
Food & Beverage Trendscdn.bpaa.com/Training/Seminars/Rick_Heim-Food_Beverage_Trends.pdfSource:...
37
Food & Beverage Trends January 23 2012 January 23, 2012
Transcript of Food & Beverage Trendscdn.bpaa.com/Training/Seminars/Rick_Heim-Food_Beverage_Trends.pdfSource:...

Food & Beverage Trends
January 23 2012January 23, 2012

Agenda
A quick look back
Current consumer behavior
Food trends
Beverage trends
2012 expenses forecast2012 expenses forecast
Equipment enhancements
Taking it back to my center(s)

A Quick Look Back
Persistent Economic MalaisePersistent Economic Malaise
Educated, Enlightened Foodies Emerge
C i & D il D l D i tCouponing & Daily Deals Dominate
Paradox Trends Run Parallel
Inflation Returns (to food & beverage)
Non‐traditional Outlets Multiplyp y
Legislation issues

Companies Experiencing Recent Success

Current Consumer Behavior
Consumers (especially Millennials) are snacking more & eating at non‐traditional times.
35% of Millenials meal consumption comes from snacks
Millenials report eating 4.3 times per day
Brinner (breakfast for dinner)
Slunch (supper and lunch)
Late night happy hours expanding
Desserts eaten anytime
The slow erosion of conventional dayparts has begun

Current Consumer Behavior
Despite the lingering effects of the recession, “artisan”Despite the lingering effects of the recession, artisan has replaced “value” as a marketing buzzword.
Consumers embrace the “Foodie” label
Burger King: “Culinary Collaboration”
Domino’s recent ad campaigns (pay attention tomorrow)p g (p y )
Consumers know source of ingredients & cooking techniques
Taco Bell touts: “quality, fresh ingredients” not value menuTaco Bell touts: quality, fresh ingredients not value menu
Farm‐branded ingredients among top 10 trends for 2012

Current Consumer Behavior
More Consumers Struggling or Just Getting By
50%
60%
20%
30%
40%
December '10
0%
10%
20%December '11
0%

Current Consumer Behavior
Consumers Don’t Blame Operators for Price Increases
Cost of Gasoline 69%
Cost of Ingredients
State of the Economy
62%
43%
Cost of Energy
Price Inflation
42%
36%
Operators Want More Profit9%

Current Consumer Behavior
Coping with Rising Prices Means Trading Down Continues
No O i i
“I am going to LSRs versus FSRs to save money” No
Opinion
“I’m going to the same type restaurant but choosing less expensive items.”
Agree,
Opinion, 12%
Opinion, 7%
g48%Disagree,
41%Agree, 55%
Disagree, 38%

Current Consumer Behavior
Cutting Back on “Extras” Allows Consumers to Maintain Eating Out FrequencyMaintain Eating Out Frequency
Appetizers 66%Appetizers 66%
Desserts 62%Desserts 62%
Alcoholic Beverages 60%Alcoholic Beverages 60%
Percent of Consumers who have cut back onPercent of Consumers who have cut back on these purchases in the last year

Current Consumer Behavior-The Value Equation
Price Most Important, but Sustainable Value Proposition Must Go Beyond Price. p y
How Consumers Assign Value at Restaurants
Price Quality Experience Portion Size
Most Important Least Important
Price Most Important 44%Price Most Important 44%Quality Most Important 32%Experience Most Important 12%Portion Size Most Important 12%

Current Consumer Behavior-The Value Equation
Enhancing Food Quality Provides Value Consumers are Willing to Pay More Forare Willing to Pay More For
Premium Ingredients 60%
All Natural Ingredients 36%
Local Ingredients 29%
Organic Ingredients 23%g g

Current Consumer Behavior-The Value Equation

Food Trends—Flavor in Demand
Consumers (especially younger consumers) Increasingly Seek Out Flavor Differentiation
Italian61% Italian
Asian
61%
58%
Mexican55%
Mediterranean
Caribbean
48%
42% Caribbean42%

Food Trends—Keep on Truckin’
Impressive use of Social Media

Food Trends-Better Burgers Sizzle
Total Industry 2008-2010 (3.1 %)Burger Segment +1.6 %g g

Food TrendsBanh What…..No, Banh Mi,
Baguette, Meat,Veggies, Sauce
Think Po Boy,But LighterBut Lighter

Food TrendsValue Out—Authentic In
Fresh, Unique Toppings
Flatbreads, Sauce Variations
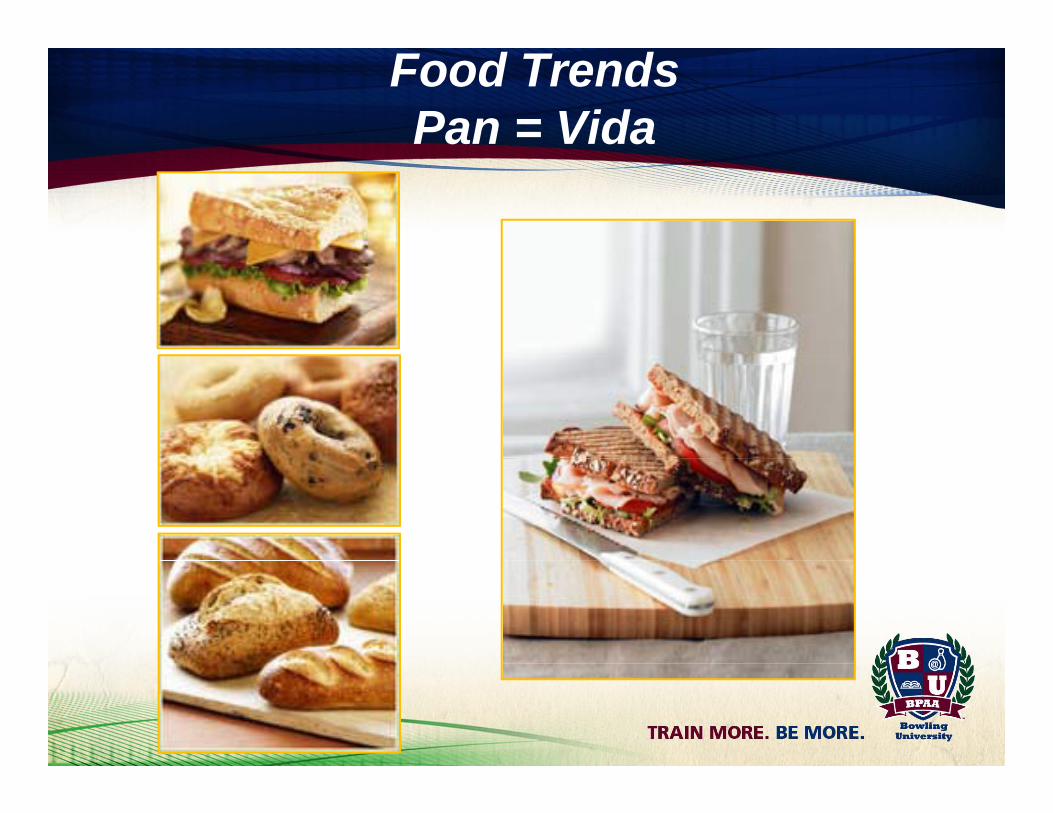
Food TrendsPan = Vida

Food TrendsNibble-icious: Mini-Desserts Huge!g
Dessert “Shot”Mini-Tiramisu
Limits Spending, Feed the “tooth”

Food TrendsComfort, Comfort Everywhere, y
Beverage Trends--Beer

Structure of Industry 1980‐2010y1980 1990 2000 2010
# of Brewers 48 298 1 500 1 600+# of Brewers 48 298 1,500 1,600+
Domestic Share 97% 95% 90% 87%
C ft Sh (BA) 1% 3% 5%Craft Share (BA) ‐ < 1% 3% 5%
Import Share 3% 5% 10% 13%
Can Share 53% 59% 51% 52%
Bottle Share 35% 30% 40% 38%
Refill Bottle 12% 5% 2% 0%
Draft Share 12% 11% 9% 9.7%
Source: Beer Institute, Brewers Association, Commerce Department, and TTB, 2011

Per Capita Consumption of Malt Beverages1980 to 2010 (total gallons/total population)1980 to 2010 (total gallons/total population)
1. 24.6 in 1981 20.6 in 2010
2 Demographics (baby boomer millenniums )
24.0
25.02. Demographics (baby boomer‐millenniums )
3. Increased alcohol beverage competition
4. Increased non‐alcohol beverage competition
22.0
23.0 5. Policy Changes (21 LDA and .08)
19 0
20.0
21.0
18.0
19.0
980
981
982
983
984
985
986
987
988
989
990
991
992
993
994
995
996
997
998
999
000
001
002
003
004
005
006
007
009
010
19 19 19 19 19 19 19 19 19 19 19 19 19 19 19 19 19 19 19 19 20 20 20 20 20 20 20 20 20 20
Source: Beer Institute, 2011

Gallup Poll, 1992‐2011f h ll h f d b f h f
45%50%
Beer faces challenge as the preferred beverage of choice for US consumers . (666 respondents with 5 pts +/‐margin of error)
30%35%40%45%
dent
s
41% v 32%
36% v 35%
15%20%25%30%
of R
espo
nd
0%5%
10%15%
Perc
ent
o
0%
Beer Wine Liquor
Source: Gallup Poll, 2011: Do you most often drink beer, wine, or liquor?
The 18-34 year old group dropped from 51% in 2010 to 39% in 2011.For people with incomes less than $30K, 51% are reported beer drinkers.

Growing US Draft Share2002 ‐ 2010
10.5%Import draft took off in 2007 to peak at 9 share in 2008.
9.5%
10.0%p p
8.5%
9.0%
7.5%
8.0%
7.0%
2002 2003 2004 2005 2006 2007 2008 2009 2010
Imports Domestic Total
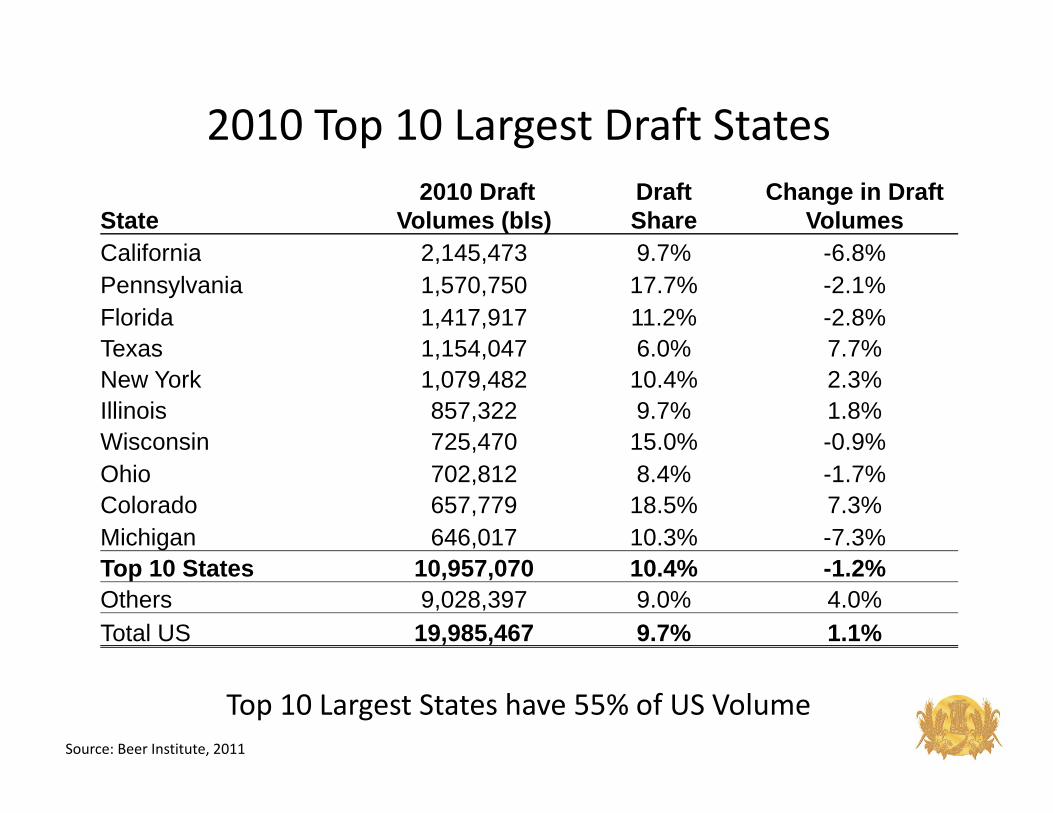
2010 Top 10 Largest Draft States
State2010 Draft
Volumes (bls)Draft Share
Change in Draft Volumes
California 2 145 473 9 7% 6 8%California 2,145,473 9.7% -6.8%Pennsylvania 1,570,750 17.7% -2.1%Florida 1,417,917 11.2% -2.8%Texas 1,154,047 6.0% 7.7%Texas 1,154,047 6.0% 7.7%New York 1,079,482 10.4% 2.3%Illinois 857,322 9.7% 1.8%Wisconsin 725,470 15.0% -0.9%Ohio 702,812 8.4% -1.7%Colorado 657,779 18.5% 7.3%Michigan 646,017 10.3% -7.3%T 10 St t 10 957 070 10 4% 1 2%Top 10 States 10,957,070 10.4% -1.2%Others 9,028,397 9.0% 4.0%Total US 19,985,467 9.7% 1.1%
Top 10 Largest States have 55% of US Volume Source: Beer Institute, 2011

Draft Volume Growth, 2010
Growth 4.0% to 20%
Growth -1.0% to +3.9%
Growth -1 1 to -15%
Source: TTB and Beer Institute, 2011
Growth 1.1 to 15%
US Average +1.1%

2010 Draft Share of by State
10% < share
8%< share < 10%
0%< share<8% US Average 9 7% in 2010
Source: TTB and Beer Institute, 2011
0%< share<8% US Average 9.7% in 2010Almost 5 billion 16oz Servings

Beer Trends-Questions & Comments
Do we have the same brands as 5 years ago?Do we have the same brands as 5 years ago?
Have we changed the number of taps?
Have I increased imports versus domestic?
Have I increased premium brands?Have I increased premium brands?
Have I trained my staff in proper techniques?
Variety in portions matter……
Garnishes & Glassware integralGarnishes & Glassware integral…..

Other Beverage Trends
Beverage growth outperforming industry
Non‐alcohol growth coming outside of carbonated soft drink category
Alcohol growth in premium & specialty categories
Consumers experiencing “frugality fatigue”Consumers experiencing frugality fatigue
Multi‐cultural, exotic and “fused” flavors driving growth
“ bl ” ( kConsumers want “customizable” options (Coke Freestyle)
Beverages respond to health & wellness trends
Relaxation (anti‐energy) drinks appear

Spirits & Wine Trends

Spirits Trends
Fresh, “Better for You” ingredients (fruits & vegetable)
St th i i f iStrong growth in infusions
Local products gaining footholds (with premium pricing)
S t t th “Cl i ”Some return to the “Classics”
Contemporary & traditional interpretations
Sh b d killShowcase bartender skill set
Appealing to Millennials
O i i d “A f E i ”Operators creating perceived “Areas of Expertise”
“Long Tail” philosophy creates concept uniqueness
li h (b i i i ) k fli hFlights (beer, wine, martinis) take flight

Suggestions for Building Beverage Sales
1. Focus on Iced Coffee and Iced Tea (Seasonal Changes)( g )2. Develop “Signature” non‐alcoholic drinks3. Increase commitment to staff education4. Offer more variety and flavors of NA beverages5. Reduce the number of CSDs6 Increase draft brands/variety6. Increase draft brands/variety7. Strongly consider local breweries & distilleries8. Develop (or copy) drinks with exciting flavor profilesp ( py) g p9. Master the art of quality drink making

2012 Cost Outlook
Chi k 7%Chicken +7%
Beef +6%Beef +6%
Paper Plates/Cups +5%
Cheese +4%
Overall Food Price Inflation +4%

Equipment Enhancements


![2012 PBK/Gallup Poll Full Report[1]](https://static.fdocuments.net/doc/165x107/577ce6611a28abf10392b44a/2012-pbkgallup-poll-full-report1.jpg)


![ARTICLE · 6. See ALEC M. GALLUP, THE GALLUP POLL: PUBLIC OPINION 2005 321 (2006) (“[T]he relationship between higher gas prices and consumers’ negative expectations for the economy](https://static.fdocuments.net/doc/165x107/5f0c3e3e7e708231d4347025/article-6-see-alec-m-gallup-the-gallup-poll-public-opinion-2005-321-2006-aoethe.jpg)

