FOOD BALANCE SHEETS OF THE PHILIPPINES
55
FOOD BALANCE SHEETS OF THE PHILIPPINES
Transcript of FOOD BALANCE SHEETS OF THE PHILIPPINES
FOOD BALANCE SHEETS OF THE PHILIPPINES

FOOD BALANCE SHEETS OF THE PHILIPPINES
TERMS OF USE
Food Balance Sheets (FBS) of the Philippines is a publication of the Philippine Statistics Authority (PSA). The PSA reserves exclusive right to reproduce this publication in whatever form. Should any portion of this publication be included in a report/article, the title of the publication and the PSA should be cited as the source of data. The PSA will not be responsible for any information derived from the processing of data contained in this publication.
ISSN-0119-450X
DECEMBER 2020

FOOD BALANCE SHEETS OF THE PHILIPPINES
i Philippine Statistics Authority
FOREWORD
The Food Balance Sheets (FBS) presents a comprehensive picture of the country’s
food supply during a specified reference period. It gives an indication of the
adequacy of food supply relative to the nutritional requirement of the population. It is
a useful tool in designing, planning, and assessment of policies and programs
related to food security and nutrition.
The FBS of the Philippines is an annual publication of the Philippine Statistics
Authority (PSA). The statistical tables cover the reference period 2017 to 2019, while
the highlights focus on the 2019 data.
While the FBS report is being prepared annually, PSA will continue to carry out
improvements in the data support and the compiling system for FBS. This report
includes technical notes to provide brief description on the data source, data
coverage, estimation methodology, parameters, and technical conversion ratios as
well as the terms and definitions that will guide the data users.
The PSA welcomes comments and suggestions from the data users for further
improvement of this publication.
DENNIS S. MAPA, Ph.D.
Undersecretary
National Statistician and Civil Registrar General
Quezon City, Philippines
December 2020

FOOD BALANCE SHEETS OF THE PHILIPPINES
ii
Philippine Statistics Authority
TABLE OF CONTENTS
Title Page
Foreword i
Table of Contents ii
List of Tables iii
List of Figures iii
Technical Notes iv
Background iv
Sources of Basic Data iv
Estimation Methodology vi
Food Supply Situation in the Philippines 1
References 11
Annexes 12

FOOD BALANCE SHEETS OF THE PHILIPPINES
iii
Philippine Statistics Authority
LIST OF TABLES
Table
No.
Title Page
1 Per Capita Supply of Food, Calories, Proteins, and Fats, Philippines, 2017 to 2019
1
2 Percent Distribution of Calories, Proteins, and Fats, by Source, Philippines, 2017 to 2019
5
3 Per Capita Supply and Recommended Energy Intake (REI) for Calories, Philippines, 2017 to 2019
8
4 Per Capita Supply and Estimated Average Requirements (EAR) for Proteins, Philippines, 2017 to 2019
9
LIST OF FIGURES
Figure
No.
Title Page
1 Per Capita Supply of Calories, Philippines, 2018 to 2019 3
2 Per Capita Supply of Proteins, Philippines, 2018 to 2019 3
3 Per Capita Supply of Fats, Philippines, 2018 to 2019 4
4 Percent Distribution of Calories by Source, Philippines, 2019 6
5 Percent Distribution of Proteins by Source, Philippines, 2019 6
6 Percent Distribution of Fats by Source, Philippines, 2019 7
7 Import Dependency Ratio (IDR) and Self-Sufficiency Ratio (SSR), Philippines, 2017 to 2019
10

FOOD BALANCE SHEETS OF THE PHILIPPINES
iv
Philippine Statistics Authority
TECHNICAL NOTES ON THE PREPARATION OF FOOD BALANCE SHEETS OF
THE PHILIPPINES
I. BACKGROUND
The Food Balance Sheets (FBS) is an aggregated and analytical dataset that
presents a comprehensive picture of the pattern of a country’s food supply during a
specified reference period. FBS provides estimates for every food item of per capita
food available for human consumption in terms of quantity, calories, proteins, and
fats. (Global Strategy to Improve Agricultural and Rural Statistics, “Guidelines for the
compilation of Food Balance Sheets”, October 2017).
The FBS is also useful for analyzing the country’s overall diet. It estimates the
country’s overall Dietary Energy Supply (DES) and micronutrient availability like fats
and proteins. DES serves as an indicator if sufficient food is available nationally.
Other indicators derived from FBS data include the self-sufficiency ratio, which
compares the magnitude of a country’s agricultural production to its domestic
utilization and the import dependency ratio, which compares the magnitude of a
country’s imports to its domestic utilization.
The Philippines was one of the beneficiaries and key partners in the Food and
Agriculture Organization (FAO) Regional Project (TCP/RAS/3409), “Building
Statistical Capacity for Quality Food Security and Nutrition Information in Support of
Better Informed Policies” which started in 2013. Thru this project, the Philippines
participated in the series of capacity building on the compilation of FBS. FAO
provided excel-based compiling system in processing the FBS tables. This project
generated preliminary estimates which served as benchmark data for the compilation
of the 2017 to 2019 FBS.
II. Sources of Basic Data
The compilation of the FBS requires basic data on production, stocks, foreign trade,
domestic utilization, nutrient values, dietary allowances, and population which were
obtained from the results of censuses, household and establishment surveys,
administrative reports of government agencies and special studies conducted by
various research institutions.
1. Production
1.1 Crops
The production data of palay and corn were obtained from the quarterly Palay
Production Survey (PPS) and Corn Production Survey (CPS) of the PSA. Other
crops were sourced from the Crops Production Survey (CrPS).

FOOD BALANCE SHEETS OF THE PHILIPPINES
v
Philippine Statistics Authority
The Sugar Regulatory Administration (SRA) provided data on centrifugal sugar.
1.2 Livestock and Poultry
For livestock and poultry animals, production data including the production of milk
and eggs were taken from the Backyard Livestock and Poultry Survey (BLPS) and
Commercial Livestock and Poultry Survey (CLPS) of the PSA. Data used include the
inventory of animals and production of milk and eggs which were disaggregated for
all types of animals such as carabao, cattle, hogs, goat, chicken, and ducks.
1.3 Fish
For fisheries, production data were sourced from the quarterly fishery surveys of the
PSA such as the Quarterly Aquaculture Survey, Quarterly Commercial Fisheries
Survey, Quarterly Municipal Fisheries Survey, and Quarterly Inland Fisheries
Survey.
1.4 Processed Food Commodities
Data for processed food commodities used the Technical Conversion Factors for
Agricultural Commodities sourced from the FAO’s publication which was published in
August 2000 (Annex 1).
2. Stocks
Stock data on rice and corn were obtained from monthly rice and corn stocks
inventory which are generated from three sectors namely: household, commercial,
and National Food Authority (NFA). The household stocks are taken from the Palay
and Corn Stock Survey (PCSS) of the PSA. The commercial stocks are sourced
from registered grains businessmen through the Commercial Stocks Survey (CSS),
conducted by the NFA and the results are submitted to the PSA while the NFA
stocks are monitored from their warehouses/depositories.
3. Foreign Trade
Data on the volume of exports and imports of each food commodity were obtained
from the Foreign Trade Statistics compiled by the PSA.
4. Domestic Utilization
Data on domestic utilization such as feeds, seeds, waste, processed for food and
non-food for selected primary commodities were obtained from the parameters being
used in the compilation of Supply Utilization Accounts (SUA) for Selected Agricultural
Commodities (Annex 2).

FOOD BALANCE SHEETS OF THE PHILIPPINES
vi
Philippine Statistics Authority
5. Balancing Item
The balancing item for the 78 food commodities covered in the SUA for Selected
Agricultural Commodities was adopted. For the other remaining commodities, the
FAO’s recommended balancing item was employed.
6. Nutrient Values
The nutrient values in terms of energy, proteins, and fats for each food item were
obtained from the 1997 Food Composition Table (FCT) on Per Capita Food Intake
published by the DOST-FNRI and from the FAO and World Standard Nutritional
Values (Annex 3).
7. Recommended Energy Intake and Estimated Average Requirement
The Food Consumption Survey of the 8th National Nutrition Survey: Philippines, 2013
conducted by the DOST-FNRI provided the Recommended Energy Intake (REI) for
energy and Estimated Average Requirements (EAR) for proteins and fats
disaggregated by major food group (Annex 4).
Recommended Energy Intake (REI) is the level of intake of energy which is
considered adequate for the maintenance of health and well-being of healthy
persons in the population.
The Estimated Average Requirements (EAR) is the daily nutrient intake level that
meets the median average requirement of healthy individuals in a particular life stage
and sex group, corrected for incomplete utilization or dietary nutrient bioavailability.
8. Population
The mid-year population estimates of the PSA based on the 2015 Census of
Population were used for the estimation of the per capita food supply and the per
capita food nutrient.
III. ESTIMATION METHODOLOGY
1. Total Domestic Supply (TDS)
𝑇𝐷𝑆 = 𝑃𝑟𝑜𝑑𝑢𝑐𝑡𝑖𝑜𝑛 − 𝐶ℎ𝑎𝑛𝑔𝑒𝑠 𝑖𝑛 𝑆𝑡𝑜𝑐𝑘𝑠 + 𝑁𝑒𝑡 𝐼𝑚𝑝𝑜𝑟𝑡𝑠
This represents the quantity of food supplies available before disposal to non-food
and food uses. It is obtained by adding the change in stocks, if the sign is minus and
subtracting it, if the sign is plus, from production, plus net imports (i.e. imports less
exports).

FOOD BALANCE SHEETS OF THE PHILIPPINES
vii
Philippine Statistics Authority
1.1 Production
1.1.1 Unprocessed Food Commodities
All production data in the PSA data system were accounted for in the compilation of
the FBS.
1.1.2 Processed Food Commodities
Production estimates of the processed food commodities were derived by applying
appropriate parameters taken from FAO’s publication of Technical Conversion
Factors for Agricultural Commodities (Annex 1).
1.2 Changes in Stocks
𝐶ℎ𝑎𝑛𝑔𝑒𝑠 𝑖𝑛 𝑆𝑡𝑜𝑐𝑘𝑠 = 𝐸𝑛𝑑𝑖𝑛𝑔 𝑆𝑡𝑜𝑐𝑘𝑠 − 𝐵𝑒𝑔𝑖𝑛𝑛𝑖𝑛𝑔 𝑆𝑡𝑜𝑐𝑘𝑠
1.3 Net Imports
𝑁𝑒𝑡 𝐼𝑚𝑝𝑜𝑟𝑡𝑠 = 𝑇𝑜𝑡𝑎𝑙 𝐼𝑚𝑝𝑜𝑟𝑡𝑠 − 𝑇𝑜𝑡𝑎𝑙 𝐸𝑥𝑝𝑜𝑟𝑡𝑠
Data on exports and imports of commodities in terms of quantity (in net kilo
equivalent) were sourced from the Foreign Trade Statistics of the PSA. Trade
commodities were matched with the FBS commodities using the Philippine Standard
Commodity Classification (PSCC) codes.
2. Total Domestic Utilization (TDU)
𝑇𝐷𝑈 = 𝑁𝑒𝑡 𝑎𝑣𝑎𝑖𝑙𝑎𝑏𝑙𝑒 𝑓𝑜𝑜𝑑 𝑠𝑢𝑝𝑝𝑙𝑦 + 𝑛𝑜𝑛 − 𝑓𝑜𝑜𝑑 𝑢𝑡𝑖𝑙𝑖𝑧𝑎𝑡𝑖𝑜𝑛 + 𝑝𝑟𝑜𝑐𝑒𝑠𝑠𝑒𝑑 𝑓𝑜𝑟 𝑓𝑜𝑜𝑑
The net available food supply represents the total amount of food available for
consumption while non-food utilization refers to a part of total domestic utilization
which is used for seed, feed, processed for non-food including the amount wasted.
2.1 Net Available Food Supply
The net available food supply was obtained by deducting from the total domestic
supply of food commodities the total amount for allowances for non-food utilization
and processed for food. The amount derived represents the actual quantity of food in
the retail stage or "as purchased basis".

FOOD BALANCE SHEETS OF THE PHILIPPINES
viii Philippine Statistics Authority
2.2 Non-Food Utilization
Estimates of non-food utilization such as seed, feed, processed for non-food and
waste made use of the parameters from SUA for Selected Agricultural Commodities
(Annex2) and FAO’s publication of Technical Conversion Factors for Agricultural
Commodities (Annex 1).
2.2.1 Feed, which refers to the amount of food for animals, was estimated by
applying appropriate parameters to the reported total production of certain food
crops;
2.2.2 Seed, which refers to the quantity of food crops used as seeds or planting
materials, was estimated by applying the recommended seeding allowance per
hectare by type of crop;
2.2.3 Processed for non-food, which refers to the quantity of food crops converted
into non-food commodities for industrial and manufacturing purposes was estimated
using the available parameters as shown in Annex 2; and
2.2.4 Waste, which refers to the amount of losses that occur during harvesting,
infestations, spoilage, storage, distribution, etc., was estimated by applying the
required wastage parameters to the total estimate of production or total domestic
supply.
2.3 Food Utilization
Processed for Food refers to the quantity of food crops which are further processed
into other form of food commodities.
3. Per Capita Food Supply
3.1 Annual Per Capita Food Supply (in kilograms)
The annual per capita food supply in kilograms was estimated by dividing the net
available food supply by the estimated mid-year population multiplied by 1,000.
3.2 Daily Per Capita Food Supply (in grams)
The daily per capita food supply in grams was estimated by dividing the annual per
capita food supply by 365 days multiplied by 1,000.

FOOD BALANCE SHEETS OF THE PHILIPPINES
ix
Philippine Statistics Authority
4. Nutrient Supply
The nutrient equivalent of the food supply in terms of energy, proteins, and fats were
computed by multiplying the daily per capita food supply in grams by the
corresponding nutrient values per 100 grams.
5. Self-Sufficiency Ratio (SSR) and Import Dependency Ratio (IDR)
Self-Sufficiency Ratio (SSR) shows the extent to which country relies on its own
production resources or the extent of sufficiency of domestic production in relation to
domestic consumption. It is the ratio of production to the sum of production plus
import minus export and multiplied by 100.
A ratio of less than 100 percent indicates inadequacy of food production to cope with
the demand of the population; equal to 100 percent indicates that food production
capacity of the sector is just enough to support the food needs of the population;
ratio of greater than 100 percent indicates that domestic production is more than
enough to support the domestic requirements, the higher the ratio the greater the
self-sufficiency.
𝑆𝑆𝑅 =𝑃𝑟𝑜𝑑𝑢𝑐𝑡𝑖𝑜𝑛
𝑃𝑟𝑜𝑑𝑢𝑐𝑡𝑖𝑜𝑛 + 𝐼𝑚𝑝𝑜𝑟𝑡 − 𝐸𝑥𝑝𝑜𝑟𝑡 𝑥 100
Import dependency ratio (IDR) is the extent of dependency on importation in relation
to domestic consumption. It is the ratio of quantity imported to the sum of production
plus import minus export and multiplied by 100. The higher ratio implies greater
dependency on importation.
𝐼𝐷𝑅 =𝐼𝑚𝑝𝑜𝑟𝑡
𝑃𝑟𝑜𝑑𝑢𝑐𝑡𝑖𝑜𝑛 + 𝐼𝑚𝑝𝑜𝑟𝑡 − 𝐸𝑥𝑝𝑜𝑟𝑡 𝑥 100

FOOD BALANCE SHEETS OF THE PHILIPPINES
x
Philippine Statistics Authority

FOOD BALANCE SHEETS OF THE PHILIPPINES
1
Philippine Statistics Authority
I. FOOD SUPPLY SITUATION IN THE PHILIPPINES
Table 1. Per Capita Supply of Food, Calories, Proteins, and Fats,
Philippines, 2017 to 2019
Products 2017 2018 2019 17-18 18-19 2017 2018 2019 17-18 18-19
Grand total 2,351.59 2,503.98 2,424.15 6.5 -3.2-
Vegetable prod. 1,958.02 2,097.47 2,018.69 7.1 -3.8
Animal prod. 393.57 406.51 405.46 3.3 -0.30
Cereals (excl. beer) 143.07 149.94 152.65 4.8 1.8 1,336.25 1,423.44 1,476.79 6.5 3.7
Starchy roots 15.45 15.18 14.91 -1.7 -1.8 45.11 44.07 42.99 -2.3 -2.5
Sugar crops 2.81 2.34 1.93 -16.8 -17.4 3.85 3.20 2.65 -16.8 -17.4
Sugar & Sweeteners 6.55 7.26 6.23 10.8 -14.1 46.04 58.54 47.21 27.1 -19.4
Pulses 1.33 1.39 1.31 4.7 -6.0 7.68 8.09 7.63 5.3 -5.7
Treenuts 0.34 0.40 0.36 18.9 -10.9 3.03 3.39 2.62 12.0 -22.6
Oilcrops 56.67 57.11 55.61 0.8 -2.6 189.43 191.25 186.06 1.0 -2.7
Vegetable oils 2.93 4.48 1.71 53.0 -61.9 70.97 108.55 41.35 53.0 -61.9
Vegetables 26.32 26.22 26.36 -0.4 0.6 29.83 30.30 30.19 1.6 -0.4
Fruits 104.07 84.81 69.01 -18.5 -18.6 168.18 162.93 118.30 -3.1 -27.4
Stimulants 5.82 7.08 7.19 21.6 1.6 19.78 24.23 24.29 22.5 0.2
Spices 0.40 0.39 0.46 -2.2 19.5 1.43 1.50 1.70 5.4 13.1
Alcoholic beverages 16.00 19.31 18.38 20.6 -4.8 36.36 37.25 36.49 2.5 -2.0
Meat 33.04 36.11 36.00 9.3 -0.3 174.09 184.94 181.72 6.2 -1.7
Offals 7.15 5.60 5.50 -21.7 -1.8 29.29 24.25 23.68 -17.2 -2.4
Animal fats 2.35 2.45 2.43 4.1 -0.5 46.03 48.05 47.48 4.4 -1.2
Milk (excluding butter) 31.59 37.09 38.76 17.4 4.5 28.15 34.44 34.90 22.3 1.3
Eggs 4.80 5.11 5.50 6.3 7.6 21.21 22.54 24.25 6.3 7.6
Fish & seafood 35.31 34.04 34.16 -3.6 0.3 94.79 92.28 93.44 -2.7 1.3
Miscellaneous 0.00 0.07 0.04 1,616.4 -41.8 0.08 0.71 0.43 842.4 -39.8
Kilocalorie/DayGrowth Rates
(in percent)
Items
PER CAPITA SUPPLY
CaloriesFood
Kilogram/YearGrowth Rates
(in percent)
Source: Philippine Statistics Authority
0.0 - Less than 0.05 but not equal to 0

FOOD BALANCE SHEETS OF THE PHILIPPINES
2
Philippine Statistics Authority
Table 1. (continued)
FOOD
• In 2019, the annual per capita supply of cereals (excluding beer) available for
food was 152.65 kilograms. This was an increase of 1.8 percent from the
previous year’s level.
• The available per capita food supply for fish and seafood was 34.16 kilograms,
showing an increase of 0.3 percent in 2019.
Products 2017 2018 2019 17-18 18-19 2017 2018 2019 17-18 18-19
Grand total 76.94 80.31 81.75 4.4 1.8 54.60 60.80 52.64 11.3 -13.4- -
Vegetable prod. 36.04 38.68 39.76 7.3 2.8 31.31 36.82 28.90 17.6 -21.5
Animal prod. 40.90 41.63 41.99 1.8 0.9 23.30 23.99 23.73 3.0 -1.10 0
Cereals (excl. beer) 28.40 30.90 32.60 8.8 5.5 3.61 4.43 4.85 22.7 9.6
Starchy roots 0.35 0.35 0.34 1.9 -2.4 0.11 0.10 0.10 -2.9 -2.2
Sugar crops 0.01 0.01 0.01 -16.8 -17.4 0.02 0.01 0.01 -16.8 -17.4
Sugar & Sweeteners 0.03 0.00 0.00 -100.0 5,626.3 0.00 0.00 0.00 6.4 34.5
Pulses 0.52 0.55 0.52 5.3 -5.5 0.03 0.03 0.03 6.2 -6.7
Treenuts 0.08 0.09 0.07 13.6 -21.2 0.21 0.22 0.21 1.3 -3.2
Oilcrops 3.40 3.45 3.32 1.4 -3.9 16.91 17.08 16.62 1.0 -2.7
Vegetable oils - - - - - 8.03 12.28 4.68 53.0 -61.9
Vegetables 1.08 1.09 1.10 1.0 0.7 0.21 0.21 0.21 1.4 -2.1
Fruits 1.63 1.56 1.12 -4.0 -28.1 0.95 0.93 0.66 -2.6 -28.6
Stimulants 0.40 0.49 0.49 23.6 0.8 1.19 1.47 1.47 23.7 -0.4
Spices 0.05 0.05 0.06 7.0 12.1 0.04 0.04 0.05 8.1 13.9
Alcoholic beverages 0.10 0.13 0.12 27.9 -5.7 0.00 0.00 0.00 -2.4 -2.6
Meat 16.37 18.04 18.08 10.2 0.2 11.99 12.45 12.08 3.8 -3.0
Offals 3.00 2.21 2.18 -26.4 -1.2 1.70 1.58 1.53 -6.9 -3.4
Animal fats 0.28 0.29 0.28 3.6 -1.9 4.98 5.20 5.14 4.4 -1.2
Milk (excluding butter) 2.48 2.69 2.84 8.4 5.6 0.52 0.62 0.65 19.3 3.7
Eggs 1.62 1.72 1.86 6.3 7.6 1.46 1.56 1.67 6.3 7.6
Fish & seafood 17.15 16.68 16.75 -2.7 0.4 2.64 2.58 2.67 -2.4 3.5
Miscellaneous 0.00 0.01 0.01 17,582.7 -44.1 0.01 0.01 0.01 30.9 -12.0
Grams/DayGrowth Rates
(in percent)Grams/Day
Growth Rates
(in percent)
Items
PER CAPITA SUPPLY
Proteins Fats
Source: Philippine Statistics Authority
0.0 - Less than 0.05 but not equal to 0
- No reported protein nutrient value
Per Capita Food Supply of Protein for Sugar & Sweeteners (gram per day)
2018: 0.00001 and 2019: 0.00074
FOOD BALANCE SHEETS OF THE PHILIPPINES
3
Philippine Statistics Authority
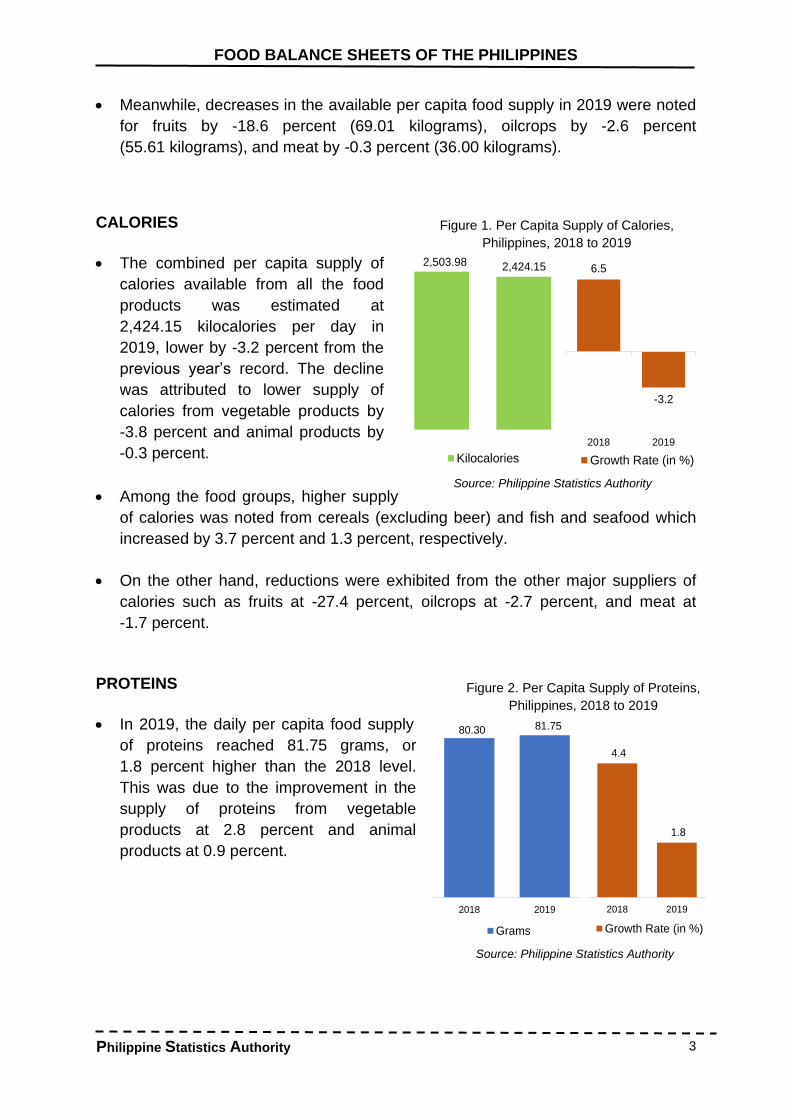
• Meanwhile, decreases in the available per capita food supply in 2019 were noted
for fruits by -18.6 percent (69.01 kilograms), oilcrops by -2.6 percent
(55.61 kilograms), and meat by -0.3 percent (36.00 kilograms).
CALORIES
• The combined per capita supply of
calories available from all the food
products was estimated at
2,424.15 kilocalories per day in
2019, lower by -3.2 percent from the
previous year’s record. The decline
was attributed to lower supply of
calories from vegetable products by
-3.8 percent and animal products by
-0.3 percent.
• Among the food groups, higher supply
of calories was noted from cereals (excluding beer) and fish and seafood which
increased by 3.7 percent and 1.3 percent, respectively.
• On the other hand, reductions were exhibited from the other major suppliers of
calories such as fruits at -27.4 percent, oilcrops at -2.7 percent, and meat at
-1.7 percent.
PROTEINS
• In 2019, the daily per capita food supply
of proteins reached 81.75 grams, or
1.8 percent higher than the 2018 level.
This was due to the improvement in the
supply of proteins from vegetable
products at 2.8 percent and animal
products at 0.9 percent.
Source: Philippine Statistics Authority
Source: Philippine Statistics Authority
2503.982424.15
Kilocalories
6.5
-3.2
2018 2019
Growth Rate (in %)
2,503.98 2,424.15
Figure 1. Per Capita Supply of Calories,
Philippines, 2018 to 2019
80.31 81.75
2018 2019
Grams
4.4
1.8
2018 2019
Growth Rate (in %)
80.30 81.75
Source: Philippine Statistics Authority
Figure 2. Per Capita Supply of Proteins,
Philippines, 2018 to 2019

FOOD BALANCE SHEETS OF THE PHILIPPINES
4 Philippine Statistics Authority
• Increases in the daily per capita supply were recorded from the primary sources
of proteins such as milk (excluding butter) at 5.6 percent, cereals (excluding beer)
at 5.5 percent, fish and seafood at 0.4 percent, and meat at 0.2 percent.
• Oilcrops posted a -3.9 percent drop in the daily per capita supply of proteins.
FATS
• In per capita terms, the daily food
supply of fats was 52.64 grams, lower
by -13.4 percent compared to the
previous year’s level. This was
contributed by the downtrends in the fat
contents of vegetable products at
-21.5 percent and animal products at
-1.1 percent.
• For the major sources of fats, the daily
supply of cereals (excluding beer), eggs,
and fish and seafood in 2019 were higher than the 2018 levels with
respective increments at 9.6 percent, 7.6 percent, and 3.5 percent.
• In contrast, the fats supply went down from vegetable oils by -61.9 percent, meat
by -3.0 percent, oilcrops by -2.7 percent and animal fats by -1.2 percent.
Figure 3. Per Capita Supply of Fats,
Philippines, 2018 to 2019
Source: Philippine Statistics Authority
60.8
52.6
2018 2019
Grams
11.3
-13.4
2018 2019
Growth Rate (in %)
60.80
52.64

FOOD BALANCE SHEETS OF THE PHILIPPINES
5 Philippine Statistics Authority
Table 2. Percent Distribution of Calories, Proteins, and Fats, by Source,
Philippines, 2017 to 2019
2017 2018 2019 2017 2018 2019 2017 2018 2019
Products
Grand total 100.0 100.0 100.0 100.0 100.0 100.0 100.0 100.0 100.0
Vegetable prod. 83.3 83.8 83.3 46.8 48.2 48.6 57.3 60.6 54.9
Animal prod. 16.7 16.2 16.7 53.2 51.8 51.4 42.7 39.4 45.1
Cereals (excl. beer) 56.8 56.8 60.9 36.9 38.5 39.9 6.6 7.3 9.2
Starchy roots 1.9 1.8 1.8 0.5 0.4 0.4 0.2 0.2 0.2
Sugar crops 0.2 0.1 0.1 0.0 0.0 0.0 0.0 0.0 0.0
Sugar & Sweeteners 2.0 2.3 1.9 0.0 0.0 0.0 0.0 0.0 0.0
Pulses 0.3 0.3 0.3 0.7 0.7 0.6 0.0 0.0 0.0
Treenuts 0.1 0.1 0.1 0.1 0.1 0.1 0.4 0.4 0.4
Oilcrops 8.1 7.6 7.7 4.4 4.3 4.1 31.0 28.1 31.6
Vegetable oils 3.0 4.3 1.7 - - - 14.7 20.2 8.9
Vegetables 1.3 1.2 1.2 1.4 1.4 1.3 0.4 0.4 0.4
Fruits 7.2 6.5 4.9 2.1 1.9 1.4 1.7 1.5 1.3
Stimulants 0.8 1.0 1.0 0.5 0.6 0.6 2.2 2.4 2.8
Spices 0.1 0.1 0.1 0.1 0.1 0.1 0.1 0.1 0.1
Alcoholic beverages 1.5 1.5 1.5 0.1 0.2 0.1 0.0 0.0 0.0
Meat 7.4 7.4 7.5 21.3 22.5 22.1 22.0 20.5 22.9
Offals 1.2 1.0 1.0 3.9 2.7 2.7 3.1 2.6 2.9
Animal fats 2.0 1.9 2.0 0.4 0.4 0.3 9.1 8.6 9.8
Milk (excluding butter) 1.2 1.4 1.4 3.2 3.3 3.5 1.0 1.0 1.2
Eggs 0.9 0.9 1.0 2.1 2.1 2.3 2.7 2.6 3.2
Fish & seafood 4.0 3.7 3.9 22.3 20.8 20.5 4.8 4.2 5.1
Miscellaneous 0.0 0.0 0.0 0.0 0.0 0.0 0.0 0.0 0.0
Items
PER DAY
Calories
(Kilocalorie/Day)
Proteins
(Grams/Day)
Fats
(Grams/Day)
Source: Philippine Statistics Authority
0.0 - Less than 0.05 but not equal to 0
- No reported protein nutrient value

FOOD BALANCE SHEETS OF THE PHILIPPINES
6 Philippine Statistics Authority
• Cereals (excluding beer) shared the biggest proportion in the total daily per capita
supply of calories at 60.9 percent in 2019. This was followed by oilcrops at
7.7 percent, meat at 7.5 percent, fruits at 49 percent, and fish and seafood at
3.9 percent.
Figure 4. Percent Distribution of Calories by Source, Philippines, 2019
• The biggest contributor in the daily per capita supply of proteins was cereals
(excluding beer) with 39.9 percent. Meat shared 22.1 percent and fish and
seafood with 20.5 percent.
Figure 5. Percent Distribution of Proteins by Source, Philippines, 2019
Cereals (excl. beer)
60.9%
Oilcrops7.7%
Meat 7.5%
Fruits4.9%
Fish & seafood3.9%
Other food groups15.2%
Cereals (excl. beer)
39.9%
Meat 22.1%
Fish & seafood20.5%
Oilcrops4.1%
Milk (excluding butter) 3.5%
Other food groups10.0%
Details may not add up to 100% due to rounding.Source: Philippine Statistics Authority
Details may not add up to 100% due to rounding.Source: Philippine Statistics Authority

FOOD BALANCE SHEETS OF THE PHILIPPINES
7 Philippine Statistics Authority
• The major sources of daily per capita supply of fats were oilcrops with
31.6 percent and meat with 22.9 percent shares. Animal fats and cereals
(excluding beer) contributed 9.8 percent and 9.2 percent, respectively.
Figure 6. Percent Distribution of Fats by Source, Philippines, 2019
Oilcrops31.6%
Meat 22.9%
Animal fats9.8%
Cereals (excl. beer)
9.2%
Vegetable oils8.9%
Other food groups17.6%
Source: Philippine Statistics Authority

FOOD BALANCE SHEETS OF THE PHILIPPINES
8
Philippine Statistics Authority
Table 3. Per Capita Supply and Recommended Energy Intake (REI) for Calories,
Philippines, 2017 to 2019
Recommended
Energy Intake
(REI)
2013/a REI 2017 2018 2019
Products
Grand total 1,810.00 2,351.59 2,503.98 2,424.15 -
Vegetable prod. 1,958.02 2,097.47 2,018.69
Animal prod. 393.57 406.51 405.46 -
Cereals (excl. beer) 1,229.00 1,336.25 1,423.44 1,476.79
Starchy roots 15.00 45.11 44.07 42.99
Sugar crops 3.85 3.20 2.65
Sugar & Sw eeteners 43.00 46.04 58.54 47.21
Pulses 7.68 8.09 7.63
Treenuts 3.03 3.39 2.62
Oilcrops 189.43 191.25 186.06
Vegetable oils 70.97 108.55 41.35
Vegetables 34.00 29.83 30.30 30.19
Fruits 25.00 168.18 162.93 118.30
Stimulants 19.78 24.23 24.29
Spices 1.43 1.50 1.70
Alcoholic beverages 36.36 37.25 36.49
Meat 176.00 174.09 184.94 181.72
Offals 29.29 24.25 23.68
Animal fats 46.03 48.05 47.48
Milk (excluding butter) 25.00 28.15 34.44 34.90
Eggs 23.00 21.21 22.54 24.25
Fish & seafood 64.00 94.79 92.28 93.44
Miscellaneous 49.00 0.08 0.71 0.43
Items
DAILY PER CAPITA SUPPLY (Calories)
Available Supply
(Kilocalories)
18.00
Source: Philippine Statistics Authority a/ – Based on the results of the DOST-FNRI 8th National Nutrition Survey, 2013

FOOD BALANCE SHEETS OF THE PHILIPPINES
9
Philippine Statistics Authority
Table 4. Per Capita Supply and Estimated Average Requirements (EAR) for
Proteins, Philippines, 2017 to 2019
Estimated
Average
Requirements
(EAR)
2013/a EAR 2017 2018 2019
Products
Grand total 56.50 76.94 80.31 81.75 - -
Vegetable prod. 36.04 38.68 39.76
Animal prod. 40.90 41.63 41.99 - -
Cereals (excl. beer) 26.50 28.40 30.90 32.60
Starchy roots 0.20 0.35 0.35 0.34
Sugar crops 0.01 0.01 0.01
Sugar & Sw eeteners n 0.03 0.00 0.00
Pulses 0.52 0.55 0.52
Treenuts 0.08 0.09 0.07
Oilcrops 3.40 3.45 3.32
Vegetable oils - - -
Vegetables 1.60 1.08 1.09 1.10
Fruits 0.30 1.63 1.56 1.12
Stimulants 0.40 0.49 0.49
Spices 0.05 0.05 0.06
Alcoholic beverages 0.10 0.13 0.12
Meat 12.00 16.37 18.04 18.08
Offals 3.00 2.21 2.18
Animal fats 0.28 0.29 0.28
Milk (excluding butter) 1.10 2.48 2.69 2.84
Eggs 1.80 1.62 1.72 1.86
Fish & seafood 10.90 17.15 16.68 16.75
Miscellaneous 0.60 0.00 0.01 0.01
Items
1.10
DAILY PER CAPITA SUPPLY (Protein)
Available Supply
(Grams)
Source: Philippine Statistics Authority a/ – Based on the results of the DOST-FNRI 8th National Nutrition Survey, 2013 n (negligible) if: Less than 0.05 gram 0.0 - Less than 0.05 but not equal to 0 - No reported protein nutrient value

FOOD BALANCE SHEETS OF THE PHILIPPINES
10 Philippine Statistics Authority
Figure 7: Import Dependency Ratio (IDR) and Self-Sufficiency Ratio (SSR),
Philippines, 2017 to 2019
• The country’s estimated self-sufficiency ratio (SSR) for the aggregated foodproducts was computed at 81.3 percent in 2019. This implies that 81.3 percent ofthe food supply comprised the domestic production.
• The 2019 import dependency ratio (IDR) for food was recorded at 29.0 percent.This indicates that 29.0 percent of the country’s food supply came from imports.
22.6
27.7 29.0
86.8
80.0 81.3
2017 2018 2019
Import Dependency Ratio (IDR) Self-Sufficiency Ratio (SSR)
Source: Philippine Statistics Authority
Ra
tio
in
Pe
rce
nta
ge

FOOD BALANCE SHEETS OF THE PHILIPPINES
11
Philippine Statistics Authority
REFERENCES
Bureau of Agricultural Statistics. (1995). A Handbook on Supply Utilization Accounts.
Quezon City: Bureau of Agricultural Statistics.
FishBase: A Global Information System on Fishes, retrieved from FishBase.org.
Food and Agriculture Organization of the United Nations. (2002). Aquatic Sciences
and Fisheries Information System (ASFIS) List of Species for Fishery
Statistics Purposes.Rome: Food and Agriculture Organization of the United
Nations.
Food and Agriculture Organization of the United Nations. (2001). Food Balance
Sheets: A handbook. Rome: Food and Agriculture Organization of the United
Nations.
Food and Agriculture Organization of the United Nations. (October 2017). Guidelines
for the compilation of Food Balance Sheets. Rome: Food and Agriculture
Organization of the United Nations.
Food and Agriculture Organization of the United Nations. (August 2000). Technical
Conversion Factors for Agricultural Commodities. Rome: Food and Agriculture
Organization of the United Nations.
Food and Nutrition Research Institute. (August 2000). Philippine Nutrition Facts and
Figures 2013. Bicutan, Taguig City, Metro Manila: Food and Nutrition
Research Institute.
Food and Nutrition Research Institute. (1997). The Philippine Food Composition
Tables 1997 User's Guide. Bicutan, Taguig City, Metro Manila: Food and
Nutrition Research Institute.
National Statistical Coordination Board. (March 2005). 2004 Philippine Standard
Commodity Classification. Makati City: National Statistical Coordination
Board.
National Statistical Coordination Board. (March 2001). 1997-1999 Food Balance
Sheets of the Philippines. Makati City: National Statistical Coordination Board.
Philippine Statistics Authority. (August 2016). 2015 Philippine Standard Commodity
Classification. Quezon City: Philippine Statistics Authority.

FOOD BALANCE SHEETS OF THE PHILIPPINES
12
Philippine Statistics Authority
ANNEXES

FOOD BALANCE SHEETS OF THE PHILIPPINES
13 Philippine Statistics Authority
Annex 1. Technical Conversion Factors for Agricultural Commodities
(Legends: < - up to, > - more than, ≈ - more or less)
FAOSTAT
codeFAOSTAT Commodity List
Extraction rate /
Carcass weights
identified by FAO
MinimumWorld
AverageMaximum
15 Wheat -
16 Flour of Wheat 74 70 79 90
17 Bran of Wheat 23 10 18 26
18 Macaroni 100 ≈100
19 Germ of Wheat - 2 2 3
20 Bread 120 100 130
21 Bulgur, Wholemeal - 93 95 98
22 Pastry 100 100 130
23 Wheat Starch - <85
24 Wheat Gluten - <15
26 Wheat Fermented Beverages -
27 Rice, Paddy -
28 Rice, Husked -
29 Milled/Husked Rice -
31 Milled Paddy Rice 65
32 Rice, Broken -
33 Rice, Gluten -
34 Rice, Starch -
35 Bran of Rice 8
36 Oil of Rice Bran -
37 Cake of Rice Bran -
38 Rice Flour -
39 Rice Fermented Beverages -
41 Breakfast Cereals 120 80 90
44 Barley -
45 Pot Barley - 60 72 85
46 Barley, Pearled - <55
47 Bran of Barley - 19 <30
48 Barley Flour and Grits - <45
49 Malt of Barley 75 65 73 80
50 Malt Extracts - ≈80
51 Beer of Barley 900 500 655 900
56 Maize -
57 Germ of Maize 7 6 <8
58 Flour of Maize 60 70 82 95
59 Bran of Maize 22 11 <20
60 Oil of Maize 40 45 <50
61 Cake of Maize 52 52 <55
63 Maize Gluten 10 10 <15
64 Starch of Maize 88 75 <88
66 Beer of Maize - 350 550 650
67 White Maize -
68 Pop Corn -
71 Rye -
72 Flour of Rye - 70 80 85
73 Bran of Rye - 14 17 28
75 Oats -
76 Oats, Rolled - 45 53 70
77 Bran of Oats - 15 20 30
79 Millet -
80 Flour of Millet - 86 <95
81 Bran of Millet - 10 <20
82 Beer of Millet - 450 <500
83 Sorghum -
84 Flour of Sorghum - 90 <95
85 Bran of Sorghum - 8 <15
86 Beer of Sorghum - 485 <500
89 Buckwheat -
90 Flour of Buckwheat - 60 75 85
91 Bran of Buckwheat - 5 20 30
92 Quinoa -
94 Fonio -
95 Flour of Fonio - 80 <85
96 Bran of Fonio - 15 <20

FOOD BALANCE SHEETS OF THE PHILIPPINES
14
Philippine Statistics Authority
FAOSTAT
codeFAOSTAT Commodity List
Extraction rate /
Carcass weights
identified by FAO
MinimumWorld
AverageMaximum
97 Triticale -
98 Flour of Triticale - 75 <80
99 Bran of Triticale - 23 <28
101 Canary Seed -
103 Mixed Grain -
104 Flour of Mixed Grain - 80 <85
105 Bran of Mixed Grain - <20
108 Cereals nes -
109 Infant Food -
110 Wafers 90
111 Flour of Cereals -
112 Bran of Cereals -
113 Cereal Prep nes - 80 90
114 Mixes and Doughs -
115 Food Prep.Flour,Malt Ext -
116 Potatoes -
117 Flour of Potatoes 25 18 22
118 Potatoes, frozen - 45 55
119 Potato Starch - 16 22
120 Potato Offals - <60
121 Potato Tapioca - <20
122 Sweet Potatoes -
125 Cassava -
126 Flour of Cassava 25 <30
127 Cassava Tapioca 20 <20
128 Cassava Dried 25 <35
129 Cassava Starch 25 <25
135 Yautia (Cocoyam) -
136 Taro (Coco Yam) -
137 Yams -
149 Roots and Tubers nes -
150 Flour of Roots and Tuber 25 <25
151 Roots and Tubers Dried - <30
154 Fructose Chemically Pure -
155 Maltose Chemically Pure -
156 Sugar Cane -
157 Sugar Beets -
158 Cane Sugar 9 11 <15
159 Beet Sugar - 14 <18
160 Maple Sugar and Syrups -
161 Sugar Crops nes -
162 Sugar (Centrifugal, Raw) -
163 Sugar non Centrifugal 8 9 <13
164 Sugar Refined 92 <93.5
165 Molasses 4 <5
166 Other Fructose and Syrup - ≈100
167 Sugar and Syrups nes -
168 Sugar Confectionery 100 100
169 Beet Pulp, Dry - <7
170 Bagasse 20 ≈25
171 Sugars Flavoured - 100
172 Glucose and Dextrose - ≈110/≈100
173 Lactose -
174 Artificial Sweeteners -
175 Isoglucose - ≈100
176 Beans, Dry -
181 Broad Beans, Dry -
187 Peas, Dry -
191 Chick-Peas -
195 Cow Peas, Dry -
197 Pigeon Peas -
201 Lentils -
203 Bambara Beans -
205 Vetches -
210 Lupins -
211 Pulses nes -
212 Flour of Pulses - 72 <80
213 Bran of Pulses - 23 <30
216 Brazil Nuts -

FOOD BALANCE SHEETS OF THE PHILIPPINES
15
Philippine Statistics Authority
FAOSTAT
codeFAOSTAT Commodity List
Extraction rate /
Carcass weights
identified by FAO
MinimumWorld
AverageMaximum
217 Cashew Nuts -
220 Chestnuts -
221 Almonds -
222 Walnuts -
223 Pistachios -
224 Kolanuts -
225 Hazelnuts (Fliberts) -
226 Areca Nuts (Betel) -
229 Brazilnuts Shelled - <55
230 Cáshew Nuts Shelled - <30
231 Almonds Shelled - <50
232 Walnuts Shelled - <53
233 Hazelnuts Shelled - <50
234 Nuts nes -
235 Preprd Nuts(Excl.Grnuts) 100 80 100
236 Soybeans -
237 Oil of Soya Beans 18 18 <19
238 Cake of Soya Beans 80 79 <80
239 Soya Sauce 400 300 400
240 Soya Paste - ≈450
241 Soya Curd - ≈375
242 Groundnuts in Shell -
243 Groundnuts Shelled 70 70 <75
244 Oil of Groundnuts - 43 <50
245 Cake of Groundnuts - 54 <60
246 Prepared Groundnuts 100 <100
247 Peanut Butter - <85
249 Coconuts -
250 Coconuts, Dessicated 17 15 20 25
251 Copra 22 15 21 25
252 Oil of Coconuts 64 60 61 65
253 Cake of Coconuts 35 32 36 37
254 Oil Palm Fruit -
256 Palm Kernels 6 4 6 8
257 Oil of Palm 17 12 19 28
258 Oil of Palm Kernels 45 40 46 50
259 Cake of Palm Kernels 50 40 52 55
260 Olives -
261 Oil of Olive 20 14 20 25
262 Olives, Preserved 100 ≈100
263 Karite Nuts (Sheanuts) -
264 Butter of Karite Nuts -
265 Castor Beans -
266 Oil of Castor Beans 40 40 <45
267 Sunflower Seed -
268 Oil of Sunflower Seed 41 35 41 45
269 Cake of Sunflower Seed 47 40 47 55
270 Rapeseed -
271 Oil of Rapeseed 38 32 38 42
272 Cake of Rapeseed 60 45 60 60
273 Olive Residues 40 <40
274 Oil of Olive Residues 5 ≈5
275 Tung Nuts -
276 Oil of Tung -
277 Jojoba Seeds -
278 Oil of Jojoba -
280 Safflower Seed -
281 Oil of Safflower -
282 Cake of Safflower -
289 Sesame Seed -
290 Oil of Sesame Seed 43 40 43 48
291 Cake of Sesame Seed 51 45 51 55
292 Mustard Seed -
293 Oil of Mustard Seed 36 25 36 40
294 Cake of Mustard Seed 60 60 <70
295 Flour of Mustard 80 <80
296 Poppy Seed -
297 Oil of Poppy Seed -
298 Cake of Poppy Seed -

FOOD BALANCE SHEETS OF THE PHILIPPINES
16
Philippine Statistics Authority
FAOSTAT
codeFAOSTAT Commodity List
Extraction rate /
Carcass weights
identified by FAO
MinimumWorld
AverageMaximum
299 Melonseed -
305 Tallowtree Seeds -
306 Vegetable Tallow 15 ≈15
307 Oil of Stillingia 15 ≈15
310 Kapok Fruit -
311 Kapokseed in Shell 66 ≈66
312 Kapokseed Shelled 70 ≈70
313 Oil of Kapok 20 ≈20
314 Cake of Kapok 80 ≈80
328 Seed Cotton -
329 Cottonseed 67 50 63 70
331 Oil of Cotton Seed 18 12 16 22
332 Cake of Cotton Seed 45 40 51 65
333 Linseed -
334 Oil of Linseed 35 32 35 36
335 Cake of Linseed 63 55 63 65
336 Hempseed -
337 Oil of Hempseed -
338 Cake of Hempseed -
339 Oilseeds nes -
340 Oil of Veget Origin nes -
341 Cakes of Oilseeds -
343 Flour/Meal of Oilseeds 85 <85
358 Cabbages -
366 Artichokes -
367 Asparagus -
372 Lettuce -
373 Spinach -
378 Cassava Leaves -
388 Tomatoes -
389 Tomatojuice Concentrated - <20
390 Tomatojuice Single-Stren 70 <80
391 Tomato Paste - <25
392 Peeled Tomatoes - <80
393 Cauliflower - <65
394 Pumpkins, Squash, Gourds -
397 Cucumbers and Gherkins -
399 Eggplants -
401 Chillies&Peppers, Green -
402 Onions and Shallots, Green -
403 Onions, Dry -
406 Garlic -
407 Leeks and Oth.Alliac.Veg -
414 Beans, Green -
417 Peas, Green -
420 Broad Beans, Green -
423 String Beans -
426 Carrots -
430 Okra -
446 Green Corn (Maize) -
447 Sweet Corn Frozen - <35
448 Sweet Corn Prep. or Preserved - <45
449 Mushrooms -
450 Dried Mushrooms - 26 <30
451 Canned Mushrooms - <110
459 Chicory Roots -
460 Veg Prod Fresh or Dried -
461 Carobs -
463 Vegetables Fresh nes -
464 Vegetables Dried nes -
465 Vegetables Canned nes -
466 Juice of Vegetables nes -
469 Vegetables Dehydrated -
471 Vegetables Produced by Vinegar -
472 Vegetables Prepared nes -
473 Vegetables Frozen -
474 Veg. in Temp Preservatives -
475 Veg.Prep or Pres.Frozen -

FOOD BALANCE SHEETS OF THE PHILIPPINES
17 Philippine Statistics Authority
FAOSTAT
codeFAOSTAT Commodity List
Extraction rate /
Carcass weights
identified by FAO
MinimumWorld
AverageMaximum
476 Homogenized Veget. Prep. -
486 Bananas -
489 Plantains -
490 Oranges -
491 Oranjuice Single-Strength 40 <55
492 Oranjuice Concentrated - 10 <15
495 Tang.Mand.Clement.Satsuma -
496 Tangerine Juice - <45
497 Lemons and Limes -
498 Lemonjuice Single-Strength - 39 <45
499 Lemonjuice Concentrated - <12
507 Grapefruit and Pomelos -
509 Grapefruitjuice Sing-Strength - 47 <55
510 Grapefruitjuice Concentrated - 14 <16
512 Citrus Fruit nes -
513 Citrusjuice Single-Strength 40 <10
514 Citrusjuice Concentrated -
515 Apples -
517 Ferm. Beverages Exc Wine -
518 Applejuice Single Strength -
519 Applejuice Concentrated -
521 Pears -
523 Quinces -
526 Apricots -
527 Dry Apricots - ≈29
530 Sour Cherries -
531 Cherries -
534 Peaches and Nectarines -
536 Plums -
537 Plums, Dried (Prunes) - ≈35
538 Plumjuice, Single-Strength -
539 Plumjuice, Concentrated -
541 Stone Fruit nes, Fresh -
542 Pome Fruit nes, Fresh -
544 Strawberries -
547 Raspberries -
549 Gooseberries -
550 Currants -
552 Blueberries -
554 Cranberries -
558 Berries nes -
560 Grapes -
561 Raisins - ≈25
562 Grape Juice - ≈75
563 Must of Grapes - 86
564 Wine - ≈70
565 Vermouths and Similar -
566 Marc of Grapes - 20
567 Watermelons -
568 Cantaloupes & other melons -
569 Figs -
570 Figs, Dried - ≈35
571 Mangoes -
572 Avocados -
574 Pineapples -
575 Pineapples, Canned 55 52
576 Pineapplejuice Single-Strength 25 20
577 Dates -
580 Pineapplejuice Concentrated 12 8
583 Mango Juice 12 ≈10
584 Mango Pulp 70 ≈55
587 Persimmons -
591 Cashewapple -
592 Kiwi Fruit -
600 Papayas -
603 Fruit Tropical Fresh nes -
604 Fruit Tropical Dried nes -
619 Fruit Fresh nes 0
620 Fruit Dried nes -
622 Fruit Juice nes -
623 Fruit Prepared nes -
624 Flour of Fruit -

FOOD BALANCE SHEETS OF THE PHILIPPINES
18
Philippine Statistics Authority
FAOSTAT
codeFAOSTAT Commodity List
Extraction rate /
Carcass weights
identified by FAO
MinimumWorld
AverageMaximum
625 Fruit,Nut,Peel,Sugar Prs -
626 Homogen.Cooked Fruit Pre -
628 Pulp, Waste of Fruit for Feed 20 <40
629 Beet Tops -
630 Cane Tops -
631 Waters,Ice, etc. -
632 Alcohol Non Food Purpose 10 ≈28
633 Beverages Non-Alcoholic 150
634 Beverages Dist Alcoholic 20 62 ≈68 65
635 Straw, Husks -
636 Maize for Forage and Silage -
637 Sorghum for Forage and Silage -
638 Rye Grass for Forage and Silage -
639 Grasses nes for Forage and Silage -
640 Clover for Forage and Silage -
641 Alfafa for Forage and Silage -
642 Green Oilseeds for Silage -
643 Leguminous for Forage and Silage -
644 Cabbage for Fodder -
645 Pumpkins for Fodder -
646 Turnips for Fodder -
647 Beets for Fodder -
648 Carrots for Fodder -
649 Swedes for Fodder -
650 Leaves, Tops and Vines nes -
651 Forage Products nes -
652 Veg Products for Feed -
653 Food Wastes -
654 Dregs from Brewing+Dist. 40
655 Vegetables and Roots, Fodder -
656 Coffee, Green -
657 Coffee Roasted 75
658 Coffee Subst Cont Coffee -
659 Coffee Extracts 35
660 Coffee Husks and Skins -
661 Cocoa Beans -
662 Cocoa Paste 80 ≈80
663 Cocoa Husks+Shell 20 ≈20
664 Cocoa Butter 47 ≈47
665 Cocoa Powder and Cake 53 ≈53
666 Chocolate Products nes 470 ≈470
667 Tea -
671 Mate -
672 Extract Tea,Mate, Prep. -
674 Tea nes -
677 Hops -
687 Pepper,White/Long/Black -
689 Pimento, Allspice -
692 Vanilla -
693 Cinnamon (Canella) -
698 Cloves, Whole+Stems -
702 Nutmeg, Mace, Cardamons -
711 Anise, Badian, Fennel -
720 Ginger -
723 Spices nes -
737 Oil of Citronella -
748 Peppermint, Spearmint -
753 Essential Oils nes -
754 Pyrethrum, Dried Flowers -
755 Pyrethrum Extract -
756 Pyrethrum Marc -
767 Cotton Lint 23 30 35 45
768 Cotton Carded Combed -
769 Cotton Waste - <7
770 Cotton Linter - <10
771 Flax Fibre Raw -
773 Flax Fibre and Tow -
774 Flax Tow Waste -
777 Hemp Fibre and Tow -
778 Kapok Fibre - ≈33
780 Jute -
782 Jute-like Fibres -

FOOD BALANCE SHEETS OF THE PHILIPPINES
19
Philippine Statistics Authority
FAOSTAT
codeFAOSTAT Commodity List
Extraction rate /
Carcass weights
identified by FAO
MinimumWorld
AverageMaximum
788 Ramie -
789 Sisal -
800 Agave Fibres nes -
809 Abaca (Manila Hemp) -
813 Coir -
821 Fibre Crops nes -
826 Tobacco Leaves -
828 Cigarettes -
829 Cigars Cheroots -
831 Tobacco Products nes -
836 Natural Rubber -
837 Rubber Natural Dry -
839 Natural Gums -
840 Compound Feed, Cattle -
841 Compound Feed, Poultry -
842 Compound Feed, Pigs -
843 Pet Food -
845 Compound Feed, Other or nes -
846 Gluten Feed and Meal -
849 Feed Yeast -
850 Feed Supplements -
851 Non-protein Nitrogens -
852 Other Concentrates, nes -
853 Vitamins -
854 Feed Additives -
855 Feed Minerals -
857 Hay (non leguminous) -
858 Hay (clover, lucerne, etc.) -
859 Hay (unspecified) -
860 Range Pastures -
861 Improved Pasture -
862 Alfalfa Meal and Pellets -
866 Cattle 0
867 Beef and Veal 50 46 52 57
868 Offals of Cattle, Edible 9 4 7 10
869 Fat of Cattle 3 2 3 5
870 Beef and Veal,Boneless - 71
871 Cattle Butcher Fat - 12
872 Beef Dried Salt Smoked 46 46
873 Meat Extracts - 20
874 Sausages Beef and Veal - 80
875 Beef Preparations 60 60
876 Beef Canned -
877 Homogenized Meat Prep. -
878 Liver Preparations -
882 Cow Milk, Whole, Fresh -
883 Standardized Milk -
885 Cream, Fresh - 10 15 30
886 Butter of Cow Milk - 3 4,7 5-6
887 Ghee (From Cow Milk) - 5 <5
888 Skim Milk of Cows - 85 93 95
889 Whole Milk,Condensed - 20 45
890 Whey, Condensed -
891 Yoghurt - 80 <80
892 Yoghurt Concentrated or Not - 80 <80
893 Butterm,Curdl,Acid.Milk - 85 93 95
894 Whole Milk, Evaporated 0 30 50
895 Skim Milk, Evaporated - 40
896 Skim Milk, Condensed - 36
897 Dry Whole Cow Milk - 10 20
898 Dry Skim Cow Milk - 10
899 Dry Buttermilk - 10
900 Dry Whey -
901 Cheese (Whole Cow Milk) - 10 20
903 Whey, Fresh - 40 73 85
904 Cheese (Skim Cow Milk) - 18
905 Whey Cheese -
907 Processed Cheese -
908 Reconstituted Milk -
909 Prod.Of Nat.Milk Constit -
910 Ice Cream and Edible Ice -
916 Egg Albumine -

FOOD BALANCE SHEETS OF THE PHILIPPINES
20
Philippine Statistics Authority
FAOSTAT
codeFAOSTAT Commodity List
Extraction rate /
Carcass weights
identified by FAO
MinimumWorld
AverageMaximum
917 Casein - <3
919 Cattle Hides, Fresh 2 4 6 10
920 Hides Wet-Salted Cattle - 80
921 Hides Dry-Salted Cattle - 50
922 Hides nes, Cattle - 80
927 Skins Fresh of Calves -
928 Skins Wet-Salt Calves - 80
929 Skins Dry-Salted, Calves - 50
930 Skins nes, Calves -
944 Indigenous Cattle Meat 23
945 Biological Cattle Meat 47
946 Buffaloes 0
947 Buffalo Meat 22
948 Offals of Buffalo, Edible 2
949 Fat of Buffalo 1
951 Buffalo Milk 0
952 Butter of Buffalo Milk -
953 Ghee (from Buffalo Milk) -
954 Skim Milk of Buffalo -
955 Cheese of Buffalo Milk -
957 Buffalo Hides, Fresh 2
958 Hides Wet-Salted, Buffalo 80
959 Hides Dry-Salted, Buffalo 60
972 Indigenous Buffalo Meat 22
973 Biological Buffalo Meat 46
976 Sheep -
977 Mutton and Lamb 0 44 50 56
978 Offals of Sheep, Edible 0 4 8 10
979 Fat of Sheep 0 2 3 6
982 Sheep Milk -
983 Butter and Ghee (Sheep Milk) -
984 Cheese of Sheep Milk -
985 Skim Sheep Milk -
987 Wool, Greasy -
988 Wool, Scoured -
994 Grease Incl Lanolin Wool -
995 Sheepskins, Fresh 0 6 8 12
996 Skin Wet-Salted Sheep -
997 Skin Dry-Salted Sheep -
998 Skins nes, Sheep -
999 Skin With Wool Sheep 0
1002 Karakul Skins -
1007 Wool Shoddy -
1008 Hair Carded or Combed -
1009 Wool and Hair Waste -
1010 Wool Tops -
1012 Indigenous Sheep Meat 0
1013 Biological Sheep Meat 0
1016 Goats 0
1017 Goat Meat 44
1018 Offals of Goats, Edible 14
1019 Fat of Goats 0
1020 Goat Milk -
1021 Cheese of Goat Milk -
1022 Butter of Goat Milk -
1023 Skim Milk of Goat -
1025 Goatskins, Fresh 0
1026 Skins Wet-Salted Goats -
1027 Skins Dry-Salted Goats -
1028 Skins nes, Goats -
1030 Fine Goat Hair -
1031 Coarse Goat Hair -
1032 Indigenous Goat Meat 2
1033 Biological Goat Meat 4
1034 Pigs -
1035 Pigmeat 70 65 76 85
1036 Offals of Pigs, Edible 14 4 4 10
1037 Fat of Pigs 6 4 6 15
1038 Pork - 73
1039 Bacon-Ham of Pigs 77 77
1040 Pig Butcher Fat - 10 25
1041 Sausages Pig Meat 85 85

FOOD BALANCE SHEETS OF THE PHILIPPINES
21
Philippine Statistics Authority
FAOSTAT
codeFAOSTAT Commodity List
Extraction rate /
Carcass weights
identified by FAO
MinimumWorld
AverageMaximum
1042 Meat Preparations Pigs - 88
1043 Lard 80 80
1044 Pigskins, Fresh - 5
1045 Skins Wet-Salted, Pigs - 80
1046 Skins Dry-Salted, Pigs -
1047 Skins nes, Pigs -
1055 Indigenous Pig Meat 7
1056 Biological Pig Meat 10
1057 Chickens -
1058 Chicken Meat 77 73 78 83
1059 Offals Liver of Chickens -
1060 Fat Liver Prep(Foie Gras 0
1061 Meat Canned Chicken - <92
1062 Hen Eggs -
1063 Eggs Liquid Hen -
1064 Eggs Dry Whole Yolks Hen -
1065 Fat of Poultry -
1066 Fat of Poultry Rendered -
1067 Hen Eggs (number) -
1068 Ducks -
1069 Duck Meat 75
1070 Indigenous Duck Meat 200
1071 Biological Duck Meat 260
1072 Geese -
1073 Goose Meat -
1074 Offals Liver Geese -
1075 Offals Liver Ducks -
1077 Indigenous Geese Meat -
1078 Biological Geese Meat -
1079 Turkeys -
1080 Turkey Meat -
1081 Offals Liver Turkeys -
1083 Pigeons and Other Birds -
1084 Indigenous Meat, Other Poultry -
1085 Biological Meat, Other Poultry -
1087 Indigenous Turkey Meat -
1088 Biological Turkey Meat -
1089 Meat of Pigeon and Other Birds -
1091 Eggs, excluding Hen -
1092 Eggs, excl. Hen Eggs (number) -
1094 Indigenous Chicken Meat 112
1095 Biological Chicken Meat 144
1096 Horses -
1097 Horsemeat -
1098 Offals of Horse -
1100 Hair of Horses -
1102 Horse Hides, Fresh -
1103 Hides Wet-Salted Horses -
1104 Hides Dry-Salted, Horses -
1105 Hides nes, Horses -
1107 Asses -
1108 Meat of Asses -
1109 Hides of Asses, Fresh -
1110 Mules -
1111 Meat of Mules -
1112 Hides of Mules, Fresh -
1120 Indigenous Horse Meat -
1121 Biological Horse Meat -
1122 Indigenous Ass Meat -
1123 Biological Ass Meat -
1124 Indigenous Mule Meat -
1125 Biological Mule Meat -
1126 Camels -
1127 Meat of Camels -
1128 Offals of Camel, Edible -
1129 Fat of Camels -
1130 Camel Milk -
1133 Camel Hides, Fresh -
1134 Hides Wet-Salted, Camels -
1135 Hides Dry-Salted, Camels -
1136 Hides nes, Camels -
1137 Indigenous Camel Meat -

FOOD BALANCE SHEETS OF THE PHILIPPINES
22 Philippine Statistics Authority
FAOSTAT
codeFAOSTAT Commodity List
Extraction rate /
Carcass weights
identified by FAO
MinimumWorld
AverageMaximum
1138 Biological Camel Meat -
1140 Rabbits -
1141 Rabbit Meat -
1144 Indigenous Rabbit Meat -
1145 Biological Rabbit Meat -
1146 Rabbit Skins -
1150 Other Rodents -
1151 Meat of Other Rodents -
1154 Indigenous Meat, Other Rodents -
1155 Biological Meat, Other Rodents -
1157 Other Camelids -
1158 Meat of Other Camelids -
1159 Offals of Other Camelids -
1160 Fat of Other Camelids -
1161 Indigenous Meat, Other Camelids -
1162 Biological Meat, Other Camelids -
1163 Game Meat -
1164 Meat, Dried, nes -
1166 Meat nes -
1167 Offals nes -
1168 Animal Oils and Fats nes -
1169 Live Animals nes, Non-Food -
1171 Live Animals nes -
1172 Meat Prepared nes 100 90
1173 Meat Meal -
1174 Fish Meal -
1175 Blood Meal -
1176 Snails Not Sea Snails -
1181 Beehives -
1182 Honey -
1183 Beeswax -
1185 Cocoons, Reelable -
1186 Silk, Raw -
1187 Cocoons, Unreelable -
1195 Fur Skins -
1213 Hides and Skins nes, Fresh -
1214 Hide Wet-Salted -
1215 Hide Dry-Salted -
1216 Hide nes -
1217 Leather Used and Waste -
1218 Hair Fine Animal -
1219 Hair Coarse nes -
1221 Lard and Stearine Oil -
1222 Degras -
1223 Oils Fish and Marine Mammals -
1225 Tallow - 82
1232 Food Prepared nes -
1241 Liquid Margarine - 110 150
1242 Margarine + Shortening 0 100 130
1243 Fat Preparations nes 80 ≈100
1259 Food Waste, Prep. for Feed -
1273 Castor Oil Hydr(Opal Wax -
1274 Oils Boiled etc -
1275 Oils Hydrogenated 140 100 130
1276 Fatty Acids Oils 431.31 0 ≈98
1277 Res Fatty Subst 431.32 -
1291 Arabic Gum -
1292 Other Resins -
1293 Crude Organic Materls 29 -
1294 Seeds Fruits Spores Pl -
1295 Spermaceti 431.41 -
1296 Waxes Veg 431.43 -
1501 Freshwater Diadrom Fresh -
1502 Freshwater Frozen Whole 99
1503 Freshwater Fillets -
1504 Freshwater Frozen Fillets -
1505 Freshwater Cured -
1506 Freshwater Canned -
1507 Freshwater Prep nes -
1509 Freshwater Body Oils -
1510 Freshwater Liver Oils -
1514 Demersal Marine Fish Fresh -

FOOD BALANCE SHEETS OF THE PHILIPPINES
23
Philippine Statistics Authority
FAOSTAT
codeFAOSTAT Commodity List
Extraction rate /
Carcass weights
identified by FAO
MinimumWorld
AverageMaximum
1515 Demersal Frozen Whole 80
1516 Demersal Fillets 40
1517 Demersal Frozen Fillets 40
1518 Demersal Cured -
1519 Demersal Canned -
1520 Demersal Prep nes 100
1522 Demersal Body Oils -
1523 Demersal Liver Oils -
1527 Pelagic Marine Fish Fresh -
1528 Pelagic Frozen Whole 90
1529 Pelagic Fillets -
1530 Pelagic Frozen Fillets -
1531 Pelagic Cured 62
1532 Pelagic Canned 52
1533 Pelagic Prep nes 62
1534 Pelagic Meals -
1535 Pelagic Body Oils -
1536 Pelagic Liver Oils -
1537 Pelagic Meal from Offal -
1540 Marine Fish nes Fresh -
1541 Marine nes Frozen Whole 90
1542 Marine nes Fillets -
1543 Marine nes Frozen Fillets -
1544 Marine nes Cured -
1545 Marine nes Canned -
1546 Marine nes Prep nes -
1547 Marine nes Meals -
1548 Marine nes Body Oils -
1549 Marine nes Liver Oils -
1550 Marine nes Meal from Offal -
1553 Crustaceans Fresh -
1554 Crustaceans Frozen 100
1555 Crustaceans Cured 25
1556 Crustaceans Canned 25
1557 Crustaceans Prep nes 38
1559 Crustaceans Meal from Offal -
1562 Molluscs excl cephal fresh -
1563 Molluscs Frozen 40
1564 Molluscs Cured -
1565 Molluscs Canned 62
1567 Molluscs Meal from Offal -
1570 Cephalopods Fresh -
1571 Cephalopods Frozen 100
1572 Cephalopods Cured -
1573 Cephalopods Prep nes -
1574 Cephalopods Prep nes -
1576 Cephalopods Meal from Offal -
1579 Aquatic Mammals -
1580 Aquatic Mammals Meat -
1582 Aquatic Mammals Oils -
1583 Aquatic Mammals Prep nes -
1587 Aquatic Animals nes Frsh -
1588 Aquatic Animals Cured -
1590 Aquatic Animals Prep nes 53
1591 Aqua Anim Meal Fr Offal -
1594 Aquatic Plants -
1595 Aquatic Plants Dried 10
1596 Aquatic Plants Prep nes -

FOOD BALANCE SHEETS OF THE PHILIPPINES
24
Philippine Statistics Authority
Annex 2. Conversion Ratios and Parameters for the FBS
Conversion Ratios for Rice, Livestock and Poultry
Item Equivalent/Conversion
RICE Quantity of Palay X 0.654
CATTLE
Dressweight Production (in mt) X 0.50
Offals Production (in mt) X 0.0861
CARABAO
Dressweight Production (in mt) X 0.50
Offals Production (in mt) X 0.0861
HOG
Dressweight Production (in mt) X 0.70
Offals Production (in mt) X 0.1433
GOAT
Dressweight Production (in mt) X 0.44
Offals Production (in mt) X 0. 1433
CHICKEN
Dressweight Production (in mt) X 0.77
DUCK
Dressweight Production (in mt) X 0.75
EGGS
Chicken Fresh Eggs / 21 pieces/kilogram
Duck Fresh Eggs / 15 pieces/kilogram
Item
1. Cereals
Palay 75.00 (kg./ha)
Corn 20.00 (kg./ha)
2. Root crops
Cassava
Gabi 25.00 (kg./ha)
Pao/Galiang 9% of production
White potato 25.00 (kg./ha)
Sweet potato 20.00 (kg./ha)
Tugui 9% of production
Ubi 25.00 (kg./ha)
Ampalaya 2.20 (kg./ha)
Seed

FOOD BALANCE SHEETS OF THE PHILIPPINES
25 Philippine Statistics Authority
Item
3. Vegetables and Legumes
Cabbage 3.70 (kg./ha)
Chayote 3.50 (kg./ha)
Cucumber 3.50 (kg./ha)
Eggplant 2.10 (kg./ha)
Garlic 12% of production
Ginger 0.50% of production
Gourd (Upo) 3.30 (kg./ha)
Habitchuelas 6.00 (kg./ha)
Mongo 4.50 (kg./ha)
Onion 7% of production
Patola 1.10 (kg./ha)
Peanut 4.00 (kg./ha)
Soybean 4.50 (kg./ha)
Squash 1.00 (kg./ha)
Tomato 3.90 (kg./ha)
4. Nuts
Cashew 4.00 (kg./ha)
Pili 4.00 (kg./ha)
5. Commercial Crops
Coconut 1% of production
6. Livestock and
Chicken Egg 6% of production
Duck Egg 4% of production
Seed

FOOD BALANCE SHEETS OF THE PHILIPPINES
26
Philippine Statistics Authority
Feed Waste ProcessedOther
Utilization
31 Milled Paddy Rice 6.50 4.00
56 Maize 65.00 5.00 8.34
116 Potatoes 5.00 25.00
122 Sweet Potatoes 5.00
125 Cassava 6.00 17.00 67.00
136 Taro (Coco Yam) 5.00
137 Yams 4.00
156 Sugar Cane 99.00
176 Beans, Dry 0.50
217 Cashew Nuts 0.50 0.25
234 Nuts nes 0.50 0.25
236 Soybeans 0.50 0.25
242 Groundnuts in Shell 0.50 7.00
249 Coconuts 0.30 0.05 40.00 54.00
252 Oil of Coconuts 0.10
358 Cabbages 8.00
367 Asparagus 8.00
388 Tomatoes 7.00 15.00
393 Cauliflower 8.00
399 Eggplants 8.00
401 Chillies&Peppers, Green 5.00
403 Onions, Dry 8.00
406 Garlic 8.00
426 Carrots 8.00
430 Okra 8.00
486 Bananas 6.00 25.00
490 Oranges 6.00
495 Tang.Mand.Clement.Satsuma 6.00
507 Grapefruit and Pomelos 6.00
512 Citrus Fruit nes 6.00
544 Strawberries 6.00
567 Watermelons 6.00
571 Mangoes 6.00
572 Avocados 6.00
574 Pineapples 6.00 44.00
600 Papayas 6.00
656 Coffee, Green 6.00 23.00
661 Cocoa Beans 1.00
687 Pepper,White/Long/Black 5.00
720 Ginger 8.00
826 Tobacco Leaves 10.00
867 Beef and Veal 10.00
919 Cattle Hides, Fresh 10.00
1035 Pigmeat 1.20
1036 Offals of Pigs, Edible 1.20
1062 Hen Eggs 2.00
1091 Eggs, excluding Hen 2.00
1501 Freshwater Diadrom Fresh 3.00
1540 Marine Fish nes Fresh 3.00 0.32
FAOSTAT
code
Domestic Utilization elements: user
calculated valuesFAOSTAT Commodity List

FOOD BALANCE SHEETS OF THE PHILIPPINES
27
Philippine Statistics Authority
Annex 3. Nutritional Values Used in FBS Note: Nutritional Values were from FAO and World Standard Nutritional Values;
Highlighted cells were based from 1997 FCT from DOST-FNRI.
Calories Proteins Fats
u/mg g/mg g/mg
15 Wheat 334 122 23
16 Flour of Wheat 352 126 8
17 Bran of Wheat 213 121 31
18 Macaroni 353 143 2
19 Germ of Wheat 382 291 107
20 Bread 329 97 51
21 Bulgur, Wholemeal 345 123 20
22 Pastry 364 75 8
23 Wheat Starch 362 5 3
24 Wheat Gluten 380 950 0
26 Wheat Fermented Beverages 60 19 3
27 Rice, Paddy 280 60 14
28 Rice, Husked 357 75 18
29 Milled/Husked Rice 371 100 28
31 Milled Paddy Rice 356 74 5
32 Rice, Broken 360 67 7
33 Rice, Gluten 380 950 0
34 Rice, Starch 362 5 3
35 Bran of Rice 276 133 158
36 Oil of Rice Bran 884 0 1,000
38 Rice Flour 358 76 3
39 Rice Fermented Beverages 133 3 0
41 Breakfast Cereals 400 51 4
44 Barley 332 110 18
45 Pot Barley 348 96 11
46 Barley, Pearled 346 90 14
48 Barley Flour and Grits 343 92 17
49 Malt of Barley 368 131 19
50 Malt Extracts 367 60 0
51 Beer of Barley 15 3 0
56 Maize 354 80 12
57 Germ of Maize 373 111 385
58 Flour of Maize 364 79 12
60 Oil of Maize 884 0 1,000
63 Maize Gluten 380 950 0
64 Starch of Maize 370 3 3
66 Beer of Maize 40 4 0
67 White Maize 357 83 15
68 Pop Corn 471 67 186
71 Rye 319 110 19
72 Flour of Rye 341 90 18
75 Oats 394 100 47
76 Oats, Rolled 384 160 63
79 Millet 340 97 30
Philippines NUTRITIONAL VALUESFAOSTAT
codeFAOSTAT Commodity List

FOOD BALANCE SHEETS OF THE PHILIPPINES
28
Philippine Statistics Authority
Calories Proteins Fats
u/mg g/mg g/mg
80 Flour of Millet 340 97 30
82 Beer of Millet 40 4 0
83 Sorghum 343 101 33
84 Flour of Sorghum 343 101 33
86 Beer of Sorghum 40 4 0
89 Buckw heat 330 110 20
90 Flour of Buckw heat 344 64 12
92 Quinoa 342 120 50
94 Fonio 338 80 30
95 Flour of Fonio 355 90 22
97 Triticale 327 116 21
98 Flour of Triticale 341 114 21
101 Canary Seed 388 160 60
103 Mixed Grain 340 80 15
104 Flour of Mixed Grain 364 100 11
108 Cereals nes 340 80 15
109 Infant Food 371 66 16
110 Wafers 504 46 229
111 Flour of Cereals 364 100 11
113 Cereal Prep nes 364 100 11
114 Mixes and Doughs 393 62 120
115 Food Prep.Flour,Malt Ext 377 75 27
116 Potatoes 78 24 1
117 Flour of Potatoes 349 85 4
118 Potatoes, frozen 73 12 0
119 Potato Starch 362 5 3
121 Potato Tapioca 362 5 3
122 Sw eet Potatoes 121 8 4
125 Cassava 145 6 2
126 Flour of Cassava 362 11 7
127 Cassava Tapioca 354 5 3
128 Cassava Dried 255 28 7
129 Cassava Starch 362 5 3
135 Yautia (Cocoyam) 109 17 3
136 Taro (Coco Yam) 141 23 2
137 Yams 97 17 2
149 Roots and Tubers nes 141 10 27
150 Flour of Roots and Tuber 282 50 6
151 Roots and Tubers Dried 282 50 6
154 Fructose Chemically Pure 375 0 0
155 Maltose Chemically Pure 375 0 0
156 Sugar Cane 50 1 2
157 Sugar Beets 70 13 1
160 Maple Sugar and Syrups 348 0 0
Philippines NUTRITIONAL VALUESFAOSTAT
codeFAOSTAT Commodity List

FOOD BALANCE SHEETS OF THE PHILIPPINES
29 Philippine Statistics Authority
Calories Proteins Fats
u/mg g/mg g/mg
161 Sugar Crops nes 390 0 0
162 Sugar (Centrifugal, Raw ) 373 0 0
163 Sugar non Centrifugal 358 11 3
164 Sugar Refined 400 0 0
165 Molasses 260 18 4
166 Other Fructose and Syrup 298 3 0
167 Sugar and Syrups nes 308 0 1
168 Sugar Confectionery 400 0 0
169 Beet Pulp, Dry 288 111 6
171 Sugars Flavoured 310 0 0
172 Glucose and Dextrose 368 0 0
173 Lactose 387 0 0
175 Isoglucose 318 0 0
176 Beans, Dry 119 77 2
181 Broad Beans, Dry 343 234 20
187 Peas, Dry 340 241 13
191 Chick-Peas 377 192 62
195 Cow Peas, Dry 358 204 15
197 Pigeon Peas 348 212 12
201 Lentils 346 242 18
203 Bambara Beans 365 177 63
205 Vetches 325 315 19
210 Lupins 390 400 130
211 Pulses nes 340 220 20
212 Flour of Pulses 340 220 20
216 Brazil Nuts 315 69 318
217 Cashew Nuts 170 55 139
220 Chestnuts 158 18 17
221 Almonds 236 80 209
222 Walnuts 289 64 278
223 Pistachios 289 103 242
224 Kolanuts 349 90 20
225 Hazelnuts (Fliberts) 291 60 288
226 Areca Nuts (Betel) 342 34 94
229 Brazilnuts Shelled 656 143 662
230 Cáshew Nuts Shelled 553 182 439
231 Almonds Shelled 589 200 522
232 Walnuts Shelled 642 143 619
233 Hazelnuts Shelled 632 130 626
234 Nuts nes 699 142 685
235 Preprd Nuts(Excl.Grnuts) 615 155 562
236 Soybeans 151 131 61
237 Oil of Soya Beans 884 0 1,000
238 Cake of Soya Beans 123 129 70
Philippines NUTRITIONAL VALUESFAOSTAT
codeFAOSTAT Commodity List

FOOD BALANCE SHEETS OF THE PHILIPPINES
30
Philippine Statistics Authority
Calories Proteins Fats
u/mg g/mg g/mg
239 Soya Sauce 75 35 1
240 Soya Paste 144 130 35
241 Soya Curd 123 129 70
242 Groundnuts in Shell 401 174 266
243 Groundnuts Shelled 567 257 492
244 Oil of Groundnuts 884 0 1,000
245 Cake of Groundnuts 363 417 76
246 Prepared Groundnuts 580 268 492
247 Peanut Butter 616 254 454
249 Coconuts 102 14 53
250 Coconuts, Dessicated 660 69 645
251 Copra 636 60 614
252 Oil of Coconuts 895 0 991
254 Oil Palm Fruit 900 0 1,000
256 Palm Kernels 514 73 434
257 Oil of Palm 884 0 1,000
258 Oil of Palm Kernels 884 0 1,000
260 Olives 175 13 175
261 Oil of Olive 884 0 1,000
262 Olives, Preserved 132 13 126
263 Karite Nuts (Sheanuts) 579 68 490
264 Butter of Karite Nuts 711 0 850
266 Oil of Castor Beans 884 0 1,000
267 Sunflow er Seed 308 123 268
268 Oil of Sunflow er Seed 880 0 1,000
270 Rapeseed 494 196 450
271 Oil of Rapeseed 884 0 1,000
274 Oil of Olive Residues 884 0 1,000
276 Oil of Tung 884 0 1,000
280 Safflow er Seed 314 97 303
281 Oil of Saff low er 884 0 1,000
289 Sesame Seed 642 251 535
290 Oil of Sesame Seed 884 0 1,000
291 Cake of Sesame Seed 469 249 288
292 Mustard Seed 469 249 288
293 Oil of Mustard Seed 884 0 1,000
295 Flour of Mustard 469 264 363
296 Poppy Seed 533 180 447
297 Oil of Poppy Seed 884 0 1,000
299 Melonseed 562 402 432
307 Oil of Stillingia 884 0 1,000
313 Oil of Kapok 884 0 1,000
331 Oil of Cotton Seed 884 0 1,000
333 Linseed 498 180 340
Philippines NUTRITIONAL VALUESFAOSTAT
codeFAOSTAT Commodity List

FOOD BALANCE SHEETS OF THE PHILIPPINES
31 Philippine Statistics Authority
Calories Proteins Fats
u/mg g/mg g/mg
334 Oil of Linseed 884 0 1,000
337 Oil of Hempseed 884 0 1,000
339 Oilseeds nes 387 147 317
340 Oil of Veget Origin nes 884 0 1,000
343 Flour/Meal of Oilseeds 393 372 156
358 Cabbages 27 15 2
366 Artichokes 20 11 1
367 Asparagus 20 22 1
372 Lettuce 22 13 4
373 Spinach 26 19 5
378 Cassava Leaves 83 71 14
388 Tomatoes 27 9 3
389 Tomatojuice Concentrated 25 8 2
390 Tomatojuice Single-Stren 17 8 1
391 Tomato Paste 112 43 1
392 Peeled Tomatoes 19 9 2
393 Caulif low er 25 17 2
394 Pumpkins, Squash, Gourds 36 11 4
397 Cucumbers and Gherkins 20 6 2
399 Eggplants 29 10 2
401 Chillies&Peppers, Green 46 14 5
402 Onions and Shallots, Green 37 17 10
403 Onions, Dry 60 17 4
406 Garlic 129 70 3
407 Leeks and Oth.Alliac.Veg 37 7 1
414 Beans, Green 50 30 4
417 Peas, Green 31 21 2
420 Broad Beans, Green 23 23 1
423 String Beans 43 31 2
426 Carrots 52 15 4
430 Okra 38 17 2
446 Green Corn (Maize) 56 21 8
447 Sw eet Corn Frozen 54 18 4
448 Sw eet Corn Prep. or Preserved 77 23 6
449 Mushrooms 48 38 6
450 Dried Mushrooms 330 160 9
451 Canned Mushrooms 23 23 4
459 Chicory Roots 60 11 2
460 Veg Prod Fresh or Dried 22 14 2
461 Carobs 111 16 5
463 Vegetables Fresh nes 12 4 2
464 Vegetables Dried nes 176 112 16
465 Vegetables Canned nes 36 14 3
466 Juice of Vegetables nes 19 6 1
Philippines NUTRITIONAL VALUESFAOSTAT
codeFAOSTAT Commodity List

FOOD BALANCE SHEETS OF THE PHILIPPINES
32
Philippine Statistics Authority
Calories Proteins Fats
u/mg g/mg g/mg
469 Vegetables Dehydrated 341 66 13
471 Vegetables Produced by Vinegar 29 14 13
472 Vegetables Prepared nes 38 21 3
473 Vegetables Frozen 71 33 5
474 Veg. in Temp Preservatives 65 33 3
475 Veg.Prep or Pres.Frozen 54 24 4
476 Homogenized Veget. Prep. 41 12 5
486 Bananas 112 11 7
489 Plantains 75 8 3
490 Oranges 35 4 2
491 Oranjuice Single-Strength 43 2 2
492 Oranjuice Concentrated 244 0 7
495 Tang.Mand.Clement.Satsuma 33 4 2
496 Tangerine Juice 43 5 2
497 Lemons and Limes 50 8 24
498 Lemonjuice Single-Strength 42 5 16
499 Lemonjuice Concentrated 116 23 9
507 Grapefruit and Pomelos 51 7 6
509 Grapefruitjuice Sing-Strength 39 5 1
510 Grapefruitjuice Concentrated 230 0 13
512 Citrus Fruit nes 44 4 10
513 Citrusjuice Single-Strength 47 6 2
514 Citrusjuice Concentrated 157 21 5
515 Apples 62 5 1
517 Ferm. Beverages Exc Wine 34 4 1
518 Applejuice Single Strength 50 1 1
519 Applejuice Concentrated 166 5 4
521 Pears 54 4 4
523 Quinces 35 2 1
526 Apricots 45 13 4
527 Dry Apricots 238 37 5
530 Sour Cherries 45 9 3
531 Cherries 65 11 9
534 Peaches and Nectarines 33 5 1
536 Plums 71 8 4
537 Plums, Dried (Prunes) 278 25 7
538 Plumjuice, Single-Strength 71 6 0
539 Plumjuice, Concentrated 215 20 1
541 Stone Fruit nes, Fresh 52 9 3
542 Pome Fruit nes, Fresh 48 4 3
544 Straw berries 34 8 2
547 Raspberries 47 9 5
549 Gooseberries 40 8 7
550 Currants 59 14 3
Philippines NUTRITIONAL VALUESFAOSTAT
codeFAOSTAT Commodity List

FOOD BALANCE SHEETS OF THE PHILIPPINES
33
Philippine Statistics Authority
Calories Proteins Fats
u/mg g/mg g/mg
552 Blueberries 55 7 4
554 Cranberries 47 4 2
558 Berries nes 49 10 7
560 Grapes 83 4 3
561 Raisins 340 35 11
562 Grape Juice 49 0 4
563 Must of Grapes 61 6 1
564 Wine 85 1 0
565 Vermouths and Similar 137 1 0
567 Watermelons 31 1 2
568 Cantaloupes & other melons 24 6 1
569 Figs 73 8 3
570 Figs, Dried 270 4 12
571 Mangoes 70 6 2
572 Avocados 101 9 62
574 Pineapples 55 4 2
575 Pineapples, Canned 92 4 4
576 Pineapplejuice Single-Strength 50 1 0
577 Dates 156 15 4
580 Pineapplejuice Concentrated 179 13 1
583 Mango Juice 56 4 7
584 Mango Pulp 65 5 3
587 Persimmons 86 4 6
591 Cashew apple 43 8 6
592 Kiw i Fruit 52 9 4
600 Papayas 53 7 2
603 Fruit Tropical Fresh nes 119 14 7
604 Fruit Tropical Dried nes 267 28 6
619 Fruit Fresh nes 43 6 3
620 Fruit Dried nes 267 28 6
622 Fruit Juice nes 48 5 1
623 Fruit Prepared nes 36 5 2
624 Flour of Fruit 346 39 18
625 Fruit,Nut,Peel,Sugar Prs 212 6 0
626 Homogen.Cooked Fruit Pre 59 3 0
631 Waters,Ice, etc. 0 0 0
633 Beverages Non-Alcoholic 39 0 0
634 Beverages Dist Alcoholic 295 0 0
652 Veg Products for Feed 52 60 4
656 Coffee, Green 47 67 0
657 Coffee Roasted 406 152 71
658 Coffee Subst Cont Coffee 56 80 0
659 Coffee Extracts 129 40 0
661 Cocoa Beans 414 40 400
Philippines NUTRITIONAL VALUESFAOSTAT
codeFAOSTAT Commodity List

FOOD BALANCE SHEETS OF THE PHILIPPINES
34
Philippine Statistics Authority
Calories Proteins Fats
u/mg g/mg g/mg
662 Cocoa Paste 472 17 440
664 Cocoa Butter 711 0 850
665 Cocoa Pow der and Cake 465 217 198
666 Chocolate Products nes 393 42 357
667 Tea 357 217 10
671 Mate 40 100 0
672 Extract Tea,Mate, Prep. 18 45 0
674 Tea nes 40 100 0
687 Pepper,White/Long/Black 276 107 27
689 Pimento, Allspice 318 120 173
692 Vanilla 334 113 115
693 Cinnamon (Canella) 261 39 32
698 Cloves, Whole+Stems 323 60 201
702 Nutmeg, Mace, Cardamons 525 58 363
711 Anise, Badian, Fennel 345 158 149
720 Ginger 46 11 8
723 Spices nes 337 113 155
780 Jute 65 65 10
862 Alfalfa Meal and Pellets 265 305 20
867 Beef and Veal 137 231 46
868 Offals of Cattle, Edible 176 158 106
869 Fat of Cattle 409 151 345
870 Beef and Veal,Boneless 150 185 79
871 Cattle Butcher Fat 847 20 930
872 Beef Dried Salt Smoked 203 343 63
873 Meat Extracts 238 160 89
874 Sausages Beef and Veal 313 117 284
875 Beef Preparations 233 250 140
876 Beef Canned 252 147 183
877 Homogenized Meat Prep. 110 137 57
878 Liver Preparations 275 134 198
882 Cow Milk, Whole, Fresh 65 33 36
883 Standardized Milk 48 33 15
885 Cream, Fresh 195 27 193
886 Butter of Cow Milk 717 9 811
887 Ghee (From Cow Milk) 873 3 991
888 Skim Milk of Cow s 35 34 2
889 Whole Milk,Condensed 320 81 84
890 Whey, Condensed 26 9 3
891 Yoghurt 83 53 45
892 Yoghurt Concentrated or Not 82 47 15
893 Butterm,Curdl,Acid.Milk 43 35 50
894 Whole Milk, Evaporated 148 77 78
895 Skim Milk, Evaporated 120 76 48
Philippines NUTRITIONAL VALUESFAOSTAT
codeFAOSTAT Commodity List

FOOD BALANCE SHEETS OF THE PHILIPPINES
35
Philippine Statistics Authority
Calories Proteins Fats
u/mg g/mg g/mg
896 Skim Milk, Condensed 334 85 70
897 Dry Whole Cow Milk 480 241 225
898 Dry Skim Cow Milk 362 408 8
899 Dry Buttermilk 387 343 58
900 Dry Whey 346 123 8
901 Cheese (Whole Cow Milk) 388 271 304
903 Whey, Fresh 26 8 2
904 Cheese (Skim Cow Milk) 247 460 40
905 Whey Cheese 72 124 10
907 Processed Cheese 310 190 231
908 Reconstituted Milk 61 18 34
909 Prod.Of Nat.Milk Constit 61 18 34
910 Ice Cream and Edible Ice 157 42 95
916 Egg Albumine 61 127 2
917 Casein 427 1,000 0
947 Buffalo Meat 99 204 19
948 Offals of Buffalo, Edible 107 133 48
949 Fat of Buffalo 847 20 930
951 Buffalo Milk 115 52 87
952 Butter of Buffalo Milk 717 9 811
953 Ghee (from Buffalo Milk) 873 3 991
954 Skim Milk of Buffalo 41 43 1
955 Cheese of Buffalo Milk 269 169 220
977 Mutton and Lamb 195 120 159
978 Offals of Sheep, Edible 117 146 57
979 Fat of Sheep 902 0 1,000
982 Sheep Milk 94 59 60
983 Butter and Ghee (Sheep Milk) 716 6 810
984 Cheese of Sheep Milk 310 232 228
985 Skim Sheep Milk 48 61 4
1017 Goat Meat 95 183 23
1018 Offals of Goats, Edible 101 170 33
1019 Fat of Goats 847 20 930
1020 Goat Milk 72 36 41
1021 Cheese of Goat Milk 280 160 150
1022 Butter of Goat Milk 717 9 811
1023 Skim Milk of Goat 35 34 2
1035 Pigmeat 274 155 234
1036 Offals of Pigs, Edible 159 141 106
1037 Fat of Pigs 712 47 767
1038 Pork 220 134 180
1039 Bacon-Ham of Pigs 603 111 583
1040 Pig Butcher Fat 712 47 767
1041 Sausages Pig Meat 587 107 600
Philippines NUTRITIONAL VALUESFAOSTAT
codeFAOSTAT Commodity List

FOOD BALANCE SHEETS OF THE PHILIPPINES
36
Philippine Statistics Authority
Calories Proteins Fats
u/mg g/mg g/mg
1042 Meat Preparations Pigs 239 161 188
1043 Lard 900 0 1,000
1044 Pigskins, Fresh 320 198 266
1058 Chicken Meat 110 206 31
1059 Offals Liver of Chickens 125 180 39
1060 Fat Liver Prep(Foie Gras 462 114 438
1061 Meat Canned Chicken 221 118 139
1062 Hen Eggs 160 124 110
1063 Eggs Liquid Hen 158 121 112
1064 Eggs Dry Whole Yolks Hen 594 458 418
1065 Fat of Poultry 629 37 680
1066 Fat of Poultry Rendered 901 0 998
1069 Duck Meat 139 216 58
1073 Goose Meat 124 232 35
1074 Offals Liver Geese 133 164 43
1075 Offals Liver Ducks 136 187 46
1080 Turkey Meat 100 222 13
1081 Offals Liver Turkeys 137 200 40
1083 Pigeons and Other Birds 226 142 183
1089 Meat of Pigeon and Other Birds 185 171 124
1091 Eggs, excluding Hen 177 117 126
1097 Horsemeat 125 205 37
1098 Offals of Horse 105 184 25
1108 Meat of Asses 94 150 30
1111 Meat of Mules 94 150 30
1127 Meat of Camels 174 127 132
1128 Offals of Camel, Edible 105 184 25
1129 Fat of Camels 847 20 930
1130 Camel Milk 73 38 45
1141 Rabbit Meat 144 204 63
1151 Meat of Other Rodents 81 162 14
1158 Meat of Other Camelids 143 146 90
1159 Offals of Other Camelids 105 184 25
1160 Fat of Other Camelids 847 20 930
1163 Game Meat 104 180 30
1164 Meat, Dried, nes 250 554 15
1166 Meat nes 126 164 60
1167 Offals nes 105 184 25
1168 Animal Oils and Fats nes 902 0 1,000
1172 Meat Prepared nes 242 206 169
1176 Snails Not Sea Snails 94 94 8
1182 Honey 258 1 1
1225 Tallow 884 0 1,000
1232 Food Prepared nes 41 12 5
Philippines NUTRITIONAL VALUESFAOSTAT
codeFAOSTAT Commodity List

FOOD BALANCE SHEETS OF THE PHILIPPINES
37
Philippine Statistics Authority
Calories Proteins Fats
u/mg g/mg g/mg
1241 Liquid Margarine 445 5 500
1242 Margarine + Shortening 832 0 919
1243 Fat Preparations nes 720 6 810
1274 Oils Boiled etc 902 0 1,000
1275 Oils Hydrogenated 720 6 810
1501 Freshw ater Diadrom Fresh 107 181 38
1502 Freshw ater Frozen Whole 69 109 25
1503 Freshw ater Fillets 127 203 45
1504 Freshw ater Frozen Fillets 127 203 45
1505 Freshw ater Cured 199 313 72
1506 Freshw ater Canned 161 198 84
1507 Freshw ater Prep nes 262 269 150
1509 Freshw ater Body Oils 902 0 1,000
1510 Freshw ater Liver Oils 902 0 1,000
1514 Demersl Marine Fish Fresh 42 83 8
1515 Demersal Frozen Whole 42 83 8
1516 Demersal Fillets 90 179 16
1517 Demersal Frozen Fillets 90 179 16
1518 Demersal Cured 186 379 19
1519 Demersal Canned 173 250 63
1520 Demersal Prep nes 320 250 235
1522 Demersal Body Oils 902 0 1,000
1523 Demersal Liver Oils 902 0 1,000
1527 Pelagic Marine Fish Fresh 110 229 20
1528 Pelagic Frozen Whole 86 126 36
1529 Pelagic Fillets 141 202 60
1530 Pelagic Frozen Fillets 141 202 60
1531 Pelagic Cured 156 264 45
1532 Pelagic Canned 185 208 102
1533 Pelagic Prep nes 318 442 136
1535 Pelagic Body Oils 902 0 1,000
1536 Pelagic Liver Oils 902 0 1,000
1540 Marine Fish nes Fresh 136 198 64
1541 Marine nes Frozen Whole 64 103 22
1542 Marine nes Fillets 115 190 38
1543 Marine nes Frozen Fillets 115 190 38
1544 Marine nes Cured 169 321 32
1545 Marine nes Canned 179 229 82
1546 Marine nes Prep nes 132 175 50
1548 Marine nes Body Oils 902 0 1,000
1549 Marine nes Liver Oils 902 0 1,000
1553 Crustaceans Fresh 107 187 22
1554 Crustaceans Frozen 91 184 8
1555 Crustaceans Cured 149 254 13
Philippines NUTRITIONAL VALUESFAOSTAT
codeFAOSTAT Commodity List

FOOD BALANCE SHEETS OF THE PHILIPPINES
38
Philippine Statistics Authority
Calories Proteins Fats
u/mg g/mg g/mg
1556 Crustaceans Canned 98 198 11
1557 Crustaceans Prep nes 113 195 18
1562 Molluscs excl cephal fresh 113 98 46
1563 Molluscs Frozen 71 105 12
1564 Molluscs Cured 345 494 47
1565 Molluscs Canned 98 149 26
1570 Cephalopods Fresh 66 135 7
1571 Cephalopods Frozen 74 151 9
1572 Cephalopods Cured 341 616 62
1573 Cephalopods Prep nes 137 208 28
1574 Cephalopods Prep nes 130 208 15
1580 Aquatic Mammals Meat 136 210 50
1582 Aquatic Mammals Oils 902 0 1,000
1583 Aquatic Mammals Prep nes 156 206 75
1587 Aquatic Animals nes Frsh 30 40 2
1588 Aquatic Animals Cured 33 55 1
1590 Aquatic Animals Prep nes 168 115 38
1594 Aquatic Plants 54 28 6
1595 Aquatic Plants Dried 215 164 9
1596 Aquatic Plants Prep nes 312 13 12
Philippines NUTRITIONAL VALUESFAOSTAT
codeFAOSTAT Commodity List

FOOD BALANCE SHEETS OF THE PHILIPPINES
39
Philippine Statistics Authority
Annex 4. Recommended Energy Intake (REI) for Energy and Estimated Average
Requirements (EAR) for Proteins and Fats

FOOD BALANCE SHEETS OF THE PHILIPPINES
40
Philippine Statistics Authority
Annex 5. 2017 to 2019 Food Balance Sheets (FBS) of the Philippines
Population ('000): 104,169 Population ('000): 106,599 Population ('000): 107,288
PER PER PER
Y EA R Y EA R Y EA R
FOOD C alories Pro t eins Fat s FOOD C alories Pro t eins Fat s FOOD C alories Pro t eins Fat s
Products Kg. units grams grams Kg. units grams grams Kg. units grams grams
Grand total 2352 77 55 2504 80 61 2424 82 53
Vegetable prod. 1958 36 31 2097 39 37 2019 40 29
Animal prod. 394 41 23 407 42 24 405 42 24
ce cg ci ck ce cg ci ck ce cg ci ck
Cereals (excl. beer) 143 1336 28 4 150 1423 31 4 153 1477 33 5
Wheat 3 19 0 1 3 20 0 1 3 13 0 0
Maize 20 143 3 1 28 214 5 1 24 185 4 1
Rice (Milled Eq.) 120 1171 25 2 119 1186 26 3 125 1275 28 4
Barley 0 0 0 0 0 0 0 0 0 0 0 0
Rye 0 0 0 0 0 0 0 0 0 0 0 0
Oats 0 1 0 0 0 1 0 0 0 1 0 0
Millet 0 0 0 0 0 0 0 0 0 0 0 0
Sorghum 0 0 0 0 0 0 0 0 0 0 0 0
Cereals, other 0 2 0 0 0 2 0 0 0 2 0 0
Starchy roots 15 45 0 0 15 44 0 0 15 43 0 0
Cassava 7 20 0 0 7 19 0 0 7 18 0 0
Potatoes 2 4 0 0 2 5 0 0 2 5 0 0
Sweet Potatoes 5 16 0 0 5 16 0 0 5 15 0 0
Yams 0 0 0 0 0 0 0 0 0 0 0 0
Roots, other 1 5 0 0 1 4 0 0 1 4 0 0
Sugar crops 3 4 0 0 2 3 0 0 2 3 0 0
Sugar cane 3 4 0 0 2 3 0 0 2 3 0 0
Sugar beet - - - - - - - - - - - -
Sugar & Sweeteners 7 46 0 0 7 59 0 0 6 47 0 0
Sugar non-centrifugal 0 0 0 0 0 0 0 0 0 0 0 0
Sugar (raw equivalent) 1 10 0 0 5 51 0 0 4 37 0 0
Sweeteners, other 6 36 0 0 2 8 0 0 3 10 0 0
Honey 0 0 0 0 0 0 0 0 0 0 0 0
Pulses 1 8 1 0 1 8 1 0 1 8 1 0
Beans 1 3 0 0 1 3 0 0 1 2 0 0
Peas 0 5 0 0 1 5 0 0 1 5 0 0
Pulses, other 0 1 0 0 0 1 0 0 0 0 0 0
Treenuts 0 3 0 0 0 3 0 0 0 3 0 0
Oilcrops 57 189 3 17 57 191 3 17 56 186 3 17
Soybeans 2 8 1 0 2 8 1 0 2 7 1 0
Groundnuts 1 22 1 2 1 23 1 2 1 22 1 2
Sunflowerseed 0 0 0 0 0 0 0 0 0 0 0 0
Rape & Mustard seed 0 0 0 0 0 0 0 0 0 0 0 0
Cottonseed 0 0 0 0 0 0 0 0 0 0 0 0
Coconuts (incl. copra) 53 159 2 15 54 160 2 15 53 156 2 14
Sesame seed 0 0 0 0 0 0 0 0 0 0 0 0
Palm 0 0 0 0 0 0 0 0 0 0 0 0
Olive 0 0 0 0 0 0 0 0 0 0 0 0
Oilcrops, other 0 0 0 0 0 0 0 0 0 0 0 0
Vegetable oils 3 71 0 8 4 109 0 12 2 41 0 5
Soybean oil 0 8 0 1 0 7 0 1 0 7 0 1
Groundnut oil 0 0 0 0 0 0 0 0 0 0 0 0
Sunflower seed oil - - - - - - - - - - - -
Rape and mustard oil 0 1 0 0 0 0 0 0 0 1 0 0
Cottonseed oil 0 0 0 0 0 0 0 0 0 0 0 0
Palm kernel oil 1 21 0 2 1 21 0 2 0 9 0 1
Palm oil 2 39 0 4 3 78 0 9 1 23 0 3
Copra oil 0 0 0 0 0 0 0 0 0 0 0 0
Sesame seed oil - - - - - - - - - - - -
Olive oil 0 1 0 0 0 1 0 0 0 1 0 0
Rice bran oil - - - - - - - - - - - -
Maize germ oil 0 2 0 0 0 2 0 0 0 2 0 0
Oilcrops oil, other 0 0 0 0 0 0 0 0 0 0 0 0
Vegetables 26 30 1 0 26 30 1 0 26 30 1 0
Tomatoes 3 2 0 0 3 2 0 0 3 3 0 0
Onions 2 3 0 0 2 4 0 0 2 3 0 0
Vegetables, other 21 24 1 0 21 24 1 0 21 24 1 0
PER D A Y
2017 20192018
PER CAPITA SUPPLY
PER D A Y PER D A Y
PER CAPITA SUPPLY PER CAPITA SUPPLY

FOOD BALANCE SHEETS OF THE PHILIPPINES
41
Philippine Statistics Authority
Population ('000): 104,169 Population ('000): 106,599 Population ('000): 107,288
PER PER PER
Y EA R Y EA R Y EA R
FOOD C alories Pro t eins Fat s FOOD C alories Pro t eins Fat s FOOD C alories Pro t eins Fat s
Products Kg. units grams grams Kg. units grams grams Kg. units grams grams
Fruits 104 168 2 1 85 163 2 1 69 118 1 1
Oranges & mandarins 1 1 0 0 1 1 0 0 1 1 0 0
Lemons & limes 0 0 0 0 0 0 0 0 0 0 0 0
Grapefruit 0 0 0 0 0 0 0 0 0 0 0 0
Citrus, other 1 1 0 0 1 1 0 0 1 1 0 0
Bananas 33 103 1 1 32 97 1 1 18 55 1 0
Plantains - - - - 0 0 0 0 0 0 0 0
Apples (excl. cider) 2 3 0 0 2 2 0 0 2 2 0 0
Pineapples 18 19 0 0 20 21 0 0 18 18 0 0
Dates 0 0 0 0 0 0 0 0 0 0 0 0
Grapes (excl. w ine) 1 1 0 0 1 1 0 0 1 2 0 0
Fruit, other 47 40 0 0 28 38 0 0 28 38 0 0
Stimulants 6 20 0 1 7 24 0 1 7 24 0 1
Coffee 5 7 0 0 6 8 0 0 6 8 0 0
Cocoa Beans 1 13 0 1 1 16 0 1 1 16 0 1
Tea 0 0 0 0 0 0 0 0 0 0 0 0
Spices 0 1 0 0 0 2 0 0 0 2 0 0
Pepper 0 0 0 0 0 0 0 0 0 0 0 0
Pimento 0 0 0 0 0 0 0 0 0 0 0 0
Cloves 0 0 0 0 0 0 0 0 0 0 0 0
Spices, other 0 1 0 0 0 1 0 0 0 1 0 0
Alcoholic beverages 16 36 0 0 19 37 0 0 18 36 0 0
Wine 0 0 0 0 0 0 0 0 0 0 0 0
Beer 12 5 0 0 15 6 0 0 14 6 0 0
Beverages, fermented 0 0 0 0 0 0 0 0 0 0 0 0
Beverages, alcoholic 4 31 0 0 4 31 0 0 4 30 0 0
Meat 33 174 16 12 36 185 18 12 36 182 18 12
Bovine meat 1 5 1 0 1 5 1 0 1 5 1 0
Mutton & goat meat 0 1 0 0 0 1 0 0 0 1 0 0
Pig meat 16 123 7 11 17 126 7 11 16 121 7 10
Poultry meat 14 41 8 1 16 49 9 1 17 51 10 1
Other meat 1 4 1 0 2 4 1 0 1 4 1 0
Offals 7 29 3 2 6 24 2 2 5 24 2 2
Animal fats 2 46 0 5 2 48 0 5 2 47 0 5
Butter, ghee 0 7 0 1 0 7 0 1 0 8 0 1
Cream 0 0 0 0 0 0 0 0 0 0 0 0
Fats, animal, raw 2 38 0 4 2 41 0 4 2 39 0 4
Fish, body oil 0 0 0 0 0 0 0 0 0 0 0 0
Fish, liver oil - - - - - - - - - - - -
Milk (excluding butter) 32 28 2 1 37 34 3 1 39 35 3 1
Eggs 5 21 2 1 5 23 2 2 5 24 2 2
Fish & sea food 35 95 17 3 34 92 17 3 34 93 17 3
Freshwater fish 8 22 4 1 8 22 4 1 8 22 4 1
Demersal fish 2 2 0 0 1 2 0 0 1 2 0 0
Pelagic fish 20 56 11 1 19 54 11 1 19 55 11 1
Marine fish, other 2 5 1 0 2 5 1 0 2 5 1 0
Crustaceans 2 4 1 0 1 3 1 0 1 3 1 0
Molluscs other 2 4 0 0 2 4 0 0 2 4 0 0
Cephalopods 1 2 0 0 1 2 0 0 1 2 0 0
Aquatic products, other - - - - - - - - - - - -
Aquatic mammals meat - - - - - - - - - - - -
Aquatic animals, other - - - - - - - - - - - -
Aquatic plants 0 0 0 0 0 0 0 0 0 0 0 0
Miscellaneous 0 0 0 0 0 1 0 0 0 0 0 0
Infant food 0 0 0 0 0 1 0 0 0 0 0 0
Miscellaneous, other 0 0 0 0 0 0 0 0 0 0 0 0
FOOD GROUPS IDR TDR SDR SSR IDR TDR SDR SSR IDR TDR SDR SSR
% % % % % % % % % % % %
Grand total 22.6 -13.4 0.2 86.8 27.7 -20.0 0.0 80.0 29.0 -19.2 0.5 81.3
Vegetable products 22.9 -13.3 0.2 86.9 28.1 -20.1 0.0 79.9 29.6 -19.2 0.5 81.3
Animal products 19.8 -14.1 0.0 85.9 22.8 -19.4 0.0 80.6 22.3 -19.6 0.0 80.4
Trade
D epend .
R at io
PER D A Y
2017
Import
D ependency
R at io
Trade
D epend .
R at io
St ock
D epend . R at io
Self
suf f iciency
R at io
20192018
St ock
D epend .
R at io
Self
suf f iciency
R at io
Import
D ependenc
y R at io
Trade
D epend .
R at io
St ock D epend .
R at io
Self
suf f iciency
R at io
PER CAPITA SUPPLY
PER D A Y PER D A Y
PER CAPITA SUPPLY PER CAPITA SUPPLY
Import
D ependency
R at io

FOOD BALANCE SHEETS OF THE PHILIPPINES
42
Philippine Statistics Authority
FOOD BALANCE SHEETS (FBS) OF THE PHILIPPINES
PHILIPPINE STATISTICS AUTHORITY
DENNIS S. MAPA, Ph.D.
Undersecretary
National Statistician and Civil Registrar General
MACROECONOMIC ACCOUNTS SERVICE
VIVIAN R. ILARINA
Assistant National Statistician
AGRICULTURAL ACCOUNTS DIVISION
Maria Carol G. Duran
Chief Statistical Specialist
Manuela S. Nalugon
Supervising Statistical Specialist
Reynante A. Santos
Senior Statistical Specialist
Joynabel S. Paraguison
Statistical Specialist II
Joseph C. Evangelista
Statistical Specialist II
John Archie S. Pontigon
Statistical Analyst

FOOD BALANCE SHEETS OF THE PHILIPPINES
43
Philippine Statistics Authority