Minnesota-Wisconsin Dairy Policy Conference- 2011 Rochester, MN Steve Etka Midwest Dairy Coalition

S t a t e o f W i s c o n s i n
Letter Report
Food and Dairy Safety Program FundingJanuary 2008
Legis lat ive Audit Bureau22 E. Mifflin St., Ste. 500, Madison, Wisconsin 53703-4225 (608) 266-2818
Fax: (608) 267-0410 Web site: www.legis.wisconsin.gov/lab


January 29, 2008 Senator Jim Sullivan and Representative Suzanne Jeskewitz, Co-Chairpersons Joint Legislative Audit Committee State Capitol Madison, Wisconsin 53702 Dear Senator Sullivan and Representative Jeskewitz: We have completed a review of food and dairy safety program funding, which is administered by the Department of Agriculture, Trade and Consumer Protection (DATCP). The program’s expenditures totaled $8.4 million in fiscal year (FY) 2006-07 and supported 97.6 full-time equivalent positions. In FY 2006-07, 54.9 percent of the program was funded with fees charged to regulated entities, 41.6 percent with general purpose revenue, and 3.5 percent with federal revenue. During our review period, fee revenue increased 20.8 percent, but fee-funded expenditures increased by 43.2 percent. As a result, the program’s appropriation account balance has decreased each year since FY 2002-03, and in FY 2006-07 ended with a negative balance of $51,800. To address the program’s current funding shortfall, DATCP has proposed increasing food and dairy fees by approximately 30 percent beginning July 1, 2008. This proposal is currently under review by the Legislature. We compared Wisconsin’s fee structure with those of six other states and found substantial variation in funding levels, staffing levels, and inspector workloads. While Wisconsin is near the average of the states we reviewed in terms of funding and staffing, it has the highest inspector workload. In FY 2006-07, DATCP had contracts with 34 local health departments to conduct food safety inspections at retail food establishments such as grocery stores and delicatessens within their boundaries. We compared DATCP’s retail food licensing fees with fees charged by 26 local programs and found that local fees were frequently higher than those charged by DATCP. Our comprehensive evaluation of the effectiveness of DATCP’s food and dairy regulatory activities will be released later in the year. We appreciate the courtesy and cooperation extended to us by DATCP in conducting this review. Sincerely, Janice Mueller State Auditor JM/PS/bm Enclosure


FOOD AND DAIRY SAFETY PROGRAM FUNDING To help ensure the safety of the human food supply, the Department of Agriculture, Trade and Consumer Protection (DATCP) is responsible for regulating individuals and facilities involved in the production of food and dairy products. DATCP’s responsibilities include regulating dairy farms, dairy plants, food processors (such as canning factories, breweries, and wineries), food warehouses, retail food establishments such as grocery stores and delicatessens, and dairy professionals such as cheese and butter makers. However, its responsibilities do not include restaurants, which are regulated by the Department of Health and Family Services (DHFS), primarily through contracts with local health departments. DATCP’s main regulatory and oversight activities involve:
• licensing individuals and facilities involved in the production of food and dairy products;
• regularly inspecting all food and dairy establishments;
• contracting with local governments that choose to license and inspect retail food establishments within their jurisdictions;
• collecting and analyzing samples of food and testing food preparation surface areas for the presence of bacteria and other pathogens that cause foodborne illnesses;
• testing samples of dairy products for the presence of antibiotic drug residues and elevated levels of harmful bacteria; and
• responding to and identifying the causes of food emergencies, such as the contaminated spinach outbreak in 2006, by working with local public health departments, other state and federal agencies, and the responsible food or dairy establishments.
In fiscal year (FY) 2006-07, DATCP issued 29,384 food and dairy licenses. Approximately one-half were for dairy farms, as shown in Table 1. Approximately 84.2 percent of dairy farms have Grade A permits to produce milk that can be sold as fluid milk for human consumption. The remaining farms are classified as Grade B and produce milk to be used in manufactured products such as cheese.

Table 1
Food and Dairy Licenses Issued by DATCP
FY 2006-07
License Type Number Issued Percentage
of Total Food Retail Food 4,625 15.7% Food Processors 1,270 4.3 Food Warehouses 887 3.0 Subtotal Food 6,782 23.0 Dairy Dairy Farms1 14,272 48.6 Dairy Plants 368 1.3 Other Dairy 7,962 27.1 Subtotal Dairy 22,602 77.0 Total 29,384 100.0%
1 Represents the number of active dairy farm licenses, rather
than the number of licenses issued in FY 2006-07, because dairy farm licenses do not expire.
In conducting our review, we analyzed program revenues and expenditures and compared DATCP’s food and dairy fees with those of other states and several local governments. We also interviewed DATCP staff, representatives of the food and dairy industries, and regulatory staff in six other states and eight local governments in Wisconsin.
Staffing and Expenditures The food and dairy safety program had 97.6 full-time equivalent (FTE) staff positions in FY 2006-07. As shown in Table 2, approximately one-half are filled by inspectors who inspect food and dairy establishments, collect samples of food and dairy products as part of DATCP’s food sampling program, and respond when needed to food emergencies. Approximately one-fifth of the staff provide support and administrative services. Staffing levels increased slightly from 94.5 FTE positions in FY 2002-03 to 97.6 FTE positions in FY 2006-07, primarily because staff responsible for evaluating and certifying Grade A dairy farms and dairy plants based on national standards were transferred from DHFS to DATCP in FY 2003-04.
-2-

Table 2
Food and Dairy Safety Staffing
FY 2006-07
Classification
FTE Positions Percentage
of Total Program Staff Inspectors 48.1 49.3% Field Supervisors 6.0 6.2 Other1 25.0 25.6 Subtotal 79.1 81.1 Support Staff 13.5 13.8 Administrative Staff 5.0 5.1 Total 97.6 100.0%
1 Includes food and dairy specialists, food scientists, a regulatory
compliance investigator, a laboratory evaluation officer, milk rating officers, and multiple product graders.
As shown in Table 3, FY 2006-07 program expenditures totaled $8.4 million. Program revenue from food and dairy fees is the largest funding source and increased from 50.8 percent of total program funding in FY 2002-03 to 54.9 percent in FY 2006-07. In turn, general purpose revenue (GPR) decreased from 44.4 percent of the total in FY 2002-03 to 41.6 percent in FY 2006-07. During the period shown, fees were increased once, in 2006. Federal funds reimburse the activities DATCP conducts under four federal contracts, which include inspecting federally regulated food processing plants; inspecting egg producers, packers, and hatcheries; and collecting food samples that are analyzed as part of an ongoing national survey on the population’s exposure to pesticides, pathogens, and microorganisms in fruits and vegetables.
-3-
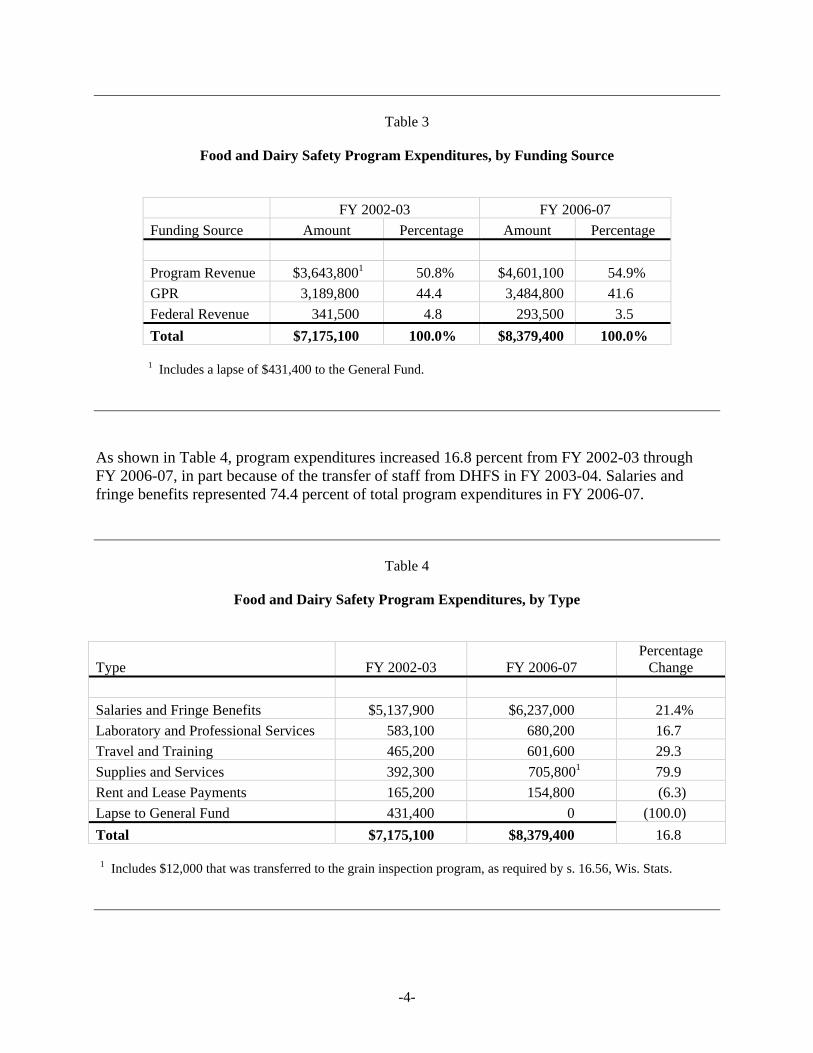
Table 3
Food and Dairy Safety Program Expenditures, by Funding Source
FY 2002-03 FY 2006-07 Funding Source Amount Percentage Amount Percentage Program Revenue $3,643,8001 50.8% $4,601,100 54.9% GPR 3,189,800 44.4 3,484,800 41.6 Federal Revenue 341,500 4.8 293,500 3.5 Total $7,175,100 100.0% $8,379,400 100.0%
1 Includes a lapse of $431,400 to the General Fund.
As shown in Table 4, program expenditures increased 16.8 percent from FY 2002-03 through FY 2006-07, in part because of the transfer of staff from DHFS in FY 2003-04. Salaries and fringe benefits represented 74.4 percent of total program expenditures in FY 2006-07.
Table 4
Food and Dairy Safety Program Expenditures, by Type
Type FY 2002-03 FY 2006-07 Percentage
Change Salaries and Fringe Benefits $5,137,900 $6,237,000 21.4% Laboratory and Professional Services 583,100 680,200 16.7 Travel and Training 465,200 601,600 29.3 Supplies and Services 392,300 705,8001 79.9 Rent and Lease Payments 165,200 154,800 (6.3) Lapse to General Fund 431,400 0 (100.0) Total $7,175,100 $8,379,400 16.8 1 Includes $12,000 that was transferred to the grain inspection program, as required by s. 16.56, Wis. Stats.
-4-

Supplies and services costs increased by the largest percentage over the period we reviewed, largely because of increased information technology costs, including costs associated with computer maintenance and support charged to the program by DATCP. Laboratory and professional services, the third-largest expenditure category in FY 2006-07, include mainly laboratory testing as part of the program’s sampling activities. Travel and training expenditures are mostly for in-state travel by inspectors and supervisors as part of their day-to-day regulatory responsibilities. The required lapse of $431,400 in unencumbered fee revenue to the General Fund was made to help address the State’s budget deficit in FY 2002-03.
Food and Dairy Fees DATCP has the authority to license and charge fees for the operation of food and dairy facilities and dairy professionals. These fees can be organized into four categories:
• facility fees, which include license fees for dairy farms, dairy plants, retail food establishments, food processing facilities and food warehouses, and reinspection fees for non-routine inspections at these facilities;
• procurement fees, which are based on the amount of milk received by dairy plants each month;
• professional licenses, which include license fees for butter and cheese makers and graders, milk haulers, and milk distributors; and
• Service fees, which are charged when DATCP provides certain requested services, such as grading cheese and butter or testing milk pasteurizers.
As shown in Table 5, DATCP received $4.5 million in fee revenue in FY 2006-07. That is a 20.8 percent increase since FY 2002-03. However, program expenditures increased by 43.2 percent over the same period, and an additional $1.2 million in fee revenue was lapsed to the General Fund from FY 2002-03 through FY 2004-05 to help address the State’s budget deficits. The food and dairy fee appropriation account balance has decreased every year since FY 2002-03, and the ending balance in FY 2006-07 was negative, at -$51,800.
-5-
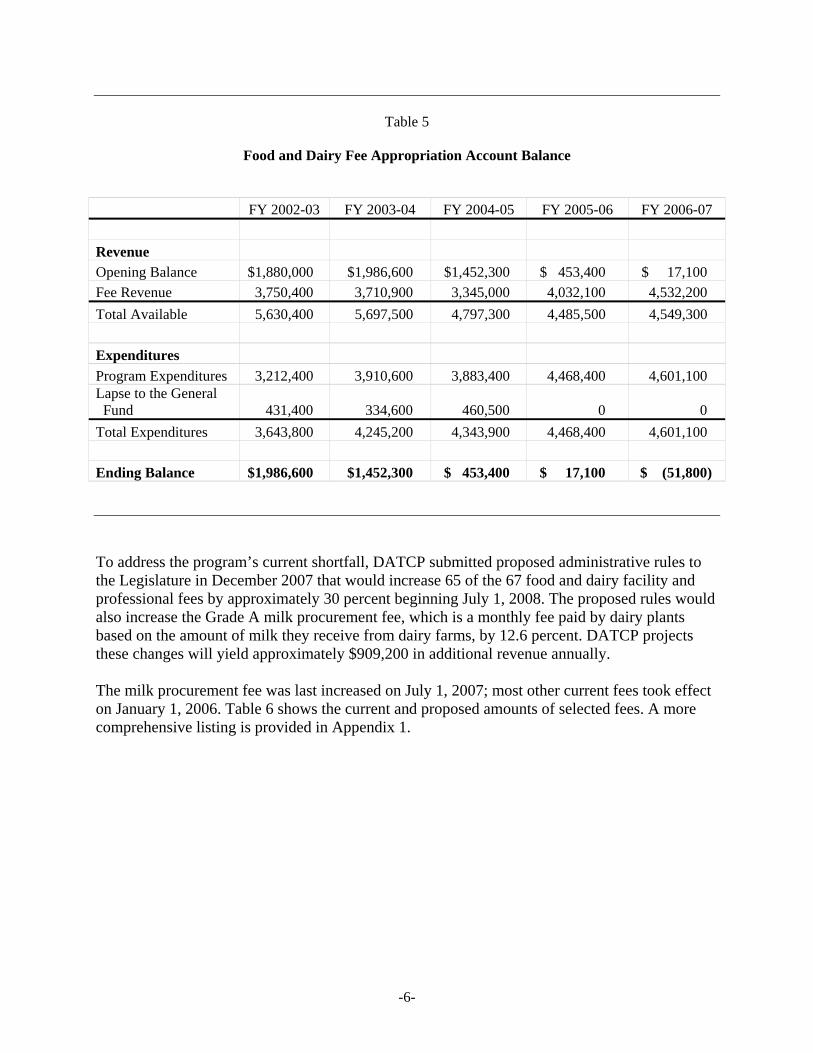
Table 5
Food and Dairy Fee Appropriation Account Balance
FY 2002-03 FY 2003-04 FY 2004-05 FY 2005-06 FY 2006-07 Revenue Opening Balance $1,880,000 $1,986,600 $1,452,300 $ 453,400 $ 17,100 Fee Revenue 3,750,400 3,710,900 3,345,000 4,032,100 4,532,200 Total Available 5,630,400 5,697,500 4,797,300 4,485,500 4,549,300 Expenditures Program Expenditures 3,212,400 3,910,600 3,883,400 4,468,400 4,601,100 Lapse to the General Fund 431,400 334,600 460,500 0 0 Total Expenditures 3,643,800 4,245,200 4,343,900 4,468,400 4,601,100 Ending Balance $1,986,600 $1,452,300 $ 453,400 $ 17,100 $ (51,800) To address the program’s current shortfall, DATCP submitted proposed administrative rules to the Legislature in December 2007 that would increase 65 of the 67 food and dairy facility and professional fees by approximately 30 percent beginning July 1, 2008. The proposed rules would also increase the Grade A milk procurement fee, which is a monthly fee paid by dairy plants based on the amount of milk they receive from dairy farms, by 12.6 percent. DATCP projects these changes will yield approximately $909,200 in additional revenue annually. The milk procurement fee was last increased on July 1, 2007; most other current fees took effect on January 1, 2006. Table 6 shows the current and proposed amounts of selected fees. A more comprehensive listing is provided in Appendix 1.
-6-

Table 6
Selected Fee Amounts
Fee Category Current Fee Proposed Fee Average
Percentage Change Dairy Farms $24 $31 29.2% Grade A Dairy Plants1 $699 or $879 $909 or $1,143 30.0 Grade B Dairy Plants1 $96 or $421 $125 or $548 30.2 Retail Food1 $37 to $562 $48 to $731 29.9 Food Processing Plant1 $78 to $685 $101 to $890 29.8 Food Warehouses1 $65 to $261 $85 to $339 30.0 Grade A Milk Procurement Fee $0.0096 per 100 lbs $0.01081 per 100 lbs 12.6
1 Fees vary based on factors such as facility size and the potential food safety risk.
The fees DATCP charges are based on the type of facility, the associated level of risk of a foodborne illness that each type of facility potentially poses, and in some cases on sales volume. For example, higher license fees are paid by Grade A dairy plants, which have more stringent regulatory requirements than Grade B plants. In addition, higher fees are paid by establishments that process or sell foods that are at risk of causing a foodborne illness, which include foods that need to be heated or cooled in order to be safe to consume, such as delicatessen meats and cheeses. DATCP refers to establishments processing or selling these types of foods as “potentially hazardous.” DATCP does not charge a fee for a routine inspection but can charge a fee for a reinspection, which is a nonroutine inspection resulting from the number or type of problems it identifies during a routine inspection. Current reinspection fees range from $24 to $431 and would be increased to amounts from $31 to $560 under DATCP’s proposed rules. We found that the amount of revenue generated by food and dairy fees is somewhat proportional to the amount of time DATCP staff spend on dairy and food activities. Table 7 identifies the number of hours DATCP staff reported spending on food and dairy regulatory activities and the corresponding amount of revenue generated by those activities.
-7-

Table 7
Food and Dairy Regulatory Activities and Revenue1
FY 2006-07
Activity
Total Number of
Work Hours
Percentage of Total
Work Hours Revenue
Percentage of Total Revenue
Dairy 106,295 61.3% $2,825,500 71.0% Food 66,977 38.7 1,154,700 29.0 Total 173,272 100.0% $3,980,200 100.0%
1 Excludes $552,000 in revenue and 18,173 work hours related to nonregulatory activities.
Comparison with Other States To determine how Wisconsin’s program compares with those of other states, we reviewed funding levels, staffing levels, the number and type of facilities regulated, and the fees charged by similar programs in four surrounding midwestern states—Illinois, Iowa, Michigan, and Minnesota—as well as two large dairy-producing states—California and New York. As shown in Table 8, food and dairy safety program budgets ranged from $2.2 million in Iowa to $15.7 million in California. The average was $8.7 million, which was the same as Wisconsin’s FY 2006-07 budget.
-8-

Table 8
Food and Dairy Safety Program Budgets1
(in millions)
Food Dairy Total California $ 9.2 $6.5 $15.7 New York 10.8 2.3 13.1 Michigan 7.6 2.8 10.4 Average 8.7 Wisconsin2 - - 8.7 Minnesota 4.0 3.1 7.1 Illinois2 - - 3.9 Iowa 1.2 1.0 2.2
1 Represents the fiscal year for which data could be readily provided by
each state, which was either FY 2005-06 or FY 2006-07. For Wisconsin, it represents DATCP’s food and dairy safety program budget for FY 2006-07.
2 Both Wisconsin and Illinois budget their food and dairy regulatory efforts as a single program.
Illinois and Wisconsin each administer food and dairy safety as a single program with a unified budget. In the other five states, food and dairy safety are budgeted separately. Moreover, the food and dairy safety programs in California and Iowa are administered by separate state agencies. The extent to which program operations are funded through fee revenue varies substantially. As shown in Table 9, the extent to which fees cover the cost of food safety programs ranges from an estimated 13 percent in Minnesota to 89 percent in California. For dairy safety programs, the amount ranges from an estimated 3 percent in Michigan to 85 percent in California. In general, costs not funded by fees are covered through a state’s general fund.
-9-

-10-
Table 9
Estimated Funding of State Food and Dairy Safety Program Budgets1
Food Safety Dairy Safety
Percentage Funded by
Fees
Percentage Funded by
General Fund Revenue
Percentage Funded by
Fees
Percentage Funded by
General Fund Revenue
California 89% 11% 85% 15% Illinois2 42 58 42 58 Iowa N.A.3 N.A. 3 80 20 Michigan 37 63 3 97 Minnesota 13 87 68 32 New York 37 63 N.A.3 N.A.3 Wisconsin2 55 42 55 42
1 Represents the fiscal year for which data could be readily provided by each state, which was
either FY 2005-06 or FY 2006-07. For Wisconsin, it represents FY 2006-07. 2 Both Illinois and Wisconsin budget their food and dairy regulatory efforts in as a single program.
For Wisconsin, the percentage of funding does not add to 100 percent because a small amount of federal funding is used to support its program.
3 Because fees are deposited into these states’ general funds, the extent to which fees fund their programs cannot be determined.
The amounts that states budget for their food and dairy programs vary largely as a result of the number of inspectors, whose salaries and fringe benefits make up most program expenditures. As shown in Table 10, the number of food and dairy inspectors ranges from an estimated 20.0 FTE staff in Illinois to 135.0 FTE staff in New York. Three of the six states we reviewed have more staff than Wisconsin, and three have fewer.

Table 10
Estimated FTE Food and Dairy Safety Inspectors1
August 2007
Food
Inspectors Dairy
Inspectors Total New York 100.0 35.02 135.0 California 45.0 46.0 91.0 Average 58.3 Michigan 45.0 8.0 53.0 Wisconsin3 - - 48.1 Minnesota 23.0 15.0 38.0 Iowa 14.0 9.0 23.0 Illinois3 - - 20.0
1 Does not include supervisory staff. 2 New York also uses 120 certified milk inspectors, who are employed by
milk cooperatives and dairy plants, to conduct routine farm inspections on behalf of the state.
3 Inspectors in Illinois and Wisconsin conduct both food and dairy inspections. The number of staff each state employs depends on factors such as the number and type of regulated facilities that are required to be licensed and inspected; a state’s specific regulatory requirements, such as inspection frequency; and the role of local units of government in the regulatory process. The number of food and dairy facilities regulated by the states we reviewed ranges from an estimated 4,000 in Illinois to 37,800 in New York. As shown in Table 11, the estimated number of facilities per inspector also ranges substantially, from 88 facilities per inspector in California to 445 facilities per inspector in Wisconsin.
-11-

Table 11
Estimated Number of Food and Dairy Facilities per Inspector1
Food
Facilities Dairy
Facilities2 Total
Facilities Facilities per
Inspector Wisconsin 6,800 14,600 21,400 445 Iowa 6,700 2,300 9,000 391 Michigan 17,300 2,600 19,900 375 Minnesota 7,600 5,000 12,600 332 Average 302 New York 31,600 6,200 37,800 280 Illinois 2,800 1,200 4,000 200 California 5,500 2,500 8,000 88
1 Represents data from the fiscal year for which they could be readily provided by each state,
which was either FY 2005-06 or FY 2006-07. For Wisconsin, FY 2006-07 data were used. 2 Represents the estimated number of dairy farms and dairy plants.
While there is a strong relationship between the numbers of food facilities and food inspectors in the five states with staff specifically dedicated to inspecting food facilities, there is not a meaningful relationship between the number of dairy facilities and the number of dairy inspectors. This divergence may be based on factors such as farm size, travel distances needed to conduct inspections, and regulatory requirements that differ based on whether dairy farms and dairy plants produce Grade A or Grade B milk. For example, while California produces more milk than any other state, it has far fewer farms than Wisconsin. In 2006, California had approximately 2,000 dairy farms with an average herd size of 908 cows, compared to Wisconsin’s 14,300 dairy farms with an average herd size of 85 cows. California also has a higher percentage of Grade A dairy plants. In 2006, approximately 15.0 percent of California’s dairy plants produced Grade A milk, compared to 7.3 percent in Wisconsin. As noted, the regulatory requirements and inspection frequency is substantially greater for Grade A plants than for Grade B plants. As shown in Table 12, the fees states charge to license food and dairy facilities vary substantially. This is not surprising because, as noted, states rely on fees to widely varying degrees for support of their programs. For example, California, which funds 89 percent of its food safety program through fees, charges some of the highest fees to license retail food facilities, food processing facilities, and food warehouses. In contrast, Michigan, which funds only 3 percent of its dairy safety program with fees, charges some of the lowest fees to license dairy farms and dairy plants. Overall, Illinois charges the lowest fees for the selected licenses shown, including none to dairy
-12-

farms, food processing facilities, and food warehouses. The majority of Illinois’ fee revenue is generated through the issuance of Food Service Sanitation Manager Certifications, which are required for food service managers working in restaurants and other establishments, such as delicatessens, schools, nursing homes, and convenience stores. The $35 fee is paid every five years by approximately 300,000 individuals and generates an estimated $2.1 million annually.
Table 12
Comparison of Selected Food and Dairy Fees
State Dairy Farm1 Dairy Plant Retail Food
Establishment
Food Processing
Facility Food
Warehouse California
$135 plus $0.00025 per gallon
$100 to $300
Established by local health
departments
$348 to $2,140
$348 to $695
Illinois2
No fee
$100
Established by local health
departments
No fee
No fee Iowa
No fee for routine inspection
Up to $1,0003
$30 to $304
$68 to $338
$68 to $338
Michigan $5 or $15 $175 $70 or $175 $70 or $175 $70 Minnesota
No more than: $25 (Grade B); $50 (Grade A)
$525 to $550 (Grade A);
No more than $140 per pasteurizer
(Grade B)
$15 to $2,001
$150 to $2,571
$57 to $1,502
New York
No fee for routine inspection
No fee for routine inspection
$75 or $1003
$1003
$75 to $1503
Wisconsin $24 $ 96 to $879 $37 to $562 $78 to $685 $65 to $261 1 Although these fees are assessed on farms, they may be paid by dairy plants, which is the case in Wisconsin. 2 Most of the fee revenue in Illinois is generated by a fee on certain food service managers. 3 This is a two-year license; the amounts shown represent the annualized fee amount.
As noted, in Wisconsin, license fee amounts for the food and dairy industry can be changed through an administrative rule process. Iowa also adjusts its dairy fees through an administrative rule process. Iowa’s food fees and the other five states’ food and dairy fees must usually be changed through direct legislative action to modify state statutes. However, California may adjust its food license fees by up to 4.0 percent without changing state statutes if the balance of its food safety fund falls below an established level.
-13-

Comparison with Local Fees Statutes permit DATCP to enter into agreements with local health departments for the regulation of retail food establishments that it would otherwise license and inspect. As of June 2007, DATCP had established contracts with 34 local health departments to conduct these activities. We reviewed program funding levels, program staffing levels, and the number of licenses issued by 8 local health departments, as well as the fees charged by all 34 local health departments. Appendix 2 lists the local programs, which include 19 counties, 12 cities, and 3 consortiums. While 54.9 percent of DATCP’s food safety budget was supported by fee revenue in FY 2006-07, local health departments rely more heavily on fees. Of the eight local health departments we contacted:
• five support their retail food safety programs solely with fee revenue;
• two support an estimated 80 percent of program costs with fee revenue; and
• one supports an estimated 60 percent of program costs with fee revenue. As shown in Table 13, the number of retail food licenses per inspector ranged widely, from 39 retail food licenses per inspector for the South Milwaukee/St. Francis Consortium to 305 retail food licenses per inspector for Brown County. Not surprisingly, the three local programs we reviewed with the most licenses—the City of Milwaukee, the City of Madison, and Brown County—also had the most licenses per inspector. As noted, DATCP inspectors are responsible for an average of 445 facilities per inspector.
-14-

Table 13
Estimated Number of Retail Food Licenses per FTE Inspector
Local Health Department Retail Food
Licenses Number of FTE
Retail Food Inspectors1 Licenses per
Inspector Brown County 229 0.75 305 City of Madison 403 1.80 224 City of Milwaukee 1,306 6.00 218 La Crosse County 108 0.50 216 Average 180 Douglas County 78 0.50 156 City of De Pere 29 0.20 145 Marathon County 214 1.60 134 South Milwaukee/St. Francis Consortium 49 1.25 39
1 Represents the number of FTE inspectors who perform retail food regulatory activities. Does not include
the FTE staff responsible for performing other types of activities associated with regulating facilities such as restaurants, hotels, and campgrounds, for which local health departments are also responsible under contract with DHFS.
State statutes require local governments to establish a licensing fee structure that covers the “reasonable costs” incurred in administering their programs. In addition, each local program is required to pay DATCP 10.0 percent of the license fee revenue DATCP would have otherwise received if it were responsible for licensing the retail establishments. Programs administered by three local governments—Ashland County, Oneida County, and Trempealeau County—have adopted DATCP’s licensing fee structure in its entirety, including the same categories and fee amounts charged by DATCP. Of the remaining 31 programs, 16 have adopted the same basic fee categories but have set different fee amounts; 7 have added additional fee categories and have also established different fee amounts; and the remaining 8 use different fee structures, including 3 that base their license fees entirely on sales volume. As a result of these differences, the license fee paid by retail food establishments can vary significantly. Overall, retail food license fees range from $30 in Douglas County for retail food establishments that do not process food to $1,440 for retail food establishments with annual sales of $2.0 million or more in the City of Milwaukee. The amount each retail food establishment pays depends on where in Wisconsin it is located. For example, a grocery store that has annual sales of at least $2.0 million and processes potentially hazardous food would pay between $525 and $1,440 in licensing fees annually, based on its location. Table 14 shows selected
-15-

license fees for the 26 local programs with fee structures that could be directly compared, at least in part, to DATCP’s fees. We found that 108 of the 130 local fees shown in the table, or 83.1 percent, were higher than those charged by DATCP. Moreover, every fee charged by 19 of the local health departments was greater than the fees charged by DATCP for the same license types. To a certain extent, this is expected for those programs that rely heavily on fee revenue to support their regulatory activities, such as the eight local health departments we contacted. In addition, each local program is responsible for paying a 10.0 percent fee to DATCP, as noted. During discussions on DATCP’s proposed fee increase, representatives of the food industry have argued that the fee increase would be too high. However, if the fee increase were approved by the Legislature, 60.0 percent of the fees charged by local health departments shown in Table 14 would remain higher than the fees charged by DATCP for similar licenses.
-16-

-17-
Table 14
Selected Local Retail Food License Schedules Similar to DATCP
As of June 2007
More than $1.0 Million in
Sales and Processes Potentially
Hazardous Food
$25,000 to $1.0 Million in
Sales and Processes Potentially
Hazardous Food
More than $25,000 in Sales
and Does Not Process
Potentially Hazardous Food
Less than $25,000 in Sales
and Processes Food
Does Not Process Food
DATCP $ 562 $ 218 $ 156 $ 50 $ 37
Appleton (City) 915 407 or 484 99 60 91
Ashland County 562 218 156 50 37
Brown County 1,028 441 to 676 381 346 112
De Pere (City) 875 475 325 150 96
Douglas County 550 220 150 40 30
Dunn County 590 230 165 80 60
Fond du Lac County 785 325 235 105 90
Kenosha County 670 362 294 162 129
La Crosse County 525 325 225 110 140
Lincoln County 618 to 960 240 172 55 41
Marathon County 721 to 1,077 418 or 544 177 88 45
Menasha (City) 1,086 357 257 180 125
Neenah (City) 750 370 250 150 85 North Shore Environmental Health Consortium 822 320 228 56 55
Oneida County 562 218 156 50 37
Oshkosh (City) 1,000 550 375 255 210
Outagamie County 800 600 245 85 77
Portage County 700 to 1,000 400 220 100 55
Racine (City) 750 375 260 135 105
Taylor County 618 to 960 240 172 55 41
Trempealeau County 562 218 156 50 37
Tri-County Consortium 720 280 200 64 48
Waukesha County 430 to 975 275 150 275 105 to 175
West Allis (City) 604 225 168 66 55
Winnebago County 927 427 256 145 94
Wood County 620 240 170 55 40
****

Appendix 1
Selected Food and Dairy License Fees
License Type Current Fee Proposed Fee
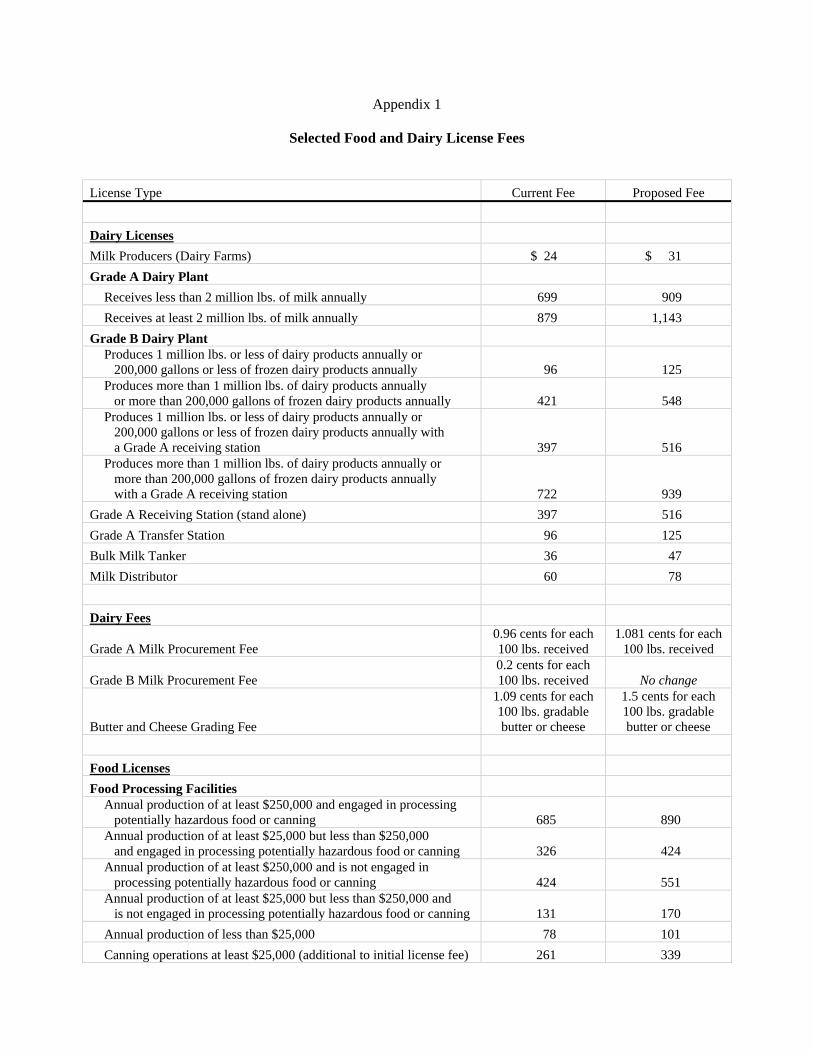
Dairy Licenses Milk Producers (Dairy Farms) $ 24 $ 31 Grade A Dairy Plant Receives less than 2 million lbs. of milk annually 699 909 Receives at least 2 million lbs. of milk annually 879 1,143 Grade B Dairy Plant
Produces 1 million lbs. or less of dairy products annually or 200,000 gallons or less of frozen dairy products annually 96 125 Produces more than 1 million lbs. of dairy products annually or more than 200,000 gallons of frozen dairy products annually 421 548 Produces 1 million lbs. or less of dairy products annually or 200,000 gallons or less of frozen dairy products annually with a Grade A receiving station 397 516 Produces more than 1 million lbs. of dairy products annually or more than 200,000 gallons of frozen dairy products annually with a Grade A receiving station 722 939
Grade A Receiving Station (stand alone) 397 516 Grade A Transfer Station 96 125 Bulk Milk Tanker 36 47 Milk Distributor 60 78 Dairy Fees
Grade A Milk Procurement Fee 0.96 cents for each 100 lbs. received
1.081 cents for each 100 lbs. received
Grade B Milk Procurement Fee 0.2 cents for each 100 lbs. received No change
Butter and Cheese Grading Fee
1.09 cents for each 100 lbs. gradable butter or cheese
1.5 cents for each 100 lbs. gradable butter or cheese
Food Licenses Food Processing Facilities
Annual production of at least $250,000 and engaged in processing potentially hazardous food or canning 685 890 Annual production of at least $25,000 but less than $250,000 and engaged in processing potentially hazardous food or canning 326 424 Annual production of at least $250,000 and is not engaged in processing potentially hazardous food or canning 424 551 Annual production of at least $25,000 but less than $250,000 and is not engaged in processing potentially hazardous food or canning 131 170 Annual production of less than $25,000 78 101 Canning operations at least $25,000 (additional to initial license fee) 261 339

1-2
License Type Current Fee Proposed Fee
Food Warehouses
Stores potentially hazardous food and has at least 50,000 sq. feet $261 $339 Stores potentially hazardous food and has fewer than 50,000 sq. feet 98 127 Does not store potentially hazardous food and has at least 50,000 sq. feet 131 170 Does not store potentially hazardous food and has fewer than 50,000 sq. feet 65 85
Retail Food Establishments
Food sales of at least $1,000,000 and processes potentially hazardous foods 562 731 Food sales of at least $25,000 but less than $1,000,000 and processes potentially hazardous foods 218 283 Food sales of at least $25,000 and is engaged in food processing, but does not process potentially hazardous foods 156 203 Food sales of less than $25,000 and is engaged in food processing 50 65 Does not engage in food processing 37 48
Professional Licenses (Biennial Fees) Cheese and Butter Grader 60 78 Bulk Milk Weigher and Sampler 48 62 Butter Maker 60 78 Cheese Maker 60 78 Milk and Cream Tester 50 No change

Appendix 2
Local Health Departments that Regulate Retail Food Establishments As of June 2007
Consortiums North Shore Environmental Health Consortium (cities north of Milwaukee) South Milwaukee/St. Francis Consortium Tri-County Consortium (Green Lake, Marquette, and Waushara counties)
Counties
Ashland Oneida Brown Outagamie Dane Portage
Douglas Rock Dunn Taylor
Fond du Lac Trempealeau Kenosha Waukesha
La Crosse Winnebago Lincoln Wood
Marathon
Cities
Appleton Milwaukee De Pere Neenah
Eau Claire Oshkosh Greenfield Racine Madison Wauwatosa Menasha West Allis