Food and Beverages Sector - EMIS Insight - Brazil Food a… · Brazil's food and beverages sector...
64
- 1 - Any redistribution of this information is strictly prohibited. Copyright © 2014 EMIS, all rights reserved. Produced by: Any redistribution of this information is strictly prohibited. Copyright © 2014 EMIS, all rights reserved. Food and Beverages Sector Brazil December 2014
Transcript of Food and Beverages Sector - EMIS Insight - Brazil Food a… · Brazil's food and beverages sector...
- 1 - Any redistribution of this information is strictly prohibited.
Copyright © 2014 EMIS, all rights reserved.
Produced by:
Any redistribution of this information is strictly prohibited.
Copyright © 2014 EMIS, all rights reserved.
Food and Beverages
Sector Brazil
December 2014
- 2 - Any redistribution of this information is strictly prohibited.
Copyright © 2014 EMIS, all rights reserved.
Table of Contents
I. Sector Overview 1. Sector Highlights
2. Key Indicators
3. Performance Indicators
4. Industrial Production
5. Investments
6. Forecast
7. International Trade
8. Industrial Activity
9. Financial Conditions
10.Employment and Wages
11.Government Policy
II. Food 1. Beef
2. Beef Trade
3. Pork
4. Pork Trade
5. Poultry
6. Poultry Trade
7. Turkey
8. Turkey Trade
9. Other Poultry Meat
10.Other Poultry Meat Trade
11.Eggs
12.Fish
9. Fish Exports
10.Fish Imports
11.Wheat Flour
12.Wheat Flour International Trade
13.Pasta
14.Pasta International Trade
15.Bread and Cake
16.Bread and Cake International Trade
17.Biscuits
18.Dairy Segment
19.Dairy Segment International Trade
20.Fruits
21.Fruits International Trade
22.Vegetables
23.Vegetables International Trade
III. Beverages 1. Soft Drinks
2. Beer
3. Orange Juice
4. Orange Juice Exports Key Indicators
5. Wine
6. Sales of Wine in Brazil
7. Wine International Trade
- 3 - Any redistribution of this information is strictly prohibited.
Copyright © 2014 EMIS, all rights reserved.
Table of Contents
IV. Main Players 1. BRF
2. BRF (cont’d)
3. BRF (cont’d)
4. JBS
5. JBS (cont’d)
6. Marfrig Global Foods
7. Marfrig Global Foods (cont’d)
8. Ambev
9. Ambev (cont’d)
10.Vigor Alimentos
11.Vigor Alimentos (cont’d)
- 4 - Any redistribution of this information is strictly prohibited.
Copyright © 2014 EMIS, all rights reserved.
I. Sector Overview

- 5 - Any redistribution of this information is strictly prohibited.
Copyright © 2014 EMIS, all rights reserved.
Sector Highlights
Brazil's beverages sector experienced strong growth in the past few years. The cumulative growth of physical production of beverages reached 50%
between 2004 and 2013. Notably, the average annual growth rate of beverages production in the last decade stood at 4.2%, while the average
annual growth rate of the country's GDP over the same period was 3.7%. The sector is dominated by the soft drinks and beer segments. Currently,
Brazil is the third-largest producer and consumer of soft drinks and beer in the world. Interestingly, despite the almost non-existent imports of soft
drinks and beer in Brazil, the segment's share in the country's overall imports is constantly growing due to the rise in imported raw materials,
especially the imports of malt.
The food sector is among the most dynamic in the Brazilian economy. The country is home to the largest players in the global meat market and
leading exporter of sugar, soybean and other raw materials for the food industry. The growth of the sector is strongly supported by the large and fast
growing consumer market. In addition, some local companies have strongly expanded abroad by acquiring international brands. Almost 100% of the
local demand is met by local companies or foreign entities operating in Brazil. The sector's imports are predominantly of some products in the
premium segment and also raw materials like wheat and wheat flour, milk powder and cocoa. The food sector in Brazil is highly concentrated, less
than 1% of the companies account for more than half of the production gross value.
Brazil's food and beverages sector accounts for 10% of the country's GDP and is its largest exporter. In 2013, the revenues of the sector reached
BRL 485bn, an 11% increase from 2012. Currently, the food and beverages manufacturing industry is the second-largest segment of the
manufacturing industry in terms of gross output, behind only the petrochemical industry. Underpinned by rising domestic and foreign demand, the
sales in the sector are constantly growing despite the current slowdown of Brazil's economy.
There are about 32,000 companies operating in the food and beverages sector and they employ about 19% of the working population in the country.
Overview
Food
Beverages
- 6 - Any redistribution of this information is strictly prohibited.
Copyright © 2014 EMIS, all rights reserved.
Source:
Key Indicators
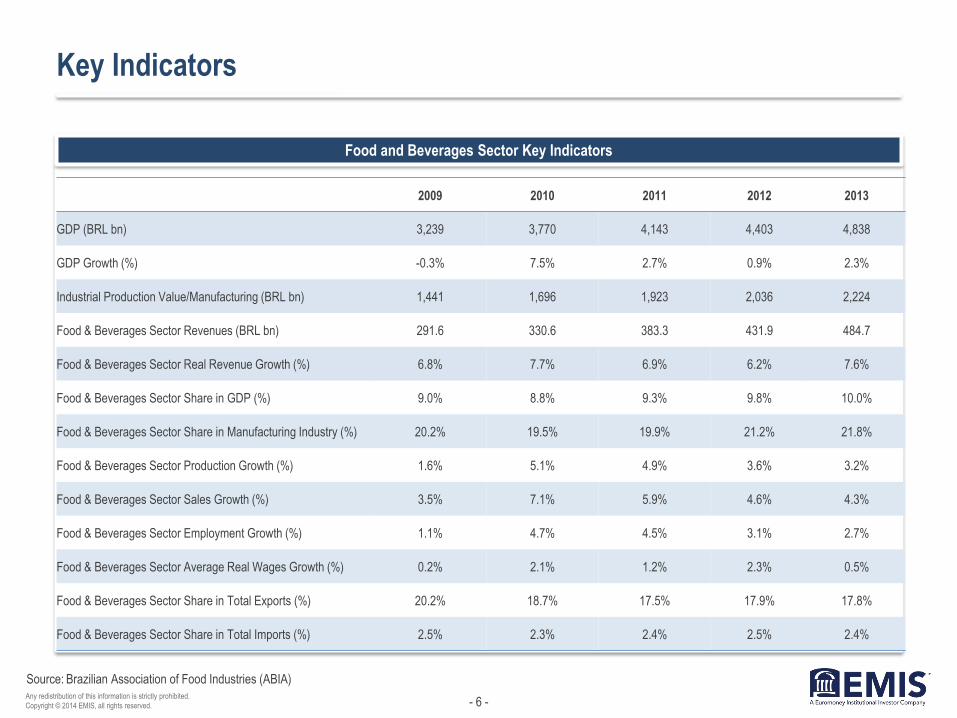
Food and Beverages Sector Key Indicators
Brazilian Association of Food Industries (ABIA)
2009 2010 2011 2012 2013
GDP (BRL bn) 3,239 3,770 4,143 4,403 4,838
GDP Growth (%) -0.3% 7.5% 2.7% 0.9% 2.3%
Industrial Production Value/Manufacturing (BRL bn) 1,441 1,696 1,923 2,036 2,224
Food & Beverages Sector Revenues (BRL bn) 291.6 330.6 383.3 431.9 484.7
Food & Beverages Sector Real Revenue Growth (%) 6.8% 7.7% 6.9% 6.2% 7.6%
Food & Beverages Sector Share in GDP (%) 9.0% 8.8% 9.3% 9.8% 10.0%
Food & Beverages Sector Share in Manufacturing Industry (%) 20.2% 19.5% 19.9% 21.2% 21.8%
Food & Beverages Sector Production Growth (%) 1.6% 5.1% 4.9% 3.6% 3.2%
Food & Beverages Sector Sales Growth (%) 3.5% 7.1% 5.9% 4.6% 4.3%
Food & Beverages Sector Employment Growth (%) 1.1% 4.7% 4.5% 3.1% 2.7%
Food & Beverages Sector Average Real Wages Growth (%) 0.2% 2.1% 1.2% 2.3% 0.5%
Food & Beverages Sector Share in Total Exports (%) 20.2% 18.7% 17.5% 17.9% 17.8%
Food & Beverages Sector Share in Total Imports (%) 2.5% 2.3% 2.4% 2.5% 2.4%

- 7 - Any redistribution of this information is strictly prohibited.
Copyright © 2014 EMIS, all rights reserved.
Source:
Performance Indicators
Financial Performance (BRL bn)
Domestic Sales Segmentation (BRL bn)
Main Segments Revenue Evolution (BRL bn)
ABIA
246.7 274.6 316.5 353.9 394.6
45.0 56.0
66.8 78.0
90.1
291.7 330.6
383.3 431.9
484.7
2009 2010 2011 2012 2013
Food Subsector Revenues Beverages Subsector Revenues
159.1 179.5 203.5 227.9 255.6
65.0 75.7
87.9 100.9
116.6
224.1 255.1
291.5 328.7
372.2
2009 2010 2011 2012 2013
Retail Food Service
17.7
15.6
19.9
37.7
29.3
33.1
35.9
66.0
20.5
18.2
21.4
42.2
34.5
38.1
40.6
79.1
24.2
20.4
23.5
41.9
40.9
42.2
46.9
88.7
28.7
23.7
26.8
40.9
42.3
50.1
52.8
100.8
Spices, Slat Deserts & IceCream,
Fruit & Vegetables
Corn & Corn Derivatives
Sweets
Oils & Fats
Dairy Segment
Coffee, Tea and Cereal
Meat & Processed Meat
2013
2012
2011
2010
- 8 - Any redistribution of this information is strictly prohibited.
Copyright © 2014 EMIS, all rights reserved.
Source:
Industrial Productivity
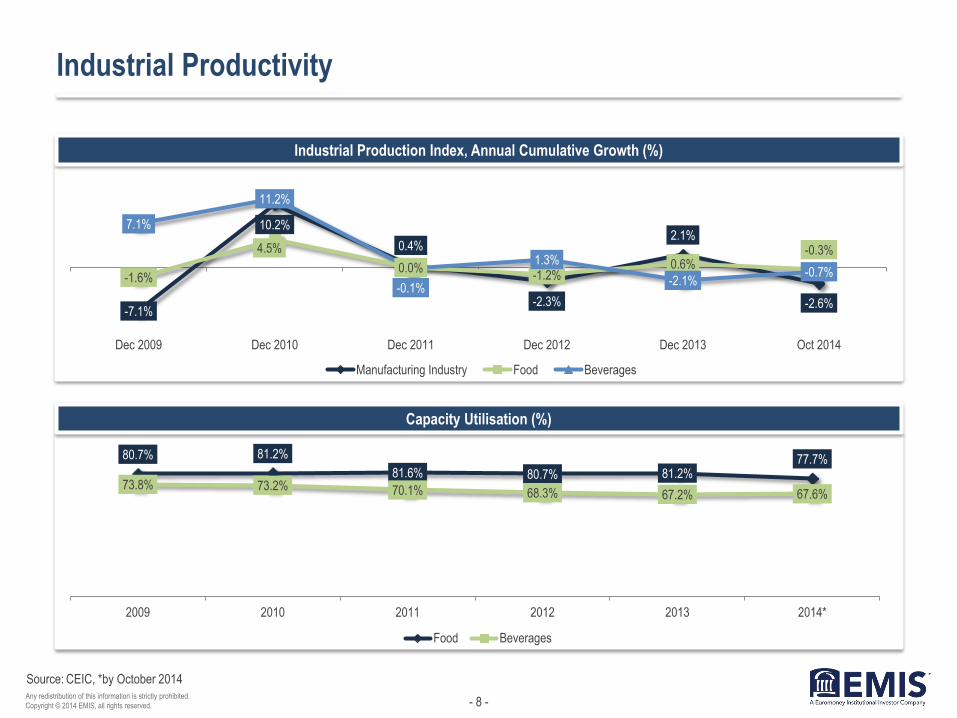
Industrial Production Index, Annual Cumulative Growth (%)
Capacity Utilisation (%)
CEIC, *by October 2014
80.7% 81.2%
81.6% 80.7% 81.2% 77.7%
73.8% 73.2% 70.1% 68.3% 67.2% 67.6%
2009 2010 2011 2012 2013 2014*
Food Beverages
-7.1%
10.2%
0.4%
-2.3%
2.1%
-2.6%
-1.6%
4.5%
0.0% -1.2%
0.6% -0.3%
7.1%
11.2%
-0.1%
1.3%
-2.1% -0.7%
Dec 2009 Dec 2010 Dec 2011 Dec 2012 Dec 2013 Oct 2014
Manufacturing Industry Food Beverages

- 9 - Any redistribution of this information is strictly prohibited.
Copyright © 2014 EMIS, all rights reserved.
Comments
Source:
Investments
The overall investments in the food and beverages sector in 2013 reached BRL 15bn, a 26% increase from the previous year. The funds were mainly used
for capacity upgrade and expansion.
The future investments announced by food sector players are predominantly focused on the purchase of new machinery and equipment as well as the
diversification of their product portfolio, which focuses on processed foods rather than on fresh ones. In the case of beverages, the companies earmark
considerable investments for marketing campaigns in order to increase their market share. According to estimates by Brazil's state development bank
BNDES, investments in the segment will reach BRL 32bn by 2018.
FDI, Equity Capital Inflow (USD mn) BNDES Investments (BRL bn)
EMIS Insight, CEIC, BNDES
58
49
32
2010 - 2013 2015 - 2018
Foods Beverages
451.0
1,716.1
3,063.3
5,076.0
1,486.7
115.8 366.4
4,265.0
511.0 598.1
2009 2010 2011 2012 2013
Food Beverages
- 10 - Any redistribution of this information is strictly prohibited.
Copyright © 2014 EMIS, all rights reserved.
Comments
Source:
Sector Forecast
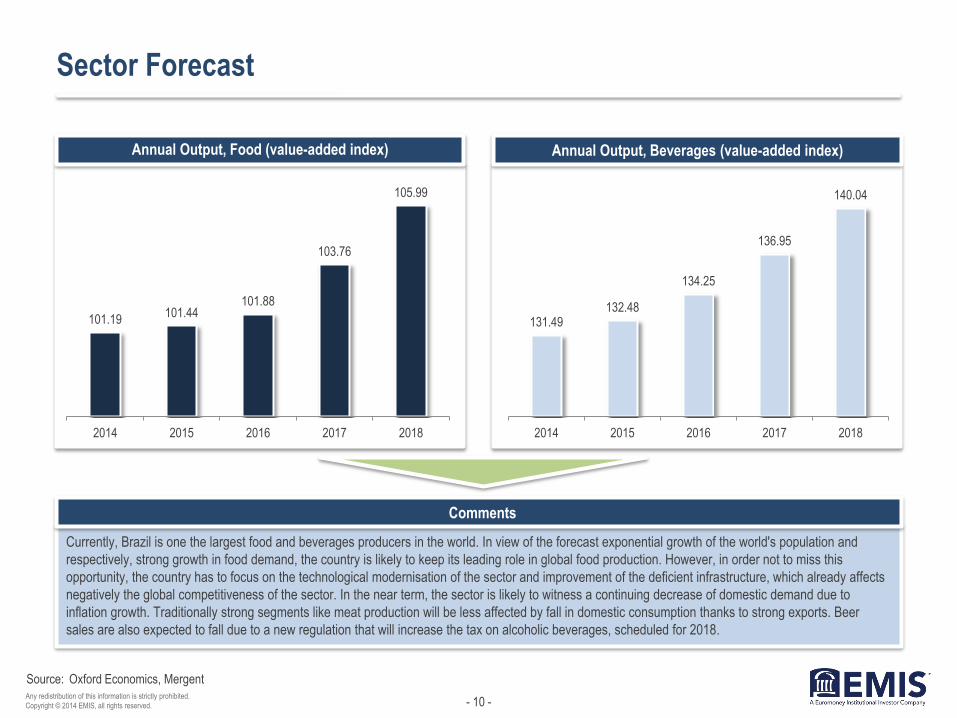
Currently, Brazil is one the largest food and beverages producers in the world. In view of the forecast exponential growth of the world's population and
respectively, strong growth in food demand, the country is likely to keep its leading role in global food production. However, in order not to miss this
opportunity, the country has to focus on the technological modernisation of the sector and improvement of the deficient infrastructure, which already affects
negatively the global competitiveness of the sector. In the near term, the sector is likely to witness a continuing decrease of domestic demand due to
inflation growth. Traditionally strong segments like meat production will be less affected by fall in domestic consumption thanks to strong exports. Beer
sales are also expected to fall due to a new regulation that will increase the tax on alcoholic beverages, scheduled for 2018.
Annual Output, Food (value-added index) Annual Output, Beverages (value-added index)
Oxford Economics, Mergent
101.19 101.44
101.88
103.76
105.99
2014 2015 2016 2017 2018
131.49 132.48
134.25
136.95
140.04
2014 2015 2016 2017 2018
- 11 - Any redistribution of this information is strictly prohibited.
Copyright © 2014 EMIS, all rights reserved.
Source:
International Trade
Food & Beverages Exports Evolution (USD bn)
Food & Beverages Trade Balance Evolution (USD bn)
Food & Beverages Imports Evolution (USD bn)
Comments
ABIA
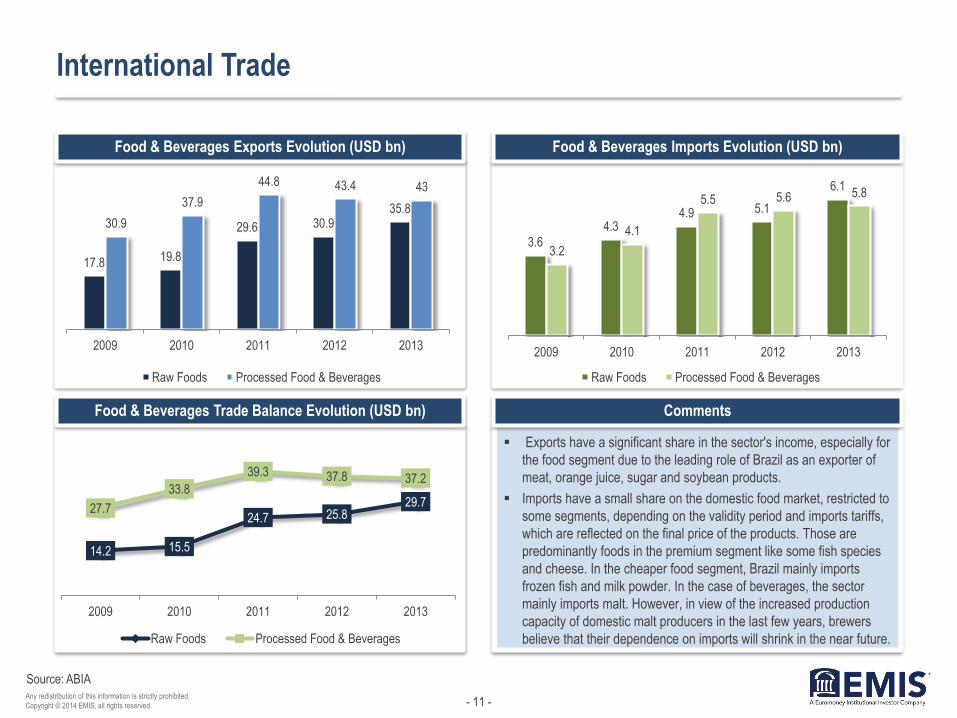
Exports have a significant share in the sector's income, especially for
the food segment due to the leading role of Brazil as an exporter of
meat, orange juice, sugar and soybean products.
Imports have a small share on the domestic food market, restricted to
some segments, depending on the validity period and imports tariffs,
which are reflected on the final price of the products. Those are
predominantly foods in the premium segment like some fish species
and cheese. In the cheaper food segment, Brazil mainly imports
frozen fish and milk powder. In the case of beverages, the sector
mainly imports malt. However, in view of the increased production
capacity of domestic malt producers in the last few years, brewers
believe that their dependence on imports will shrink in the near future.
17.8 19.8
29.6 30.9 35.8
30.9
37.9
44.8 43.4 43
2009 2010 2011 2012 2013
Raw Foods Processed Food & Beverages
3.6
4.3 4.9 5.1
6.1
3.2
4.1
5.5 5.6 5.8
2009 2010 2011 2012 2013
Raw Foods Processed Food & Beverages
14.2 15.5
24.7 25.8 29.7
27.7
33.8
39.3 37.8 37.2
2009 2010 2011 2012 2013
Raw Foods Processed Food & Beverages
- 12 - Any redistribution of this information is strictly prohibited.
Copyright © 2014 EMIS, all rights reserved.
Source:
Industrial Activity
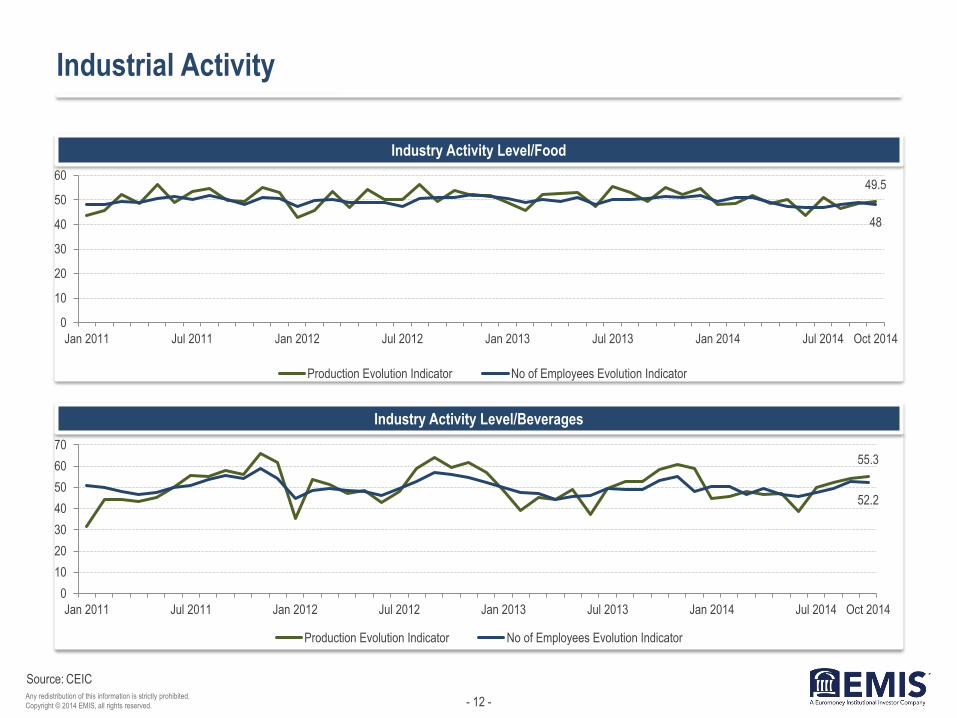
Industry Activity Level/Food
Industry Activity Level/Beverages
CEIC
49.5
48
0
10
20
30
40
50
60
Jan 2011 Jul 2011 Jan 2012 Jul 2012 Jan 2013 Jul 2013 Jan 2014 Jul 2014 Oct 2014
Production Evolution Indicator No of Employees Evolution Indicator
55.3
52.2
0
10
20
30
40
50
60
70
Jan 2011 Jul 2011 Jan 2012 Jul 2012 Jan 2013 Jul 2013 Jan 2014 Jul 2014 Oct 2014
Production Evolution Indicator No of Employees Evolution Indicator
- 13 - Any redistribution of this information is strictly prohibited.
Copyright © 2014 EMIS, all rights reserved.
Source:
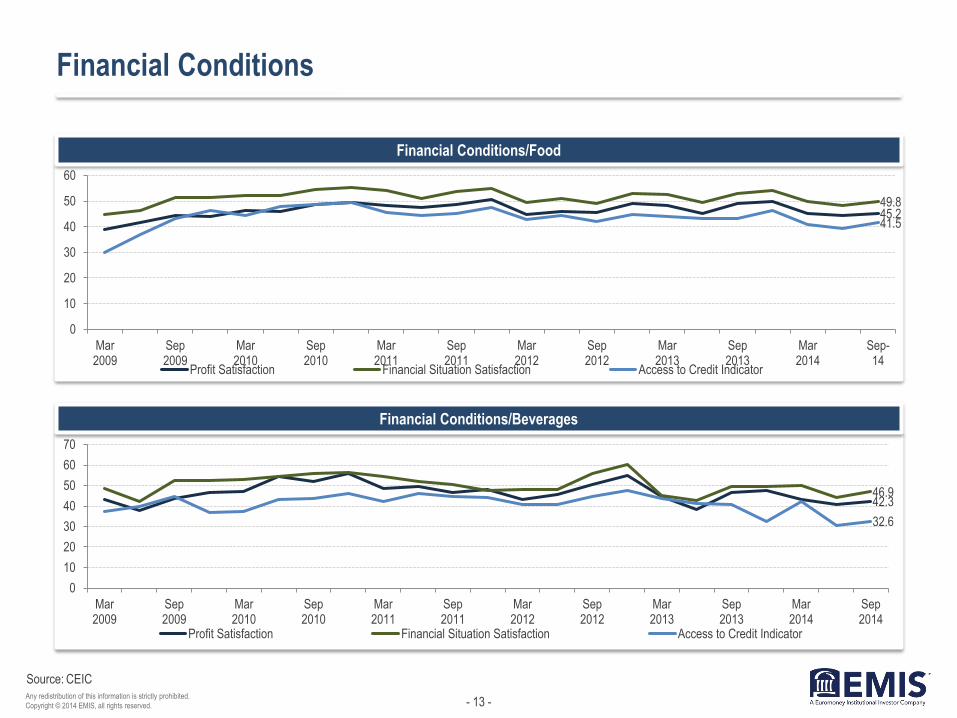
Financial Conditions
Financial Conditions/Food
Financial Conditions/Beverages
CEIC
45.2 49.8
41.5
0
10
20
30
40
50
60
Mar2009
Sep2009
Mar2010
Sep2010
Mar2011
Sep2011
Mar2012
Sep2012
Mar2013
Sep2013
Mar2014
Sep-14
Profit Satisfaction Financial Situation Satisfaction Access to Credit Indicator
42.3 46.9
32.6
0
10
20
30
40
50
60
70
Mar2009
Sep2009
Mar2010
Sep2010
Mar2011
Sep2011
Mar2012
Sep2012
Mar2013
Sep2013
Mar2014
Sep2014
Profit Satisfaction Financial Situation Satisfaction Access to Credit Indicator

- 14 - Any redistribution of this information is strictly prohibited.
Copyright © 2014 EMIS, all rights reserved.
Source:
Employment and Wages
Employment (thou)
Wages and Productivity Evolution (%)
Sector's Share in Overall Manufacturing Industry (%)
Comments
ABIA, BNDES
The largest share of workers in the overall food and beverages sector
are employed in the food industry. The sector is among the biggest
employers in the country. The companies in the sector are often
located in the interior of the country and generate jobs and income in
smaller towns where the unemployment rates are traditionally higher.
The beverage segment is characterised as capital intensive, thus it
tends to have a lower importance as employer. However, it is
responsible for about 2.2% of the jobs in the overall manufacturing
industry of the country. The segment directly employs about 144,000
people, and more than 110,000 indirectly, predominantly engaged in
beverage retail sales.
1,437.8
1,527.3
1,583.7 1,585.6
1,626.1
2009 2010 2011 2012 2013
19.5% 19.4% 19.5% 19.5% 19.5%
1.1%
4.7% 4.5% 3.1% 2.7%
2009 2010 2011 2012 2013
Contribution to Employment in Man. Industry
Food & Beverages Employment Growth
5.3%
7.3% 7.9% 8.0%
7.1% 6.5% 6.8%
11.8% 12.6%
9.4%
2009 2010 2011 2012 2013
Nominal Average Wage Growth Revenue per Employee Growth
- 15 - Any redistribution of this information is strictly prohibited.
Copyright © 2014 EMIS, all rights reserved.
Source:
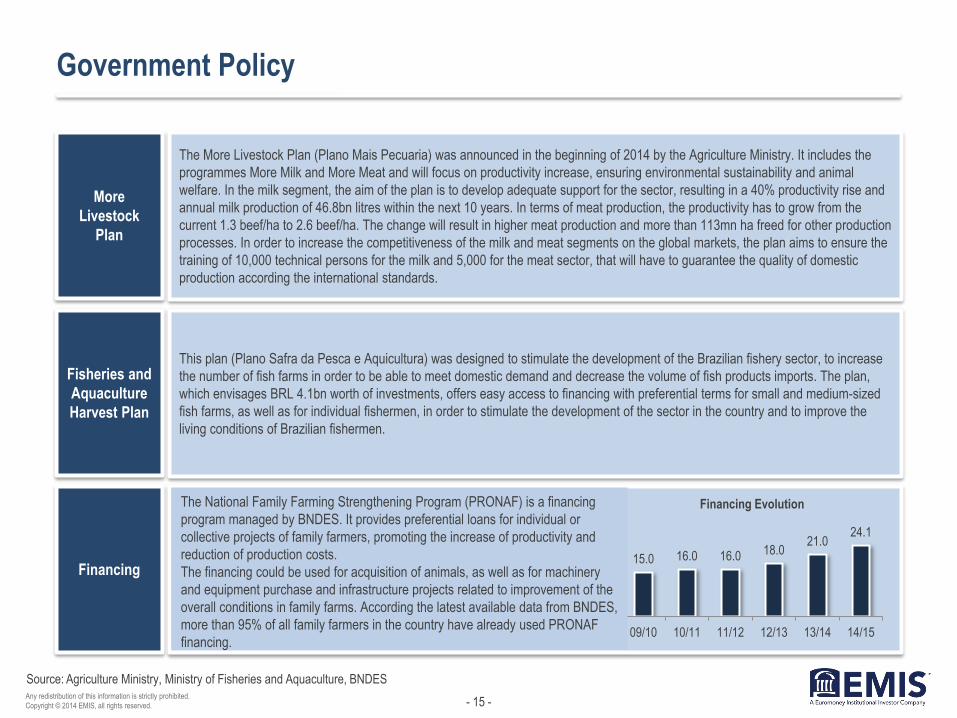
Government Policy
More
Livestock
Plan
The More Livestock Plan (Plano Mais Pecuaria) was announced in the beginning of 2014 by the Agriculture Ministry. It includes the
programmes More Milk and More Meat and will focus on productivity increase, ensuring environmental sustainability and animal
welfare. In the milk segment, the aim of the plan is to develop adequate support for the sector, resulting in a 40% productivity rise and
annual milk production of 46.8bn litres within the next 10 years. In terms of meat production, the productivity has to grow from the
current 1.3 beef/ha to 2.6 beef/ha. The change will result in higher meat production and more than 113mn ha freed for other production
processes. In order to increase the competitiveness of the milk and meat segments on the global markets, the plan aims to ensure the
training of 10,000 technical persons for the milk and 5,000 for the meat sector, that will have to guarantee the quality of domestic
production according the international standards.
Fisheries and
Aquaculture
Harvest Plan
This plan (Plano Safra da Pesca e Aquicultura) was designed to stimulate the development of the Brazilian fishery sector, to increase
the number of fish farms in order to be able to meet domestic demand and decrease the volume of fish products imports. The plan,
which envisages BRL 4.1bn worth of investments, offers easy access to financing with preferential terms for small and medium-sized
fish farms, as well as for individual fishermen, in order to stimulate the development of the sector in the country and to improve the
living conditions of Brazilian fishermen.
Financing
Agriculture Ministry, Ministry of Fisheries and Aquaculture, BNDES
15.0 16.0 16.0 18.0 21.0
24.1
09/10 10/11 11/12 12/13 13/14 14/15
Financing Evolution The National Family Farming Strengthening Program (PRONAF) is a financing
program managed by BNDES. It provides preferential loans for individual or
collective projects of family farmers, promoting the increase of productivity and
reduction of production costs.
The financing could be used for acquisition of animals, as well as for machinery
and equipment purchase and infrastructure projects related to improvement of the
overall conditions in family farms. According the latest available data from BNDES,
more than 95% of all family farmers in the country have already used PRONAF
financing.
- 16 - Any redistribution of this information is strictly prohibited.
Copyright © 2014 EMIS, all rights reserved.
II. Food

- 17 - Any redistribution of this information is strictly prohibited.
Copyright © 2014 EMIS, all rights reserved.
Source:
Beef
Beef Supply and Demand (thou mt cwe)
Cattle Stock (thou heads)
Brazil’s Share in Global Beef Meat Production 2013 (%)
Comments
USDA, Scot Consultoria, ABIEC
Brazil has the second-largest beef herd in the world after India. The
sector is the most important in the overall agribusiness sector in the
country.
Since 2012, Brazil is the largest beef and veal meat exporter in the
world. The forecast made by the Association of Meat Exporters
(ABIEC) is that the beef exports for 2014 will account for USD 7bn,
more than 8% growth compared to 2013. ABIEC is also optimistic for
the performance of the sector in 2015, thanks to the recently
announced end of the Chinese embargo for imports of Brazilian beef
meat and expectations for the suspension of the Saudi Arabian and
Japanese embargoes.
9,11
5
9,03
0
9,30
7
9,67
5
9,92
0
7,59
2
7,73
0
7,84
5
7,88
5
7,95
5
2010 2011 2012 2013 2014f
Production Domestic Consumption USA 20.1%
Brazil 16.5%
EU 12.7%
China 9.6%
India 6.6%
Others 34.5%
185,159
190,925
197,550
203,273
207,960
2010 2011 2012 2013 2014f
- 18 - Any redistribution of this information is strictly prohibited.
Copyright © 2014 EMIS, all rights reserved.
Source:
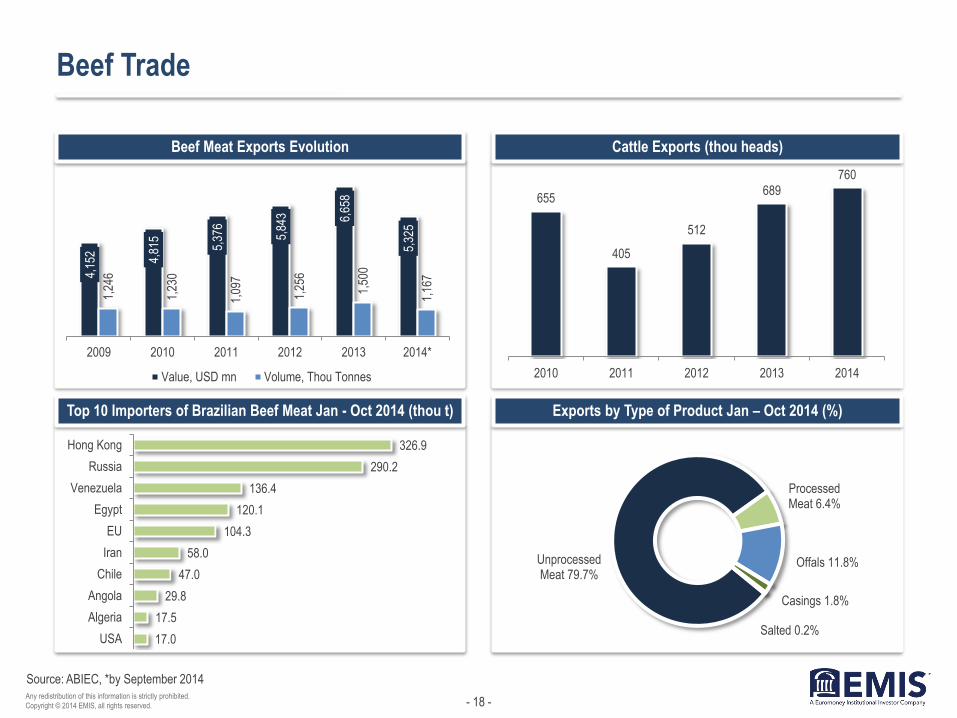
Beef Trade
Beef Meat Exports Evolution
Top 10 Importers of Brazilian Beef Meat Jan - Oct 2014 (thou t)
Cattle Exports (thou heads)
Exports by Type of Product Jan – Oct 2014 (%)
ABIEC, *by September 2014
4,15
2
4,81
5
5,37
6
5,84
3 6,65
8
5,32
5
1,24
6
1,23
0
1,09
7
1,25
6
1,50
0
1,16
7
2009 2010 2011 2012 2013 2014*
Value, USD mn Volume, Thou Tonnes
655
405
512
689
760
2010 2011 2012 2013 2014
17.0
17.5
29.8
47.0
58.0
104.3
120.1
136.4
290.2
326.9
USA
Algeria
Angola
Chile
Iran
EU
Egypt
Venezuela
Russia
Hong Kong
Unprocessed Meat 79.7%
Processed Meat 6.4%
Offals 11.8%
Casings 1.8%
Salted 0.2%

- 19 - Any redistribution of this information is strictly prohibited.
Copyright © 2014 EMIS, all rights reserved.
Source:
Pork
Pork Meat Supply and Demand (thou t)
Swine Stock (thou heads)
Pork Meat Consumption per Capita (kg)
Comments
ABIPECS, USDA
Brazil has the third-largest swine herd in the world after China and
the European Union. However, it accounts for only 5% of the global
swine stock and for about 3% of the world's pork meat production.
The production and consumption of pork meat in Brazil have
remained almost flat in the last 2-3 years, predominantly due to high
end prices leading to a fall in the per capita consumption.
The pork meat production in the country is concentrated in a few
states – Santa Catarina (25%), Rio Grande do Sul (20%) and Parana
(16%).
3,91
0
3,23
8
3,39
8
3,48
8
3,42
9
2,58
3
2,69
8
2,88
2
2,90
7
2,91
2
2009 2010 2011 2012 2013
Production Consumption
13.7
14.1
14.9 14.9
14.6
2009 2010 2011 2012 2013
35,122
36,652
38,336 38,577 38,844
2010 2011 2012 2013 2014f

- 20 - Any redistribution of this information is strictly prohibited.
Copyright © 2014 EMIS, all rights reserved.
Comments
Source:
Pork Trade
Brazil is the third-largest pork meat exporter in the world, after the European Union and Canada. However, the country's share in global exports was
relatively low at 8% in 2014. The main market for Brazilian pork meat is Russia. The country's imports of Brazilian pork meat increased by about 24% in
2014, pushed up predominantly by the Russian embargo on U.S., Canadian and European imports.
The main importers of Brazilian pork meat in South America are Uruguay and Argentina. Recently, the country received authorisation to exports pork meat
to the United States, the first shipments occurred in November 2014. By now, only two plants have the right to manufacture meat for the U.S. market -
Aurora Chapecó and BRF in Herval do Oeste in the Santa Catarina state.
Pork Meat Exports Pork Meat Exports by Country of Destination 2014* (%)
ABIPECS, *by September 2014
607 540 516
581 517
362
1,226 1,341
1,435 1,495
1,359
1,137
2009 2010 2011 2012 2013 2014*
Volume, thou tonnes Value, USD mnRussia 35.8%
Hong Kong 22.8%
Angola 10.7% Singapore
7.1%
Uruguay 4.4%
Georgia 2.1%
Others 17.2%
- 21 - Any redistribution of this information is strictly prohibited.
Copyright © 2014 EMIS, all rights reserved.
Comments
Source:
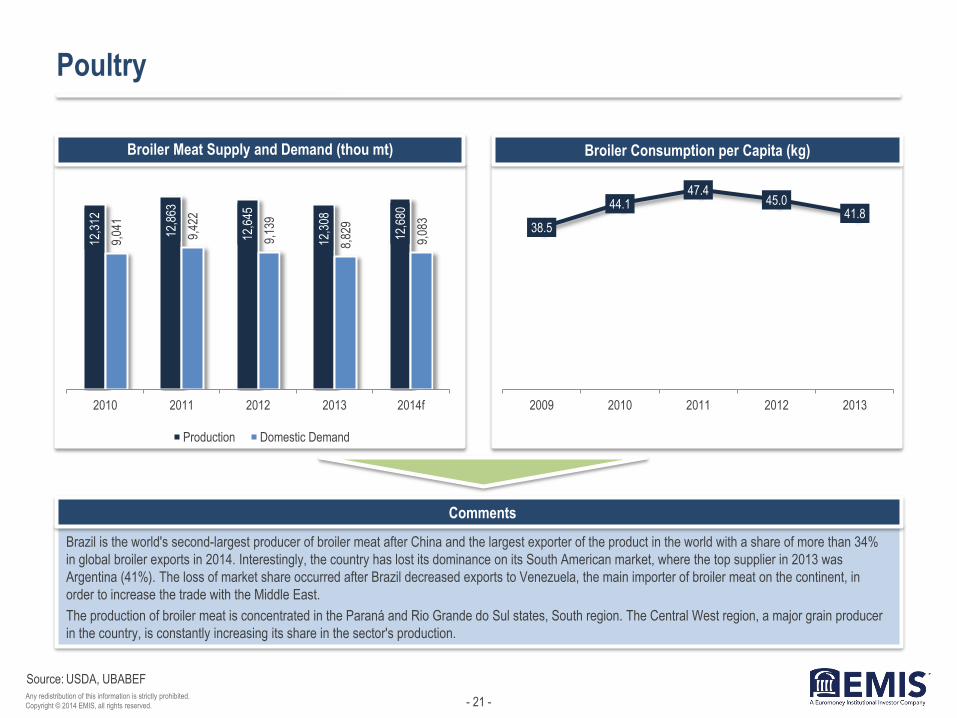
Poultry
Brazil is the world's second-largest producer of broiler meat after China and the largest exporter of the product in the world with a share of more than 34%
in global broiler exports in 2014. Interestingly, the country has lost its dominance on its South American market, where the top supplier in 2013 was
Argentina (41%). The loss of market share occurred after Brazil decreased exports to Venezuela, the main importer of broiler meat on the continent, in
order to increase the trade with the Middle East.
The production of broiler meat is concentrated in the Paraná and Rio Grande do Sul states, South region. The Central West region, a major grain producer
in the country, is constantly increasing its share in the sector's production.
Broiler Meat Supply and Demand (thou mt) Broiler Consumption per Capita (kg)
USDA, UBABEF
12,3
12
12,8
63
12,6
45
12,3
08
12,6
80
9,04
1
9,42
2
9,13
9
8,82
9
9,08
3
2010 2011 2012 2013 2014f
Production Domestic Demand
38.5
44.1 47.4
45.0 41.8
2009 2010 2011 2012 2013
- 22 - Any redistribution of this information is strictly prohibited.
Copyright © 2014 EMIS, all rights reserved.
Source:
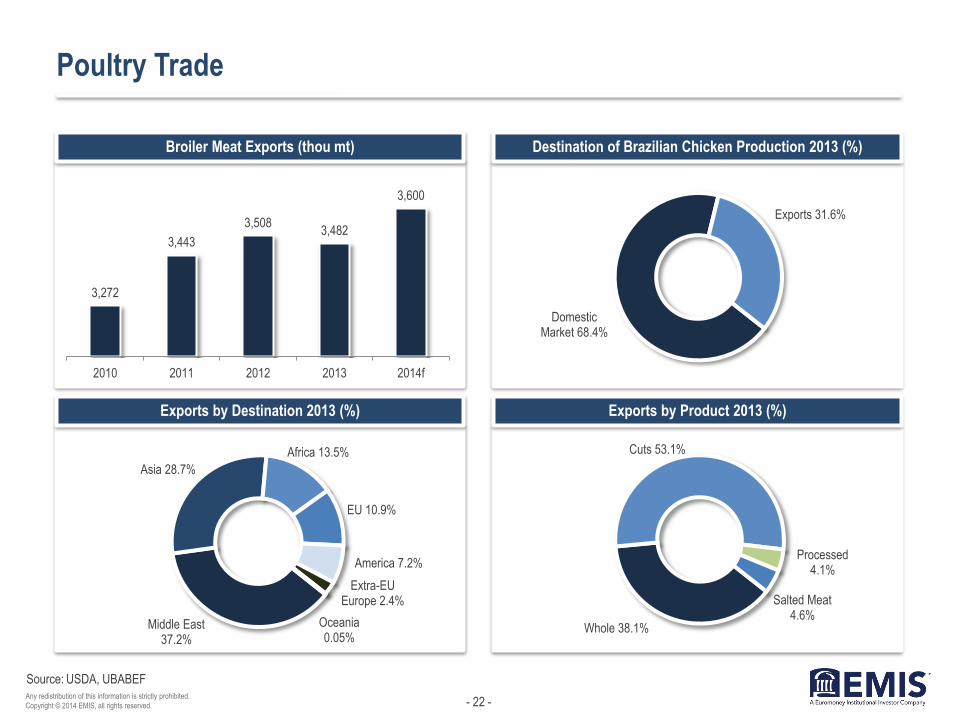
Poultry Trade
Broiler Meat Exports (thou mt)
Exports by Destination 2013 (%)
Destination of Brazilian Chicken Production 2013 (%)
Exports by Product 2013 (%)
USDA, UBABEF
3,272
3,443
3,508 3,482
3,600
2010 2011 2012 2013 2014f
Domestic Market 68.4%
Exports 31.6%
Middle East 37.2%
Asia 28.7%
Africa 13.5%
EU 10.9%
America 7.2%
Extra-EU Europe 2.4%
Oceania 0.05%
Whole 38.1%
Cuts 53.1%
Processed 4.1%
Salted Meat 4.6%

- 23 - Any redistribution of this information is strictly prohibited.
Copyright © 2014 EMIS, all rights reserved.
Source:
Turkey
Turkey Meat Production (thou t)
Destination of Production 2013 (%)
Turkey Slaughtering by State 2013 (%)
Comments
UBABEF, Folha de Sao Paulo
Brazil is the world's second-largest exporter and third-largest
producer of turkey. However, the domestic consumption of turkey
meat is much lower than broiler and beef consumption, with sales
surging predominantly during festive periods like Christmas.
Nevertheless, the consumption of turkey meat is enjoying robust
growth. The increase registered in November 2014 was 6%
compared to the same period in 2013. However, the per capita
consumption of turkey meat in Brazil (1.7kg/year) is still much lower
than the consumption in developed markets like the United States
(7.4kg/year) and the EU (3.4%).
337 305
442
364
2010 2011 2012 2013 Paraná 26.6%
Santa Catarina 24.2%
Minas Gerais 17.6%
Goiás 19.4%
Rio Grande do Sul 14.3%
Domestic Market 56%
Exports 44%
- 24 - Any redistribution of this information is strictly prohibited.
Copyright © 2014 EMIS, all rights reserved.
Source:
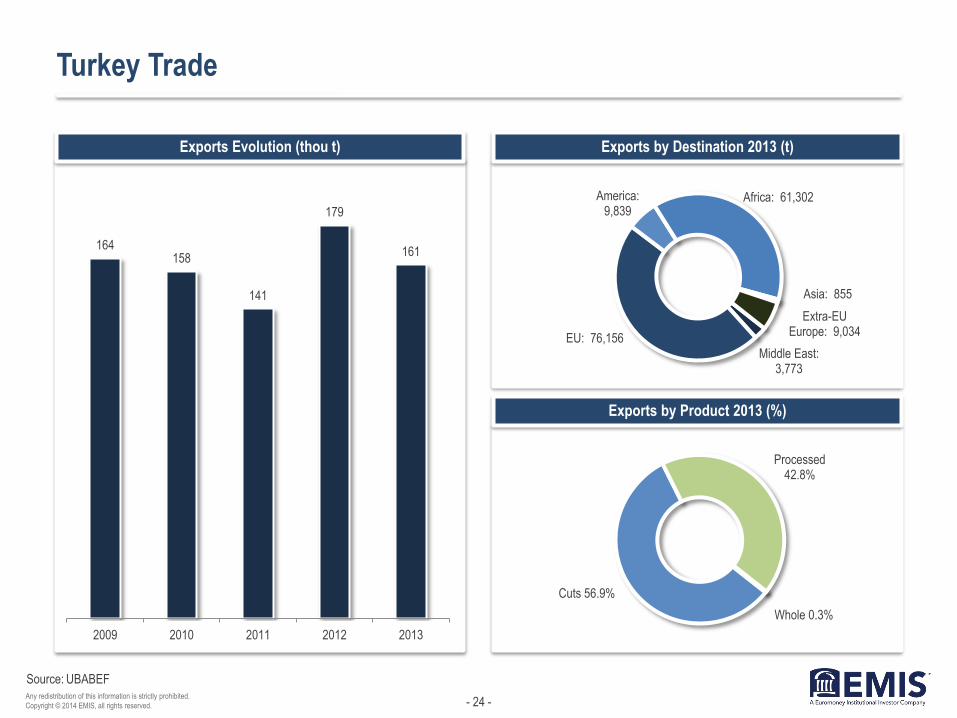
Turkey Trade
Exports by Destination 2013 (t)
Exports by Product 2013 (%)
Exports Evolution (thou t)
UBABEF
164 158
141
179
161
2009 2010 2011 2012 2013
Middle East: 3,773
EU: 76,156
America: 9,839
Africa: 61,302
Asia: 855
Extra-EU Europe: 9,034
Whole 0.3%
Cuts 56.9%
Processed 42.8%
- 25 - Any redistribution of this information is strictly prohibited.
Copyright © 2014 EMIS, all rights reserved.
Comments
Source:
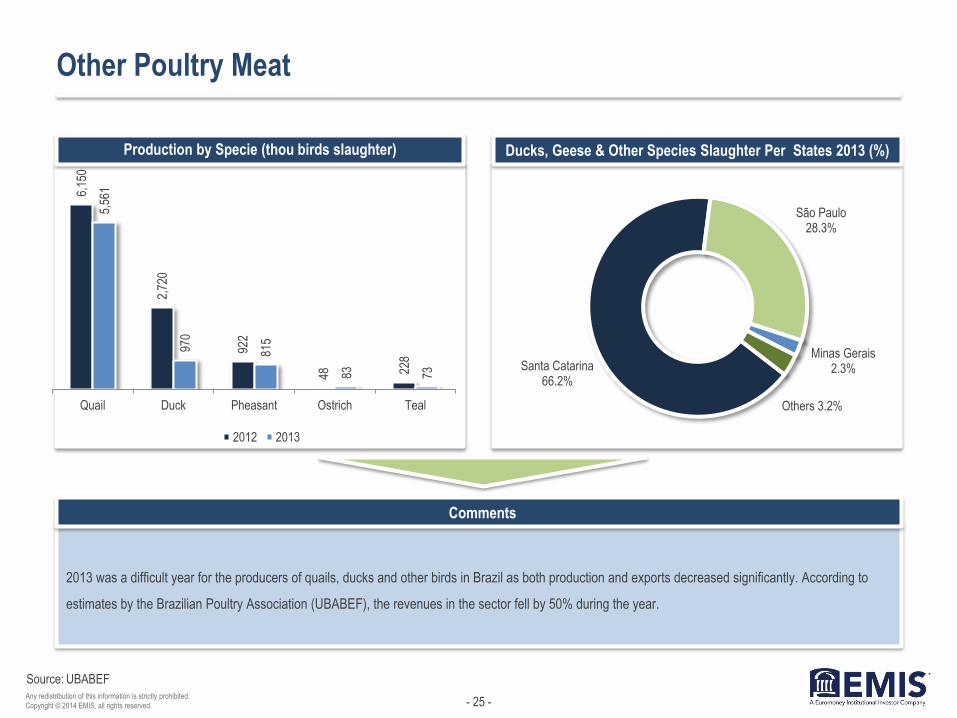
Other Poultry Meat
2013 was a difficult year for the producers of quails, ducks and other birds in Brazil as both production and exports decreased significantly. According to
estimates by the Brazilian Poultry Association (UBABEF), the revenues in the sector fell by 50% during the year.
Production by Specie (thou birds slaughter) Ducks, Geese & Other Species Slaughter Per States 2013 (%)
UBABEF
6,15
0
2,72
0
922
48
228
5,56
1
970
815
83
73
Quail Duck Pheasant Ostrich Teal
2012 2013
Santa Catarina 66.2%
São Paulo 28.3%
Minas Gerais 2.3%
Others 3.2%
- 26 - Any redistribution of this information is strictly prohibited.
Copyright © 2014 EMIS, all rights reserved.
Source:
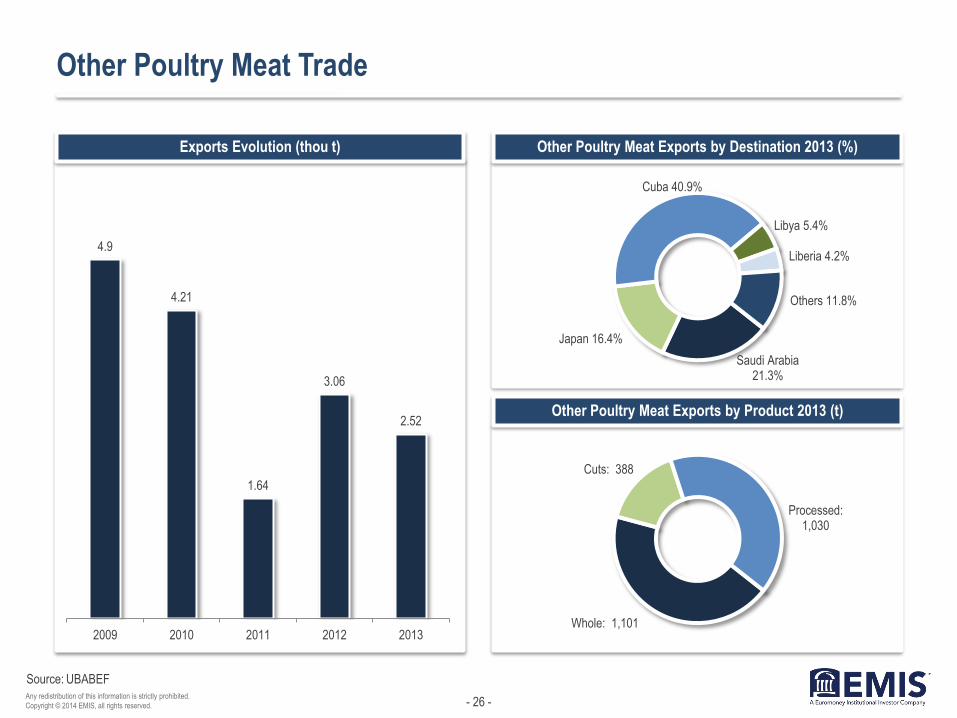
Other Poultry Meat Trade
Other Poultry Meat Exports by Destination 2013 (%)
Other Poultry Meat Exports by Product 2013 (t)
Exports Evolution (thou t)
UBABEF
4.9
4.21
1.64
3.06
2.52
2009 2010 2011 2012 2013
Saudi Arabia 21.3%
Japan 16.4%
Cuba 40.9%
Libya 5.4%
Liberia 4.2%
Others 11.8%
Whole: 1,101
Cuts: 388
Processed: 1,030

- 27 - Any redistribution of this information is strictly prohibited.
Copyright © 2014 EMIS, all rights reserved.
Source:
Eggs
Eggs Supply and Demand
Exports Evolution (thou t)
Production by State 2013 (%)
Exports by Destination 2013 (%)
UBABEF
28.8 31.6 31.8 34.1
148.85 162.57 161.53 168.72
2010 2011 2012 2013
Production (bg units) Consumption per Capita (units/year)
São Paulo 34.3%
Minas Gerais 12.4%
Espírito Santo 8.7%
Mato Grosso 6.6%
Paraná 6.1% Pernambuco
6.4%
Rio Grande do Sul 5.9%
Others 19.7%
37.01
27.72
16.66
26.85
12.39
2009 2010 2011 2012 2013Angola 36.1%
Congo 4.3%
UAE 42.6%
Bolivia 7.2%
Uruguay 2.6%
Others 7.3%
- 28 - Any redistribution of this information is strictly prohibited.
Copyright © 2014 EMIS, all rights reserved.
Source:
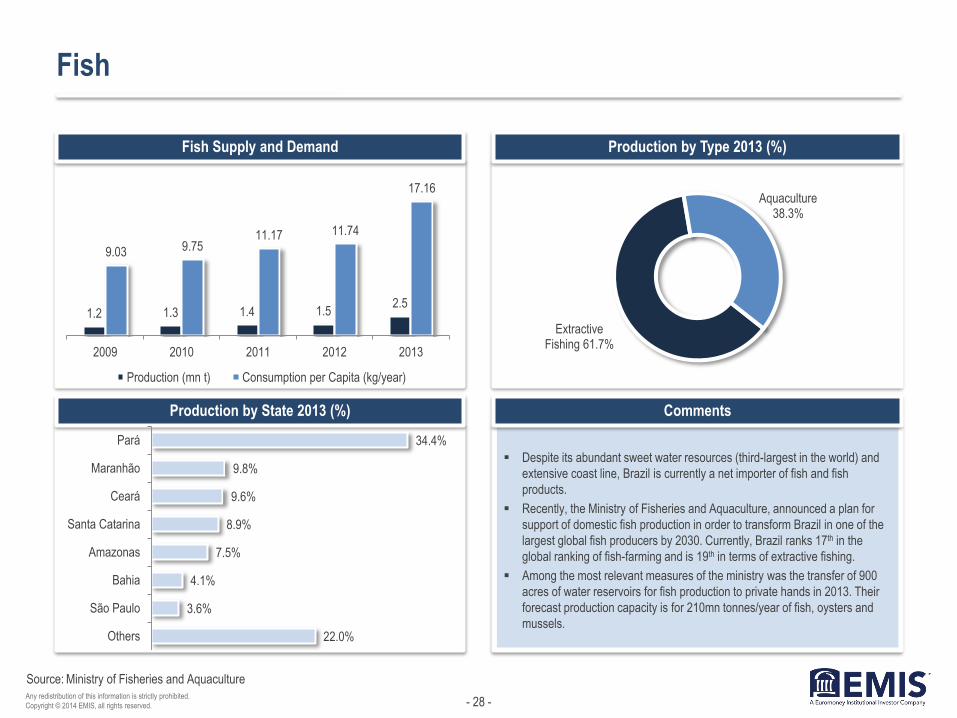
Fish
Fish Supply and Demand
Production by State 2013 (%)
Production by Type 2013 (%)
Comments
Ministry of Fisheries and Aquaculture
Despite its abundant sweet water resources (third-largest in the world) and
extensive coast line, Brazil is currently a net importer of fish and fish
products.
Recently, the Ministry of Fisheries and Aquaculture, announced a plan for
support of domestic fish production in order to transform Brazil in one of the
largest global fish producers by 2030. Currently, Brazil ranks 17th in the
global ranking of fish-farming and is 19th in terms of extractive fishing.
Among the most relevant measures of the ministry was the transfer of 900
acres of water reservoirs for fish production to private hands in 2013. Their
forecast production capacity is for 210mn tonnes/year of fish, oysters and
mussels.
1.2 1.3 1.4 1.5 2.5
9.03 9.75 11.17 11.74
17.16
2009 2010 2011 2012 2013
Production (mn t) Consumption per Capita (kg/year)
Extractive Fishing 61.7%
Aquaculture 38.3%
22.0%
3.6%
4.1%
7.5%
8.9%
9.6%
9.8%
34.4%
Others
São Paulo
Bahia
Amazonas
Santa Catarina
Ceará
Maranhão
Pará
- 29 - Any redistribution of this information is strictly prohibited.
Copyright © 2014 EMIS, all rights reserved.
Source:
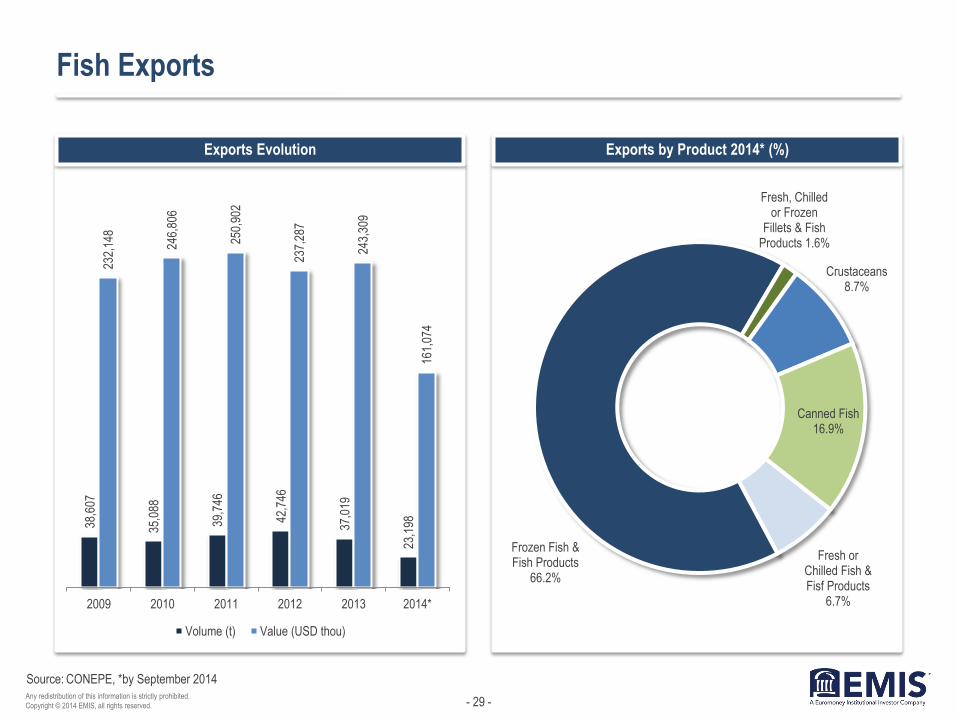
Fish Exports
Exports Evolution Exports by Product 2014* (%)
CONEPE, *by September 2014
38,6
07
35,0
88
39,7
46
42,7
46
37,0
19
23,1
98
232,
148
246,
806
250,
902
237,
287
243,
309
161,
074
2009 2010 2011 2012 2013 2014*
Volume (t) Value (USD thou)
Fresh or Chilled Fish & Fisf Products
6.7%
Frozen Fish & Fish Products
66.2%
Fresh, Chilled or Frozen
Fillets & Fish Products 1.6%
Crustaceans 8.7%
Canned Fish 16.9%

- 30 - Any redistribution of this information is strictly prohibited.
Copyright © 2014 EMIS, all rights reserved.
Source:
Fish Imports
Imports by Country of Origine 2014* (%)
Imports by Product 2014* (%)
Imports Evolution
CONEPE, *by September 2014
Chile 22.0%
China 17.7%
Vietnam 16.6%
Argentina 9.4%
Norway 6.3%
Morocco 6.3%
Others 21.5%
Fresh or Chilled Fish & Fisf Products
20.2%
Frozen Fish & Fish Products
23.4%
Fresh, Chilled or Frozen
Fillets & Fish Products
47.4%
Canned Fish 9.0%
240 28
0 345
363 41
9
296
715
1,00
1
1,25
3
1,23
1
1,45
3
1,25
6
2009 2010 2011 2012 2013 2014*
Volume (thou t) Value (USD mn)

- 31 - Any redistribution of this information is strictly prohibited.
Copyright © 2014 EMIS, all rights reserved.
Comments
Source:
Wheat Flour
The production of wheat and wheat flour in Brazil is much below the volume of domestic consumption. In fact, much of the wheat used in the production of
flour, pasta, bread, cakes and biscuits comes from imports. Actually, Brazil is one of the world's largest wheat importers and it is the second most imported
item in the country, after oil derivatives. In 2013, Brazil's wheat production decreased significantly as it was affected by the drought in the country. In 2014,
the wheat acreage increased by more than 14% to 2.524 million ha, and analysts had forecast a record wheat production of 7mn tonnes, a record high for
the country. However, in December 2014, the National Supply Company (Conab) announced much lower wheat production of 5.95 mn tonnes, explained
by unfavorable weather conditions.
Wheat Flour Supply and Demand by Harvest Period (mn t) Wheat Flour & Mixtures Consumption per Capita (kg/year)
ABIMA
3.75
4.5 4.24
3.18
4.07
7.58 7.65 7.69 7.73 7.8
2009/2010 2010/2011 2011/2012 2012/2013 2013/2014
Production Consumption
38.90 39.57
42.31
44.21 44.51 45.01
2008 2009 2010 2011 2012 2013
- 32 - Any redistribution of this information is strictly prohibited.
Copyright © 2014 EMIS, all rights reserved.
Source:
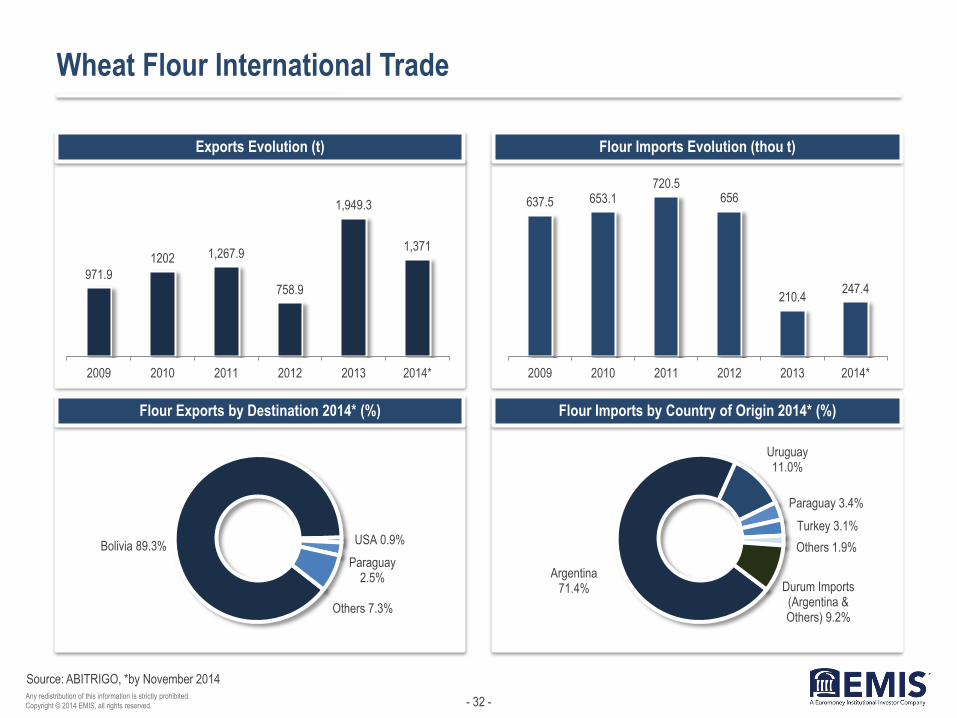
Wheat Flour International Trade
Exports Evolution (t)
Flour Exports by Destination 2014* (%)
Flour Imports Evolution (thou t)
Flour Imports by Country of Origin 2014* (%)
ABITRIGO, *by November 2014
971.9
1202 1,267.9
758.9
1,949.3
1,371
2009 2010 2011 2012 2013 2014*
Bolivia 89.3% USA 0.9%
Paraguay 2.5%
Others 7.3%
637.5 653.1 720.5
656
210.4 247.4
2009 2010 2011 2012 2013 2014*
Argentina 71.4%
Uruguay 11.0%
Paraguay 3.4%
Turkey 3.1%
Others 1.9%
Durum Imports (Argentina & Others) 9.2%

- 33 - Any redistribution of this information is strictly prohibited.
Copyright © 2014 EMIS, all rights reserved.
Comments
Source:
Pasta
The consumption of pasta in Brazil is the third-largest in the world, after the United States and Italy. The most popular type is the spaghetti (57%), followed
by fusilli (15%) and lasagne. In 2013, the revenue of the segment reached BRL 7bn, or a 11.5% increase compared to 2012. Brazilian pasta enjoys very
high penetration on the domestic market – above 99%, according the latest research from the Brazilian Association of Pasta and Industrialised Bread &
Cake Producers (ABIMA).
Pasta Sales by Type (thou t) Consumption per Capita (kg/year)
ABIMA, O Globo
6.3 6.3
6.1
6.0 6.0
2009 2010 2011 2012 2013
1,015 1,007 961 953 967
170.8 180.8 183.5 187.8 186.7
40.8 45.2 51.1 50.5 51.5
1,226 1,233 1,196 1,191 1,205
2009 2010 2011 2012 2013
Dry Instant Fresh
- 34 - Any redistribution of this information is strictly prohibited.
Copyright © 2014 EMIS, all rights reserved.
Source:
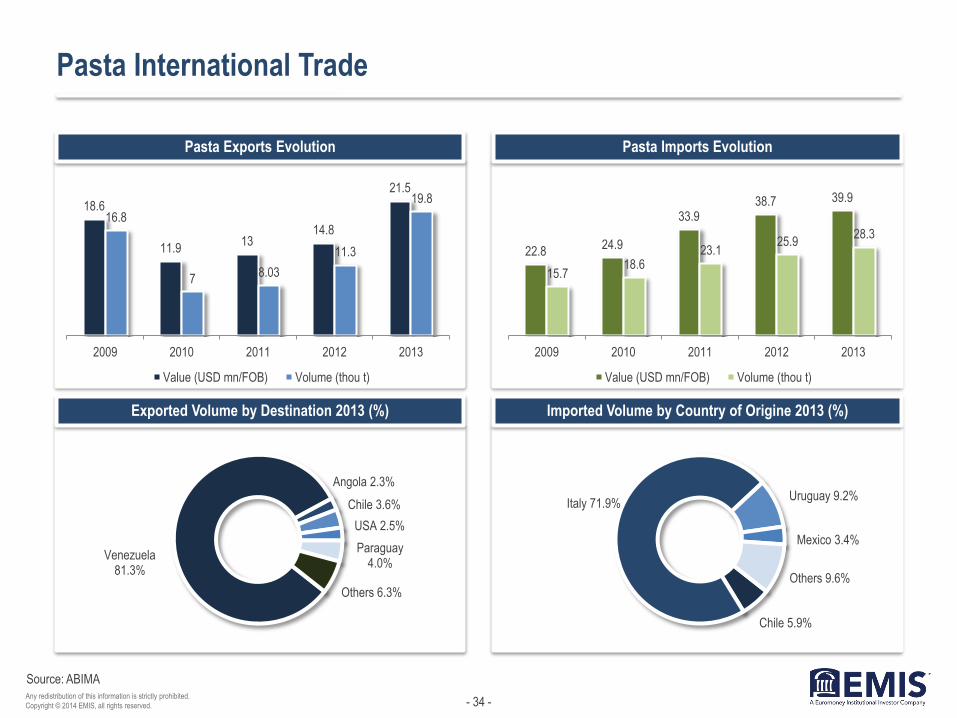
Pasta International Trade
Pasta Exports Evolution
Exported Volume by Destination 2013 (%)
Pasta Imports Evolution
Imported Volume by Country of Origine 2013 (%)
ABIMA
18.6
11.9 13
14.8
21.5
16.8
7 8.03
11.3
19.8
2009 2010 2011 2012 2013
Value (USD mn/FOB) Volume (thou t)
22.8 24.9
33.9 38.7 39.9
15.7 18.6
23.1 25.9
28.3
2009 2010 2011 2012 2013
Value (USD mn/FOB) Volume (thou t)
Venezuela 81.3%
Angola 2.3%
Chile 3.6%
USA 2.5%
Paraguay 4.0%
Others 6.3%
Chile 5.9%
Italy 71.9% Uruguay 9.2%
Mexico 3.4%
Others 9.6%
- 35 - Any redistribution of this information is strictly prohibited.
Copyright © 2014 EMIS, all rights reserved.
Comments
Source:
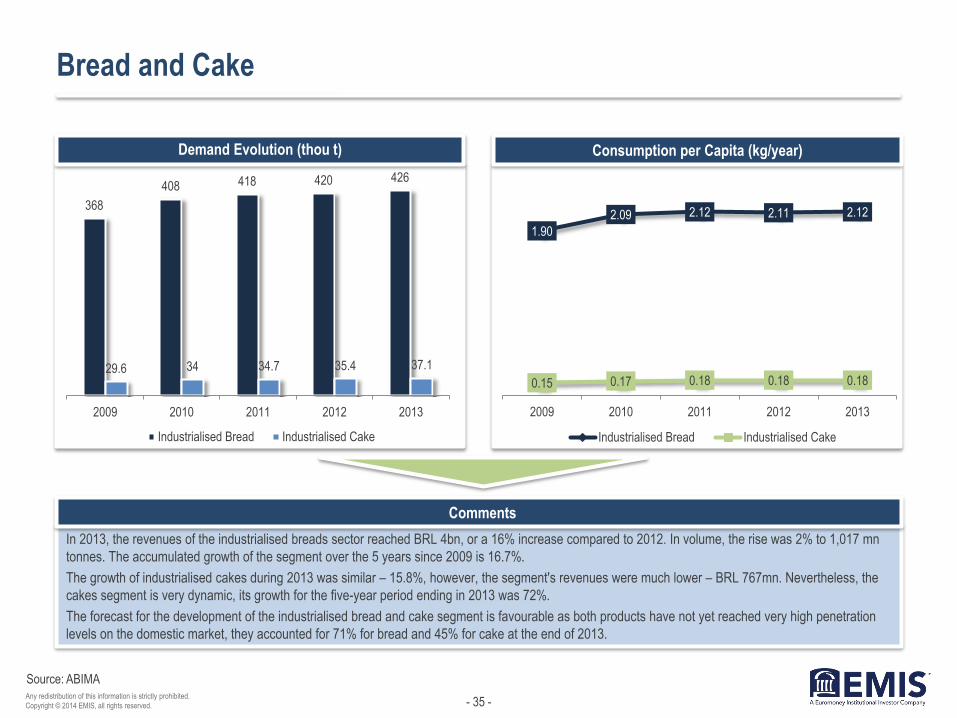
Bread and Cake
In 2013, the revenues of the industrialised breads sector reached BRL 4bn, or a 16% increase compared to 2012. In volume, the rise was 2% to 1,017 mn
tonnes. The accumulated growth of the segment over the 5 years since 2009 is 16.7%.
The growth of industrialised cakes during 2013 was similar – 15.8%, however, the segment's revenues were much lower – BRL 767mn. Nevertheless, the
cakes segment is very dynamic, its growth for the five-year period ending in 2013 was 72%.
The forecast for the development of the industrialised bread and cake segment is favourable as both products have not yet reached very high penetration
levels on the domestic market, they accounted for 71% for bread and 45% for cake at the end of 2013.
Demand Evolution (thou t) Consumption per Capita (kg/year)
ABIMA
368
408 418 420 426
29.6 34 34.7 35.4 37.1
2009 2010 2011 2012 2013
Industrialised Bread Industrialised Cake
1.90
2.09 2.12 2.11 2.12
0.15 0.17 0.18 0.18 0.18
2009 2010 2011 2012 2013
Industrialised Bread Industrialised Cake
- 36 - Any redistribution of this information is strictly prohibited.
Copyright © 2014 EMIS, all rights reserved.
Source:
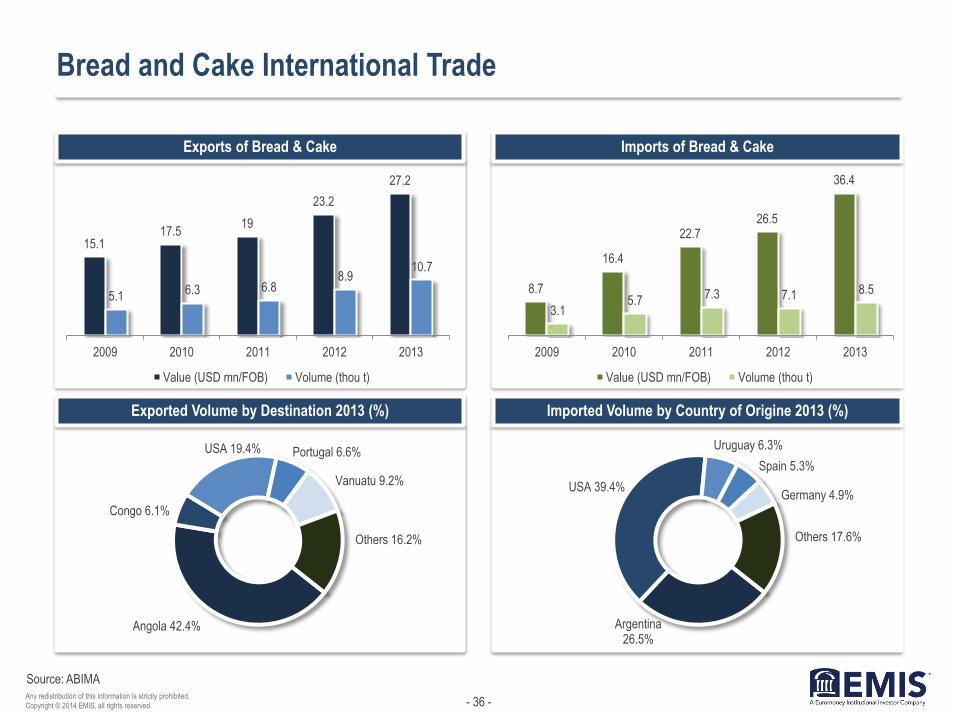
Bread and Cake International Trade
Exports of Bread & Cake
Exported Volume by Destination 2013 (%)
Imports of Bread & Cake
Imported Volume by Country of Origine 2013 (%)
ABIMA
15.1 17.5
19
23.2
27.2
5.1 6.3 6.8
8.9 10.7
2009 2010 2011 2012 2013
Value (USD mn/FOB) Volume (thou t)
8.7
16.4
22.7 26.5
36.4
3.1 5.7
7.3 7.1 8.5
2009 2010 2011 2012 2013
Value (USD mn/FOB) Volume (thou t)
Angola 42.4%
Congo 6.1%
USA 19.4% Portugal 6.6%
Vanuatu 9.2%
Others 16.2%
Argentina 26.5%
USA 39.4%
Uruguay 6.3%
Spain 5.3%
Germany 4.9%
Others 17.6%

- 37 - Any redistribution of this information is strictly prohibited.
Copyright © 2014 EMIS, all rights reserved.
Source:
Biscuits
Production and Revenues
Production by Type 2013 (%)
Production by Region 2013 (%)
Comments
ANIB
Brazil is the second-largest producer of biscuits in the world, after the
United States. In 2013, the production reached 1.27 million tonnes, or
a 2% increase compared to 2012.
The sector's production is mainly used to meet domestic demand.
Despite the fact that the industry occupies the 36th place among
Brazilian exporters, it more than doubled its exported volumes in the
last decade. In 2013, the biscuits exports accounted for USD
155.8mn, 11% increase compared to 2012. The country exports
predominantly to Angola, the United States, Paraguay, Uruguay and
Argentina.
In 2013, the National Association of Biscuit Industry (ANIB) launched
a new brand in order to boost the image of Brazilian biscuits.
1.2 1.24 1.22 1.25 1.27
5.96 6.47 6.8 7.02
7.91
2009 2010 2011 2012 2013
Production (bn t) Reveneu (BRL bn)
North 1.5% Northeast 30.7%
Southeast 45.0%
South 15.0%
Central West 7.8%
Cracker 21.4%
Sandwich Cookies 26.8%
Dry Sweet Biscuits 15.4%
Salted 8.5%
Wafer 8.1%
Donuts 5.9%
Cornflour Biscuits 11.3%
Others 2.6%
- 38 - Any redistribution of this information is strictly prohibited.
Copyright © 2014 EMIS, all rights reserved.
Source:
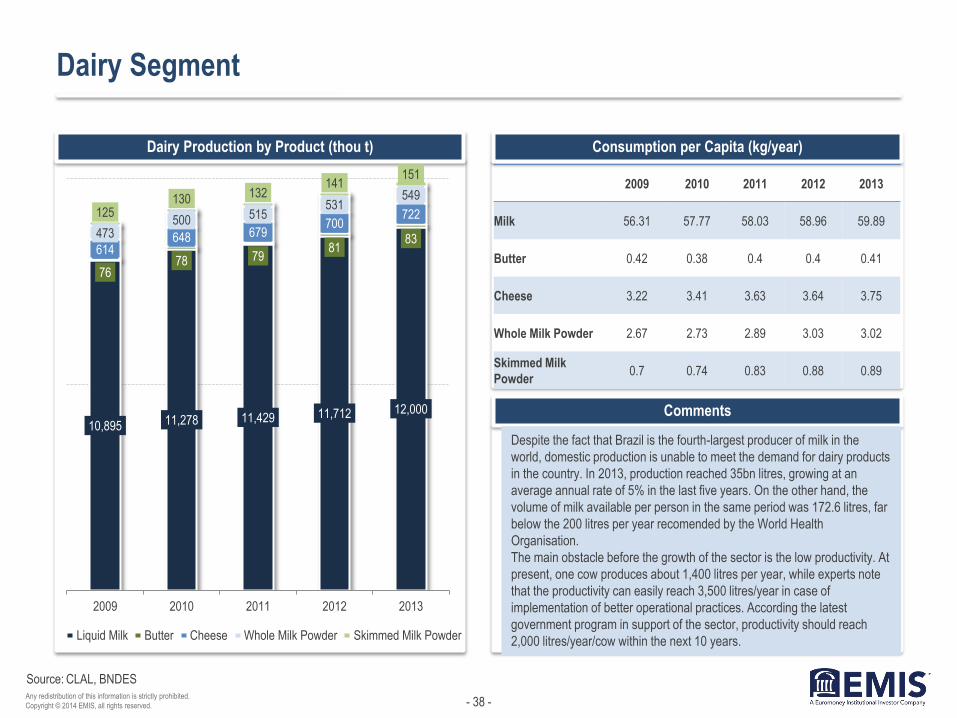
Dairy Segment
Consumption per Capita (kg/year)
Comments
Dairy Production by Product (thou t)
CLAL, BNDES
10,895 11,278 11,429 11,712 12,000
76 78 79
81 83
614 648 679
700 722
473 500 515
531 549
125 130 132
141 151
2009 2010 2011 2012 2013
Liquid Milk Butter Cheese Whole Milk Powder Skimmed Milk Powder
2009 2010 2011 2012 2013
Milk 56.31 57.77 58.03 58.96 59.89
Butter 0.42 0.38 0.4 0.4 0.41
Cheese 3.22 3.41 3.63 3.64 3.75
Whole Milk Powder 2.67 2.73 2.89 3.03 3.02
Skimmed Milk
Powder 0.7 0.74 0.83 0.88 0.89
Despite the fact that Brazil is the fourth-largest producer of milk in the
world, domestic production is unable to meet the demand for dairy products
in the country. In 2013, production reached 35bn litres, growing at an
average annual rate of 5% in the last five years. On the other hand, the
volume of milk available per person in the same period was 172.6 litres, far
below the 200 litres per year recomended by the World Health
Organisation.
The main obstacle before the growth of the sector is the low productivity. At
present, one cow produces about 1,400 litres per year, while experts note
that the productivity can easily reach 3,500 litres/year in case of
implementation of better operational practices. According the latest
government program in support of the sector, productivity should reach
2,000 litres/year/cow within the next 10 years.
- 39 - Any redistribution of this information is strictly prohibited.
Copyright © 2014 EMIS, all rights reserved.
Source:
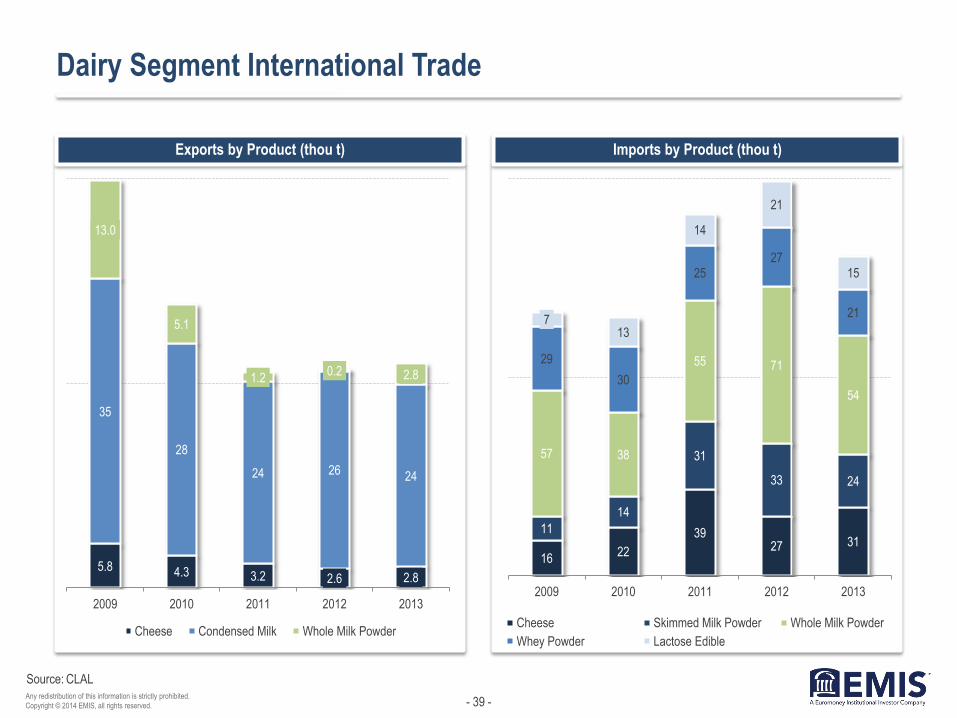
Dairy Segment International Trade
Exports by Product (thou t) Imports by Product (thou t)
CLAL
5.8 4.3 3.2 2.6 2.8
35
28
24 26 24
13.0
5.1
1.2 0.2 2.8
2009 2010 2011 2012 2013
Cheese Condensed Milk Whole Milk Powder
16 22
39 27 31
11
14
31
33 24
57 38
55 71
54
29
30
25 27
21 7
13
14
21
15
2009 2010 2011 2012 2013
Cheese Skimmed Milk Powder Whole Milk Powder
Whey Powder Lactose Edible
- 40 - Any redistribution of this information is strictly prohibited.
Copyright © 2014 EMIS, all rights reserved.
Source:
Comments
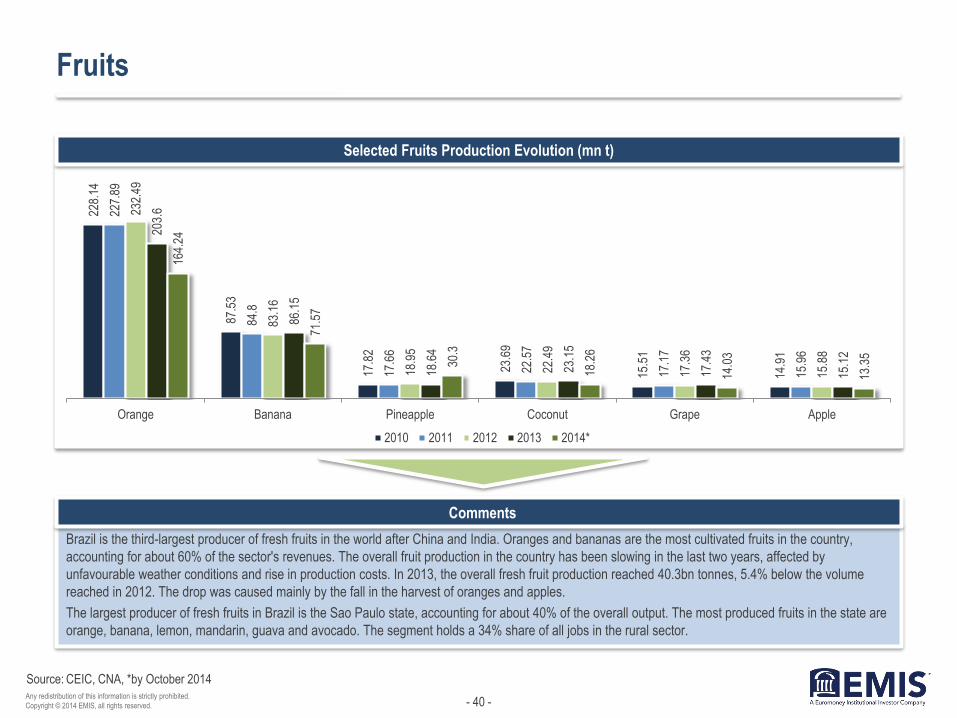
Fruits
Brazil is the third-largest producer of fresh fruits in the world after China and India. Oranges and bananas are the most cultivated fruits in the country,
accounting for about 60% of the sector's revenues. The overall fruit production in the country has been slowing in the last two years, affected by
unfavourable weather conditions and rise in production costs. In 2013, the overall fresh fruit production reached 40.3bn tonnes, 5.4% below the volume
reached in 2012. The drop was caused mainly by the fall in the harvest of oranges and apples.
The largest producer of fresh fruits in Brazil is the Sao Paulo state, accounting for about 40% of the overall output. The most produced fruits in the state are
orange, banana, lemon, mandarin, guava and avocado. The segment holds a 34% share of all jobs in the rural sector.
Selected Fruits Production Evolution (mn t)
CEIC, CNA, *by October 2014
228.
14
87.5
3
17.8
2
23.6
9
15.5
1
14.9
1
227.
89
84.8
17.6
6
22.5
7
17.1
7
15.9
6
232.
49
83.1
6
18.9
5
22.4
9
17.3
6
15.8
8
203.
6
86.1
5
18.6
4
23.1
5
17.4
3
15.1
2
164.
24
71.5
7
30.3
18.2
6
14.0
3
13.3
5
Orange Banana Pineapple Coconut Grape Apple
2010 2011 2012 2013 2014*

- 41 - Any redistribution of this information is strictly prohibited.
Copyright © 2014 EMIS, all rights reserved.
Source:
Fruits International Trade
Fruit Exports by Product 2013 (thou t)
Fruit Exports by Destination 2013 (%)
Fruit Imports by Product 2013 (thou t)
Fruit Imports by Country of Origine 2013 (%)
ITC
1.4
1.0
1.4
4.2
35.9
43.2
85.4
99.2
102.5
129.0
252.0
Others
Citrus fruit & Melon peel
Provisionally preserved fruits & nuts
Frozen fruits & nuts
Brazil nuts, Cashew nuts & Coconuts
Grapes, fresh or dried
Apples, Pears & Quinces
Bananas & Plantains, fresh or dried
Citrus Fruit, fresh or dried
Dates, Figs, Pineapples, Mangoes,…
Melons, Watermelons & Papayas
Netherlands 36.6%
UK 16.3%
USA 12.6% Spain 8.7%
Germany 3.7%
Canada 2.7%
Portugal 2.6%
France 2.1%
Others 14.8%
0.7
1.1
9.9
12.6
19.4
26.7
29.6
55.3
57.5
58.0
283.7
Others
Dates, Figs, Pineapples, Mangoes,…
Frozen fruits & nuts
Nuts nes
Dried fruit
Citrus fruit, fresh or dried
Fruits nes, fresh
Brazil nuts, Cashew nuts & Coconuts
Grapes, fresh or dried
Apricots, Cherries, Peaches,…
Apples, Pears & Quinces
Argentina 37.9%
Chile 25.9%
Spain 9.0% Turkey 4.8%
Portugal 4.8%
USA 3.2%
Italy 3.2%
Others 11.2%

- 42 - Any redistribution of this information is strictly prohibited.
Copyright © 2014 EMIS, all rights reserved.
Source:
Vegetables
Selected Vegetables Production Evolution (mn t)
Comments
Selected Seed Production (mn t)
CEIC, CNA, *by October 2014
45.4
42.7
5
17.5
6
47.2
7
46.2
9
7.39
47.2
7
42.8
7
16.6
6
46.6
1
42.1
3
16.2
9
40.4
8
36.9
9
15.6
2
Tomatoes Potatoes Onion
2010 2011 2012 2013 2014*
137
317
648
816
8,471
160
316
673
879
8,037
138
301
828
879
8,037
142
268
941
979
8,769
124
233
763
872
7,378
Rice
Cassava
Corn
Soybean
Sugarcane
2014*
2013
2012
2011
2010
Production of vegetables in Brazil has been stagnant in the last five
years, with an annual output around 18mn tonnes. Business
representatives explain the lack of dynamism in the segment with the
high production costs, inadequate infrastructure and logistics conditions,
absence of consumption incentives and poor rural expansion policy,
which is focused only in the development of selected cultures.
The production is very fragmented and is mainly in the hands of small
and medium-sized entities, of the type of family farms with an annual
turnover of BRL 60,000. The state of Sao Paulo is the largest vegetables
producer in the country with a share of more than 21% in overall
vegetables production in 2013.

- 43 - Any redistribution of this information is strictly prohibited.
Copyright © 2014 EMIS, all rights reserved.
Source:
Vegetables International Trade
Vegetables Exports by Product 2013 (thou t)
Vegetables Exports by Destination 2013 (%)
Vegetables Imports by Product 2013 (thou t)
Vegetables Imports by Country of Origin 2013 (%)
ITC
0.6
1.5
2.0
3.0
3.6
5.0
35.4
Others
Tomatoes
Potatoes
Vegetables nes, fresh or chilled
Onions, Garlic & Leeks, fresh or chilled
Manioc, Arrowroot Salem (yams)
Dried Vegetables, shelled
Egypt 30.4%
India 17.5%
Uruguay 8.4%
USA 7.5% UK 5.2%
Pakistan 4.6%
Germany 4.4%
Argentina 3.4%
Others 18.6%
1.0
1.5
11.3
16.6
18.9
21.4
29.2
373.2
444.2
Others
Vegetables nes, fresh or chilled
Manioc, Arrowroot Salem (yams)
Vegetables, provisionally preserved…
Frozen Vegetables
Dried Vegetables
Potatoes
Dried Vegetables, shelled
Onions, Garlic & Leeks, fresh or chilled
China 47.8%
Argentina 34.0%
Bolivia 3.5%
Canada 2.9%
Netherlands 2.4%
Spain 1.5%
France 1.3%
Others 6.5%
- 44 - Any redistribution of this information is strictly prohibited.
Copyright © 2014 EMIS, all rights reserved.
III. Beverages
- 45 - Any redistribution of this information is strictly prohibited.
Copyright © 2014 EMIS, all rights reserved.
Source:
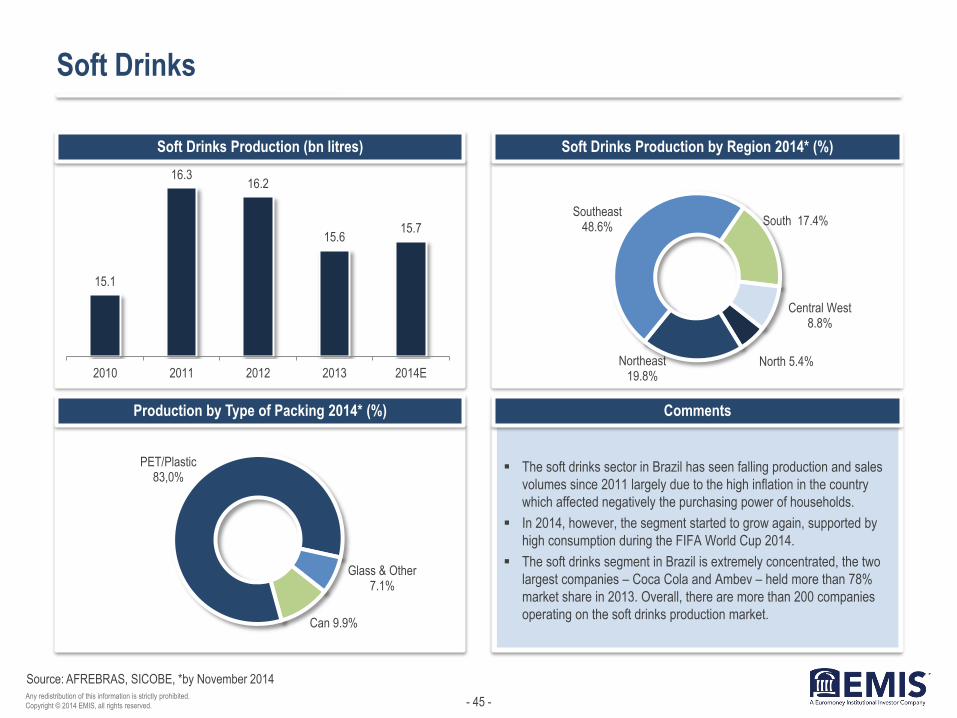
Soft Drinks
Soft Drinks Production (bn litres)
Production by Type of Packing 2014* (%)
Soft Drinks Production by Region 2014* (%)
Comments
AFREBRAS, SICOBE, *by November 2014
The soft drinks sector in Brazil has seen falling production and sales
volumes since 2011 largely due to the high inflation in the country
which affected negatively the purchasing power of households.
In 2014, however, the segment started to grow again, supported by
high consumption during the FIFA World Cup 2014.
The soft drinks segment in Brazil is extremely concentrated, the two
largest companies – Coca Cola and Ambev – held more than 78%
market share in 2013. Overall, there are more than 200 companies
operating on the soft drinks production market.
15.1
16.3 16.2
15.6 15.7
2010 2011 2012 2013 2014ENorth 5.4% Northeast
19.8%
Southeast 48.6% South 17.4%
Central West 8.8%
Can 9.9%
PET/Plastic 83,0%
Glass & Other 7.1%
- 46 - Any redistribution of this information is strictly prohibited.
Copyright © 2014 EMIS, all rights reserved.
Source:
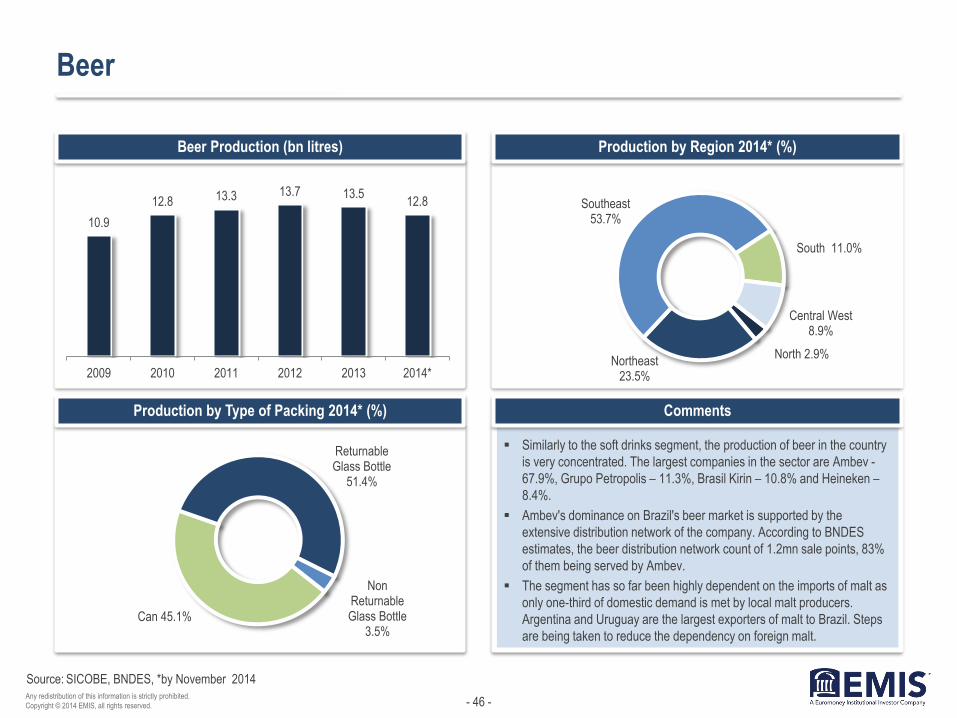
Beer
Beer Production (bn litres)
Production by Type of Packing 2014* (%)
Production by Region 2014* (%)
Comments
SICOBE, BNDES, *by November 2014
Similarly to the soft drinks segment, the production of beer in the country
is very concentrated. The largest companies in the sector are Ambev -
67.9%, Grupo Petropolis – 11.3%, Brasil Kirin – 10.8% and Heineken –
8.4%.
Ambev's dominance on Brazil's beer market is supported by the
extensive distribution network of the company. According to BNDES
estimates, the beer distribution network count of 1.2mn sale points, 83%
of them being served by Ambev.
The segment has so far been highly dependent on the imports of malt as
only one-third of domestic demand is met by local malt producers.
Argentina and Uruguay are the largest exporters of malt to Brazil. Steps
are being taken to reduce the dependency on foreign malt.
10.9
12.8 13.3 13.7 13.5 12.8
2009 2010 2011 2012 2013 2014*
North 2.9% Northeast
23.5%
Southeast 53.7%
South 11.0%
Central West 8.9%
Can 45.1%
Returnable Glass Bottle
51.4%
Non Returnable Glass Bottle
3.5%

- 47 - Any redistribution of this information is strictly prohibited.
Copyright © 2014 EMIS, all rights reserved.
Source:
Orange Juice
Processed Volumes of Oranges per Season (mn bxs)
Oranges Production (mn bxs)
Centro de Citricultura, CEPEA, 1 box ≈ 40.8kg
264.86 251.11
398.03
301.69
240 258
2009/2010 2010/2011 2011/2012 2012/2013 2013/2014 2014/2015
355.4
297.5
428 385.4
289.9 308.8
2009/2010 2010/2011 2011/2012 2012/2013 2013/2014 2014/2015
Brazil is the world's largest producer and exporter of
orange juice, accounting for more than half of the global
output. The country exports more than 90% of the juice it
produces.
However, since 2011, the sector has been facing falling
production and exports volumes, which contributes
significantly to the overall slowdown of Brazilian economy.
For instance, the sector's exports have fallen by more
than 15% in the last 10 years since 2003, and the forecast
for 2014 is also not positive.
There are two main reasons behind the slowdown. The
first one is the decrease of global consumption,
predominantly in the leading markets – the United States
and Europe. In addition, the production costs in Brazil
have increased significantly in the last few years, mainly
the costs of labour, land lease, pesticides and fertilisers.
As a consequence, only for the two-year period between
2012 and 2013, in the state of Sao Paulo, the largest
producer of oranges in the country, 4,200 orange
producers left the sector, 80% of whom were small-sized
producers.
Additional challenge for the small and medium-sized
independent orange producers in the country is the
increasing share of fully integrated orange juice producers
on the market.

- 48 - Any redistribution of this information is strictly prohibited.
Copyright © 2014 EMIS, all rights reserved.
Source:
Orange Juice Exports Key Indicators
Orange Juice Exports Evolution (USD mn/FOB)
Exports by Destination 2014* (%)
Exports Segmentation, January - December (thou t)
CitrusBR, *by October 2014, **by November 2014
170.0
172.3
188.7
177.0
200.0
159.8
553.5
558.5
522.3
436.1
445.5
304.9
524.2
424.3
387.3
405.1
520.6
430.9
934.8
947.4
1038
973.8
1099.8
878.7
1,247.7
1,155.1
1,098.4
1,018.3
1,166.0
895.6
2009
2010
2011
2012
2013
2014**
FCOJ Equivalent NFC FCOJ
Other Orange Juice NFC converted in FCOJ
1,619.2 1,774.8
2,376.2 2,276.4 2,295.4
1,542.8
2009 2010 2011 2012 2013 2014*
EU 62.6%
USA 19.5%
Japan 5.9%
China 3.9%
Switzerland 2.0%
Others 6.0%
- 49 - Any redistribution of this information is strictly prohibited.
Copyright © 2014 EMIS, all rights reserved.
Comments
Source:
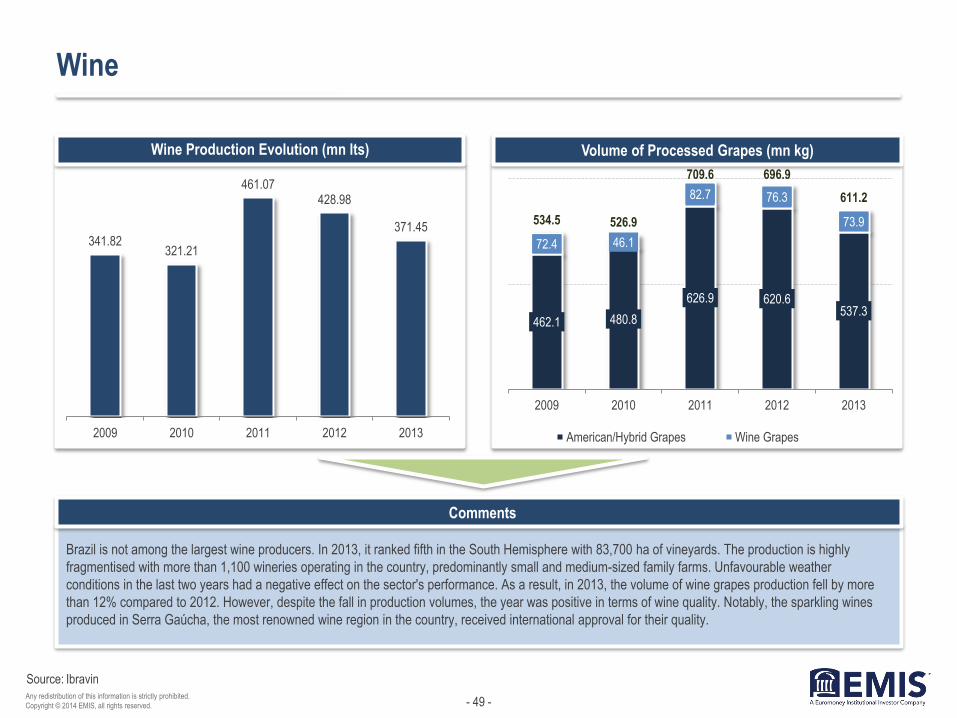
Wine
Brazil is not among the largest wine producers. In 2013, it ranked fifth in the South Hemisphere with 83,700 ha of vineyards. The production is highly
fragmentised with more than 1,100 wineries operating in the country, predominantly small and medium-sized family farms. Unfavourable weather
conditions in the last two years had a negative effect on the sector's performance. As a result, in 2013, the volume of wine grapes production fell by more
than 12% compared to 2012. However, despite the fall in production volumes, the year was positive in terms of wine quality. Notably, the sparkling wines
produced in Serra Gaúcha, the most renowned wine region in the country, received international approval for their quality.
Wine Production Evolution (mn lts) Volume of Processed Grapes (mn kg)
Ibravin
341.82 321.21
461.07 428.98
371.45
2009 2010 2011 2012 2013
462.1 480.8
626.9 620.6 537.3
72.4 46.1
82.7 76.3
73.9 534.5 526.9
709.6 696.9
611.2
2009 2010 2011 2012 2013
American/Hybrid Grapes Wine Grapes

- 50 - Any redistribution of this information is strictly prohibited.
Copyright © 2014 EMIS, all rights reserved.
Source:
Wine Sales in Brazil
Fine Wines Sales Evolution (mn lts) Table Wine Sales Evolution (mn lts)
Ibravin
4.8 4.5 4.7 4.4 4.6
0.2 0.2 0.2 0.1 0.2
13.0 13.6 14.7
14.2 15.3
18.0 18.3
19.6 18.7
20.1
2009 2010 2011 2012 2013
White Rose Red
29.4 29.6 32.1 30.1 29.3
2.3 2.0 1.7 1.7 1.8
190.4 183.4 196.3
173.6 181.0
222.1 215.0
230.1
205.4 212.1
2009 2010 2011 2012 2013
White Rose Red

- 51 - Any redistribution of this information is strictly prohibited.
Copyright © 2014 EMIS, all rights reserved.
Source:
Wine International Trade
Exports of Wine and Sparkling Wine (USD thou/FOB)
Imports of Wine and Sparkling Wine (mn lts)
Exports by Country of Destination 1H2013 (%)
Imports by Country of Origine 2013 (%)
Ibravin, * - estimates
2,571.6
4,117.9 4,453.5 4,383.5
4,014.4
2009 2010 2011 2012 2013* USA 23%
Paraguay 27%
Colombia 14% Germany 6%
UK 4%
China 2%
Netherlands 4%
Others 20%
59.1
75.3 77.6 79.5 72.2
2009 2010 2011 2012 2013 Chile 39.3%
Argentina 18.6%
Italy 12.7% France 6.5%
Portugal 12.9%
Others 10.0%

- 52 - Any redistribution of this information is strictly prohibited.
Copyright © 2014 EMIS, all rights reserved.
IV. Major Players
- 53 - Any redistribution of this information is strictly prohibited.
Copyright © 2014 EMIS, all rights reserved.
Source:
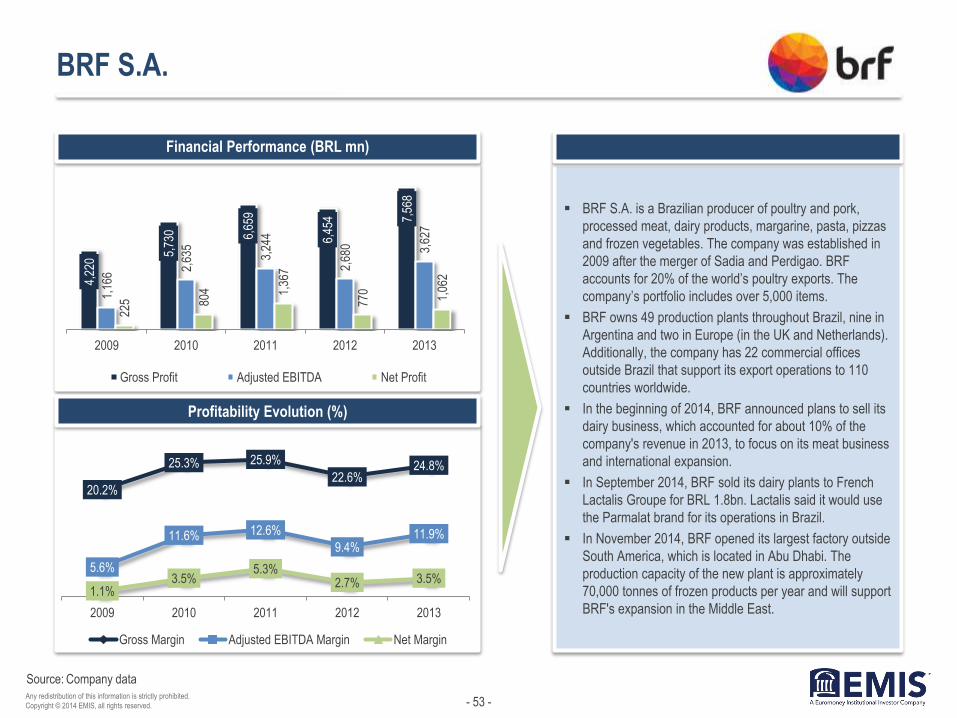
BRF S.A.
Financial Performance (BRL mn)
BRF S.A. is a Brazilian producer of poultry and pork,
processed meat, dairy products, margarine, pasta, pizzas
and frozen vegetables. The company was established in
2009 after the merger of Sadia and Perdigao. BRF
accounts for 20% of the world’s poultry exports. The
company’s portfolio includes over 5,000 items.
BRF owns 49 production plants throughout Brazil, nine in
Argentina and two in Europe (in the UK and Netherlands).
Additionally, the company has 22 commercial offices
outside Brazil that support its export operations to 110
countries worldwide.
In the beginning of 2014, BRF announced plans to sell its
dairy business, which accounted for about 10% of the
company's revenue in 2013, to focus on its meat business
and international expansion.
In September 2014, BRF sold its dairy plants to French
Lactalis Groupe for BRL 1.8bn. Lactalis said it would use
the Parmalat brand for its operations in Brazil.
In November 2014, BRF opened its largest factory outside
South America, which is located in Abu Dhabi. The
production capacity of the new plant is approximately
70,000 tonnes of frozen products per year and will support
BRF's expansion in the Middle East.
Profitability Evolution (%)
Company data
4,22
0
5,73
0 6,65
9
6,45
4 7,56
8
1,16
6
2,63
5
3,24
4
2,68
0 3,62
7
225 80
4 1,36
7
770
1,06
2
2009 2010 2011 2012 2013
Gross Profit Adjusted EBITDA Net Profit
20.2%
25.3% 25.9%
22.6% 24.8%
5.6%
11.6% 12.6%
9.4% 11.9%
1.1% 3.5%
5.3% 2.7% 3.5%
2009 2010 2011 2012 2013
Gross Margin Adjusted EBITDA Margin Net Margin
- 54 - Any redistribution of this information is strictly prohibited.
Copyright © 2014 EMIS, all rights reserved.
Source:
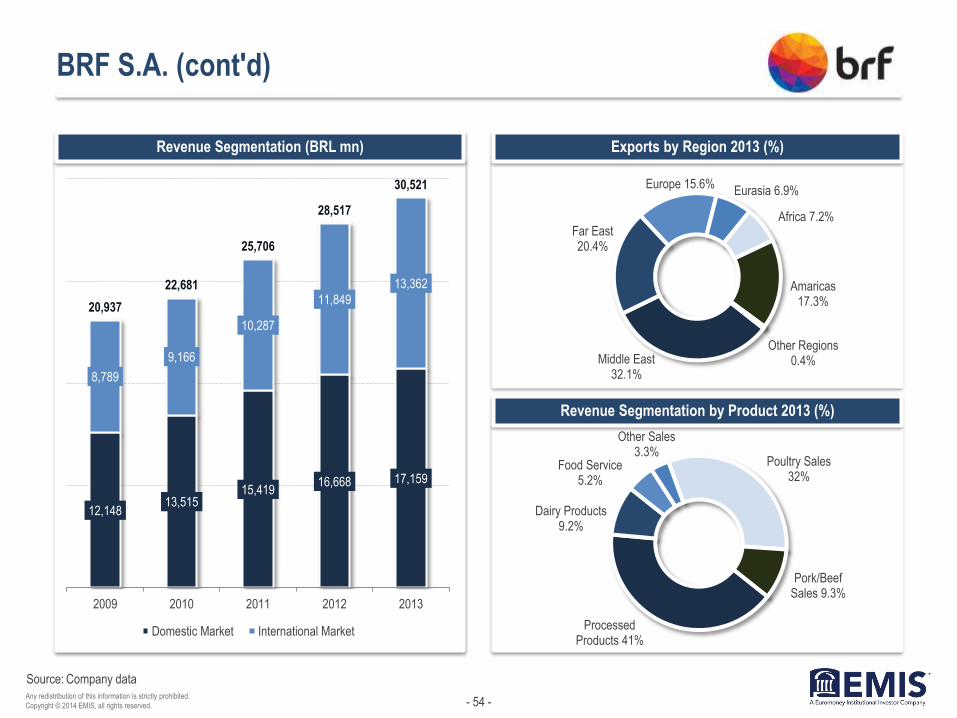
BRF S.A. (cont'd)
Exports by Region 2013 (%)
Revenue Segmentation by Product 2013 (%)
Revenue Segmentation (BRL mn)
Company data
12,148 13,515
15,419 16,668 17,159
8,789
9,166
10,287
11,849
13,362
20,937
22,681
25,706
28,517
30,521
2009 2010 2011 2012 2013
Domestic Market International Market
Middle East 32.1%
Far East 20.4%
Europe 15.6% Eurasia 6.9%
Africa 7.2%
Amaricas 17.3%
Other Regions 0.4%
Processed Products 41%
Dairy Products 9.2%
Food Service 5.2%
Other Sales 3.3%
Poultry Sales 32%
Pork/Beef Sales 9.3%
- 55 - Any redistribution of this information is strictly prohibited.
Copyright © 2014 EMIS, all rights reserved.
Source:
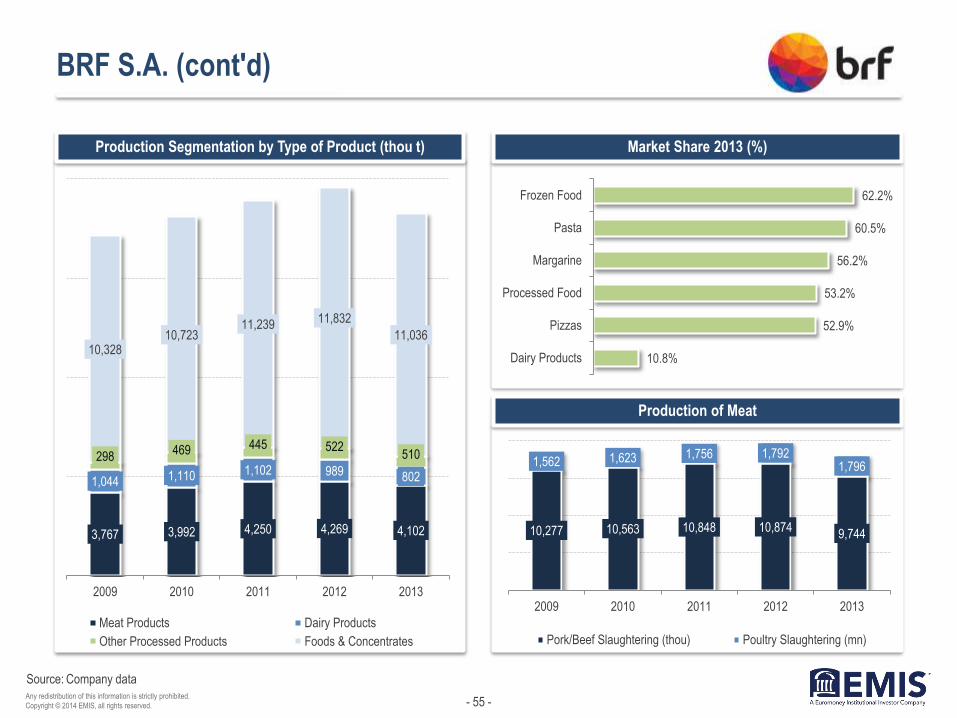
BRF S.A. (cont'd)
Market Share 2013 (%)
Production of Meat
Production Segmentation by Type of Product (thou t)
Company data
3,767 3,992 4,250 4,269 4,102
1,044 1,110 1,102 989 802
298 469 445 522
510
10,328 10,723
11,239 11,832
11,036
2009 2010 2011 2012 2013
Meat Products Dairy Products
Other Processed Products Foods & Concentrates
10.8%
52.9%
53.2%
56.2%
60.5%
62.2%
Dairy Products
Pizzas
Processed Food
Margarine
Pasta
Frozen Food
10,277 10,563 10,848 10,874 9,744
1,562 1,623 1,756 1,792 1,796
2009 2010 2011 2012 2013
Pork/Beef Slaughtering (thou) Poultry Slaughtering (mn)
- 56 - Any redistribution of this information is strictly prohibited.
Copyright © 2014 EMIS, all rights reserved.
Comments
Source:
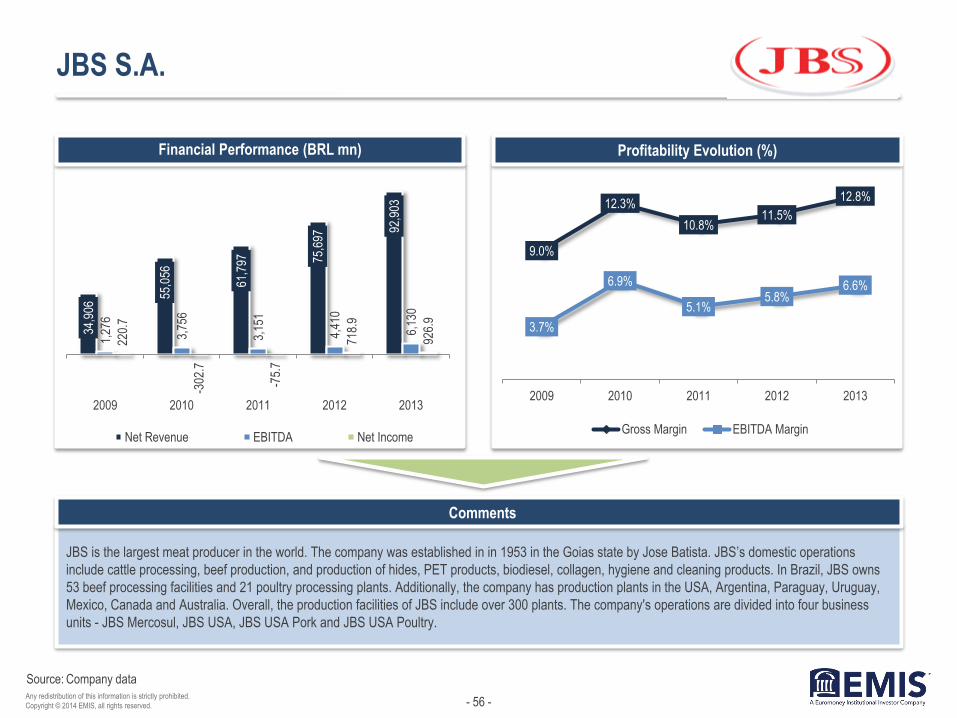
JBS S.A.
JBS is the largest meat producer in the world. The company was established in in 1953 in the Goias state by Jose Batista. JBS’s domestic operations
include cattle processing, beef production, and production of hides, PET products, biodiesel, collagen, hygiene and cleaning products. In Brazil, JBS owns
53 beef processing facilities and 21 poultry processing plants. Additionally, the company has production plants in the USA, Argentina, Paraguay, Uruguay,
Mexico, Canada and Australia. Overall, the production facilities of JBS include over 300 plants. The company's operations are divided into four business
units - JBS Mercosul, JBS USA, JBS USA Pork and JBS USA Poultry.
Financial Performance (BRL mn) Profitability Evolution (%)
Company data
34,9
06 55
,056
61,7
97
75,6
97 92
,903
1,27
6
3,75
6
3,15
1
4,41
0
6,13
0
220.
7
-302
.7
-75.
7
718.
9
926.
9
2009 2010 2011 2012 2013
Net Revenue EBITDA Net Income
9.0%
12.3%
10.8% 11.5%
12.8%
3.7%
6.9%
5.1% 5.8%
6.6%
2009 2010 2011 2012 2013
Gross Margin EBITDA Margin
- 57 - Any redistribution of this information is strictly prohibited.
Copyright © 2014 EMIS, all rights reserved.
Comments
Source:
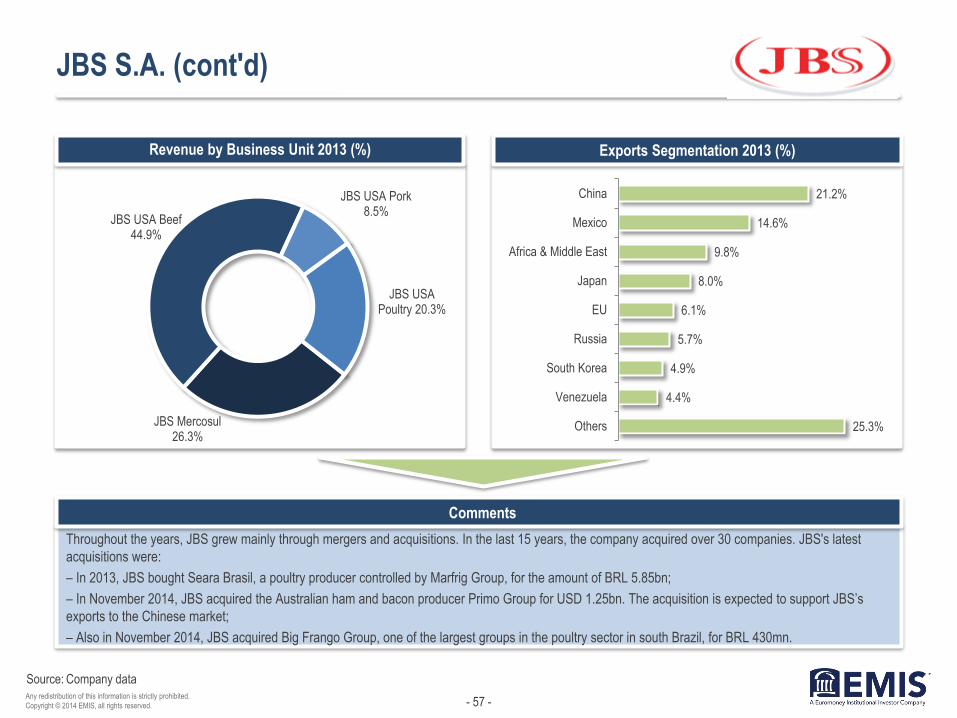
JBS S.A. (cont'd)
Throughout the years, JBS grew mainly through mergers and acquisitions. In the last 15 years, the company acquired over 30 companies. JBS's latest
acquisitions were:
– In 2013, JBS bought Seara Brasil, a poultry producer controlled by Marfrig Group, for the amount of BRL 5.85bn;
– In November 2014, JBS acquired the Australian ham and bacon producer Primo Group for USD 1.25bn. The acquisition is expected to support JBS’s
exports to the Chinese market;
– Also in November 2014, JBS acquired Big Frango Group, one of the largest groups in the poultry sector in south Brazil, for BRL 430mn.
Revenue by Business Unit 2013 (%) Exports Segmentation 2013 (%)
Company data
JBS Mercosul 26.3%
JBS USA Beef 44.9%
JBS USA Pork 8.5%
JBS USA Poultry 20.3%
25.3%
4.4%
4.9%
5.7%
6.1%
8.0%
9.8%
14.6%
21.2%
Others
Venezuela
South Korea
Russia
EU
Japan
Africa & Middle East
Mexico
China
- 58 - Any redistribution of this information is strictly prohibited.
Copyright © 2014 EMIS, all rights reserved.
Comments
Source:
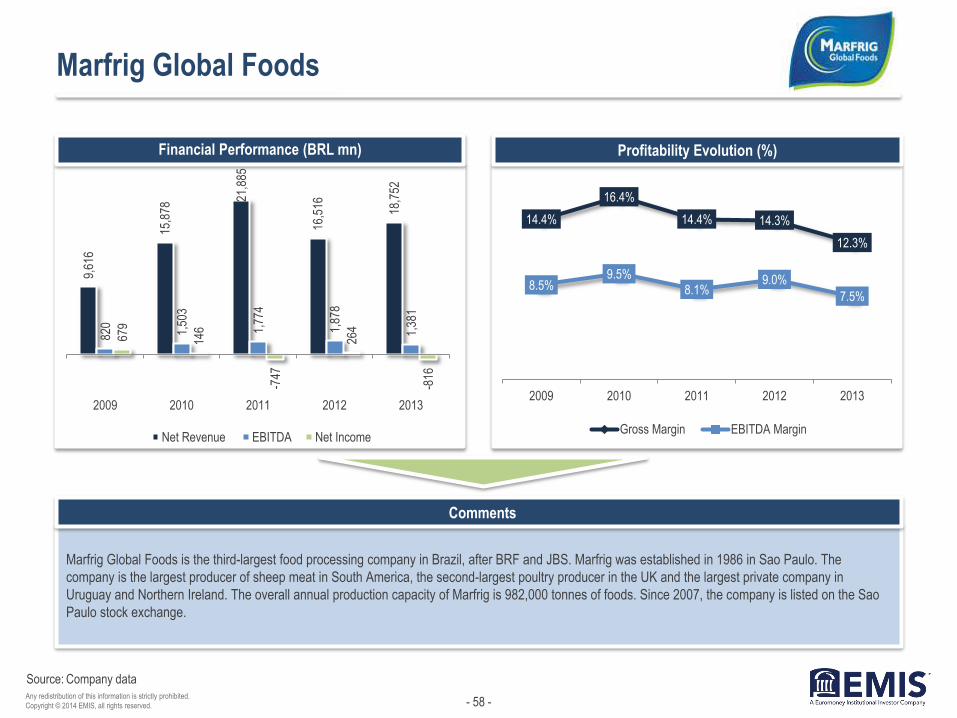
Marfrig Global Foods
Marfrig Global Foods is the third-largest food processing company in Brazil, after BRF and JBS. Marfrig was established in 1986 in Sao Paulo. The
company is the largest producer of sheep meat in South America, the second-largest poultry producer in the UK and the largest private company in
Uruguay and Northern Ireland. The overall annual production capacity of Marfrig is 982,000 tonnes of foods. Since 2007, the company is listed on the Sao
Paulo stock exchange.
Financial Performance (BRL mn) Profitability Evolution (%)
Company data
9,61
6
15,8
78 21
,885
16,5
16
18,7
52
820
1,50
3
1,77
4
1,87
8
1,38
1
679
146
-747
264
-816
2009 2010 2011 2012 2013
Net Revenue EBITDA Net Income
14.4%
16.4%
14.4% 14.3%
12.3%
8.5% 9.5%
8.1% 9.0%
7.5%
2009 2010 2011 2012 2013
Gross Margin EBITDA Margin
- 59 - Any redistribution of this information is strictly prohibited.
Copyright © 2014 EMIS, all rights reserved.
Comments
Source:
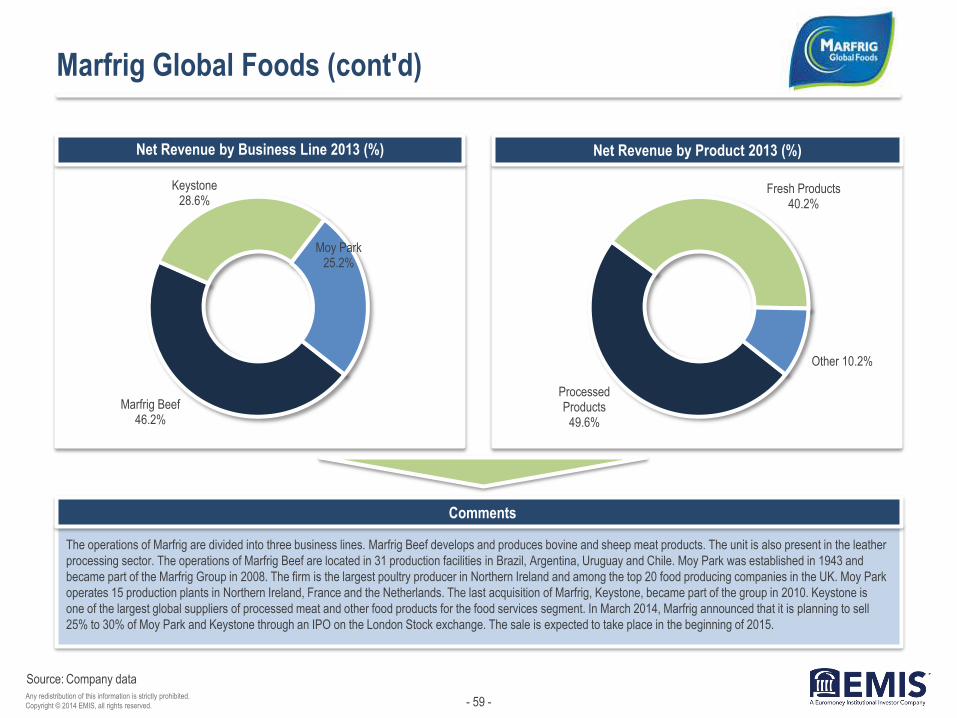
Marfrig Global Foods (cont'd)
The operations of Marfrig are divided into three business lines. Marfrig Beef develops and produces bovine and sheep meat products. The unit is also present in the leather
processing sector. The operations of Marfrig Beef are located in 31 production facilities in Brazil, Argentina, Uruguay and Chile. Moy Park was established in 1943 and
became part of the Marfrig Group in 2008. The firm is the largest poultry producer in Northern Ireland and among the top 20 food producing companies in the UK. Moy Park
operates 15 production plants in Northern Ireland, France and the Netherlands. The last acquisition of Marfrig, Keystone, became part of the group in 2010. Keystone is
one of the largest global suppliers of processed meat and other food products for the food services segment. In March 2014, Marfrig announced that it is planning to sell
25% to 30% of Moy Park and Keystone through an IPO on the London Stock exchange. The sale is expected to take place in the beginning of 2015.
Net Revenue by Business Line 2013 (%) Net Revenue by Product 2013 (%)
Company data
Processed Products
49.6%
Fresh Products 40.2%
Other 10.2%
Marfrig Beef 46.2%
Keystone 28.6%
Moy Park 25.2%
- 60 - Any redistribution of this information is strictly prohibited.
Copyright © 2014 EMIS, all rights reserved.
Source:
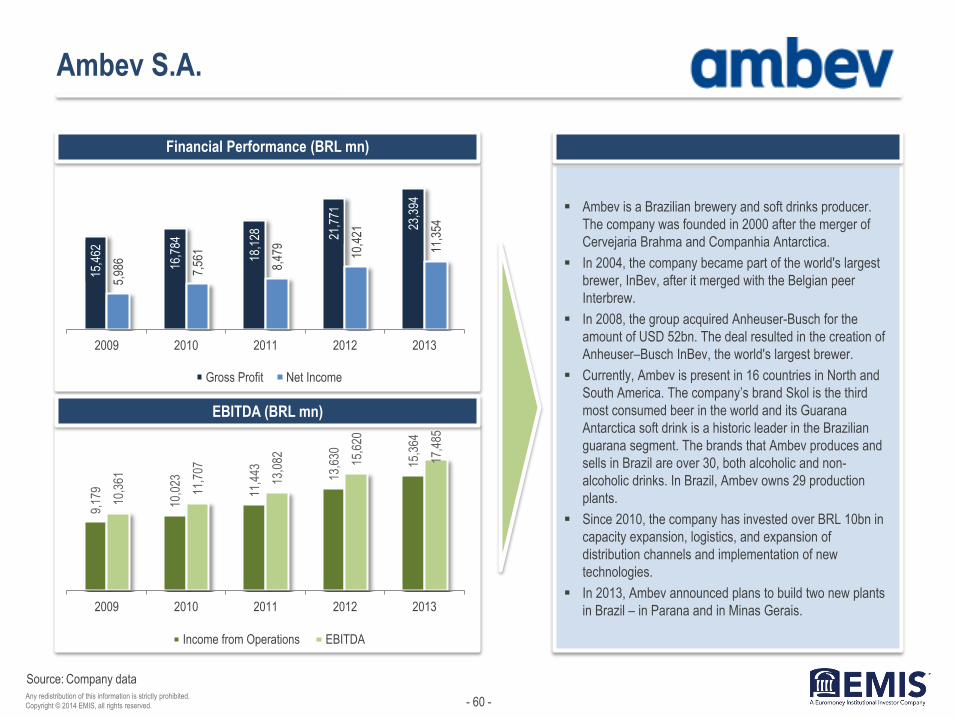
Ambev S.A.
Financial Performance (BRL mn)
Ambev is a Brazilian brewery and soft drinks producer.
The company was founded in 2000 after the merger of
Cervejaria Brahma and Companhia Antarctica.
In 2004, the company became part of the world's largest
brewer, InBev, after it merged with the Belgian peer
Interbrew.
In 2008, the group acquired Anheuser-Busch for the
amount of USD 52bn. The deal resulted in the creation of
Anheuser–Busch InBev, the world's largest brewer.
Currently, Ambev is present in 16 countries in North and
South America. The company’s brand Skol is the third
most consumed beer in the world and its Guarana
Antarctica soft drink is a historic leader in the Brazilian
guarana segment. The brands that Ambev produces and
sells in Brazil are over 30, both alcoholic and non-
alcoholic drinks. In Brazil, Ambev owns 29 production
plants.
Since 2010, the company has invested over BRL 10bn in
capacity expansion, logistics, and expansion of
distribution channels and implementation of new
technologies.
In 2013, Ambev announced plans to build two new plants
in Brazil – in Parana and in Minas Gerais.
EBITDA (BRL mn)
Company data
15,4
62
16,7
84
18,1
28
21,7
71
23,3
94
5,98
6
7,56
1
8,47
9
10,4
21
11,3
54
2009 2010 2011 2012 2013
Gross Profit Net Income
9,17
9
10,0
23
11,4
43
13,6
30
15,3
64
10,3
61
11,7
07
13,0
82
15,6
20
17,4
85
2009 2010 2011 2012 2013
Income from Operations EBITDA
- 61 - Any redistribution of this information is strictly prohibited.
Copyright © 2014 EMIS, all rights reserved.
Source:
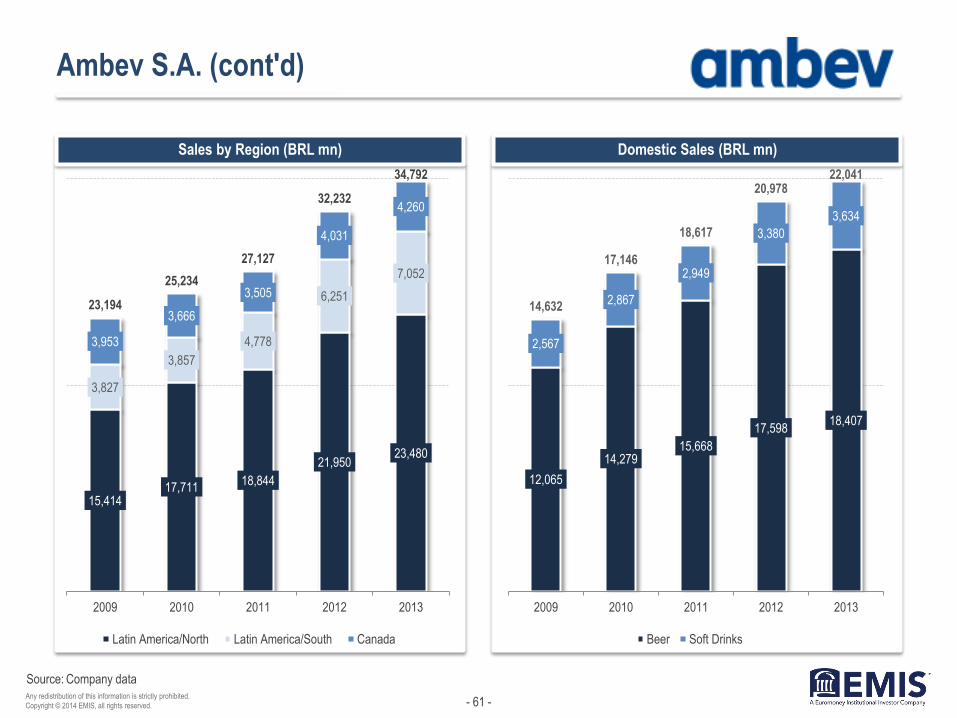
Ambev S.A. (cont'd)
Sales by Region (BRL mn) Domestic Sales (BRL mn)
Company data
15,414 17,711
18,844
21,950 23,480
3,827
3,857
4,778
6,251
7,052
3,953
3,666
3,505
4,031
4,260
23,194
25,234
27,127
32,232
34,792
2009 2010 2011 2012 2013
Latin America/North Latin America/South Canada
12,065
14,279 15,668
17,598 18,407
2,567
2,867
2,949
3,380
3,634
14,632
17,146
18,617
20,978 22,041
2009 2010 2011 2012 2013
Beer Soft Drinks
- 62 - Any redistribution of this information is strictly prohibited.
Copyright © 2014 EMIS, all rights reserved.
Comments
Source:
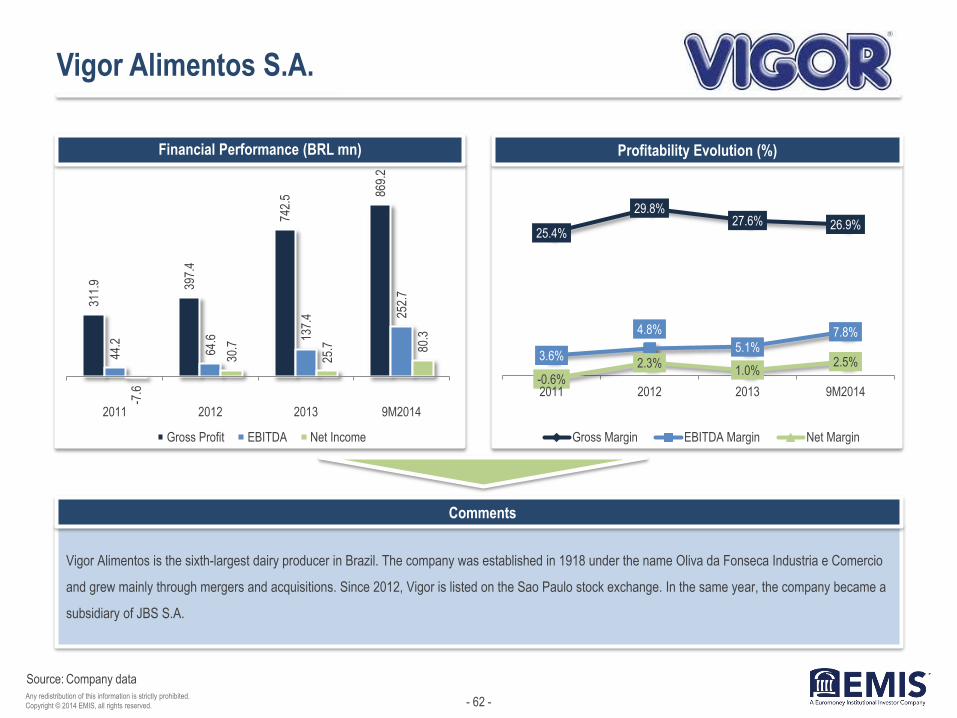
Vigor Alimentos S.A.
Vigor Alimentos is the sixth-largest dairy producer in Brazil. The company was established in 1918 under the name Oliva da Fonseca Industria e Comercio
and grew mainly through mergers and acquisitions. Since 2012, Vigor is listed on the Sao Paulo stock exchange. In the same year, the company became a
subsidiary of JBS S.A.
Financial Performance (BRL mn) Profitability Evolution (%)
Company data
311.
9 397.
4
742.
5 869.
2
44.2
64.6
137.
4 252.
7
-7.6
30.7
25.7
80.3
2011 2012 2013 9M2014
Gross Profit EBITDA Net Income
25.4%
29.8% 27.6% 26.9%
3.6%
4.8%
5.1% 7.8%
-0.6%
2.3% 1.0%
2.5%
2011 2012 2013 9M2014
Gross Margin EBITDA Margin Net Margin

- 63 - Any redistribution of this information is strictly prohibited.
Copyright © 2014 EMIS, all rights reserved.
Source:
Vigor Alimentos S.A. (cont'd)
Sales Segmentation by Product 2013 (%)
Comments
Revenue Segmentation by Product (BRL mn)
Company data
Dairy Products 31.9%
Spreads 21.9%
UHT Milk 23.6%
Powder Milk 13.7%
Others 8.9%
666.9 751.6
1,108.6 1,109.3
341.0 400.4
474.4 498.8
129.1 98.9
285.9 316.5
729.4
1,241.7
92.6 83.0
94.9
69.5
1,229.6 1,333.9
2,693.2
3,235.8
2011 2012 2013 9M2014
Dairy Products Spreads UHT Milk Powder Milk Others
In the beginning of 2013, Vigor announced the acquisition of its
competitor Itambe Alimentos S.A. for BRL 410mn.
Through the deal Vigor increased its presence in the Minas Gerais and
Rio de Janeiro states. The target company has five production plants and
ten distribution centres.
The other 50% of Itambe are controlled by Central Cooperative of Rural
Producers of Minas Gerais (CCPR).
Also in 2013, Vigor announced the incorporation of Laticinios MB. The
acquisition of the company was made in 2012 and increased Vigor's
presence on the parmesan cheese market in Brazil.

- 64 - Any redistribution of this information is strictly prohibited.
Copyright © 2014 EMIS, all rights reserved.
Contact:
Corporate Headquarters
Nestor House
Playhouse Yard
London EC4V 5EX
UK
Voice: +44 207 779 8471
Fax: +44 207 779 8224
Americas Headquarters
225 Park Avenue South
New York, New York 10003
U.S.
Voice: +1 212 610 2900
Fax: +1 212 610 2950
Asia Headquarters
Eucharistic Congress Bldg. No.
III
4th Floor, 5 Convent Street
Mumbai 400 001
India
Voice: +91 22 22881123
Fax: +91 22 22881137
Disclaimer:
The material is based on sources which we believe are reliable, but no warranty, either expressed or implied, is provided in relation to the accuracy or completeness
of the information. The views expressed are our best judgment as of the date of issue and are subject to change without notice. EMIS and Euromoney Institutional
Investor PLC take no responsibility for decisions made on the basis of these opinions.
Any redistribution of this information is strictly prohibited. Copyright © 2014 EMIS, all rights reserved. A Euromoney Institutional Investor company.
About EMIS Insight
EMIS Insight is a unit of EMIS that produces proprietary strategic research and analysis. The service features market overviews, industry trend analysis, legislation
and profiles of the leading sector companies provided by locally-based analysts.
About EMIS
Founded in 1994, EMIS (formerly known as ISI Emerging Markets) was acquired by Euromoney Institutional Investor PLC in 1999. EMIS works from over 15 offices
around the world to deliver electronic information products, by subscription, to institutional customers globally. EMIS provides hard-to-get information covering more
than 100 emerging markets. Its flagship products are EMIS Intelligence and EMIS Professional.
EMIS clients include top investment banks, corporations, law firms, consultants, investment and insurance companies, universities and libraries, multilateral
organisations, and others.