Fomc 20020626 Material
50
Appendix 1: Materials used by Mr. Kos June 25-26, 2002 130 of 179
-
Upload
fraser-federal-reserve-archive -
Category
Documents
-
view
212 -
download
0
Transcript of Fomc 20020626 Material

Appendix 1: Materials used by Mr. Kos
June 25-26, 2002 130 of 179

1.52
2.53
3.54
4.55
5.56
6.5
Sep-02 Dec-02 Mar-03 Jun-03 Sep-03 Dec-03 Mar-04 Jun-04 Sep-04 Dec-041.522.533.544.555.566.5
-43 bps
4.5
4.8
5.1
5.4
5.7
3/1 3/11 3/21 3/31 4/10 4/20 4/30 5/10 5/20 5/30 6/9 6/194.5
4.8
5.1
5.4
5.7
Rates Implied by Eurodollar Futures CurveComparison of March 19, May 6, & June 24, 2002
Page 1
PercentPercent
Source: Bloomberg
March 19, 2002May 6, 2002
-60 bps-70 bps-74 bps
-65ps
-52 bps -45 bps-42 bps
-43 bps
2.6
2.9
3.2
3.5
3.8
3/1 3/11 3/21 3/31 4/10 4/20 4/30 5/10 5/20 5/30 6/9 6/192.6
2.9
3.2
3.5
3.8
10 -Year Treasury YieldMarch 1, 2002 - June 24, 2002
PercentPercent
2 -Year Treasury YieldMarch 1, 2002 - June 24, 2002
FOMC3/19
FOMC3/19
Source: BloombergSource: Bloomberg
PercentFOMC
5/7FOMC
5/7
June 24, 2002
-39ps
28
30
32
34
36
38
40
3/1 3/15 3/29 4/12 4/26 5/10 5/24 6/7 6/2128
30
32
34
36
38
40
Eurodollar Deposit Futures Implied Volatility (December contract)March 1, 2002 to June 24, 2002 PercentPercent
Source: Bloomberg
June 25-26, 2002 131 of 179

88
90
92
94
96
98
100
102
3/1 3/15 3/29 4/12 4/26 5/10 5/24 6/7 6/2188
90
92
94
96
98
100
102
Page 2
1.31 4.80 4.92 4.95 5.01 5.09 5.17 5.34 5.40 6.00 6.510
1
2
3
4
5
6
7
Japan U.S. Germany U.K. France Spain Italy Canada Sweden Australia NewZealand
Global 10-yr. Government Bond YieldsAs of June 24, 2002 PercentPercent
Source: Bloomberg
Source: Bloomberg
6
8
10
12
3/1 3/15 3/29 4/12 4/26 5/10 5/24 6/7 6/216
8
10
12
1- month Euro-Dollar and Dollar-Yen Exchange Rate Option Implied VolatilityMarch 1, 2002 to June 24, 2002 PercentPercent
Source: Bloomberg
Euro-dollar
Dollar-yen
FOMC3/19
FOMC5/7
Index3/1/2002=100
Index3/1/2002=100
U.S. Dollar Versus Selected Foreign CurrenciesMarch 1, 2002 - June 24, 2002
Swiss Franc
Euro
British Pound
Canadian Dollar
Australian Dollar
Yen
June 25-26, 2002 132 of 179

78
82
86
90
94
98
102
106
110
3/1 3/11 3/21 3/31 4/10 4/20 4/30 5/10 5/20 5/30 6/9 6/1978
82
86
90
94
98
102
106
110
Domestic EquitiesMarch 1, 2002 - June 24, 2002
Page 3
80
85
90
95
100
105
110
115
3/1 3/11 3/21 3/31 4/10 4/20 4/30 5/10 5/20 5/30 6/9 6/1980
85
90
95
100
105
110
115
International EquitiesMarch 1, 2002 - June 24, 2002
18
20
22
24
26
28
30
32
34
3/1 3/11 3/21 3/31 4/10 4/20 4/30 5/10 5/20 5/30 6/9 6/1918
20
22
24
26
28
30
32
34
S&P 100 Volatility Index (VIX)March 1, 2002 - June 24, 2002 PercentPercent
Source: Bloomberg
Source: Bloomberg
Source: Bloomberg
Index3/1/02=100
Index3/1/02=100
Index3/1/02=100
Index3/1/02=100
FOMC3/19
FOMC5/7
Dow S&P 500
Nasdaq
FOMC3/19
FOMC5/7Bolsa
Swiss Market Index German DAX
FTSE
FOMC5/7
FOMC3/19
Nikkei
June 25-26, 2002 133 of 179

Page 4
Domestic Credit Spreads to Comparable TreasuriesMarch 1, 2002 to June 24, 2002
40
50
60
70
80
3/1 3/15 3/29 4/12 4/26 5/10 5/24 6/7 6/2140
50
60
70
80
100
120
140
160
180
200
3/1 3/15 3/29 4/12 4/26 5/10 5/24 6/7 6/21100
120
140
160
180
200Basis pointsBasis points Basis points
Source: Bloomberg Source: Bloomberg
10-Year Fannie Mae Benchmark
10-Year US Interest Rate Swaps
A-1 Industrial Corporate
30-yr. Fannie Mae Current Coupon MBS
400
700
1000
1300
1600
3/1 3/15 3/29 4/12 4/26 5/10 5/24 6/7 6/21400
700
1000
1300
1600
U.S. Corporate High Yield, EMBI+ and the Brazilian Sub-ComponentMarch 1, 2002 to June 24, 2002 Basis pointsBasis points
Source: Bloomberg Merrill Lynch High Yield Spread
Brazilian Sub-component of the JP MorganEMBI+ Sovereign Spread
JP Morgan EMBI+ Sovereign Spread
4/23/02 WCOMdowngrade to
Baa2
5/29/02ATT
downgradeto Baa2
5/9/02WCOMdowngrade toHigh Yield
June 25-26, 2002 134 of 179

$ Billions
0
10
20
30
40
50
60
70
80
1996 1997 1998 1999 2000 2001 20020
10
20
30
40
50
60
70
80Net Portfolio Expansion Purchases to Offset Redemptions
$ Billions
CurrentForecast
570
580
590
600
610
620
630
640
650
12/1 1/1 2/1 3/1 4/1 5/1 6/1 7/1 8/1 9/1 10/1 11/1 12/1570
580
590
600
610
620
630
640
650
Currency Component of M1 (excludes vault cash) Seasonally AdjustedDecember 2001 - December 2002
Page 5
$ Billions$ Billions
Total Outright Purchases and Net Soma Expansion1996 - 2002
Actuals
Current Estimates (10% growth throughSeptember, 8% growth through December)
Estimates as of the May FOMC meeting(9% growth over forecast period)
June 25-26, 2002 135 of 179

Appendix 2: Materials used by Mr. Rolnick
June 25-26, 2002 136 of 179

June 25-26, 2002 137 of 179

June 25-26, 2002 138 of 179

June 25-26, 2002 139 of 179
June 25-26, 2002 140 of 179

June 25-26, 2002 141 of 179
June 25-26, 2002 142 of 179

June 25-26, 2002 143 of 179

June 25-26, 2002 144 of 179

June 25-26, 2002 145 of 179

June 25-26, 2002 146 of 179
June 25-26, 2002 147 of 179

June 25-26, 2002 148 of 179

June 25-26, 2002 149 of 179

June 25-26, 2002 150 of 179

June 25-26, 2002 151 of 179

June 25-26, 2002 152 of 179
June 25-26, 2002 153 of 179
Appendix 3: Materials used by Mr. Roberts and Mr. Lebow
June 25-26, 2002 154 of 179

Material for
Board Staff Presentation on Explaining Low Inflation Since the Mid-1990s
Division of Research and Statistics
June 25, 2002
June 25-26, 2002 155 of 179

June 25-26, 2002 156 of 179

Exhibit 2
The FRB/US Model of Inflation Dynamics
• Bt = $ Bt-1 + (1-$) Bte - ( (Ut - Ut
n) + relative price shocks + unit labor costs
B = rate of price inflation
B e = expected rate of price inflation
U = unemployment rate
U n = natural rate of unemployment
$, ( = coefficients
• B e reflects knowledge of the structure of the economy, including the conduct ofmonetary policy.
• How do our factors fit in this model?
< Changes in the conduct of monetary policy alter the influence of U on B e.
< Changes in labor productivity growth affect inflation through unit labor costs.
< Labor market developments shift U n.
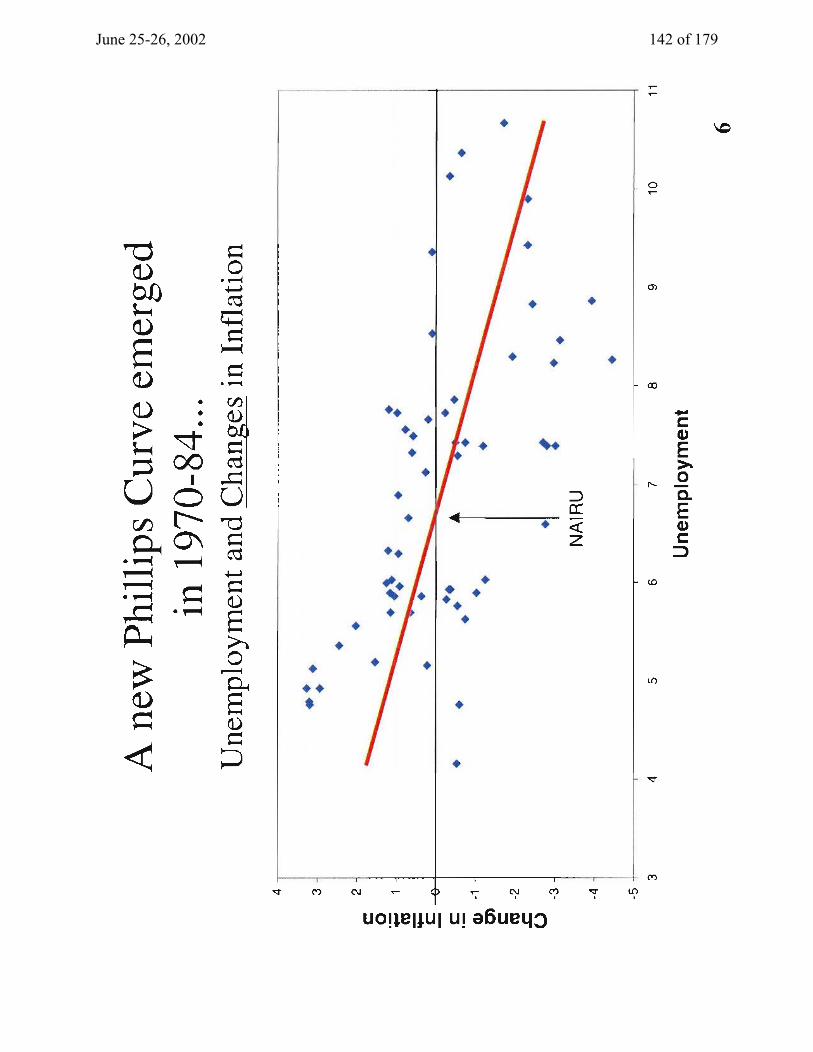
• Movements of (U - U n) explain about 20 percent of the variation of year-to-yearchanges in inflation.
June 25-26, 2002 157 of 179

June 25-26, 2002 158 of 179

June 25-26, 2002 159 of 179

June 25-26, 2002 160 of 179
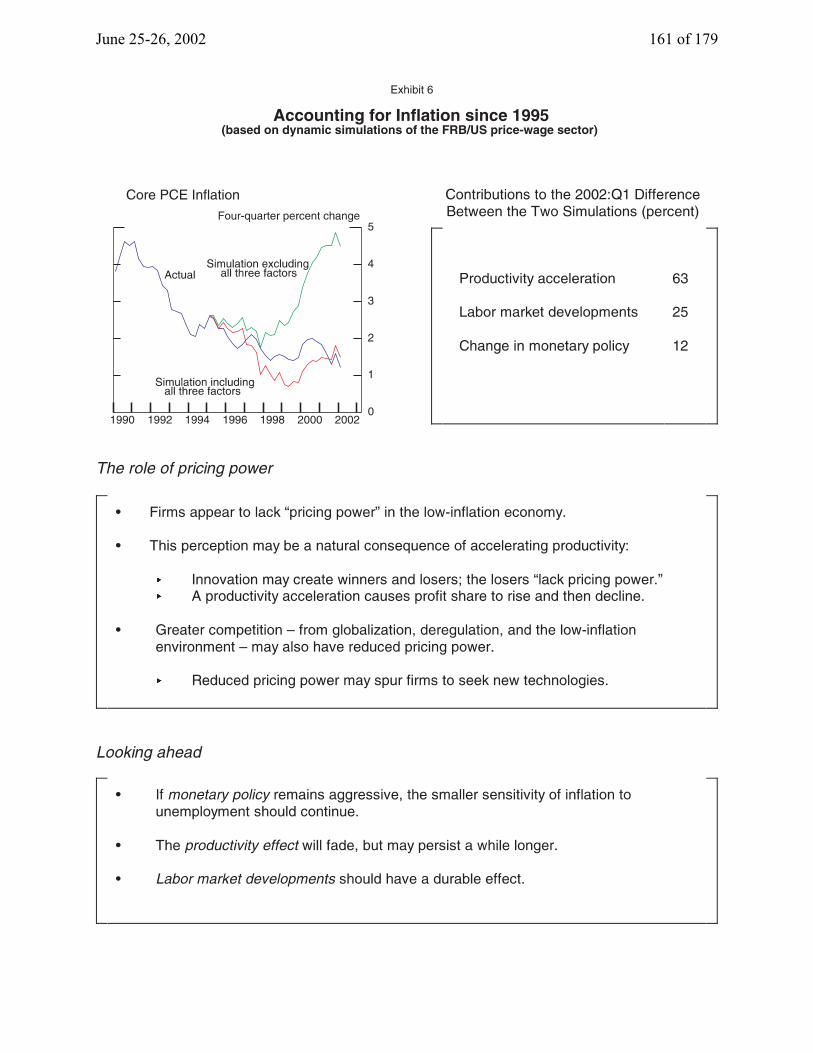
June 25-26, 2002 161 of 179

Appendix 4: Materials used by Mr. Stockton, Mr. Oliner, and Ms. Johnson
June 25-26, 2002 162 of 179

June 25-26, 2002 163 of 179June 25-26, 2002 163 of 179

June 25-26, 2002 164 of 179

June 25-26, 2002 165 of 179

June 25-26, 2002 166 of 179

June 25-26, 2002 167 of 179

June 25-26, 2002 168 of 179

June 25-26, 2002 169 of 179

June 25-26, 2002 170 of 179

June 25-26, 2002 171 of 179

June 25-26, 2002 172 of 179

June 25-26, 2002 173 of 179

June 25-26, 2002 174 of 179

June 25-26, 2002 175 of 179

June 25-26, 2002 176 of 179

June 25-26, 2002 177 of 179

June 25-26, 2002 178 of 179

June 25-26, 2002 179 of 179


