Fomc 19830713 Material
55
APPENDIX
-
Upload
fraser-federal-reserve-archive -
Category
Documents
-
view
226 -
download
0
Transcript of Fomc 19830713 Material

APPENDIX

James L. KichlineJuly 12, 1983
FOMC BRIEFING -- INTRODUCTION
During our presentations this afternoon we will be
referring to the package of charts distributed to you. The first
chart displays the monetary aggregate assumption and associated
interest rates that underlie the staff's projection for the
economy and financial markets. Our monetary policy assumption is
indexed on growth of M2 of around 8-1/2 percent this year, after
making a rough allowance for the effect of shifts of funds into
MMDAs from sources outside M2; for 1984, we have assumed growth
of M2 at 8 percent. These assumptions are consistent with short-
run Alternative B in the Bluebook. The velocity of M2 in the
projection increases somewhat in 1983 and 1984 following the
unusually large decline in 1982. We believe the assumptions and
the forecast are consistent with a little further rise of
interest rates this year -- the 3-month Treasury bill rate
averages 9-1/2 percent in the fourth quarter, about percentage
point above its current level; next year rates are projected to
decline moderately.
The fiscal situation is presented in the next chart.
Staff projections for receipts and outlays indicate actual budget
deficits around $200 billion in both 1983 and 1984 fiscal years.
These deficits on a structural basis rise from that in 1982,

- 2 -
largely because of the personal income tax reductions effective
July of last year and this July. Updated administration budget
figures are not yet available, although it seems likely that the
current fiscal year deficit will be close to that of the staff
and lower in 1984, partly reflecting different economic
assumptions.
Nevertheless, fiscal policy is an expansive force over
the projection period and the actual budget deficits relative to
GNP, shown in the bottom panel, are expected to remain
historically large. At the present time we don't believe there
is much possibility of a major change in the fiscal stance over
the year ahead, given the administration's lack of enthusiasm for
tax increases and deep cuts in defense outlays and the
unwillingness of Congress to slash nondefense programs.
Mr. Zeisel will continue the presentation with a
discussion of recent and prospective domestic economic
developments.
* * * * *

Joseph S. Zeisel
FOMC CHART SHOWJuly 12-13, 1983
The expansion in economic activity has accelerated con-
siderably in recent months, and has taken on most of the character-
istics of a typical postwar cyclical recovery. While much of the
rebound in demand earlier this year was accommodated by reducing
stocks, more recently the sustained strength of sales has generated
a vigorous growth in production and employment.
As is evident in the left hand panels of the following chart,
consumers have played a major role in the recent acceleration in
economic activity. Sales of furniture and appliances have been
particularly strong, associated partly with the recovery in housing.
There has also been a resurgence in auto demand--as shown in the right-
hand panel. Domestic models sold at a 7-1/4 million unit annual rate
in June, up nearly a fifth from the level late last year, and the
strongest pace in almost two years. As the bottom right panel illus-
trates, dealers' stocks are now relatively low and substantial upward
adjustments have been made in scheduled assemblies for the next few
months.
As shown in the next chart, industrial production overall
has continued to rise strongly--by May, output was 7 percent above its
trough 6 months earlier, about in line with its average performance
in postwar recoveries. Available data suggest that production
continued to increase at about this same pace in June.
Consistent with the growth in output, nonfarm payroll
employment has expanded strongly, rising by 350,000 in June, with

-2-
gains widespread. The rebound in factory production earlier in the
year was associated largely with a snapback in the workweek, shown
in the bottom panel; lately, however, employers have been shifting more
to hiring to meet their labor needs, suggesting increased confidence in
continued expansion.
The next chart presents our view of the outlook for growth
through 1984. We now estimate that real GNP rose at about a 7-1/2
percent annual rate in the second quarter--higher than the forecast
of the Commerce flash three weeks ago. Moreover, it appears that the
stimulus to production from rising employment and income will carry
over into the third quarter, with GNP advancing at close to the second-
quarter pace. We expect growth to ease somewhat toward year end and
in 1984, but as indicated in the bottom panel, we are forecasting a
slightly stronger than average second year of recovery--4-1/4 percent.
For the two years combined, the projected expansion of nearly 10
percent is close to postwar cyclical experience.
In the next chart, we have disaggregated GNP growth to high-
light the contribution of the major components. Several elements--
in particular, CCC payments and farm inventories--have been excluded
because their erratic fluctuations have tended to obscure fundamental
movements in GNP.. As is evident from a comparison of the first and
second panels, we expect real gains in private domestic final pur-
chases--that is, consumption, housing and business fixed investment--
to hold up quite well on average in the latter half of this year.
The swing from nonfarm inventory liquidation to restocking, which was
a major factor in GNP growth in the first half, becomes less
-3-
important as the year progresses, but this is offset in part by a
smaller decline in net exports.
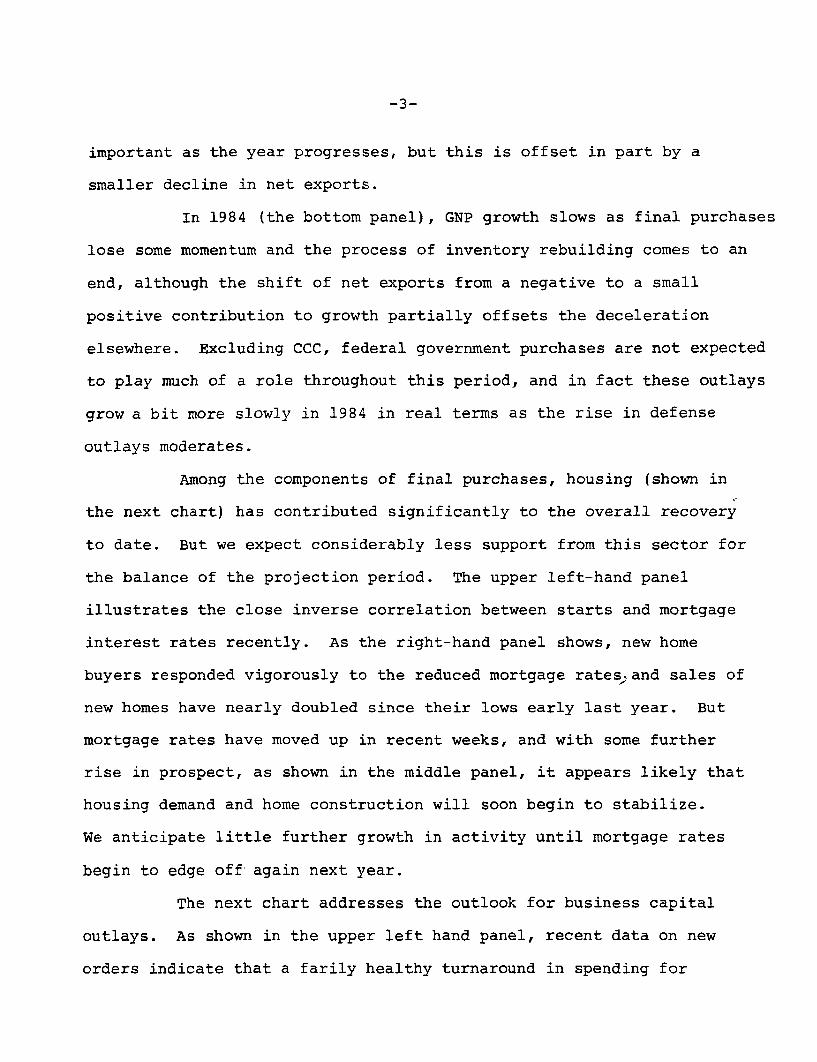
In 1984 (the bottom panel), GNP growth slows as final purchases
lose some momentum and the process of inventory rebuilding comes to an
end, although the shift of net exports from a negative to a small
positive contribution to growth partially offsets the deceleration
elsewhere. Excluding CCC, federal government purchases are not expected
to play much of a role throughout this period, and in fact these outlays
grow a bit more slowly in 1984 in real terms as the rise in defense
outlays moderates.
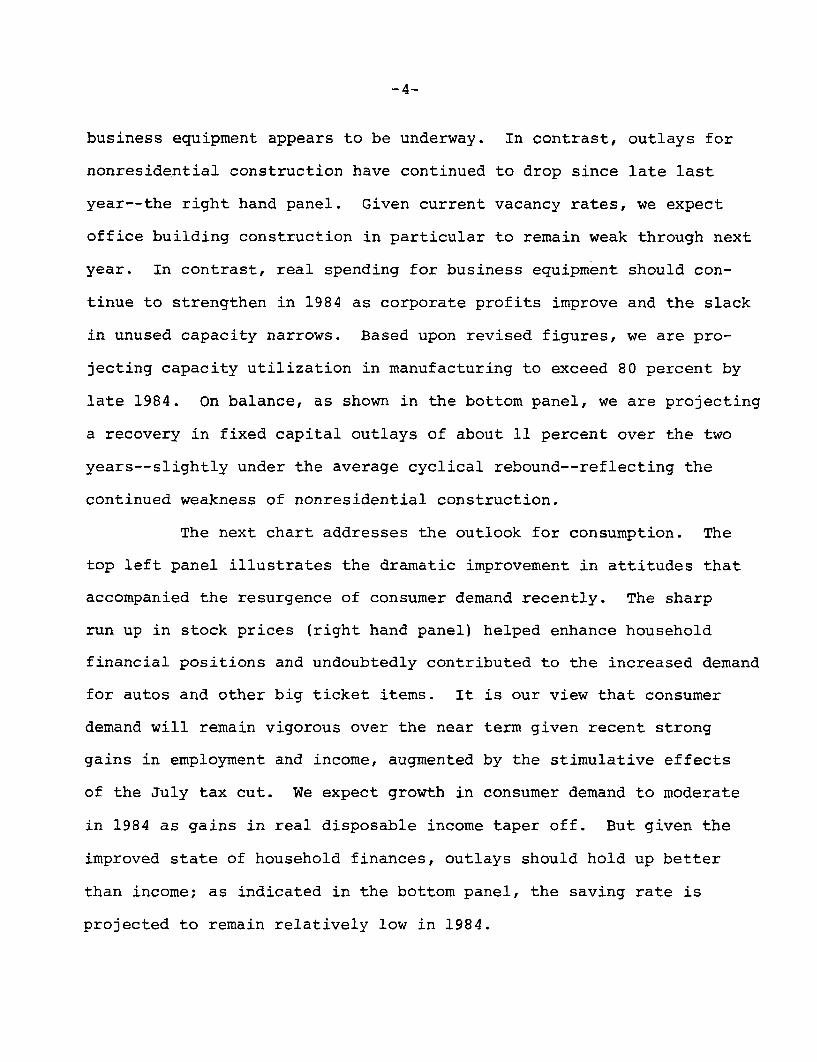
Among the components of final purchases, housing (shown in
the next chart) has contributed significantly to the overall recovery
to date. But we expect considerably less support from this sector for
the balance of the projection period. The upper left-hand panel
illustrates the close inverse correlation between starts and mortgage
interest rates recently. As the right-hand panel shows, new home
buyers responded vigorously to the reduced mortgage rates,and sales of
new homes have nearly doubled since their lows early last year. But
mortgage rates have moved up in recent weeks, and with some further
rise in prospect, as shown in the middle panel, it appears likely that
housing demand and home construction will soon begin to stabilize.
We anticipate little further growth in activity until mortgage rates
begin to edge off again next year.
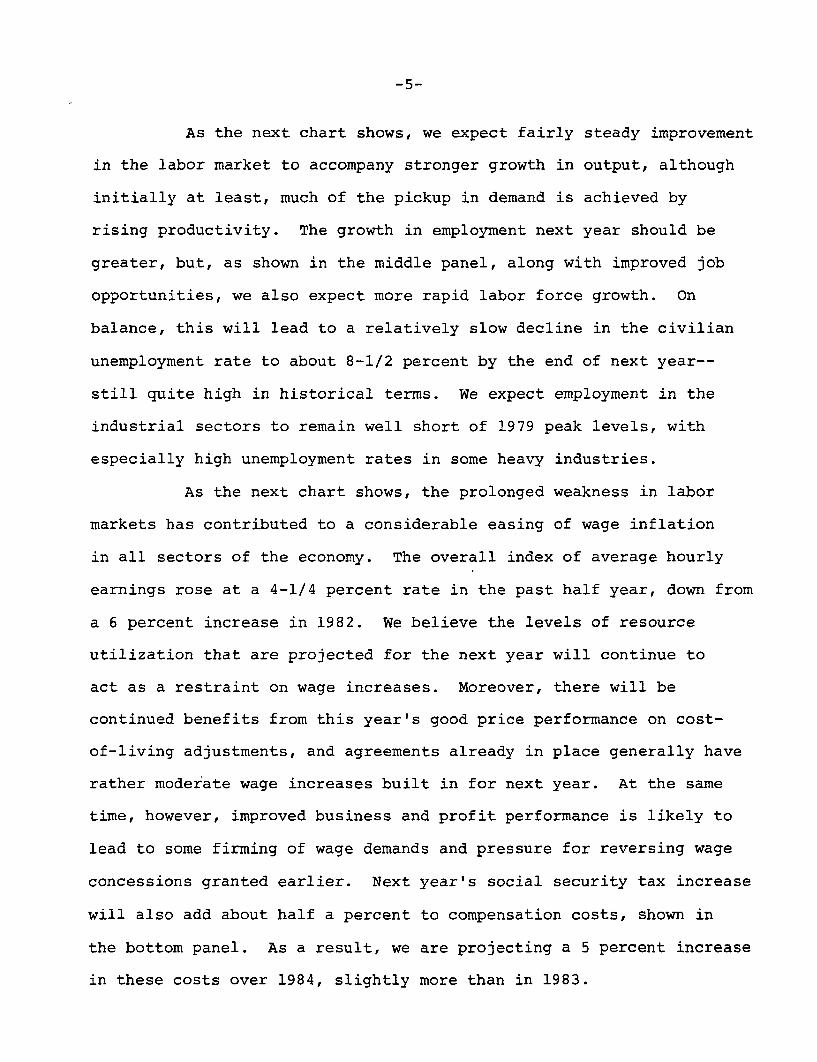
The next chart addresses the outlook for business capital
outlays. As shown in the upper left hand panel, recent data on new
orders indicate that a farily healthy turnaround in spending for
business equipment appears to be underway. In contrast, outlays for
nonresidential construction have continued to drop since late last
year--the right hand panel. Given current vacancy rates, we expect
office building construction in particular to remain weak through next
year. In contrast, real spending for business equipment should con-
tinue to strengthen in 1984 as corporate profits improve and the slack
in unused capacity narrows. Based upon revised figures, we are pro-
jecting capacity utilization in manufacturing to exceed 80 percent by
late 1984. On balance, as shown in the bottom panel, we are projecting
a recovery in fixed capital outlays of about 11 percent over the two
years--slightly under the average cyclical rebound--reflecting the
continued weakness of nonresidential construction.
The next chart addresses the outlook for consumption. The
top left panel illustrates the dramatic improvement in attitudes that
accompanied the resurgence of consumer demand recently. The sharp
run up in stock prices (right hand panel) helped enhance household
financial positions and undoubtedly contributed to the increased demand
for autos and other big ticket items. It is our view that consumer
demand will remain vigorous over the near term given recent strong
gains in employment and income, augmented by the stimulative effects
of the July tax cut. We expect growth in consumer demand to moderate
in 1984 as gains in real disposable income taper off. But given the
improved state of household finances, outlays should hold up better
than income; as indicated in the bottom panel, the saving rate is
projected to remain relatively low in 1984.
As the next chart shows, we expect fairly steady improvement
in the labor market to accompany stronger growth in output, although
initially at least, much of the pickup in demand is achieved by
rising productivity. The growth in employment next year should be
greater, but, as shown in the middle panel, along with improved job
opportunities, we also expect more rapid labor force growth. On
balance, this will lead to a relatively slow decline in the civilian
unemployment rate to about 8-1/2 percent by the end of next year--
still quite high in historical terms. We expect employment in the
industrial sectors to remain well short of 1979 peak levels, with
especially high unemployment rates in some heavy industries.
As the next chart shows, the prolonged weakness in labor
markets has contributed to a considerable easing of wage inflation
in all sectors of the economy. The overall index of average hourly
earnings rose at a 4-1/4 percent rate in the past half year, down from
a 6 percent increase in 1982. We believe the levels of resource
utilization that are projected for the next year will continue to
act as a restraint on wage increases. Moreover, there will be
continued benefits from this year's good price performance on cost-
of-living adjustments, and agreements already in place generally have
rather moderate wage increases built in for next year. At the same
time, however, improved business and profit performance is likely to
lead to some firming of wage demands and pressure for reversing wage
concessions granted earlier. Next year's social security tax increase
will also add about half a percent to compensation costs, shown in
the bottom panel. As a result, we are projecting a 5 percent increase
in these costs over 1984, slightly more than in 1983.

-6-
As the next chart shows, we expect continued strong
cyclical gains in productivity to help in damping inflationary pres-
sures this year. Productivity growth was surprisingly strong last
year in the face of declining output, suggesting that firms may have
made special efforts to cut costs, possibly signaling more lasting
gains in efficiency, and we have adjusted up our estimate of longer-
run productivity trends slightly. As growth in economic activity
moderates somewhat in 1984, we expect gains in productivity to slow,
in rather typical cyclical fashion, but for the year as a whole to
remain slightly above our notion of the long-term trend. In conjunc-
tion with the slight acceleration in compensation, unit labor costs
are projected to rise at about a 3-3/4 percent rate in 1984.
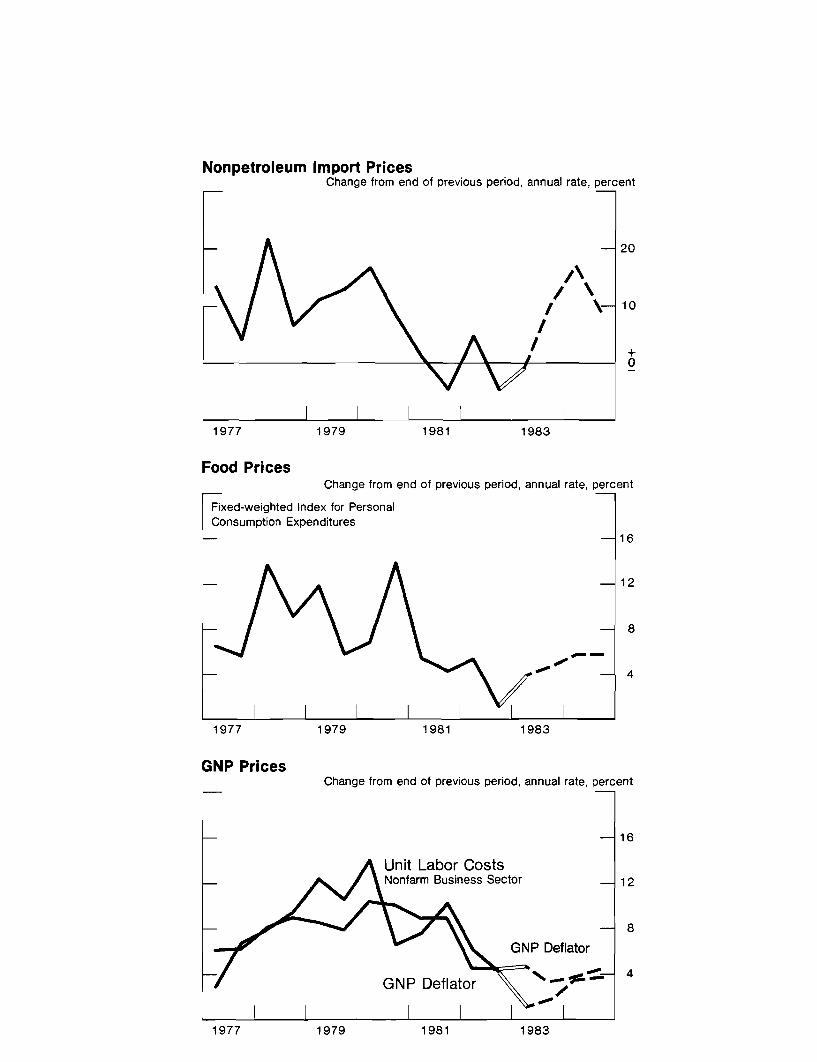
The outlook for inflation is presented in the next chart.
It is clear that the recent moderation of overall price increases
owes something to the strong dollar and its impact on nonpetroleum
import prices. As is shown, import prices rise sharply again in 1984
as a result of the projected depreciation of the dollar. In addition,
food prices next year may be moving up a bit more rapidly in response
to a variety of government efforts aimed at raising crop prices and
boosting farm income. Business is also likely to attempt to improve
profit margins as demand firms. But fundamentally, given prospective
labor cost trends and relative slack in markets, it appears that the
risks of a substantial acceleration in prices are quite small. On
balance, therefore, we are forecasting only slightly higher rates of
inflation in 1984 than in the latter half of this year--a bit over a
4 percent rate of increase in the GNP deflator.
Mr. Truman will now discuss the international outlook.

E.M. TrumanJuly 12, 1983
FOMC CHART SHOW -- INTERNATIONAL DEVELOPMENTS
The first international chart shows that the weighted average
foreign exchange value of the dollar has recently regained its level of
last November. In nominal terms, depicted by the black line in the
chart, the dollar is slightly above its previous peak, but the
relatively better inflation performance in the United States than on
average in other industrial countries has caused a widening gap between
the nominal value of the dollar and its price-adjusted value, shown by
the red line.
It is instructive to note that although the dollar has
appreciated in nominal terms by close to forty percent since the end of
1980, its appreciation has been only slightly more than five percent in
the past 12 months. Moreover, the dollar's appreciation during this
period has been primarily against the currencies of countries with rapid
inflation, such as France and Italy. Against the German mark, the Swiss
franc and the Canadian dollar, the U.S. dollar has been essentially
unchanged in value, while it has depreciated somewhat against the
Japanese yen. Thus, the dollar has remained strong over the past year,
but it has not appreciated substantially further. However, as is shown
in the lower panel, the dollar's continued high level has persisted
despite the elimination (until recently) of the differential between
short-term dollar interest rates and rates on short-term assets
denominated in other currencies.
We expect that over the forecast period movements of interest
rates on foreign currency assets will be essentially similar to

-2-
movements in interest rates on dollar assets. Therefore, the
explanation for the projected depreciation of the dollar shown in the
top panel -- which amounts to about 15 percent over the next six
quarters -- must lie elsewhere. It will not surprise the Committee to
learn that our explanation for the dollar's projected depreciation
continues to lie in the unprecedented U.S. trade and current account
deficits that we are forecasting. One factor contributing to those
deficits is, of course, the continuing effects of the strong dollar
during the past year. However, economic conditions abroad will also
play a role.
The upper left panel of the next chart shows that average
inflation has declined in the foreign industrial countries to a
year-over-year rate of less than six percent. We expect this
deceleration to continue over the forecast period, with an average
inflation rate of around five percent prevailing at the end of 1984.
As can be seen in the upper right panel, industrial production
in the major foreign countries has picked up since the end of last year,
but through early spring that revival was relatively moderate, averaging
less than 1/2 a percent a month.
The lower panel shows that the recent recession in the
industrial countries abroad was less severe, on average, than the
recession in 1974-75. We project that the recovery will also be more
moderate. The contrast reflects, in part, the continuing need for
macroeconomic adjustment in France and Italy. However, we are
projecting a weak recovery in Japan and Germany as well, in large part
because of tight fiscal policies and relatively weak external demand.

-3-
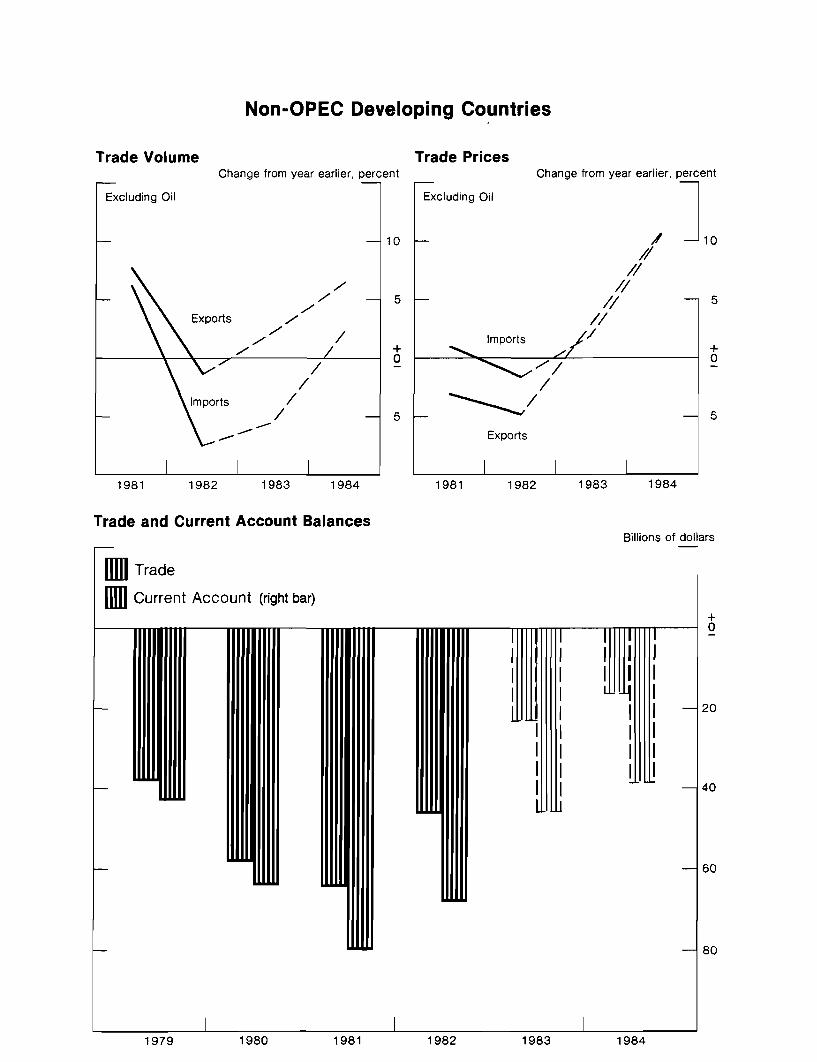
The foreign industrial countries, as well as the United
States, will experience little or no short-run stimulus from exports to
the non-OPEC developing countries during the forecast period. As is
shown in the upper left panel of the next chart, the volume of imports
of these countries is expected to decline in 1983 for the second year in
a row and to record only a moderate increase next year. Meanwhile,
their exports are expected to expand and their terms of trade -- whose
components are shown in the upper right panel -- should stop
deteriorating.
Reflecting these factors, the lower panel shows that the
trade deficit of the non-OPEC developing countries is projected to be
less than half as large in 1984 as it was in 1979. The improvement in
the current account position of these countries will be less dramatic.
The more moderate contraction reflects growing interest payments on
external debts that have been bloated by past deficits and refinanced at
higher interest rates.
The next chart summarizes the impact on U.S. external accounts
of the relatively robust U.S. recovery, slack demand abroad and our
forecast for the dollar. The upper left panel shows the continued
decline this year in the volume of U.S. exports, while the volume of
U.S. imports rises by about 20 percent. Next year, with a pickup of
growth abroad and the projected depreciation of the dollar, the growth
of U.S. exports should turn positive and that of imports should
moderate.
-4-
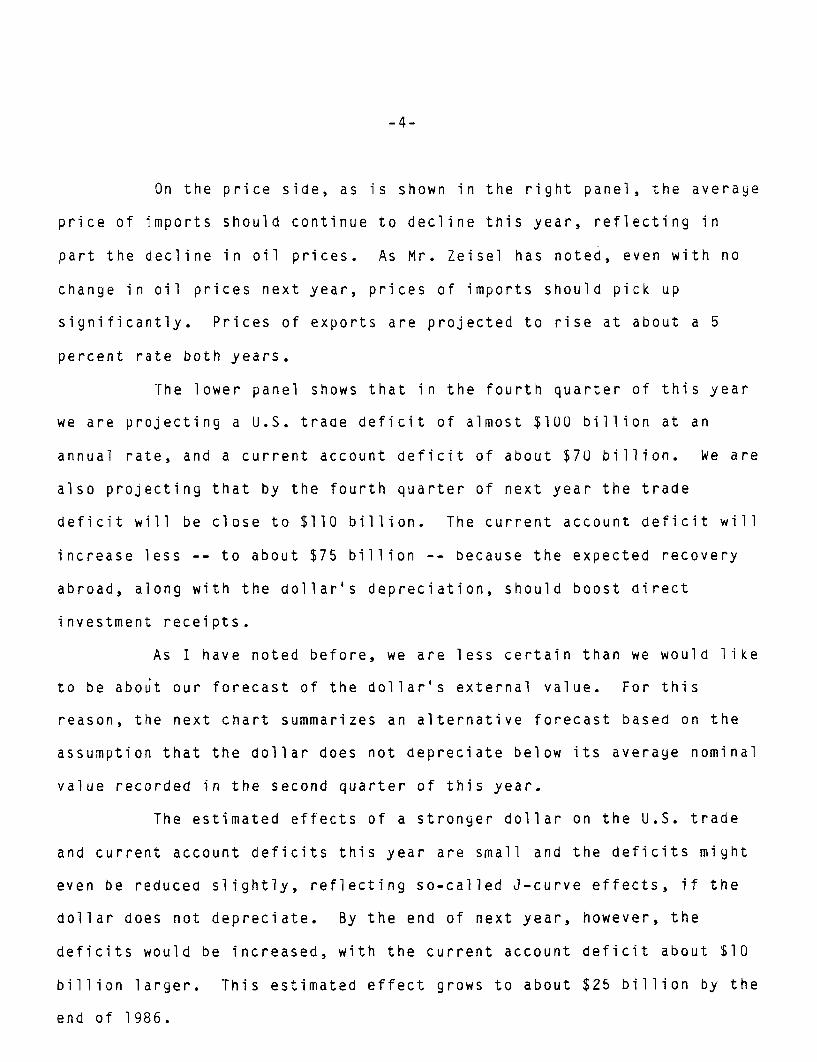
On the price side, as is shown in the right panel, the average
price of imports should continue to decline this year, reflecting in
part the decline in oil prices. As Mr. Zeisel has noted, even with no
change in oil prices next year, prices of imports should pick up
significantly. Prices of exports are projected to rise at about a 5
percent rate both years.
The lower panel shows that in the fourth quarter of this year
we are projecting a U.S. trade deficit of almost $100 billion at an
annual rate, and a current account deficit of about $70 billion. We are
also projecting that by the fourth quarter of next year the trade
deficit will be close to $110 billion. The current account deficit will
increase less -- to about $75 billion -- because the expected recovery
abroad, along with the dollar's depreciation, should boost direct
investment receipts.
As I have noted before, we are less certain than we would like
to be about our forecast of the dollar's external value. For this
reason, the next chart summarizes an alternative forecast based on the
assumption that the dollar does not depreciate below its average nominal
value recorded in the second quarter of this year.
The estimated effects of a stronger dollar on the U.S. trade
and current account deficits this year are small and the deficits might
even be reduced slightly, reflecting so-called J-curve effects, if the
dollar does not depreciate. By the end of next year, however, the
deficits would be increased, with the current account deficit about $10
billion larger. This estimated effect grows to about $25 billion by the
end of 1986.

The effects of a stronger dollar on U.S. real growth and
inflation are somewhat less dramatic. As is shown in the lower
panels, real growth during 1984 would be reduced by about a quarter of
a percent and consumer price inflation would remain at less than 3-1/2
percent instead of rising above 4 percent. The effects on real activity
tend to wash out in later years, but the price level would be about 2
percent lower at the end of 1986.
A continued strong dollar would, of course, have other
implications that are more difficult to quantify. Among these are the
encouragement of protectionism -- here and, in response, abroad -- and
the effects on the debt service burdens of developing countries.
Mr. Prell will now review the domestic financial outlook.

Prell7/12/83
DOMESTIC FINANCIAL DEVELOPMENTS
The next chart presents a broad view of credit flows in the economy.
The inset in the upper panel shows that, in the first half of this year,
the debt of domestic nonfinancial sectors grew a little faster than nominal
GNP. This is a reversal of the usual pattern for the early stages of
economic recovery, but is consistent with our earlier expectations. As is
reflected in the chart, we are projecting that debt growth will outstrip
GNP growth for the year as a whole and again in 1984. We thus see the
credit aggregate growing at about the 10% midpoint of the Committee's 8-1/2
to 11-1/2% range for 1983 and slowing only slightly in 1984. Looking at
the components of that credit growth, what stands out is the behavior of
federal debt, displayed in the bottom panel, absorbing an extraordinarily
large share of the total credit flow as it expands at almost a 20% per
annum rate in 1983-84.
Among the nonfederal sectors, the major increase in credit use this
year has occurred in the household sector. As may be seen in the upper
left panel of the next chart, growth of mortgage and consumer debt has
accelerated sharply, supporting the key elements of strength in final
demand--housing and consumer durables, especially autos. The survey results
depicted in the right panel suggest that there has been a shift in consumers'
attitudes away from the conservative financial posture they had assumed dur-
ing the period of recession and record high interest rates. Despite the
stepped-up borrowing, however, the household sector's financial net worth
has continued to rise, buoyed especially by the surge in stock prices, and,
as indicated in the bottom right panel, consumer loan delinquencies have
remained low while mortgage delinquencies have shown signs of leveling off.

-2-
The financial condition of the business sector also has improved.
The top left panel of the next chart shows the narrowing of the financing
gap faced by corporations--reflecting first massive inventory liquidation
and then the cyclical upturn in profits. As fixed investment gathers
speed next year, the gap is expected to widen despite further sizable
profit gains. Another aspect of reduced pressures on firms recently is
reflected in the right-hand panel, which indicates that, in the aggregate,
interest payments already command a noticeably smaller portion of cash
flows. The securities markets, moreover, have been much more hospitable
to firms seeking long-term funds. The improving economy has brought a
narrowing of quality spreads in bond yields, indicated in the lower left
panel by the yield differential between corporates and Treasuries, and
better profit prospects and lower interest rates have produced a marked
reduction in the cost of equity capital, as reflected here in the earnings-
to-price ratio for the S&P 500. These improvements have been sustained
even through the recent back-up in interest rate levels. Companies have
been able to achieve considerable progress in reducing debt-equity ratios
and, as indicated in the right panel, in lengthening debt structures.
We are projecting, however, that as recovery proceeds next year short-term
borrowing will again take on substantial proportions, bringing a halt to
the balance sheet reliquification.
The next chart focuses on the state and local government sector.
Many states and localities are still wrestling with financial difficulties,
but, as the upper panel shows, in the aggregate a combination of spending
cuts, tax hikes, and cyclical revenue improvements has moved the sector

-3-
back into operating surplus. We are projecting some narrowing of the
surplus in subsequent quarters as building and repair spending picks up
and some tax measures lapse. The credit markets meanwhile have been very
receptive to tax-exempt borrowers, allowing units to sell huge amounts of
bonds for prospective spending purposes and for the refunding of higher
cost debt. As the middle panel indicates, we see a considerable fall-off
in state and local borrowing in the months ahead, owing to the end of the
pre-registration bulge and to the rise in interest rates. This will not,
however, mean any commensurate relief for the markets in terms of basic
rate pressures, since, as the bottom panel shows, much of the money bor-
rowed has been reinvested in other securities--especially Treasuries.
The next chart shows that some key lenders have benefitted along
with borrowers from the cyclical drop in interest rates. Variations in the
frequency of reporting and problems of seasonality complicate the construc-
tion of consistent time series covering all commercial banks. Nonetheless,
if we focus on the data in the boxes, it is fairly clear that the earnings--
especially of the bigger banks--have been boosted by the effects of
declining rates on interest margins. Indeed, the improvement in margins
was great enough to offset the impact of higher loan loss provisions in
the past few quarters. Obviously, though, credit quality remains the
major area of vulnerability for bank earnings, with still considerable
risks of write-offs of both domestic and international loans. For thrift
institutions, interest rates are the critical variable. The thrifts
moved to roughly break-even operating positions in the first quarter,
but no further improvement would seem to be in store over the remainder
of the year, given our rate projection.

James L. KichlineJuly 12, 1983
FOMC CHART SHOW -- CONCLUSION
The top panel of the next chart presents a summary of
the economic projections of Committee members, the staff, and the
administration. The bottom panel shows the ranges of 1983
projections reported to the Congress in February. As indicated
by the median figures for Committee members, the current
projections for 1983 are quite similar for all the parties.
Compared to the outlook in February, upward revisions to
projected real GNP have placed the current forecasts near the top
of the earlier range. The unemployment rate projected for the
final quarter of 1983 is now near the bottom of the range,
associated with the strengthened outlook for economic activity.
For 1984, the various forecasts are not markedly
different, although the staff is on the lower side of most
forecasts for the GNP deflator and consequently for nominal GNP
as well.
For your possible reference the last chart presents
forecasts on a year-over-year basis.
* * * * *

CONFIDENTIAL (FR) CLASS II-FOMC
Materials for
Staff Presentation to the
Federal Open Market Committee
July 12, 1983

M2 and GNP
Change from end of previous period,annual rate, percent
M2 Nominal GNP
1982 9-1/4 3-1/2
1983 H1 15-1/2 (8-1/2)* 9-3/4
H2 8-3/4 9-1/2
1984 8 8-1/4
*Adjusted for shifts into MMDAs from sources outside M2.
Interest RatesPercent
Corporate Bonds 16
12
8
3-Month Treasury Bills
4
19811979 1983

Federal Budget
Unified Budget Basis, Billions of Dollars
FY 1982 FY 1983 FY 1984
Staff projection
Outlays
Receipts
Deficit
StructuralDeficit
728
618
111
43
805
600
205
71
861
663
198
97
Cyclical Comparison of Surplus or Deficit as a Percent of GNPPercent
Median of PreviousPostwar Cycles*
Current Cycle
2
4
6
8
-2Q Trough +2Q +4Q +6Q-8Q -6Q -4Q
* Excludes 1948-49 and 1980 cycles.

Real Retail SalesBillions of 1972 dollars
48
Total
46
44
Billions of 1972 dollarsAuto Sales and Production
Millions of units
11
June
9
7
5
on3
1979 1981 1983 1979 1981 1983
Billions of 1972 dollars
GAF*
1981 1983
Days Supply of Domestic AutosDays
100
75
50
1979 1981 1983
*General merchandise, apparel, furniture and appliance stores.
Real Retail Sales
1979

Cyclical Comparison of Industrial ProductionChange from trough, percent
20
Median of PreviousPostwar Cycles*
0Current Cycle +
-12M -6M T +6M +12M +18M +24M
Nonfarm Payroll EmploymentMillions of persons Millions of persons
92
90 Total
88 22
Manufacturing 20
18
Manufacturing WorkweekHours
40
38
1979 1981 1983
Excludes 1948-49 and 1980 cycles

Real GNPChange from end of previous period, percent
1972 Dollars
Annual rate, percent change
1983 1984
Q1 2.6 4.3 8Q2 75 4.2
Q3 7.1 4.1Q4 5.0 41Q4 to Q4 5.5 4.2
4
1978 1980 1982 1984
Cyclical Comparison of Real GNPChange for period indicated, percent
Median of Previous Postwar Cycles*
Current Cycle (right bar)- 8
4
+
Peak to trough Trough to +4Q + 4Q to +8Q
* Excludes 1948-49 and 1980 cycles.

Real GNP-Contribution of Selected ComponentsBillions of 1972 Dollars
First Half 1983
-0+ 25 50 75Change, 1982 Q4 to 1983 Q2, annual rate
Second Half 1983
Year 1984
GNP
Private Domestic Final Sales
Change in Nonfarm Inventories
Federal Government *
Net Exports
- 0+ 25 50 75Change, 1983 Q2 to 1983 Q4, annual rate
GNP
Private Domestic Final Sales
Change in Nonfarm Inventories
Federal Government *
Net Exports
-0+ 25 50 75Change, 1983 Q4 to 1984 Q4,annual rate

Housing Starts andHome Mortgage Rate
Annual rate, millions of units
Mortgage Rate
1.8 Single-family
1.2
.6
PercentNew Home Sales
Annual rate, thousands of units
700
500
300
1979 1981 1983 1979 1981 1983
Home Mortgage RatePercent
1979 1981 1983
Housing StartsAnnual rate, millions of units
Total
2.5
2.0
1.5
1.0
Single-family
1979 1981 19831979 1981 1983

Real New Orders forNondefense Capital Goods
Billions of 1972 dollars
Value of New NonresidentialConstruction Put in Place
Billions of 1977 dollars
55
1980 1982 1984
Corporate Economic ProfitsPercent
As a percent of GNP
Before Tax
After Tax
After Tax
1980 1982 1984
Manufacturing Capacity UtilizationPercent
1979 Peak 9087.2
80
70
60
1980 1982 1984
Billions of 1972 dollars
180
1980 1982 1984
170
160
Real Business Fixed Investment
1980 1982 1984

Index of Consumer SentimentIndex, 1966 Q1 =100
90
60
NYSE Stock IndexIndex, Dec. 31, 1965=50
1979 1981 1983 1979 1981 1983
Real Disposable Personal Income and Consumption ExpendituresChange, Q4 to Q4, perc
Real Disposable Personal Income
Real Personal Consumption Expenditures (right bar)
1978 1980 1982 1984
Saving RatePercent
Postwar Average
4
1978 1980 1982 19841978 1980 1982 1984

Total Employment and Real GNPChange, Q4 to Q4, percent
Real GNP (left scale)
Total Employment (right bar, right scale)
1980
Civilian Labor Force
Change, Q4 to Q4, millions of persons
1982 1984
Change, Q4 to Q4, millions of
1978 1980 1982 1984
Unemployment RatePercent
6
3
1978 1980 1982 19841978 1980 1982 1984

Hourly Earnings IndexChange from year earlier, percent
12Manufacturing
ContractConstruction
Trade andServices
1979 1981
Hourly Compensation
Nonfarm Business Sector
1983
Major Union Contracts
Contribution to Wage Change
1979 1981 1983
Change from year earlier,
1979 1981
Percent
10
5
+0
1977 1983

Output per Hour and Real GNPChange from end of previous period, annual rate, percent
Real GNP 8Real GNP
4
+
- Output per HourNonfarm Business Sector
1977 1979 1981 1983
Unit Labor CostsChange from end of previous period, annual rate, percent
Nonfarm Business Sector
16
12
1977 1979 1981 1983
Nonpetroleum Import PricesChange from end of previous period, annual rate,
1977 1979 1981 1983
Food PricesChange from end of previous period, annual rate,
Fixed-weighted Index for PersonalConsumption Expenditures
1979 1981 1983
Change from end of previous period
Unit Labor CostsNonfarm Business Sec
GNP Deflator
period, annual rate, percent
16
12
8
GNP Deflator
4
1983
1977
GNP Prices
19811977 1979

Foreign Exchange Value of the U.S. Dollar
Weighted Average Dollar*
1978 1980 1982
Short-term Interest Rates
CDs
U.S. CDs
Weighted Average*Foreign Interbank
March 1973=100
120
110
100
90
sumer Prices
80
1984
Percent per annum
18
14
10
6
1980 19821978 1984

Industrial Countries
Consumer Prices *Change from previous year, percent
1980 1981 1982 1983
Comparison of Real GNP Cycles **
Industrial Production*
Index, trough=100
1974-77Trough=1975 Q2
108
104
Current CycleTrough=1982 Q3
100
+4Q +6Q
* Weighted average of six major countries using total 1972-1976 average trade of these countries
**Weighted average of G-10 countries plus Switzerland using total 1972-1976 average trade of these countries
1974-77
-2Q -4Q Trough +2Q
Trade Volume
Non-OPEC Developing Countries
Trade PricesChange from year earlier, percent Change from year earlier, percent
Excluding Oil
1981 1982 1983 1984 1981 1982 1983 1984
Trade and Current Account BalancesBillions of dollars
1981 19821979 1980 1983 1984

U.S. Merchandise Trade
Change, Q4 to
Imports
Q4, percent
20
Exports
1981 1982 1983 1984
Trade and Current Account Balances
Trade (left bar)
Current Account
10
PriceChange, Q4 to Q4, percent
ExportsExports
Imports
1981 1982 1983
20
10
1984
Q4, seasonally adjusted, annual rate, billions of dollars
0
20
40
60
80
100100
1981 1982
Volume
1979 1980 1983 1984

Estimated Effects of Stronger Dollar
U.S. Trade and Current Account BalancesQ4, seasonally adjusted annual rate, billions of dollars
20
+
20
40
60
80
100
120
Real GNP Growth
GNP
and InflationChange, Q4 to Q4, percent
6
Staff Forecast
44Dollar Remains at1983 Q2 Level
CPI
Change, Q4 to Q4, percent12
8
Staff Forecast
Dollar Remains at1983 Q2 Level
1981 1982 1983 1984 1981 198419831981 1982 1983 1984 1981 1982 1984

GNP and Credit GrowthChange from year earlier, percent
Growth rates
Domestic
1968 1970 1972 1974 1976 1978 1980 1982 1984Federal Government Share of Total Credit Flows Percent25
1974 1976 1978 1980 1982 19841968 1970 1972

Households
Selected BorrowingBillions of dollars
1977 1979 1981 1983
Outstanding Financial Assets
Relative to Disposable Personal Income
150
100
50
Ratio
Outstanding DebtRelative to DPI
.80
.75
Consumer Attitudes
O.K. to use savingsfor major purchases
1977 1979
Loan Delinquencies
1981
Percent
35
15
1983
Percent
2.5
2.0
1.5
1.0
19831977 1979 1981

Nonfinancial Corporations
Financing GapBillions of dollars
1978 1980 1982 1984
Corporate Less Government BondRate Spread
Basis points
200
100
Earnings-Price RatioPercent
15
10
Interest Relative to Income
Net Interest/Profits plus Net Interest
Short-term Debt Relative toTotal Debt Outstanding
1978 1980 1982
Percent
50
40
30
20
Percent
49
47
45
43
1984 1978 1980 1982 1984

State and Local Government
Operating BudgetBillions of dollars
Surplus
Deficit
1978 1980 1982
10
1984
Funds Raised in Credit MarketsAnnual rate, billions of dollars
1978 1980 1982
Selected Sources and Uses of Funds
Net borrowing
Net acquisition offinancial assets
U.S. Treasury
Annual rate, billions of dollars
1981 1982 1983 H1
22.3 45.8 64.5
23.0 42.4 75.2
8.8 30.0 72.0
1984

Commercial Bank EarningsPercent of assets
Banks With Assetsof $1 Billion or More
1979 1981
1.1
.9
.7
All LargerBanks Banks
1982 H1 .97 .71H2 .88 .82
1983Q1 1.00 .84
1983
Commercial Bank Loan Loss Provisions
Banks With Assetsof $1 Billion or More
Percent of assets
.4
All LargerBanks Banks
1982 H1 .29 .31H2 .50 .47
1983Q1 .38 .40
.2
1973 1975 1977 1979 1981 1983
Thrift Institutions EarningsPercent of assets
S&Ls
Q1
MSBs S&Ls
1
+0
S&Ls MSBs
1982 H1 -1.29 -. 92
H2 -. 46 -. 56
1983 Q1 .08 -. 11
1973 1975 1977
1973 1975 1977 1979 1981 1983

Forecast Summary
Percent change,Q4 to Q4
Nominal GNP1983
1984
Real GNP1983
1984
GNP Deflator
1983
1984
BoardMembers
Range Median
9-1/4 to 10-1/2 10
7 to 10-1/2 9-1/4
5 to 6
3 to 5-1/4
VotingPresidents
Range Median
9-1/2 to 11-1/2 9-3/4
8-1/4 to 11 10
4-3/4 to 6
3 to 4-1/2
4 to 5 4-1/4
3-3/4 to 5 4-3/4
4-1/2 to 5-1/2 4-1/2
4 to 7 5-1/2
NonvotingPresidents
Range Median
9 to 1 1 10-1/4
7 to 11-1/4 9-1/2
Staff Adminis-tration
4-1/2 to 6
4 to 5
4-1/4 to 5-1/2
3-1/2 to 7
Average Q4 level
Unemployment
1983
1984
Rate
9-1/4 to 9-3/4
8-1/4 to 9
8-3/4 to 9-3/4
8 to 9-1/4
9-1/4 to 9-3/4 9-1/2
8-1/4 to 9-1/4 8-
FOMC Projections
Reported to Congress February 16, 1983
Nominal GNP
Real GNP
GNP deflator
Unemployment rate
Percent change, Q4 to Q4
7-1/4 to 11-1/4
3 to 5-1/2
3-1/2 to 51/2
Average level in the fourth quarter, percent
9-1/2 to 10-1/2

Forecast Summary
Percent change,annual averages
Nominal GNP1983
1984
Real GNP1983
1984
GNP Deflator1983
1984
BoardMembers
Range Median
7-1/2 to 9-1/4 8
8-1/2 to 10-1/4 9-3/4
3 to 5
4-1/4 to 6
4-1/4 to 4-3/4
3-1/2 to 4-3/4
Annual average level
Unemployment Rate
1983 9-3/4 to 10
1984 8-3/4 to 9-1/4
VotingPresidents
Range Median
7-1/2 to 9 7-1/2
8-3/4 to 12 9-3 / 4
23/ to 4
4 to 5
4-1/2 to 5 4-1/2
4 to 7 4-3/4
9-1/2 to 10
8-1/2 to 9-1/2
NonvotingPresidents
Range Median
Staff Adminis-tration
7-1/4 to 8-1/4
8-1/2 to 12
2-3/4 to 3-1/4
4 to 5-3/4
4-1/2 to 4-3/4
4 to 6-1/2
9-3/4 to 10
8-1/2 to 9-1/2

FOMC NOTESJuly 12-13, 1983
Paul Meek
Open market operations over the past seven weeks sought to
foster the slight increase in reserve restraint which the Committee
voted on May 24 and reaffirmed in the telephone consultation of June
23. As noted in the regular reports, the period was characterized
by a quickening of monetary aggregate growth, relative to
expectations at the May meeting.
In its operations over the interval, the Desk encountered a
willingness by banks to borrow at the discount window as reserve
restraint increased, as well as changing market views of the Federal
Reserve's policy stance, which fed back on bank behavior. The
persistent tendency of borrowing to run high, in part, reflected
higher-than-expected levels of excess reserves. But banks also
turned to the window with enthusiasm to borrow at the 8-1/2 percent
discount rate as the federal funds rate rose. Such a tendency is
not unusual in a period when most banks have clean records.
Borrowing by non member banks and seasonal borrowing rose a bit and
wire problems also led to occasional recourse to the window.
Early in the period, the Desk was slow to supply reserves
in the week of Memorial Day in order to allow the System's slightly
more restrictive stance to be reflected quickly in the money market.
The federal funds rate did move up to 8-3/4 percent or a bit higher
rather promptly. We were then caught a bit by surprise when the
Bank borrowed from the discount window on
Thursday, June 9, about a week earlier than expected and only a day
after we had bought $1 billion of Treasury bills to supply reserves
seasonally. But we reversed direction with 3-day matched
transactions the following Monday, allowing a rather tight market to

emerge on the last date of the June 15 week without our
intervention.
In this and the following week, we erred on the side of
caution because of the further strengthening of the monetary
aggregates, while excess reserves continued to exceed path levels.
Adjustment and seasonal borrowing at the window rose well above the
$350 million level incorporated in the path, and the federal funds
rate moved up above 9 percent. Some of this tautness evaporated in
the June 29 week, when non money market banks stepped up their use
of the discount window. (Coincidentally, this was after the
Committee's consultation affirmed a $400 to $500 million range for
borrowing.) A measure of tautness was restored last week over the
statement date and July 4 weekend, and federal funds have been
trading around 9-1/8 percent in the current week.
Some analysts were slow to identify the System's shift of
emphasis. They explained away the tightening of money market
conditions as seasonal, in effect interpreting the rise in discount
window borrowings and the federal funds rate as a consequence of a
seasonal demand for excess reserves. Since market analysts tend to
focus on net reserve positions, the high levels of excess reserves
often exceeded adjustment borrowing at the window to produce a net
free reserve number.
The financial markets moved to considerably higher yields
during the intermeeting period, despite some backing and filling.
However analysts read the numbers, traders prepared for a higher
federal funds rate and increased supplies of Treasury issues. The
federal funds rate has risen about 50 basis points since the May
meeting and 70 basis points since early May. Changed expectations
as well as increased reserve restraint contributed to the rise.
Rates on Treasury bills rose from about 60 basis points for 3-month

bills to 90 basis points for 6 to 12-month maturities. Banks
stepped up CD issuance in June as they moved away from anticipating
further rate declines. But there was good demand for such paper at
narrow spreads against Treasury bills, given the previous fall in
CDs outstanding made possible by MMDA inflows. The rise in CD rates
to about 9-1/2 percent for three-month maturities has put
considerable upward pressure on the prime rate, but thus far the
competition for loans in a slack market has seemed to reinforce
political reasons for not raising the prime rate.
Prices of Treasury notes and bonds have fallen
significantly over the interval, responding to an abundance of
supply, the rise in the fed funds rate, and a stronger economic
outlook. In the past seven weeks the Treasury raised $26 billion of
new cash from coupon issues, in addition to $10 billion from
Treasury bills. Three weeks ago, just before the quarter-end
financing, yields rose abruptly as the market probed for levels that
would entice investors to buy. In the event dealers underwrote the
Treasury issues but yields had to rise even higher before customers
were willing to buy. There was a crescendo of dealer anxiety
before the securities finally were placed with prices at levels that
discounted a fed funds rate of perhaps 9-1/2 percent over the near
term. The market has stabilized since in a lower trading range with
yields ranging 75 to 100 basis points higher than on May 23 for
intermediate securities and about 70 basis points higher for 20- to
30-year issues.
The market's skittishness reflected a realization that the
sheer volume of Treasury financing calls for finding an ever-
widening circle of buyers. Estimates of the Treasury's cash needs
in the next six months range up to $115 billion-indicating a need to
raise almost $4.5 billion of net new cash each week. There will be

unremitting pressure in the coupon sector. The New York staff
estimates that the Treasury will sell $60 billion of coupon issues
in the third quarter against maturities of $23 billion. The
Treasury estimates its needs will be a few billion dollars less.
The conflict between the demands of the Treasury and those of an
expanding economy does not seem as far away as it did a few months
ago.
In the corporate bond market, yields have risen about in
line with Treasury issues but the pace of new offerings has receded.
Treasurers have kept their offerings on a well-stocked shelf, hoping
that a window of lower rates will appear some time over the next six
months. Meanwhile, they have been able to raise money in the stock
market, from banks, or from internal sources. But a decline of
rates from current levels would probably trigger a substantial flow
of issues to market. The municipal market has performed rather well
in relation to other markets as the bulge in issues sold to beat the
June 30 deadline for bearer bonds passed; yields rose about 25 basis
points. The much publicized difficulties of the Washington Public
Power Supply System adversely impacted some power related issues but
not the market as a whole. Still, increased supply and the "WHOOPS"
situation appear likely to pose problems for the market as we go
forward.
As noted in the regular weekly reports, we suspended
trading with the Securities Groups New York Hanseatic Division on
May 31, in view of the merger on June 1 of its activities with a
savings and loan association owned by The Securities Groups--without
requested prior approval. The dealer was dropped from the reporting
list on June 6. A review of its past performance, and current
operations and financial structure is continuing. In addition, the

-5-
Federal Home Loan Bank Board is expected to make a formal ruling on
the permissibility of such activities for an S&L.

FOMC BriefingLong-run TargetsS. H. Axilrod7/11/83
As noted in the blue book, the principal issue for the Committee
in reassessing the longer-run ranges for 1983 appears to revolve around Ml.
So far as we can see there appears to be little chance of coming close to
the present 4 to 8 percent 1983 range for that aggregate by year-end with-
out a more rapid rise in interest rates than contemplated in any of the
short-run operating alternatives presented for this meeting. Thus, we
have shown in the blue book an alternative longer-run range for M1 of 7
to 11 percent which seems more practicable, particularly if the Committee
adopts a policy course that entails some rise in interest rates over the
balance of the year. It could be argued that an 8 to 12 percent range
would be even more practical; such a range would be more likely to accom-
modate a policy course that did not necessarily involve further interest
rate increases.
It must be recognized, however, that substantial elements of
uncertainty still surround Ml. Our recent research suggests that M1 has
become more responsive to interest rate changes as regular NOW accounts
have become a relatively more important component. That would suggest
that a small rise of market interest rates would place greater restraint
on Ml than it had in the past. Yet actual demand for Ml over the past
three quarters (given income and interest rates) has run even stronger
than our new M1 equation suggested, even though the equation itself was
generating what seemed to be unusually strong demands. So there still
appears to be some question about whether we have much of a handle on Ml
demand. Moreover, that demand should in any event be in process of changes
if and as super-NOW accounts assume a more important role, which would

act to reduce the responsiveness of Ml to market interest rates over time
from what it had recently been.
None of this would deny that there is a small chance that M1
growth could decelerate very substantially over the balance of the year.
But that would seem to depend on holders of regular NOW accounts shifting
funds out without much lag in response to small interest rate increases
and to holders of demand deposits finding that the surprisingly strong
and sustained build-up in such accounts over the past several months
(excepting January and February) has brought these balances to levels that
are more than ample for transactions and compensating balance needs. The
greater odds are on a relatively moderate deceleration in Ml growth over
the balance of the year, accompanied to be sure by the probability of some
increase in the income velocity of M1 after several quarters of decline.
Whether such a possible return to slightly more "normal" behavior
of Ml velocity is sufficient to give that variable more weight in operations
than has been the case since last fall is, of course, another major question.
Despite the recent apparent tendency for velocity of Ml to become less negative
and perhaps turn positive, its demand properties, as I mentioned earlier,
are still rather uncertain--at least as judged from model results, including
the variety of different results one can get from different models. On the
other hand, nominal GNP was stronger than earlier expected in the second
quarter of this year and seemingly will be so in the third quarter. The
strength of nominal GNP in the second and third quarters, not to mention
earlier quarters, is considerably less than most monetarist-type models
would have predicted (since they would probably not have taken account of
a structural downward shift in velocity), but the strength of Ml did to
some extent foreshadow the surprisingly strong nominal income growth of

the past quarter and this one and to some degree is also probably reflecting
growing transactions needs on a current basis.
Against that background, we have made an effort to suggest possible
alternative language for the directive should the Committee wish to give
more weight to Ml. Because of the inherent demand uncertainties that are
probably still with us, I am afraid the proposed language necessarily is
not much clearer than the existing language indicating the Committee will
monitor Ml with its weight dependent on more predictable velocity character-
istics.
There seems to be little reason, Mr. Chairman, to alter the 1983
ranges for the broader aggregates. The proposed directive provides optional
language for consideration that indicates an expectation that these aggre-
gates may be in the upper part of their ranges. Our models do not make me
much, if any, more comfortable about predicting M2 than Ml, but that optional
language may better fit a policy approach that looks to unchanged (or
declining) interest rates over the balance of this year than one that
contemplates some rise in rates.
The options laid out in the blue book for 1984 are pretty much
self-explanatory. It seems probable that modestly lower growth in the
broader aggregates next year relative to this will in practice be consistent
with continued relatively good economic recovery, given the projected
moderateness of wage and price pressures. Whether the tentative growth
ranges for 1984 should as a matter of policy be lowered from 1983 at this
time would seem to depend as well on assessment of the contribution that
such a reduction could make to holding down wage and price pressures as
the recovery proceeds and the fiscal stimulus gets larger.
Ml growth in 1984 should be considerably slower than in 1983, but
there is a small chance that it will not. On the face of it, considerably
slower growth than this year should naturally be expected since the upward
-4-
stock adjustment of M1 balances in late '82 and the early part of '83
to a much lower level of interest rates will have been behind us for
some time. On the other hand, if the current economic recovery is not
as sustainable as projected at the continuing apparently fairly high
level of real interest rates, one would have to assume either that price
increases will be strong next year or nominal interest rates will be
lower. If the latter should be the case, M1 growth could again be strong
as short-term rates move down further toward NOW account ceiling rates.
NOTES FOR THE F.O.M.C. MEETINGJuly 12, 1983
Sam Y. Cross
Over the period since your last meeting, the dollar has
continued to strengthen about 2 to 4 percent against most of the
European currencies and the Japanese yen. Against the traditionally
strong currencies like the German mark and Swiss franc, the dollar
is now back to the highs reached last November. Against same of the
weaker currencies, the dollar has set new records. On a trade-weighted
basis, the dollar reached an all-time high in mid-June and is at about
that level now. It stands some 7 percent higher than the level at
the beginning of this year.
The major factor behind the dollar's strength over this
period has been the changing outlook for interest rates. In May and
early June the exchange markets' hopes for further declines in U.S.
interest rates faded, and then gave way to expectations of renewed
increases in response to growing evidence of a robust recovery in the
U.S., together with large actual and prospective federal budget deficits
and rising money supply. In other countries, expectations that interest
rates generally would continue to decline persisted longer than in,the
United States, and interest differentials favoring the dollar widened.
The current strength of the dollar apparently reflects antici-
pation of a possible tightening of U.S. monetary policy. Nevertheless,
there were occasions particularly in late June when there was enough
skepticism about how long the dollar would maintain these levels that
it came off rather sharply though briefly on adverse news. Skepticism
was generated by figures published during June suggesting a faster

deterioration in the U.S. trade position than had been anticipated.
At the same time, large trade surpluses were again reported for
Germany and Japan. The prospects for financing a widening U.S. current
account deficit came more into question with publication of statistics
for May showing a slowdown in capital outflows frcm Germany and Japan.
Also during this time, there was some evidence of at least occasional
shifts of funds back into Germany and Japan, and there was less talk
of foreign inflows into U.S. securities.
At the present, therefore, the exchange market seems to be
reflecting a short-term focus on interest rate prospects, although we
may see more medium-term concern about the outlook for our balance of
payments and its financing.
On July 26, 1983, the last Carter bond to mature will be
redeemed. The Treasury intends to use marks warehoused with the System
to cover this repayment, thereby eliminating all balances warehoused
for the Treasury.
FOMC Recommendations
Mr. Chairman, swap drawings totaling $269 million by Mexico
under the Federal Reserve special swap arrangement will mature between
now and September 2, 1983. Of these, $115.5 million mature before
August 23, 1983. I would propose that these drawings, $14 million of
which comes up for first renewal and $101.5 million for second renewal,
be extended to August 23, 1983. Mexico fully intends to repay these
and all other drawings under the special swap arrangement on the maturity
date. Indeed, the possibility is being explored of their making a deposit
or investment of $500 million in anticipation of repayment of the BIS-U.S.
credit arrangements.