
Fomc 19710921 Green Book 19710915
106
Prefatory Note The attached document represents the most complete and accurate version available based on original copies culled from the files of the FOMC Secretariat at the Board of Governors of the Federal Reserve System. This electronic document was created through a comprehensive digitization process which included identifying the best- preserved paper copies, scanning those copies, 1 and then making the scanned versions text-searchable. 2 Though a stringent quality assurance process was employed, some imperfections may remain. Please note that some material may have been redacted from this document if that material was received on a confidential basis. Redacted material is indicated by occasional gaps in the text or by gray boxes around non-text content. All redacted passages are exempt from disclosure under applicable provisions of the Freedom of Information Act. 1 In some cases, original copies needed to be photocopied before being scanned into electronic format. All scanned images were deskewed (to remove the effects of printer- and scanner-introduced tilting) and lightly cleaned (to remove dark spots caused by staple holes, hole punches, and other blemishes caused after initial printing). 2 A two-step process was used. An advanced optical character recognition computer program (OCR) first created electronic text from the document image. Where the OCR results were inconclusive, staff checked and corrected the text as necessary. Please note that the numbers and text in charts and tables were not reliably recognized by the OCR process and were not checked or corrected by staff. Content last modified 6/05/2009.
-
Upload
fraser-federal-reserve-archive -
Category
Documents
-
view
216 -
download
0
Transcript of Fomc 19710921 Green Book 19710915

Prefatory Note The attached document represents the most complete and accurate version available based on original copies culled from the files of the FOMC Secretariat at the Board of Governors of the Federal Reserve System. This electronic document was created through a comprehensive digitization process which included identifying the best-preserved paper copies, scanning those copies,1
and then making the scanned versions text-searchable.2
Though a stringent quality assurance process was employed, some imperfections may remain. Please note that some material may have been redacted from this document if that material was received on a confidential basis. Redacted material is indicated by occasional gaps in the text or by gray boxes around non-text content. All redacted passages are exempt from disclosure under applicable provisions of the Freedom of Information Act. 1 In some cases, original copies needed to be photocopied before being scanned into electronic format. All scanned images were deskewed (to remove the effects of printer- and scanner-introduced tilting) and lightly cleaned (to remove dark spots caused by staple holes, hole punches, and other blemishes caused after initial printing). 2 A two-step process was used. An advanced optical character recognition computer program (OCR) first created electronic text from the document image. Where the OCR results were inconclusive, staff checked and corrected the text as necessary. Please note that the numbers and text in charts and tables were not reliably recognized by the OCR process and were not checked or corrected by staff.
Content last modified 6/05/2009.

CONFIDENTIAL (FR)
CURRENT ECONOMIC AND FINANCIAL CONDITIONS
By the StaffBoard of Governors
of the Federal Reserve SystemSeptember 15, 1971

TABLE OF CONTENTS
Page No.Section
SUMMARY AND OUTLOOK I
Nonfinancial . . . . . . . . . . . . . . . . ... . . . . .. - 1
Financial . . . . . . . . . . . . . . . . . . . . . . . . - 2
Balance of payments . . . . . . . . . . . . . . . . ... . .. - 4
THE ECONOMIC PICTURE IN DETAIL
Domestic Nonfinancial Scene II
Gross national product . . . . . . . . . . . . . . . . . . - 1Industrial production . . . . . . . . . . . . . . . . . . . - 9Retail sales . . . . . . . . . . . . . . . . -10Unit auto sales and stocks . . . . . . . . . . . . . . . . -11Consumer credit . . . . . . . . . . . . . . . . . . . . . -13Manufacturers' orders and shipments . . . . . . . . . . . . -15Inventories . . . . . . . . . . . . . . . . . . . . . . . . -16Cyclical indicators . . . . . . . . . . . . . . . .... . .. -18Construction and real estate. . . . . . . . . . . . . . . . -19Anticipated expenditures for new plant and equipment . . . -23Labor market. . . . . . . . . . . . . . . . . .. . . . . . -26Industrial relations . . . . . . . . . . . . . . . . . . . -29Wholesale prices . . . . . . . .... . . . . . ...... -30
Domestic Financial Situation III
Monetary aggregates . . . . . . . . . . . . . . . . . . . - 1Bank credit . . . . . . . . . . . . . . . . .. . . . . - 3Nonbank depositary institutions . . . . . . .. . .. - 5Mortgage market . . . . . . . . . . . . . . . . .. . . . - 7Corporate and municipal securities markets . . ..... . -12Government securities market . . . . . . . . . . . . . -16Other short-term credit markets . . . . . . . . . . . .. -20Federal finance . . . . . . . . . . . . . . . . .... . -22
International Developments
Foreign exchange markets . . . . . . . . . . . . . . . . . - 1Euro-dollar market . . . . . . . . . . . . . . . . . . . - 4U.S, balance of payments . . . . . . . . . . . . . . . . . - 7U.S. foreign trade . .... .......... . ... .. -11Official reaction in major industrialized countries to
recent U.S. policy moves . . . . . . . . . . . . . . . . -17Exchange market developments in other countries . . . . . . -25

I- 1
SUMMARY AND OUTLOOK
Nonfinancial
At mid-summer economic activity was expanding quite modestly,
while upward price pressures were strong, according to the latest
economic statistics (most of which relate to the period prior to the
new economic program announced at mid-August). According to current
staff estimates real GNP is increasing at an annual rate of only 2 per
cent in the current quarter following a rise at an upward revised rate
of nearly 5 per cent in the second quarter.
In August industrial production declined almost 1 per cent
further, though this was mainly because of continued cutbacks in steel
following the earlier precautionary build-up of stocks. The labor market
continued weak; nonfarm payroll employment changed little after two months
of decline, and theunemployment rate returned to a level above 6 per cent
as the labor force rose sharply.
Retail sales have shown strength in the last few weeks, rising
1.7 per cent in August on the basis of the advance estimate. For July
and August combined, retail sales averaged about 1 per cent over the
second quarter. Automobile sales--both domestic-type and imports--were
exceptionally strong in the last 10 days of August and the first 10 days
of September, probably in part because of expectations of a retroactive
rebate of the excise tax and higher prospective prices for imports.
New orders for durable goods increased considerably in July,
with defense orders up sharply. Capital equipment orders changed little

I-2
and were 4 per cent above the first quarter average. The August
Commerce-SEC survey (with most returns in before August 15) scaled
down slightly the already modest increases in business plans for plant
and equipment spending this year.
Wholesale prices of industrial commodities, seasonally
adjusted, increased markedly further in the month ending at mid-August,
continuing the sharp stepup of the past several months. Increases
were widespread, with metals and lumber accounting for much of the
overall rise. Prices of farm products and foods also rose sharply.
Outlook. Beginning in the fourth quarter, the President's
new economic program is expected to impart a strong upward push to the
economy and to hold down wage and price increases. For the three
quarters ending at mid-1972, real GNP is projected to increase on
average at an annual rate of around 7 per cent, with the first half of
1972 expected to be somewhat stronger than the fourth quarter of this
year. Before the President's announcement, we had projected an average
rate growth in real GNP of a little over 5 per cent for these three
quarters. A summary comparison of old and new staff projections is
shown in the table below.
GNP PROJECTIONS
Change in Increase inNominal GNP per cent per year: Unemployment
$ billion Real GNP GNP deflator rateOld New Old New Old New Old New
1971-III 19.0 16.0 2.7 2.0 4.5 4.1 6.2 6.1
1971-IV 27.5 22.8 5.0 6.4 5.3 2.2 6.4 6.0
1972-I 28.0 30.5 5.1 7.3 5.1 3.9 6.3 5.8
1972-11 27.5 25.4 5.6 7.5 4.2 1.6 6.1 5.5

I-3
The sharp increase in growth in real GNP anticipated for the
fourth quarter reflects mainly expected strength in consumer spending,
a shift from a decline to increase in inventory investment, and
further advances in residential construction. Consumer spending in
real terms is expected to accelerate, with total auto sales rising
appreciably from their average thus far this year and with a shift
away from imports toward domestic-type units.
In the first half of 1972, strength is projected to extend
to business fixed investment--in response to both rising levels of
output and the investment tax credit. Also the new program is expected
to result in a shift from deficit to surplus in net exports of goods
and services. Consumer spending is likely to continue strong, as
disposable income is enlarged, effective January 1, by some tax relief
in the form of higher personal exemptions and the volunteer army pay
increase partly offset by the postponement of the Federal pay raise.
With a more typical cyclical recovery under way, inventory accumulation
is projected to increase appreciably further in the first half of next year.
We are assuming a reasonably effective post-freeze wage price
program, with wage rates rising at an annual rate of about 5 per cent
over the three quarters to mid-1972. Productivity is expected to respond
favorably to sizable increases in output, and the rise in unit labor
costs is expected to slow appreciably. With such diminished cost pressures,
the private GNP fixed-weight index is projected to increase at an annual
rate of around 2-1/2 per cent price over the next three quarters, down
from a rate of over 5 per cent in the first half of this year.
Industrial capacity is projected to become more fully utilized,
and the unemployment rate to be trending down, reaching about 5.5 per
cent in the second quarter.

I-4
Financial
In recent days, market interest rates generally retraced
part of the decline that followed the President's mid-August speech.
With the Federal funds rate at or near a new high for the year,
private short-term rates began to edge upwards in late August, and
by mid-September most were only 1/8 to 1/4 of a percentage point
below tneir mid-August level. The three month Treasury bill rate had
increased by 30 basis points since late August but--reflecting previous
declines associated witn large official foreign demand--remains 50
basis points below its mid-August level. Witn respect to bond yields,
in the first week or two after the President's announcement, bond
yields declined about 75 basis points. Subsequently, with new issues
moving very slowly in early September, the corporate calendar building,
and the money market remining tight, several underwriting syndicates
were terminated witn large unsold balances at mid-month; under tne
circumstances, new issue yields rose about 25 basis points.
Commercial bank deposits and credit were greatly influenced
by international developments in August. Total bank loans increased
at a near record rate as foreign and domestic corporations borrowed
dollars to pay for imports in advance, to reduce net long--or increase
net short--dollar positions, and perhaps to re-lend dollars in the
Euro-dollar market. A significant proportion of the proceeds of such

I-5
loans ended up in deposits of the U. S. Government as foreign central
banks purchased special Treasury issues with dollars absorbed by
them in support of their own currencies.
Net inflows of consumer-type time and savings deposits at
banks and nonbank thrift institutions, taken together, slowed further
in August. Despite the August slowdown of inflows to thrift institu-
tions, however, mortgage rates are reported to have eased since the
President's new program was announced.
Outlook. The outlook for credit flows and interest rates
over the balance of the year is quite uncertain, depending as it does
on how the President's economic program seems to be developing. In
long-term markets, the lower level of yields resulting initially from
the new program stimulated new offerings of both corporate and municipal
issues--including some previously postponed--in September, and the
forward calendar for October has also begun to build. Despite this
bulge in offerings, the staff sees no reason to change its view that--
given imporved internal funds flows and the successful completion of a
considerable volume of financial restructuring--corporate long-term
borrowing in the fall should continue below the record pace of the
first half. But long-term rates might come under further upward
pressure as investors back off and borrowers accelerate offerings,
especially if short-term market pressures tend to cause a change in
longer-run interest rate expectations.

I-6
In short-term markets, credit demands are likely to be
sustained between now and year-end by increased business demands to
finance working capital in connection with the accelerated expansion
in GNP, by larger consumer credit demands, and by sizable Treasury
and Federal agency cash needs.1/ Part of these demands will fall on
banks. With U. S. Government and private demand deposits unlikely to
be a significant source of funds, and consumer-type time deposits
continuing to grow only modestly, banks can be expected to step up
efforts to sustain CD's. Thus, interest rates in short-term markets
could come under upward pressure as we move into the fall.
Under the circumstances, there is little reason to expect
a significant reversal of the recent slower growth of interest-bearing
deposits at nonbank depositary institutions. Mortgage rates, however,
are expected to rise little of any this fall because of the existing
high level of S&L liquidity, Government mortgage support programs,
and the seasonal moderation in mortgage credit demands.
1/ The staff assumes no massive sales of market issues or redemptionof special issues by official foreign accounts in the fourthquarter.

I- 7
Balance of payments
The U. S. balance of payments deficit in August appears to
have been of the order of magnitude of $8 or $9 billion. The greater
part of this occurred before European official exchange markets were
temporarily closed during the week of August 16-20, following the
President's announcement of the suspension of gold convertibility of
the dollar. During that week and thereafter there were large reserve
gains by Japan, in particular, until the Japanese yen was allowed to
appreciate by 5-1/2 per cent on Saturday, August 28. In the first week
of September the Bank of Japan, as well as some other central banks,
made further reserve acquisitions.
In July, U. S. merchandise imports substantially exceeded
exports for the fourth month in a row. The worsening of the trade
balance from a $2 billion surplus in 1970 to more than a $4 billion
rate of deficit in recent months reflects three types of factors: a
strengthening of aggregate domestic demand in the United States
relative to that in other countries, reactions to or expectations of
work stoppages (at ports and in U. S. industries such as steel), and
fears of future unavailability or increased cost of imports that might
be affected by quotas, exchange rate changes, or other measures. In
the months ahead the trade balance may continue to be adversely affected
by the first factor, but the other two may no longer buoy up imports so
strongly. As time goes by, the import surcharge will begin to cut down

I - 8
the dollar payments to foreign sellers of those categories of imports
for which U. S. import demand is sufficiently responsive to changes in
cost. The appreciation of the Japanese yen and other industrial
country currencies in recent months will have similar effects on the
quantities of imports (but with much less effect on dollar payments
to foreign countries), while having the positive effect of favoring
U. S. exports and raising their aggregate dollar value.
Projections of U. S. foreign trade and the balance of pay-
ments during this period of international reappraisal and negotiation
are perforce arbitrary. It seems likely that several months will
elapse before the U. S. surcharge and foreign compensatory or retali-
atory measures can be cleared away, giving place to multilaterally
negotiated exchange rate changes (involving further appreciations
against the dollar) and to agreements regarding exchange rate flexi-
bility and regarding the nature and management of international reserve
assets in the future.
The worsening of the over-all balance of payments from about
$10 billion in 1970 (on the official settlements basis) to a rate of
over $22 billion in the first half of 1971 reflected a worsening by
nearly $4 billion in the trade balance and very large adverse shifts
in recorded and unrecorded capital flows (other than repayments of
liabilities to commercial banks abroad, which tapered off after March).

I- 9
These capital flows were heavily affected by anticipations of exchange
rate changes, especially from last April on. It is to be expected
that new rounds of speculation on additional appreciations of industrial
country currencies will develop in coming months, and there will
continue to be a basic deficit in the U. S. payments accounts. Thus
governments and central banks of the other industrial countries may
be faced with difficult choices between further unilateral appreciations
of exchange rates, tighter exchange controls, or further large acquisi-
tions of dollar reserves. Meanwhile, central banks in most of the less
developed countries will continue to acquire reserves if their payments
positions permit.

September 14, 1971
I -- T - 1
SELECTED DOMESTIC NONFINANCIAL DATA
(Seasonally adjusted)
1971 Per Cent Change* FromMay June July Aug. 1 mo. 3 mos. Year
ago ago ago
Civilian labor force (mil.)Unemployment rate (%) 6/Insured unempl. rate (%)-
Nonfarm employment, payroll (mil.)ManufacturingNonmanufacturing
Industrial production (1967=100) /
Final products, totalConsumer goodsBusiness equipment
Materials5/
Capacity util. rate, mfg.-
Wholesale prices (1967=100)1/
Industrial commodities (FR)Sensitive materials (FR)
Farm products, foods & feeds
Consumer prices (1967=100)1/ /FoodCommodities except foodServices
Hourly earnings, pvt. nonfarm ($)Hourly earnings, mfg. ($)Weekly earnings, mfg. ($)Net spend, weekly earnings, mfg.
(3 dependents 1967 $) 1/ 6/
Personal income ($ bil.) 2/ 6/
Retail sales, total ($ bil.)Autos (million units) 2/GAAF ($ bil.) 3/
12 leaders, composite (1967=100) /
Selected leading indicators: 2/ 6/Housing starts, pvt. (thous.)- -Factory workweek (hours) 6/Unempl. claims, initial (thous.),/New orders, dur. goods, ($ bil.)-
Capital equipmentCommon stock prices (41-43=10)
84.26.24.2
70.818.752.1
107.0104.0115.894.4
108.9
n.a.
113.8113.4113.3114.3
120.8118.2116.6127.5
3.413.55
142.00
101.81
850.0
32.78.48.9
124.8
1,97540.0
30430.6
7.9101.64
83.15.64.4
70.718.652.0
106.9104.2116.094.2
108.7
n.a.
114.3113.7113.6115.4
121.5119.2117.1128.2
3.423.57
142.80
102.45
870.1
33.38.29.3
124.7
1,99540.0307
30.78.2
99.72
83.85.84.0
70.618.552.0
106.0104.0115.9
93.6107.1
n.a.
114.6114.3115.1115.0
121.8119.8117.0128.8
3.423.58
143.53
100.77
859.1
33.08.49.0
126.5
2,21840.0275
31.78.2
99.00
84.36.1
n.a.
70.618.552.1
n.a.n.a.n.a.n.a.n.a.
n.a.
114.9114.9116.4114.6
n.a.n.a.n.a.n.a.
3.453.60
143.59
n.a.
n.a.
33.68.49.1
n.a.
n.a.39.9n.a.n.a.n.a.
97.24
0.6
0.0-0.2
0.0
-0.8-0.2-0.1-0.6-1.5
0.30.51.1-0.3
0.20.5
-0.10.5
0.90.60.0
-1.6
-1.3
1.71.11.3
1.4
11.2-0.310.5-3.3
-0.4-1.8
0.2 1.94/5. 13.-- 3.
-0.3-1.1
0.0
-0.20.41.1
-1.6-0.4
1.01.32.70.3
1.31.71.01.6
0.2-3.9
1.7
-1.4-1.43.3
-8.7-1.3
4.04.52.93.1
4.43.54.05.6
1.2 5.81.4 5.91.1 6.2
-0.3
1.7
2.70.32.2
2.1
16.0-0.32.8-4.86.3
-4.3
38.40.37/
-1.7-5.3
16.424.8
* Based on unrounded data. 1/ Not seasonally adjusted. 2/ Annual rates.3/ Gen'l. merchandise, apparel, and furniture and appliances. 4/ Actual figures.
S/ To be revised. 6/ Per cent calculated to July 1971. 1/ Sign reversed.

I -- T - 2
SELECTED DOMESTIC FINANCIAL DATA
Interest rates, per cent
Federal funds3-mo. Treasury bills3-mo. Federal agencies3-mo. Euro-dollars3-mo. finance co. paper4-6 mo. commercial paper
Bond buyer municipalsAaa corporate-new issues20-year Treasury bondsFHA mortgages, 30-year
Change in monetaryaggregates (SAAR, per cent)
Total reservesNonborrowed reservesCredit proxyCredit proxy + nondep. fundsMoney supplyTime and savings depositsDeposits at S&L's and MSB'sBank credit, end-of-monthTreasury securitiesOther securitiesTotal loans
Business
Commercial paper (SA change,$ mil.)
Total (SA)Bank-related (NSA)
1970
QIV
5.575.355.507.466.126.28
5.938.266.578.76
1970QIV
6.69.4
15.18.33.4
21.811.6
8.66.2
36.51.4
-4.9
1970QIV
-760-2,269
Averages1971 Week ended
QI QII July Aug. Sept. 8
3.863.763.785.504.484.57
5.257.336.00
4.564.264.436,724.745.05
5.747.836.247.67
5.315.405.566.475.545.75
6.067.966.387.97
5.574.944.198.165.575.73
5.837.656.27n.a.
5.734.565.808.765.445.75
5.397.385.99
1971
01 Oi _ .Jily Aii-
11.011.017.010.9
8.927.323.312.219.827.9
6.31.4
6.65.39.66.5
11.313.517.37.4
11.115.74.22.5
1971
Q. QII
-2,581-657
-87441
0.3-13.1
8.88.0
10.111.315.87.6
-20.918.710.011.7
15.016.311.510.0
2.66.18.4
13.0-3.9-3.721.829.4
July Aug.
-758 n.a.75 -16
New security issues (NSA, $ mil.)
Total corp. issuesPublic offerings
State and local governmentbond offerings
Fed. sponsored agency debt(change)
Fed. gov't. debt (change)
1970H-2 QIII Aug.
1971QII July August
20,499 8,560 2,274 11,654 4;000 e 2,850 e16,830 7,646 2,069 9,930 3,527 2,350 e
10,327 4,465 1,359 6,050 1,928 1,828 e
3,057 1,593 678 - 924 86916,257 7,366 2,716 1,616 4,226
210 e6,900 e
n.a. - Not available. e - Estimated. p - Preliminary.SAAR - Seasonally adjusted annual rate. NSA - Not seasonally adjusted.

9/15/71I -- T - 3
U.S. Balance of PaymentsIn millions of dollars; seasonally adjusted
1 9 7 1 p/I II May* June* July*
Goods and services, net 1/
Trade balance 2/
Exports 2/
Imports 2/
Service balance
Remittances and pensions
Govt. grants & capital, net
U.S. private capital (- = outflow)Direct investment abroadForeign securities
Bank-reported claims -- liquid" " " other
Nonbank-reported claims -- liquid" " " other
Foreign capital (excl. reserve trans.)Direct investment in U.S.U.S. corporate stocksNew U.S. direct investment issues
Other U.S. securities (excl. U.S. Treas.)
Liquid liabilities to:Commercial banks abroadOther private foreignIntl. & regional institutions
Nonliquid liab. to banks and others
Foreign official reserve claimsLiquidOther
U.S. monetary reserves (increase, -)Gold stockSpecial drawing rights 3/IMF gold trancheConvertible currencies
Errors and omissions
BALANCES (deficit -) 3/Official settlements, S.A.
" " , N.S.A.Net Liquidity, S.A.
" , N.S.A.
Adjusted liquidity, S.A. 4/1" " - N.S.A.
1,147
26911,03010,761
878
-342-1,026
-2,230-1,370
-353-72-53
-225-157
-2,241
92
78317164
-2.693
-LZ
-1,04010,716
-11,756
1,018
-357
-1,094
-1,967
-1,315
-39638
-317
66
-43
-110
-241
264-59-59
-3063,670-3,976
-126-481-507
-64
10
-693
-4243,594
-4,018
-150437139
76
-11
1.025
-3603,435
-3,795
-70-103
109n.a.
-4
-613-3,042 -85 -617 1,134 -632
78 -148 -118 -86 -59
271 174 42 -23 78
-199 -233
4,856 5.047 4,806 -1,515 2.229
5,067 5,216 4,821 -1,455 2,287
-211 -169 -15 -60 -58
862 838 496 307 221
-1,026
-5,718-5,440-2,728-2,604-3,025-2.927
-2,335
-5,885-6,444-5,930-6,572-5,826-6.548
357196
4-61
-5,302
-4,064
-4.609
61
250-4
1,208
-330
183
-2,450
n.a.
-1.837* Monthly, only exports and imports are seasonally adjusted.1/ Equals "net exports" in the GNP, except for latest revisions.2/ Balance of payments basis which differs a little from Census basis.3/ Excludes allocation of $717 million of SDRs on 1/1/71.4/ Measured by changes in U.S. monetary reserves, all liabilities to foreign official
reserve agencies and liquid liabilities to commercial banks and other foreigners.

II - 1
THE ECONOMIC PICTURE IN DETAIL
Domestic Nonfinancial Scene
Gross national product. GNP projections in this Greenbook
are a revision and extension of those presented in the Supplement to
the last Greenbook which incorporated our tentative conclusions with
respect to the impacts of the President's new economic policies through
the end of this year. Since many important aspects of the new policies
remain uncertain, the projections require an unusually large number of
major assumptions, particularly in regard to the post-freeze period.
We have assumed that Congress will enact the President's new
proposals quickly and that the 90-day price freeze will be generally
effective. Following the freeze, we expect that.average wage rate
increases will be kept to about 5 per cent annual rate and price
increases to about 2 - 2-1/2 per cent. Some post-freeze catch-up is
expected to accelerate increases in wages and prices temporarily in
the first quarter of 1972. We have also assumed that the 10 per cent
job development tax credit and the 10 per cent supplemental duty on
imports, or equivalent foreign exchange rate adjustments, will remain
effective throughout the projection period. With respect to monetary
policy, we assume that interest rates will remain approximately at
present levels through early 1972. Additional important assumptions
involving fiscal implications are listed on the following page.

II - 2
ASSUMPTIONS
The 7 per cent manufacturers excise tax on automobiles will
be repealed retroactive to August 15, 1971.
Personal income tax exemptions will increase by $100, to $750
per individual on January 1, 1972.
Social Security benefits will be increased by 5 per cent on
January 1, 1972, but without any other liberalization.
No minimum wage increase will go into effect until after
July 1, 1972.
Welfare reforms and revenue sharing will be postponed until
after July 1, 1972.
Regular Federal civilian and military pay increases will be
50
postponed from January 1, 1972 to July 1, 1972.
The special military pay increase in connection with the
volunteer army program will be postponed from October 1, 1971 to
January 1, 1972.
Federal employment will be reduced by 5 per cent by June 30,
1972. ****************
Our reappraisal suggests the likelihood of a distinctly
stronger tone to the economy over the next several quarters than was
anticipated prior to the President's announcement. Many of the sectors
which had remained relatively weak are now expected to grow at an accel-
erating rate. Improved consumer demand, particularly for autos, a
higher rate of inventory investment, and-beginning early next year--
an improvement in the net export position combined with a turnaround

II - 3
in capital spending, are expected to raise real GNP growth to an annual
rate of about 7 per cent in the next three quarters--not usually high
for a period of cyclical recovery.
GNP AND RELATED ITEMS 1971 - III THROUGH 1972 - II(Changes in seasonally adjusted annual rates)
GNPFinal sales
Personal consumptionResidential constructionBusiness fixed investmentNet exportsFederal purchasesState & local purchases
Inventory change
Real GNPGNP deflator
1971Q III Q IV
----- Billions o
16.0 22.817.9 21.1
10.9 14.41.1 1.41.0 - .2
- .51.8 2.53.5 3.0
-1.9 1.7
------- Per Cent
2.0 6.44.0 2.2
1972QI Q II
f Dollars-------
30.5 25.428.3 20.6
16.7 13.41.4 .71.7 2.51.5 1.53.0 - .54.0 3.0
2.2 4.8
Per Year-------
7.3 7.53.9 1.6
Relatively little impact from these policy changes is likely
to be evident in the current quarter. We now expect a GNP increase of
only $16 billion almost $6-1/2 billion less than the rise last
quarter.1/ This reflects in part a slower increase in prices as a
result of the freeze, but the gain in real GNP is also expected to
fall far short of that in the second quarter, 2.0 per cent as compared
with 4.8 per cent.
1/ We have revised up second quarter GNP to reflect new figures whichsuggest a net export total of $-0.5 billion instead of $-2.2 billion.Commerce plans to make a similar adjustment.

II - 4
However, the surge of auto sales in the last ten days of August and
the first ten days of September suggests that the proposed elimination
of the 7 per cent excise tax on new autos and the freeze on prices of
1972 models may already have had some effect. We expect a high rate
of sales of domestic type autos to continue through September, with
the average for the quarter at 8.6 million units. Substantial demand
for foreign cars is also likely to be sustained temporarily by inventory
clearances of autos exempt from the import surcharge. Nevertheless,
total retail sales fell in July, and the rebound in August was modest
outside of the auto sector. As a result, we still anticipate a
significantly smaller gain in consumer expenditures in the third
quarter than in the second.
Among other sectors, construction activity continues to post
impressive gains. We now expect 2.1 million residential housing starts,
annual rate, in the current quarter, about 150,000 more than last
quarter. But relatively little evidence of strength has been evident
elsewhere in the economy. The net exports situation is expected to
show no imporvement in the current quarter. Capital outlays should
rise only modestly and a decline of about $2 billion is expected in the
rate of inventory investment largely as a result of the runoff of
steel stocks.
The impact of the new economic program is projected to be
more clearly evident in the fourth quarter. We expect an increase in

II - 5
current dollar GNP of $23 billion; in real terms this would be an
annual rate of 6.4 per cent, as compared with 5.0 per cent we had
projected in July, preceding the announcement of policy changes.
Domestic auto sales are expected to continue at an advanced level, in
small part at the expense of foreign models once the current inventory,
not affected by the import surtax, is sold off. An annual sales rate
of 9-1/4 million is anticipated for domestic cars, up from a projected
rate of 8.6 million this quarter. Relative stability in prices should
have a salutary effect on consumer attitudes generally, resulting in
stronger real takings for other durables and nondurables as well. In
total, consumer outlays are projected to rise by over 6 per cent in
real terms, and the saving rate is projected to drop to around 7 per
cent.
With improved business sentiment, the rate of inventory
investment is also likely to rise in the fourth quarter accompanying
a recovery in demand and the attainment of a better balance of steel
stocks. However, the rather moderate production schedules announced
for October and November, in conjunction with the high sales rate we
foresee, suggests some rundown of auto stocks.
Even larger gains in GNP are projected for the first half of
1972--an average of about $28 billion per quarter, nearly 7-1/2 per
cent, annual rate, in real terms.

II - 5a
Consumer demand is projected to continue up at a brisk
pace with income benefitting from significantly larger employment
increases and a series of fiscal stimuli: a $2.4 billion military
pay increase and a $100 increase in personal income tax exemptions
plus other liberalizations.

II - 6
Business investment should also be gaining considerable
strength through this period. Encouraged by improved sales and higher
utilization rates, business is expected to take increasing advantage of
the 10 per cent tax credit, with capital spending rising at an annual
rate of about 8 per cent in current dollar terms during the first half.
A substantial further rise in inventory investment should also accom-
pany the increase in sales, with accumulation averaging about $10
billion a quarter, about double that during 1971. Residential con-
struction activity is expected to continue at a high rate with housing
starts leveling off at slightly over 2.1 million, and as a result of the
surcharge and exchange rate adjustments, net exports of goods and ser-
vices are expected to swing to a positive total of about $2 billion by
the second quarter.
The higher rate of real growth which we are now projecting
should mean a sizeable expansion of nonfarm employment--1.7 million in
the next three quarters. The growth of the civilian labor force is
also expected to accelerate, and the unemployment rate should drop
moderately, to a 5-1/2 per cent rate in the second quarter.
We anticipate a substantial recovery in productivity gains,
to almost 4 per cent, annual rate, to accompany improved output per-
formance, and this should contribute significantly to the success of
efforts to keep price increases in check. The rise in prices, as
measured by the fixed weight GNP price index is expected to moderate
to about a 2 - 2-1/2 per cent rate in the second quarter following the
post-freeze catch up early in the year.

II - 6
CONFIDENTIAL - FR September 15, 1971
GROSS NATIONAL PRODUCT AND RELATED ITEMS(Quarterly figures are seasonally adjusted. Expenditures and income
figures are billions of dollars, with quarterly figures at annual rates.)
1971 19721970 1971 Projection
Proj. I II III IV I II
Gross National ProductFinal purchases
PrivateExcluding net exports
Personal consumption expendituresDurable goodsNondurable goodsServices
Gross private domestic investmentResidential constructionBusiness fixed investmentChange in business inventories
Nonfarm
Net exports of goods and servicesExportsImports
Gov't. purchases of goods & servicesFederal
DefenseOther
State & local
Gross national product inconstant (1958) dollars
GNP implicit deflator (1958 = 100)
Personal incomeWage and salary disbursements
Disposable incomePersonal savingSaving rate (per cent)
Corporate profits before taxCorp. cash flow, net of div. (domestic)
Federal government receipts andexpenditures (N.I.A. basis)
ReceiptsExpendituresSurplus or deficit (-)
974.1971.3751.9748.3
615.888.6
264.7262.5
135.330.4
102.12.82.5
1051.21046.7
813.0812.5
665.9101.9281.2282.9
151.239.9
106.84.64.1
1020.81017.6
789.4785.2
644.697.6
272.0275.0
143.836.4
104.33.23.0
1043.1r
1 0 3 7 . 41
807.2r
807.6
660.9100.8279.8280.4
152.439.7
107.05.75.2
3.6 0.4 4.2 -0.5r62.9 66.5 66.1 66.4 r
59.3 66.1 61.9 66.9
219.497.275.421.9
122.2
233.797.572.025.5
136.3
228.296.773.023.7
131.5
230.295.771.823.9
134.5
235.597.571.526.0
138.0
1059.11055.3
819.8820.8
671.8103.0283.0285.8
152.841.0
108.03.83.0
1081.91076.4
835.4836.4
686.2106.0290.0290.2
155.742.4
107.85.55.0
1112.41104.7
856.7856.2
702.9109.4298.0295.5
161.043.8
109.57.77.5
1137.81125.3874.8872.8
716.3111.9303.5300.9
169.044.5
112.012.512.5
-1.0 0.5 2.066.5 71.0 72.767.5 70.5 70.7
241.0100.071.528.5
141.0
248.0103.0
73.529.5
145.0
250.5102.5
73.529.0
148.0
720.0 741.1 729.7 738.4r 742.2 754.1 767.8 782.2135.3 141.9 139.9 141.3 142.7 143.5 144.9 145.5
803.6541.4687.8
54.17.9
858.7576.0743.4
58.47.9
834.3562.3721.6
58.48.1
854.8572.4740.8
60.98.2
75.4 82.9 79.1 83.369.8 82.8 77.2 81.2
191.5205.1-13.6
198.8 195.6222.0 213.2-23.2 -17.5
198.3220.9-22.6
866.5580.2750.2
59.27.9
879.3589.2760.9
55.27.3
900.2604.7781.0
58.37.5
916.7616.0795.2
58.87.4
82.5 86.5 92.5 98.083.7 89.2 94.1 98.6
199.4224.5-25.1
202.0229.2-27.2
207.6237.0-29.4
213.3238.9-25.6
High employment surplus or deficit (-) 0.9
Total labor force (millions) 85.9Armed forces " 3.2Civilian labor force " 82.7Unemployment rate (per cent) 4.9
Nonfarm payroll employment (millions) 70,6Manufacturing 19.4
Industrial production (1967=100) 106.7Capacity utilization, manufacturing
(per cent) n.a.
Housing starts, private (millions A.R.) 1.43Sales new autos (millions, A.R.)Domestic models 7.12Foreign models 1.23
1.7 2.5 0.9 2.4 1.1 -3.4 -0.7
86.8 86.5 86.5 87.0 87.3 87.6 88.02.8 3.0 2.8 2.8 2.7 2.6 2.5
84.0 83.6 83.7 84.2 84.6 85.0 85.56.0 5.9 6.0 6.1 6.0 5.8 5.5
70.7 70.4 70.7 70.6 71.0 71.6 72.318.6 18.7 18.6 18.5 18.6 18.8 19.0
106.4 105.5 106.7 105.8 107.8 110.0 112.5
n.a. n.a. n.a. n.a. n.a. n.a. n.a.
2.00 1.81 1.96 2.11 2.13 2.13 2.13
8.63 8.39 8.29 8.60 9.25 9.25 9.251.58 1.50 1.57 1.75 1.50 1.40 1.30
are based on(N.I.A. basis) are
NOTE: Projection of related items such as employment and industrial production index
projection of deflated GNP. Federal budget high employment surplus or deficit
staff estimates and projections by method suggested by Okun and Teeters.
n.a. - not available.

II - 7
CONFIDENTIAL - FR September 15, 1971
CHANGES IN GROSS NATIONAL PRODUCTAND RELATED ITEMS
1971 19721970 1971 ------------ Projection----------
Proj. I II III IV I II
------------------------- Billions Of Dollars-------------------------
Gross National ProductInventory changeFinal purchasesPrivateExcluding net exportsNet exports
Government
GNP in constant (1958) dollarsFinal purchases
Private
Gross National ProductFinal purchases
Private
Personal consumption expendituresDurable goodsNondurable goodsServices
Gross private domestic investmentResidential constructionBusiness fixed investment
Gov't. purchases of goods & servicesFederal
DefenseOther
State & local
GNP in constant (1958) dollarsFinal purchases
PrivateGNP implicit deflatorPrivate GNP fixed weight price index2/
Personal incomeWage and salary disbursements
Disposable income
Corporate profits before tax
Federal government receipts andexpenditures (N.I.A. basis)
ReceiptsExpenditures
Nonfarm payroll employmentManufacturing
Industrial productionHousing starts, privateSales new autos
Domestic modelsForeign models
45.0 77.1 32.4 22.3r 16.0 22.7 30.6 25.4-4.6 1.8 -0.5 2.5 -1.9 1.7 2.2 4.849.6 75.4 32.9 19.8 17.9 21.1 28.3 20.639.9 61.1 28.4 17.8 12.6 15.6 21.3 18.138.3 64.2 26.9 22.4 13.2 15.6 19.8 16.61.6 -3.2 1.5 -4.7
r -0.5 0.0 1.5 1.5
9.7 14.3 4.5 2.0 5.3 5.5 7.0 2.5
-4.7 21.1 13.8 8.7 3.8 11.9 13.7 14.4-0.5 19.6 14.3 6.4 5.5 10.4 11.9 10.45.7 20.3 15.0 6.9 3.7 8.3 11.1 9.5
------------------------ In Per Cent Per Year-----------------------
4.8 7.9 13.81/ 9 .0r / 6.1 8.6 11.3 9.15.4 7.8 13.4 7.8 6.9 8.0 10,5 7.55.6 8.1 14.9 9.0 6.2 7.6 10.2 8.5
6.2 8.1 12.7 10.1 6.6 8.6 9.7 7.6-1.4 15.0 59.8 13.1 8.7 11.7 50.6 -25.16.9 6.2 1.6 11.5 4.6 9.9 11.0 7.48.4 7.8 9.1 7.9 7.7 6.2 7.3 7.3
-1.8 11.8 18.9 23.9 1.0 7.6 13.6 19.9-4.4 31.3 43.9 36.3 13.1 13.7 13.2 6.43.5 4.6 13.9 10.4 3.7 -0.7 6.3 9.1
4.6 6.5 8.0 3.5 9.2 9.3 11.6 4.0-2.0 0.3 3.3 -4.1 7.5 10.3 12.0 -1.9-3.8 -4.5 -1.1 -6.6 -1.7 0.0 11.2 0.05.8 16.4 17.6 3.4 35.1 38.5 14.0 -6.8
10.5 11.5 11.3 9.1 10.4 8.7 11.3 8.3
-0.6 2.9 8.01/ 4 .8r 1/ 2.1 6.4 7.3 7.5-0.1 2.7 8.0 3.5r 3.0 5.6 6.4 5.41.0 3.5 10.4 4.7
r 2.5 5.6 7.3 6.1
5.5 4.9 5.31/ 4.0r 1/ 4.1 2.2 3.9 1.64.8 5.61/ 5.0
/' 4.0 1.9 3.2 2.5
7.1 6.9 8.6 9.8 5.5 5.9 9.5 7.36.2 6.4 11.0 7.2 5.5 6.2 10.5 7.58.5 8.1 11.5 10.6 5.1 5.7 10.6 7.3
-10.5 9.9 41.9 21.2 -3.8 19.4 27.7 23.8
-2.7 3.8 13.3 5.5 2.2 5.2 11.1 11.08.2 8.2 6.5 14.4 6.5 8.4 13.6 3.2
0.5 0.1 1.8 1.3 -0.4 2.3 3.4 3.9-4.0 -4.0 0.4 -0.6 -3.2 2.2 4.3 4.3
-3.6 -1.0 7.3 4.7 -3.6 7.5 8.5 8.7-2.3 39.9 8.1 32.7 29.6 5.1 0.0 0.0
-15.9 21.2 216.1 -4.7 15.1 30.2 0.0 0.016.0 28.5 60.2 18.1 46.5 -57.1 -26.7 -28.6
1/ At compound rates.
2/ Using expenditures in 1967 as weights.

II - 9
Industrial production. Industrial production declined 0.8
per cent further in August and at 105.1 per cent was 6.1 per cent
below the 1969 high and 2.4 per cent above the low last November.
Steel production was cut back very sharply in August, accounting for
almost all of the decline in the total index. In the first 11 days of
September, however, raw steel production increased 28 per cent from
the low August average.
Auto assemblies, after allowance for the model changeover
period, were at annual rate of 8.5 million units in August, the same
as in July. Production schedules for September and preliminary plans
for the fourth quarter indicate little change from the August rate.
Output of room air conditioners, television sets, and some appliances
was reduced in August. Production of business equipment declined
slightly (-0.4 per cent) because of a 1.5 per cent reduction in indus-
trial equipment. Output of defense and space equipment rose slightly.

II - 10
INDUSTRIAL PRODUCTION1967=100, seasonally adjusted
Per cent change1969 1971 Sept 1969 July 1971
Sept 1/ June July Aug to Aug 1971 to Aug 1971
Total index 111.9 107.0 106.0 105.1 -6.1 -.8
Consuaner goods 112.3 115.9 115.8 115.5 2.8 -. 3Autos 116.6 107.9 107.9 108,5 -6.9 .6Home goods 111.6 112.7 113.1 110.8 - .7 -2.0Apparel & staples 111.3 116.0 115.9 115.8 4.0 -.1
Business equipment 110.3 95.0 95.4 95.0 -13.9 -.4Defense equipment 102.1 76.6 76.6 77.0 24.6 .5
Intermediate products 112.1 111.4 112.9 111.3 - .7 -1.4Construction products 111.9 114.2 115,7 112.6 .6 -2.7
Materials, total 114.4 108.7 105.8 104.2 -8,9 -1.5Durable 114.9 103.0 98.7 96.4 -16.1 -2,3
Steel 117.0 105.3 99.3 73.0 -37.6 26.5Nondurable 113.8 114.4 113.5 113.3 - .4 - .2
1/ Pre-recession peak of the total index.
Retail sales. Sales in August increased 1.7 per cent from
July, with much of the additional strength in the automotive group
following the mid-August announcement by the President of major policy
changes. Sales of durable goods rose 3.4 per cent, largely reflecting
a 4.5 per cent increase in the automotive group; furniture and appliance
sales gained 0.8 per cent. Sales of nondurable goods increased almost
1 per cent, with general merchandise up about the same amount and mixed
gains and losses in other major store types. Excluding the automotive
group and nonconsumer items, sales in August were also up about 1 per
cent.

II - 11
Beginning in March, retail sales have moved sharply upward,
and in August were 6.3 per cent above the level six months earlier.
This gain far exceeds the rise in retail prices over that period,
which amounted to about 2 per cent, and appears to represent the best
sustained rate of increase in real terms since mid-1968.
RETAIL SALES, 1971(Seasonally adjusted)
Jue uy uus un ul ugs
Total retail
DurableFurniture & applianceAutomotive
NondurableFoodGeneral merchandise
Total, less auto &nonconsumer goods
Total real, deflated byall commodities CPI
June July August
(Millions of dollars)
33,310 33,029 33,576
10,518 10,531 10,8841,487 1,450 1,4616,267 6,353 6,640
22,792 22,498 22,6927,121 7,167 7,1445,975 5,790 5,841
25,163 24,822 25,041
28,272 27,910 n.a.
June(Per
1.9
2.94.12.2
1.4-1.3
4.4
Julycent
- .8
.1-2.5
1.4
-1.3,6
-3.1
1.6 -1.4
August
change)
1.7
3.4,8
4.5
.9S.3.9
.9
1.4 -1.3 n.a.
Unit auto sales and stocks. Sales of new domestic type autos
in the last 10 days of August were at an annual rate of 9.5 million
units and in the first 10 days of September were at an annual rate of
10 million; for the 20 days combined,sales were a fourth above a year
earlier. For the month of August, sales were at an8.5 million unit rate,
about the same as the 8.4 million average in the first 8 months of 1971.
During this period, most domestic producers either had cash discount

II - 12
programs on 1971 models or had sales incentive programs. Moreover,
dealers were permitted to sell the new 1972 models, whereas in the
corresponding interval of last year they were not allowed to sell the
then new 1971 models.
August sales of foreign cars were in record volume. At an
annual rate of 1.8 million units, they were up 43 per cent from a year
earlier. Strength of import sales in August may have reflected an
attempt to avoid the increased import surcharge which is not applicable
to dealer inventories or to vehicles in sea transit by August 15.
Foreign sales for the first 8 months of the year were at an annual
rate of 1.6 million units.
The import share of the U. S. auto market amounted to 22 per
cent in August compared with 18 per cent in July and also in August
1970. However, the rise in the import share over the past two summer
months is partly seasonal as domestic type sales are relatively low
in the period. Low priced vehicles accounted for most of the import
increase, and their share of total sales in the U. S. market rose to
19 per cent from 15 per cent in both July and last August. The market
share of domestic small cars was unchanged from last month at 21 per
cent but was up from 16 per cent a year earlier.
Due to the earlier and more rapid production change-over for
this new model year, seasonal factors for dealer inventories of
domestic-type autos have been changed substantially back to April.
With the new factors, stocks of domestic type cars were placed at a
61 days supply, up 2 per cent from last year (old seasonal factors)
but down 1 per cent from July.

II - 13
DISTRIBUTION OF U. S. AUTO SALES(In percent 1/)
1970 1971August June July August 3/
DomesticTotal 82.5 83.9 81.9 78.3
Large 66.3 63.5 61.1 57.2Small 2/ 16.2 20.4 20.8 21.1
ImportsTotal 17.5 16.1 18.1 21.7
Low-Priced 15.0 13.7 15.6 18.6
1/ Based on not seasonally adjusted data.2/ Compacts and sub-compacts.3/ Preliminary.
DEALER INVENTORIES OF DOMESTIC TYPE AUTOS, 1971Days Supply
Old Series New Series
April 57.5 57.5
May 56.6 58.2June 57.5 61.8July 55.4 62.4August 72.5 61.2
Consumer credit. Comsumer instalment credit outstanding
during July recorded the largest monthly advance in two years. At
$9.1 billion, seasonally adjusted annual rate, the increase was still
well below gains reported in most months of the first half of 1969
and the last half of 1968. But in the first half of this year, the
increase averaged only $4.7 billion at an annual rate.

II - 14
Extensions of instalment credit declined slightly in July
for all types of credit except personal loans; repayments were lower in
all categories, and, in total, were below any month since February.
Automobile credit extensions virtually leveled off between March and
July after a sharp rise in early months this year that was mainly
associated with recovery in sales from last fall's strike. Extensions
of nonautomotive consumer goods credit reached a new high of more than
$40 billion (SAAR) in the second quarter and remained at an advanced
level in July.
Two major factors account for a large part of the increase in
nonautomotive consumer goods credit; bank credit card volume has con-
tinued to expand and shipments of mobile homes--the credit financing
of which is in this category--are running well above year-earlier
levels. A new series indicates that the average mobile home contract
at commercial banks during June and July was close to $6,800, more
than double the average new car loan of $3,200.
CONSUMER INSTALMENT CREDIT EXTENSIONS(Billions of dollars, seasonally adjusted annual rate)
Other PersonalTotal Automobile
consumer goods loans
1970 - QI 102.2 30.0 35.5 34.6
QII 104.7 31.0 35.8 35,7QIII 106.9 31.4 37.5 35.9QIV 102.1 26.6 38.0 35.4
1971 - QI 110.1 32.2 38.7 36.9QII 116.6 33,9 40.6 39.7
July 116.1 33.3 40.8 39.4

II - 15
Manufacturers' orders and shipments. New orders for durable
goods increased 3.3 per cent in July, according to preliminary data.
About half of the increase reflected a jump in defense orders, but
excluding both defense and the primary metals group, the value of
orders in July was 2 per cent above June and 4 per cent above the
first-quarter average. Orders increased in July for motor vehicles
and parts, which returned to the first-quarter level, and for the
construction- and investment-related "all other" durables group which
was 6 per cent above the first quarter. Capital equipment orders
changed little at a level 4 per cent above the first-quarter average.
MANUFACTURERS' NEW ORDERS FOR DURABLE GOODSSeasonally adjusted monthly averages
1971
Durable goods, totalExcluding primarymetals
Excluding primarymetals and defense
Primary metalsIron and steel
Motor vehicles andparts
Household durablesDefense productsCapital equipmentAll other durables
QI Q II(rev.) (rev.)-------Billions
31.4 30.5
26.1 25.8
24.1 24.2
5.3 4.72.7 2.1
4.9 4.72.3 2.42.0 1.67.8 7.99.0 9.2
June July(rev.) (prel.)
of dollars--------
30.7 31.7
26.1 27.2
24.5 25.0
4.5 4.51.9 2.1
4.6 4.92.3 2.31.7 2.28.2 8.29.3 9.6
Change, Julyfrom June
-- Per Cent--
3.3
4.0
2.2
- .8
9.5
6.0
30.3- .43.2
NOTE: Detail may not add to total because of rounding.

II - 16
Factory shipments of durable goods fell 2.4 per cent in July:
defense products shipments dropped back from the unusually high June
level, and shipments of primary metals other than iron and steel, of
capital equipment, and of household durables also contributed to the
decrease. Unfilled orders declined only 0.2 per cent, as the expected
decline in primary metals backlogs was largely offset by increases
among other major groups.
Inventories. Book value of manufacturing and trade inventories
increased at a $5.0 billion annual rate in July, according to preliminary
data. This was slightly higher than in June but was below the first and
second quarter averages, in part because of the slowing of pre-contract
metals stockpiling.
CHANGE IN BOOK VALUE OF BUSINESS INVENTORIES(Seasonally adjusted annual rate, billions of dollars)
1971Q I Q II June July
(rev.) (rev.) (rev.) (prel.)
Manufacturing and trade 6.8 6.2 3.8 5.0
Manufacturing, total .1 .1 -1.3 -2.1
Durable - .3 -1.0 -3.0 -1.0Materials* .9 1.3 - .4 - .1End products -1.2 -2.3 -2.7 - .8
Nondurable .4 1.2 1.7 -1.2
Trade, total 6.7 6.0 5.2 7.2
Wholesale .7 2.2 2.3 5.8Metals & metalwork .3 .4 .5 .9
Retail 6.0 3.9 2.8 1.4Durable 4.4 2.7 1.2 .8Automotive 5.0 2.8 2.6 .6Nonautomotive - .6 - .1 -1.4 .2
Nondurable 1.6 1.1 1.7 .6
NOTE: Detail may not add to total because of rounding.* Including finished and in-process inventories of primary metals
manufacturers.

II - 17
Manufacturers' stocks declined at a $2 billion rate in July
as durable materials holdings were little changed and other inventories,
both durable and nondurable, declined. When surveyed in July and early
August, manufacturers anticipated building stocks at a $1.6 billion rate
for the third quarter as a whole, and accelerating to a $4.8 billion
rate in the fourth quarter. Attainment of the anticipated third quar-
ter rate (if the July figures are not revised) would require a rate of
increase of $3.5 billion in August and September. This would probably
have to take place outside the durable materials sector, since steel
stocks are expected to be worked down from a July level which was
relatively high, even by comparison with other pre-contract periods.
While manufacturers' stocks were declining, trade stocks
increased at a $7.2 billion rate--mainly at wholesale, especially
automotive goods and metals dealers.
Sales declined in July and the business inventory-sales
ratio rose, returning to the May level--which was still well below a
year earlier. The inventory-unfilled orders ratio for durable goods
manufacturing was unchanged from the high June level.

II -18
INVENTORY RATIOS
1970 1971June July June July
(rev.) (rev.) (rev.) (prel.)
Inventories to sales:Manufacturing & trade 1.58 1.59 1.52 1.54
Manufactuting, total 1.78 1.79 1.70 1.73Durable 2,13 2.14 1.99 2.03Nondurable 1.36 1.37 1.36 1.35
Trade, total 1.36 1.37 1.33 1.36Wholesale 1.22 1.23 1.20 1.23Retail 1.46 1.46 1.42 1.44
Durable 2.08 2.08 1.98 1.98Automotive 1,72 1.73 1.68 1.66Nonautomotive 2.58 2.57 2.42 2.47
Nondurable 1.18 1.19 1.17 1.18
Inventories to unfilledorders:Durable manufacturing .799 .806 .867 .868
Cyclical indicators. The
leading indicator rose 1.4 per cent
preliminary Census
in July. The June
composite
change is now
reported as a decline of 0.1 per cent, instead of the 0.5 per cent
decline indicated by the preliminary index. Series improving in
July were initial claims for unemployment insurance, new orders for
durable goods, housing permits, and the ratio of price to unit labor
cost. Series declining were the manufacturing workweek, contracts and
orders for plant and equipment, industrial materials prices, and common
stock prices, with all declines relatively small.

II - 19
The coincident composite declined 1.3 per cent and the
lagging composite declined 0.8 per cent.
COMPOSITE CYCLICAL INDICATORS(1967=100)
12 LeadingTrend Adjusted 5 Coincident 6 Lagging
1971: January 118.6 121.3 125.7February 119.6 122.2 124.0March 122.2 122.7 124.5
April 123.9 123.4 123.7May 124.8 124.2 123.3June 124.7 126.1 123.9
July (prel.) 126.5 124.4 122.9
Construction and real estate. Seasonally adjusted expendi-
tures for new construction edged higher in August and, at an annual rate
of $105.0 billion, slightly exceeded the previous record reached last
June. Outlays for private residential construction--still the dominant
factor in the over-all advance--continued upward for the thirteenth
consecutive month, to a rate 50 per cent above the low in July of last
year. Expenditures for private nonresidential construction in August
remained somewhat below the peak registered last June when outlays for
commercial buildings, hospitals and some other types of structures had
been particularly strong. Outlays for public construction in August
appeared to be holding at about the relatively advance second quarter
rate, although they were also down from earlier highs this year.

II - 20
Just before the President's general "wage-price" freeze,
construction costs, as measured by the Census Bureau's composite cost
index, were advancing at a pace very near the 9 per cent annual rate
last year. As a result, higher costs in August accounted for almost
half of the year-to-year rise in current dollar outlays. Except for
the residential sector, in fact, higher costs continued to account
for all of the year-to-year rise in current dollar terms.
NEW CONSTRUCTION PUT IN PLACE(Seasonally adjusted annual rate)
PrivateNon-
All Total Residential residential Public
Billions of dollars
1970 - Annual 91.3 63.1 29.3 33.8 28.3
1970 - IVQ 94.8 65.3 31.9 33.4 29.51971 IQ (r) 101.3 70.7 35.4 35.3 30.6
IIQ (r) 104.2 74.7 38.7 36.0 29.5
1971
June (r) 104.8 75.6 39.0 36.6 29.3July (r) 104.1 74.3 39.3 35.0 29.8August (p) 1/ 105.0 75.5 40.4 35.1 29.5
Per cent change in August from a year earlier
In current dollars +17 +23 +47 +3 +4
In 1957-59 dollars +9 +14 +36 -5 -3
1/ Data for the most recent month (August) are confidential CensusBureau extrapolations. In no case should public reference bemade to them.

II - 21
In view of the exceptional pace of housing starts so far this
year, concern about the possibility of "overbuilding" has already begun
to be expressed in some quarters. As reported earlier, however,
residential vacancy rates through the second quarter had generally
remained quite low. Also, while the mix of sales was apparently
shifting toward lower-cost units again in July--the latest month for
which data are available 1/ --the seasonally adjusted rate of new homes
sold by speculative builders reached a record high. Although builders'
stocks of such homes increased further in July, they remained compara-
tively low in relation to sales even after allowance for the volatility
of the sales series. Sales of used homes also showed appreciable
strength in July, according to the National Association of Real Estate
Boards, at a median price of $25,400--7 per cent more than in July of
last year. In the case of apartments, 68 per cent of all new privately
financed apartment-units finished in the first quarter of this year
were occupied within three months after completion, at a median asking
rent of $183 per month, according to the Census Bureau. This contrasted
with a 65 per cent absorption rate for comparable apartments in the fourth
quarter of last year when--because of a greater incidence of luxury-units
in the mix of completions--the monthly rental required was $192.
1/ Confidential until release this Thursday.

II - 22
NEW SINGLE FAMILY HONES SOLD AND FOR SALE
Homes sold 1/(Thousands
Homesfor sale 2/
of units)
Median price of:Homes sold Homes for sale
(Thousands of dollars)
1969 - Annual
1970
IIQIIIQIVQ
1971
IQIIQ
1971
AprilMayJuneJuly 3/
SAAR.SAAR, end of period.Data for July confidential until release this Thursday.
448
485
457518571
228
227
219215227
661628
220245
25.6
23.4
24.423.022.6
24.325.8
25.825.526.125.0
27.0
26.2
27.027.126.2
26.126.4
26.526.526.426.7
224232245250

II - 23
Anticipated expenditures for new plant and equipment. The
August Commerce-SEC survey indicates that business plans a 2.2 per
cent increase in 1971 spending for new plant and equipment. (The
survey was completed before the President's statement of August 15.)
This is a slight downward revision from the 2.7 per cent gain reported
in the May survey.
The downward revision is attributable to manufacturers who
now plan to reduce outlays by 5.8 per cent rather than the 4.2 per
cent reported earlier. Within manufacturing, large downward revisions
were reported in the primary iron and steel, nonelectrical machinery,
aircraft, stone, clay, and glass, and paper industries. Nonmanufactur-
ing, as a whole, indicates a 7.5 per cent gain for the year--up slightly
from earlier reported expectations.
The overall investment picture for 1971 is one of relatively
widespread weakness in manufacturing with only the textile, petroleum,
other durable goods, and other nondurable goods industries expecting
to increase outlays this year. The strength in investment is in the
nonmanufacturing sector where electric utilities, communications, min-
ing, and commercial and other firms plan large increases over last
year's spending.
Actual spending in the second quarter was about $800 million
less than anticipated with the shortfall concentrated in durable goods
manufacturing--especially primary iron and steel, electrical and non-
electrical machinery, and motor vehicles. Some rise is expected in
the third quarter due to a sharp increase in electric utility and
commercial and other spending. In the fourth quarter, the slight pick-
up expected in manufacturing spending is just offset by a projected drop
in nonmanufacturing.

II - 24
PLANT AND EQUIPMENT EXPENDITURES(Per cent change from prior year)
1969 1970 1971 PlansActual Actual Dec.'70 Feb. May Aug.
Total 11.5 5.5 1.4 4.3 2.7 2.2
Manufacturing 11.7 .9 -2.7 - .3 -4.2 -5.8Durable goods 13.0 -1.0 -3.1 -2.5 -7.2 -9.4Nondurable goods 10.3 2.7 -2.4 1.9 -1.4 -2.2
Nonmanufacturing-1 11.4 8.8 4.1 7.4 7.3 7.5Railroads 28.3 -4.3 -14.8 2.3 -2.8 -7.9Other transportation 1.0 1.7 -17.7 -12.0 -23.2 -25.8Public utilities 1/ 13.8 13.2 14,3 17.5 16.6 18.1
Electric 16.7 19.1 18.7 22.4 21.0 23.2Communications 21.5 21.7 14.02/ 10.32/ 11.22/ 8.82/Commercial and other 6.0 3,4 -2.02/ 3.82/ 6.82/ 8.12/
1/ Includes series not shown separately.2/ Confidential, not published separately.
The latest Conference Board survey of manufacturers' capital
appropriations suggests continued weakness through the remainder of 1971.
(This survey also was largely completed prior to August 15.) Appropria-
tions were reduced about 6 per cent in the second quarter--the seventh
such reduction in the last eight quarters--and expenditures and backlogs
also declined.

II -25
QUARTERLY PATTERN OF EXPENDITURES FORNEW PLANT AND EQUIPMENT
(Billions of dollars, seasonally adjustedannual rates)
1970 1971III IV I II III IV(Actual) (Actual) (Anticipated)
Total
Addendum: Totals as shownin May 1971 survey
ManufacturingDurable goodsNondurable goods
1/Nonmanufacturing-RailroadsOther transportationPublic utilities 1/Electric
CommunicationsCommercial and other
81.9 78.6 79.3 81.0 82.4 82.4
81.9 78.6 79.3 82.4 82.8 82.7
32.215.716.4
49.72.04.5
13.811.310.617.0
31.014.916.1
47.71.64.3
13.711.210.216.0
30.514.216.3
48.91.52.6
14.612.210.7
17.4
30.114.116.1
51.51.93.7
14.912.611.217.7
29.714.515.2
52.61.82.9
16.113.711.2 6 /18.62/
30.214.515.8
52.21.53.4
16.413.810.9118. 2-
1/ Includes series not shown separately.2/ Confidential, not published separately.
MANUFACTURERS' NEW CAPITAL APPROPRIATIONS(Seasonally adjusted, quarterly rates)
1971 1970 1971II p I II III IV I r II p
Millions Per Cent Changeof $ from Preceding Quarter
All manufacturing 5,432 -13.4 -1.1 1.6 -9.3 -4.0 -5.7
Durable goods 2,514 -10.6 -2.2 3.8 -18.9 .2 -7.4Nondurable goods 2,918 -15.9 .0 - .5 .5 -7.5 -4.1
SOURCE: Conference Board.

II - 26
Labor market. The labor market has been relatively weak
for several months. The unemployment rate rose by 0.3 percentage
points in August to 6.1 per cent, with widespread increases for
most groups except prime age job seekers (25-54 years). As was
anticipated, seasonal forces which led to a sharp decline in the
June rate proved temporary. Thus, the unemployment rate in August
was the same as in April and only 0.1 percentage point below the
high of last May. Nonfarm payroll employment was little changed in
August but down 200,000 from May.
The unemployment rate for males of prime working age--the
group least affected by seasonal fluctuations--was 3.6 per cent in
August about the same as the rate prevailing since the beginning of
the year. Looked at by type of occupation, joblessness among white-
collar workers remained virtually unchanged in August, while the rate
for blue-collar workers jumped 0.5 percentage points to 7.6 per cent
largely reflects the layoff of steel workers following contract settle-
ments at the end of July. Both the white-collar and blue-collar rates
are 0.7 points higher than a year ago.
The civilian labor force rose sharply in August. In the
last two months the labor force has grown by almost 1.2 million, but
this followed a decline of over 1 million in June. Compared to a year
ago the civilian labor force is up by over 1.5 million and the total
labor force by 1,2 million--in both cases a somewhat smaller amount of
growth than might be expected from population growth and projected
participation rates.

II - 27
SELECTED UNEMPLOYMENT RATES(Per cent, seasonally adjusted)
1970 1971August April July August
Total 5.1 6.1 5.8 6.1
Men aged:20 to 24 years 8.7 10.5 10.1 10.525 and over 3.0 3.5 3.4 3.6
Women, aged 20 and over 4.8 6.0 5.7 5.8Teenagers 15.8 17.2 16.2 17.0
White-collar 2.8 3.8 3.6 3.5
Blue-collar 6.9 7.4 7.1 7.6
White 4.8 5.6 5.3 5.6Negro 8.4 10.0 10.1 9.8
Nonfarm payroll employment failed to increase in August and
has shown very little growth over the past year. Manufacturing employ-
ment dropped 30,000 further in August and the average factory workweek
also edged down 0.1 hours--reflecting, in part, curtailments in steel
production. Over the past year the manufacturing work force has declined
by about 700,000 and is 1.8 million below the peak reached in July 1969.
Employment has continued to rise in trade and services, but at a much
slower rate than earlier. Gains in State and local government have also
moderated.
Earnings. Although the overall rate of increase in wages
continued high prior to the wage freeze, the growth rate of average
hourly earnings of production workers on private nonfarm payrolls in
July and August was somewhat below the rates posted in the first half

II - 28
NONFARM PAYROLL EMPLOYMENT, AUGUST 1971(Seasonally adjusted, in thousands)
Change from:August 1970* May 1971 July 1971
Total 131 -217 -14
Goods-producing -809 -275 -33Manufacturing -702. -201 -29Mining -10 -12 11Construction -97 -62 -15
Service-producing 940 58 19Transportation & P. U. -71 -65 -24Trade 274 35 33Finance and services 386 52 -10Government 351 36 20
Federal 3 -29 -5State and local 348 65 25
* Not seasonally adjusted.
of the year. Much of the slowing in the rate of increase occurred
in manufacturing. Overtime declined, and the growth of straight time
earnings in manufacturing (adjusted for inter-industry shifts), also
has edged downward steadily since the beginning of the year. But out-
side of manufacturing there has been little indication of easing except
in services.

II - 29
AVERAGE HOURLY EARNINGS OF PRODUCTIONAND NONSUPERVISORY WORKERS
(Per cent change from year earlier;not seasonally adjusted)
1970 1971III IV I II July-August
Private nonfarm 6.2 5.6 6.4 6.7 5.9
Manufacturing 5.5 4.4 6.5 6.4 5.9Adjusted for overtime andinter-industry shifts 6.6 6.4 7.1 6.8 6.5
Mining 6.5 6.6 5.9 6.2 6.1Construction 9.8 9.1 9.0 9.4 8.5Transportation & P. U. 6.2 6.6 7.6 7.4 7.3
Trade 6.2 5.5 5.9 6.2 5.7Finance 5.2 5.6 6.0 7.7 7.3Services 7.9 8.0 7.7 7.2 6.0
Industrial relations. The 90-day wage-price freeze effective
August 16 will affect contract renegotiations in a number of key
industries. In the construction industry apparently relatively few of
the 480,000 workers covered by major contracts expiring this year had
been renegotiated and submitted for approval to the Construction Industry
Stabilization Committee before the freeze. Also underway at the time of
the freeze was the West Coast shipping strike.
Major contracts covering workers at Atlantic and Gulf Coast
ports, in bituminous coal, aerospace, the smaller steel companies and
various machinery industries also expire in September. In all, about
420,000 workers are covered by contracts expiring in September, and in
October another 230,000 workers, mainly in aerospace, steel and glass
industries, will be renegotiating contracts. Wage increases(excluding

II - 30
cost-of-living adjustments) that would have been effective during the
period of the wage freeze include 5 per cent for about 400,000 rail-
road workers, about 3 per cent for 640,000 postal workers, nearly 7
per cent for 60,000 meatpacking workers, and 5 per cent for 50,000
teamsters in Chicago. Cost-of-living wage adjustments affected by the
freeze included adjustments for about 200,000 electrical equipment
workers at G.E. and Westinghouse and 50,000 Chicago truckers due in
October. Annual improvement factor and cost-of-living adjustments for
auto and related workers fall after the 90-day freeze--in late
November and early December.
Wholesale prices. Wholesale prices rose at a seasonally
adjusted annual rate of 9.0 per cent from July to August, reflecting
large increases for both industrial commodities and farm and food
products. Practically all commodities were priced before the President's
wage-price stabilization program was announced.
WHOLESALE PRICES(Percentage changes, seasonally adjusted annual rates)
June '70to
Dec. '70
All commodities 2.2
Farm and food 1/ - .4
Industrial commodities 3.4
Crude materials 2/ .8Intermediate materials 2/ 1.8Finished goods 2/ 5.4
Producer 6.0Consumer 5.1
1/ Farm products, and processed foods
2/ Excludes food.
Dec. '70to
Mar. '71
5.4
11.3
2.9
2.44.02.83.92.2
and feeds.
Mar. '71to
June '71
4.7
3.2
5.3
7.16.91.92.81.5
June '71to
July '71
2.4
-11.9
8.8
6.09.94.73.15.5
July '71to
Aug. '71
9.0
18.4
6.6
-3.810.9
3.66.32.2

II - 31
The rate of increase in industrial commodity prices has
accelerated sharply in the last few months; increases over the last
three months and the last six months were the largest in the current
inflation. Intermediate products increases have been substantially
larger than those of finished products.
In August, increases for metals and metal products and
lumber and wood products accounted for about two-thirds of the increase
in industrial commodities. The first stage of price increase recently
set by the steel industry became effective on August 5 and containers,
fabricated products and non-ferrous metals also rose. The textile
products group also moved up again as prices of cotton and manmade
fiber textiles and men's and boy's apparel increased substantially.
Seasonally-adjusted prices of farm and food products increased
sharply following last month's decline as prices of fresh and dried
fruits and vegetables rose contra-seasonally, reversing their dramatic
decline in July, and eggs rose nearly one-fourth in price. Meats,
poultry, and fish declined, but less than seasonally. Grains, however,
declined more than seasonally on prospects of a bumper crop.

III - 1
THE ECONOMIC PICTURE IN DETAIL
Domestic Financial Situation
Monetary aggregates. Growth in the narrowly defined money
stock (M1 ) dropped sharply during August to an annual rate of about 3.0
per cent. Some slowdown had been anticipated, with the amount of money
demanded expected to moderate in lagged response both to the earlier
higher level of market interest rates and the greatly increased public
holdings of liquid assets, but the falloff--for reasons that are not
yet clear--was more abrupt than expected. While no firm evidence is
available, it is possible that the massive shifts by private holders out
of dollars and the subsequent purchases of special Treasury issues by
foreign central banks both before and after the President's mid-month
announcements were a contributing factor. Indeed, the outflow of dollars
during August was so large that even if only a small part had been held
previously in demand balances rather than in interest-bearing assets,
the impact on the rate of expansion in M1 could have been significant.
Growth in M1 has continued slowly in early September, however, even though
dollar outflows have diminished sharply. Thus, even if such outflows
did contribute to the slow growth in M1 during August, other factors
also would appear to have been at work.
Expansion in M2 also slowed during August, to a rate of about
5.0 per cent from about 7.0 per cent in July. This slowdown is accounted
for by the reduced growth in M1, with time and savings deposits other
than large CD's expanding at a somewhat more rapid pace than during July.

III - 2
MONETARY AGGREGATES(Per cent changes, seasonally adjusted annual rates)
1970 1971QIV QI QII July Aug.
1. M1 (Currency plus privatedemand deposits) 3.4 8.9 11.3 10.1 3.2 p
2. M2 (M1 plus commercial banktime and savings depositsother than large CD's) 9.2 17.8 12.6 7.2 5.0 p
3. M3 (M2 plus savings deposits
at mutual savings banksand S&L's) 9.7 19.0 14.8 10.1 7.2 p
4. Adjusted bank credit proxy 8.3 10.9 6.5 8.0 10.7 p
5. Other aggregatesa) Total time and savings
deposits 21.8 27.3 13.5 11.3 6.5 pb) Time and savings deposits
other than large CD's 15.4 27.2 13.7 4.3 6.9 p
Memo: Average monthly change in: Millions of dollarsa) Negotiable CD's (SA) 1,437 606 242 1,579 172 pb) U.S. Government deposits
at Member Banks (SA) -24 -469 -283 -208 2,365 p
p - Preliminary.
Despite the small pickup in the growth rate for these time and savings
deposits, the expansion was still much less rapid than during the first
and second quarters of the year. M3 also increased less during August
than during July with growth in nonbank thrift institution deposits,
as well as M2 , slackening somewhat during the period.
The volume of large CD's outstanding at commercial banks in-
creased moderately on a seasonally adjusted basis during August, following
a large increase during July. Despite a sharp expansion in business

III - 3
loans, banks' willingness to bid for time deposits was reduced as the
month progressed by the large increases in Treasury deposits that re-
sulted from foreign central bank purchases of special Treasury issues
with dollars absorbed during the exchange crisis. As a result, CD
offering rates dropped following the President's termination of the gold-
dollar link and continued to move downward until late in the month. With
other private deposit inflows remaining low and large amounts of CD's
scheduled to mature over the forthcoming tax date, offering rates again
were bid up somewhat in early September. However, this resulted in
little increase in the amounts outstanding.
The large increase in U.S. Government deposits was reflected
in the adjusted credit proxy which expanded at an annual rate of 10.5
percent during August. This increase over the rates of recent months
occurred despite the slowdowns in the demand deposit and CD components
and a drop of almost $400 million on average in liabilities to foreign
branches.
Bank credit. End-of-month commercial bank credit, like the
adjusted credit proxy, showed an increased rate of growth during August,
rising at an annual rate of 13.0 per cent, almost double the rate for July.
All the growth took place in loans, as bank holdings of both U.S. Gov-
ernment and other securities edged off. The decline in holdings of
other securities, mainly tax-exempts, was the first in 18 months and
was centered at large banks, although holdings were weaker than seasonal
at smaller banks as well. Net sales of Treasury issues also were concen-
trated at larger banks and reflected the liquidation of both low-yielding
bills and longer-term securities as well.

III 4
COMMERCIAL BANK CREDIT ADJUSTED FOR LOANSSOLD TO AFFILIATES 1/
(Seasonally adjusted percentage changes, at annual rates)
1970 19712nd 1sthalf half QI QII July August
2/Total loans & investments- 11.4 10.0 12.2 7.4 7.6 13.0
U.S. Treasury securities 16.3 15.7 19.8 11.1 -20.9 -349Other securities 29.3 22.3 27.9 15.7 18.7 -3.7Total loans 5.6 5.2 6.3 4.2 10.0 21.8
3/Business loans- -1.6 1.8 1.4 2.5 11.7 29.4Real estate loans 4.8 9.4 8.3 10.3 12.8 11.1
1/ Last Wednesday of month series. Data for 1971 are preliminary.2/ Includes outstanding amounts of loans reported sold outright by banks
to their own holding companies, affiliates, subsidiaries, and foreignbranches.
3/ Includes outstanding amounts of business loans reported sold outrightby banks to their own holding companies, affiliates, subsidiaries, andforeign branches.
The strength in loans during August was concentrated primarily
in business, real estate and security loans, although all types of loans
showed at least some increase. The expansion in real estate loans
extended for another month the string of large increases that began to
develop late in 1970, while the sharp increase in security loans was the
first recorded this year. The rise in security loans was primarily
against issues other than direct Treasury obligations, and probably re-
flects aggressive pricing by corporate and municipal dealers of recent
new issues--and the consequent lag in their distribution--as well as an
increase in dealer inventories in anticipation of a continued decline
in rates in the immediate future.

III - 5
Business loans were by far the strongest component in the
expansion of bank credit during August, growing at an annual rate of
almost 30 percent, the highest rate for any month since the mid-1950's.
This extremely rapid expansion probably is attributable in large part to
borrowing both by foreign and domestic corporations associated with the
foreign exchange developments during the month.1/ This is suggested both
by statistical evidence and by Reserve Bank conversations with commercial
banks, and there seems to be little basis in the real sector for expecting
a large increase in domestic business borrowing for other purposes. It
should be noted, however, that this assessment may over-emphasize the
influence of foreign-related demands for loans, and that some of the
August increase in business loans, as well as the relatively rapid expan-
sion of such loans in July, reflects the emergence, after a year of
essentially no growth, of stronger business loan demand.
Nonbank depositary institutions. Deposit inflows to the non-
bank thrift institutions declined further during August. Because of
difficulties with seasonal adjustment that have affected both July and
August, however, combining the data for both months probably provides a
better measure of recent experience. The combined figure shows a modera-
1/ Most of the foreign borrowing was by Japanese corporations. Japanesebanks also were very large borrowers during the month, as reflectedin the rise of almost $1 billion in loans to foreign commercialbanks at weekly reporting banks. Such borrowing is not included inthe end-of-month bank credit data, which are computed, as in thecall report, net of loans to both domestic and foreign banks. Someof this large increase in loans to foreign banks was reversed inearly September.

III - 6
tion in inflows from the second quarter pace far less pronounced than that
suggested by the August figures taken alone. Evidence on deposit be-
havior in early September is still very limited, but flows to the sample
of large New York City mutual savings banks suggest a continuation of
the more moderate pace observed during July-August.
DEPOSIT GROWTH AT NONBANK THRIFT INSTITUTIONS(Seasonally adjusted annual rates, in per cent)
Mutual Savings and Loan BothSavings Banks Associations
1970 - QI 2.7 2.3 2.5QII 6.4 7.2 7.0QIII 6.9 10.6 9.3QIV 10.5 12.1 11.6
1971 - QI 17.7 26.0 23.3QII P/ 15.0 18.4 17.3
1970 - 2nd half 8.8 11.5 10.6
1971 - 1st half p/ 16.7 22.8 20.8
May* 12.7 15.1 14.3June 12.9 16.1 15.1July* p/ 8.8 19.0 15.8August * p/ 6.6 9.3 8.4
July andAugust 7.7 14.2 12.1
* Monthly patterns may not be significant because of difficultieswith seasonal adjustment.
p/ Preliminary. August is based on sample data.

III - 7
The moderation in deposit growth in recent months had been
associated with the rise in alternative market yields that had developed
before the mid-August wage and price freeze. So far, there is little
evidence as to the possible impact on deposit growth of the freeze
and the coincident drop in market yields. The few data available on
intra-monthly patterns reveal no significant difference from past years.
But effects of the drop in market yields may have been offset by what
appears to have been an increase in consumer spending during the latter
half of August and the first part of September.
Savings and loan associations borrowed a modest net amount
from the FHLB Banks during August as they had in July. Although complete
data for August are not yet available, this borrowing does not seem to
imply any particular pressure on S&L's in their takedowns of outstanding
commitments. The FHLB Board,in a move designed to provide some easing
in home mortgage interest rates, lowered the minimum liquidity
requirements for S&L's from 7.5 to 7 per cent of the sum of deposits plus
borrowed funds due within one year. The industry's aggregate liquidity
ratio was considerably above even the higher required minimum, however,
and no more than the usual relatively small number of associations were
operating close to that ratio. It is therefore not likely that this
easing in liquidity requirements would provide a significant release of
funds for mortgage acquisitions.
Mortgage market. Since the President's new program was
announced, yields to lenders on home mortgages have edged down somewhat,
according to field reports and trade opinion. However, many private

III - 8
originators and investors in FHA and VA mortgages have continued to
curtail their activities pending a clearer understanding about the
operation and impact of the new GNMA special assistance programs that
subsidize a portion of the discounts on such loans. Through early
September--one month after the programs were initially announced--GNMA
had executed more than $400 million in new purchase commitments under
Programs 21 and 22, and had sold off about an eighth of them at its
first commitment sales auction.1/
A further decline through the early part of this month in
yields required by home-mortgage lenders on Government-underwritten loans
in the secondary market was confirmed by the results of the latest FNMA
auction, which continued to be limited to forward purchase commitments
of 3 months. By September 7, yields on these 3-month commitments, at
7.88 per cent, were down 19 basis points from the 1971 high in late July.
1/ Under its new discount-subsidy Program 21 (multifamily loans) andProgram 22 (home loans) which generally apply to mortgages of nomore than $22,000, GNMA executes purchase commitments at fixed pricesof 95 (existing homes) or 96 (new properties) per cent of par. Itmay then resell these commitments at lower prices by (a) auctioningthem off to the same mortgage originators from whom it agreed topurchase the loans at the fixed prices (in GNMA's first sales auctionof September 9, GNMA accepted $48 million out of a total of $155million in bids submitted by these buyers, at prices ranging upwardfrom 93); or (b) selling them to the same originators at a uniformGNMA-determined interim selling price (ISP), initially established at93-1/2. In the event GNMA does not sell all of its purchase commit-ments before the loans are presented to GNMA for takedown, GNMA maythen sell the mortgages to FNMA or may auction them off to anyeligible buyer.

III - 9
FNMA PURCHASE AUCTIONS
3-month commitmentsAmount of total offers PrivateReceived Accepted Discount market yield
(Millions of dollars) (Points) (Per cent)
1971 - High 1,168 (5/10) 314 (4/26) 8.5 (7/26) 8.05 (6/1)
June 14 638 191 7.4 7.9128 539 263 7.4 7.92
July 12 606 241 7.8 7.9826* 686 183 8.5 8.07
Aug. 25* 635 154 7.8 7.97
Sept. 7* 445 189 7.1 7.88NOTE: Average secondary market yield after allowance for commitment fee
and required purchase and holding of FNMA stock, assuming prepay-ment period of 15 years for 30-year Government-underwrittenmortgages. Implicit yields shown are gross, before deduction offee paid by investors to servicers of 38 basis points.
*Auctions of 3-month commitments only. The September 7 auctionwas confined to mortgages too large for GNMA discount subsidy.
Over the entire month of August, average interest rates on
conventional home mortgages virtually stabilized, with only a slight
increase reported for new-home loans and no change for used-home loans.
In the more sensitive secondary market for FHA mortgages, yields edged
down. Although gross returns on both conventional and Government-under-
written mortgages improved somewhat relative to the reduced yields on new
issues of high-grade corporate bonds, they continued to offer no net
investment incentive for diversified lenders after allowance is made for
the higher servicing costs on mortgages.

III - 10
AVERAGE RATES AND YIELDS ON NEW-HOME MORTGAGES
Primary marketConventional loans
Yieldspread
Level (basis(per cent) points)
Secondary market:FHA-insured loans
Yieldspread
Level (basis Di(per cent) points)
iscount(points)
8.30 (Dec.)8.60 (July,
Aug.)
7.607.557.65
-56 (June)
50 (Dec.)
8.40
9.29
7.327.377.75
1 (May) 3.1 (Nov.)
99 (Feb.)
-14-20-36
6.0 (Feb.)
2.73.16.1
June 7.70 -20 7.89 -1 7.2July 7.80 -16 7.97 1 7.8August 7.85 20 7.92 27 7.4NOTE: FHA series; interest rates on conventional first mortgages
(excluding additional fees and charges) are rounded to the nearest5 basis points. On FHA loans carrying the 7 per cent ceiling ratein effect since mid-February 1971, a change of 1.0 points indiscount is associated with a change of 12 to 14 basis points inyield. Gross yield spread is average mortgage return, beforededucting servicing costs, minus average yield on new issues ofhigh grade corporate bonds with 5-year call protection.
August data confidential until released on Friday, September 17.
Net flows of credit to the residential mortgage market con-
tinued large in July, judging from fragmentary data. Net acquisitions by
S&I'swere at a record pace, inflated partly by an unusually large volume
of loans in process. Net market takings by this dominant lender group,
1970
LowHigh
1971
MarchAprilMay

III - 11
plus support from federal credit agencies, had already reached a new
high in the second quarter, accounting for a combined share of more than
four-fifths of total seasonally adjusted net credit extensions on all
residential mortgages.
S&L AND FEDERAL CREDIT AGENCY SHARESOF NET RESIDENTIAL MORTGAGE LENDING
Net Lending by all FederalPeriod Types of Lenders S&Ls Credit Agencies Both
(Billions of dollars) (Per cent of total)
1968 19 44 8 531969 20 44 19 631970 19 48 28 76
1970 - I 14 29 41 70II 16 40 33 73III 23 52 27 79IV 23 63 17 81
1971 - I 22 66 7 73II 35 65 18 82
NOTE: Flow of Funds accounts, with quarterly averages based on seasonallyadjusted data. Federal credit agencies include mortgage poolsbacking GNMA-guaranteed securities. S&L net acquisitions partlyreflect loans in process. Details may not add to totals becauseof rounding.
The quality of home mortgage debt deterioriated slightly
during the second quarter, according to the Mortgage Bankers Association
after-the-fact delinquency series, which is heavily weighted with FHA
and VA loans. The average delinquency rate edged up to a new second-
quarter high of 3.27 per cent, partly reflecting the growing volume of

III - 12
loans under FHA's Sec. 235 program that subsidizes interest rates down
to 1 per cent for eligible lower-income homeowners. In the MBA series,
delinquencies on these subsidized loans were more than twice the average
rates indicated for other mortgages.
Corporate and municipal securities markets. After some
adjustment from their initial sharp decline, yields on both corporate
and municipal bonds continued to fall in the weeks following the
Presidential message in mid-August. By September 10, long-term
corporate bond rates had dropped 76 basis points and municipal rates
were down 67 basis points. However, the decline seems to have run its
course for the present. Corporate syndicate positions built up as
investors, still uncertain about the course of inflation and sensing
an upturn in the new issue calendar, bought sparingly of the aggressively
priced new utility offerings. A more generous pricing policy on the
most recently issued industrial bonds resulted in quick sellouts.
In mid-September, with the market facing an unusually large
weekly calendar, the unsold portions of several slow-moving utility
bonds were released from syndicate, and their yields adjusted upward
about 25 basis points. Buying appears also to have slackened somewhat
in the long-term municipal market in recent days. Dealer inventories
of municipals rose significantly, resulting in the termination of
syndicates holding several recently issued, high-quality issues.

III - 13
Since the rapid run-up during the first few days after the
President's announcement, stock prices have remained relatively stable
with the NYSE, AMEX, and NASDAQ indexes having returned to approximately
their June 1 closing levels.
BOND YIELDS(Per cent)
New Aaa Long-term StateCorporate Bonds 1/ and Local Bonds 2/
1970
Low 7.68 (12/18) 5.33 (12/10)High 9.30 (6/9) 7.12 (5/28)
1971
Low 6.76 (1/29) 5.00 (3/18)High 8.23 (5/21) 6.23 (6/24)
Week of:August 6 8.02 6.07
13 7.97 6.0320 7.33 5.4927 7.48 5.71
September 3 7.38 5.3910 7.21 5.36
1/ With call protection (includes some issues with 10-year protection).2/ Bond Buyer (mixed qualities).
Public offerings of corporate bonds amounted to about $1.4
billion in August, but a series of new announcements and reschedulings
in late August raised the September calendar to $2.3 billion. At
this time it is estimated that the October total may be about $1.9
billion. There have been several announcements of large new issues in
recent days, and underwriters report that they have a number of

III - 14
corporations anticipating issues over the next six months or so that might
accelerate their offerings if it appeared that interest rates were trend-
ing upward again. Prospective offerings in other sectors of the long-
term securities markets are expected to remain close to the monthly
averages for the first half of the year. It is estimated that takedowns
of private placements will continue at a monthly rate of about $550
million during the latter part of the year, after the usual end-of-the-
quarter upswing in September. New equity volume, while varying somewhat
from month to month because of the timing of rights offerings, is
expected to average $800 to $900 million a month.
CORPORATE SECURITY OFFERINGS(Monthly or monthly averages in millions of dollars)
BondsPublic Private Stocks Total
1970 - Year 2,099 403 713 3,245First half 1,929 424 721 3,074
1971 - First half 2,486 546 948 3,980QI 2,790 505 769 4,063QII 2,182 586 1,128 3,896QIII e/ 1,677 596 1,382 3,655
August e/ 1,400 500 950 2,850September e/ 2,300 750 1,000 4,050October e/ 1,900 550 750 3,200
e/ Estimated.
Long-term offerings by State and local governments were about
$1.8 billion in August, and the September total is estimated at $1.9
billion, since a few previously postponed offerings apparently were
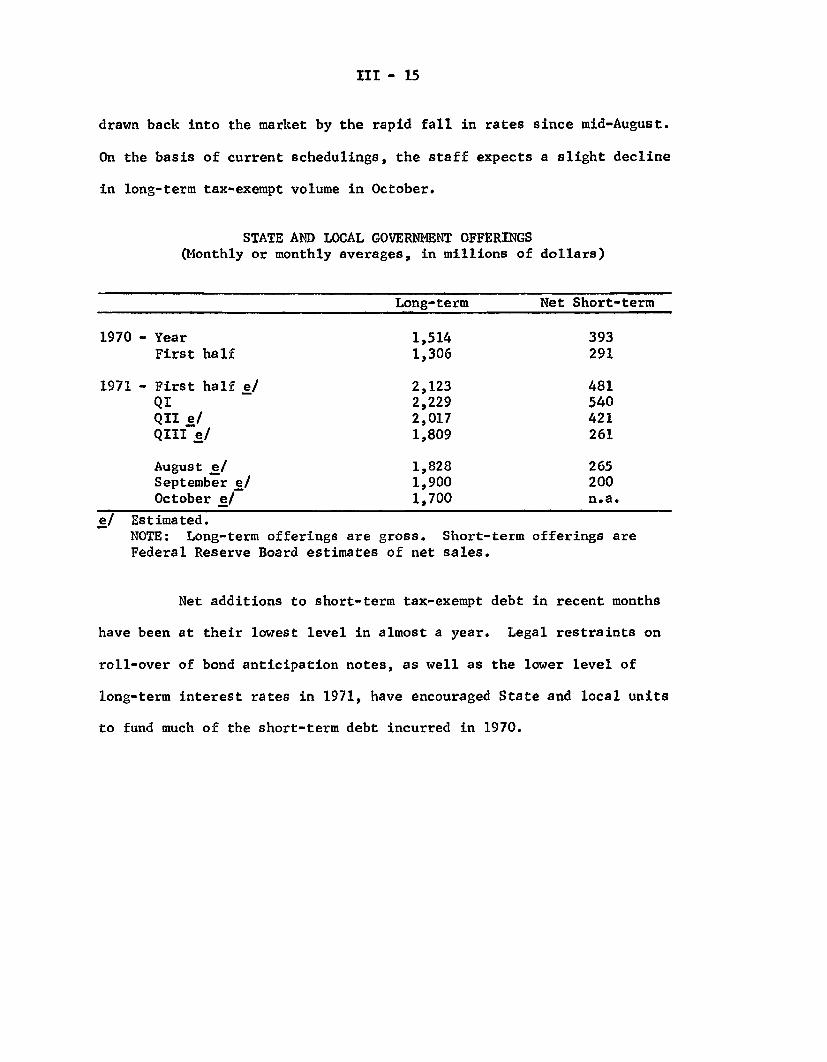
III - 15
drawn back into the market by the rapid fall in rates since mid-August.
On the basis of current schedulings, the staff expects a slight decline
in long-term tax-exempt volume in October.
STATE AND LOCAL GOVERNMENT OFFERINGS(Monthly or monthly averages, in millions of dollars)
Long-term Net Short-term
1970 - Year 1,514 393First half 1,306 291
1971 - First half e/ 2,123 481QI 2,229 540QII e/ 2,017 421QIII e/ 1,809 261
August e/ 1,828 265September e/ 1,900 200October e/ 1,700 n.a.
e/ Estimated.NOTE: Long-term offerings are gross. Short-term offerings areFederal Reserve Board estimates of net sales.
Net additions to short-term tax-exempt debt in recent months
have been at their lowest level in almost a year. Legal restraints on
roll-over of bond anticipation notes, as well as the lower level of
long-term interest rates in 1971, have encouraged State and local units
to fund much of the short-term debt incurred in 1970.

III - 16
Government securities market. Yields in the Treasury bill
market have risen in the latest week, more than erasing the declines
registered in the first two weeks following the August 24 Committee meet-
ing. Nevertheless, bill yields at their current levels are 1/4 to 1/2
per cent below those prevailing just prior to the President's mid-August
economic statement. The key 3-month bill, for example, was bid at 4.87
per cent on September 14, down 28 basis points from its August 13 level,
but 12 basis points above the level prevailing at the time of the August
Committee meeting.
MARKET YIELD ON U. S. GOVERNMENT AND(Per cent)
AGENCY SECURITIES
1971 Weekly average for week endingDaily highs 1/ Daily lows 1/ Aug. 24 Aug. 31 Sept. 7 Sept. 14
5.335.535.846.01
6.917.037.116.956.56
(7/19)(7/19)(7/27)(7/28)
(7/28)(8/10)(8/10)(8/28)(6/15)
6.20 (7/23)6.56 (7/28)7.33 (8/12)7.45 (8/13)
2.073.223.353.45
4.274.745.155.385.69
3.673.934.70
(3/12)(3/11)(3/11)(3/11)
(3/22)(3/22)(3/23)(3/23)(3/23)
(3/16)(3/16)(3/24)
5.12 (3/23)
and low rates in parentheses.
Bills
1-month3-month6-month1-year
Coupons
3-year5-year7-year10-year20-year
Agencies
6-month1-year3-year5-year
4.664.664.775.16
5.996.226.376.386.16
5.485.916.686.90
4.624.584.845.15
5.916.166.316.346.15
5.435.906.596.86
4.494.544.845.14
5.826.046.146.156.02
5.355.806.446.73
4.534.715,005.22
5.946.166.216.146.04
5.375.796.376.63
1/ Latest dates of high

III - 17
The most recent upward yield adjustment in the bill market
reflects several factors. There has been a substantial reduction in
foreign demand as the combination of floating rates and foreign exchange
restrictions has greatly reduced the volume of dollar inflows to foreign
central banks. In addition, the cost of dealer financing has remained
relatively high as the Federal funds rate has been typically over 100
basis points above the rate on 3-month bills. Furthermore, overall
yield declines for other short-term money market instruments have been
less pronounced than for bills and have helped to generate market
sentiments that bill rates had been initially driven unrealistically
low in the wake of the President's message.
In the coupon sector of the Treasury market, yields have also
increased in the last week but on balance remain 10 to 25 basis points
below the levels preceding the last meeting and 50 to 60 basis points
below levels prevailing August 13. The results of the Treasury auction
on August 31 of a $1.25 billion 5-year 2-month note generated considerable
optimism in the market. In view of the provision for full tax and loan
account credit the new issue was largely taken by banks at an average
yield of 5.98 per cent, considerably below earlier market expectations.
The recent upward adjustment in yields may reflect, in part, some caution
on the part of investors as a result of the persistent tightness of the
federal funds market, the cool reception accorded a number of recent new
issues in the corporate and municipal markets, and the upward movements
of bill yields.

III - 18
DEALER POSITIONS IN GOVERNMENT AND AGENCY SECURITIES(In millions of dollars)
AugustDaily average Aug. 23 Aug. 30 Sept. 3 Sept.13
Treasury securities
Total 2.898 2,766 3,636 3,784
Treasury bills (total) 2 244 1,949 2369 2,489 2,604
Due in 92 days or less 1,089 825 1,132 1,148 1,119
93 days or over 1,155 1,125 1,237 1,341 1,485
Treasury notes and bonds(Total) 654 816 799 1,147 1,181
Due within 1-year 228 199 217 274 298
1-5 years 345 509 503 401 429
over 5 years 81 108 79 472 454
Agency securities
Total 690 689 971 981 859
Due within 1-year 359 373 467 495 414
Over 1-year 331 316 504 486 445
New issue activity in the Federal Agency market was dominated
by a $1 billion FNMA offering on August 26 that raised $552 million of
new money. The offering consisted of a $450 million 3-year 3-month issue
priced to yield 6.45 per cent, a $300 million 6-year issue yielding 6.88
per cent, and a $250 million 10-year issueyielding 7.25 per cent. The
total package was well received, with each issue moving to a premium on

III - 19
subsequent days. The Farmer's Home Administration raised $300 million
of new cash on September 10 through a $150 million 5-year issue yielding
6.62 per cent, and a $150 million 15-year issue yielding 7.50 per cent.
This financing was also well received. The FHLB announced that it would
issue a 14-month bond on September 15 that would result in a $90 million
net pay down. Yield movements on outstanding agency securities have
generally paralleled those in the market for direct Treasury obligations.
III - 20
Other short-term credit markets. Total commercial and
finance company paper outstanding dropped by about $200 million to $29.2
billion in August, following much sharper declines, averaging nearly
$700 million, in June and July. About a third of the August decline
was accounted for by a reduction in bank-related paper. Of the non-
bank paper, dealer-placed commercial paper fell by $200 million over the
month on a seasonally adjusted basis, but this was partly offset by an
increase of around $70 million in finance company paper.
Interest rates on commercial paper and finance company paper
fell by 1/8 to 1/4 of a percentage point in the two weeks following
the President's mid-August announcement of his new economic program,
but have been about unchanged since then, with the 3-month commercial
paper rate remaining 1/8 per cent below the 6 per cent bank prime
rate. Yields on bankers' acceptances have changed little during the
past several weeks. Most new issue CD rates fell by 1/2 of a percentage
point over the third and fourth weeks of August, but more recently
have moved up slightly, possibly to counteract seasonal runoffs of
such deposits.

III - 21
SELECTED SHORT-TERM INTEREST RATES(Wednesday Quotation-Discount Basis)
1970 1971 Net changeHighs Lows Aug 11 Aug 18 Aug 25 Sept 8 Aug 11--Sept 8
1-month
Commercial paper 9.25Finance paper 9.00Bankers' acceptances 9.00Certificates ofDeposit--new issue 1/ 7.75
Treasury bill 7.84
5.505.005.50
5.004.58
5.755.505.75
5.635.255,88
5.505.255.75
5.635.255.75
5.50 5.25 5.00 5.255.17 4.81 4.69 4.45
3-month
Commercial paper 9.25Finance paper 8.25Bankers' acceptances 9.00Certificates of
Deposit--new issue 1/ 6.75Treasury bill 7.93
6.005.505.50
5.504.74
6.005.505.88
6.005.506.00
5.885.385.88
5.885.385.88
5.75 5.50 5.25 5.505.22 4.78 4.73 4.60
6-month
Bankers' acceptancesTreasury bill
9.00 5.50 6.00 6.13 6.00 6.007.99 4.78 5.67 4.84 4.95 4.89
12-month
Certificates ofDeposit--new issue 1/ 7.50
Treasury bill 7.62
Prime municipal notes
5.504.74
5.80 2.95
6.25 5.88 5.75 5.755.91 5.22 5.21 5.15
3.60 3.00 3.20 3.00
1/ Investment yield basis. Highs foeffective as of January 21, 1970.
r certificates of deposit are ceilings
Source: Wall Street Journal's Money Rates for commercial and finance paper and
bankers' acceptances; all other data from the Federal Reserve Bank ofNew York.
-. 12-. 25-- m
-. 25-. 72
-. 12-/12--1
-. 25-. 62
-. 78-. 78
-. 50-. 76
-. 60

III - 22
COMMERCIAL AND FINANCE COMPANY PAPER(End-of-month data, in millions of dollars)
1971 1971 1971June July August-
Total commercial andfinance paper 1/ 30,080: 29,397 29,203
Bank related 2/ 1,733 1,808 1.744Nonbank related 3/ 28,347r / 27,589 27,459
Placed through dealers 11,577 r 11,459 11,261Placed directly 16,770; 16,130 16,198
Total commercial andfinance paper 1/ -650 / -683 -194
Bank related 2/ - 15 + 75 - 64Nonbank related 3/ -6351/ -758 -130
Placed through dealers -845 -118 -198Placed directly +210. / -640 + 68
1/ Combines seasonally adjusted nonbank-related paper and seasonallyunadjusted bank-related paper.
2/ Seasonally unadjusted.3/ Seasonally adjusted.4/ Based on data for the week ending September 1, 1971.r/ Revised.
Federal finance. Estimates budget receipts and outlays for
fiscal year 1972 are quite tentative at the moment, since the Congressional
response to the President's fiscal package is not yet clear, but
assuming the President's proposals to be adopted the staff has estimated
that the deficit for fiscal year 1972, on a unified budget basis, would
be about $27 billion. The likely effects of the fiscal changes recommended
by the President are analyzed in detail in an Appendix to the Greenbook
supplement.

III - 23
Briefly, in making estimates of tax receipts the staff has
assumed, as it also did for the last Greenbook, that the investment
tax credit, the automobile excise repeal and the acceleration of
personal tax relief will each be passed in the form proposed, although
estimates of the initial impact of these measures on receipts have been
revised downward slightly. On the other hand, the estimate of receipts
from the import surcharge has been increased by about $1 billion
because the staff is now assuming that the surcharge will remain in
effect for the full fiscal year. The staff estimates that the
President's package of requests would result in a net reduction of $4.2
billion in its estimate of receipts for the current fiscal year.
On the outlays side of the unified budget, staff estimates
for fiscal year 1972 are somewhat below those of the Administration.
Uplike the OMB, the staff assumes a 5 per cent increase in Social
Security benefits starting in January, but general revenue sharing,
which is now included in the Administration estimate as of January, is
entirely excluded from the staff estimate for the current fiscal year.
Also the staff estimate of outlays has been lowered somewhat since the
last Greenbook, mainly because Social Security reform measures that were
previously projected to because effective in January 1972 are no longer
expected to affect fiscal 1972 outlays. Other expenditure adjustments
proposed by the President are incorporated in the staff estimates,

III - 24
including the six month delay of the Federal pay raise and the 5 per
cent reduction in Federal employment, which would reduce fiscal 1972
outlays by $1.3 billion and $.8 billion, respectively. The President's
package of requests would reduce staff estimates of outlays by $3.9
billion, on net, in fiscal year 1972.
Staff estimates of the high employment budget on a national
income accounts basis, show an approximate balance in fiscal year 1972,
even with the proposed fiscal changes. However, computation of the
high employment budget on a unified budget basis shows a deficit of
about $5 billion for this fiscal year; on the same basis the Administra-
tion calculates a deficit of around $8 billion in its official high
employment budget estimate. The revision of the staff's high employ-
ment budget estimates and the difference between the staff and
Administration figures are explained in the Appendix to the supplement.
Congressional actions could alter the outlook significantly.
Some changes in the President's package are being suggested that would
cut revenues further, such as making the investment tax credit retroactiveto April 1, 1971, extending it to used as well as new equipment,and increasing the minimum standard deduction for the personal income
tax. On the other hand, there are also press reports that Congressman
Mills favors a straight 7 per cent rather than a 10 per cent-falling-to-
5 per cent investment credit, and reversal of the recently adopted
liberalized depreciation regulations.

III - 25
Projections of the Treasury cash balance and of Treasury
borrowing are quite uncertain because it is not known to what extent
the recent special foreign issues will be redeemed in coming months.
The balance at the end of September is estimated to be $8.6 billion,
assuming no further foreign redemptions and full repayment of special
Treasury certificates sold to foreign branches as they mature. No
new borrowing is expected until mid-October, when $3 to $4 billion of
new money might be needed. Further borrowings and increases in the
size of weekly bill offerings are projected from mid-October to mid-
December, as the cash balance falls to a seasonal low in early November.
The projected $8 to $9 billion in net new cash borrowing between now
and the end of the year would be greater if there were substantial
redemptions of special foreign securities.

FEDERAL BUDGET ANDTable 1
FEDERAL SECTOR IN NATIONAL INCOME(In billions of dollars)
ACCOUNTS 1/
I F. R. Board Staff estimatesFiscal Calendar Fiscal Year 1972e/ Calendar QuartersYear Year 1971 Adm. 2. F.R. 1971 19721971* F.R. Board Estimate- Board II* III IV I II
Federal Budget
(Quarterly data, unadjusted)Surplus/deficit -23.2 -26.6 -27.5 -27.6 1.6 -8.7 -11.3 -10.6 3.1
Receipts 188.3 193.5 204.5 202.9 56.7 48.9 43.8 48.5 61.7Outlays 211.6 220.0 232.0 230.5 55.1 57.6 55.1 59.1 58.6
Means of financing:Net borrowing from the public 19.4 20.3 n.a. 24.2 1.6 8.5 8.6 8.1 -1.0Decrease in cash operating balance -.8 2.8 n.a. 2.6 -4.3 .2 3.2 .8 -1.7Other 3/ 4.5 3.4 n.a. .7 1.1 -.1 -.5 1.7 - .4
Cash operating balance, end of period 8.8 5.3 n.a. 6.2 8.8 8.5 5.3 4.5 6.2
4/Memo: Net agency borrowing- 1.1 1.6 n.a. n.e. -.9 1.5 2.0 n.e. n.e.
National Income Sector
(Seasonally adjusted annual rate)Surplus/deficit -19.0 -23.1 n.a. -26.8 -22.6 -25.1 -27.2 -29.4 -25.6Receipts 193.6 198.8 n.a. 205.6 198.3 199.4 202.0 207.6 213.3Expenditures 212.7 222.0 n.a. 232.4 220.9 224.5 229.2 237.0 238.9
High employment surplus/deficit(NIA basis) 5/ 1.3 1.7 n.a. -.1 .9 2.4 1.1 -3.4 -.7
* Actual e--projected n.e.--not estimated n.a.--not available1/ Reflects effects of total additional depreciation allowable under Treasury's newly-approved "accelerated
depreciation range" guidelines, which are effective as of the beginning of 1971.2/ In testimony before the House Ways & Means Committee on Sept. 8, 1971, Secretary Connally disclosed the current
Administration budget deficit estimate of $27.0--28.0 billion and the updated outlays estimate of $232.0billion. These figures would imply a receipts estimate ranging from $204.0--205.0 billion.

Footnotescontinued FEDERAL BUDGET AND FEDERAL SECTOR IN NATIONAL INCOME ACCOUNTS 1/
(In billions of dollars)
31 Includes such items as deposit fund accounts and clearing accounts.4/ Federally-sponsored credit agencies, i.e., Federal Home Loan Banks, Federal National Mortgage Assn.,
Federal Land Banks, Federal Intermediate Credit Banks, and Banks for Cooperatives.5/ Estimated by F.R. Board staff.

III - 2
Table 2
PROJECTION OF TREASURY CASH OUTLOOK(In billions of dollars)
Total net borrowing
Weekly and monthly billsTax billsCoupon issuesAs yet unspecified new
borrowingOther (debt repayments, etc.)
a/Plus: Other net financial sources- /
Plus: Budget surplus or deficit (-)
Equals: Change in cash balance
Memoranda: Level of cash balance,end of period
Derivation of budgetsurplus or deficit:Budget receiptsBudget outlays
Maturing coupon issuesheld by public
Net agency borrowing
a/ Checks issued less checks paid andb/ Actual.c/ The August refunding fell short of
Aug.
6.9
.6
-2.7
3.6
-. 9
-3.7
2.3t
9.5-/
16.019.7
Sept.
-2.6
.6
1.2
-4.4
1.2
.4
-1.0
Oct.
2.8
.4--
3.5-1.1
1.1
-6.6
-2.7
8.5
19.719.3
12.819.4
4.1 /
0.2 0.4
other accrual items.
its goal by $1.4 billion.
0.8

FINANCIAL DEVELOPMENTS - UNITED STATESBILLIONS OF DOLLARS, SEASONALLY ADJUSTED, RATIO SCALE
BANK RESERVES
TOTALAUG 317,
MONEY AND TIME DEPOSITS
MONEYAUG 228 0
TIME DEPOSITSAUG 2581
I i 1 111,,, ,1,1 n I Il n
BANK CREDIT
TOTALAUG 4650
LOANSAUG 3057
BUSINESS LOANSAUG 1154
OTHER SECURITIESAUG 975
SAVINGS ACCOUNTS
SAVINGS & LOAN ASSN.AUG 166 4
MUTUAL SAVINGS BANKSAUG 780 ,,
.... ... Ii ......111
1971 1969 1971
-'45
I 35
-30
-25
- 11
- 9
9/14/71III-C-1
1969

II-C-2FINANCIAL DEVELOPMENTS - UNITED STATES
NET FUNDS RAISED NONFINANIAL SECORSSEASONALLY ADJUSTEDANNUAL RATE
TOTAL01 1614
LESS FEDERALGOVERNMENT .
SII I I I I
HOUSEHOLDS AND BUSINESS
NET FUNDS RAISEDT 91 5
NET CAPITAL OUTLAYSon 740
SI I I i I
PERCENT
'ER
- 8
CORPORATE VI I I I I I I I I I 1 1
STATE AND LOCAL GOVERNMENT
1971AUG 18
1970
1969II I I - I I 0
SHARES IN FUNDS SUPPLIED
SNONBANK FINANCESQI 433
9/14/71
PER CENT
-50
+0
50
-50
+-0
50
MAR. JUNE SEPT. DEC.

IV - 1
THE ECONOMIC PICTURE IN DETAIL
International Developments
Foreign exchange markets. Following the re-opening of
official foreign exchange markets in Europe on August 23, trading
volume gradually returned to near pre-crisis levels, though activity
in the New York market remains depressed. Bid-offer spreads narrowed
substantially as traders became more accustomed to dealing with
floating currencies and as fluctuations in the levels of the rates
moderated. Forward markets in European currencies were re-established,
but volume in those market remains substantially reduced, mainly
because of a reduction in short-term capital movements brought about
by the institution of a variety of exchange control measures in a
number of countries.
The Japanese exchange markets stayed open throughout, with
the Bank of Japan defending the old parity for two weeks after the
United States suspended gold convertibility. During those two weeks,
Japanese exporters accelerated their conversions of export proceeds
and Japanese banks borrowed heavily abroad for conversion into yen,
with the result that the Bank of Japan absorbed some $4.2 billion
from the market before it suspended the upper intervention limit.
As shown in the table below, major foreign currencies, with
the exception of the yen, have appreciated very little since
August 13, and are generally at levels well below what we would expect

IV - 2
long-run equilibrium rates to be. Meanwhile, LDC's on the average
have not changed their rates against the dollar significantly (see
below, section on foreign reactions).
Spot Foreign Exchange RatesNew York Market, Sept. 15
Per Cent over Par Per Cent over Aug. 13 Rate
Sterling 3.0 2.1DM 8.7 0.5Dutch guilder 5.7 1.0Swiss franc 2.6 1.9French franc
commercial 0.8 0.0financial 4.1 4.1
Belgian franccommercial 4.3 3.4financial 4.3 1.7
Italian lira 1.9 1.2Japanese yen 6.7 5.8Canadian dollar 6.6 -0.3
Swedish krona 2.1 1.7Danish krona 2.5 2.3Norwegian krone 3.4 2.6Austrian schilling 1.4 2.2Spanish peseta 0.1 0.9
Note: These changes do not measure the weighted change of eachcurrency against all other currencies, but only against theU.S. dollar.
The reasons for the absence of greater upward pressure on rates of the
industrial countries include (1) the fact that the 10 per cent U.S.
surcharge on dutiable non-quota imports is felt as the partial
equivalent of changes in exchange rates, (2) the reluctance of
speculators -- with large positions already taken -- to plunge deeper
until they can see the future more clearly, (3) the continuing

IV - 3
restraint exerted by U.S. controls on outward flows of U.S. bank funds
and corporate capital, and (4) the actions adopted by various foreign
countries to limit the appreciation of their currencies. Such actions
have ranged from exchange market intervention (Japan, Italy) to the
establishment of two-tier exchange markets (France, Netherlands) to
selective exchange controls (U.K., Japan, Switzerland). (For further
discussion of the latter measures see below.)
The Bank of Japan continues to intervene in the
market, though at rates well outside the former margin. The Bank
of Japan no longer reports its intervention activity, but we under-
stand that its reserve gains have exceeded $500 million since the
controlled float was begun. The progressive tightening of Japanese
exchange controls, notably a freeze on increases in non-resident yen
accounts at Japanese banks, has made trading in yen extremely difficult,
particularly outside of Japan. The Frankfurt bourse last week
suspended an official fixing of the yen rate, on the grounds that it
was practically impossible for German banks to deal in yen. On
September 10 the German government officially requested the Japanese
government to take actions to remedy what has been widely termed a
"breakdown" in the yen payments mechanism.
In other official intervention, the Bank of Italy purchased
some $200 million the first week after the Italian market was
officially re-opened. That bank stopped providing intervention

IV - 4
figures after August 27; we know that it has intervened after that
date, but we do not have any good indication of the magnitude of
such intervention.
The Bank of France purchased $170 million in the first
two weeks of operating under its two-tier system, intervening in the
commercial franc market at the old upper limit. There was some
feeling in the market (and at the Bank of France) that after the
Japanese yen was floated the franc would come under great speculative
pressures. This did not, in fact, occur, and the Bank of France
last week sold $50 million, citing a pickup in payments by French
importers as contributing to an easing of the franc.
The Netherlands Bank purchased a moderate amount of Belgian
francs, under a bilateral agreement to limit fluctuations in the
guilder/franc exchange rate to 1.75 per cent on either side of the
old guilder/franc parity. Press reports suggested that the two
countries have not been happy with the working of this agreement,
but both central banks vehemently denied such reports and again
urged that such an arrangement be broadened to include the entire
European Economic Community.
Euro-dollar market. Euro-dollar rates, which had risen
sharply in early August, have remained at very high levels since mid-
August. The movement away from dollar-denominated assets, and the use
of dollar borrowings to move into foreign currencies, which largely

IV - 5
accounted for the rise in Euro-dollar rates, have not been reversed.
Continued uncertainty concerning the exchange value of the dollar
makes foreigners hesitant to acquire dollar deposits, and this has
led to a thin market in Euro-dollars and sharp daily movements in
rates.
SELECTED EURO-DOLLAR AND U.S. MONEY MARKET RATES
Average for (1) (2) (3) (4) (5) (6)month or Over- (1)-(2) 3-month 60-89 day (4)-(5)
week ending Night Federal Differ- Euro-$ CD rate, Differ-Wednesday Euro-$-1 Funds-2 ential Depositi/ (Adj.)- ential1971
Jan.-Mar. 4.68 3.87 0.81 5.52 4.41 1.11
April 5.05 4.15 0.90 5.92 4.41 1.51May 8.52 4.63 3.89 7.04 4.97 2.07June 4.89 4.91 -0.02 7.15 5.47 1.68July 5.39 5.28 0.11 6.47 5.81 0.66
Aug. 4 11.54 5.57 5.97 6.84 5.92 0.9211 5.82 5.59 0.23 7.43 5.92 1.51
18r 12.14 5.59 6.55 8.70 5.66 3.0425 6.03 5.48 0.55 8.46 5.39 3.07
Sept. 1 28.48 5.59 22.89 9.16 5.59 3.578 5.17 5.73 -0.56 8.76 5.62 3.1415P 5.84 5.66 0.18 8.09 5.62 2.47
1/ All Euro-dollar rates are noon bid rates in the London market;overnight rate adjusted for certain technical factors to reflect theeffective cost of funds to U.S. banks.2/ Effective rate.3/ Offer rate (median, as of Wednesday) on large denomination CD's by
prime banks in New York City; CD rates are adjusted for the cost ofrequired reserves.
p/ Preliminary.
Potential U.S. suppliers of dollars have apparently been
unwilling or unable to take advantage of arbitrage incentives to
move funds to the Euro-dollar market in sufficient quantities to

IV - 6
lower the Euro-dollar rate structure. The VFCR and OFDI programs
limited the potential outflow as banks and non-bank corporations
subject to these regulations were near or at their ceilings at month-
end. In addition U.S. residents undoubtedly participated in the
movement into foreign currencies due to exchange uncertainties. It
is possible that U.S. market participants who closely manage their
financial assets had switched a substantial share of their available
funds into foreign currencies. Meanwhile, less sensitive U.S.
investors have not yet responded to higher yields available on Euro-
dollars. If the arbitrage advantage exists for an extended period,
we would expect U.S. residents to begin to acquire more Euro-dollars,
particularly since the opportunity to purchase foreign currency assets
has been limited by exchange controls instituted in most major
foreign countries.
Japanese banks were heavy borrowers in the Euro-dollar
market before month-end and during the first week of September, but
this source of demand was probably eliminated by the very severe
tightening of Japanese exchange controls on September 7. Additionally,
dollars were in demand to roll over short positions taken earlier.
The Euro-dollar yield curve in recent weeks has had an
unusual shape, influenced by market views of when some further
depreciation of the dollar might occure. Except for unusually high
rates at month end, overnight Euro-dollar rates have been easy
compared to rates for longer maturities, and at times lower than the

IV - 7
U.S. federal funds rate. This is what might be expected since on
any given day the probability of exchange loss to the holder of an
overnight dollar deposit is near zero. This is particularly true
under current market conditions, since major currencies have already
appreciated to some extent, and further appreciation is being resisted
by most major foreign countries.
After a net fall in U.S. banks' liabilities to branches
during the week ending Wednesday, September 1, of $172 million,such
liabilities have risen by $99 million as of Monday, September 13.
The Treasury allowed an additional $516 million in special Euro-
dollar issues to run off on September 14, bringing the remainder
outstanding to a level of $1.5 billion.
U.S. balance of payments. The abrupt worsening of the U.S.
balance of payments in the first half of this year was spread through-
out the major sectors of the accounts except services (shown in the
table below).
After a recovery in June that was probably the result of
quarter-end window dressing and perhaps some profit taking after the
May appreciation of the DM, the official settlements deficit rose to
$2.5 billion in July. Then in August it ballooned to roughly $9
billion (monthly figures). Some countries (mainly Japan) continued to
resist appreciations of their currencies after August 15 and to take
in dollars, so that sizable U.S. deficits with foreign official reserve
holders continued into September.

IV - 8
U.S. INTERNATIONAL TRANSACTIONS(billions of dollars; seasonally adjusted annual rates)
Change1970 1971 1H70 to
Year IH 2H 1H 1I71
Trade balance +2.1 +2.5 +1.7 -1.5 -4.0Services, net +1.5 +1.4 +1.6 +3.8 +2.4
Goods & services balance +3.6 +3.9 +3.3 +2.3 -1.6
Remittances & pensions -1.4 -1.4 -1.4 -1.4
U.S. Gov't grants & capital/-net -3.8 -3.6 -3.8 -4.4 -.7
Long-term private capital -1.5 -2.5 -.4 -5.3 -2.8
Balance on current accountand long-term capital -3.0 -3.7 -2.3 -8.9 -5.2
Nonliquid short-term private capital -.5 -.5 -.6 -1.7 -1.2Errors and omissions -1.1 -.9 -1.3 -6.7 -5.8
Net liquidity balance(excluding SDR allocations) -4.7 -5.1 -4.3 -17.3 -12.4
Private liquid capital -6.0 -4.3 -7.7 -5.9 -1.6
Official settlements balance(excluding SDR allocations) -10.7 -9.4 -12.0 -23.2 -13.8
1 / 1 1 * -* 1 - * - * * * - _ X _ -1- . _ -«_ - _ _ . f f _ 1 , _ -_141/ Includes nonliquid liabilities to
holders.p/ Preliminary. (Confidential until
other than official reserve
published)
Mounting capital outflows this year, both recorded and un-
recorded, were reactions first to the widening of interest rate differ-
entials and then, by April, to growing apprehension about the stability
of the dollar. These apprehensions probably also tended to worsen the

IV - 9
merchandise trade accounts, adding to other temporary adverse factors
such as reactions to actual and potential work stoppages in the United
States. The strength of these speculative and temporary factors is, of
course, difficult to judge, but they caused overall deficits considerably
greater than would have occurred from basic forces alone. On the other
hand, the fact that the United States economy was still far below its
high-employment potential, while on average other industrial countries
were operating with less slack, tended to hold down the size of the
possible trade deficit.
Weakness in the trade account carried into July, but during
the rest of the year some recovery from the $4.2 billion annual rate
trade deficits of the April-July period is expected, as discussed in
the next section. On the other hand, the strong showing of the services
sector of the current account in the first half of this year resulted
largely from lower income payments, and higher income receipts, the
latter including some extraordinary direct investment dividends. After
mid-year, interest payments will reflect much larger liabilities and
higher interest rates than the average of the first half. Consequently,
net receipts on services are projected at an annual rate of about $2.0
billion in the second half, down from the $3.8 billion rate of the
first half. The combined balance on goods and services is now projected
at a minus $1 billion rate in the second half.
A striking feature of the first-half balance of payments was
a sharp rise in the net outflow of private long-term capital to an

IV - 10
annual rate (seasonally adjusted) of over $5 billion. This was more
than double the rate of outflow in the first half of the previous year.
In addition, there was a sharp upturn in the outflow of short-term
capital apart from outflows classed as "liquid". Nearly half of the
$4.0 billion (annual rate) year-over-year increase in recorded outflows
of these two classes was connected with U.S. direct foreign investments
and other corporate capital flows. While the gross outflow of U.S.
corporate capital was only moderately higher than in the first half
of 1970, corporate borrowing abroad -- especially short-term financing --
was sharply reduced, so that the net use of U.S.-source funds was much
higher than in other recent periods. In fact, it exceeded the total for
the year 1970. Some of the increase in net outflow probably reflected
exchange rate uncertainties as well as the rising costs of borrowing
abroad. However, net outflows in the remainder of the year are likely
to be sharply reduced, as they were in the last half of 1970.
Other adverse elements in the first-half recorded capital
accounts were a much reduced inflow of foreign capital for direct
investments in the United States and to purchase U.S. corporate stocks,
and larger outflows of U.S. capital to purchase foreign corporate stocks
(mainly Japanese). Movements of "liquid" capital included a further
large repayment of liabilities to commercial banks abroad during the
first quarter.
In addition to recorded capital flows, unrecorded transactions
(probably largely leads and lags on trade and other payments, and capital

IV - 11
flows) shot up to over $1 billion in the first quarter and to $2.3
billion in the second. These quarterly amounts compare with a "normal"
annual figure of about $1 billion. The massive size of the July-August
deficits suggests that in the third quarter these unrecorded flows were
even larger than in the second quarter.
Presumably the actions taken by the President on August 15,
and the actions taken abroad since that time to allow some appreciations
of exchange rates and to raise barriers against further capital inflows,
have slowed down the outflow of funds from the United States. However,
it appears that exchange market conditions will be unsettled for many
months, and that trade and other transactions will be far from normal.
While these conditions persist there is unlikely to be any major un-
winding of positions taken during the speculative flurries.
U.S. foreign trade. In July the U.S. trade balance showed
another large deficit -- for the fourth successive month. For the
four months of April-July the trade deficit was at an annual rate of
$4-1/4 billion (balance-of-payments basis). This contrasts with a
surplus at a rate of about $1 billion in the first quarter, and a
surplus of about $2 billion in 1970.
The levels of both exports and imports in July were sub-
stantially lower than in June -- 4-1/2 and 5-1/2 per cent respectively --
principally because of the closing of West Coast ports in early July
by the longshoremen's strike and because of the selective domestic

IV - 12
rail and coal strikes that occurred in July. The shutdown of West
Coast ports probably affected imports more than exports since about
15 per cent of total imports arrive by vessel through these ports
compared with departures amounting to about 9 per cent of total
exports. Imports from Japan were particularly hard-hit by the strike;
they were down about 30 per cent from June. Nearly one-half of U.S.
imports from Japan arrive by vessel through West Coast ports.
The decrease in the July trade figures also reflected a
considerable decline in the seasonally adjusted movement of automobiles
to and from Canada. Determination of the appropriate seasonal factor
for July is difficult because of variation in timing of the model-year
changeover.
It is an unsettled question as to how much of the recent
deterioration has resulted from temporary factors such as anticipation
of, or the effect of, domestic strikes (longshoremen, steel, aluminum,
etc.), anticipation of the imposition of "voluntary" controls by
foreign governments on their industries' sales to the United States,
and the increasing possibility of changes in currency values. Obviously
these factors cannot be fully quantified, and some of them tend to reduce
imports as well as exports. We are guessing that these elements may have
accounted for about a third to a half of the trade deficit in the past
four months. This guess implies an underlying trade deficit (not
cyclically adjusted) of between $2-1/4 - $2-3/4 billion at an annual
rate in the last four months.

IV - 13
While some temporary elements have already ended -- in
particular, the coal and railroad strikes,the effect of which was
greatest on exports -- others are likely to persist for several more
months. The current West Coast dock strike may spread to East and
Gulf Coast ports as the labor agreement affecting workers in these ports
expires on October 1. The uncertainties regarding the duration of the
surcharge imposed by the President on most dutiable imports on August 15,
and expectations of currency changes resulting from the floating of the
dollar on exchange markets, are likely to result in some hesitation by
traders as they attempt to assess the impact of these actions on their
export or import positions. Consequently, inventories of U.S. goods
abroad, and of foreign goods in the United States, are both likely to
be sharply reduced in the next few months.
However, the import surcharge and the changes in parities
since August 15 -- small so far, averaging about 3 per cent against
the dollar (as measured by several alternative weighting methods) --
should begin to have some effect in reducing the trade deficit before
long. Although any estimate of the trade balance for the remainder
of this year can only be highly tenuous because of the factors outlined
above, we are projecting the trade deficit in the fourth quarter to be
close to $3 billion at an annual rate.
Looking a little further ahead, if it is assumed that the
surcharge is maintained for a year and that about a third of the impact

IV - 14
on the cost of imports is absorbed by foreign exporters or American
distributors, the surcharge could reduce dollar payments to foreign
suppliers by an annual rate of $1-1/2 billion by mid-1972. This also
assumes that there would be no retaliation by foreign countries, either
directly in the form of restrictions against U.S. exports or indirectly
through subsidies to their export industries.
It is estimated that the import surcharge would have a
substantial impact on the domestic economies of Japan and, to a
somewhat lesser extent, Canada, among the industrial countries. Its
effect would be proportionately even greater on a number of the develop-
ing countries, as shown in the table below. For these countries,
exports affected by the surcharge are a substantial part both of
their total exports and of their GNP. In most major industrial
countries other than Japan and Canada the effect of the surcharge
will be relatively less significant.
The effect of the present limited appreciation of foreign
currencies reducing the dollar value of U.S. imports by mid-1972 may
be relatively small -- perhaps about $1/4 billion (annual rate) --
but the effect in raising the dollar value of U.S. exports could be
considerably greater -- perhaps about $3/4 billion. (See Appendix A
for an explanation of the differential effects of a surcharge and a
devaluation.) In total, it is quite possible that these factors could
result in an improvement in the trade balance of between $2 and $3 billion

IV - 15
SELECTED COUNTRIES AFFECTED BY THE U.S. 10 PER CENTSUPPLEMENTAL DUTY ON IMPORTS
Per cent of Per cent of Exports affectedtotal exports exports to as per cent
affected U.S. affected of GNP
A. Industrial countriesJapan 29 94 3Canada 16 25 4Germany 9 94 2Italy 9 86 1United Kingdom 3 72 1Belgium-Luxembourg 5 84 2France 4 83 1Netherlands 3 75 1
B. Less developed countriesMexico 52 60 3Korea 41 95 5China (Taiwan) 36 93 11Haiti 31 37 3Hong Kong 31 83 25
Note: Exports based on 1970 annual data compiled by U.S. Departmentof State; GNP based on annual data for latest year available,primarily from various OECD and United Nations sources.
at an annual rate by the second quarter of 1972. On the assumption that
the new economic program proves successful, the potential increase in
U.S. demand for imports should be blunted by a concomitant improvement
in our relative price position vis-à-vis foreign countries.
Even under these optimistic assumptions, and including a strong
impact from the "temporary"surcharge, it is unlikely that our trade
position will be any better than in balance by the middle of next year.
This suggests that a considerable further realignment of currencies --

IV - 16
over and above the appreciation needed to replace the surcharge --
is required if we are to reach the $5 billion-plus U.S. trade surplus
estimated to be needed under full employment conditions to achieve
some approximate "equilibrium" in our overall payments position.

IV - 17
Official reaction in major industrialized countries to
recent U.S. policy moves. The suspension of gold convertibility
of the dollar induced most major foreign countries to float their
exchange rates. Some central banks, notably Italy and Japan, are
continuing to intervene in the market, but at rates outside the
usual margins, and France has established a two-tier system, main-
taining the old dollar parity for commercial (trade) transactions.
Many additional measures have been adopted by foreign countries to
mitigate the upward pressures on currencies. These measures and
other factors have served so far to limit the extent of dollar
depreciation. However, the U.S. measures have also induced financial
authorities everywhere to give serious consideration, not only to
the much-needed realignment of parities, but also to the future
structure of the international monetary system.
Foreign attitudes toward the President's foreign policy
measures can be summed up as follows:
1. Most countries now seem willing to accept somewhat
greater exchange rate flexibility, at least in the form of
wider bands. The EC Council of Ministers has approved a
recommendation by the EC Commission that the wider bands
with relation to non-EC countries be coupled with progressively
narrower bands within the Community.
2. All countries urge the quick removal of the U.S.
import surcharge, and of the discriminatory features of the

IV - 18
investment tax credit, either on principle or because, in
some cases, they expect serious effects on their exports and
thus on domestic employment. Most European countries, however,
would probably like to see the U.S. capital controls maintained.
Their abolition would enlarge the U.S. capital account deficit,
requiring a larger U.S. current account surplus, which could
conflict with their own balance of payments objectives. Also,
large investments of U.S. capital are sometimes unwelcome as
such.
3. There is widespread agreement abroad that the use of
the U.S. dollar as an international reserve should be curtailed,
so that the United States would no longer be able to finance
its balance of payments deficits merely by increasing its
liquid liabilities to foreign monetary authorities. This
reflects a consensus that the United States should, like other
countries, be subject to balance of payments discipline in
formulating its domestic policies. How this is to be accomplished
has given rise to divergent views. There are some who would like
to see the United States return to gold convertibility (presumably
accompanied by a funding of existing official dollar balances);
but the view is growing that more fundamental changes are needed,
and varying schemes of reserve asset consolidation are under
consideration.

IV - 19
4. There is strong feeling abroad that the United States
should raise the price of gold, if only by a small amount, as
a gesture indicating acknowledgment that some of the responsi-
bility for the existing international disequilibrium rests with
the United States. Moreover, such a move would enable countries
abroad to revalue more relative to the dollar than to gold;
this is viewed as a political advantage in many countries. It
would also reduce the loss in terms of their own currencies of
gold held in international reserves.
A number of press reports, confirmed by confidential
conversations with authoritative foreign officials, indicate a
fairly widespread expectation that most major currencies will con-
tinue their circumscribed floats for some time -- perhaps months --
and, more interestingly, that more than a few foreign officials
seem quite resigned to this prospect. In the meantime, the major
industrial countries are trying to relieve some of the upward
pressures that might otherwise raise the market rates for their
currencies. These upward pressures are, in any event, not very
strong at present, for the reasons discussed on pp. IV - 2-3 above.
The desire to minimize the market appreciation of their currencies
partly reflects the uncertainty, on the part of each country, over
what other countries might do. (Uncertainties of this kind were
diminished a little by Japan's action in allowing an initial apprecia-
tion of the yen.) Equally important is the attempt to establish

IV - 20
bargaining positions for the possible multilateral negotiation of
new parities -- it would be difficult for a country to induce its
trading partners to accept a smaller revaluation for its currency
than the market had already indicated.
Aside from outright support of the dollar through market
intervention, as practiced by France, Italy, and Japan, most countries
have intensified earlier efforts to stem the inward flow of capital,
primarily by means of exchange controls, but also in a few cases by
domestic monetary actions which tend to reduce the incentive for
such flows.
A significant portion of the speculative inflow into Japan
after August 15 took the form of more rapid conversion by exporters
of their foreign exchange receipts. Consequently, the Japanese
authorities on September 1 prohibited foreign exchange banks in Japan
from purchasing export bills with more than six months maturity unless
specific approval is granted.
Regulations concerning the Japanese exchange banks' foreign
positions were also tightened; these banks were forbidden to increase
their external liabilities to foreign banks above the level at close
of business on August 18. This measure, in conjunction with regula-
tions previously in effect which had placed ceilings on the conversion
of foreign exchange assets into yen assets at the Bank of Japan,
sharply limited the potential for enlargement of the Bank of Japan's
dollar reserves. Furthermore, the ceilings on conversions into yen

IV - 21
which formerly had to be met at mid-month and month-end only, now
(as of September 1) have to be met daily. Also on September 1,
the Bank of Japan instructed the foreign exchange banks to freeze
their free yen deposit liabilities to nonresidents at the level
outstanding on August 27.
The United Kingdom similarly introduced control measures
(effective August 31) to discourage speculative inflows. Specifically,
banks, discount houses, and other institutions holding sterling
accounts for nonresidents of the sterling area may not pay interest
on any increase in such balances (although some minor exemptions may
be granted). Financial institutions (including building societies
and trustee savings banks) and local authorities may not accept
further deposits from nonresidents. Nonresidents may not purchase
additional holdings of sterling certificates of deposit, Treasury
bills, and British Government, British Government-guaranteed and
local authority securities having a fixed maturity date earlier
than October 1, 1976. Finally, the extent to which authorized banks
may convert foreign currency assets into sterling is being restricted.
Switzerland has taken three measures to discourage inflows
of capital. First, under a gentlemen's agreement with the banks
effective August 16, the banks will not pay interest on Swiss franc
deposits owned by any nonresidents in excess of the balance on
July 31. Second, under the same agreement, the banks must keep a
100 per cent, non-interest-bearing reserve against any increase in

IV - 22
their net foreign liabilities since July 31. Finally, the three
largest banks have agreed to block, for three months, additions
to foreign customers' Swiss franc balances over and above a daily
minimum per customer, if the francs are acquired at a rate showing
an appreciation of the franc relative to the dollar of 3 per cent
or more from the official parity; so far, such conditions have
been present only on the first day.
The Netherlands has acted to reduce foreign purchases of
Dutch bonds, which have been a major vehicle for capital inflows.
Under regulations effective September 6, nonresidents may purchase
bonds denominated in guilders from residents only with new "obligatie
guilders," obtainable only from the sale by nonresidents of bonds
denominated in guilders. Thus, total holdings of Dutch bonds by
nonresidents cannot be increased.
As far as non-exchange rate actions in other countries are
concerned, France and Germany maintained their prohibition against
payment of interest on bank liabilities to nonresidents; the pro-
hibition is now obligatory in both countries (it had been only
voluntary in France). Germany continues to seek legislation enabling
the authorities to limit external borrowing by the corporate nonbank
sector. Austria intensified its control over capital imports. Italy
took no new actions, nor did Belgium or Canada.
In addition to the various control measures just mentioned,
some countries have taken domestic monetary actions that may tend

IV - 23
to reduce upward pressures on their currencies. It is, of course,
difficult to ascertain the extent to which monetary conditions abroad
are deliberately kept easier than domestic economic objectives would
warrant in an attempt to reduce the inflow of interest-sensitive funds.
When the Bank of England, for example, cut Bank rate from 6 to 5 per
cent on September 2, it indicated explicitly that the move was con-
sistent with recent exchange control measures to discourage speculative
inflows. But an easing of monetary conditions was also consistent
with the Government's current reflationary policy. Since, as cited
above, nonresidents can no longer receive interest on additions to
their short-term sterling assets, it is likely that domestic considera-
tions played a major role in the Bank rate decision. The discount
rate reduction in Sweden on September 10, from 6 to 5-1/2 per cent,
was based even more clearly on domestic considerations. On the
other hand, the decision to decrease the discount rate in the Nether-
lands on September 15,from 5-1/2 to 5 per cent, was apparently taken
mainly to support the measures designed to reduce capital inflows.
Foreign reactions to other aspects of the President's program
affecting our foreign trade have been very critical. As to the
10 per cent surcharge, Canada and Japan have been the most vocal
complainers, with Canada in particular requesting an exemption;
this exemption has not been granted. Strong protests have also
been made by the developing countries, many of whose new export
industries are affected.

IV - 24
The Germans have also expressed considerable displeasure
with the "Buy American" clause in the President's investment tax
credit proposal. This measure, coming on top of the surcharge and
the mark revaluation, will impose a tremendous burden on the German
capital goods industry, which is likely to be hard hit in any case
by the expected cyclical down-turn in domestic demand in Germany.
The Canadian government has introduced a bill establishing
an Employment Support Board which would seek to maintain employment
by granting up to C$80 million in the current fiscal year to firms
that can demonstrate that they have been significantly hit by the
U.S. surcharge. This would enable those firms receiving aid to
charge lower prices on their products, partially offsetting the
surcharge. There are pressures to impose similar measures elsewhere,
notably in Germany and Japan. But so far there have been no moves
to retaliate against U.S. exports.

IV - 25
Exchange market developments in other countries. Among
the smaller OECD countries, Austria, Denmark, Finland, Greece,
Ireland, Norway, and Portugal have permitted their currencies to
float. Iceland, Turkey, and Yugoslavia have maintained the old
parity with the dollar. Spain has also maintained the dollar parity,
while raising the upper intervention point to approximately 1 per
cent. Australia has continued to peg its rate to sterling.
Outside the OECD area, no single currency, to the best of
our knowledge, is floating independently. Indeed, in a few cases,
countries have devalued against the dollar as well as against the
upward floating European currencies. Indonesia devalued by nearly
9 per cent against the dollar on August 23. Israel devalued by
16.7 per cent, and Argentina by 6 per cent, against the dollar on
August 25. Virtually all other non-OECD countries have continued to
peg their currencies to the U.S. dollar, the pound sterling, or the
French franc.
In the Western Hemisphere, Jamaica, Trinidad & Tobago,
Barbados and Bermuda have elected to follow the pound sterling and
have therefore appreciated against the dollar. Except for Argentina,
all the Latin American countries and Surinam are maintaining their
old parities with the dollar and thus have depreciated against the
harder European currencies.
In Asia, Pakistan, Singapore, Malaysia, Hong Kong, and
Burma have maintained parity with sterling, appreciating against

IV - 26
the dollar. India, and probably Ceylon, which were previously in
the sterling area, have decided to maintain the existing parity
with the dollar, depreciating against sterling. All the other
Asian countries except Japan and probably Mainland China have
maintained the old parities with the dollar.
In Africa, former French sub-Saharan colonies have followed
the French example, introducing a dual rate for the dollar. Nigeria
has also introduced a dual rate for the dollar, maintaining commercial
transactions at the old parity. South Africa has retained the
existing parity with the dollar, as have the Congo (Kinshasa),
Rwanda, Burundi, Tanzania, Ethiopia, the U.A.R. and Liberia. Kenya
and Uganda have both moved with sterling, appreciating against the
dollar. It is not yet clear what course some of the other former
British colonies are following.
In the Middle East, Kuwait has moved with sterling, but
most other countries have maintained previous parities with the
dollar.

U.S. AND INTERNATIONAL ECONOMIC DEVELOPMENTSBILLIONS OF DOLLARS
U.S. MERCHANDISE TRADEBALANCE OF PAYMENTS BASISANNUAL RATES, SEASONALLY ADJUSTED3 MO MOV AV(121)1969 DATA AFFECTED BY PORT STRIKES
NTERNATIONAL RESERVES EECCOUNTES
NET OFFICIAL NETOFFICIALPLUSBINCLUDING SDRs BEGINNING 1970 INCLDING SDRs BE
/
-TOTALOR 347 TOTAL
01 26
GERMANYG 166 A /
/ \ / BENELUXO11 66
ITALY 197
FRANCEL " I I i I
1969 1971
U.S. BALANCE OF PAYMENTSI SEASONALLY ADJUSTED
A .
1969
J.S. BANK LIABILITIESPLUS EX IM NOTES ANDTREASURY CERTIFICATES HELD BY BRANCHES
NTERNATIONAL RESERVES OTHERCOUNTRIES
NETOFFICIAL / NETOFFICIAL PLUS BANKSINCLUDING SDR INCLUDING SDRs BEGINNING 1970BEGINNING 1970 BREAK IN SERIES
LESSDEVELOPEDCOUNTRIESQn 197
OTHER DEVELOPED JAPAN-COUNTRIES B 8 9 /
' 143 SWITZERLAND
*/
SWITZERLAND Of 70 . f01 53
SCANADAGt 59
CANADAJAPAN (1 48GQ 771
1969 1971 1969 197
IV-C-1 9/14/71

STRICTLY CONFIDENTIAL (FR)
APPENDIX A: COMPARATIVE EFFECTS OF SURCHARGES & DEVALUATION
This note describes how an import surcharge may have agreater impact in reducing dollar payments to foreign suppliers ofU.S. imports than a devaluation of the same percentage. It is importantto observe that no consideration is given to the relative effects ofthese measures on U.S. exports, and it is assumed that all othereconomic conditions are held constant; i.e., consumer behavior isunchanged, producers' pricing techniques are unchanged, there is noretaliation by foreign governments, etc.
With either a devaluation or an import surcharge, consumerspay higher dollar prices for the imported goods they do continue tobuy. However, with a devaluation all payments go to foreign suppliers,while with an import surcharge a certain percentage of the purchasers'expenditures are siphoned off by the Treasury Department as revenue andthe dollar payments going to foreigners are reduced. A surcharge willthus be more effective than a devaluation in reducing the dollar valueof imports. It will not, however, necessarily have any greater effectin reducing physical quantities of imports.
To illustrate, we will assume: (1) that the average devalua-tion and import surcharge are both equal to 10 per cent; (2) that theoverall elasticity of substitution is equal to -1.5; (3) that U.S.domestic prices of imports rise by the full amount of the devaluationor the surcharge; i.e., foreign producers raise their dollar prices bythe full 10 per cent.
Devaluation Surcharge
Original paymentsto foreignerg in dollars 20 20
Purchasers' expenditures onimports with 10 per cent risein price 18.7 18.7
Payments to Treasury -- 1.7 (10% of 17)
Payments to foreigners, indollars, after change 18.7 17.0

A-2
Our example is not intended to illustrate what will actuallyhappen under the present surcharge and possible revaluations butrather to indicate the possible effect on the value of U.S. imports.Of course, it should be noted that the present 10 per cent surchargeapplies only to about one-half of U.S. imports, while a devaluationwould affect all U.S. imports. If it is assumed that the items notcovered by the surcharge but affected by the devaluation are not sensi-tive to price changes -- industrial materials, foodstuffs -- then theimport bill for these items in terms of dollars may actually riseunder a devaluation. If this occurs, a devaluation would appear tobe even less effective in reducing imports than the surcharge.
Offsetting this latter effect is the probable improvementin exports with a devaluation while there would be no stimulus toexports under a surcharge. In either case, these illustrations ignorethe possible retaliations by foreign governments, which are more likelywith a surcharge than with exchange rate changes. They also ignorethe actions of exporters and importers in absorbing part of the potentialprice change -- which would differ to the extent a surcharge is pre-sumed to be temporary while a devaluation is expected to have long-runeffects.


