Fomc 19710824 Blue Book 19710820
35
Prefatory Note The attached document represents the most complete and accurate version available based on original copies culled from the files of the FOMC Secretariat at the Board of Governors of the Federal Reserve System. This electronic document was created through a comprehensive digitization process which included identifying the best- preserved paper copies, scanning those copies, 1 and then making the scanned versions text-searchable. 2 Though a stringent quality assurance process was employed, some imperfections may remain. Please note that some material may have been redacted from this document if that material was received on a confidential basis. Redacted material is indicated by occasional gaps in the text or by gray boxes around non-text content. All redacted passages are exempt from disclosure under applicable provisions of the Freedom of Information Act. 1 In some cases, original copies needed to be photocopied before being scanned into electronic format. All scanned images were deskewed (to remove the effects of printer- and scanner-introduced tilting) and lightly cleaned (to remove dark spots caused by staple holes, hole punches, and other blemishes caused after initial printing). 2 A two-step process was used. An advanced optical character recognition computer program (OCR) first created electronic text from the document image. Where the OCR results were inconclusive, staff checked and corrected the text as necessary. Please note that the numbers and text in charts and tables were not reliably recognized by the OCR process and were not checked or corrected by staff. Content last modified 6/05/2009.
-
Upload
fraser-federal-reserve-archive -
Category
Documents
-
view
218 -
download
0
Transcript of Fomc 19710824 Blue Book 19710820

Prefatory Note The attached document represents the most complete and accurate version available based on original copies culled from the files of the FOMC Secretariat at the Board of Governors of the Federal Reserve System. This electronic document was created through a comprehensive digitization process which included identifying the best-preserved paper copies, scanning those copies,1
and then making the scanned versions text-searchable.2
Though a stringent quality assurance process was employed, some imperfections may remain. Please note that some material may have been redacted from this document if that material was received on a confidential basis. Redacted material is indicated by occasional gaps in the text or by gray boxes around non-text content. All redacted passages are exempt from disclosure under applicable provisions of the Freedom of Information Act. 1 In some cases, original copies needed to be photocopied before being scanned into electronic format. All scanned images were deskewed (to remove the effects of printer- and scanner-introduced tilting) and lightly cleaned (to remove dark spots caused by staple holes, hole punches, and other blemishes caused after initial printing). 2 A two-step process was used. An advanced optical character recognition computer program (OCR) first created electronic text from the document image. Where the OCR results were inconclusive, staff checked and corrected the text as necessary. Please note that the numbers and text in charts and tables were not reliably recognized by the OCR process and were not checked or corrected by staff.
Content last modified 6/05/2009.

(CONFIDENTIAL FR)
MONETARY AGGREGATESANDMONEY MARKET CONDITIONS
Prepared for the Federal Open Market Committee
By the Staff
BOARD OF GOVERNORS OF THE FEDERAL RESERVE SYSTEM
August 20, 1971.

CONFIDENTIAL (FR)
MONETARY AGGREGATES ANDMONEY MARKET CONDITIONS
Recent developments
(1) Security markets have responded strongly to the President's
announcement of new domestic and international economic measures. Prices
of both equities and fixed-income securities bounded upward on the basis
of new hopes for stronger economic recovery and more effective control of
inflation and the balance of payments problem; and, related to the latter,
expectations that monetary policy might be less restrictive than anticipated
earlier. Yields on Treasury coupon issues have declined by 50 to 70 basis
points; corporate bond yields have dropped by around 80 basis points; and
municipal yields have fallen by about 50 basis points.
(2) Treasury bill yields have also declined sharply on balance
over the past week, as persistent large Desk purchases for foreign official
accounts--and more recently for System Account--have tended to pre-empt
scarce market supplies of bills at a time when dealers have also been
trying to add to depleted positions. Currently, bill yields are 60 to
80 basis points below their levels of a week ago, with the 3-month issue
bid at 4.65 per cent, compared with 5.15 per cent on August 13 and 5.46
per cent at the time of the last Committee meeting. In private short-term
credit markets, rate declines have thus far been less pronounced--ranging
generally from 1/8 to 1/4 of a percentage point.
August 20, 1971.

-2-
(3) The declines in bond yields and Treasury bill rates following
the President's message occurred against a background of relatively taut
money market conditions. In the period immediately following the July 27
Committee meeting, when the outcome of the Treasury's August refinancing
operations was still unknown, the Desk sought to maintain fairly steady money
market conditions as characterized by a Federal funds rate of about 5-1/2 perthe
cent or slightly less. Early in August, it became clear that/refinancing
operations would turn out successfully, and market conditions in general
tended to strengthen. With growth in the monetary aggregates remaining
substantial, the Desk became a more reluctant supplier of reserves, and the
Federal funds rate has since averaged around 5-5/8 per cent, even though
other short-term rates declined following the President's address. In the
face of foreign exchange market uncertainties, banks have generally pursued
rather cautious reserve management policies, particularly on the Friday
preceding the Camp David meetings when member bank borrowings bulged to
nearly $1.7 billion. Borrowings dropped off following the President's speech,
but nevertheless, averaged $1.2 billion in the statement week ending August
18. Net borrowed reserves for that week ran to an average of nearly $900
million. Over the earlier weeks of the inter-meeting period, member bank
borrowing ranged from $550 to $750 million, and net borrowed reserves from
about $300 to $550 million.
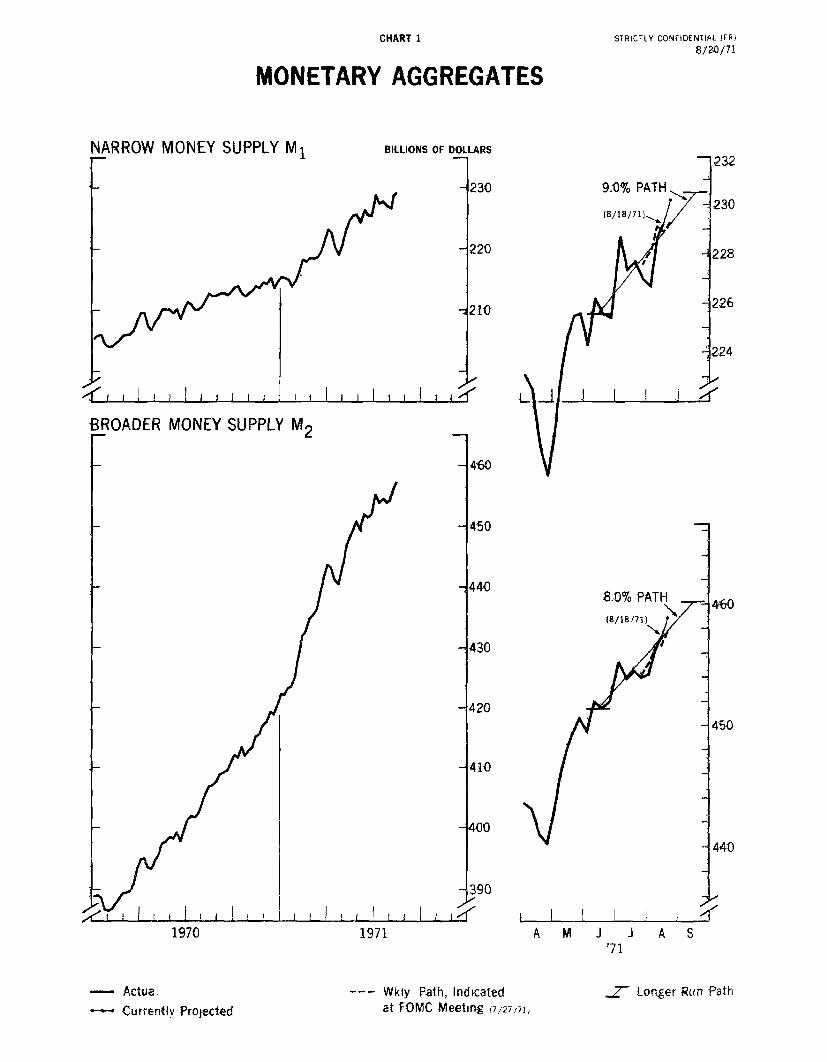
(4) The narrowly defined money supply increased substantially
in July, although at a pace somewhat below the 12 per cent annual rate
indicated in the July 27 path (as shown in the table below). On the basis

-3-
of incomplete data the average level in August is about ^as^ projected, but the
annual growth rate is somewhat above path because of the shortfall in July.
Growth in the other monetary aggregates in July and apparently also [in early]
August was reasonably close to expectations, although the credit proxy
edged somewhat above path in both months and M 2 did the same in August.
Recent Paths of the Key Monetary Aggregates(Seasonally adjusted, billions of dollars)
Actuals orCurrentEstimates
July 27Path 1/
Actuals orCurrentEstimate
Adjusted ProxyJuly 27 Actuals orPath 1/ Current
Estimate
A. Annual Rates ofGrowth, per centMonthJulyAugust 2/
B. Actual levels,billions of $
MonthJulyAugust 2/
227.9229.0
227.6 454.5229.0 457.0
454.2 347.6457.2 350.8
Week ending
July 28Aug. 4Aug. 11Aug. 18 p
p-- Preliminary.
July 27Path 1/
12.06.0
10.67.5
8.06.5
7.48.0
6.511.0
7.611.5
227.6228.2229.1228.9
347.9351.3
227.0226.7228.7229.2
454.2455.2456.5456.7
454.0454.2456.4457.4
347.7348.9349.8350.8
1/ Consistent with the directive the Committee adopted at the July 27meeting, and close to the alternative A path in the blue book preparedfor that meeting.
2/ Data are preliminary for week of 18th and projected thereafter.
348.5348.0348.5350.9

-4-
(5) The need for reserves in July turned out to be even less than
indicated in the last blue book. Although growth of reservesin August appears
to be somewhat more rapid than the sharp increase projected, July and August
taken together show average reserve growth about on track with staff estimates.
The 17 per cent annual growth rate for total reservesin August reflected
mainly sharply increased Government deposits--arising from central bank
purchases of special Treasury certificates--along with some further growth
of private demand deposits. With average member bank borrowings leveling
off at about the level to which they had risen in July, nonborrowed reserves
appear to be growing in August at about the same rate as total reserves.
Reserve Aggregates(Daily averages in millions of dollars, seasonally adjusted)
Total
BluebookPath 1/
Month
July 31,339August pe/ 31,693
Annual Rate ofIncrease (Julyover June) 3.0
Annual Rate ofIncrease (Augustover July) 13.5
Week ending
August 4 31,634August 11 31,624August 18 p/ 31,786
1/ Path in July 27 FOMC path.pe--Partially estimated.p -- Preliminary.
Nonborrowed
BluebookActual Path 1/
31,266 30,445 30,46631,715 30,825 30,890
0.2
17.0
31,81331,46931,826
-14.0
15.0
30,74430,82430,876
-13.1
16.5
31,05831,97630,636
Required
BluebookActual Path 1/ Ac tual
31,161 31,09431,486 31,508
4.5
12.5
31,42431,44331,531
1.9
16.0
31,35731,48931,507

(6) The following table summarizes developments in the major
financial aggregates for selected recent periods:
4th and1st Qtrs. Secondcombined Quarter August
(March over (June over overSept.) March) June
Total Reserves 8.9 6.6 8.8
Nonborrowed Reserves 10.3 5.3 1.7
Concepts of Money
M1 (Currency plus demanddeposits 1/) 6.2 11.3 9.0
M2 (M1 plus time depositsat commercial banksother than large CD's) 13.7 12.6 7.7
M3 (M2 plus deposits atthrift institutions) 14.6 14.7 n.a.
Bank Credit
Total member bank deposits(Bank credit proxy adj.) 9.7 6.5 9.7
Loans and investments ofcommercial banks 2/ 10.5 7.4 n.a.
Short-term market paper(Actual $ change in billions)
Large CD's $ 6.1 $ 0.7 $1.4
Bank-related commercialpaper N.S.A. - 2.9 0.0 n.a.
Nonbank commercial paper - 0.4 - 0.9 n.a.
1/ Other than interbank and U.S. Government.2/ Based on month-end figures. Includes loans sold to affiliates and
branches.N.S.A. Not seasonally adjusted.
NOTE: All items are based on averages of daily figures, except for data
on total loans and investments of commercial banks, commercialpaper and thrift institutions--which are either end-of-month orlast Wednesday of month figures.

Prospective developments
(7) The President's new economic program seems likely to haveat given levels of interest rates.
the effect of reducing rates of growth in the aggregates/ First, as the
program strengthens confidence in economic and financial prospects, the
drop-off we had been anticipating earlier from the apparently very high
recent liquidity demands for money should be accentuated. Second, the
program should moderate inflationary expectations and reduce the inflation
premiums built into current levels of interest rates. Third, our projections
indicate that the program will result in slightly smaller increases of
nominal GNP over the third and fourth quarters due to an abrupt slowing in
the rate of price increase,
which implies that the transactions demand for money should also
be somewhat lower than otherwise. Finally, insofar as the program is
viewed by the market as reducing the need for further firming of monetary
policy, expectations of upward pressure on interest rates should be lessened.
(8) While the direction of these effects seems clear, their
magnitude is impossible to quantify with any precision. In addition, in the
very short run these effects may be masked by transitory increases in cash
holdings arising from greater investor activity in domestic securities
markets and from current disturbances in foreign exchange markets. As a
result, the problems of forming judgments regarding appropriate growth rates
for the monetary and credit aggregates and of estimating probable relations
among growth rates in such aggregates and money market conditions are even

-7-
more difficult than usual. Under such circumstances one option the Committee
may wish to consider is a neutralist approach in monetary policy for the
time being, in order to rock the financial boat as little as possible until
^the Committee^ can make a fuller evaluation of the responses to the new program.
(9) Two broad policy approaches are described below which pro-
bably define the limits within which most would consider a neutralist policy
to fall. Both, as it happens, might be characterized--in their own contexts--
as policies calling for minimum change. The first specifies the maintenance
of current money market conditions, a course which the staff believes would
imply some weakening after August in the growth rates of the aggregates
from those associated with the policy accepted at the last meeting. The
second would specify maintenance ̂of^ growth in M at the rate consistent with
the directive adopted at the last meeting, a course which in our view would
require an easing of money market conditions. The specifications given
for the second alternative (B) might also be employed with directive
language presented in a later section under the label of alternative C.
As noted in that section, C differs from B with respect to operating
techniques rather than objectives. Specifically, under C the Desk would
place main emphasis on bank reserves rather than on money market conditions
in making operating decisions.
(10) The text table that follows specifies: (1) the growth path
for M1 thought to be consistent with the unchanged Federal funds rate
assumption of alternative A; and (2) the funds rate thought to be needed
to achieve the 6 per cent annual growth rate in M1 (for the third and

fourth quarters combined) that was associated with the directive adopted at
the last meeting 1/ The table on the next page shows the paths for all of the
monetary aggregates under the two alternatives.
Federal funds rate
Member bank borrowings
3-month bill rate
Growth in M1(SAAR)
August
September
3rd Quarter
4th Quarter
Second half
Alternative A
5-3/8--5-3/4%
$700-$900 million
4-3/4--5-1/2%
7-1/2%
5%
8%
3%
5-1/2%
Alternative B
4-1/2--5%
$450-$650 million
4--4-3/4%
7-1/2%
7%
8-1/2%
4%
6%
(11) Staff projections in the last blue book--slightly modified
to take into account the 5-3/8-5-3/4 per cent range for the funds rate
approved at the July 27 meeting--indicated that M1 would grow at an annual
rate averaging around 7 per cent for August and September and around 4 per
cent for the fourth quarter. Now, however, it seems more likely that a
funds rate at the mid-point of that range would lead to M1 growth at about
a 5.0 per cent rate in September and only a 3.0 per cent rate in the fourth
quarter. To achieve M1 growth rates previously specified for the third
1/ Weekly paths are appended on page 19.
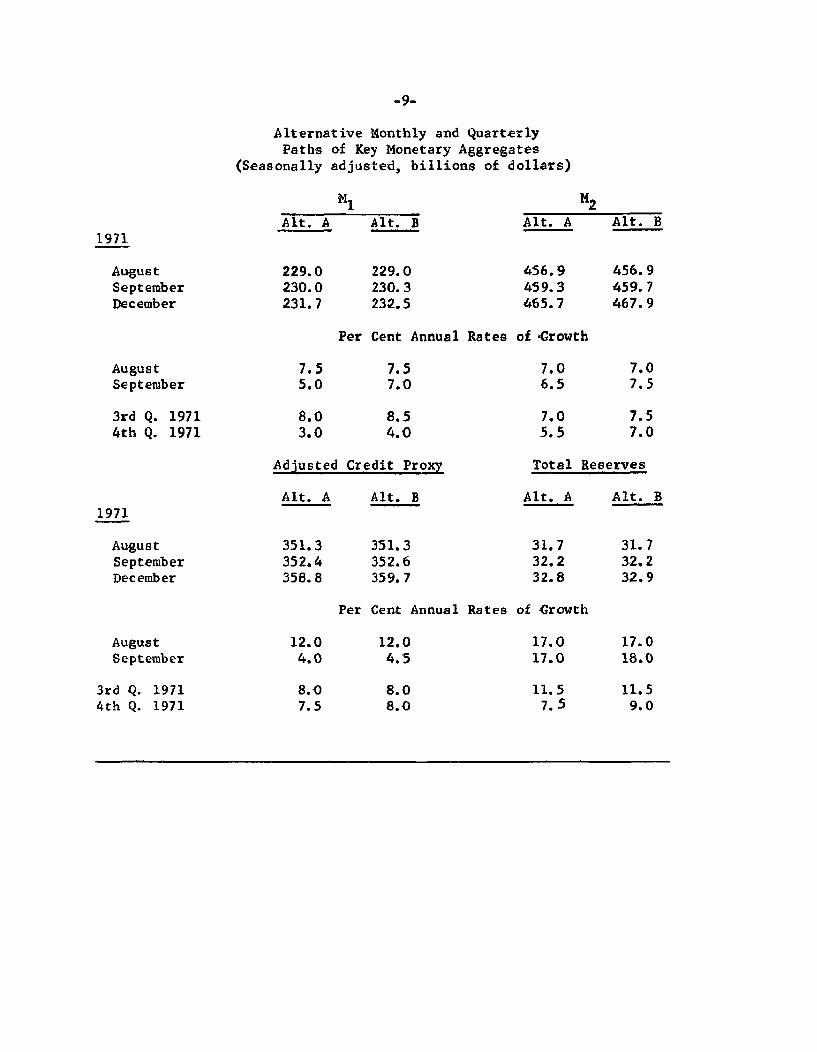
Alternative Monthly and QuarterlyPaths of Key Monetary Aggregates
(Seasonally adjusted, billions of dollars)
1971
AugustSeptemberDecember
M1
Alt. A Alt. B
229.0230.0231.7
229.0230. 3232.5
M2Alt. A Alt. B
456.9459.3465.7
456.9459.7467.9
Per Cent Annual Rates of Growth
AugustSeptember
3rd Q. 19714th Q. 1971
Adjusted Credit Proxy
1971
AugustSeptemberDecember
Alt. A
351.3352.4358.8
Alt. B
351.3352.6359. 7
Total Reserves
Alt. A Alt. B
31.732.232.8
Per Cent Annual Rates of Growth
AugustSeptember
3rd Q. 19714th Q. 1971
7.55.0
8.03.0
8.54.0
7.06.5
7.05.5
7.07.5
7.57.0
31.732.232.9
12.04.0
8.07.5
12.04.5
8.08.0
17.017.0
11.57.5
17.018.0
11.59.0
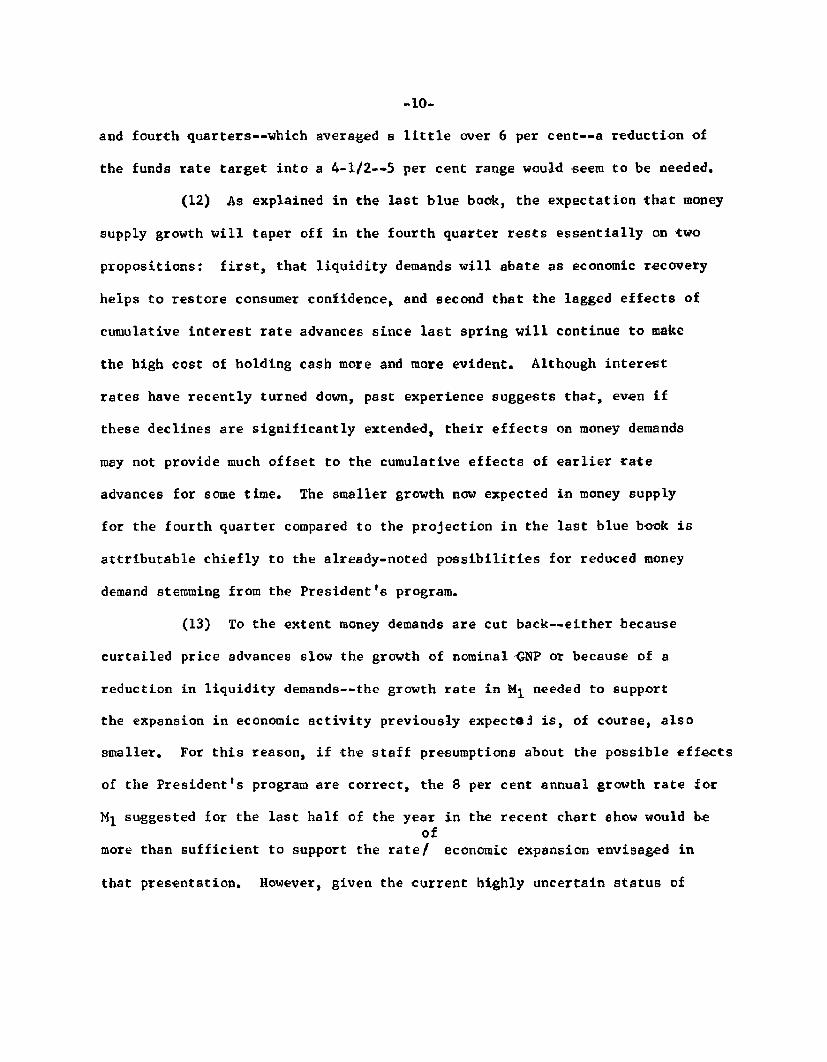
-10-
and fourth quarters--which averaged a little over 6 per cent--a reduction of
the funds rate target into a 4-1/2--5 per cent range would seem to be needed.
(12) As explained in the last blue book, the expectation that money
supply growth will taper off in the fourth quarter rests essentially on two
propositions: first, that liquidity demands will abate as economic recovery
helps to restore consumer confidence, and second that the lagged effects of
cumulative interest rate advances since last spring will continue to make
the high cost of holding cash more and more evident. Although interest
rates have recently turned down, past experience suggests that, even if
these declines are significantly extended, their effects on money demands
may not provide much offset to the cumulative effects of earlier rate
advances for some time. The smaller growth now expected in money supply
for the fourth quarter compared to the projection in the last blue book is
attributable chiefly to the already-noted possibilities for reduced money
demand stemming from the President's program.
(13) To the extent money demands are cut back--either because
curtailed price advances slow the growth of nominal GNP or because of a
reduction in liquidity demands--the growth rate in M1 needed to support
the expansion in economic activity previously expected is, of course, also
smaller. For this reason, if the staff presumptions about the possible effects
of the President's program are correct, the 8 per cent annual growth rate for
M1 suggested for the last half of the year in the recent chart show would be
more than sufficient to support the rate ^of^ economic expansion envisaged in
that presentation. However, given the current highly uncertain status of

-11-
financial and economic relationships, it is difficult to be sure what rate
of growth in M 1 is appropriate or how much confidence one can place in
projections based largely on past experience.
(14) Under alternative A, rates of growth in the other monetary
aggregates are projected to slow significantly after August. The degree of
expected slackening is considerably smaller than for M1, however, reflecting
both the probability of somewhat stronger bank credit demands and increased
success in competing for consumer-type deposits in an environment of lower
market interest rates. Also Government deposits are assumed to remain at
higher than normal levels, as the Treasury hedges against the possibility
of a sudden cash-in of special Treasury certificates by foreign central banks.
Under alternative A banks would probably have to press more actively to obtain
CD funds than under alternative B in order to offset the slower growth in demand
accounts. Under alternative B, growth rates for both M2 and the credit proxy
show little change from the third to fourth quarters on the assumption that
the lower interest rates realized under ^that^ alternative would be associated
with a greater improvement in time deposit performance.
(15) Holding the Federal funds rate close to the recently pre-
vailing rate would be likely to act as a brake on further declines in other
interest rates. In short-term markets, the heavy foreign central bank demands
which have so strongly intensified recent downward pressures on Treasury bill
rates should soon abate. In these circumstances, a reversal in bill rates
can be expected, and that reversal could be particularly sharp if the Federal

-12-
funds rate is held unchanged and dealer financing costs therefore remain
relatively high. Such a development would tend to be reflected in interest
rate expectations in longer-term markets as well, where underlying supply-
demand relationships might otherwise maintain downward pressure on rates.
(16) While the market probably has already discounted some re-
duction in the Federal funds rate, sizable downward movement--say, to the
lower end of the range specified in alternative B--would undoubtedly be
interpreted by the market as a significant policy move. This would encourage
further yield declines in both short- and long-term markets. It is possible
that such a move could carry rates to unsustainably low levels, but, on the
other hand, it is still unclear whether the decline in market yields to date
has fully discounted the changed outlook on inflation.
(17) Alternative C, as noted earlier, differs from B only with
respect to the indicated operating techniques. This alternative is provided
in the event the FOMC may wish to move in the direction recommended by the
Committee on the Directive. If the public appetite for demand as against
time deposits proves different from that assumed in the alternative B
specifications, for example, the Committee might nevertheless wish to provide
only the quantity of reserves consistent with those projections. In that
event, the market would have to adjust for any resultant reserve excess or
deficiency. This would imply the possibility of significantly larger
changes in money market conditions, however, ̂ and^ the Committee may wish to set
outside limits of acceptable variation in the Federal funds rate--perhaps

-13-
a band of plus or minus one percentage point around the 4-3/4 per cent
midpoint of the funds rate range specified under alternative B.
(18) If the Committee adopts alternative C it may want to instruct
the Manager to make his operating decisions on the basis of available
evidence regarding the relationship between the actual supply of reserves
and the supply considered to be best calculated to promote growth in the
monetary and credit aggregates at the desired rates. In addition, the
Manager might be given leeway to adjust the target paths for total and non-
borrowed reserves to take account of deviations in U.S. Government deposits
and ̂in deposit^ distribution between reserve city and country banks from original pro-
jections. The Manager might also be advised that in making day-to-day
operating decisions he should refer particularly to information on non-
borrowed reserves, but should also take into account data on member bank
borrowings for what they indicate about both the behavior of total reserves
and the degree of tension in the banking system. Similarly, he might be
instructed to use information on the cost of reserves--as reflected primarily
in the Federal funds rate--as a supplementary and early indicator of the
effective supply of reserves in the market.
(19) Shown in the table below are monthly and weekly aggregates
reserve paths consistent with alternative C. The indicated percentage growth
rates for reserves are far above those projected for M1 and M2 chiefly
because of the use of reserves to support sharply increased levels of certain
types of deposits (mainly Government deposits) not included in M1 and M2 .

-14-
Total and Nonborrowed Reserve Paths--alternative C(Daily averages in millions of dollars, seasonally adjusted)
Total Reserves Nonborrowed Reserves
AugustSeptemberDecember
Per Cent Annual Rates of Growth
AugustSeptember
3rd Q. 19714th Q. 1971
Weekly Paths
Total Reserves Nonborrowed Reserves
SeasonallyAdjusted 1/
Not SeasonallyAdjusted
SeasonallyAdjusted 1/
Not SeasonallyAdjusted
August 25
September 181522
31,604
31,92932,47832,22631,955
30,270
30,46630,94030,81730,721
30,739
30,13732,00731,70731,530
29,720
29,91630,39030,26730,171
1/ The level of this series also reflects step adjustments made in the pastto avoid discontinuities because of reserve requirement changes.
31,71532.18732,895
30,89031,69032,180
17.018.0
11.59.0
16.531.0
11.56.0

-15-
(20) Total reserves for both August and September would be expected to
increase at around a 17.0 per cent annual rate of growth. In the fourth
quarter the rate of increase would be reduced to about half the August-
September rate. Nonborrowed reserves after declining sharply in July--re-
flecting the over $300 million increase in member bank borrowings--are
expected to track very closely to total reserves on the assumption that
borrowings will show no appreciable further increase on average in August.
In September, however, borrowings are projected to average sharply lower
than in August, so that nonborrowed reserves would have to increase at a very
rapid pace if targeted rates of growth in M1 and M2 are to be achieved. If
the decline in borrowings needed to achieve the alternative B paths is some-
what overstated, the growth in nonborrowed reserve could be commensurately
smaller.

-16-
Possible directive language
(21) This section presents three possible alternatives for the
second paragraph of the directive corresponding to the approaches to policy
and operating techniques outlined in paragraph ( 9) above.
(22) Alternative A. This language is proposed for possible use
if the Committee decides to call for maintaining about the prevailing money
market conditions, subject to a proviso clause.
"To implement this policy, [DEL: taking account of the current
Treasury financing and of developments in capital markets, the
Committee seeks to achieve more moderate growth in monetary
aggregates overt he months ahead.] System open market operations
until the next meeting of the Committee shall be conducted with a
view to MAINTAINING ABOUT THE PREVAILING [DEL: achieving bank reserve and]
money market conditions; [DEL: consistent with these objectives] PROVIDED
THAT MONEY MARKET CONDITIONS SHALL BE MODIFIED IF IT APPEARS THAT
THE MONETARY AND CREDIT AGGREGATES ARE DEVIATING SIGNIFICANTLY
FROM THE GROWTH PATHS EXPECTED."
If the Committee adopts this alternative, it may wish to consider the money
market conditions notedfor alternative A in paragraph (10) as a description
of "prevailing" conditions, and for purposes of the proviso clause to adopt
the growth paths for the monetary and credit aggregates discussed earlier
in connection with alternative A as the "expected" paths. The proviso
clause has been formulated in two-way terms--guarding against shortfalls
as well as excesses relative to the expected paths--on the assumption that

-17-
the Committee would not want to see the aggregates grow at less than the
indicated rates, which for the months beyond August are below those associated
with the directive the Committee adopted at its preceding meeting. If the
Committee favors a money market orientation for its primary instruction but
would prefer to see the aggregates grow at rates somewhat above those
projected under unchanged money market conditions, it might modify the
alternative A language to call for operations with a view to "attaining
somewhat less firm money market conditions" and associate with the revised
language the money market and aggregate specifications described above in
connection with alternative B.
(23) Alternative B. This language is proposed for possible use
if the Committee decides (a) to formulate its primary instruction in terms
of desired growth rates in the monetary and credit aggregates, and (b) to
adopt as targets growth rates similar to those associated with the directive
adopted at the previous meeting, as discussed above in connection with
alternative B.
"To implement this policy, [DEL: taking account of the current
Treasury financing and of developments in capital markets,] the
Committee seeks to PROMOTE [DEL: achieve more] moderate growth in mone-
tary AND CREDIT aggregates over the months ahead. System open
market operations until the next meeting of the Committee shall
be conducted with a view to achieving bank reserve and money
market conditions consistent with THAT [DEL: those] objectives."

-18-
If the Committee favors an aggregate orientation for its primary instruction
but would prefer to see the aggregates grow at rates somewhat below those
discussed in connection with this alternative, it could adopt the language
of alternative B (or C) but associate with such language the growth rates
discussed in connection with alternative A.
(24) Alternative C. This language is proposed for possible use
if the Committee decides to seek the objectives discussed above in connec-
tion with alternative B, but would prefer to have the Desk shift emphasis
from money market conditions to bank reserves in implementing policy.
"To implement this policy, [DEL: taking account of the current
Treasury financing and of developments in capital markets,] the
Committee seeks to PROMOTE [DEL: achieve more] moderate growth in
monetary AND CREDIT aggregates over the months ahead. System
open market operations until the next meeting of the Committee
shall be conducted with a view to achieving bank reserve [DEL: and
money market] conditions consistent with THAT [DEL: these] objectives;
PROVIDED, HOWEVER, THAT OPERATIONS SHALL BE MODIFIED IF NECESSARY
TO AVOID EXCESSIVE FLUCTUATIONS IN MONEY MARKET CONDITIONS."
A proviso clause designed to guard against excessive fluctuation in money
market conditions is suggested in this alternative for reasons discussed
in paragraph (17). As will be noted, the primary instructions of this
alternative differs from the language of alternative B only in the
deletion of the words "and money market" from the phrase "with a view to
achieving bank reserve and money market conditions."

-19-
Alternative Weekly Paths of Key Monetary Aggregates(Seasonally adjusted, billions of dollars)
August 25
September
M 1
Alt. A Alt. B
230.2 230.2
229.3229.0228.8231.4
229.3229.0228.9231.6
M2Alt. A Alt. B
459.0 459.0
458.1458.0458.0460.8
458.1458.0458.2461.1
Credit ProsyAlt. A Alt. B
354.5 354.5
353.4353.3352.6352.7
353.4353.3352.8353.0
Credit Proxy
Alt. A Alt. B
354.5 354.5August 25
September 353.4353.3352.6352.7
353.4353.3352.8353.0
Total Reserves
Alt. A Alt. B
31.6
31.932.532.231.9
31.6
31.932.532.232.2
STRICTTY CONFIDENTIAL (FR)8/24/71
MONETARY AGGREGATES
MONEY SUPPLY M1 BILLIONS OF DOLLARS
230
220
-210
i i i ! i i i i i I I 1 1 4 41
9.0% PATH
I 1 I ! i ;-
MONEY SUPPLY M2
1970 1971
- Actual
- Currently Projected--- Wkly Path, Indicated
at FOMC Meeting 7/27/71,
7- Longer Run Path
CHART 1
8.0% P,
(8/18/71:
A M J J A S1 i I !

STRICTLY CONFIDENTIAL (FR)8/20/71
MONETARY AGGREGATES
ADJUSTED CREDIT PROXY BILLIONS OF DOLLARS
355
-335
-325
9.0%
I I IJ J
RESERVES
7.5%
32
31
27 1 JA M
I 1 aJ A
'71
-- Actual
-- Currently Projected
--- Wkly. Path, Indicatedat FOMC Meeting (7/27/71)
.. Longer Run Path
CHART 1A
348
344
34V
I-
1970 1971
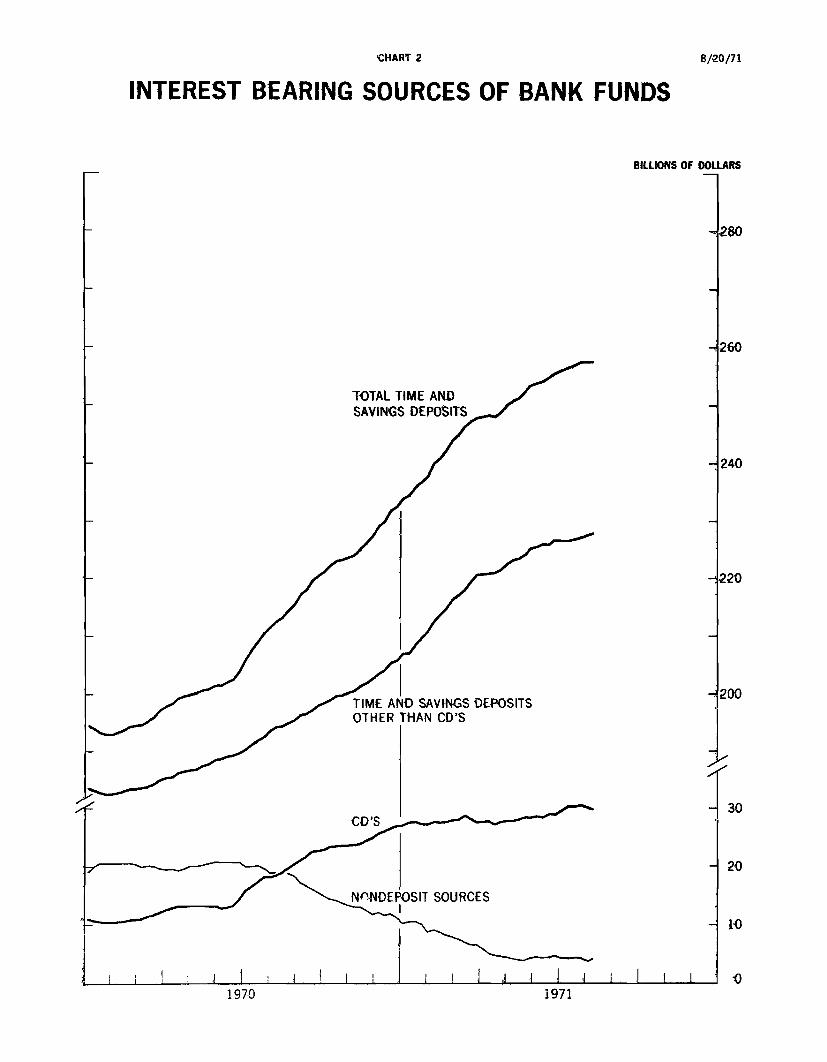
CHART 2
INTEREST BEARING SOURCES OF BANK FUNDS
BILLIONS OF DOLLARS
TOTAL TIME ANDSAVINGS DEPOSITS
TIME AND SAVINGS DEPOSITSOTHER THAN CD'S
CD'S
8/20/71
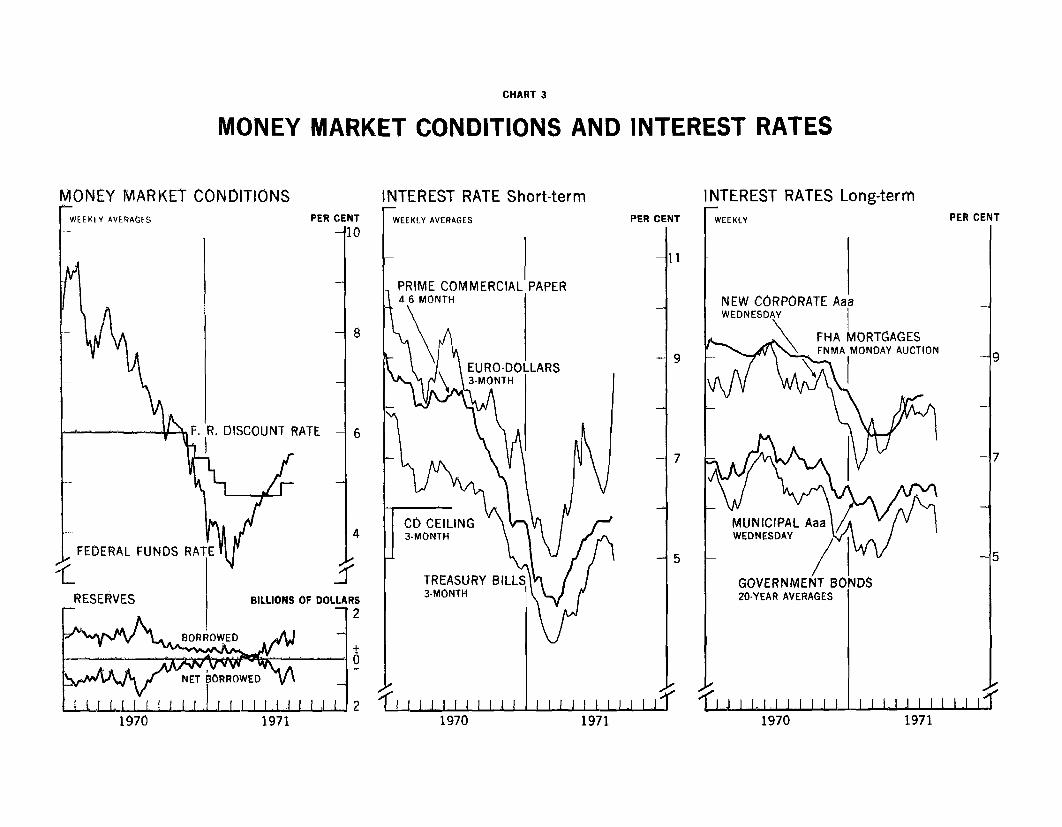
CHART 3
MONEY MARKET CONDITIONS AND INTEREST RATES
MONEY MARKET CONDITIONS INTEREST RATE Short-term INTEREST RATES Long-term
1970 19711970 1971 1970 1971

Table 1
PATHS OF KEY MONETARY AGGREGATES
Narrow Money Supply (M1) 1/
Path as of 2 Actuals &
July 27 Current Prol
STRICTLY CONFIDENTIAL (FR)
August 20, 1971
Total Reserves
sof 8 Actuals &27 Current Prof.
1971 Jan.Feb.Mar.
Apr.MayTune
Ju lvAug.
1971- ts1t tr.2nd Ott.3rd Qtr.
1971: lan.Feb.Mar
Apr.MayTune
Aug.
1971- June 10
Tuly 7142128
Aug. 41118 pe25
Monthly Pattern in Billions of Dollars
214,8217.3219.4
221.1221,9225.6
227.9 227.6229.0 (229.0)
454.5457.0
Annual Percentage Rates of Change--Quarterly and Monthly
8.911.3
9 0 ( 8.0) 8.0
1.114.011.6
9.315.9
9.1
12.0 10.6 8.06.0 ( 7,5) 6.5
Weekly Pattern in Billions of Dollars
225.4
228.7227.4227.7
227 6 227. 0 454.2
228.2 226.7 455.2229.1 228.7 456.5228.9 229.2 456.7229.3 (230.2) 457.8
NOTES Annual rates of change other than those for the pastData sh1own in parenthesis are current projections.I/ Currency plls private demand deposits.2/ M plus time deposits other than large CD's.
are rounded to the nearest half per cent. pe--Partially estimated. FR712-Dev 2/16/71
Period
334.1337.7340.2
341.7343.8345.7
347.9(35 1.3)
10.96.5
( .0)
10.512.9
8.9
5.37.46.6
7.6f11,5)
423.0430.8437.6
442.0447.3451.4
454.2(457.2)
17.812.6
(7.0)
11.522.118.9
12.114.411.0
7.4( 8.0)
452.0
455.24593.454.5454.0
454,2456.4457.4
(458.9)
30.230.530.3
30.831.331.3
31.3(31.7)
11.06.6
(1115)
12.211.49.2
2.717.60.2
0.3(17.0)
347.6150.8
9.0
6.511.0
347.7
348.9349.8350.8351.9
I II I L- I II
-I-~ - -- tf^^k^^^^^^^^^^^^

Table 1-A
PATHS OF KEY MONETARY AGGREGATESSTRICTLY CONFIDENTIAL (FR)
August 20, 1971
1971: Jan
I ebMar
AprMayJune
JulyAug
1971: 1st Qtr.2nd Qtr3rd Qtr
1971. Tan.FehMar
Apr.Nayjune
JulyAugp
1071: Tune 30
Tlly 734
Aug. 41118 pe25
Billions of Dollars
6 76.24.8
S4
235.3240 9246.1
248 3it. z 4 1 . 4
3.9 254.4
3.3 3.7 256.8 256.84 3 ( 6.3) 259.0 (258.2)
Annual Percentage Rates of Change-Quarterly and Monthly27.313.5
10.0 ( 8.5)
25.528.625.9
10.715.614.3
13.5 11.10.5 ( 6.5)
Weekly Pattern in Billions of Dollars
2.7
2 52.94.0
3 7 4.1 25
3.7 4.5 253.8 4.6 254 3 5.7 255 0 (88) 25
7.1
7.98.48.99.6
Annual rates of change other than those for the past areNOTES: Data shown in parenthesis are current projections.
pe - Partially estimated,
255.4
256 0256.6
256.9257.5
257.5257.5258.2
(258.9)--- ' - *
226.6228.0
7.0
4.57.5
226.6
227.0227 .4227.8228.5
208.2213.5218.3
221.0223.4225.8
226.4(228.2)
27.213.7
(6.0)
22.330.527.0
14.813.012.9
4.3(8.5)
226 6
226 5226.5
226.8227.0
227.5227.8228.2
(228.8)
rounded to the nearest half per cent.
30.231.0
30.5
30.931.031.131.1
27.127.427 8
27.327 928.6
30.1(30.0)
28.8
29.630.130.130.5
30.029.730.0
(30,1)
4.1(3.7)
4 7
4 24 1
4.44.1
3.741
3.6
(3.6)- & ~-.I. - a i - -
FR 712-KRev2/16/71

Table 2
AGGREGATE RESERVES AND MONETARY VARIABLESRETROSPECTIVE CHANGES, SEASONALLY ADJUSTED
CONFIDENTIAL (FR)
August 20, 1971
(Annual rates in percent)Reserve Aggregates' - Monetary Variables Addenda
1 2 3 Total 4 Money Supply 8 9 10Total Nonborrowed Member Adjusted 5 Time Thrift Norbank
Pero serves Private DepOsits Instit. CommercialReserves Reserves epositsa Credit Proxy Total Currency Demand Adusted Deposits PaperS_ _ Deposts Deposits Adusted Deposs Paper
Anumally196819691970
Semi-annuall1st Half 19702nd Half 1970
1st Half 1971
Qaurter lv1st Qtr. 19702nd Qtr. 19703rd Qtr. 19704th Qtr. 1970
1st Qtr. 19712nd Qtr. 1971
1970: Apr.MayJune
JulyAug.Sept.
Oct.Nov.Dec.
1971: Jan.Feb.Mar.
Apr.MayJuneJuly 1
+ 7.8- 1.6+ 6.4
- 0.2+13.0
+ 8.9
- 2.9+ 2.6+19.1+ 6.6
+11.0+6.6
+21.3-13.9+ 0.5
+ 6.0+23.3+27.5
- 1.9+ 3.6+18.4
+12.2+11.4+ 9.2
+ 2.7+17.0+0.2
0.3
+ 6.0- 3.0
+ 9.5
+ 1.9+17.1
+ 8.2
- 0.4
+ 4.1+24.4+ 9.4
+11.0+5.3
+25.4-19.0+ 6.2
-16.1+48.8+40.1
+ 4.4+22.8
+ 8.8+15.1+ 8.8+ 9.7+12.4
- 6.2-13.1
+ 9.0- 4.0
+11.8
+ 3.3+20.0
+13.5
+ 0.6+ 6.0+24.1+15.1
+17.0+ 9.6
+16.8- 4.5
+ 5.8
+22.7+29.2+19.0
+10.1+13.1+21.4
+16.1+19.3+14.9+12.2+11.1+ 5.3
-8.8
n.a.n.a.
+ 8.3
+ 3.5+12.9
+ 8.8
+ 0.5+ 6.5+17.2+ 8.3
+10.9+ 6.5
+13.7- 1.2+ 7.0
+18.1+23.2+ 9.7
+ 1.1+ 7.0+16.5
+10.5+12.9+ 8.9+ 5.3+ 7.4
- 6.6L'7.6
+ 7.84 3.1
+ 5.4
+ 5.9+ 4.8
+10.3
+ 5.9+ 5.8+ 6.1+ 3.4
+ 8.9+11.3
+ 9.9+ 5.2+ 2.3
+ 5.7+ 6.84 5.7
+ 1.1+ 2.8+ 6.2
+ 1.1+14.0411.6
+ 9.3+15. 2
+ 9.1+10.6
+ 7.4+ 6.0+ 6.3
+ 7.8+ 4.6
+ 9.4
+ 6.1+ 9.4+ 3.3+ 5.8
+ 9.0+ 9.6
+10.3+15.3+ 2.5
+ 7.5+ 2.5
+ 7.5+ 4.9+ 4.9
+ 7.4+ 9.8+ 9.7
+12.0+ 9.5
+ 7.1+11.7
+ 7.9+ 2.4+ 5.1
+ 5.3+ 4.7
+10.5
+ 5.3+ 5.3+ 6.7+ 2.7
+ 8.9+11.8
+10.5+ 3.0+ 2.2
+ 4.4+ 8.9+ 6.6
- 0.7+ 2.2+ 6.6
- 1.4+16.0+12.2
+ 7.8+17.6
+ 9.7+10.3
+11.1- 5.0+18.4
+ 7.8+27.9
+20.8
+ 1.4+14.1+32.2+ 21.8
+27.3+13.5
+19.7+10.9+11.4
+35.6+28.8+29.8
+20.3+15.1+28.8
+25.5+28.6
+25.9+10.7+15.0
+14.3+11.3
____ _I ____II_____I ---- -- I _- -L ___- ____p - PTetiminary.
NOTE: Aggregate reserve series have been adjusted to eliminate changeson Eurodollar borrowings are included beginning October 16, 1969,
+ 6.3+ 3.4+ 7.8
+ 4.7+10.6
+20.7
+ 2.5+ 7.0+ 9.3+11.6
+23.3+17.2
+ 8.1+ 5.3+ 7.3
+11.9+ 5.9+10.0
+16.6+ 9.4+14.5
+25.1+18.5+24.9+21.8+14.2
+14.9+16.1
n.a.n.a.
+ 7.3
+12.8+ 1.7
-18.2
+17.8+ 7.5-16.2+20.4
-24.7-12.5
+34.4+18.9-30.0
-87.5- 7.2+49.6
+32.4-28.7+58.1
- 9.0-10.9-55.2+ 4.4-15.8-26.3-32.1
FR 712 - Ein percentage reserve requirements against deposits, but reserve requirements
and requirements on bank-related commercial paper are included beginning October 1, 1970.

Table 3
AGGREGATE RESERVES AND MONETARY VARIABLESSEASONALLY ADJUSTED
CONFIDENTIAL (FR)
August 20, 1971
1970: Jan.Feb.Mar.
Apr.
F ayJune
JulyAug.Sept.
Oct.NOV.Dec.
1971: Jan.Feb.Mar.
Apr.May.Tune
July p
Week endIng:1971: July 7
142128
Aug. 4 p11 p
(In millions of dollars)
28,00127,72227,723
28,216
27,89027,902
28,04128,58529,240
29,38529,474
29,925
30,22930,51530,748
30,81631,25331,257
31,266
31,03230,83131,55231,414
31,81331,469
26,96626,61526,782
27,35026,91627,056
26,69427,78028,708
28,92829,03329,584
29,80130,17630,398
30,64430,96130,801
30,465
30,46229,95030,346
30,849
31,05830,976
27,82327,52327,536
28,046
27,69227,713
27,89628,40829,024
28,13429,23329,703
30.02930,25530,534
30,61130,99831,046
31,094
30,76931,02631,13531,332
31,35731,489
284.8282.9286.2
290.2289.1290.5
296.0303.2308,0
310.6314.0319.6
323.9329.1333.2
336.6339.7341.2
343.7
343.2343.4343.3344.4
344.2344.5
205.2204.5206.6
208.3209.2209.6
210.6211,8212.8
213.0213.5214.6
214.8217.3219.4
221.1223.9225.6
227.6
228.7227.4227.7227 0
226.7228.7
46.246.446.7
47.147.747.8
48.148.248.2
48.548.748.9
49.249.650.0
50.550.951.2
51.7
51.851.751.851.7
51.851.9
(In billions of dollars)
159.0 193.3 10.658.1 193.5 10.659.8 195.3 11.5
L61.2 198.5 12.9161.6 200.3 13.2161.9 202.2 13.2
162.5163.7164.6
164.5164.8165.7
165.5167.7169.4
170.5173.0174.4
175.9
176.9175.7176.0175.3
174.9176.8
208.2213.2218.5
222.2225.0230.4
235.3240.9246.1
248.3251.4254.4
256.8
256.0256.6256.9257.5
257.5257.5
182.7182.9183.8"
185.6187.1189.0
191.3184.2196.8
199.1201.1204.4
208.2213 5218.3
221.0223.4225.8
226.6
226.5226.5226.8227.0
227.5227.8
304.8303.4306.1
309.6309.3311.1
315.8321,9324.5
324.8326.7331.2
334.1337.7340.2
341.7343.8345.7
347.9
347 3347.5347.6348.5
348.0348.5
29.430.030.4
31.231.730.9
28 728.529.7
30.529.731.2
31.030.729.3
29 429.028.3
27.6
28.128.328.328.3
27.927.8
NOTES. Aggregate reserve series have been adjusted to eliminate changes in percentage reserve requirements against deposits, but reserve requirements onEuro-dollar borrowings are included beginning October 16, 1969, and requirements on bank-related commercial paper are included beginning October 1,1970. Adjusted credit proxy includes mainly total member bank deposits subject to reserve requirements, bank-related commercial paper, and Euro-dollar horrowings of U.S. banks. Weekly data are daily averages for statement weeks. Monthly data are daily average except for nonbank commercialpaper figures which are for last day of month. FR 712 - Fp - Preliminary.
111
1

Table 4
MARGINAL RESERVE MEASURES(Dollar amounts in millions, based on period averages of daily figures)
Member Banks BorrowingsFree Excess I Reserve C t
eri reserves reserves Total Major banks Other Country8 N.Y Outside N.Y.
Monthly (reserves weeksending in)'
1970--January - 759 169 928 148 287 232 261
February - 916 210 1,126 106 317 289 414March - 751 129 880 90 225 287 278
April - 687 178 865 227 331 119 188May - 765 159 924 165 241 228 290June - 736 171 907 140 289 217 261July -1,134 183 1,317 218 460 348 291August - 706 175 881 143 278 273 187September - 374 235 609 101 115 274 119October - 274 193 467 12 40 313 102November - 199 210 409 42 17 294 57December - 84 264 348 36 16 265 30
1971--January - 140 238 378 45 36 262 35February - 71 264 335 29 30 248 29March - 120 192 312 41 17 238 16
April 2 154 152 15 9 119 9Mv 6 218 212 78 36 60 38June - 303 211 514 103 85 159 167July p - 672 158 830 77 223 270 260
1971--Jan. 6 138 545 407 71 60 250 2613 - 245 32 277 -- -- 249 2820 - 380 02 472 82 63 284 4327 - 72 282 354 26 20 266 42
Feb 3 - 46 237 283 -- -- 253 3010 - 42 205 247 -- -- 229 1817 - 264 297 561 114 121 280 4624 67 317 250 - ,- 228 22
Mar. 3 - 88 170 258 -- 1 241 1610 - 339 82 421 108 51 249 1317 - 25 265 290 46 -- 231 1324 - 265 68 333 52 15 251 1531 119 376 257 -- 18 217 22
Apr. 7 80 277 197 -- -- 184 3314 58 208 150 17 -- 127 621 - 3 81 84 -- 1 79 428 - 128 48 176 42 34 86 14
May 5 191 365 174 46 40 61 2712 131 230 99 39 20 22 1819 - 204 102 306 134 47 74 5126 - 93 174 267 91 36 84 56
June 2 - 361 285 646 171 100 217 589 - 80 73 153 46 27 25 55
16 - 149 254 403 86 4 152 16123 - 409 210 619 103 161 202 15330 - 518 212 750 107 192 203 308
July 7 - 384 277 661 -- 149 257 25514 - 986 5 991 252 309 189 24121 - 839 282 1,121 47 344 397 :3328 - 478 67 545 9 88 236 212
Aug. 4 p - 294 471 765 43 122 307 29311 p - 569 24 593 0 47 328 21818 p - 891 289 1,180 336 245 335 262
p - Preliminary.
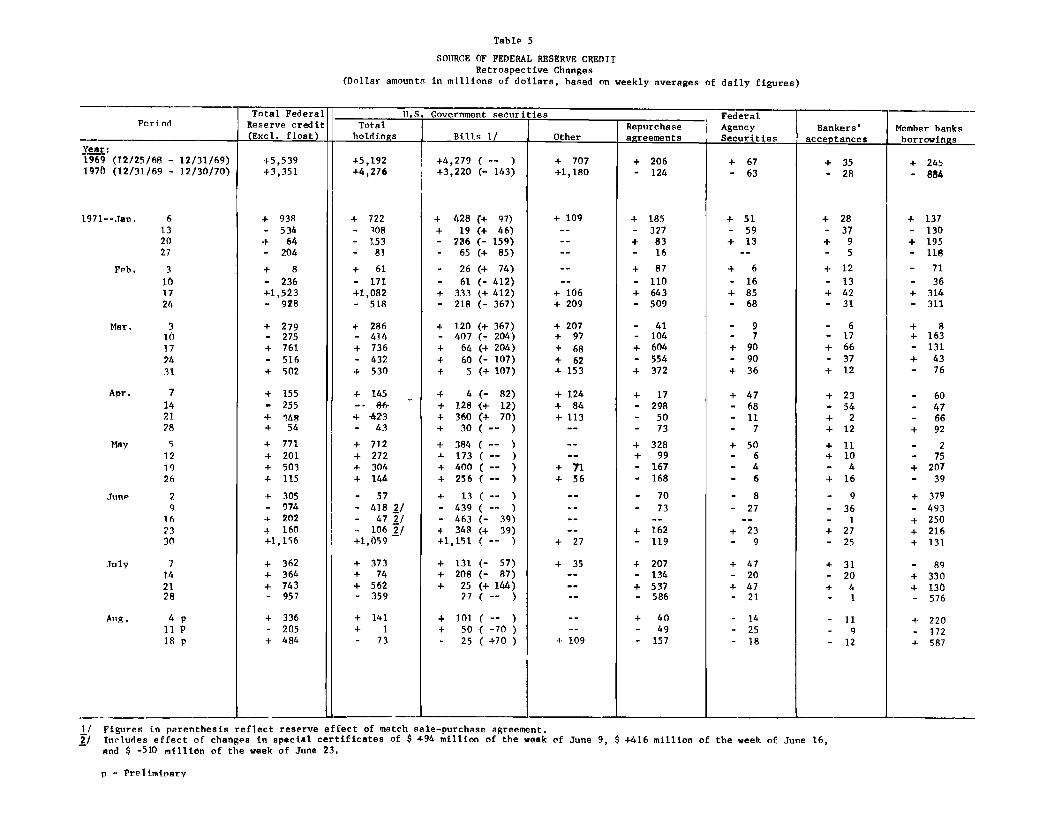
Table 5
SOURCE OF FEDERAL RESERVE CREDITRetrospective Changes
(Dollar amounts in millions of dollars, based on weekly averages of daily figures)
Total Federal U.S. Government securities FederalPeriod Reserve credit Total Repurchase Agency Bankers' Member banks
(Excl. float) holdings Bills 1/ Other agreements Securities acceptances borrowingsYear:1969 (12/25/68 - 12/31/69)1970 (12/31/69 - 12/30/70)
1971--Jan. 6132027
Feb. 3
101724
Mar. 310172431
Apr. 7142128
May 5121926
June 29
162330
July 7142128
Aug. 4 p11 P18 p
+5,539+3,351
+ 938- 534
+ 64- 204
+ 8- 236
+1,523- 928
+ 279- 275+ 761- 516+ 502
+ 155- 255
+ 148+ 54
+ 771+ 201+ 503+ 115
+ 305- 974+ 202+ 160+1,156
+ 362+ 364+ 743- 957
+ 336- 205
+ 484
+5,192+4,276
+ 722- 108- 153- 81
+ 61- 171+1,082- 518
+ 286- 414+ 736- 432+ 530
+ 145-- 66-
+ -423- 43
+ 712+ 272+ 304+ 144
- 57- 418 2/- 47 2/- 106 2/+1,059
+ 373+ 74+ 562- 359
+ 141+ 1
- 73
+4,279 ( -- )+3,220 (- 143)
+ 428 (+ 97)+ 19 (+ 46)- 236 (- 159)
S 65 (+ 85)
- 26 (+ 74)- 61 (- 412)+ 333 (+ 412)- 218 (- 367)
+ 120 (+ 367)- 407 (- 204)+ 64 (4 204)+ 60 (- 107)+ 5 (+ 107)
+ 4 (- 82)+ 128 (+ 12)+ 360 (+ 70)+ 30 (- )
+ 384 ( -- )-9- 173 ( -- )+ 400 (- )+ 256(-- )
+ 13 (- )- 439 ( -- )- 463 (- 39)+ 348 (+ 39)+1,151 ( -- )
+ 131 (- 57)+ 208 (- 87)+ 25 (+ 144)
27 ( -- )
+ 101 ( -- )+ 50 (-70)- 25 (+70 )
+ 707+1,180
+ 109
+ 106+ 209
+ 207+ 97
+ 68+ 62+ 153
+ 124+ 84+ 113
+ 71
+ 56
+ 27
+ 35
+ 109
+ 206- 124
+ 185- 327
+ 83- 16
+ 87
- 110+ 643- 509
- 41- 104
+ 604- 554+ 372
+ 17
- 298
- 50
- 73
+ 328+ 99- 167- 168
- 70
- 73
+ 162- 119
+ 207- 134+ 537- 586
+ 40
- 49
- 157
+ 67
- 63
+ 51- 59
+ 13
+ 6
- 16
+ 85- 68
- 97
+ 90- 90
+ 36
+ 47- 68
- 11
7
+ 506
46
8
-27
+ 23
- 9
+ 47- 20
+ 47- 21
-14-25-18
+ 35- 28
+ 245- 884
p - Preliminary
1/ Figures in parenthesis reflect reserve effect of match sale-purchase agreement.2/ Includes effect of changes in special certificates of $ +94 million of the week of June 9, $ +416 million of the week of June 16,
and $ -510 million of the week of June 23.
I

Table 6
MAJOR SOURCES AND USES OF RESERVESRetrospective and Prospective Changes
(Dollar amounts in millions, based on weekly averages of daily figures)
Factor s a ffecting a upp ly of r e s e r v e s = Change = Bank use of reserves
Federal Reserve Currency Foreign Other nonmember inquired Excesseriod credit (exl. Gold outside Treasury Float deposits deposits and total r e resfloat) e / stock banks operations reserves reservescfloat 1/ stock banks and gold loans F.R. accounts reservesfloat)~~~o reserves)s rseral
Year:1969 (12/25/68 -1970 (12/31/69 -
12/31/6912/30/70
1971--Tan. 6132027
Feb. 3101724
Mar. 310172431
Apr. 714
2128
May 5121926
June 29162330
July 71421
28
Aug. 4 p11 p18 p
+5,539+3,351
+ 938- 534+ 64
S204
+ 8- 236+1,523- 928
+ 279- 275+ 761- 516+ 506
+ 279- 275
+ 348+ 54
+ 771+ 201+ 503+ 115
+ 305- 974
+ 202+ 160+1,156
+ 362+ 364+ 743- 957
+ 336- 205+ 484
( S i g n
-- -2,+1,150-
2 -3,
- 385 +-- -+-- +-- ±+
- 171
- 229
- 86
- 114
i n
76
12267
effecti c a t aicate
- 813
+ 773
+ 188- 63
+ 108
- 275
+ 289- 256- 50
+ 418
- 99
- 105
+ 508- 186
- 60
243S249- 131
- 384
+ 307- 248
+ 83+ 218
+ 169+ 522+ 398- 648
- 776
- 54
- 244
+ 176+ 204
+ 266- 17
+ 125
on re e r v e s )
+ 54 - 898+ 1 -1,655
+ 8- 4
+ 241+ 667
- 250- 673+ 191- 889
- 402+ 542- 533+ 844
- 752+ 185- 357+ 304- 371
+ 235+ 2414 301- 10
- 497- 211+ 421- 177
- 327+ 291- 122+ 291- 334
+ 376+ 217+ 11- 453
- 127- 70+ 205
- 50
+ 305- 26- 34
- 130- 7+ 97- 515
- 40
- 37
+ 280+ 85- 9
- 173
+ 217+ 187- 23
- 72
+ 99- 45
- 315
- 33
- 28
+ 228+ 33- 28
- 43
+ 82+ 110- 27
- 89
- 29
- 1
+1,448+1,163
+1,340+1,257
+ 657+ 144+ 727-1,047
- 168- 167+ 350- 306
- 227- 50
+ 368- 276+ 150- 171+ 24+ 440+ 252
+ 306- 561+ 406- 188
81- 178+ 146- 250+ 351
- 24+ 213+ 401
S 94
- 89- 148+ 61
+ 108- /
+ 111- 513+ 60+ 190
- 45
- 32
+ 92+ 20
- 147- 88
+ 183- 197
+ 30899
69
- 127- 33
+ 317- 135
- 128+ 72
+ 111
- 212
+ 181- 44
+ 22
+ 45- 272+ 277- 215
+ 404- 447
+ 265
1/ For retrospective details, see Table 5.
I/ Includes $400 million in special drawing account.p - Preliminary.
4-
+
4-+
+
+
4-
+
+
4-+
+
+
+

Table 7
Reconciliation--Money supply and Credit Proxy Adjusted(Billions of dollars, not seasonally adjusted)
Item
1. Money supply--M 1
2. Plus: Time deposits otherthan large CD's
3. Enuals: Money supply--M,
Levels, 1971 Dollar Change
March Junel July 2nd Qtr., 1971 June to July, 1973
217.4 223.6 225.9 6.2 2.3
218.9
436.3
226.1
449.6
226.9
452.7
7.2
13.3
Plus:
4. U.S. Gov't. deposits atmember banks
5. Net domestic commercial bankdeposits at member banks
6. Large CD's
7. Nondeposit funds 1/
8. Time deposit of U.S. Gov't.and commercial banks
9. F.R. Float
Less:
10. Demand deposits at nonmemberbanks
11. Time deposits at nonmemberbanks
12. Currency component of themoney supply
13. Deposits at Edge Act Corps.,agencies and foreignbranches
14. Foreign deposits at F.R.
Equals:
15. Credit Proxy Adjusted
4.5 4.4 5.7
4.3
28.0
7.0
4.0
28.4
4.4
4.2
29.5
4.1
1.9 1.9 1.9
2.7 2.7 3.0
38.3 39.9 40.5
56.5 58.8 59.4
49.5 51.1 51.9
0.8 0.7 0.8
0.4 0.4 0.4
339.2 344.7 -348.2
p - Preliminary.1/ Includes borrowings from banks own foreign branches,commercial paper and other
minor item.NOTE: Sums of levels and changes -may not add because of rounding.
-0.1
-4 .3
0.4
-2.6
0.2
1.1
0.3
0.3
2.3
0.8
-0.1
,.5
_

Table 7A
Reconciliation--Money Supply and Credit Proxy Adjusted(Billions of dollars, seasonally adjusted)
Levels, 1971 2nd Qtr. 1971 June to July, 1971Dollar Percentage Dollar Percentage
Item ]March June July Change Change Change Change
1. Money supply--M I
2. Plus: Time depositsother than large CD's
3. Equals: Money supply--
M2
219.4 225,6
218.3 225,8
437.6 451.4
227.6
226.6
454.2
6.2
7.5
13.8
Plus:
4. U.S. Gov't. deposits atmember banks
5. Net domestic commercial
bank deposits at member
banks
6. Large CD's
7. Nondeposit funds 1/
4.8 3.9 3.7 -0.9
4.7 4.3 4.2 -0.4
27.8 28.6 30.1 0.8
7.0 4.4 4.1 -2.6
Less:
8. Currency component ofthe money supply
9. Deposits at nonmemberbanks, and otheritems 2/
Equals:
10. Adiusted Credit Proxy
50.0 51.2 51.7 1.2
91.8 95.7 96.7 3.9
340.2 345.7 347.9
1/ Includes borrowings from banks own foreign branchcs, commercial paper and <otherminor items.
2/ Other items include imoney supply type deposits at Edge Act corporations anddomestic branches of foreign banks.
NOIE: Suams of leveisand changes may not add because of rounding.p - Preli-minary.
2.0 10.611.3
13.7
12.6
-0.2
-0.1
1.5
-0.3
0.5
1.0
2.2

Table 8
Reserve Absorbtion by Type of Deposit--Selected Periods(Millions of dollars, seasonally adjusted)
Dec. 1970- Dec. 1970- March 1971-July 1971 March 1971 JuLy 1971
Change in total reserves 1,341 823 518
Reserves absorbed by:Demand deposits adjusted 812 289 523
Interbank deposits 329 213 116
U.S. Government deposits -387 -219 -168
Time and Savings deposits 810 495 315
Eurodollars and Commercialpaper 1/ -111 -85 -26
Excess reserves -51 -9 -42
Adjustment due tolagged accounting -61 139 -200
Per cent of total reservechange absorbed by:Demand deposits adjusted 60.6 35.1 101.0
Interbank deposits 24.5 25.9 22.4
U.S. Government deposits -28.9 -26.6 -32.4
Time and Savings deposits 60.4 60.2 60.8
Eurodollars and Commercialpaper 1/ -8.3 -10.3 -5,0
Excess reserves -3.8 -1.1 -8,1
Adjustment due to
lagged accounting -4,6 16,9 -38,6
1/ Member bank borrowings from own foreign branches subject to Regulation M
reserve requirements and commercial paper subject to Regulation D.