FOG DENSITY MEASURING SYSTEMk.pdf · MATLAB, which draws graphs from the measured values. ... in...
5
Acta Electrotechnica et Informatica, Vol. 12, No. 2, 2012, 67–71, DOI: 10.2478/v10198-012-0021-7 67 ISSN 1335-8243 (print) © 2012 FEI TUKE ISSN 1338-3957 (online) www.aei.tuke.sk www.versita.com/aei FOG DENSITY MEASURING SYSTEM Ľuboš OVSENÍK * , Ján TURÁN * , Pavol MIŠENČÍK * , János BITÓ ** , László CSURGAI-HORVÁTH ** * Department of Electronics and Multimedia Communications, Faculty of Electrical Engineering and Informatics, Technical University of Košice, Park Komenského 13, 042 00 Košice, Slovak Republic, tel.: +421 55 602 2943, 4336, 4277 e-mail: [email protected], [email protected], [email protected] ** Department of Broadband Infocommunications and Electromagnetic Theory, Budapest University of Technology and Economics, Hungary, e-mail: [email protected], [email protected] ABSTRACT Currently, lasers are so powerful that they allow transmitting signal from behind the glass window, thus increasing the possibility of placement and security FSO systems. But still the visibility of transmission and environmental impact of environment on the signal transmitted remains a big problem. This paper deals in detail with a description of the instrument for measuring the density of fog, humidity and temperature of the environment. Long-term measurement of these parameters allows us to create models for transmission FSO environment. Keywords: fog sensor, FSO system simulator, measuring density, measuring temperature and relative humidity 1. INTRODUCTION Free Space Optics (FSO) is a device using modulate visible or infrared beam for optical communication through atmospheric line medium [7,8]. FSO system sends optical beam from one device to other using laser diodes with small output power. The receiver of the beam is equipped with highly sensitive photoreceptors. FSO systems operate at distance of several kilometres (line-of- sight) where there is no obstacle between the devices and powers of optical transmitters are secured. Since this is a system whose transmission medium is a free environment, the biggest drawback of this technology is a strong dependence on the reliability of weather conditions. There are several disturbing effects on the quality and transmission range [5,6]. The main disturbance in the optical communication free environment is a dense fog. Fog is vapour composed of water droplets, whose diameter is only a few hundred microns, but at the scattering and reflection of signal, degradation occurs or completely prevents light transmission through the environment. Therefore, we need to do a preliminary analysis of visual transmission and on the basis of that analysis to determine the appropriate parameters of the transmission system. One of the measurement device by which we determine the transmission quality of the environment is the fog sensor. The first part of this paper describes the general principle of this device and its technical parts (section 1. and 2.) In the following sections we describe the experimental results of transmission line measurements. 2. FOG DENSITY MEASURING SYSTEM Fog sensor is a device that measures data about density, temperature and relative humidity. These are important parameters for subsequent static and statistical evaluation of the quality of free space optical communication environment [1]. In order to estimate the attenuation due to fog, content of liquid water is measured in unit (g/m 3 ). This task usually requires relatively complex and expensive measuring instruments. For experimental purposes a simple and low cost device was developed by Digital and Optical Communication Lab. at BME (Budapest University of Technology and Economics) that measures the quantitative values of liquid water from the air [2]. Fig. 1 illustrates the block diagram of the experimental measurements of temperature, humidity and fog density in the Lab. of Optoelectronic systems KEMT FEI TUKE (Department of Electronics and Multimedia Telecommu- nications, Faculty of Electrical Engineering and Informatics, Technical University of Košice). Our system consists of an outdoor unit, which performs the measurement. This unit is connected to the indoor unit with RS-422 line. The indoor unit is connected to PC through RS-232. The measured data are processed in a PC in several ways. It can be saved to a file, rendered to chart or stored on the server. These individual components are described later in this paper. Fig. 1 Block diagram of the measurement 2.1. The principle of fog density measurement The external sensor unit of fog density measurement system is shown in Fig. 2, wired to the wall of Lab. of Unauthenticated | 194.138.39.60 Download Date | 1/15/14 3:06 AM
Transcript of FOG DENSITY MEASURING SYSTEMk.pdf · MATLAB, which draws graphs from the measured values. ... in...

Acta Electrotechnica et Informatica, Vol. 12, No. 2, 2012, 67–71, DOI: 10.2478/v10198-012-0021-7 67
ISSN 1335-8243 (print) © 2012 FEI TUKE ISSN 1338-3957 (online) www.aei.tuke.sk www.versita.com/aei
FOG DENSITY MEASURING SYSTEM
Ľuboš OVSENÍK*, Ján TURÁN*, Pavol MIŠENČÍK*, János BITÓ**, László CSURGAI-HORVÁTH**
*Department of Electronics and Multimedia Communications, Faculty of Electrical Engineering and Informatics, Technical University of Košice, Park Komenského 13, 042 00 Košice, Slovak Republic, tel.: +421 55 602 2943, 4336, 4277
e-mail: [email protected], [email protected], [email protected] **Department of Broadband Infocommunications and Electromagnetic Theory, Budapest University of Technology and Economics,
Hungary, e-mail: [email protected], [email protected]
ABSTRACT Currently, lasers are so powerful that they allow transmitting signal from behind the glass window, thus increasing the
possibility of placement and security FSO systems. But still the visibility of transmission and environmental impact of environment on the signal transmitted remains a big problem. This paper deals in detail with a description of the instrument for measuring the density of fog, humidity and temperature of the environment. Long-term measurement of these parameters allows us to create models for transmission FSO environment.
Keywords: fog sensor, FSO system simulator, measuring density, measuring temperature and relative humidity
1. INTRODUCTION
Free Space Optics (FSO) is a device using modulate visible or infrared beam for optical communication through atmospheric line medium [7,8]. FSO system sends optical beam from one device to other using laser diodes with small output power. The receiver of the beam is equipped with highly sensitive photoreceptors. FSO systems operate at distance of several kilometres (line-of-sight) where there is no obstacle between the devices and powers of optical transmitters are secured. Since this is a system whose transmission medium is a free environment, the biggest drawback of this technology is a strong dependence on the reliability of weather conditions. There are several disturbing effects on the quality and transmission range [5,6]. The main disturbance in the optical communication free environment is a dense fog. Fog is vapour composed of water droplets, whose diameter is only a few hundred microns, but at the scattering and reflection of signal, degradation occurs or completely prevents light transmission through the environment. Therefore, we need to do a preliminary analysis of visual transmission and on the basis of that analysis to determine the appropriate parameters of the transmission system. One of the measurement device by which we determine the transmission quality of the environment is the fog sensor. The first part of this paper describes the general principle of this device and its technical parts (section 1. and 2.) In the following sections we describe the experimental results of transmission line measurements.
2. FOG DENSITY MEASURING SYSTEM
Fog sensor is a device that measures data about density, temperature and relative humidity. These are important parameters for subsequent static and statistical evaluation of the quality of free space optical communication environment [1]. In order to estimate the attenuation due to fog, content of liquid water is measured in unit (g/m3). This task usually requires relatively
complex and expensive measuring instruments. For experimental purposes a simple and low cost device was developed by Digital and Optical Communication Lab. at BME (Budapest University of Technology and Economics) that measures the quantitative values of liquid water from the air [2].
Fig. 1 illustrates the block diagram of the experimental measurements of temperature, humidity and fog density in the Lab. of Optoelectronic systems KEMT FEI TUKE (Department of Electronics and Multimedia Telecommu-nications, Faculty of Electrical Engineering and Informatics, Technical University of Košice). Our system consists of an outdoor unit, which performs the measurement. This unit is connected to the indoor unit with RS-422 line. The indoor unit is connected to PC through RS-232. The measured data are processed in a PC in several ways. It can be saved to a file, rendered to chart or stored on the server. These individual components are described later in this paper.
Fig. 1 Block diagram of the measurement
2.1. The principle of fog density measurement
The external sensor unit of fog density measurement system is shown in Fig. 2, wired to the wall of Lab. of
Unauthenticated | 194.138.39.60Download Date | 1/15/14 3:06 AM
68 Fog Density Measuring System
ISSN 1335-8243 (print) © 2012 FEI TUKE ISSN 1338-3957 (online) www.aei.tuke.sk www.versita.com/aei
Optoelectronic Systems KEMT FEI TUKE. The principle of the fog measurement is given in Fig. 3. Outdoor unit regularly sends and receives short infrared optical pulses. Amplitude of the reflected optical pulses is influenced by the reflectance of the elements in the environment.
Fig. 2 Fog sensor – outdoor unit
Fig. 3 The principle of the fog density measurement
This information may be used for a good estimate of liquid water content in the environment. In addition the optical sensor is also equipped with temperature and relative humidity sensors. These parameters provide important information and have characteristic values in foggy weather. The sensor is built for the rainy conditions and is shielded from direct sunlight, but allows free movement of fog droplets into the sensor [2].
Fig. 4 Fog sensor - external (outdoor) unit
2.2. Technical equipments of fog sensor system
Fog sensor system consists of internal and external units (Fig. 4, Fig. 5).
Fig. 5 Fog sensor – internal (indoor) unit
The external microcontroller unit has a serial communication interface (RS-422) and it’s built to measure liquid water content in air temperature and relative humidity. The indoor unit of the system (Fig. 5) receives information from the outdoor unit (Fig. 4) using the RS-422, it converts them to RS-232 and the device is connected to a standard PC using a serial line. The indoor unit powers the outdoor unit; therefore the outdoor unit does not need a separate power supply.
Communication between outdoor and indoor unit is using the RS-422 with the following parameters:
38400 kbit/s, non-concurrent, 1 stop bit, no hardware control of flow;
Maximum cable length is about 1200 m [1].
2.3. Programs for the fog sensor system
The outdoor unit contains a microcontroller, which collects the measured data and communicates with the internal unit. The firmware of the sensor can be updated from the indoor unit, as the outdoor unit has a built-in boot loader system. The boot loader communicates with the control computer via a serial interface. The user program from the computer will be written into the microcontroller flash memory. Boot loader can be used only with those microcontrollers, which is capable to write its owned flash memory. The boot loader itself must be programmed into the initial address space of the flash memory using external programming device.
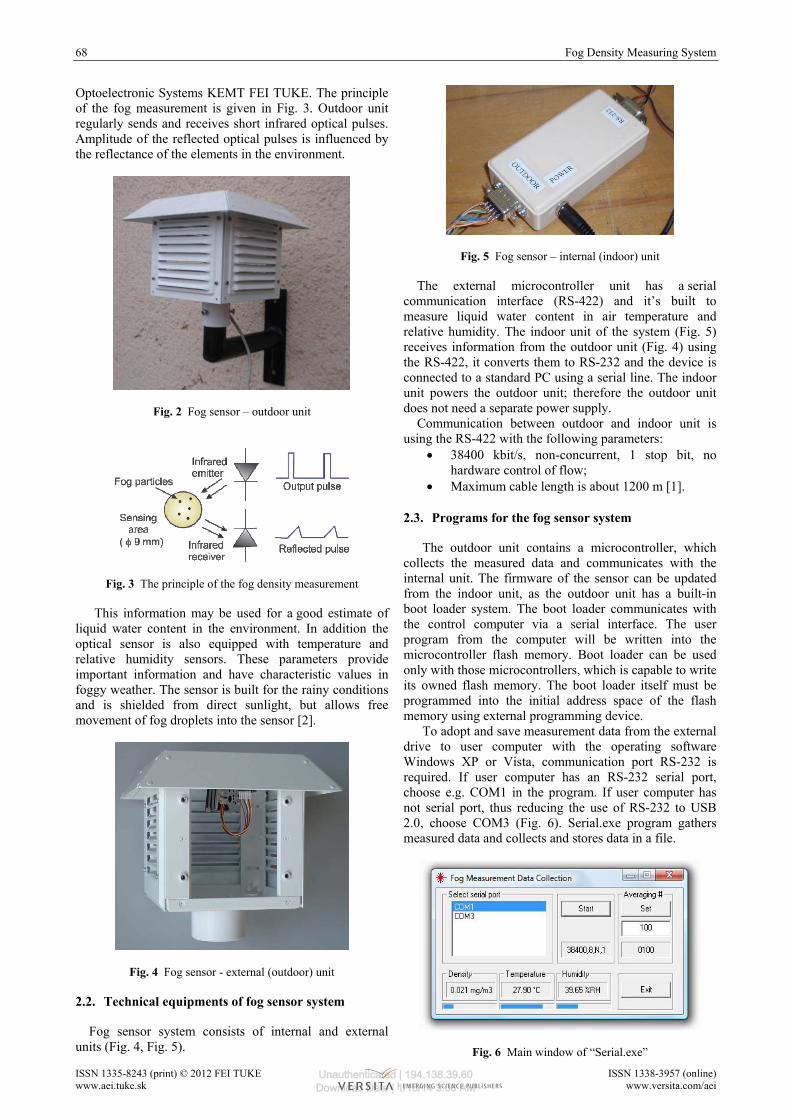
To adopt and save measurement data from the external drive to user computer with the operating software Windows XP or Vista, communication port RS-232 is required. If user computer has an RS-232 serial port, choose e.g. COM1 in the program. If user computer has not serial port, thus reducing the use of RS-232 to USB 2.0, choose COM3 (Fig. 6). Serial.exe program gathers measured data and collects and stores data in a file.
Fig. 6 Main window of “Serial.exe”
Unauthenticated | 194.138.39.60Download Date | 1/15/14 3:06 AM

Acta Electrotechnica et Informatica, Vol. 12, No. 2, 2012 69
ISSN 1335-8243 (print) © 2012 FEI TUKE ISSN 1338-3957 (online) www.aei.tuke.sk www.versita.com/aei
The measured data are sampled in the outdoor unit every 10 ms, then arithmetically averaged by value "Averaging#" and sent to the indoor unit every second. The range of values for value "Averaging#" is from 1 to 1000. In the case referred to in Fig. 6, the value of "Averaging#" is set at 100.
3. EXPERIMENTS WITH FOG DENSITY MEASURING SYSTEM
In general, fog density is inhomogeneous in space, therefore to achieve appropriate estimate of the fog attenuation on a FSO link, the measuring device should be installed along the propagation path. These measurements are carried out in area of Technical University of Košice campus. Examples of these measurements and detailed description are given in the following experiments.
3.1. Experiment I
Each second the program for data gathering saves one sample to a text file. For the illustration purposes the first 15 measurement values of 3 December 2010 are shown (336_Fog_Humi_Temp_Fri_Dec_03_2010.txt) (Fig. 7) [1]:
Fig. 7 Text file with measured data
Stored data can be further processed in the program MATLAB, which draws graphs from the measured values. They are shown in Fig. 9. Value “Relative Time” is the number of seconds in the current day which always begins with zero. “Averaging#” represents average value. The current file is closed and a new file is opened every day at 24.00. If the program is interrupted, later it is re-started and data entry continues in the same file without a change in a date. Program is naming text file as it follows: 0_Fog_Humi_Temp_day_month_year.txt, e.g.: 336_Fog_Humi_Temp_Fri_Jan_14_2010.txt
In Fig. 8 is shown the program environment in MATLAB, which requires the selection of the text file by start. This text file was created by Serial.exe program. After marking the desired text file, in this case „336_Fog_Humi_Temp_Fri_Jan_14_2010.txt“, the pro-gram draws three courses. These are the traces of fog density, temperature and humidity for the entire day (Fig. 9).
Fig. 8 Environment in MATLAB
In Fig. 9 the result characteristics of fog density, temperature and humidity are depicted for the day 14th of January 2011.
Fig. 9 Plotted traces of fog density, temperature and humidity for the entire day in an environment of “MATLAB”
For a design of the quality and efficient FSO systems it is necessary to know the details of each element of the facilities and see the connection between changes in parameters of equipment, between changes in the characteristics of transmission channel and the overall effect. Simulation of free space optical communication environment is an essential tool in designing or experimenting with such devices. The part of the system in KEMT FEI TUKE is capable of constant monitoring and recording of the density of fog, temperature and humidity of the external environment, which helps to efficiently and correctly analyze the reliability of FSO systems.
3.2. Experiment II
When we run the program in MATLAB entitled “fog_ sensor.m” displays the user interface (Fig. 10), where the user enters a value for the maximum density of the fog and the number of days. The term maximum value of fog is meant the maximum possible upper limit of the density of fog, in which the optical connection is interrupted. We have to enter number of days because the program allows you to describe the charts for several days, not just one particular day.
Unauthenticated | 194.138.39.60Download Date | 1/15/14 3:06 AM

70 Fog Density Measuring System
ISSN 1335-8243 (print) © 2012 FEI TUKE ISSN 1338-3957 (online) www.aei.tuke.sk www.versita.com/aei
Fig. 10 User interface
After confirmation of the values entered click OK, the table with a choice of days on “selected file” is displayed (Fig. 11). If the specified number of days is greater than 1, the program does not selected multiple days at once, but the table with a choice of days to repeat the number of times. Upon completion of the selection program draws 3 graphs, this is graphically depicted fog density dependence (mg/m3), temperature (°C) and relative humidity (%) from time (Fig. 12). On the x-axis is time information in hours, on the y-axis is time information about individual values. On the fog density chart y-axis varies with the maximum reading of value for more realistic displays of measured values.
Fig. 11 Choice of days
Fig. 12 Graph of fog density, temperature and humidity of the day and the threshold value (red line)
In the first case study is the maximum value of fog is set to 0.05 mg/m3 and is selected only one day, namely January 23, 2011. As shown in the figure below Fig. 12, most of the measured values are smaller than the threshold value, which is set for the maximum density of the fog at 0.05 mg/m3 and can see that some values exceed this threshold. When this limit is exceeded the connection is assumed unavailable. Specifically, the density values at
which the connection was unavailable are stored in a text file called “OutFile.txt”.
Fig. 13 Graph of fog density, temperature and humidity for the period 15-19.1. 2011 and the threshold set by the red line
In the second case study five days is chosen, specifically, in the period from 15 to 19 January 2011. The maximum value of fog is set to 0.123 mg/m3 significantly higher as in the first case. From the picture Fig. 13 only outage can be observed, but in fact a statement has 212 values was stored in called “OutFile.txt”.
4. CONCLUSIONS
In this paper a Fog Density Measurement System was presented. The article gives a detailed description of its internal and external units. Experiments were performed in area of Technical University of Košice campus. The output values of these experiments were used for design of optical transmission systems (FSO). The measured values of the fog sensor are plotted in graphs using MATLAB. By applying a threshold level, we are able to determine immediately from the graph the availability valuesfor FSO, too.
Measurements are still running and they are processed in our laboratory. These results may serve to improve the FSO transmission path design and help the engineering process.
ACKNOWLEDGMENT
We support research activities in Slovakia / Project is co-financed from EU funds. This paper was developed within the Project
"Centrum excelentnosti integrovaného výskumu a využitia progresívnych materiálov a technológií v oblasti automobilovej elektroniky", ITMS 26220120055 (100%).
REFERENCES
[1] CSURGAI-HORVÁTH, L.: Fog sensor manual. BUTE, Hungary, Budapest, 2010.
Unauthenticated | 194.138.39.60Download Date | 1/15/14 3:06 AM

Acta Electrotechnica et Informatica, Vol. 12, No. 2, 2012 71
ISSN 1335-8243 (print) © 2012 FEI TUKE ISSN 1338-3957 (online) www.aei.tuke.sk www.versita.com/aei
[2] CSURGAI-HORVÁTH, L. – BITÓ, J.: Fog attenuation on V band terrestrial radio and a low cost measurement setup. Future Network & Mobile Summit, Florence, Italy, Paper #47, June 2010.
[3] KIM, I. – McARTHUR, B. – KOREVAR, E.: Comparison of Laser Beam Propagation at 785 nm and 1550 nm in Fog and Haze for Optical Wireless Communications. In Proceedings of SPIE, Boston, USA, Vol. 4214, pp. 26-37, 2001.
[4] BOUCHET, O. – O’BRIEN D. – EL TABACH M. M. et al.: State of the Art – Optical Wireless. Deliverable D4.1, ICT - Omega, 2008.
[5] KVICALA, R. – KVICERA, V. – GRABNER, M. – FISER, O.: BER and Availability Measured on FSO Link. Radioengineering, Vol. 16, No. 3, 2007.
[6] ALNABOULSI, M. – SIZUN, H. – DEFORNEL, F.: Fog Attenuation for Optical and Infrared Waves. Journal of Optical Eng., Vol. 43, pp. 319-329, 2004.
[7] NADEEM, F. – KVICERA, V. – SALEEM, A. M. – LEITGEB, E. – MUHAMMAD SHEIKH, S. – KANDUS, G.: Weather Effects on Hybrid FSO/RF Communication Link. IEEE Journal on Selected Areas in Communications, Vol. 27, No. 9, pp. 1687-1697, December 2009.
[8] KIM, I. – KOREVAR, E.: Availability of Free Space Optics (FSO) and Hybrid FSO/RF Systems. Proc. SPIE, Vol. 4530, pp. 84-95, 2001.
Received January 5, 2012, accepted June 14, 2012
BIOGRAPHIES
Ľuboš Ovseník (doc., Ing., PhD.) received Ing. (MSc.) degree in radioelectronics from the University of Technology, Košice, in 1990. He received PhD. degree in electronics from University of Technology, Košice, Slovakia, in 2002. Since February 1997, he has been at the University of Technology, Košice as Associate Professor for electronics and information technology. His general research interests include optoelectronic, digital signal processing, photonics, fiber optic communications and fiber optic sensors.
Ján Turán (Dr.h.c., Prof., RNDr., Ing., DrSc.) received Ing. (MSc.) degree in physical engineering with honours from the Czech Technical University, Prague, Czech Republic, in 1974, and RNDr. (MSc.) degree in experimental physics with honours from Charles University, Prague, Czech Republic, in 1980. He received a CSc. (PhD.) and DrSc. degrees in radioelectronics from University of Technology, Košice, Slovakia, in 1983, and 1992, respectively. Since March 1979, he has been at the University of Technology, Košice as Professor for electronics and information technology. His research interests include digital signal processing and fiber optics, communication and sensing. Pavol Mišenčík (Ing.) received Ing. (MSc.) degree in 2009 at Department of Electronics and Multimedia Telecommunications, Faculty of Electrical Engineering and Informatics of Technical University of Košice. Since September 2009 he has been at University of Technology, Košice as PhD. student. His research interests include FSO/RF hybrid systems. János Bitó (doc., Ing., PhD.) graduated from Budapest University of Technology and Economics (BME) as electrical engineer (1987) and received the PhD (Dr.-Ing.) from Technical University of Berlin (TUB) in 1996. He was researcher (1994-1996) at TUB. Since then he is employed as associate professor at BME, Department of Broadband Infocommunications and Electromagnetic Theory. His research interest focused on mobile and wireless broadband terrestrial and satellite communication systems, and propagation studies of radio communications. He has published around 100 referred journal and conference paper. He was executive vice chairman of the 16th IST Mobile and Wireless Communications Summit, 2007.
László Csurgai-Horváth (Ing., PhD.) received his MSc. (Ing.) degree in telecommunications from the Budapest University of Technology, in 1985. He received PhD. degree in electrical engineering from Budapest University of Technology and Economics, in 2010. He works at the Budapest University of Technology and Economics, Department of Broadband Infocommunications and Electromagnetic Theory, as associate professor. His research interest is millimetre band radio propagation measurements and modelling, furthermore the characterization of the free space optical channel.
Unauthenticated | 194.138.39.60Download Date | 1/15/14 3:06 AM