
FOCUSED ON THE FUTURE - Royal Canadian Mint › store › dyn › PDFs › 2015-Royal... ·...
84
FOCUSED ON THE FUTURE ANNUAL REPORT 2015
Transcript of FOCUSED ON THE FUTURE - Royal Canadian Mint › store › dyn › PDFs › 2015-Royal... ·...

FO CUSED ON THE FUTUREANNUAL REPORT 2015

1 Focused on the future
2 Message from the President and CEO
14 Message from the Chair
15 Corporate Governance
17 Board of Directors
18 Management Discussion and Analysis
33 Management Report
34 Independent Auditor’s Report
35 Financial Statements
39 Notes to the Consolidated Financial Statements
80 Executive Officers
2015 2014 % change
Key financial highlights ($ in millions)
Revenues 2,974.1 2,443.4 21.7
Gross profit 203.9 198.1 2.9
Pre-impairment profit before tax 65.0 56.1 15.9
(Loss) profit before income tax (0.5) 56.1 (100.9)
(Loss) profit after tax (0.3) 41.3 (100.7)
Total assets 438.8 491.1 (10.6)
Shareholder’s equity (post impairment net of tax) 275.8 333.8 (17.4)
Capital expenditures 17.4 25.4 (31.5)
Cash flow from operating activities 115.2 87.9 31.1
Pre-impairment pre-tax return on equity1 20.0% 16.8% 19.0
Pre-tax return on equity (0.2%) 16.8% (101.2)
Key operating highlights
Canadian circulation coins produced (in millions of pieces) 350.0 173.0 102.3
Gold bullion coin sales (in thousands of ounces) 953.0 707.0 34.8
Silver bullion coin sales (in millions of ounces) 34.3 29.1 17.9
Number of employees (at December 31) 1,202 1,262 (4.8)
1 Calculated based on pre-impairment profit and pre-impairment equity
FINANCIAL AND OPER ATING HIGHLIGHTS
Contents
Revenues (segmented)($ in millions)
Canadian Circulation
Circulation Products and Solutions
Bullion Products and Services
Numismatics
* Impairment charge of $65.5 million in 2015
3,159.4
2,583.3
3,375.2
2,443.4
2,974.1
2,211.1
1514131211 1514131211
Pro�t before impairmentand income tax($ in millions)
1514131211
Total production(millions of pieces)
2,656.9
2,062.3 2,059.71,936.1 X,XXX
65.0*
42.1 40.7
48.0
56.1

1ROYAL CANADIAN MINT ANNUAL REPORT 2015
Focused on the futureTo deliver excellence demands discipline, focus and evolution.
In 2015, we undertook a comprehensive strategic review to ensure we continue to manage Canada’s coinage system effectively and celebrate the country with pride, while reaching our next stage of growth and sophistication as a commercial enterprise.
We confirmed our core strengths, clarified our priorities and made careful strategic choices, reorganizing and consolidating as needed. Customer-focused and results-oriented, we are future-ready.

2 ROYAL CANADIAN MINT ANNUAL REPORT 2015
Since joining the Mint in early 2015, I have been privileged to lead an organization that plays a fundamental role in the economic life of Canada, but also has a powerful way to remind us of what makes us proud to be Canadian. This is the foundation upon which the Mint was built over a century ago and continues to be at the heart of who we are today.
The Mint achieved remarkable operational success in 2015. We attained a record $199 million in revenue in our Numismatics business for the year. Our Bullion coin sales business also proved to be record-breaking, as we sold an unprecedented 34 million ounces of silver, and an incredible 953 thousand ounces of gold made its way through our production line. We also advanced our world-renowned colour technology that brings Canadian celebrations to life on our circulation coins. Finally, we successfully completed the divestiture of the MintChip™ assets.
These milestones would not have been possible without our greatest asset—our people. The Mint’s continued success would not be possible without the hard work and dedication of our employees and I would like to thank them for their tremendous efforts in 2015.
Our financial results for 2015 are complex. While we achieved operating profits of $65.0 million, this was offset by a non-cash impairment charge of $65.5 million, amounting to a loss of $0.5 million for the year. We continued to generate strong cash from operations which allowed us to return significant dividends of $53 million to the Government of Canada.
MESSAGE FROM THE PRESIDENT AND CEO
To position ourselves for future growth, recognizing that our markets and our customers are constantly evolving, the Mint conducted a comprehensive strategic review in 2015. Our challenge and responsibility is to make sure we are equipped to adapt to change, and also to profit from it. Being ‘choiceful’ has been our approach: we have been deliberately and strategically selective about our priorities.
We identified opportunities for efficiency, reviewed our operating costs, adjusted and redeployed part of our workforce. We reorganized our businesses and set aside activities not delivering sufficient value. We also improved our governance on spending, including travel and hospitality. Last but certainly not least, the cornerstone of the strategy is a new corporate vision focused on excellence, serving our customers, delivering value to Canada and Canadians, and providing a supportive work environment for our talented people.
2016 will see us put the Mint’s new strategy into action. Our future is bright. By working collaboratively and building on the strengths that brought us to our current position of success, I am confident in our readiness to pursue new opportunities, with the future squarely in focus.
Sandra L. HaningtonPresident and CEO

3ROYAL CANADIAN MINT ANNUAL REPORT 2015
TO DELIVER EXCELLENCE… THROUGH OUR CUSTOMER-DRIVEN BUSINESSES, OUR
TALENTED PEOPLE AND THE VALUE WE ADD TO CANADA AND CANADIANS
VISION
CORE PROGRAM FOR-PROFIT BUSINESSES
Circulation Products and Solutions
We are a leading provider of finished coins and coin blanks to customers around the world, including central banks, mints, monetary authorities and finance ministries.
We leverage our expertise in products and processes to support our customers to meet their objectives.
Canadian Circulation
Our Canadian Circulation Program delivers secure, high-quality and cost-effective coinage in support of Canadian trade and commerce.
We manage a sophisticated forecasting and distribution system that ensures the availability of coins across the country.
We celebrate Canada’s history, culture and values through our commemorative coin program.
Bullion Products and Services
We produce and market high-purity gold, silver, platinum and palladium Maple Leaf bullion coins, bars and wafers, in collaboration with our strong network of dealers and distributors.
Our integrated refinery, precious metals storage services, and exchange traded receipts (ETRs) support our Bullion business and contribute to our market-leading position.
Numismatics
Our Numismatics business produces and sells exceptional collectible coins and medals to customers in Canada and around the world.
A sophisticated marketing business, we are sharply focused on developing excellent products that resonate strongly with customers.

4 ROYAL CANADIAN MINT ANNUAL REPORT 2015
The 2015 Remembrance-themed circulation coins were extremely popular. The circulation coin packs, collector cards and special edition uncirculated sets sold out within a couple of weeks.

To celebrate Canada’s 150th anniversary, the Royal Canadian Mint invited Canadians from coast-to-coast-to-coast to design the 5-cent, 10-cent, 25-cent, one-dollar and two-dollar coins that will circulate in 2017.
5ROYAL CANADIAN MINT ANNUAL REPORT 2015
FIRST AND FOREMOST, CANADA’S MINT
The Canadian Circulation Program is focused on delivering secure, high-quality and cost-effective coinage in support of Canadian trade and commerce.
In 2015, we continued to manufacture coins and manage the country’s sophisticated forecasting and distribution system efficiently to ensure the availability of coins across the country. As chair of the National Coin Committee, we worked collaboratively with Canadian financial institutions, armoured car companies and other stakeholders to guarantee Canada had no coin shortages and that inventories were maintained at appropriate levels.
Proud champion for CanadaAs part of our role celebrating Canadian heritage through commemorative coin programs, in 2015 we issued a coloured 25-cent coin to mark the 50th anniversary of the Canadian flag, manufactured using our innovative colour pad printing process. To commemorate the 100th anniversary of the poem In Flanders Fields, for Remembrance Day we released a highly popular colour 25-cent Poppy coin featuring a large, red poppy, and a $2 coin depicting the author, Lt. Col. John McCrae. In addition, we saluted Canada’s first Prime Minister, Sir John A. MacDonald, with the issue of a two-dollar coin commemorating his 200th birthday earlier in the year. These coins were all launched with coin exchange events held across Canada.
“My Canada, My Inspiration”To engage Canadians, we invited Canadians to submit designs for the 5-cent, 10-cent, 25-cent, one-dollar and two-dollar coins that will circulate in 2017 during Canada’s 150th birthday. We received over 10,000 entries from which five finalists were selected by a distinguished panel of experts, Mint employees and prominent Canadians. From coast to coast to coast, over one million Canadians voted online for their favourite design for each denomination. The winning designs will be revealed in 2017.
We ensure Canadians have coins—when and where they need them.
Canadian Circulation
6 ROYAL CANADIAN MINT ANNUAL REPORT 2015
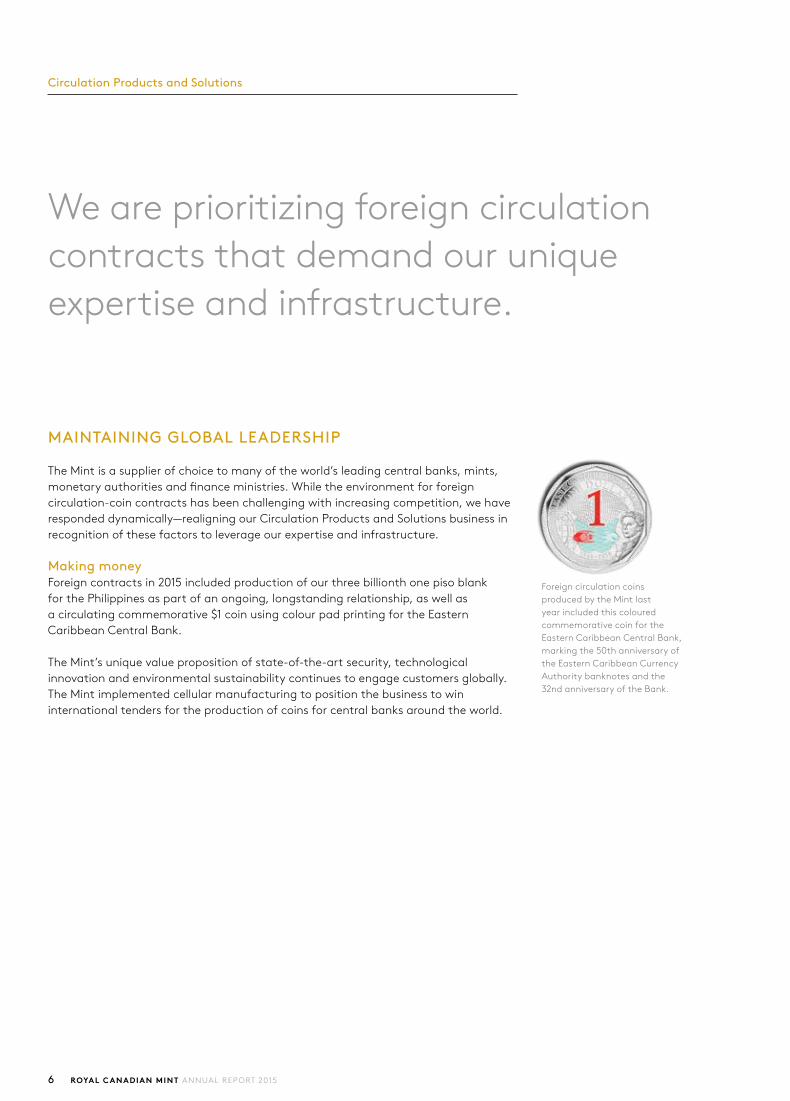
Foreign circulation coins produced by the Mint last year included this coloured commemorative coin for the Eastern Caribbean Central Bank, marking the 50th anniversary of the Eastern Caribbean Currency Authority banknotes and the 32nd anniversary of the Bank.
Circulation Products and Solutions
We are prioritizing foreign circulation contracts that demand our unique expertise and infrastructure.
MAINTAINING GLOBAL LEADERSHIP
The Mint is a supplier of choice to many of the world’s leading central banks, mints, monetary authorities and finance ministries. While the environment for foreign circulation-coin contracts has been challenging with increasing competition, we have responded dynamically—realigning our Circulation Products and Solutions business in recognition of these factors to leverage our expertise and infrastructure.
Making moneyForeign contracts in 2015 included production of our three billionth one piso blank for the Philippines as part of an ongoing, longstanding relationship, as well as a circulating commemorative $1 coin using colour pad printing for the Eastern Caribbean Central Bank.
The Mint’s unique value proposition of state-of-the-art security, technological innovation and environmental sustainability continues to engage customers globally. The Mint implemented cellular manufacturing to position the business to win international tenders for the production of coins for central banks around the world.

7ROYAL CANADIAN MINT ANNUAL REPORT 2015
Forecasting demand
Annually, we forecast national demand based on historical and macroeconomic data and provide regional forecasts and monthly outlooks throughout the year.
Managing distribution
We work closely with Canada’s financial institutions and the National Coin Committee to distribute Canadian coins where demand requires them—in support of trade and commerce.
Recycling
We collect and redistribute coins recycled from kiosks across Canada in collaboration with recycling companies, minimizing manufacturing requirements.
Maintaining supply
We ensure supply by efficiently producing the volume of new coins required to meet demand not satisfied through other channels.
MANAGING THE COINAGE SYSTEM
Coin Demand
4.2 billion
Coins Manufactured2
350 million
Coins Recycled1
590 million
The Mint’s role as manager of Canada’s coinage system is unique in the world. We are the only mint that oversees the manufacture, supply, circulation and redistribution of coins to meet national currency needs; this integrated role drives great efficiency for Canada.
1 Recycled coins do not include 1-cent volumes since they are not re-circulated.2 Manufactured volumes do not include coins produced for the Alloy Recovery Program (ARP) or foreign countries.
RecyclingMaintaining supply
Forecastingdemand
Managing distribution

8 ROYAL CANADIAN MINT ANNUAL REPORT 2015
The Bullion DNA Dealer Program includes exclusive access to a member-only site that provides marketing collateral, product photos and videos, and advance notice of Bullion news and products from the Mint. Members are also listed on the Mint’s website as official Royal Canadian Mint Bullion DNA dealers, giving them extra profile among potential customers.
9ROYAL CANADIAN MINT ANNUAL REPORT 2015
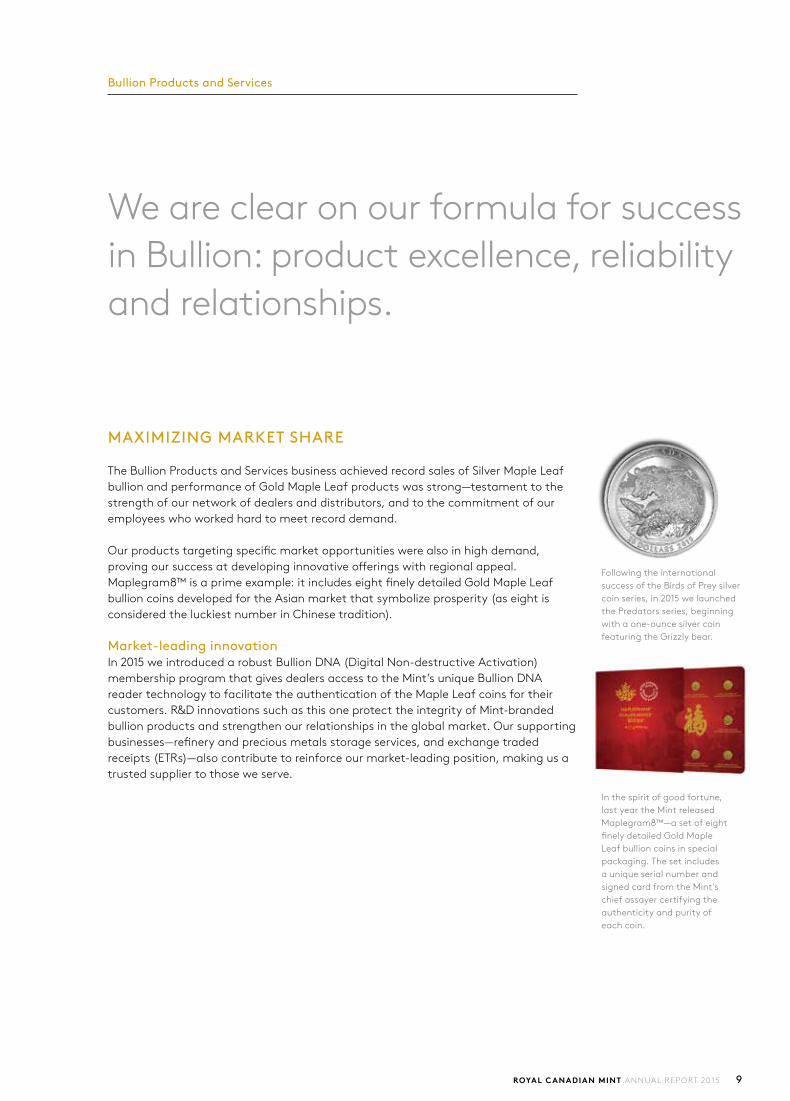
In the spirit of good fortune, last year the Mint released Maplegram8™—a set of eight finely detailed Gold Maple Leaf bullion coins in special packaging. The set includes a unique serial number and signed card from the Mint’s chief assayer certifying the authenticity and purity of each coin.
Following the international success of the Birds of Prey silver coin series, in 2015 we launched the Predators series, beginning with a one-ounce silver coin featuring the Grizzly bear.
We are clear on our formula for success in Bullion: product excellence, reliability and relationships.
MAXIMIZING MARKET SHARE
The Bullion Products and Services business achieved record sales of Silver Maple Leaf bullion and performance of Gold Maple Leaf products was strong—testament to the strength of our network of dealers and distributors, and to the commitment of our employees who worked hard to meet record demand.
Our products targeting specific market opportunities were also in high demand, proving our success at developing innovative offerings with regional appeal. Maplegram8™ is a prime example: it includes eight finely detailed Gold Maple Leaf bullion coins developed for the Asian market that symbolize prosperity (as eight is considered the luckiest number in Chinese tradition).
Market-leading innovation In 2015 we introduced a robust Bullion DNA (Digital Non-destructive Activation) membership program that gives dealers access to the Mint’s unique Bullion DNA reader technology to facilitate the authentication of the Maple Leaf coins for their customers. R&D innovations such as this one protect the integrity of Mint-branded bullion products and strengthen our relationships in the global market. Our supporting businesses—refinery and precious metals storage services, and exchange traded receipts (ETRs)—also contribute to reinforce our market-leading position, making us a trusted supplier to those we serve.
Bullion Products and Services

Photo: Sgt Ronald Duchesne, Rideau Hall © OSGG, 2015
10 ROYAL CANADIAN MINT ANNUAL REPORT 2015
The Mint’s $20 fine silver shaped Maple Leaf coin features an intricate series of deep veins rendered with finely detailed engraving.
The Polar Medal features the North Star and the Royal Canadian Mounted Police schooner, St. Roch, with two crew members.
We are focused on creating Numismatic coins and collectibles that delight customers.
FUELLING GROWTH
Every year, Canadians love our products. To help our passionate customers build and enjoy their collections, in 2015 we launched the Royal Canadian Mint app—a free, secure mobile application giving users a way to manage their personal collections from their smartphones. We also revitalized our Master’s Club program, introducing more frequent touchpoints and a tiered system with customer rewards, exclusive coins and special events for loyal collectors.
Growth in collectors In 2015, our Numismatics business continued to attract new customers at a strong pace. Our customer base grew by 10 percent, with the web remaining the primary engine of our omnichannel sales system.
Coins our customers love Coins showcasing the Mint’s innovative technologies were among the most popular offerings of the year with our customers. Silver coins including the multi-coloured glow in the dark Moonlight Fireflies, the Majestic Maple Leaves featuring a drusy stone, and Venetian glass turtle all sold out quickly.
Sellouts totalled 72 and revenues outpaced 2014 by $21 million—a new record.
The Mint’s artistic and technical abilities were acknowledged internationally with six nominations in the Krause Publications 2015 Coin of the Year Awards, winning in the Best Crown Coin category for the Maple Canopy, Autumn Allure fine silver coin. This stunning numismatic coin is enhanced with vibrant hues of orange and yellow which bring the true beauty of the maple tree’s autumn foliage to light.
Honouring Canadians Our Numismatics business plays an important role in honouring Canada and Canadians. A producer of medals since the 1930s, the Mint has a long history of celebrating Canadian excellence. In 2015, we were proud to manufacture the inaugural Polar Medal series, an official honour created by the Crown that is now part of the Canadian Honours System. The Polar Medal celebrates Canada’s Northern heritage and recognizes individuals who have made outstanding contributions in the polar regions and Canada’s North.
Numismatics

11ROYAL CANADIAN MINT ANNUAL REPORT 2015
The new Mint mobile application allows collectors to receive notices of new coin releases and track sales of popular coins. Available in both official languages, the app was downloaded more than 24,000 times by year end.

12 ROYAL CANADIAN MINT ANNUAL REPORT 2015
Clear strategic priorities are important, but execution depends on people.
ENGAGING OUR WORKFORCE
Our employees told us that they wanted us to be focused and clear about our operating priorities, provide them with improved tools to help them achieve results and improve communication and collaboration throughout the organization. This feedback guided our actions in 2015. We clarified our strategies and priorities and began the rollout of changes to evolve how we work together to deliver results.
Focus on leadership Excellence in leadership is critical for an engaged workforce. With this in mind, the Mint invested significantly in leadership development in 2015 and will sustain this focus into the future.
Promoting employee wellbeing Our efforts to strengthen employee engagement were complemented by a focus on employee wellbeing. In 2015, we formed a Mental Health steering committee that brought in mental health experts to begin delivering Mental Health First Aid training to our first responders and employees with direct reports. We believe that breaking down the stigma around mental health and starting an open dialogue will help employees understand what is going on in their own lives and ask for help when they need it. Our focus is to have a more supportive workplace that will reduce stress associated with having a mental illness, faster intervention for employees in crisis and increased access to the required resources and tools.

13ROYAL CANADIAN MINT ANNUAL REPORT 2015
SOCIAL RESPONSIBILITY: HIGHLIGHTS
Corporate social responsibility is an important part of the Mint’s business and an ongoing strategic consideration. Following are highlights of how the Mint fulfilled its commitments and obligations as a Canadian corporation and a global enterprise in 2015.
ENVIRONMENTAL STEWARDSHIP
To minimize and manage the environmental impact of its operations, we:
• Continued management of the coin distribution network and coin recycling program which efficiently re-circulates coins and reduces the production of new coinage to meet Canadian trade and commerce needs.
• Continued the alloy recovery program ensuring that scrap metals from coinage are recovered and sold back into the market.
• Managed wastewater through five wastewater systems (two in Ottawa, three in Winnipeg), using chemical and physical treatments to remove acids and neutralize heavy metals. Self-monitoring ensured contaminant levels remained below applicable requirements.
• Began implementation of an Environmental Management System (EMS) in both Ottawa and Winnipeg including the creation of an Environmental Management Committee to oversee the system.
EMPLOYEES
To ensure the Mint is a safe and healthy place to work,the Mint:
• Introduced Mental Health First Aid training so that all employees with direct reports and first responders such as our protective service officers could be equipped to recognize and address mental health issues in the workplace.
• Completed a high level risk assessment for the Mint’s operations and implemented a variety of health and safety programs.
• Engaged employees, friends and family in physical activities that spanned the distance between the mints of the world through the second annual Run-Walk-Bike initiative.
SUPPLY CHAIN
To protect the integrity of the precious and base metals supply chain, the Mint:
• Continued to execute the London Bullion Market Association (LBMA)-certified Responsible Metals Program.
• Executed a diversified metals sourcing strategy to ensure production is not impacted by raw material supply constraints.
• Made quality improvements to the supplier management system that allow for high quality products and services.
COMMUNITY
In support of local communities, the Mint:
• Raised more than $24,000 in Ottawa and Winnipeg for The Children’s Wish Foundation through the annual Exile Island challenge.
• Raised approximately $60,000 in Ottawa and Winnipeg for the Government of Canada Workplace Charitable Campaign (GCWCC) earning two awards from the campaign for highest pledge rates and highest number of leaders and friends.
CUSTOMERS AND PRODUCTS
For the health, safety, environmental impact and social wellbeing of the Mint’s customers, we:
• Further developed our non-cyanide diffused brass and bronze processes, which offer low-impact alternatives for manufacturing yellow coins that avoid use of cyanide and chlorine.
• Added a Q&A section to every product page on mint.ca to allow customers to pose questions directly to our dedicated customer service centre.

14 ROYAL CANADIAN MINT ANNUAL REPORT 2015
I was honoured in 2015 to be named Chair of the Royal Canadian Mint after eight years of service as a director on the Board. This is a complex organization— a commercial manufacturer, a marketing enterprise, a government-owned institution, and an important Canadian employer. Our role on the Board is to ensure the Mint is well directed to succeed on all of these fronts.
That work has been particularly rewarding in this period of evolution for the Mint. Appointed early in the year, President and CEO Sandra Hanington brought with her a refreshing management style and valuable experience from her years in the banking industry. That perspective was critical to the comprehensive strategic review of the organization undertaken in 2015.
The review was a highly successful, collaborative effort between the Board and senior leadership. It helped us clearly identify our priorities, reorganize the business, and set the foundation for definition of our new Corporate Plan that will guide us to 2020.
During the year, we concluded our Memorandum of Understanding (MOU) with the Government of Canada and transitioned to a new operating model consistent with our recently updated mandate. Covering a three-year period, the new MOU reflects the changes to the Royal Canadian Mint Act made with Bill C-43, which states the Mint should not anticipate profit on goods and services it provides to the Government of Canada.
I’d like to thank Susan Dujmovic for her strong leadership as Interim Chair prior to my appointment, and welcome our two newest directors, Carol Skelton and William C. Ross, who each bring unique experience and further add to the diversity of our Board.
MESSAGE FROM THE CHAIR
Representing the Mint’s shareholder, the Government of Canada, the Board of Directors is committed to ensuring strong governance of the organization, working together with the senior leadership team to sustain the Mint’s position of global leadership and vitality as a Crown corporation.
The past year has been an exciting, transformative and accomplished one for the Royal Canadian Mint. I am eager to see the organization carry forward the work it has done and continue its pursuit of excellence in 2016 and beyond.
Carman M. Joynt, FCPA, FCA, ICD.DChair
10.0
53.0*
10.010.010.0
1514131211
Dividend paid/declared(in millions of dollars)
* Includes $43 million in special dividend
15ROYAL CANADIAN MINT ANNUAL REPORT 2015
CORPOR ATE GOVERNANCE
The Royal Canadian Mint is committed to maintaining a strong governance framework that allows us to continue our leadership in the global minting industry, maintain and promote our vision and corporate values, and safeguard our long-term viability as a federal Crown corporation.
Enabling effective trade and commerce
Incorporated as a Crown corporation in 1969 under the Royal Canadian Mint Act, the Mint is accountable to Parliament through the Minister of Finance. Our legislative framework consists of the Royal Canadian Mint Act and the Financial Administration Act as well as other legislation and regulations that are applicable to all federal Crown corporations. Our raison d’être is to produce and deliver secure, high-quality and cost-effective Canadian circulation coins in support of trade and commerce.
Reflecting Canadian values
The Mint is committed to the highest standards of business conduct in carrying out our vision to “deliver excellence... through our customer-driven businesses, our talented people and the value we add to Canada and Canadians.” Our Code of Conduct and Ethics provides ethical guidance for our employees and sets forth the core values of honesty, respect, pride and passion that define employee behaviour and support our vision.
Ensuring effective governance
The Board of Directors has overall responsibility for overseeing the management of the Mint’s business and affairs. It exercises its duty in the best interests of the Mint and the long-term interests of our sole shareholder, the Government of Canada, in accordance with the Mint’s governing by-laws and applicable legislation.
To fulfill its stewardship responsibilities, the Board establishes and approves the Mint’s strategic direction through a five-year corporate plan, and reviews and approves major strategies and initiatives. It exercises due diligence by assessing risks and opportunities, monitoring corporate financial performance, ensuring the integrity of financial results, and providing timely reports to the Government of Canada.
Throughout most of 2015 and as we entered 2016, the Board consisted of 11 directors, including the President and Chief Executive Officer (CEO). Directors are appointed from different regions across Canada; four of the 11 directors are women. With the exception of the CEO, all directors are independent of the Mint’s senior management. The Board and its Committees hold in camera sessions with and without the presence of the CEO.
Staying connected with the public and our employees
The Mint engages in numerous activities to promote transparency, accountability and accessibility. The Mint hosts an Annual Public Meeting and publishes the Corporation’s Annual Report and other reports that have been tabled in Parliament. The Mint solicits feedback from and engages with Canadian consumers and other stakeholders through customer surveys, focus groups and other public opinion research on a variety of topics periodically throughout the year. The Mint also meets regularly with numismatic and bullion dealers and distributors and participates in trade conferences and shows that are attended by Mint customers, dealers and distributors.

C O R P O R AT E G O V E R N A N C E
16 ROYAL CANADIAN MINT ANNUAL REPORT 2015
Employee meetings were held in the spring and fall to update employees on our performance, to celebrate achievements and to recognize employees’ contributions to our success. Managers also held meetings with their direct reports to improve communication and promote employee engagement.
Board meetings, remuneration and reimbursement of expenses
In 2015, the Board of Directors met nine times. Three standing committees assist the Board in discharging its responsibilities: the Audit Committee, the Governance and Nominating Committee, and the Human Resources and Workplace Health and Safety Committee. In 2015, these committees met a combined total of 11 times.
While the CEO receives an annual salary, the Chair of the Board and directors are paid an annual retainer and per diem set by the Governor in Council pursuant to the Financial Administration Act. They are reimbursed for all reasonable out-of-pocket expenses including travel, accommodation and meals while performing their duties related to the Mint. In 2015, the Mint was issued a directive to align with the travel, hospitality, conference and event expenditure policies with Treasury Board policies, directives and related instruments. These expenses are posted quarterly on the Mint’s website. The Mint is on track to implement Treasury Board Guidelines fully in early 2016.
Director
Total remuneration(annual retainer /
per diem)Board meeting
attendance(5)Committee meeting
attendance(5)
Carman Joynt(1) $ 45,165 9/9 10/11
Sandra Hanington(2) N/A 8/8 10/10
John Bell $ 16,385 8/9 8/8
Claude Bennett $ 17,597 9/9 8/8
Guy Dancosse $ 23,175 8/9 3/3
Susan Dujmovic $ 18,407 8/9 5/5
Ghislain Harvey $ 18,567 7/9 2/3
Kirk MacRae $ 21,720 8/9 3/3
William C. Ross(3) $ 6,885 5/5 1/1
Carol Skelton(4) $ 11,199 6/7 1/1
Bonnie Staples-Lyon $ 22,447 9/9 7/8
Total $ 201,547
Notes:
(1) Carman Joynt was appointed Chair of the Board effective February 5, 2015.
(2) Sandra Hanington was appointed President and CEO effective February 11, 2015.
(3) William C. Ross was appointed to the Board effective July 1, 2015.
(4) Carol Skelton was appointed to the Board effective March 26, 2015.
(5) The number of Board and Committee meetings attended compared to the maximum the director could have attended.

BOARD OF DIRECTORS
Ghislain Harvey, CIRCCEO of Promotion Saguenay Inc.Saguenay, Quebec
John Bell, FCPA, FCA, ICD.D.CEO, Onbelay Capital Inc.Cambridge, Ontario
Susan Dujmovic, FICB, ICD.DHead of Regulatory Compliance Retail Banking and Wealth ManagementHSBC Bank of CanadaVancouver, British-ColumbiaVice-Chair, BoardChair, Audit Committee
Claude BennettRetiredOttawa, Ontario
Bonnie Staples-Lyon Director of Strategic CommunicationsChangemakersWinnipeg, Manitoba
Kirk MacRae, ICD.DPresident, R.K.M. Investment Ltd.Sydney, Nova ScotiaChair, Governance and Nominating Committee
Carman Joynt, FCPA, FCA, ICD.DPresident, Joynt Ventures Inc.Ottawa, OntarioChair of the Board
William C. RossSenior CounselWeirFoulds LLPToronto, Ontario
The Honourable Carol SkeltonRetiredHarris, Saskatchewan
Guy Dancosse, Q.C., ICD.DLapointe Rosenstein Marchand Melançon LLPMontréal, QuebecChair, Human Resources and Workplace Health and Safety Committee
Sandra Hanington, ICD.DPresident andChief Executive Officer
C O R P O R AT E G O V E R N A N C E
17ROYAL CANADIAN MINT ANNUAL REPORT 2015

International Financial Reporting Standards (IFRS)
As a publicly accountable enterprise, the Royal Canadian Mint follows IFRS according to the requirements of the Canadian Accounting Standards Board.
This report contains forward-looking statements about the Mint’s strategy and expected financial and operational results. Forward-looking statements are based on the following broad assumptions: Government of Canada approval of the Mint’s 2016–2020 Corporate Plan and no change to the Mint’s mandate. Key risks and uncertainties are described in the Risk section of this report. However, some risks and uncertainties are by definition difficult to predict and beyond our control. They include, but are not limited to, economic, competition, financial, foreign exchange, precious metals, base metals, technology and regulatory conditions. These factors may cause actual results to differ substantially from the expectations stated or implied in forward-looking statements.
Corporate profile
The Royal Canadian Mint is Canada’s national mint, whose core mandate is to produce circulation coins for Canada, manage the supporting distribution system and provide advice to the Government of Canada on all matters related to coinage. The Mint’s activities also include: the production and marketing of bullion and related refinery products and services, numismatic coins, medals and the provision of minting services to foreign countries. Under the Royal Canadian Mint Act, which established the Mint, the corporation was to conduct its businesses in anticipation of profit. The Act was amended in December 2014, directing it to provide goods and services to the Government of Canada without profit.
Vision
Delivering excellence… through our customer-driven businesses, our talented people and the value we add to Canada and Canadians.
Values
Honesty, respect, passion and pride.
Government of Canada priorities
In addition to fulfilling its legislated mandate, the Mint contributes to fulfilling Government of Canada priorities related to economic, social and international affairs as well as employment.
A strong economy: Throughout 2015, the Mint ensured sufficient coinage for efficient trade and commerce was available at all times in every region in Canada. Through its collaborations in coin recycling, it has consistently fulfilled this obligation while reducing the number of new coins produced, which in turn reduces the environmental impact and cost of producing new coins.
18 ROYAL CANADIAN MINT ANNUAL REPORT 2015
MANAGEMENT DISCUSSION AND ANALYSIS

A vibrant Canadian culture and heritage: The Mint celebrates Canada’s history, culture and values by delivering compelling themes on commemorative and numismatic coins and medals. In addition to its commemorative coin program, the Mint produced 12,495 medals bestowed on deserving athletes during the TORONTO 2015 Pan Am and Parapan American Games, as well as Canadian honours presented by the Governor General of Canada to recognize Canadians for their excellence, courage or exceptional dedication to service.
A prosperous Canada through international commerce: The Mint competes in global markets. It holds leading market shares for gold and silver bullion coins and produces circulation and numismatic coins, blanks, medals, medallions and tokens for countries around the world.
Providing high quality jobs: The Mint provides jobs for more than 1,200 Canadians at its facilities in Ottawa and Winnipeg while supporting thousands more at the hundreds of Canadian companies that supply the Mint with raw materials, supplies and services estimated to exceed $1 billion. The Mint also commissions creative work from more than 200 Canadian artists every year in the development of circulation and numismatic coins.
Return to the shareholder
The Mint is a prescribed federal Crown corporation for tax purposes and subject to federal income taxes under the Income Tax Act. Over the past five years, the Mint has paid $52.9 million in income taxes and returned $93.0 million in dividends to the shareholder, the Government of Canada.
Financial Benefit to Canada
(in $ million) 2011 2012 2013 2014 2015
Income tax paid 10.8 7.5 7.8 16.9 9.9
Dividends paid 10.0 10.0 10.0 10.0 53.0
Paid to shareholder 20.8 17.5 17.8 26.9 62.9
Performance indicators
To achieve its objectives, the Mint strives to continually improve profitability through prudent financial management and efficient operations. The Mint measures its performance by using metrics meaningful to customers, business partners and employees. The measures below allow the Mint to monitor its capacity to improve performance and create value.
M A N A G E M E N T D I S C U S S I O N A N D A N A LY S I S
19ROYAL CANADIAN MINT ANNUAL REPORT 2015
257.5278.4
303.2333.8
275.8
1514131211
56.965.9
107.9
92.6
67.3
1514131211
113.7 116.9
103.7 104.194.3
1514131211
Canadian Circulation coin revenue ($ in millions)
Note: ARP is not included
Numismatics revenues ($ in millions)
Numismatic sellouts (number of coins)
Shareholder's equity($ in millions)
Sales of gold bullion products (thousands of ounces)
vs. Average price of gold (US$ per ounce)
93.0
145.1
167.0177.3
198.7
1514131211
Foreign circulation coins sold (millions of pieces)
1,100903
2,6202,401
1,185
1514131211
Circulation Products and Solutions revenue ($ millions)
Foreign circulation revenue ($ in millions)
34.030.3
78.272.8
44.7
1514131211
Research and developmentexpenditures excludingSR&ED credits ($ in millions)
5.7
7.4
8.6
9.6
6.8
1514131211
Lost time injury frequency rate(Number of accidents with lost time
x 200,000 hours)/hours worked
1.5
2.1
0.8
1.5
1.2
1514131211
Lost time injury severity rate(Number of days lost x 200,000 hours)
/hours worked
5.8
15.4
2.9
22.4
7.0
1514131211
30
60
70
7972
1514131211
Sales of silver bullion products (thousands of ounces)
vs. Average price of silver (US$ per ounce)
1,571.51,669.0
1,411.21,266.4
1,160.1
1,188.4
834.5
1,318.1
818.3
1,036.7
1514131211
35.1231.15
23.7915.6819.08
23,130
18,136
28,22930,263
36,141
1514131211
0
2,000
4,000
6,000
8,000
1514131211
Coins on deposit at major �nancialinstitutions
Annual demand for coinage across Canada
Recycled coins
New coins sold to �nancial institutions
Increased e�ciency in the management of Canada’s coinage system has reduced the volume of coins that must be held on deposit by �nancial institutions and the production of new coins in order to meet coinage demand across Canada.
4,557 4,430 4,540 4,436 4,248
1514131211
Annual demand for coinage across Canada excluding pennies (in millions of pieces)

Consolidated results and financial performance
(in $ millions) 2015 2014 $ change % change
Revenue 2,974.1 2,443.4 530.7 21.7
Pre-impairment profit before tax 65.0 56.1 8.9 15.9
Impairment (65.5) – (65.5) –
(Loss) profit before income tax (0.5) 56.1 (56.6) (100.9)
(Loss) profit after tax (0.3) 41.3 (41.6) (100.7)
Total assets 438.8 491.1 (52.3) (10.6)
Working capital 129.9 139.7 (9.8) (7.0)
Pre-impairment pre-tax return on equity1 20.0% 16.8% – 19.0
Pre-tax return on equity (0.2%) 16.8% – (101.2)
Pre-impairment pre-tax return on assets1 14.8% 11.4% – 29.8
Pre-tax return on assets (0.1%) 11.4% – (100.9)
1 Calculated based on pre-impairment profit and pre-impairment equity and assets.
Significant corporate events
The year 2015 was one of transition for the Mint. The amendment to the Royal Canadian Mint Act in December 2014 formed the basis for the negotiation of the Mint’s new Memorandum of Understanding (MOU) with the Department of Finance, finalized on March 19, 2015. The MOU reflected the legislative requirement for a non-profit operating model for the Canadian Circulation Program; the Mint’s Circulation Products and Solutions, Bullion Products and Services and Numismatics businesses continue to operate in anticipation of profit.
During the year, a number of senior executive appointments were made. Carman Joynt was appointed Chair of the Board of Directors and Sandra Hanington was appointed President and CEO. Both were appointed to five-year terms. Jennifer Camelon joined the Mint as Chief Financial Officer and Vice-President of Finance and Administration and Simon Kamel was appointed Vice-President of Corporate and Legal Affairs and Corporate Secretary. The Honourable Carol Skelton and William C. Ross were appointed to the Mint’s Board of Directors for a four-year term.
An Order in Council (OIC) issued on July 16, 2015 pursuant to section 89 of the Financial Administration Act directed the Mint to comply with Treasury Board of Canada Secretariat (TBS) guidelines on travel and hospitality expenditures and to report on the implementation of the guidelines in its corporate plan. Prior to the OIC being issued, the Mint had implemented significant changes to its travel and hospitality policies in February and May 2015 to align many primary provisions with TBS guidelines. It will complete its compliance at the end of February 2016.
The Mint’s leadership conducted a strategic review in the summer of 2015 as a result of the change of operating model for its core mandate and to evaluate the sources of profitable growth for the business going forward. Upon completion of the strategic review, the Mint concluded that an impairment review should be conducted due to changes to its businesses and markets. This review was completed at the end of the third quarter and
M A N A G E M E N T D I S C U S S I O N A N D A N A LY S I S
20 ROYAL CANADIAN MINT ANNUAL REPORT 2015

an impairment charge was recorded. In October 2015, the Mint reorganized its operations and aligned its workforce to its new strategic direction.
On December 23, 2015, the Mint concluded the sale of the assets related to MintChip™ in line with the technology’s natural next step of commercialization in the private sector.
Consolidated overview
For the 52 weeks of fiscal 2015, consolidated revenue increased 21.7% to $3.0 billion from $2.4 billion in fiscal 2014. The increase was driven primarily by a rebound in demand for bullion products during the last half of the year aided by a weak Canadian dollar that pushed Bullion revenue up 26.3% to $2.6 billion from $2.1 billion in 2014. Revenue from sales of numismatic coins increased 12.1% to $198.7 million from $177.3 million in 2014. These increases were offset by a 9.4% decline in Canadian Circulation revenue as a result of the change in the new MOU with the Government of Canada and a decline in revenue from the Circulation Products and Solutions business.
Pre-impairment operating expenses for the year increased 1.3% to $142.9 million from $141.6 million in the prior year. An increase in marketing and sales expenses was offset by a decline in administration expenses. Sales and marketing expenses were up due to restructuring charges incurred in the year and administration expenses decreased due to careful cost management.
After a detailed impairment review, it was determined that the Mint’s Circulation Cash Generating Unit (which includes the Canadian Circulation Program and the Circulation Products and Solutions business) was not projected to generate sufficient cash flows to support its related asset base and consequently the Mint recorded a $65.5 million non-cash impairment charge in 2015. The details of the methodology and major assumptions used in determining this charge are contained in Note 13 to the financial statements.
The impairment loss increased operating expenses for the year to $208.4 million from $141.6 million in fiscal 2014. Other income of $5 million was earned from the sale of MintChip™ as detailed in Note 26 to the financial statements.
Pre-impairment profit before taxes increased 15.9% to $65.0 million from $56.1 million in fiscal 2014. The $65.5 million impairment loss drove the consolidated profit before taxes to a loss of $0.5 million in 2015. The post-impairment loss after tax was $0.3 million in 2015 compared to an after-tax profit of $41.3 million in 2014.
During 2015, the Mint’s cash balance increased from $104.2 million to $140.8 million. The increase was driven by strong cash generated from operations, particularly in the Bullion and Numismatic businesses, along with tightly managed capital expenditures. Management also completed a review of the Mint’s dividend framework to determine a more structured approach to determining the dividend to be paid to the Government of Canada going forward. This review led to the declaration of a special dividend of $43.0 million in August that was paid in December 2015 in addition to the $10.0 million dividend paid in March 2015.
M A N A G E M E N T D I S C U S S I O N A N D A N A LY S I S
21ROYAL CANADIAN MINT ANNUAL REPORT 2015

Revenue by program and business
(in $ millions) 2015 2014 $ change % change
Canadian Circulation Program 94.3 104.1 (9.8) (9.4)
Circulation Products and Solutions 67.3 92.6 (25.3) (27.3)
Bullion Products and Services 2,613.8 2,069.4 544.4 26.3
Numismatics 198.7 177.3 21.4 12.1
Canadian Circulation Program
The Mint’s core mandate is the management of the Canadian circulation coinage system. It accomplishes this mandate through a world-leading coin distribution network and inventory management system and a high-tech high-volume manufacturing, plating and coining facility in Winnipeg. It is also responsible for safeguarding the integrity of Canada’s coinage through ongoing research, development and implementation of increasingly sophisticated security features.
Explanation of results
The Mint is responsible for managing an efficient and cost-effective Canadian coinage distribution system. This is accomplished through advanced forecasting, world class manufacturing and inventory management, and efficient coin processing and recycling services. Through positive relationships and collaboration with Canadian financial institutions, armoured car companies and other key stakeholders, the Mint helps to prevent the occurrence of any coin shortages.
Overall demand for Canadian circulation coins declined from 4.4 billion coins in 2014 to 4.2 billion coins in 2015. While demand is trending moderately downwards, it has remained relatively stable between 4.2 and 4.6 billion coins over the last five years. Demand is met through three main sources of supply and is subject to variability across regions of the country and seasonality depending on time of the year. The three principal channels to meet demand include:• Inventories held by major financial institutions across Canada, which in 2015
comprised approximately 75% of supply. This has remained relatively flat as a percentage of overall supply compared to the previous year.
• With over 1,000 coin recycling locations in Canada, recycling volumes have increased by over 50% over the last five years to 590 million pieces in 2015. This channel accounts for approximately 15% of overall supply.
• The Mint’s supply of new coin volumes remained relatively flat in 2015 at 392 million coins compared to 389 million in the previous year, accounting for the remaining 10% of supply.
The Mint actively manages inventory levels in response to changes in demand, financial institution deposits and recycling volumes to ensure that coinage demand is met throughout the year while minimizing overall inventories. It also works to optimize its logistics operations to reduce overall distribution and storage costs for the Government of Canada.
The Mint anticipated removing six billion pennies from circulation within three years of its phase out from Canada’s coinage system in February 2013. As of December 31, 2015,
257.5278.4
303.2333.8
275.8
1514131211
56.965.9
107.9
92.6
67.3
1514131211
113.7 116.9
103.7 104.194.3
1514131211
Canadian Circulation coin revenue ($ in millions)
Note: ARP is not included
Numismatics revenues ($ in millions)
Numismatic sellouts (number of coins)
Shareholder's equity($ in millions)
Sales of gold bullion products (thousands of ounces)
vs. Average price of gold (US$ per ounce)
93.0
145.1
167.0177.3
198.7
1514131211
Foreign circulation coins sold (millions of pieces)
1,100903
2,6202,401
1,185
1514131211
Circulation Products and Solutions revenue ($ millions)
Foreign circulation revenue ($ in millions)
34.030.3
78.272.8
44.7
1514131211
Research and developmentexpenditures excludingSR&ED credits ($ in millions)
5.7
7.4
8.6
9.6
6.8
1514131211
Lost time injury frequency rate(Number of accidents with lost time
x 200,000 hours)/hours worked
1.5
2.1
0.8
1.5
1.2
1514131211
Lost time injury severity rate(Number of days lost x 200,000 hours)
/hours worked
5.8
15.4
2.9
22.4
7.0
1514131211
30
60
70
7972
1514131211
Sales of silver bullion products (thousands of ounces)
vs. Average price of silver (US$ per ounce)
1,571.51,669.0
1,411.21,266.4
1,160.1
1,188.4
834.5
1,318.1
818.3
1,036.7
1514131211
35.1231.15
23.7915.6819.08
23,130
18,136
28,22930,263
36,141
1514131211
0
2,000
4,000
6,000
8,000
1514131211
Coins on deposit at major �nancialinstitutions
Annual demand for coinage across Canada
Recycled coins
New coins sold to �nancial institutions
Increased e�ciency in the management of Canada’s coinage system has reduced the volume of coins that must be held on deposit by �nancial institutions and the production of new coins in order to meet coinage demand across Canada.
4,557 4,430 4,540 4,436 4,248
1514131211
Annual demand for coinage across Canada excluding pennies (in millions of pieces)
M A N A G E M E N T D I S C U S S I O N A N D A N A LY S I S
22 ROYAL CANADIAN MINT ANNUAL REPORT 2015
5.7 billion pennies had been recovered. The scrap metals were recovered from the coins and the proceeds delivered to the Government of Canada.
The efficient management of the coinage system is achieved hand-in-hand with the celebration of Canada’s history, culture and values. During 2015, 35 million commemorative coins were released, including 6.25 million poppy and 6.25 million flag coloured coins painted with the Mint’s high-speed colour pad printing technology.
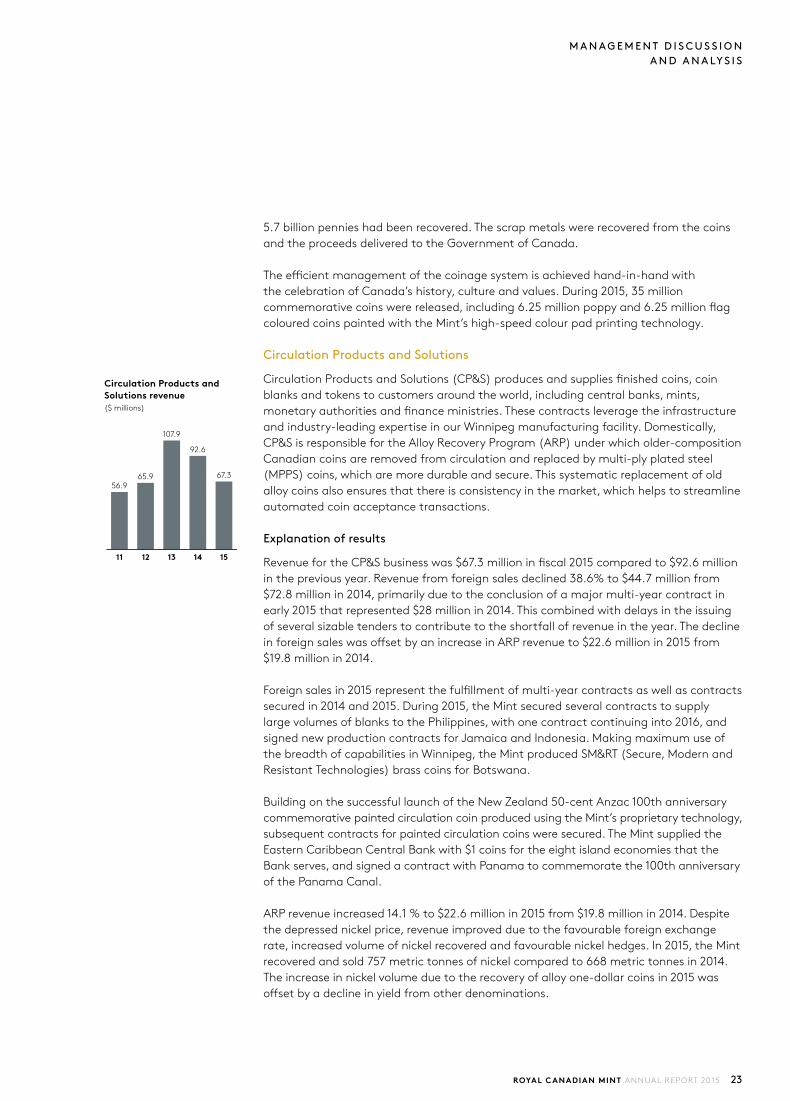
Circulation Products and Solutions
Circulation Products and Solutions (CP&S) produces and supplies finished coins, coin blanks and tokens to customers around the world, including central banks, mints, monetary authorities and finance ministries. These contracts leverage the infrastructure and industry-leading expertise in our Winnipeg manufacturing facility. Domestically, CP&S is responsible for the Alloy Recovery Program (ARP) under which older-composition Canadian coins are removed from circulation and replaced by multi-ply plated steel (MPPS) coins, which are more durable and secure. This systematic replacement of old alloy coins also ensures that there is consistency in the market, which helps to streamline automated coin acceptance transactions.
Explanation of results
Revenue for the CP&S business was $67.3 million in fiscal 2015 compared to $92.6 million in the previous year. Revenue from foreign sales declined 38.6% to $44.7 million from $72.8 million in 2014, primarily due to the conclusion of a major multi-year contract in early 2015 that represented $28 million in 2014. This combined with delays in the issuing of several sizable tenders to contribute to the shortfall of revenue in the year. The decline in foreign sales was offset by an increase in ARP revenue to $22.6 million in 2015 from $19.8 million in 2014.
Foreign sales in 2015 represent the fulfillment of multi-year contracts as well as contracts secured in 2014 and 2015. During 2015, the Mint secured several contracts to supply large volumes of blanks to the Philippines, with one contract continuing into 2016, and signed new production contracts for Jamaica and Indonesia. Making maximum use of the breadth of capabilities in Winnipeg, the Mint produced SM&RT (Secure, Modern and Resistant Technologies) brass coins for Botswana.
Building on the successful launch of the New Zealand 50-cent Anzac 100th anniversary commemorative painted circulation coin produced using the Mint’s proprietary technology, subsequent contracts for painted circulation coins were secured. The Mint supplied the Eastern Caribbean Central Bank with $1 coins for the eight island economies that the Bank serves, and signed a contract with Panama to commemorate the 100th anniversary of the Panama Canal.
ARP revenue increased 14.1 % to $22.6 million in 2015 from $19.8 million in 2014. Despite the depressed nickel price, revenue improved due to the favourable foreign exchange rate, increased volume of nickel recovered and favourable nickel hedges. In 2015, the Mint recovered and sold 757 metric tonnes of nickel compared to 668 metric tonnes in 2014. The increase in nickel volume due to the recovery of alloy one-dollar coins in 2015 was offset by a decline in yield from other denominations.
257.5278.4
303.2333.8
275.8
1514131211
56.965.9
107.9
92.6
67.3
1514131211
113.7 116.9
103.7 104.194.3
1514131211
Canadian Circulation coin revenue ($ in millions)
Note: ARP is not included
Numismatics revenues ($ in millions)
Numismatic sellouts (number of coins)
Shareholder's equity($ in millions)
Sales of gold bullion products (thousands of ounces)
vs. Average price of gold (US$ per ounce)
93.0
145.1
167.0177.3
198.7
1514131211
Foreign circulation coins sold (millions of pieces)
1,100903
2,6202,401
1,185
1514131211
Circulation Products and Solutions revenue ($ millions)
Foreign circulation revenue ($ in millions)
34.030.3
78.272.8
44.7
1514131211
Research and developmentexpenditures excludingSR&ED credits ($ in millions)
5.7
7.4
8.6
9.6
6.8
1514131211
Lost time injury frequency rate(Number of accidents with lost time
x 200,000 hours)/hours worked
1.5
2.1
0.8
1.5
1.2
1514131211
Lost time injury severity rate(Number of days lost x 200,000 hours)
/hours worked
5.8
15.4
2.9
22.4
7.0
1514131211
30
60
70
7972
1514131211
Sales of silver bullion products (thousands of ounces)
vs. Average price of silver (US$ per ounce)
1,571.51,669.0
1,411.21,266.4
1,160.1
1,188.4
834.5
1,318.1
818.3
1,036.7
1514131211
35.1231.15
23.7915.6819.08
23,130
18,136
28,22930,263
36,141
1514131211
0
2,000
4,000
6,000
8,000
1514131211
Coins on deposit at major �nancialinstitutions
Annual demand for coinage across Canada
Recycled coins
New coins sold to �nancial institutions
Increased e�ciency in the management of Canada’s coinage system has reduced the volume of coins that must be held on deposit by �nancial institutions and the production of new coins in order to meet coinage demand across Canada.
4,557 4,430 4,540 4,436 4,248
1514131211
Annual demand for coinage across Canada excluding pennies (in millions of pieces)
M A N A G E M E N T D I S C U S S I O N A N D A N A LY S I S
23ROYAL CANADIAN MINT ANNUAL REPORT 2015

Bullion Products and Services
The Bullion Products & Services business provides its customers with market-leading precious metal investment coin and bar products, supported by integrated precious metal refining, storage and ETR capabilities. The products include the Maple Leaf family of gold, silver, palladium and platinum coins, and other precious metal products and services for investment and manufacturing purposes. As a market leader in the industry with bullion coins of the highest quality and unprecedented security, the Mint is well positioned to capture a leading share of any increase in demand while sustaining volumes during soft markets. The Canadian Gold and Silver Reserves ETR products listed on the Toronto Stock Exchange allow retail and institutional investors to access precious metals stored at the Mint while reducing Mint lease costs.
Explanation of results
Bullion Products and Services revenues increased 26.3% to $2.6 billion from $2.1 billion in 2014 as global demand for the investment rebounded with the geo-political and financial market volatility of the second half of 2015. Strong sales of new bullion coins were supported by limited secondary market activity, with most investors maintaining or increasing their bullion coin positions.
Sales of gold coins increased 34.8% to 953.0 thousand ounces in 2015 from 707.0 thousand ounces in 2014 as the average price declined 8.4% to US$1,160.06 per ounce from US$1,266.40 per ounce in 2014. Sales of silver coins increased 17.9% to 34.3 million ounces from 29.1 million ounces in 2014, establishing a record volume of sales for the third consecutive year. The average silver price declined 17.9% to US$15.68 per ounce from US$19.1 per ounce in 2014. Although activity in the silver and gold bullion markets have historically correlated, many investors have shifted to silver as the preferred investment over gold due to its affordability and the safety net provided by industrial demand.
The Mint is one of the leading suppliers of both gold and silver bullion to global investors, a market position sustained by the credibility of the Mint as a Crown corporation of the Government of Canada and the increasingly sophisticated security features of the coins. In 2015, the Mint released the much-anticipated commercial application of its Bullion DNA (Digital Non-destructive Activation) reader technology that facilitates the authentication of the maple leaf coins at the American Numismatic Association’s World’s Fair of Money in Chicago.
Storage, refining and ETR provide the basis of the Mint’s vertically integrated precious metal businesses. They lend significant support to the Mint’s Bullion and Numismatic businesses by providing the precious metal and production capacity to capture surges in demand. This has been particularly important in 2015, allowing the Mint to sustain its leading share of the investment bullion market and achieve record bullion and numismatics volumes. The Mint experienced a minor decline in the volume of external precious metals refined and in storage for clients as well as minor redemptions of Gold and Silver ETRs.
257.5278.4
303.2333.8
275.8
1514131211
56.965.9
107.9
92.6
67.3
1514131211
113.7 116.9
103.7 104.194.3
1514131211
Canadian Circulation coin revenue ($ in millions)
Note: ARP is not included
Numismatics revenues ($ in millions)
Numismatic sellouts (number of coins)
Shareholder's equity($ in millions)
Sales of gold bullion products (thousands of ounces)
vs. Average price of gold (US$ per ounce)
93.0
145.1
167.0177.3
198.7
1514131211
Foreign circulation coins sold (millions of pieces)
1,100903
2,6202,401
1,185
1514131211
Circulation Products and Solutions revenue ($ millions)
Foreign circulation revenue ($ in millions)
34.030.3
78.272.8
44.7
1514131211
Research and developmentexpenditures excludingSR&ED credits ($ in millions)
5.7
7.4
8.6
9.6
6.8
1514131211
Lost time injury frequency rate(Number of accidents with lost time
x 200,000 hours)/hours worked
1.5
2.1
0.8
1.5
1.2
1514131211
Lost time injury severity rate(Number of days lost x 200,000 hours)
/hours worked
5.8
15.4
2.9
22.4
7.0
1514131211
30
60
70
7972
1514131211
Sales of silver bullion products (thousands of ounces)
vs. Average price of silver (US$ per ounce)
1,571.51,669.0
1,411.21,266.4
1,160.1
1,188.4
834.5
1,318.1
818.3
1,036.7
1514131211
35.1231.15
23.7915.6819.08
23,130
18,136
28,22930,263
36,141
1514131211
0
2,000
4,000
6,000
8,000
1514131211
Coins on deposit at major �nancialinstitutions
Annual demand for coinage across Canada
Recycled coins
New coins sold to �nancial institutions
Increased e�ciency in the management of Canada’s coinage system has reduced the volume of coins that must be held on deposit by �nancial institutions and the production of new coins in order to meet coinage demand across Canada.
4,557 4,430 4,540 4,436 4,248
1514131211
Annual demand for coinage across Canada excluding pennies (in millions of pieces)
M A N A G E M E N T D I S C U S S I O N A N D A N A LY S I S
24 ROYAL CANADIAN MINT ANNUAL REPORT 2015

Numismatics
The Numismatics business creates and sells collectible coins and medals to customers in Canada and around the world. Due to our world-class designs, the Mint’s global leadership in the art and science of minting is consistently recognized with prestigious international awards in large part due to innovative technology enhancements such as holograms, selective plating and stunning colour that allow the Mint to create unique and compelling products. Mint.ca continues to rank among the top destinations for online numismatic coin purchases in Canada and around the world, a direct result of the Mint’s focus on building traffic to the site, optimizing the online customer experience and developing new and interactive ways for customers to purchase coins from the Mint.
Explanation of results
Numismatics revenue increased 12.1% to $198.7 million from $177.3 million in 2014, the fourth consecutive record in the Mint’s history. During the year, the Mint issued 243 numismatic coins and achieved 72 sell-outs by the end of the year.
As a result of increased demand for custom Numismatic gold products, the Mint sold 28.9% more numismatic ounces of gold in 2015 versus 2014. In 2015, the Mint sold 13.1% more numismatic ounces of silver products versus 2014.
Best-in-class craftsmanship and quality of the Mint’s products are the foundation of the business’s success. One of the most unusual coins issued in 2015 was a fine silver maple leaf-shaped coin, a world first. Other notable coins were those featuring LOONEY TUNES™ characters along with coins celebrating FIFA Women’s World Cup Canada 2015TM, the TORONTO 2015 Pan Am and Parapan American Games, a new flight of collector coins featuring iconic SUPERMANTM comic book covers, and two coins commemorating the 100th anniversary of the publication of John McCrae’s war poem In Flanders Fields.
In support of the businesses
Research and development
The Mint’s enduring commitment to R&D has been critical to its world-leading national circulation program. This strength has been leveraged to achieve product differentiation in all of its businesses over many years. In 2015, the Mint’s investment in R&D was reduced to $6.8 million from $9.6 million in 2014 as the Mint aligned its R&D activities with the new corporate strategy.
Priorities in 2015 included customer-centric features such as security, including advancements in the Mint’s Bullion DNA technology, as well as new technologies to create distinctive circulation and numismatic coins that resonate with Canadians and international customers alike.
To complement its internal capabilities, the Mint continues to work with universities around the world, including the University of Ottawa and the University of Manitoba, to tap into the latest research.
257.5278.4
303.2333.8
275.8
1514131211
56.965.9
107.9
92.6
67.3
1514131211
113.7 116.9
103.7 104.194.3
1514131211
Canadian Circulation coin revenue ($ in millions)
Note: ARP is not included
Numismatics revenues ($ in millions)
Numismatic sellouts (number of coins)
Shareholder's equity($ in millions)
Sales of gold bullion products (thousands of ounces)
vs. Average price of gold (US$ per ounce)
93.0
145.1
167.0177.3
198.7
1514131211
Foreign circulation coins sold (millions of pieces)
1,100903
2,6202,401
1,185
1514131211
Circulation Products and Solutions revenue ($ millions)
Foreign circulation revenue ($ in millions)
34.030.3
78.272.8
44.7
1514131211
Research and developmentexpenditures excludingSR&ED credits ($ in millions)
5.7
7.4
8.6
9.6
6.8
1514131211
Lost time injury frequency rate(Number of accidents with lost time
x 200,000 hours)/hours worked
1.5
2.1
0.8
1.5
1.2
1514131211
Lost time injury severity rate(Number of days lost x 200,000 hours)
/hours worked
5.8
15.4
2.9
22.4
7.0
1514131211
30
60
70
7972
1514131211
Sales of silver bullion products (thousands of ounces)
vs. Average price of silver (US$ per ounce)
1,571.51,669.0
1,411.21,266.4
1,160.1
1,188.4
834.5
1,318.1
818.3
1,036.7
1514131211
35.1231.15
23.7915.6819.08
23,130
18,136
28,22930,263
36,141
1514131211
0
2,000
4,000
6,000
8,000
1514131211
Coins on deposit at major �nancialinstitutions
Annual demand for coinage across Canada
Recycled coins
New coins sold to �nancial institutions
Increased e�ciency in the management of Canada’s coinage system has reduced the volume of coins that must be held on deposit by �nancial institutions and the production of new coins in order to meet coinage demand across Canada.
4,557 4,430 4,540 4,436 4,248
1514131211
Annual demand for coinage across Canada excluding pennies (in millions of pieces)
M A N A G E M E N T D I S C U S S I O N A N D A N A LY S I S
25ROYAL CANADIAN MINT ANNUAL REPORT 2015

Human resources (HR)
Sustaining a diversified business demands an engaged, well-trained, flexible workforce that shares the Mint’s vision. The Mint’s employees also share in the corporation’s profits through incentive-based compensation introduced within collective agreements.
To ensure its employees are as effective and engaged as possible, spending on training increased to $3.6 million from $3.1 million in 2014 due, in part, to the breadth of leadership training introduced.
The Public Service Alliance of Canada (PSAC) collective agreement expired on December 31, 2013. Collective bargaining with PSAC covering operations in Ottawa and Winnipeg concluded successfully with a new four-year contract in January 2016. Negotiations continue to renew the collective agreement with the Amalgamated Transit Union (ATU) that expired at the end of 2014 and to establish a first agreement with a separate local of the PSAC union covering the protective services officers in Winnipeg.
Employment at the Mint declined to 1,202 permanent and temporary employees at the end of 2015 from 1,262 at the end of 2014. Wages paid in 2015 increased slightly to $96 million from $95 million 2014.
Occupational health & safety (OHS)
The Mint is committed to providing a safe and productive work environment for its employees and runs a comprehensive program in support of this objective. In 2015, the Mint focused on the education of its staff through the Respectful Workplace program, Mental Health First Aid and ergonomics training. In Winnipeg, there were six lost-time injuries (LTI) resulting in an injury frequency rate of 2.65 compared to 3.99 in 2014; the injury severity rate declined to 26.28 from 30.67. In Ottawa, five injuries caused the LTI frequency rate to increase to 1.24 from 1.23 in 2014 while the injury severity rate declined to 1.98 from 25.04. The most common cause (40%) of incidents was ergonomics.
Environment
The Mint undertook several significant initiatives in 2015 to improve its environmental performance:• Implemented an Environment Management System (EMS) designed to conform to
ISO14001:2004 and established an Environmental Management Committee (EMC) to oversee its implementation.
• Developed a plan to track, manage and measure domestic and industrial consumables and the Mint’s waste streams.
• Complied with the Canadian Environmental Assessment Act, 2012 (CEAA) by using its Environmental, Health & Safety and Security Impact Assessment (EHSIA) process to meet the requirements outlined in Sections 67–69 of the CEAA. For 2015, all projects undertaken by the Mint that were evaluated under CEAA 2012 were determined not likely to cause significant adverse environmental effects.
The Mint experienced 11 reportable non-significant environmental incidents during 2015; six occurred at the Ottawa facility and five occurred at the Winnipeg facility. In 2014, the Mint experienced 14 reportable non-significant environmental incidents; nine in Ottawa and the balance in Winnipeg. This represents a decrease in reportable incidents.
M A N A G E M E N T D I S C U S S I O N A N D A N A LY S I S
26 ROYAL CANADIAN MINT ANNUAL REPORT 2015

Marketing and Communications
During 2015, the Marketing and Communications division focused on analyzing the Mint’s numismatic customer database to develop a better understanding of the customer life cycle – acquisition, conversion and retention – and the buying patterns of different customer segments and individual collectors. With this customer-centric insight, it refreshed the Masters Club, a program designed to retain and grow the Mint’s most loyal customer base, and began to re-develop the face value acquisition program in order to improve conversion rates.
Responsible for creating the customer experiences in advertising campaigns and direct marketing that drives sales, the division also engaged with the public through its social media platforms. By the end of 2015, it had increased its Facebook “likes” to over 75,000 from 53,000 at the end of 2014, and expanded its presence on Pinterest, Twitter and the web. Social media at the Mint has become a constant component of marketing campaigns, echoing the messages delivered through other channels.
The commercial launch of Bullion DNA expanded the Mint’s marketing reach through the provision of materials developed to support bullion dealers as they market the Mint’s bullion coins to individual investors.
Operations
The Mint manages a highly diversified and complex manufacturing operation. It is comprised of two main facilities: a high-speed operation in Winnipeg that produces billions of circulation coins each year and a precious metals operation in Ottawa that produces world renowned collector and investment coins and medals.
In order to keep pace with increasing sales of its Numismatics and Bullion businesses and adjust to changes in the foreign circulation market, the Mint’s operations have invested in capital to modernize current equipment and processes. The Mint has also adopted ongoing process improvements incorporating ideas and procedures to meet customer requirements and reduce overall costs. The application of lean principles allows the Mint to balance capacity with demand and minimize waste. Productivity, health and safety, quality and training are the cornerstones of the Mint’s operations.
In 2015, the Mint produced a record number of one-ounce Maple Leaf coins, 18.1% higher than the previous year, while production of Gold Maple Leaf products was up 26.7% from 2014. The Ottawa facility shipped more than one million numismatic orders during the year, eclipsing the record set in the previous year of 950,000 orders.
In the CP&S business, the Mint produced the first ever pad printed coloured circulation coins for Canada, commemorating the 50th anniversary of the Canadian flag and Remembrance Day. It also implemented cellular manufacturing to reduce costs of producing Canadian circulation coins and to position the business to win international tenders for the production of coins for central banks around the world.
Supply chain and procurement
2015 was a foundational year for the Mint’s supply chain organization. After many years of growth, the Mint consolidated its supply chain and procurement functions which previously had been distributed throughout the organization. As a result of
2015 25-Cent Pure Gold Coin and $200 Pure Gold Coin - Diwali: Festival of Lights
Diwali, the New Year’s celebration in India known as the “Festival of Lights”, is celebrated annually in communities across Canada. The Mint proudly commemorated this celebration for the first time in 2015 with two exceptionally crafted gold coins with multiple finishes.
M A N A G E M E N T D I S C U S S I O N A N D A N A LY S I S
27ROYAL CANADIAN MINT ANNUAL REPORT 2015

the consolidation, purchase requirements for similar goods and services across the Mint can be aggregated going forward to drive better value, cost savings and more efficient supply chain in key areas such as base metals sourcing, logistics, printing, and numismatics packaging and supplies.
In its commitment to improved governance on procurement, a number of the Office of Auditor General Special Examination recommendations relating to procurement were completed in 2015.
Information technology
The Mint continued to invest in its enterprise applications and information systems infrastructure as an important part of our customer experience and internal process effectiveness both now and in the future. Key initiatives included supporting the rollout of the new Bullion DNA program and the divestiture of the MintChip™ assets as well as the improvements to the ERP system.
Liquidity and Capital Resources
As at
(in $ millions) 31-Dec-15 31-Dec-14 $ change % change
Cash 140.8 104.2 36.6 35.1
Inventories 78.6 89.0 (10.4) (11.7)
Working capital 129.9 139.7 (9.8) (7.0)
Capital assets 188.0 259.3 (71.3) (27.5)
Total assets 438.8 491.1 (52.3) (10.6)
Cash increased to $140.8 million at December 31, 2015 from $104.2 million at December 31, 2014, mainly generated from the strong operating results. Inventories declined to $78.6 million from $89.0 million at December 31, 2014, due to strong bullion and numismatics sales in the fourth quarter of 2015.
Working capital decreased to $129.9 million at December 31, 2015 from $139.7 million at December 31, 2014. The decrease is due to lower inventory and accounts receivable levels at year end.
The impairment charge on tangible and intangible fixed assets decreased the consolidated total assets by 10.6% to $438.8 million at December 31, 2015 compared to $491.1 million at December 31, 2014. Further details can be found in Note 13 to the financial statements.
The Mint entered 2015 with total outstanding long-term loans of $42.0 million and a long-term loan-to-equity ratio of 1:8. During the year, repayments of $7.5 million decreased the balance to $34.5 million and maintained the long-term loan-to-equity ratio at 1:8. Further details can be found in Note 15 to the financial statements.
The Mint declared an annual $10.0 million dividend to the Government of Canada during the first quarter of 2015. The Mint also paid a special dividend of $43.0 million at the end of the year.
2015 $30 Fine Silver Coin - Moonlight Fireflies
Unique Numismatic issues in 2015 included the two-ounce fine silver glow-in-the-dark coin, Moonlight Fireflies, and the Maple Leaf Forever Gold Kilo, which incorporated a hologram over the engraved surface of the coin.
M A N A G E M E N T D I S C U S S I O N A N D A N A LY S I S
28 ROYAL CANADIAN MINT ANNUAL REPORT 2015

Capital expenditures
Capital expenditures at the Mint are guided by anticipated business growth rates; new product and technology research, development and production requirements; information technology support and enhancement; and return on investment. Less growth-oriented, but essential, projects include the replacement of aging equipment, building and equipment support, refurbishment and investments in health and safety.
In 2015, capital expenditures declined by 31.5% to $17.4 million from $25.4 million in 2014. These expenditures fell into four categories:• Building ($3.6 million): Includes plant modernization and improvements in Ottawa and
Winnipeg to facilitate efficient plant use while meeting health and safety standards;• Equipment ($9.5 million): Includes investments for reliability, flexibility and capability
improvements as well as safety, security and protection of the environment. Some major capital expenditures were related to the development of new product and processes and further implementation of cellular manufacturing and lean concepts at the Winnipeg site.
• Information Technology ($2.9 million): Includes computer hardware and software for the ongoing support and development of the computing and communications infrastructure.
• Value-in-Kind ($1.4 million): Includes costs incurred by the Royal Canadian Mint in the production of victory and participation medals awarded to the athletes competing at the TORONTO 2015 Pan Am/Parapan Am Games in counterpart of sponsorship, marketing and licensing rights associated with the Games.
Risks to performance
The Mint’s performance is influenced by many factors, including competitive pressures, economic conditions and volatility in financial and commodity markets. To manage these risks, the Mint employs an Enterprise Risk Management (ERM) program to identify, assess, monitor and review key risks. The Audit Committee is responsible for the oversight of the Mint ERM program and provides regular updates to the Board of Directors.
The operating environment continues to be characterized by weakness in the global economy and volatile base metal prices. In addition, the diverse markets in which the Mint operates present a variety of unique risks to future performance. The following risks have been identified as particularly relevant in the current operating environment.
Mandate and regulatory
The Mint is a Crown corporation solely owned by the Government of Canada and governed primarily under the Royal Canadian Mint Act and the Financial Administration Act. Changes to shareholder objectives or to legislation could have an impact on performance.
Precious metal investment demand
Demand for precious metal investment products is largely determined by market forces beyond the Mint’s control. This risk is managed through active monitoring of market conditions to quickly and efficiently align operations and capacity with changes in demand, through diversification of business activities beyond core bullion products and by reducing costs to mitigate the impact of cyclical downturns.
M A N A G E M E N T D I S C U S S I O N A N D A N A LY S I S
29ROYAL CANADIAN MINT ANNUAL REPORT 2015

Competition in Circulation Products and Solutions
Over the past few years, the increasing number of mints pursuing foreign circulation coinage contracts has contributed to commoditizing the global market. The Mint undertook a number of initiatives in late 2015 to increase its competitiveness in the foreign circulation market.
Competition in Numismatics and Bullion Products and Services
These businesses operate in competitive environments where competitor actions can impact the Mint’s ability to achieve business objectives. Management regularly assesses the competitive environment and adjusts business strategies and tactics as necessary. Competitive threats are managed through investment in research and development, emphasis on strategic supply and sales relationships, expansion of innovative product offerings and the continual updating of capabilities, particularly in direct marketing and e-commerce.
Base and precious metal prices
The Mint purchases precious metals, including gold, silver, platinum and palladium for use in bullion and numismatic coins, as well as base metals and alloys in the production of domestic and foreign circulation coins. Exposure to volatility in metal prices is mitigated by matching the timing of purchase and sales, contractually transferring price risk to suppliers, hedging strategies and/or natural hedges inherent in business activities. Notwithstanding the hedging policy, long-term trends in metal prices may impact sales opportunities, margins and overall profitability. The Mint also sells base metal collected through ARP. While a portion of ARP sales is hedged, variability in metal prices will impact revenue on the unhedged portion of sales in the short term and the performance of the overall program over the longer term.
Foreign exchange risk
A significant portion of revenues and costs are denominated in foreign currencies. The Mint mitigates short- to mid-term foreign exchange risk through natural currency hedges and financial instrument hedges, however longer-term currency trends can impact results. A stronger Canadian dollar can have a negative impact on profitability as it reduces revenue from bullion products and reduces margins on products sold in US funds. Alternatively, a weak Canadian dollar vis-à-vis the US dollar increases the stream of revenue generated by products sold in US dollars and improves the cost competitiveness of other products.
Health, safety and the environment
The Mint’s operations and business activities present a variety of risks related to health, safety and environment. All change initiatives are subject to a structured review to ensure that risks are identified, assessed and managed. Health and safety orientation, ongoing training, wellness programs and a formal hazard prevention program contribute to the reduction of this risk. In addition to the regular assessment and management of environmental risks, the Mint seeks to continue to advance environmental awareness and corporate practices.
2015 $20 Fine Silver Coin - Weather Phenomenon: Summer Storm
Collectors are able to hold a thunderstorm in the palm of their hand with this spectacular fine silver coin produced by the Mint in 2015. Viewing the reverse under a black light activates the coin’s specialized technology, which allows the lightning bolts to radiate across the sky with a stunning life-like intensity and exceptional luminosity.
M A N A G E M E N T D I S C U S S I O N A N D A N A LY S I S
30 ROYAL CANADIAN MINT ANNUAL REPORT 2015

Precious metals physical security and reconciliation
The Mint’s business involves handling currency and precious metals; best-in-class practices related to security of physical assets are critical. The Mint is continuously improving its physical security program and tools and internal threat mitigation practices. The Mint has augmented its controls surrounding precious metals through improvements in its organizational structure, introduction of a perpetual dollar and unit inventory system and implementation of recommendations from external experts in refining processes.
Business continuity and disaster recovery
The Mint’s business is dependent on modern manufacturing facilities, technology and a global supply chain. The Mint’s operations may be affected by threats including natural events, pandemics, disruptions to critical infrastructure such as telecommunications or transportation, or events such as fire. Business Continuity Planning (BCP) aims to reduce the risk associated with such potential disruptions. To increase assurance of continuity of the Mint’s essential services to Canadians, the BCP program targets preparedness, reduction of impacts of potentially disruptive events, and effective recovery plans. Current continuity efforts are focused on improving business continuity documentation and recovery plans, and alignment of information technology recovery capabilities with recovery plan targets.
Cyber threats
Cyber threats and security of corporate data present a risk for all organizations. The Mint employs security controls and follows industry practices to safeguard information systems and corporate data. To ensure its cyber risk objectives of being secure, vigilant and resilient are being met, an assessment of the Mint’s readiness posture was completed in mid 2015. Recommendations to be implemented over the next 24 months are focused on the Mint’s incident response management and cyber security governance.
Sensitivity table
Key factor Change Dominant impact
Canadian dollar relative to US dollar
Decreases Increases revenue from products sold in US fundsIncreases US-based costs
Gold price / ounce Increases Increases product cost for Numismatics
Silver price / ounce Increases Increases product cost for Numismatics
Nickel price / KG Increases Increases revenue for ARP
Bullion lease rates / ounce Increases Increases product cost for Bullion
2015 $2,500 Pure Gold Coin Maple Leaf Forever
A Royal Canadian Mint first, this kilo coin is the largest to feature a hologram and is also the first Mint coin to feature a hologram struck over an engraved surface, exemplifying the innovative craftsmanship for which the Mint is world-renowned.
M A N A G E M E N T D I S C U S S I O N A N D A N A LY S I S
31ROYAL CANADIAN MINT ANNUAL REPORT 2015

Outlook
The Mint’s outlook is based on its corporate vision to deliver excellence through its customer-driven businesses, talented people and the value added to Canada and Canadians. This is supported by three strategic objectives: • Directly link customer insights and business acumen to our target marketing, product
development, relationship-building and operational excellence to drive profitable growth.• Provide the right tools, training and leadership practices in a safe work environment to
attract, retain and enable a skilled, productive and engaged team.• Demonstrate the ‘added-value’ to Canada by delivering return on investment while
reducing costs to the Canadian taxpayers and promoting our heritage, culture and values.
The Mint steps forward into 2016 having identified the best path to fulfill these strategies. Each business has developed and articulated its strategies as an integrated set of choices that link together explicit goals.
With a focused strategy combined with disciplined cost management, the Mint is on track to fulfill its core mandate while delivering returns to its shareholder, the Government of Canada.
2015 $200 Pure Gold Coin - Singing Moon Mask
An exceptional celebration of First Nations art and heritage, every curve and detail of this stunning ultra-high relief gold coin is imbued with rich artistic traditions of the K’ómoks and Kwakwaka’wakw First Nations in British Columbia. The colourful enamel accenting the design, which is a bold and unique representation of a singing moon, is painstakingly applied by hand.
M A N A G E M E N T D I S C U S S I O N A N D A N A LY S I S
32 ROYAL CANADIAN MINT ANNUAL REPORT 2015

33ROYAL CANADIAN MINT ANNUAL REPORT 2015
The consolidated financial statements contained in this annual report have been prepared by Management of the Royal Canadian Mint in conformity with International Financial Reporting Standards, as issued by the International Accounting Standards Board using the best estimates and judgments of Management, where appropriate. The integrity and objectivity of the data in these consolidated financial statements are Management’s responsibility. Management is also responsible for all other information in the annual report and for ensuring that this information is consistent, where appropriate, with the information and data contained in the consolidated financial statements.
In support of its responsibility, Management has developed and maintains books of account, records, financial and management controls, information systems and management practices. These are designed to provide reasonable assurance as to the reliability of financial information, that assets are safeguarded and controlled, and that transactions of the Corporation and of its wholly-owned subsidiary are in accordance with the Financial Administration Act and regulations and, as appropriate, the Royal Canadian Mint Act, the by-laws of the corporation and the charter and the by-laws of its wholly-owned subsidiary.
The Board of Directors is responsible for ensuring that Management fulfils its responsibilities for financial reporting and internal control. The Board exercises its responsibilities through the Audit Committee. The Committee meets with Management, the internal auditor and the independent external auditor to review the manner in which the Corporation is performing their responsibilities and to discuss auditing, internal controls and other relevant financial matters. The Audit Committee meets to review the consolidated financial statements with the internal and external auditors and submits its report to the Board of Directors. The Board of Directors reviews and approves the consolidated financial statements.
The Corporation’s external auditor, the Auditor General of Canada, audits the consolidated financial statements and reports thereon to the Minister responsible for the Royal Canadian Mint.
Sandra L. Hanington Jennifer Camelon, CPA, CAPresident and Chief Executive Officer Chief Financial Officer and Vice President, Finance and Administration
Ottawa, CanadaMarch 11, 2016
MANAGEMENT REPORT

F I N A N C I A L S TAT E M E N T S
34 ROYAL CANADIAN MINT ANNUAL REPORT 2015
INDEPENDENT AUDITOR’S REPORT
To the Minister of Finance Report on the Consolidated Financial Statements I have audited the accompanying consolidated financial statements of the Royal Canadian Mint, which comprise the consolidated statement of financial position as at 31 December 2015, and the consolidated statement of comprehensive (loss) income, consolidated statement of changes in equity and consolidated statement of cash flows for the year then ended, and a summary of significant accounting policies and other explanatory information. Management’s Responsibility for the Consolidated Financial Statements Management is responsible for the preparation and fair presentation of these consolidated financial statements in accordance with International Financial Reporting Standards, and for such internal control as management determines is necessary to enable the preparation of consolidated financial statements that are free from material misstatement, whether due to fraud or error. Auditor’s Responsibility My responsibility is to express an opinion on these consolidated financial statements based on my audit. I conducted my audit in accordance with Canadian generally accepted auditing standards. Those standards require that I comply with ethical requirements and plan and perform the audit to obtain reasonable assurance about whether the consolidated financial statements are free from material misstatement. An audit involves performing procedures to obtain audit evidence about the amounts and disclosures in the consolidated financial statements. The procedures selected depend on the auditor’s judgment, including the assessment of the risks of material misstatement of the consolidated financial statements, whether due to fraud or error. In making those risk assessments, the auditor considers internal control relevant to the entity’s preparation and fair presentation of the consolidated financial statements in order to design audit procedures that are appropriate in the circumstances, but not for the purpose of expressing an opinion on the effectiveness of the entity’s internal control. An audit also includes evaluating the appropriateness of accounting policies
used and the reasonableness of accounting estimates made by management, as well as evaluating the overall presentation of the consolidated financial statements. I believe that the audit evidence I have obtained is sufficient and appropriate to provide a basis for my audit opinion.
Opinion In my opinion, the consolidated financial statements present fairly, in all material respects, the financial position of the Royal Canadian Mint as at 31 December 2015, and its financial performance and its cash flows for the year then ended in accordance with International Financial Reporting Standards. Report on Other Legal and Regulatory Requirements As required by the Financial Administration Act, I report that, in my opinion, the accounting principles in International Financial Reporting Standards have been applied on a basis consistent with that of the preceding year.
Further, in my opinion, the transactions of the Royal Canadian Mint and its wholly-owned subsidiary that have come to my notice during my audit of the consolidated financial statements have, in all significant respects, been in accordance with Part X of the Financial Administration Act and regulations, the Royal Canadian Mint Act and regulations, the charter and by-laws of the Royal Canadian Mint and its wholly-owned subsidiary, and the directive issued pursuant to section 89 of the Financial Administration Act described in Note 1 to the consolidated financial statements.
Karen Hogan, CPA, CAPrincipalfor the Auditor General of Canada
11 March 2016Ottawa, Canada

F I N A N C I A L S TAT E M E N T S
35ROYAL CANADIAN MINT ANNUAL REPORT 2015
FINANCIAL STATEMENTS
Consolidated Statement of Financial Position
As at December 31 (audited) (CAD$ thousands)
Notes 2015 2014
Assets
Current AssetsCash 5 $ 140,776 $ 104,153
Accounts receivable 6 22,946 27,455
Prepaid expenses 7 4,821 1,525
Income taxes receivable 2,891 7,633
Inventories 8 78,570 89,023
Derivative financial assets 9 756 1,941
Total current assets 250,760 231,730
Non-current AssetsDerivative financial assets 9 - 16
Property, plant and equipment 10, 13 172,597 241,650
Investment property 11 236 236
Intangible assets 12, 13 15,211 17,450
Total non-current assets 188,044 259,352
Total assets $ 438,804 $ 491,082
Current LiabilitiesAccounts payable and accrued liabilities 14 $ 85,771 $ 74,778
Loans payable 9, 15 7,526 7,522
Deferred revenue 16 8,656 1,209
Income taxes payable 4,828 3,971
Employee benefits 18 2,697 2,088
Derivative financial liabilities 9 11,414 2,447
Total current liabilities 120,892 92,015
Non-current LiabilitiesDerivative financial liabilities 9 4,096 1,946
Loans payable 9, 15 26,987 34,475
Deferred tax liabilities 17 564 18,218
Employee benefits 18 10,439 10,611
Total non-current liabilities 42,086 65,250
Total liabilities 162,978 157,265
Shareholder’s equityShare capital (authorised and issued 4,000 non-transferable shares) 40,000 40,000
Retained earnings 242,655 295,421
Accumulated other comprehensive income (losses) (6,829) (1,604)
Total shareholder’s equity 275,826 333,817
Total liabilities and shareholder’s equity $ 438,804 $ 491,082
Commitments, contingencies and guarantees (Note 26).The accompanying notes are an integral part of these condensed consolidated financial statements.
Approved on behalf of Approved on behalf of Approved on behalf of Managementthe Board of Directors the Audit Committee
Carman M. Joynt, Susan Dujmovic, Sandra L. Hanington, Jennifer Camelon, FCPA, FCA, ICD.D FICB, ICD.D CPA, CAChair, Chair, President and Chief Financial Officer andBoard of Directors Audit Committee Chief Executive Officer Vice-President of Finance and Administration

F I N A N C I A L S TAT E M E N T S
36 ROYAL CANADIAN MINT ANNUAL REPORT 2015
Consolidated Statement of Comprehensive (Loss) Income
For the year ended December 31 (audited) (CAD$ thousands)
Notes 2015 2014
Revenue 19 $ 2,974,148 $ 2,443,414
Cost of sales 21, 24 2,770,210 2,245,340
Gross profit 203,938 198,074
Operating expenses
Marketing and sales expenses 21, 24 82,633 79,302
Administration expenses 21, 22, 24 60,250 62,273
Impairment losses 13 65,512 -
Operating expenses 208,395 141,575
Net foreign exchange (losses) gains (757) 402
Operating (loss) profit (5,214) 56,901
Finance income (costs), net (290) (764)
Other Income 25 5,000 -
(Loss) profit before income tax (504) 56,137
Income tax (recovery) expense 17 (186) 14,883
(Loss) profit for the period (318) 41,254
Items that will be reclassified subsequently to profit or loss:
Net unrealized (losses) on cash flow hedges (7,108) (3,839)
Reclassification of net realized losses on cash flow hedges transferred from other comprehensive income 1,883 4,027
Items that will not be reclassified subsequently to profit or loss:
Net actuarial gains (losses) on defined benefit plans 552 (812)
Other comprehensive loss, net of tax (4,673) (624)
Total comprehensive (loss) income $ (4,991) $ 40,630
The accompanying notes are an integral part of these consolidated financial statements.

F I N A N C I A L S TAT E M E N T S
37ROYAL CANADIAN MINT ANNUAL REPORT 2015
Consolidated Statement of Changes In Equity
For the year ended December 31 (audited) (CAD$ thousands)
Share Capital
Retained earnings
Accumulated other comprehensive
income (“AOCI”) (Net gains(losses)
on cash flow hedges) Total
Balance as at December 31, 2013 $ 40,000 $ 264,979 $ (1,792) $ 303,187
Profit for the period - 41,254 - 41,254
Other comprehensive income (loss), net of tax - (812) 188 (624)
Dividend paid - (10,000) - (10,000)
Balance as at December 31, 2014 $ 40,000 $ 295,421 $ (1,604) $ 333,817
Loss for the period - (318) - (318)
Other comprehensive income (loss), net of tax - 552 (5,225) (4,673)
Dividends paid - (53,000) - (53,000)
Balance as at December 31, 2015 $ 40,000 $ 242,655 $ (6,829) $ 275,826
The accompanying notes are an integral part of these consolidated financial statements.

F I N A N C I A L S TAT E M E N T S
38 ROYAL CANADIAN MINT ANNUAL REPORT 2015
Consolidated Statement of Cash Flows
For the year ended December 31 (audited) (CAD$ thousands)
2015 2014
Cash flows from operating activities
Receipts from customers $ 2,354,135 $ 1,732,083
Cash receipts on disposal of MintChip™ 5,000 -
Payments to suppliers and employees (2,336,147) (1,739,499)
Interest paid (923) (1,139)
Cash receipts on derivative contracts 606,085 708,436
Cash payments on derivative contracts (502,988) (595,137)
Income taxes paid (9,921) (16,860)
Net cash generated by operating activities 115,241 87,884
Cash flows from investing activities
Interest received 1,020 485
Cash receipts on derivative contracts to acquire property, plant and equipment and intangible assets 4,576 -
Cash payments on derivative contracts to acquire property, plant and equipment and intangible assets (5,156) (5,006)
Payments to acquire property, plant and equipment and intangible assets (20,436) (25,265)
Net cash used in investing activities (19,996) (29,786)
Cash flows from financing activities
Dividend paid (53,000) (10,000)
Proceeds from loans - -
Repayment of loans and other payables (7,488) (7,497)
Net cash used in financing activities (60,488) (17,497)
Net increase (decrease) in cash 34,757 40,601
Cash at the beginning of the period 104,153 63,228
Effects of exchange rate changes on cash held in foreign currencies 1,866 324
Cash at the end of the period $ 140,776 $ 104,153
The accompanying notes are an integral part of these consolidated financial statements.

39ROYAL CANADIAN MINT ANNUAL REPORT 2015
NOTES TO THE CONSOLIDATED FINANCIAL STATEMENTSDecember 31, 2015
(In thousands of Canadian dollars, unless otherwise noted)
1. Nature and description of the Corporation
The Royal Canadian Mint (the “Mint” or the “Corporation”) was incorporated as a Crown Corporation in 1969 by the Royal Canadian Mint Act to mint coins and carry out other related activities. The Mint is an agent corporation of Her Majesty named in Part II of Schedule III to the Financial Administration Act. It produces all of the circulation coins used in Canada and manages the support distribution system for the Government of Canada.
On December 16, 2014, the Royal Canadian Mint Act was amended to specify that although the object of the Mint is to operate in the expectation of profit, the Mint shall not anticipate profit with respect to the provision of any goods or services to Her Majesty in right of Canada, including the minting of circulation coins.
In July 2015, the Corporation was issued a directive (P.C. 2015-1107) pursuant to section 89 of the Financial Administration Act to align its travel, hospitality, conference and event expenditure policies, guidelines and practices with Treasury Board policies, directives and related instruments on travel, hospitality, conference and event expenditures in a manner that is consistent with its legal obligations, and to report on the implementation of this directive in the Corporation’s next corporate plan. The Corporation has completed a significant amount of work to address the requirements and is currently in the process of finalizing changes to a new integrated Corporate Travel, Hospitality, Conference and Event policy that will come into effect in 2016. This new integrated policy will substantially align with Treasury Board policies, directives and related instruments on travel, hospitality, conference and event expenditures.
The Mint is one of the world’s foremost producers of circulation, collector and bullion investment coins for the domestic and international marketplace. It is also one of the largest gold refiners in the world. The addresses of its registered office and principal place of business are 320 Sussex Drive, Ottawa, Ontario, Canada, K1A 0G8 and 520 Lagimodière Blvd, Winnipeg, Manitoba, Canada, R2J 3E7.
In 2002, the Mint incorporated RCMH-MRCF Inc., a wholly-owned subsidiary. RCMH-MRCF Inc. has been operationally inactive since December 31, 2008.
The Corporation is a prescribed federal Crown corporation for tax purposes and is subject to federal income taxes under the Income Tax Act.
2. Significant accounting policies
2.1 Basis of presentationThe consolidated financial statements have been prepared in accordance with International Financial Reporting Standards (“IFRS”).
The policies set out below have been consistently applied to all the periods presented. These consolidated financial statements have been approved for public release by the Board of Directors of the Corporation on March 11, 2016.
2.2 ConsolidationThe consolidated financial statements incorporate the financial statements of the Corporation and its wholly-owned subsidiary. The subsidiary adopted IFRS at the same time as the Corporation and its accounting policies are in line with those used by the Corporation. All intercompany transactions, balances, income and expenses are eliminated in full on consolidation.

N O T E S T O T H E C O N S O L I D AT E D F I N A N C I A L S TAT E M E N T SDecember 31, 2015
(In thousands of Canadian dollars, unless otherwise noted)
40 ROYAL CANADIAN MINT ANNUAL REPORT 2015
2.3 Foreign currency translationUnless otherwise stated, all figures reported in the consolidated financial statements and disclosures are reflected in thousands of Canadian dollars (CAD$), which is the functional currency of the Corporation.
Transactions in currencies other than the Corporation’s functional currency (foreign currencies) are recognized at the rates of exchange prevailing at the dates of the transactions. At the end of each reporting period, monetary items denominated in foreign currencies are translated to Canadian dollars using the exchange rate at that date. Non-monetary items that are measured at fair value in foreign currencies are retranslated at the rates prevailing at the date when the fair value was determined. Non-monetary items that are measured in terms of historical cost in a foreign currency are not retranslated.
Exchange differences are recognized in profit or loss in the period in which they arise, except for exchange differences on transactions applying hedge accounting which are recognized in other comprehensive income.
2.4 InventoriesInventories consist of raw materials and supplies, work in process and finished goods, and they are measured at the lower of cost and net realizable value. Cost of inventories includes all costs of purchase, all costs of conversion and other costs incurred in bringing the inventories to their present location and condition. The cost of inventory is determined by the weighted average cost method. Net realizable value represents the estimated selling price of inventory in the ordinary course of business less the estimated costs of completion and the estimated costs necessary to make the sale.
2.5 Financial instruments Financial assets and financial liabilities are recognized when the Corporation becomes a party to the contractual provisions of the instrument.
Financial assets and financial liabilities are initially measured at fair value. Transaction costs that are directly attributable to the acquisition or issuance of financial assets and financial liabilities (other than financial assets and financial liabilities at fair value through profit or loss) are added to or deducted from the fair value of the financial assets or financial liabilities, as appropriate, on initial recognition. Transaction costs directly attributable to the acquisition of financial assets or financial liabilities at fair value through profit or loss are recognized immediately in profit or loss.
2.5.1 Effective interest methodThe effective interest method is a method of calculating the amortized cost of a financial asset or a financial liability and of allocating interest income and expense over the relevant periods. The effective interest rate is the rate that exactly discounts estimated future cash payments through the expected life of the financial liability, or (where appropriate) a shorter period, to the net carrying amount on initial recognition.
2.6 Financial assets The Corporation’s financial assets are classified into the following specified categories: financial assets at “fair value through profit or loss” (FVTPL) and “loans and receivables”. The classification depends on the nature and purpose of the financial assets and is determined at the time of initial recognition. All regular purchases or sales of financial assets are recognized and derecognized on a trade date basis.
All derivative financial assets are classified in the FVTPL category, except those designated and effective as hedging instruments, for which hedge accounting requirements apply (see Note 2.8.1).
2.6.1 Loans and receivablesLoans and receivables are non-derivative financial assets with fixed or determinable payments that are not quoted in an active market. Loans and receivables are measured at amortized cost using the effective

N O T E S T O T H E C O N S O L I D AT E D F I N A N C I A L S TAT E M E N T SDecember 31, 2015
(In thousands of Canadian dollars, unless otherwise noted)
41ROYAL CANADIAN MINT ANNUAL REPORT 2015
interest method, less any impairment write downs. Assets in this category include accounts receivables and are classified as current assets in the consolidated statement of financial position.
Interest income is recognized by applying the effective interest rate, except for short-term receivables when the recognition of interest would be insignificant.
2.6.2 Financial assets at fair value through profit or lossFinancial assets are classified at FVTPL when the financial asset is either held for trading or it is designated at FVTPL.
A financial asset is classified as held for trading if:
• it has been acquired principally for the purpose of selling it in the near term; or• on initial recognition it is part of a portfolio of identified financial instruments that the Corporation
manages together and has a recent actual pattern of short-term profit-taking; or • it is a derivative that is not designated or effective as a hedging instrument.
A financial asset other than a financial asset held for trading may be designated at FVTPL upon initial recognition.
Financial assets at FVTPL are presented at fair value, with any gains or losses arising on remeasurement recognized in profit or loss. Fair value is determined in the manner described in Note 9.2.1.
2.6.3 Impairment of financial assetsFinancial assets, other than those at FVTPL, are assessed for indicators of impairment at the end of each reporting period. Financial assets are considered to be impaired when there is objective
evidence that, as a result of one or more events that occurred after the initial recognition of the financial asset, the estimated future cash flows of the investment have been affected.
Objective evidence of impairment could include:
• significant financial difficulty of the debtor; or• breach of contract, such as a default or delinquency in payments; or• it becoming probable that the debtor will enter bankruptcy or financial re-organisation; or• significant decrease in creditworthiness of the debtor.
For financial assets carried at amortized cost, the amount of the impairment loss recognized is the difference between the asset’s carrying amount and the present value of estimated future cash flows, discounted at the financial asset’s original effective interest rate.
The carrying amount of the financial asset is reduced by the impairment loss directly for all financial assets with the exception of trade receivables, where the carrying amount is reduced through the use of an allowance account. When a trade receivable is considered uncollectible, it is written off against the allowance account. Subsequent recoveries of amounts previously written off are credited against the allowance account. Changes in the carrying amount of the allowance account are recognized in profit or loss.
For financial assets measured at amortized cost, if, in a subsequent period, the amount of the impairment loss decreases and the decrease can be objectively related to an event occurring after the impairment was recognized, the previously recognized impairment loss is reversed through profit or loss to the extent that

N O T E S T O T H E C O N S O L I D AT E D F I N A N C I A L S TAT E M E N T SDecember 31, 2015
(In thousands of Canadian dollars, unless otherwise noted)
42 ROYAL CANADIAN MINT ANNUAL REPORT 2015
the carrying amount of the investment at the date the impairment not exceed what the amortized cost would have been had the impairment not been recognized.
2.6.4 Derecognition of financial assetsThe Corporation derecognizes a financial asset only when the contractual rights to the cash flows from the asset expire, or when it transfers the financial asset and substantially all the risks and rewards of ownership of the asset to another entity.
2.7 Financial liabilities Financial liabilities are classified as either financial liabilities at “FVTPL” or “other financial liabilities”.
All derivative financial liabilities are classified in the FVTPL category, except those designated and effective as hedging instruments, for which hedge accounting requirements apply (see Note 2.8.1).
2.7.1 Financial liabilities at fair value through profit or loss Financial liabilities are classified at FVTPL when the financial liability is either held for trading or it is designated as at FVTPL.
A financial liability is classified as held for trading using the same criteria described in Note 2.6.2 for a financial asset classified as held for trading.
Financial liabilities at FVTPL are presented at fair value, with any gains or losses arising on remeasurement recognized in profit or loss. Fair value is determined in the manner described in Note 9.2.1.
2.7.2 Other financial liabilitiesOther financial liabilities are initially measured at fair value, net of transaction costs.
Other financial liabilities (including borrowings) are subsequently measured at amortized cost using the effective interest method.
2.7.3 Derecognition of financial liabilitiesThe Corporation derecognizes financial liabilities when, and only when, the Corporation’s obligations are discharged, cancelled or they expire.
2.8 Derivative financial instrumentsThe Corporation selectively utilizes derivative financial instruments, primarily to manage financial risks and to manage exposure to fluctuations in foreign exchange rates, interest rates and commodity prices. The Corporation’s policy is not to enter into derivative instruments for trading or speculative purposes.
Derivatives are initially recognized at fair value at the date the derivative contracts are entered into and are subsequently remeasured to their fair value at the end of each reporting period. Attributable transaction costs are recognized in profit or loss as incurred. The resulting gain or loss is recognized in profit or loss immediately unless the derivative is designated and effective as a hedging instrument, in which case the timing of the recognition in profit or loss depends on the nature of the hedging relationship.
A derivative with a positive fair value is recognized as a financial asset; a derivative with a negative fair value is recognized as a financial liability. A derivative is presented as a non-current asset or a non-current liability on the consolidated statement of financial position if the remaining contractual maturity of the instrument is more than 12 months and it is not expected to be realized or settled within 12 months. Other derivatives are presented as current assets or current liabilities.

N O T E S T O T H E C O N S O L I D AT E D F I N A N C I A L S TAT E M E N T SDecember 31, 2015
(In thousands of Canadian dollars, unless otherwise noted)
43ROYAL CANADIAN MINT ANNUAL REPORT 2015
2.8.1 Hedge accountingThe Corporation designates certain derivatives as hedges of highly probable forecasted transactions or hedges of firm commitments (cash flow hedges). Hedge accounting is applied when the derivative is designated as a hedge of a specific exposure. All designated hedges are formally documented at inception, detailing the particular risk management objective and the strategy undertaking the hedge transaction.
The documentation identifies the specific asset or liability being hedged, the risk that is being hedged, the type of derivative used and how effectiveness will be assessed. The Corporation assesses whether the derivatives are highly effective in accomplishing the objective of offsetting changes in forecasted cash flows attributable to the risk being hedged both at inception and over the life of the hedge. Furthermore, accumulated ineffectiveness is measured over the life of the hedge.
The gain or loss relating to the changes in the fair value of the effective portion of derivatives that are designated and qualify as cash flow hedges is recognized in other comprehensive income. The gains or losses relating to the ineffective portion of changes in the fair value of derivatives that are designated and qualify as cash flow hedges is recognized immediately in profit or loss.
Amounts previously recognized in other comprehensive income are transferred to net income in the period when the hedged item is recognized in the consolidated statement of comprehensive (loss) income.
Hedge accounting is discontinued prospectively when the hedging instrument is terminated, exercised, matured or when the derivative no longer qualifies for hedge accounting.
2.9 Property, plant and equipment
2.9.1 Asset recognitionItems of property, plant and equipment are measured at cost less accumulated depreciation and accumulated impairment losses.
Cost includes expenditures that are directly attributable to the acquisition of the asset. The cost of self-constructed assets includes the cost of materials and direct labour, any other costs directly attributable to bringing the assets to a working condition for their intended use, the costs of dismantling and removing the items and restoring the site on which they are located, and borrowing costs on qualifying assets.
When parts of an item of property, plant and equipment have different useful lives, they are accounted for as separate items (major components) of property, plant and equipment.
2.9.2 DepreciationDepreciation of property, plant and equipment begins when the asset is available for use by the Corporation. Depreciation is calculated on a straight-line basis over the estimated useful lives of the assets, which are estimated as follows:
Land improvements 40 years Buildings & improvements 10–60 years Equipment 4–35 years
Capital projects in process for production, supply or administrative purposes, or for purposes not yet determined, are carried at cost. Cost includes professional fees and, for qualifying assets, borrowing costs capitalized in accordance with the Corporation’s accounting policy. Depreciation of these assets commences when the assets are available for their intended use.

N O T E S T O T H E C O N S O L I D AT E D F I N A N C I A L S TAT E M E N T SDecember 31, 2015
(In thousands of Canadian dollars, unless otherwise noted)
44 ROYAL CANADIAN MINT ANNUAL REPORT 2015
Freehold land is not depreciated.
Useful lives, residual values and depreciation methods are reviewed at each year end and necessary adjustments are recognized on a prospective basis as changes in estimates.
2.9.3 Subsequent costsDay-to-day repairs and maintenance costs are expensed when incurred.
Costs incurred on a replacement part for property, plant and equipment are recognized in the carrying amount of the affected item when the costs are incurred. The carrying amount of the part that was replaced is derecognized.
Cost of major inspections or overhauls are recognized in the carrying amount of the item or as a replacement. Any remaining carrying amount of the cost of the previous inspection is derecognized.
2.9.4 DerecognitionAn item of property, plant and equipment is derecognized upon disposal or when no further future economic benefits are expected from its use or disposal. The gain or loss on disposal or retirement of an item is determined as the difference between the sales proceeds and the carrying amount of the asset and is recognized in profit or loss when the item is derecognized.
2.10 Investment propertyInvestment property is property held to earn rental income or for capital appreciation—or for both, but not for sale in the ordinary course of business, use in the production or supply of goods or services or for administrative purposes.
The Corporation’s investment property is measured at cost and relates to vacant land in the Corporation’s Winnipeg location. The fair value of the investment property is disclosed in Note 11. If in management’s judgement, it is likely that there is significant change in the market price of the investment property a new valuation will be carried out.
2.11 Intangible Assets
2.11.1 SoftwareThe Corporation’s intangible assets include software for internal use or for providing services to customers. These assets are carried at cost, less any accumulated amortization and any accumulated impairment losses. Amortization is recognized on a straight-line basis over their estimated useful lives. The estimated useful lives of intangible assets are from 5 to 7 years. The estimated useful life and amortization method are reviewed at each year-end with necessary adjustments being recognized on a prospective basis as changes in estimates.
2.11.2 Research and developmentExpenditure on research activities, undertaken with the prospect of gaining new scientific or technical knowledge and understanding, is recognized in profit or loss as incurred.
Development activities involve a plan or design for the production of new or substantially improved products and processes. Development expenditure is capitalized only if development costs can be measured reliably, the product or process is technically and commercially feasible, future economic benefits are probable, and the Corporation intends to and has sufficient resources to complete the development and to use or sell the asset. The expenditure capitalized includes the cost of materials,
N O T E S T O T H E C O N S O L I D AT E D F I N A N C I A L S TAT E M E N T SDecember 31, 2015
(In thousands of Canadian dollars, unless otherwise noted)
45ROYAL CANADIAN MINT ANNUAL REPORT 2015
direct labour, overhead costs that are directly attributable to preparing the asset for its intended use, and capitalized borrowing costs. Other development expenditure is recognized in profit or loss as incurred.
2.12 LeasingLeases are classified as finance leases whenever the terms of the lease transfer substantially all the risks and rewards of ownership to the Corporation. All other leases are classified as operating leases. The Corporation has no finance leases at the end of the reporting period.
The operating lease payments are recognized on a straight-line basis over the lease term.
2.13 Impairment of tangible and intangible assetsAt the end of each reporting period, the Corporation reviews the carrying amounts of its tangible and intangible assets to determine whether there is any indication that those assets have suffered an impairment loss. If any such indication exists, the recoverable amount of the asset is estimated in order to determine the extent of the impairment loss (if any). Where it is not possible to estimate the recoverable amount of an individual asset, the Corporation estimates the recoverable amount of the cash-generating unit to which the asset belongs. Where a reasonable and consistent basis of allocation can be identified, corporate assets are also allocated to individual cash-generating units, or otherwise they are allocated to the smallest group of cash-generating units for which a reasonable and consistent allocation basis can be identified.
Recoverable amount is the higher of fair value less costs of disposal and value in use. In assessing value in use, the estimated future cash flows are discounted to their present value that reflects current market assessments of the time value of money and the risks specific to the asset for which the estimates of future cash flows have not been adjusted.
If the recoverable amount of an asset (or cash-generating unit) is estimated to be less than its carrying amount, the carrying amount of the asset (or cash-generating unit) is reduced to its recoverable amount. An impairment loss is recognized immediately in profit or loss.
Where an impairment loss subsequently reverses, the carrying amount of the asset (or cash-generating unit) is increased to the revised estimate of its recoverable amount, but only to the extent that the increased carrying amount does not exceed the carrying amount that would have been determined had no impairment loss been recognized for the asset (or cash-generating unit) in prior years. A reversal of an impairment loss is recognized immediately in profit or loss.
2.14 Borrowing costsBorrowing costs directly attributable to the acquisition, construction or production of qualifying assets, which are assets that necessarily take a substantial period of time to prepare for their intended use or sale, are added to the cost of those assets, until such time as the assets are substantially ready for their intended use or sale.
All other borrowing costs are recognized as expenses in profit or loss in the period in which they are incurred.
2.15 Deferred revenuePayments received in advance on sales are not recognized as revenue until the products are shipped or the services are rendered which represents the time at which the significant risks and rewards are transferred to the buyer. As such, deferred revenue are initially recognized within liabilities on the consolidated statement of financial position.
2.16 Income tax Income tax expense comprises the sum of the tax currently payable and deferred tax.

N O T E S T O T H E C O N S O L I D AT E D F I N A N C I A L S TAT E M E N T SDecember 31, 2015
(In thousands of Canadian dollars, unless otherwise noted)
46 ROYAL CANADIAN MINT ANNUAL REPORT 2015
2.16.1 Current taxThe tax currently payable is based on taxable profit for the year. Taxable profit differs from profit as reported in the consolidated statement of comprehensive (loss) income because of items of income or expense that are taxable or deductible in other years and items that are never taxable or deductible. The Corporation’s liability for current tax is calculated using tax rates that have been enacted or substantively enacted by the end of the reporting period.
2.16.2 Deferred taxDeferred tax is recognized on temporary differences between the carrying amounts of assets and liabilities in the consolidated financial statements and the corresponding tax bases used in the computation of taxable profit. Deferred tax liabilities are generally recognized for all taxable temporary differences. Deferred tax assets are generally recognized for all deductible temporary differences to the extent that it is probable that taxable profits will be available against which those deductible temporary differences can be utilised.
The carrying amount of deferred tax assets is reviewed at the end of each reporting period and reduced to the extent that it is no longer probable that sufficient taxable profits will be available to allow all or part of the asset to be recovered.
Deferred tax assets and liabilities are measured at the tax rates that are expected to apply in the period in which the liability is settled or the asset realized, based on tax rates (and tax laws) that have been enacted or substantively enacted by the end of the reporting period. The measurement of deferred tax liabilities and assets reflects the tax consequences that would follow from the manner in which the Corporation expects, at the end of the reporting period, to recover or settle the carrying amount of its assets and liabilities.
2.16.3 Current and deferred tax for the periodCurrent and deferred tax are recognized in profit or loss, except when they relate to items that are recognized in other comprehensive income or directly in equity, in which case, the current and deferred tax are also recognized in other comprehensive income or directly in equity respectively.
2.16.4 Scientific Research and Development Investment Tax CreditThe Corporation deducts any scientific research and development investment tax credits from related research and development expenses. Only scientific research and development investment tax credits that are reasonably assured are recognized in the period.
2.17 Employee benefits
2.17.1 Short-term employee benefitsShort-term employee benefits are the employee benefits that are expected to be settled within twelve months after the end of the period in which the employees render the related service. The Corporation’s short-term employee benefits include wages and salaries, annual leave and other types of short-term benefits.
The Corporation recognizes the undiscounted amount of short-term employee benefits earned by an employee in exchange for services rendered during the period as a liability in the consolidated statement of financial position, after deducting any amounts already paid and as an expense in profit or loss.
2.17.2 Pension benefitsSubstantially all of the employees of the Corporation are covered by the Public Service Pension Plan (the “Plan”), a contributory defined benefit plan established through legislation and sponsored by the Government of Canada. Contributions are required by both the employees and the Corporation to cover

N O T E S T O T H E C O N S O L I D AT E D F I N A N C I A L S TAT E M E N T SDecember 31, 2015
(In thousands of Canadian dollars, unless otherwise noted)
47ROYAL CANADIAN MINT ANNUAL REPORT 2015
current service cost. Pursuant to legislation currently in place, the Corporation has no legal or constructive obligation to pay further contributions with respect to any past service or funding deficiencies of the Plan. Consequently, contributions are recognized as an expense in the year when employees render service and represent the total pension obligation of the Corporation.
2.17.3 Other post-employment benefits Other post-employment benefits include severance benefits and supplementary retirement benefits including post-retirement benefits and post-retirement insurance benefits for certain employees and former employees. The benefits are accrued as the employees render the services necessary to earn them.
The accrued benefit obligation is actuarially determined by independent qualified actuaries using the projected unit credit actuarial valuation method based upon a current market-related discount rate and other actuarial assumptions, which represent management’s best long-term estimates of factors such as future wage increases and employee termination rates.
Actuarial gains and losses arise when actual results differ from results which are estimated based on the actuarial assumptions. Actuarial gains and losses are reported in retained earnings in Shareholder’s equity in the year that they are recognized as other comprehensive income in the consolidated statement of comprehensive (loss) income.
When past service costs occur, they are recognized at the earliest of when the amendment or curtailment occurs or when the Corporation recognizes the related restructuring or termination costs.
2.17.4 Other long-term employee benefitsOther long-term employee benefits are employee benefits (other than post-employment benefits) that are not expected to be settled within twelve months after the end of the period in which the employees render the related service.
The Corporation’s other long-term employee benefits include benefits for employees in receipt of long-term disability benefits, sick leave and special leave benefits and worker’s compensation benefits.
The Corporation’s sick leave and special leave benefits that are accumulated but not vested are accounted for as other long-term employee benefits and presented as current liabilities in the consolidated statement of financial position as the Corporation does not have the right to defer settlement of these liabilities.
Long-term disability benefits, sick leave benefits and special leave benefits are accrued as the employees render the services necessary to earn them. The accrued benefit obligation is actuarially determined by independently qualified actuaries using discounted estimated future benefit payments.
The Corporation is subject to the Government Employees Compensation Act and, therefore, is self-insured. As a self-insured employer, the Corporation is accountable for all such liabilities incurred since incorporation. The accrued benefit obligation for workers’ compensation benefits is actuarially determined based on known awarded disability and survivor pensions and other potential future awards in respect of accidents that occurred up to the measurement date. The benefit entitlements are based upon relevant provincial legislations in effect on that date.
All other long-term employee benefits, past service costs and actuarial gains and losses are recognized immediately in profit or loss on the consolidated statement of comprehensive (loss) income, as is the effect of curtailments and settlements, if applicable.
N O T E S T O T H E C O N S O L I D AT E D F I N A N C I A L S TAT E M E N T SDecember 31, 2015
(In thousands of Canadian dollars, unless otherwise noted)
48 ROYAL CANADIAN MINT ANNUAL REPORT 2015
2.18 ProvisionsProvisions are recognized when the Corporation has a present obligation (legal or constructive) as a result of a past event, it is probable that the Corporation will be required to settle the obligation, and a reliable estimate can be made of the amount of the obligation.
The amount recognized as a provision is the best estimate of the consideration required to settle the present obligation at the end of the reporting period, taking into account the risks and uncertainties surrounding the obligation. When a provision is measured using the cash flows estimated to settle the present obligation, its carrying amount is the present value of those cash flows (where the effect of the time value of money is material).
When some or all of the economic benefits required to settle a provision are expected to be recovered from a third party, a receivable is recognized as an asset if it is virtually certain that reimbursement will be received and the amount of the receivable can be measured reliably.
2.19 Share capitalIn 1987, the revised Royal Canadian Mint Act provided the Corporation with an authorized share capital of $40 million divided into 4,000 non-transferable shares, redeemable at their issue price of $10,000 each. In 1989, the Minister of Supply and Services purchased the 4,000 shares in the Corporation. This was a part of a financial structuring that allows the Corporation to apply its net earnings to meet operational requirements, replace capital assets, generally ensure its overall financial stability and pay a reasonable dividend to the shareholder. The shares are currently held in trust by the Minister of Finance on behalf of the Government of Canada.
2.20 RevenueRevenue is measured at the fair value of the consideration received or receivable. Revenue is presented net of estimated customer returns, rebates and other similar allowances.
2.20.1 Sale of goodsRevenue from the sale of goods are recognized when:
• the Corporation has transferred to the buyer the significant risks and rewards of ownership of the goods; • the Corporation retains neither continuing managerial involvement to the degree usually associated
with ownership nor effective control over the goods;• the revenue and transaction costs incurred can be reliably measured; and • it is probable that the economic benefits associated with the transaction will flow to the Corporation.
The Corporation recognizes revenue in certain circumstances in which the delivery of the goods is delayed at the buyer’s request, but the buyer takes title and accepts billing. The revenue is recognized provided that it is probable that the delivery will be made, the item is on hand, identifiable and ready for delivery at the time of the sale and that usual payment terms will apply.
2.20.2 Rendering of servicesRevenue from the rendering of services is recognized by reference to the stage of completion of contracts at the reporting date. The revenue is recognized when:
• the amount of revenue, stage of completion and transaction costs incurred can be reliably measured; and • it is probable that the economic benefits associated with the transaction will flow to the Corporation.
The stage of completion of contracts at the reporting date is determined by reference to the costs incurred to date as a percentage of the estimated total costs of the contract.
N O T E S T O T H E C O N S O L I D AT E D F I N A N C I A L S TAT E M E N T SDecember 31, 2015
(In thousands of Canadian dollars, unless otherwise noted)
49ROYAL CANADIAN MINT ANNUAL REPORT 2015
2.20.3 Interest revenueInterest revenue is recognized when it is probable that the economic benefits will flow to the Corporation and the amount of revenue can be measured reliably. Interest revenue is accrued on a time basis and recognized by using the effective interest method.
3. Key sources of estimation uncertainty and critical judgments
3.1 Key sources of estimation uncertaintyThe preparation of these consolidated financial statements in accordance with IFRS requires management to make estimates and assumptions that affect the reported amounts of assets and liabilities, disclosure of contingent assets and liabilities at the date of the consolidated financial statements and the reported amounts of revenue and expenses during the reporting period.
In making estimates and using assumptions, management relies on external information and observable conditions where possible, supplemented by internal analysis as required. The estimates and associated assumptions are based on historical experience and other factors that are considered to be relevant. Actual results may differ significantly from the estimates and assumptions. The estimates and underlying assumptions are reviewed on an ongoing basis. Revisions to accounting estimates are recognized in the period in which the estimate is revised if the revision affects only that period or in the period of the revision and future periods if the revision affects both current and future periods.
The most significant items where estimates and assumptions are used are the estimated useful lives of property, plant and equipment, impairment of capital assets, employee benefits liabilities, the precious metal reconciliation process including the expected precious metal content in refinery by-products, inventory valuation allowance and income taxes.
3.1.1 Capital assetsCapital assets, comprising property, plant and equipment with finite useful lives, are depreciated over their useful lives. Useful lives are based on management’s estimates of the periods of service provided by the assets. The useful lives of these assets are reviewed annually for continued appropriateness. Changes to the useful life estimates would affect the timing of future depreciation expense and the future carrying value of assets. The carrying amounts of the capital assets as at the end of the reporting periods are included in Note 10.
Determining whether capital assets are impaired requires an estimation of the recoverable amount of the assets or of the cash-generating units that displayed impairment indicators. The recoverable amount of the assets or of the cash-generating units is determined based on the higher of fair value less cost of disposal or the value in use, whereby the undiscounted future cash flows expected to arise from the cash-generating units is estimated and a discount rate represented by the weighted average costs of capital is used in order to calculate the present value of the cash flows. The key estimates applied in determining the recoverable amount normally includes estimated future metal prices, expected future revenues, future costs and discount rates. Changes to these estimates will affect the recoverable amounts of the cash-generating units and individual assets and may then require a material adjustment to their related carrying value. Details of the impairment loss recorded by the Corporation in 2015 are described in Note 13.
3.1.2 Employee benefits liabilitiesThe present value of the other post-employment and other long-term employee benefits liabilities to be settled in the future depends on a number of factors that are determined on an actuarial basis using a number of assumptions, such as discount rates, long-term rates of compensation increase, retirement age, future health-care and dental costs and mortality rates. The Corporation consults with external actuaries
N O T E S T O T H E C O N S O L I D AT E D F I N A N C I A L S TAT E M E N T SDecember 31, 2015
(In thousands of Canadian dollars, unless otherwise noted)
50 ROYAL CANADIAN MINT ANNUAL REPORT 2015
regarding these assumptions annually. Any changes in these assumptions will impact the carrying amount of the other post-employment and other long-term employee benefits liabilities. The carrying amount of the employee benefits liabilities as at the end of the reporting periods is included in Note 18.
3.1.3 Precious metal inventory and reconciliationCertain refinery by-products with precious metal content which cannot be processed by the Corporation are shipped to contract refineries to determine the actual precious metal content. Due to the varying degrees of the physical homogeneity of these materials the Corporation relies on the best available sampling and assay methodologies to arrive at its best estimate of the precious metal content when materials are shipped. Once final settlements are reached with the contract refineries and the actual precious metal content is known these estimates are replaced by the actual values. The Corporation also refines by-products internally which requires estimates on precious metals content using the same methodology as described above. Due to this, the Corporation minimizes the amount of unrefined by-products in inventory to reduce the variability in the reconciliation results.
Management may be required to use estimates at other points in the precious metal reconciliation process based on varying conditions. If estimates are required, historical experience and other factors are applied.
Any changes in these estimates will impact the carrying amount of the inventory. The carrying amount of the inventory as at the end of the reporting periods is included in Note 8.
3.1.4 Inventory valuation allowanceInventory valuation allowance is estimated for slow moving or obsolete inventories. Management reviews the estimation regularly. Any change in the estimation will impact the inventory valuation allowance. The carrying amount of the inventory as at the end of the reporting periods is included in Note 8.
3.1.5 Income taxesThe Corporation operates in a jurisdiction which requires calculations for which the ultimate tax determination is uncertain during the ordinary course of business. Liabilities are recognized for anticipated tax exposures based on estimates of the additional taxes that are likely to become due. Where the final tax outcome of these matters is different from the amount that was initially recorded, such differences will affect the income tax and deferred tax provisions in the period in which such determination is made.
Deferred tax assets and liabilities are composed of temporary differences between the carrying values and tax basis of assets and liabilities. Deferred tax assets are only recorded to the extent that it is probable that they will be realized. The timing of the reversal of the temporary differences may take many years and the related deferred tax is calculated using substantively enacted tax rates for the related period.
If future outcomes were to adversely differ from management’s best estimate of future results from operations affecting the timing of reversal of deductible temporary differences, the Corporation could experience material deferred income tax adjustments. Such deferred income tax adjustments would not result in an immediate cash outflow nor would they affect the Corporation’s immediate liquidity.
3.2 Critical judgementsThe critical judgments that the Corporation’s management has made in the process of applying the Corporation’s accounting policies, apart from those involving estimations, that have the most significant effects on the amounts recognized in the Corporation’s consolidated financial statements are as follows:

N O T E S T O T H E C O N S O L I D AT E D F I N A N C I A L S TAT E M E N T SDecember 31, 2015
(In thousands of Canadian dollars, unless otherwise noted)
51ROYAL CANADIAN MINT ANNUAL REPORT 2015
3.2.1 Impairment indicators of capital assetsCapital assets with finite useful lives are required to be tested for impairment only when indication of impairment exists. Management is required to make a judgement with respect to the existence of impairment indicators at the end of each reporting period.
In 2015 indicators of impairment were observed for two of the Corporation’s three cash generating units and management tested these cash generating units for impairment and recorded an impairment loss. Details of the impairment loss calculation are included in Note 13.
3.2.2 Provisions and contingent liabilitiesIn determining whether a liability should be recorded in the form of a provision, management is required to exercise judgement in assessing whether the Corporation has a present legal or constructive obligation as a result of a past event, whether it is probable that an outflow of resources will be required to settle the obligation, and whether a reasonable estimate can be made of the amount of the obligation. In making this determination, management may use past experience, prior external precedents and the opinions and views of legal counsel. If management determines that the above three conditions are met, a provision is recorded for the obligation. Alternatively, a contingent liability is disclosed in the notes to the consolidated financial statements if management determines that any one of the above three conditions is not met, unless the possibility of outflow in settlement is considered to be remote.
3.2.3 Divestiture of MintChipTM
In December 2015, the Company closed the sale of MintChip™ for a cash consideration of $5 million paid at closing and an $11 million, 4% interest-bearing, secured promissory note with interest payments due semi-annually and the principal amount due on December 16, 2022. Management is required to make a judgement with respect to the uncertainty over the collectability of the promissory note. It was determined that no asset would be recorded in the consolidated financial statements and any additional future consideration related to interest and principal repayments will be recognized as other income upon receipt of cash.
4. Application of new and revised IFRS pronouncements
4.1 New and revised IFRS pronouncements affecting amounts reported and/or disclosed in the consolidated financial statements
There were no new or revised IFRS issued and that became effective for annual periods beginning on or after January 1, 2015 that affected amounts reported or disclosed in the consolidated financial statements.
4.2 New and revised IFRS issued but not yet effectivea) The Corporation has reviewed new and revised accounting pronouncements that have been issued
but are not yet effective. The adoption of the following amendments is not expected to have a material impact on the Corporation’s consolidated financial statements.
IAS 38 Intangible Assets (“IAS 38”) IAS 38 was amended in May 2014 for the clarification of acceptable methods of amortisation; it
introduces a rebuttable presumption that a revenue-based amortisation method for intangible assets is inappropriate for the same reasons as in IAS 16 with limited circumstances when the presumption can be overcome. The amendment is effective for annual periods beginning on or after January 1, 2016, with earlier application being permitted.

N O T E S T O T H E C O N S O L I D AT E D F I N A N C I A L S TAT E M E N T SDecember 31, 2015
(In thousands of Canadian dollars, unless otherwise noted)
52 ROYAL CANADIAN MINT ANNUAL REPORT 2015
Annual improvements to IFRSs 2012–2014 In September 2014, the International Accounting Standards Board (IASB) issued annual
improvements during the 2012–2014 cycle. The standards covered by the amendments are: IFRS 5 “Non-current assets held for sale and discontinued operations” which provides guidance on the methods of disposal; IFRS 7 “Financial Instruments: Disclosures” which provides guidance on servicing contracts and the applicability of the amendments to IFRS 7 to condensed interim financial statements. IFRS 19 “Employee benefits” which clarifies how the discount rate is to be determined in a regional market using the same currency; and IAS 34 “Interim Financial Reporting” which discusses disclosures of information elsewhere in the interim financial report. These annual improvements are to be applied for annual periods beginning on or after January 1, 2016. Early adoption is permitted.
b) The following amendments have been assessed as having a possible impact on the Corporation’s consolidated financial statements in the future. The Corporation is currently assessing these amendments and therefore the extent of the impact of the adoption of the amendments is unknown.
IAS 1 Presentation of Financial Statements (“IAS 1”) In December 2014, IASB issued amendments to IAS 1 which clarified the existing presentation and
disclosure requirements including the presentation of line items, subtotals and notes and provided guidance to assist in applying judgement in determining what information to disclose and how that information is presented in financial statements. The amendments are effective for annual periods beginning on or after January 1, 2016. Early adoption is permitted.
IFRS 9 Financial Instruments (“IFRS 9”) In July 2014, the IASB issued the final version of IFRS 9, which incorporates the classification and
measurement, impairment and hedge accounting phases of the project to replace the existing standards under IAS39 “Financial Instruments: Recognition and Measurement”. The new IFRS 9 standard is effective for annual periods beginning on or after January 1, 2018 and is to be applied retroactively. Early adoption is permitted.
IFRS 7 Financial Instruments: Disclosures (“IFRS 7”) An amendment was released in December 2011 to IFRS 7 regarding requiring disclosures about the
initial application of IFRS 9 which has an effective date of January 1, 2018. The amendments are to be applied retrospectively.
An additional amendment was released in November 2013 to IFRS 7 regarding additional hedge accounting disclosures resulting from the introduction of the hedge accounting section of IFRS 9 which has an effective date of January 1, 2018. The amendments are to be applied retrospectively.
IFRS 15 Revenue from Contracts with Customers (“IFRS 15”) IFRS 15 was issued in May 2014 and specifies how and when an IFRS reporter will recognise revenue
as well as requiring such entities to provide users of financial statements with more informative, relevant disclosures. The standard supersedes IAS 18 “Revenue’’, IAS 11 “Construction Contracts” and a number of revenue-related interpretations. Application of the standard is mandatory for all IFRS reporters and it applies to nearly all contracts with customers: the main exceptions are leases, financial instruments and insurance contracts. In July 2015, the IASB deferred the effective date of IFRS 15 to January 1, 2018. Early adoption is permitted.

N O T E S T O T H E C O N S O L I D AT E D F I N A N C I A L S TAT E M E N T SDecember 31, 2015
(In thousands of Canadian dollars, unless otherwise noted)
53ROYAL CANADIAN MINT ANNUAL REPORT 2015
IFRS 16 Leases IFRS 16 Leases was issued on January 13, 2016 to replace IAS 17 Leases. The new standard requires
that leases be brought onto companies’ balance sheets, increasing the visibility of their assets and liabilities. IFRS 16 removes the classification of leases as either operating leases or finance leases (for the lessee-the lease customer), treating all leases as finance leases. Short-term leases (less than 12 months) and leases of low-value assets (such as personal computers) will have an optional exemption from the requirements. The new standard is effective 1 January 2019. Early adoption is permitted (as long as the recently issued revenue Standard, IFRS 15 Revenue from Contracts with Customers is also adopted).
5. Cash
As at December 31
2015 2014
Canadian dollars $ 128,676 $ 97,789
US dollars 11,146 4,746
Euros 954 1,618
Total cash $ 140,776 $ 104,153
6. Accounts receivable
As at December 31
2015 2014
Trade receivables and accruals $ 20,632 $ 21,078
Allowance for doubtful accounts (81) (133)
Net trade receivables 20,551 20,945
Other receivables 2,395 6,510
Total accounts receivable $ 22,946 $ 27,455
The Corporation’s accounts receivable are denominated in the following currencies:
As at December 31
2015 2014
Canadian dollars $ 15,067 $ 12,925
US dollars 7,873 14,530
Euros 6 -
Total accounts receivable $ 22,946 $ 27,455
The Corporation does not hold any collateral in respect of trade and other receivables.

N O T E S T O T H E C O N S O L I D AT E D F I N A N C I A L S TAT E M E N T SDecember 31, 2015
(In thousands of Canadian dollars, unless otherwise noted)
54 ROYAL CANADIAN MINT ANNUAL REPORT 2015
7. Prepaid expenses
As at December 31
2015 2014
Total prepaid expenses $ 4,821 $ 1,525
Included in prepaid expenses are $2.9 million relating to marketing costs incurred for special Canadian circulation coins for which Order In Council approval has not yet been obtained. These costs will be expensed in 2016 once approval has been obtained.
8. Inventories
As at December 31
2015 2014
Raw materials and supplies $ 10,976 $ 21,797
Work in process 20,287 22,540
Finished goods 47,307 44,686
Total inventories $ 78,570 $ 89,023
The amount of inventories recognized as cost of sales in 2015 is $2.8 billion (2014 – $2.3 billion).
The cost of inventories recognized as cost of sales in 2015 includes $4.3 million write-downs of inventory to net realisable value (2014 – $5.4 million).
9. Financial instruments and financial risk management
9.1 Capital risk managementThe Corporation’s objectives in managing capital are to safeguard its ability to continue as a going concern and pursue its strategy of organizational growth to provide returns to its sole shareholder, the Government of Canada, and benefits to other stakeholders. The Corporation’s overall strategy with respect to capital risk management remains unchanged from the year ended December 31, 2014.
The capital structure of the Corporation consists of loans payable as detailed in Note 15 and shareholder’s equity which is composed of issued capital, accumulated other comprehensive income and retained earnings.
The Corporation’s senior management reviews the Corporation’s capital structure periodically. As part of the review, senior management considers the cost of the capital and the associated risks in order to comply with the borrowing limits (see Note 26.4) stipulated by the Royal Canadian Mint Act. The Corporation manages its capital structure and makes adjustments to it in light of general economic conditions, the risk characteristics of the underlying assets and the Corporation’s working capital requirements. The timing, terms and conditions of all borrowing transactions are approved by the Minister of Finance.
The Corporation also monitors debt leverage ratios as part of the management of liquidity to ensure it is properly financed and leveraged to facilitate planned objectives. See below the debt leverage ratios at the end of the reporting period.

N O T E S T O T H E C O N S O L I D AT E D F I N A N C I A L S TAT E M E N T SDecember 31, 2015
(In thousands of Canadian dollars, unless otherwise noted)
55ROYAL CANADIAN MINT ANNUAL REPORT 2015
Debt to Equity ratioAs at December 31
2015 2014
Loans payable (current and non-current) $ 34,513 $ 41,997
Shareholder’s equity 275,826 333,817
1:8 1:8
Debt to Assets ratioAs at December 31
2015 2014
Loans payable (current and non-current) $ 34,513 $ 41,997
Total assets 438,804 491,082
1:13 1:12
In order to maintain or adjust its capital structure, the Corporation may adjust the amount of dividends paid to the shareholder, issue new shares, issue new debt or repay existing debt. Any such activities are approved by the Board of Directors and subject to the stipulations of the Royal Canadian Mint Act.
The Corporation has remitted a total dividend of $53 million to the Government of Canada in 2015, including the standard annual dividend of $10 million and a special dividend of $43 million.
9.2 Classification and fair value measurements of financial instruments
9.2.1 Carrying amount and fair value of financial instrumentsThe classification, as well as the carrying amount and fair value of the Corporation’s financial assets and financial liabilities are as follows:
As at December 31
2015 2014
Carrying Amount Fair value
Carrying Amount Fair value
Financial Assets
Held for Trading
Cash $ 140,776 $ 140,776 $ 104,153 $ 104,153
Derivative financial assets 756 756 1,957 1,957
Loans and receivables
Accounts receivable 22,946 22,946 27,455 27,455
Financial Liabilities
Held for Trading
Derivative liabilities 15,510 15,510 4,393 4,393
Other Financial Liabilities
Accounts payable and accrued liabilities 85,771 85,771 74,778 74,778
Loans payable 34,513 34,829 41,997 42,360
The Corporation did not have any held-to-maturity or available-for-sale financial assets at the end of the reporting periods presented.
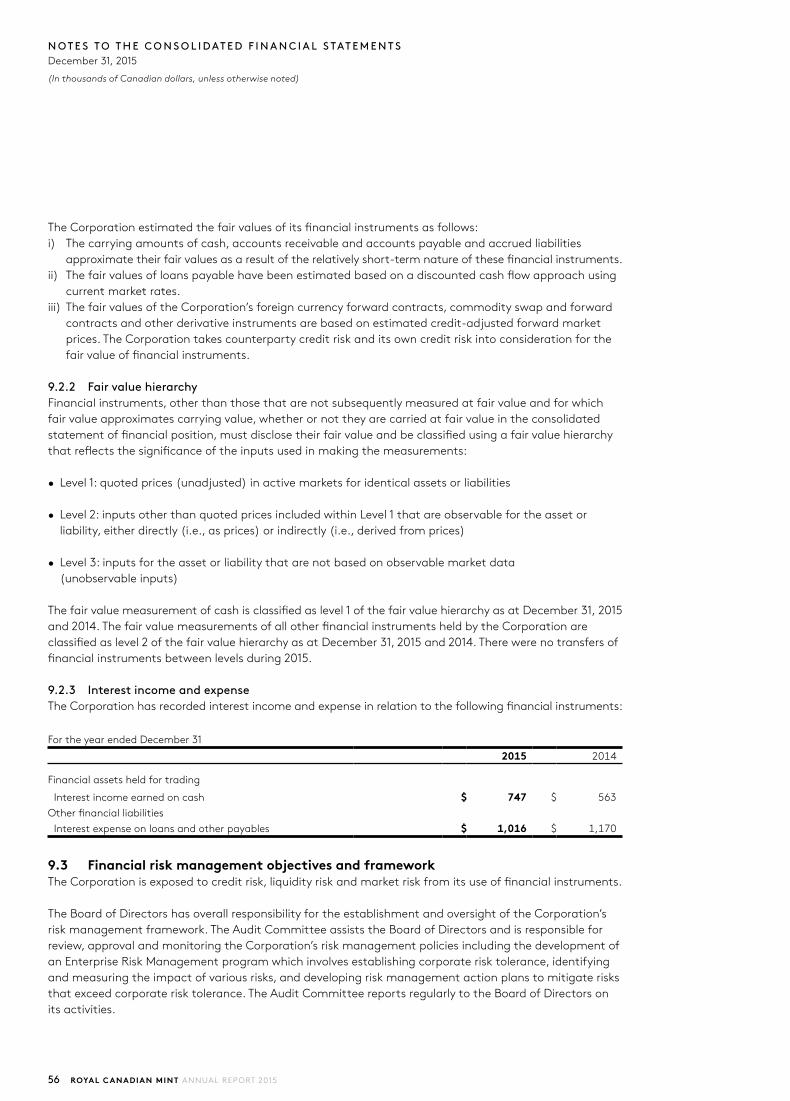
N O T E S T O T H E C O N S O L I D AT E D F I N A N C I A L S TAT E M E N T SDecember 31, 2015
(In thousands of Canadian dollars, unless otherwise noted)
56 ROYAL CANADIAN MINT ANNUAL REPORT 2015
The Corporation estimated the fair values of its financial instruments as follows:i) The carrying amounts of cash, accounts receivable and accounts payable and accrued liabilities
approximate their fair values as a result of the relatively short-term nature of these financial instruments. ii) The fair values of loans payable have been estimated based on a discounted cash flow approach using
current market rates.iii) The fair values of the Corporation’s foreign currency forward contracts, commodity swap and forward
contracts and other derivative instruments are based on estimated credit-adjusted forward market prices. The Corporation takes counterparty credit risk and its own credit risk into consideration for the fair value of financial instruments.
9.2.2 Fair value hierarchyFinancial instruments, other than those that are not subsequently measured at fair value and for which fair value approximates carrying value, whether or not they are carried at fair value in the consolidated statement of financial position, must disclose their fair value and be classified using a fair value hierarchy that reflects the significance of the inputs used in making the measurements: • Level 1: quoted prices (unadjusted) in active markets for identical assets or liabilities
• Level 2: inputs other than quoted prices included within Level 1 that are observable for the asset or liability, either directly (i.e., as prices) or indirectly (i.e., derived from prices)
• Level 3: inputs for the asset or liability that are not based on observable market data (unobservable inputs)
The fair value measurement of cash is classified as level 1 of the fair value hierarchy as at December 31, 2015 and 2014. The fair value measurements of all other financial instruments held by the Corporation are classified as level 2 of the fair value hierarchy as at December 31, 2015 and 2014. There were no transfers of financial instruments between levels during 2015.
9.2.3 Interest income and expenseThe Corporation has recorded interest income and expense in relation to the following financial instruments:
For the year ended December 31
2015 2014
Financial assets held for trading
Interest income earned on cash $ 747 $ 563
Other financial liabilities
Interest expense on loans and other payables $ 1,016 $ 1,170
9.3 Financial risk management objectives and frameworkThe Corporation is exposed to credit risk, liquidity risk and market risk from its use of financial instruments.
The Board of Directors has overall responsibility for the establishment and oversight of the Corporation’s risk management framework. The Audit Committee assists the Board of Directors and is responsible for review, approval and monitoring the Corporation’s risk management policies including the development of an Enterprise Risk Management program which involves establishing corporate risk tolerance, identifying and measuring the impact of various risks, and developing risk management action plans to mitigate risks that exceed corporate risk tolerance. The Audit Committee reports regularly to the Board of Directors on its activities.

N O T E S T O T H E C O N S O L I D AT E D F I N A N C I A L S TAT E M E N T SDecember 31, 2015
(In thousands of Canadian dollars, unless otherwise noted)
57ROYAL CANADIAN MINT ANNUAL REPORT 2015
9.3.1 Credit risk managementCredit risk is the risk of financial loss to the Corporation if a customer or counterparty to a financial instrument fails to meet its contractual obligations, and arises principally from the Corporation’s receivables from customers, cash and derivative instruments. The Corporation has adopted a policy of only dealing with creditworthy counterparties as a means of mitigating the risk of financial loss from defaults. The Corporation’s exposure and the credit ratings of its counterparties are continuously monitored.
The carrying amount of financial assets recorded in the consolidated financial statements represents the maximum credit exposure.
Accounts receivableThe Corporation’s exposure to credit risk associated with accounts receivable is influenced mainly by the individual characteristics of each customer, however the Corporation also considers the demographics of the Corporation’s customer base, including the risk associated with the type of customer and country in which customers operate.
The Corporation manages this risk by monitoring the creditworthiness of customers and obtaining pre-payment or other forms of payment security from customers with an unacceptable level of credit risk. The Corporation has established processes over contracting with foreign customers in order to manage the risk relating to foreign customers. The Corporation’s management reviews the detailed accounts receivable listing on a regular basis for changes in customer balances which could present collectability issues. An accrual is provided for accounts with collectability issues when needed.
The maximum exposure to credit risk for accounts receivable by geographic regions was as follows:
As at December 31
2015 2014
Canada $ 15,991 $ 10,574
Asia 3,054 7,649
Europe 2,204 1,809
Other 1,697 7,423
$ 22,946 $ 27,455
The maximum exposure to credit risk for accounts receivable by type of customer was as follows:
As at December 31
2015 2014
Governments (including governmental departments and agencies) $ 15,668 $ 8,040
Consumers, dealers and others 6,613 6,076
Central and institutional banks 665 13,339
Total accounts receivable $ 22,946 $ 27,455
The Corporation establishes an allowance for doubtful accounts that reflects the estimated impairment of accounts receivables. The allowance is based on specific accounts and is determined by considering the Corporation’s knowledge of the financial condition of its customers, the aging of accounts receivables, current business and geopolitical climate, customers and industry concentrations and historical experience. The Corporation sets different payment terms depending on the customer and product, which results in an average of 30 day payment terms.

N O T E S T O T H E C O N S O L I D AT E D F I N A N C I A L S TAT E M E N T SDecember 31, 2015
(In thousands of Canadian dollars, unless otherwise noted)
58 ROYAL CANADIAN MINT ANNUAL REPORT 2015
The aging of accounts receivable was as follows:
As at December 31
2015 2014
Accounts Receivable
Allowance for doubtful
accountsAccounts
Receivable
Allowance for doubtful
accounts
Current
0–30 days $ 19,450 $ - $ $17,578 $ -
30–60 days 2,012 - 4,873 -
60–90 days 350 - 2,033 -
90–120 days 908 - 1,033 -
Over 120 days 307 81 2,071 133
Total $ 23,027 $ 81 $ 27,588 $ 133
Net $ 22,946 $ 27,455
The change in the allowance for doubtful accounts was as follows:
As at December 31
2015 2014
Balance at beginning of year $ 133 $ 190
Additions - 74
Write-offs (52) (131)
Balance at end of year $ 81 $ 133
Cash The Corporation’s surplus funds are maintained in commercial bank accounts or invested to earn investment income when needed while maintaining safety of principal and providing adequate liquidity to meet cash flow requirements. The Corporation manages its credit risk relating to cash by utilizing a short-term investment policy to guide investment decisions. Investments must maintain a credit rating from at least one of the following credit agencies, meeting the following minimum criteria:
Dominion Bond Rating Service (DBRS) rating of R1 Low Moody’s rating of P1 Standard and Poor’s (S&P) rating of A1
The Corporation regularly reviews the credit rating of issuers with whom the Corporation holds investments, and disposes of investments at the prevailing market rate when the issuer’s credit rating declines below acceptable levels.
At each of the reporting dates presented, the Corporation did not hold any investments of this nature.
Derivative instrumentsCredit risk relating to foreign currency forward contracts, commodity swap and forward contracts and other derivative instruments arises from the possibility that the counterparties to the agreements may default on their respective obligations under the agreements in instances where these agreements have positive fair value for the Corporation. These counterparties are large international financial institutions and to date, no such counterparty has failed to meet its financial obligation to the Corporation. Additionally,

N O T E S T O T H E C O N S O L I D AT E D F I N A N C I A L S TAT E M E N T SDecember 31, 2015
(In thousands of Canadian dollars, unless otherwise noted)
59ROYAL CANADIAN MINT ANNUAL REPORT 2015
the Corporation manages its exposure by contracting only with creditworthy counterparties in accordance with the Minister of Finance’s Financial Risk Management Guidelines for Crown Corporations.
9.3.2 Liquidity riskLiquidity risk is the risk that the Corporation will not be able to meet its financial obligations as they fall due. The Corporation manages liquidity risk by continuously monitoring actual and forecasted cash flows to ensure, as far as possible, that it will always have sufficient liquidity to meet its liabilities when due, under both normal and stressed conditions, without incurring unacceptable losses or risking damage to the Corporation’s reputation.
The following table presents the contractual terms to maturity of non-derivative financial liabilities and derivative instruments, reflecting undiscounted net disbursements, owed by the Corporation:
As at December 31, 2015
Carrying amount
Contractual Cash flows
Less than 1 year
1 to 2 years
2 to 5 years
More than 5 years
Non-derivative financial liabilities
Accounts payable and accrued liabilities $ (85,771) $ (85,771) $ (80,640) $ (513) $ (1,539) $ (3,079)
Loans payable (34,513) (36,661) (8,229) (8,036) (14,248) (6,147)
Derivative instruments
Foreign currency forwards (14,069) 85,763 71,378 14,385 - -
As at December 31, 2014
Carrying amount
Contractual Cash flows
Less than 1 year
1 to 2 years
2 to 5 years
More than 5 years
Non-derivative financial liabilities
Accounts payable and accrued liabilities $ (74,778) $ (74,778) $ (69,134) $ (513) $ (1,539) $ (3,592)
Loans payable (41,997) (45,005) (8,382) (8,203) (19,124) (9,296)
Derivative instruments
Commodity swaps 1,692 1,692 1,692 - - -
Foreign currency forwards (3,987) 44,726 13,967 16,374 14,385 -
9.3.3 Market riskMarket risk is the risk that changes in market prices, such as foreign exchange rates, interest rates or commodity price changes will affect the Corporation’s income or the fair value of its financial instruments.
The Corporation uses derivative instruments, such as foreign currency forward contracts, interest rate exchange agreements and commodity swap and forward contracts to manage the Corporation’s exposure to fluctuations in cash flows resulting from foreign exchange risk, interest rate risk and commodity price risk. The Corporation buys and sells derivatives in the ordinary course of business and all such transactions are carried out within the guidelines set out in established policies. The Corporation’s policy is not to enter into derivative instruments for trading or speculative purposes.
N O T E S T O T H E C O N S O L I D AT E D F I N A N C I A L S TAT E M E N T SDecember 31, 2015
(In thousands of Canadian dollars, unless otherwise noted)
60 ROYAL CANADIAN MINT ANNUAL REPORT 2015
Foreign exchange riskThe Corporation is exposed to foreign exchange risk on sales and purchase transactions and short term cash management requirements that are denominated in foreign currencies, primarily in US dollar and Euros. The Corporation manages its exposure to exchange rate fluctuations between the foreign currency and the Canadian dollar by entering into foreign currency forward contracts and by applying hedge accounting to certain qualifying contracts to minimize the volatility to profit or loss. The Corporation also uses such contracts in the process of managing its overall cash requirements.
The Corporation’s exposure to foreign currency risk was as follows based on Canadian dollar equivalent amount:
As at December 31, 2015
USD EURO GBP AUD
Cash $ 11,146 $ 954 $ - $ -
Accounts receivable 7,873 6 - -
Accounts payable and accrued liabilities (9,078) (610) (308) (247)Gross exposure excluding financial
derivatives 9,941 (350) (308) (247)
Hedged forecasted sales 140,019 - - -
Hedged forecasted purchases (42,843) (885) (102) -Gross exposure 107,117 (535) (410) (247)Forward exchange contracts (99,984) - - -Net exposure $ 7,133 $ (535) $ (410) $ (247)
As at December 31, 2014
USD EURO GBP
Cash $ 4,746 $ 1,618 $ -
Accounts receivable 14,530 - -
Accounts payable and accrued liabilities (11,464) (1,433) -
Gross exposure excluding financial derivatives 7,812 185 -
Hedged forecasted sales 72,622 - -
Hedged forecasted purchases (37,123) (946) (215)
Gross exposure 43,311 (761) (215)
Forward exchange contracts (48,869) 556 -
Net exposure $ (5,558) $ (205) $ (215)
Based on the forward exchange contracts as at December 31, 2015, and assuming that all other variables remain constant, a hypothetical 10% appreciation in the Canadian dollar against the currencies above would result in increases in profit for the year by the amounts shown below. A hypothetical 10% weakening in the Canadian dollar against the currencies would have the equal but opposite effect.
For the year ended December 31
2015 2014
Other Comprehensive
Income
Profit (loss) for the period
Other Comprehensive
Income
Profit (loss) for the period
US dollars $ 5,629 $ 1,188 $ 3,336 $ (4)
Euro – – – (38)

N O T E S T O T H E C O N S O L I D AT E D F I N A N C I A L S TAT E M E N T SDecember 31, 2015
(In thousands of Canadian dollars, unless otherwise noted)
61ROYAL CANADIAN MINT ANNUAL REPORT 2015
Interest rate riskFinancial assets and financial liabilities with variable interest rates expose the Corporation to cash flow interest rate risk. There is no interest rate risk related to cash as there are no short-term investments as at the dates presented. The Corporation’s Bankers Acceptance interest rate swap loan instruments described in Note 15 expose the Corporation to cash flow interest rate risk. The Corporation has fully hedged the exposure to fluctuations in interest rates related to these instruments by entering into corresponding interest rate swaps, where the Corporation pays a fixed interest rate in exchange for receiving a floating interest rate. The interest rate swaps are designated as hedging instruments under the cash flow hedge accounting model. Financial assets and financial liabilities that bear interest at fixed rates are subject to fair value interest rate risk. The Corporation does not account for its fixed rate debt instruments as held for trading; therefore, a change in interest rates at the reporting date would not affect profit or loss with respect to these fixed rate instruments. The Corporation’s interest rate swaps expose the Corporation to fair value interest rate risk. An increase of 50 basis points in interest rates at the reporting date will increase the fair value of the swap liabilities and decrease other comprehensive income by approximately $0.4 million (2014 – $0.6 million). A decrease of 50 basis points in interest rates will have the opposite result.
Commodity price riskThe Corporation is exposed to commodity price risk on its purchase and sale of precious metals including gold, silver, platinum and palladium and base metals including nickel, copper and steel.
The Corporation is not exposed to precious metal price risk related to the bullion sales program because the purchase and sale of precious metals used in this program are completed on the same date, using the same price basis in the same currency.
For contracts that are entered into for the purpose of procuring commodities to be used in production, the Corporation applies the normal purchases classification.
The impact of commodity price risk fluctuation on the consolidated financial statements is not significant because the Corporation’s un-hedged commodity volume is not significant.
9.4 Foreign currency forwards, commodity swaps and interest rate swaps The notional and fair values of the derivative instruments designated as hedges are as follows:
As at December 31, 2015
Maturities Notional Value Fair Value
Derivative financial assets
Current
Foreign currency forwards 2016 $ 7,101 $ 510
$ 7,101 $ 510
Derivative financial liabilities
Current
Foreign currency forwards 2016 $ 63,880 $ 8,264
Interest rate swaps 2016 4,500 125
Non-current
Foreign currency forwards 2017 14,385 3,537Interest rate swaps 2022 21,000 559
$ 103,765 $ 12,485

N O T E S T O T H E C O N S O L I D AT E D F I N A N C I A L S TAT E M E N T SDecember 31, 2015
(In thousands of Canadian dollars, unless otherwise noted)
62 ROYAL CANADIAN MINT ANNUAL REPORT 2015
As at December 31, 2014
Maturities Notional Value Fair Value
Derivative financial assets
Current
Commodity swaps 2015 $ 10,901 $ 1,692
Foreign currency forwards 2015 20,484 24
Interest rate swaps 2015 3,000 -
Non-current
Interest rate swaps 2022 21,000 -
$ 55,385 $ 1,716
Derivative financial liabilities
Current
Foreign currency forwards 2015 $ 35,134 $ 2,105
Interest rate swaps 2015 1,500 35
Non-current
Foreign currency forwards 2017 30,795 1,790
Interest rate swaps 2018 4,500 106
$ 71,929 $ 4,036
The gains/losses on derivatives designated as cash flow hedges will be reclassified from accumulated other comprehensive income to profit or loss during the periods when the hedged gains/losses are realized. The amounts will be reclassified to net income over periods up to 7 years of which approximately $7.9 million losses (2014 – $0.4 million losses) will be reclassified during the next 12 months.
The notional and fair values of the derivative instruments not designated as hedges are as follows:
As at December 31, 2015
Maturities Notional Value Fair Value
Derivative financial assets
Current
Foreign currency forwards 2016 $ 15,532 $ 246
$ 15,532 $ $246
Derivative financial liabilities
Current
Foreign currency forwards 2016 $ 65,601 $ 3,025$ 65,601 $ 3,025

N O T E S T O T H E C O N S O L I D AT E D F I N A N C I A L S TAT E M E N T SDecember 31, 2015
(In thousands of Canadian dollars, unless otherwise noted)
63ROYAL CANADIAN MINT ANNUAL REPORT 2015
As at December 31, 2014
Maturities Notional Value Fair Value
Derivative financial assets
Current
Foreign currency forwards 2015 $ 26,652 $ 225
Non-current
Foreign currency forwards 2016 519 16
$ 27,171 $ 241
Derivative financial liabilities
Current
Foreign currency forwards 2015 $ 12,661 $ 307
Non-current
Foreign currency forwards 2016 485 50
$ 13,146 $ 357
For the year ended December 31, 2015, the amounts recorded in the consolidated statement of comprehensive (loss) income resulting from the net change in fair value of the derivative instruments not designated as hedges amount to a loss of $2.7 million (2014 – gain of $0.4 million). These amounts are included in net foreign exchange gains (losses).
10. Property, plant and equipment
The composition of the net book value of the Corporation’s property, plant and equipment, is presented in the following tables:
As at December 31
2015 2014
Cost $ 407,413 $ 409,035
Accumulated depreciation (234,816) (167,385)
Net book value $ 172,597 $ 241,650
Net book value by asset class
Land and land improvements $ 2,922 $ 3,139
Buildings and improvements 93,302 132,760
Equipment 73,215 96,018
In process capital projects 3,158 9,733
Net book value $ 172,597 $ 241,650

N O T E S T O T H E C O N S O L I D AT E D F I N A N C I A L S TAT E M E N T SDecember 31, 2015
(In thousands of Canadian dollars, unless otherwise noted)
64 ROYAL CANADIAN MINT ANNUAL REPORT 2015
Reconciliation of the opening and closing balances of property, plant and equipment for 2015:
Land and land improvements
Buildings and improvements Equipment
Capital projects in process Total
Cost
Balance at December 31, 2013 $ 4,094 $ 141,120 $ 233,542 $ 11,041 $ 389,797
Additions - 6,574 6,892 8,091 21,557
Transfers - 2,968 6,431 (9,399) -
Disposals - (422) (1,897) - (2,319)
Balance at December 31, 2014 4,094 150,240 244,968 9,733 409,035
Additions - 3,451 7,899 2,890 14,240
Transfers - 2,003 7,462 (9,465) -
Derecognition - - (11,398) - (11,398)
Disposals - - (4,464) - (4,464)Balance at
December 31, 2015 $ 4,094 $ 155,694 $ 244,467 $ 3,158 $ 407,413
Accumulated depreciation
Balance at December 31, 2013 $ 951 $ 12,087 $ 138,544 $ - $ 151,582
Depreciation 4 5,428 12,074 - 17,506
Disposals - (35) (1,668) - (1,703)
Balance at December 31, 2014 955 17,480 148,950 - 167,385
Depreciation (8) 5,622 11,519 - 17,133
Derecognition - - (11,398) - (11,398)
Disposals - - (3,213) - (3,213)Impairment (Note 13) 225 39,290 25,394 - 64,909Balance at
December 31, 2015 $ 1,172 $ 62,392 $ 171,252 $ - $ 234,816Net book value at
December 31, 2015 $ 2,922 $ 93,302 $ 73,215 $ 3,158 $ 172,597
No asset is pledged as security for borrowings as at December 31, 2015 or 2014.

N O T E S T O T H E C O N S O L I D AT E D F I N A N C I A L S TAT E M E N T SDecember 31, 2015
(In thousands of Canadian dollars, unless otherwise noted)
65ROYAL CANADIAN MINT ANNUAL REPORT 2015
11. Investment property
As at December 31
2015 2014
Cost $ 236 $ 236
The fair value of the land is $2.6 million. The fair value measurement of the investment property is classified as level 2 of the fair value hierarchy (see Note 9.2.2 for definitions). The valuation was performed using a market approach using market prices for similar properties in the relevant location as observable inputs. A new valuation will be carried out when there is significant change in the market price.
No indicators of impairment were found for investment property as at December 31, 2015 or 2014.
The Corporation’s investment property is held under freehold interests.
12. Intangible assets
As at December 31
2015 2014
Cost $ 29,589 $ 41,565
Accumulated amortization (14,378) (24,115)
Net book value $ 15,211 $ 17,450
The Corporation’s intangible assets contain mainly purchased software for internal use or for providing services to customers. Useful lives of certain software were extended from 5 years to 7 years based on management’s estimates during the annual useful life review resulting in a reduction of amortization in 2015 of approximately of $1.1 million.

N O T E S T O T H E C O N S O L I D AT E D F I N A N C I A L S TAT E M E N T SDecember 31, 2015
(In thousands of Canadian dollars, unless otherwise noted)
66 ROYAL CANADIAN MINT ANNUAL REPORT 2015
Reconciliation of the opening and closing balances of intangibles for 2015:
Software Value-in-kind
Capital projects in
process Total
Cost
Balance at December 31, 2013 $ 24,495 $ - $ 13,256 $ 37,751
Additions 2,923 - 891 3,814
Transfers 13,128 - (13,128) -
Balance at December 31, 2014 40,546 - 1,019 41,565
Additions 758 1,362 1,046 3,166Transfers 584 - (584) -Derecognition (13,780) (1,362) - (15,142)Balance at December 31, 2015 $ 28,108 $ - $ 1,481 $ 29,589
Accumulated amortization
Balance at December 31, 2013 $ 20,565 $ - $ - $ 20,565
Depreciation 3,550 - - 3,550
Balance at December 31, 2014 24,115 - - 24,115
Amortization 3,440 1,362 - 4,802Derecognition (13,780) (1,362) - (15,142)Impairment (Note 13) 603 - - 603Balance at December 31, 2015 $ 14,378 $ - $ - $ 14,378
Net book value at December 31, 2015 $ 13,730 $ - $ 1,481 $ 15,211
13. Impairment of capital assets
At the end of each reporting period, the Corporation assesses whether there are events or circumstances indicating that an asset may be impaired. According to IAS36 Impairment of Assets, such events or circumstances notably include material adverse changes which in the long-term impact the economic environment or the Corporation’s assumptions or objectives.
As a result of the Corporation’s strategic review, the Corporation performed tests of impairment after indicators of impairment were observed related to the two of its three cash generating units (CGUs), Circulation and Refinery. The Corporation used the value in use method to estimate the recoverable amount of the tangible and intangible assets for the two CGUs that displayed impairment indicators. The impairment review concluded that the Refinery CGU was not impaired however the Circulation CGU was impaired.
The Circulation CGU is composed of the Canadian Circulation Program and the Circulation Products and Solution business. The Corporation identified the recent decline in the Circulation CGU’s revenues, the generation of operating losses and the decrease in cash inflows from operations as indicators of impairment.
As a result of the impairment test, the Corporation has recorded an impairment loss in the third quarter of 2015 in the amount of $65.5 million. The impairment losses are included in operating expenses on the consolidated statement of comprehensive (loss) income.

N O T E S T O T H E C O N S O L I D AT E D F I N A N C I A L S TAT E M E N T SDecember 31, 2015
(In thousands of Canadian dollars, unless otherwise noted)
67ROYAL CANADIAN MINT ANNUAL REPORT 2015
Impact to property, plant and equipment (CAD $ millions)
Impairment
Land, building and improvements 39.5
Equipment 25.4
Intangible 0.6
Total impairment $ 65.5
The recoverable amount of the CGU was determined based on the value in use method, generally determined using the Company’s forecasted future net cash inflows in a discounted cash flow model. The recoverable amount is greater than half of the carrying value of the circulation assets prior to the impairment charge. The estimated future cash inflows for the first 5 years, including the terminal amount are based on the corporate and strategic plan developed in 2015.
The forecasted future net cash inflows are based on the non-profit financials for Canadian Circulation program as well as management’s estimate of Circulation Products and Solutions future sales under existing firm orders and expected future orders adjusted for any future currency and base metal price movements after 2015, procurement costs based on existing contracts with suppliers, normalized future labour costs, general market conditions, increases or decreases in non-cash working capital and a sustained level of capital expenditures in future periods.
Another estimate used to determine the recoverable amount includes the applicable discount rate. The inputs used in the discounted cash flow model are Level 3 inputs (inputs that are not based on observable market data).
The discount rate used to discount the future cash flows under the value in use method was calculated using a weighted average cost of capital of 12% determined to be the midpoint of the range calculated using the build-up method. This method incorporates risk premiums to arrive at a risk adjusted rate.
The key assumptions in determining the discount rate under the build up method were:• A cost of equity was calculated in the range of 18.9% to 19.9% as no publically traded companies exist
that are in a coin circulation business similar to the Corporation; • The pre-tax cost of debt was calculated in the range of 4.7% to 5.7% using the Bank of Canada prime
rate plus a company specific premium of 2.0% to 3.0%; • A debt-to-capital weighting in the range of 45% to 50% was used, which approximates notional debt of
2.0 to 2.5 times of 2015 net earnings; and• A 0% growth rate was considered when determining the terminal value.
In regards to the impact on income taxes, the $65.5 million of impairment losses increases the deductible temporary difference by the same amount, resulting in an increase in the deferred tax asset. This results in a deferred tax recovery of approximately $16.4 million at the applicable tax rate of 25% which is offset by the deferred tax liability (Note 17).
Sensitivity AnalysisThe following analyses are presented in isolation from one another i.e. all other estimates left unchanged:
A 10% decrease or increase in the expected future net cash inflows for the Circulation CGU evenly distributed over future periods, would result in an additional impairment loss or the reduction of the impairment loss by approximately $8.4 million in 2015.

N O T E S T O T H E C O N S O L I D AT E D F I N A N C I A L S TAT E M E N T SDecember 31, 2015
(In thousands of Canadian dollars, unless otherwise noted)
68 ROYAL CANADIAN MINT ANNUAL REPORT 2015
An increase of 100-basis points in the discount rate used to perform the impairment test would result in an additional impairment loss of approximately $5.9 million in 2015.
A decrease of 100-basis points in the discount rate used to perform the impairment test would result in a decrease in the impairment loss of approximately $7.0 million in 2015.
14. Accounts payable and accrued liabilities
As at December 31
2015 2014
Canadian dollars $ 75,522 $ 61,881
US dollars 9,078 11,464
Euros 610 1,433
Other currencies 561 -
Total accounts payable and accrued liabilities $ 85,771 $ 74,778
Accrued liabilities include the liability to Department of Finance which is disclosed in Note 23 in detail.
Included in accrued liabilities at December 31, 2015 is a $2.0 million (2014 – $1.8 million) provision for estimated sales returns and allowances. During the year the provision was reduced by $2.5 million for actual sales returns and increased by $2.7 million for estimated sales returns based on 2015 sales revenue.
15. Loans payable
As at December 31
2015 2014
Loans $ 34,487 $ 41,975
Accrued interest 26 22
Total loans payable $ 34,513 $ 41,997
Current $ 7,526 $ 7,522
Non-current 26,987 34,475
Total loans payable $ 34,513 $ 41,997
The loans payable are unsecured and consist of the following borrowing facilities:
A 10 year $15 million Bankers’ Acceptance/Interest rate swap loan bearing an interest rate at 2.67% with maturity in 2018. The Corporation hedges the loan for interest rate risk via an interest rate swap exchanging fixed rate interest for variable rate interest. The structure of the loan involves the use of a revolving 3 month Bankers Acceptances and an Interest Rate Swap to lock in the BA refinancing. The loan gets paid down $1.5 million per year for 10 years. As at December 31, 2015 the balance of the principal is $4.5 million (2014 – $6.0 million) and the fair value of the Bankers’ Acceptance is $4.5 million (2014 – $6.0 million).

N O T E S T O T H E C O N S O L I D AT E D F I N A N C I A L S TAT E M E N T SDecember 31, 2015
(In thousands of Canadian dollars, unless otherwise noted)
69ROYAL CANADIAN MINT ANNUAL REPORT 2015
A 10 year $30 million Bankers’ Acceptance/Interest rate swap loan bearing an interest rate at 2.06% with maturity in 2022. The Corporation hedges the loan for interest rate risk via an interest rate swap exchanging fixed rate interest for variable rate interest. The structure of the loan involves the use of a revolving 1 month Bankers Acceptances and an Interest Rate Swap to lock in the BA refinancing. The loan gets paid down $3 million per year for 10 years. As at December 31, 2015 the balance of the principal is $21.0 million (2014 – $24.0 million) and the fair value of the Bankers’ Acceptance is $21.0 million (2014 – $24 million).
A 5 year $15 million loan bearing a fixed interest rate of 2.35% with maturity in 2018. Interest payments are paid semi-annually and the loan gets paid down $3 million per year for 5 years. As at December 31, 2015 the balance of the principal is $9.0 million (2014 – $12.0 million) and the fair value of the loan is $9.3 million (2014 – $12.4 million).
16. Deferred revenue
As at December 31
2015 2014
Customer prepayment $ 8,656 $ 1,209
Total deferred revenue $ 8,656 $ 1,209
The deferred revenue arises when customers prepay the cost of purchasing materials in order to lock the purchasing price, primarily of the metals. The deferred revenue will be recognized as revenue when the shipments are made.
17. Income taxes
Current tax expense
For the year ended December 31
2015 2014
Current income tax expense $ 14,612 $ 11,686
Foreign taxes expense 10 889
Adjustments for prior years 120 (212)
Total current tax expense $ 14,742 $ 12,363
For the year ended December 31
2015 2014
Origination and reversal of temporary differences $ (14,951) $ 2,618
Adjustments for prior years 23 (98)
Total deferred tax (recovery) expense $ (14,928) $ 2,520

N O T E S T O T H E C O N S O L I D AT E D F I N A N C I A L S TAT E M E N T SDecember 31, 2015
(In thousands of Canadian dollars, unless otherwise noted)
70 ROYAL CANADIAN MINT ANNUAL REPORT 2015
Income tax expense on profit before income tax differs from the amount that would be computed by applying the Federal statutory income tax rate of 25% (2014 – 25%). The expense for the year can be reconciled to the accounting profit before tax as follows:
For the year ended December 31
2015 2014
Net (loss) income before tax for the year $ (503) $ 56,137
Income tax rate 25.0% 25.0%
Computed tax (recovery) expense (126) 14,034
Non-deductible (recovery) expense (458) 280
Impact of foreign taxes 222 889
Adjustments for prior years 120 (310)
Other net amounts 56 (10)
Income tax (recovery) expense recognised in profit or loss $ (186) $ 14,883
Deferred tax recognized in other comprehensive incomeThe tax effects of temporary differences that give rise to deferred tax assets and liabilities in 2015 and 2014 are presented below:
For the year ended December 31
2015 2014
Before taxTax (expense)
benefit Net of Tax Before taxTax (expense)
benefit Net of Tax
Net unrealised gains (losses) on cash flow hedges $ (9,477) $ 2,369 $ (7,108) $ (5,530) $ 1,691 $ (3,839)
Reclassification of net realised losses on cash flow hedges transferred from other comprehensive income 2,511 (628) 1,883 5,370 (1,343) 4,027
Net actuarial gains (losses) on defined benefit plan 736 (184) 552 (1,082) 270 (812)
Total $ (6,230) $ 1,557 $ (4,673) $ (1,242) $ 618 $ (624)

N O T E S T O T H E C O N S O L I D AT E D F I N A N C I A L S TAT E M E N T SDecember 31, 2015
(In thousands of Canadian dollars, unless otherwise noted)
71ROYAL CANADIAN MINT ANNUAL REPORT 2015
The tax effects of temporary differences that give rise to deferred tax assets and liabilities in 2015 and 2014 are presented below:
As at December 31, 2015
Opening balance
Recognized in profit or (loss)
Recognized in OCI
Closing balance
Deferred tax assets
Employee benefits $ 3,173 $ 300 $ (184) $ 3,289Accounts payable 1,727 425 - 2,152Derivative financial assets 581 (496) 2,910 2,995Deferred tax liability
Capital assets (19,157) 14,192 - (4,965)Intangible assets (4,359) 564 - (3,795)Derivative financial liability - - - -Investment property - - - -Investment tax credits (183) (57) - (240)Net deferred tax liability $ (18,218) $ (14,928) $ 2,726 $ (564)
As at December 31, 2014
Opening balance
Recognized in profit or (loss)
Recognized in OCI
Closing balance
Deferred tax assets
Employee benefits $ 2,959 $ (56) $ 270 $ 3,173
Accounts payable 1,792 (65) - 1,727
Derivative financial assets 220 - 361 581
Deferred tax liability
Capital assets (16,827) (2,330) - (19,157)
Intangible assets (4,293) (66) - (4,359)
Investment tax credits (180) (3) - (183)
Net deferred tax liability $ (16,329) $ (2,520) $ 631 $ (18,218)
18. Employee benefits
i) Pension benefitsSubstantially all of the employees of the Corporation are covered by the Public Service Pension plan (the “Plan”), a contributory defined benefit plan established through legislation and sponsored by the Government of Canada. Contributions are required by both the employees and the Corporation. The President of the Treasury Board of Canada sets the required employer contributions based on a multiple of the employee’s required contribution. The required employer contribution rate for 2015 was dependent on the employee’s employment start date. For employment start dates before January 1, 2013, the Corporation’s contribution rate was 1.28 times (2014 – 1.45) the employee’s contribution; and for employment start dates after December 31, 2012, the Corporation’s contribution rate was also 1.28 (2014 – 1.43) times the employee’s contribution.
The Corporation made total contributions of $11.5 million in 2015 (2014 – $11.9 million). The estimated contribution for 2016 is $12.1 million.

N O T E S T O T H E C O N S O L I D AT E D F I N A N C I A L S TAT E M E N T SDecember 31, 2015
(In thousands of Canadian dollars, unless otherwise noted)
72 ROYAL CANADIAN MINT ANNUAL REPORT 2015
The Government of Canada holds a statutory obligation for the payment of benefits relating to the Plan. Pension benefits generally accrue up to a maximum period of 35 years at an annual rate of 2 percent of pensionable service times the average of the best five consecutive years of earnings. The benefits are coordinated with Canada/Québec Pension Plan benefits and they are indexed to inflation.
ii) Other post-employment benefitsThe Corporation provides severance benefits to its employees and also provides supplementary retirement benefits including post-retirement benefits and post-retirement insurance benefits to certain employees. The benefits are accrued as the employees render the services necessary to earn them. These benefits plans are unfunded and thus have no assets, resulting in a plan deficit equal to the accrued benefit obligation.
iii) Other long-term employee benefitsThe Corporation’s other long-term benefits include benefits for employees in receipt of long-term disability benefits, sick leave and special leave benefits and worker’s compensation benefits. These benefits plans are unfunded and thus have no assets, resulting in a plan deficit equal to the accrued benefit obligation.
Employee benefits obligation at reporting date:
As at December 31
2015 2014
Post employment benefits $ 9,863 $ 10,157
Other long-term employee benefits 3,273 2,542
Total employee benefits obligation $ 13,136 $ 12,699
Movements of employee benefits obligation were as follows:
For the year ended December 31
Post employment benefitsOther long-term
employment benefits
2015 2014 2015 2014
Beginning of the year $ 10,157 $ 9,053 $ 2,542 $ 2,785
Current service cost 647 561 2,601 2,632
Interest cost 390 411 91 114
Benefits paid (595) (950) (3,272) (3,330)
Actuarial losses/(gains) from demographic assumptions (571) 136 1,314 291
Actuarial losses/(gains) from financial assumptions (165) 946 (3) 50
End of the year $ 9,863 $ 10,157 $ 3,273 $ 2,542

N O T E S T O T H E C O N S O L I D AT E D F I N A N C I A L S TAT E M E N T SDecember 31, 2015
(In thousands of Canadian dollars, unless otherwise noted)
73ROYAL CANADIAN MINT ANNUAL REPORT 2015
Included in actuarial losses/(gains) from demographic assumptions are the experience adjustments, which is the effect of differences between the previous actuarial assumptions and what has actually occurred, and the effects of changes in actuarial assumptions.
Included in the actuarial gains from financial assumptions are the adjustments due to the effect of the discount rate applied to the employee benefits obligation.
Employee benefits expenses were as follows:
For the year ended December 31
2015 2014
Pension benefits contribution $ 11,530 $ 11,856
Other post employment benefits (294) 1,105
Other long-term employee benefits 731 (243)
Total employee benefits expenses $ 11,967 $ 12,718
The principal actuarial assumptions used at the end of the reporting period were as follows (weighted average):
As at December 31
2015 2014
Accrued benefit obligation
Discount rate 3.5% 3.5%
Rate of compensation increase 2.5% 3.0%
Benefit costs for the year ended
Discount rate 3.5% 4.2%
Rate of compensation increase 3.0% 3.0%
Assumed health care cost trend rates
Initial health care cost trend rate 6.0% 6.4%
Cost trend rate declines to 4.9% 5.0%
If all other assumptions are held constant, a hypothetical increase of one percentage point in the following assumed rates will increase (decrease) the current service cost, interest cost and defined benefit obligation by the amount in the table below. The effect of a hypothetical decrease of one percentage point in the assumed rates will have approximately the opposite result.

N O T E S T O T H E C O N S O L I D AT E D F I N A N C I A L S TAT E M E N T SDecember 31, 2015
(In thousands of Canadian dollars, unless otherwise noted)
74 ROYAL CANADIAN MINT ANNUAL REPORT 2015
For the year ended December 31
2015 2014
Medical cost trend rates:
Current service cost and interest cost $ 100 $ 63
Defined benefit obligation 525 465
Discount rates:
Current service cost and interest cost $ (41) $ (18)
Defined benefit obligation (1,304) (1,282)
Salary rates:
Current service cost and interest cost $ 82 $ 88
Defined benefit obligation 535 535
The weighted average duration of the defined benefit obligation is 10 years. The distribution of the timing of benefit payments is shown in the table below:
For the year ended December 31, 2015
Within 1 Year 2 to 5 Years 5 to 10 Years
Expected pension benefit payments $ 3,713 $ 4,388 $ 4,380
For the year ended December 31, 2014
Within 1 Year 2 to 5 Years 5 to 10 Years
Expected pension benefit payments $ 1,304 $ 4,208 $ 4,235
19. Revenue
For the year ended December 31
2015 2014
Revenue from the sale of goods $ 2,958,577 $ 2,426,000
Revenue from the rendering of services 15,571 17,414
Total Revenue $ 2,974,148 $ 2,443,414
20. Depreciation and amortization expenses
For the year ended December 31
2015 2014
Depreciation of property, plant and equipment $ 17,133 $ 17,506
Amortization of intangible assets 4,802 3,550
Total depreciation and amortization expenses $ 21,935 $ 21,056

N O T E S T O T H E C O N S O L I D AT E D F I N A N C I A L S TAT E M E N T SDecember 31, 2015
(In thousands of Canadian dollars, unless otherwise noted)
75ROYAL CANADIAN MINT ANNUAL REPORT 2015
Depreciation and amortization expenses were reclassified to operating expenses as follows:
For the year ended December 31
2015 2014
Cost of sales $ 14,082 $ 14,645
Marketing and sales expenses 3,966 2,564
Administration expenses 3,887 3,847
Total depreciation and amortization expenses $ 21,935 $ 21,056
21. Employee compensation expenses
For the year ended December 31
2015 2014
Included in cost of sales:
Salaries and wages including short term employee benefits $ 37,285 $ 37,783
Pension costs 5,359 5,594
Long term employee benefits and Post-employment benefits other than pensions 3,020 2,382
Termination benefits 384 -
Included in marketing and sale expenses:
Salaries and wages including short term employee benefits 19,054 18,426
Pension costs 1,943 1,902
Long term employee benefits and Post-employment benefits other than pensions 673 593
Termination benefits 1,692 -
Included in cost of administration:
Salaries and wages including short term employee benefits 28,866 29,048
Pension costs 4,411 3,658
Long term employee benefits and Post-employment benefits other than pensions 1,353 1,369
Termination benefits 2,339 989
Total employee compensation and benefits expense $ 106,379 $ 101,744
Included in the termination benefits $2.8 million was recorded in 2015 related to involuntary terminations due to the reorganization. Details of the reorganization related costs are set out in Note 24.
22. Scientific research and experimental development expenses, net
For the year ended December 31
2015 2014
Research and development expenses $ 6,774 $ 9,624
Scientific research and development investment tax credit (1,126) (766)
Research and development expenses, net $ 5,648 $ 8,858
The net expenses of research and development are included in the administration expenses in the consolidated statement of comprehensive (loss) income.

N O T E S T O T H E C O N S O L I D AT E D F I N A N C I A L S TAT E M E N T SDecember 31, 2015
(In thousands of Canadian dollars, unless otherwise noted)
76 ROYAL CANADIAN MINT ANNUAL REPORT 2015
23. Related party transactions
Government of CanadaThe Corporation is related in terms of common ownership to all Government of Canada owned entities. The Corporation enters into transactions with these entities in the normal course of business, under the same terms and conditions that apply to unrelated parties. In accordance with disclosure exemption regarding “government related entities”, the Corporation is exempt from certain disclosure requirements of IAS 24 relating to its transactions and outstanding balances with:
• a government that has control, joint control or significant influence over the reporting entity; and• another entity that is a related party because the same government has control, joint control or
significant influence over both the reporting entity and the other entity.
Transactions with related parties that are considered to be individually or collectively significant, include transactions with the Government of Canada, and departments thereof and all federal Crown corporations.
The majority of transactions with the Government of Canada were with the Department of Finance (“DOF”) related to the production, management and delivery of Canadian circulation coins which are negotiated and measured at fair value under a three year Memorandum of Understanding, where pricing is agreed annually in the normal course of operations.
The revenue related to the transactions with Department of Finance are as follows:
For the year ended December 31
2015 2014
Revenue from DOF $ 94,340 $ 104,144
For the year ended December 31
2015 2014
Receivable from DOF $ 8,110 $ 2,068
During the year, the majority of transactions with Crown corporations were for the sales of numismatic product.
Due to the retrospective application of IAS 16 at the date of transition to IFRS on January 1st, 2010, depreciation expenses that have been charged under Canadian GAAP to the Department of Finance at a rate in excess of actual depreciation expenses incurred under IAS 16 have been adjusted by the amount of $8.2 million at that time. This amount was included in Accounts Payable and Accrued Liabilities on the consolidated statement of financial position since it could be reimbursable on demand to DOF. During 2015, the Corporation reduced the billing to the Department of Finance by $0.5 million (2014 – $0.5 million) and the remainder of $5.7 million (2014 – $6.2 million) will be deducted in future billings over the next 11 years.
Key management personnelKey management personnel include all members of the Board of Directors and executive officers including all VPs, who have the authorities and responsibilities for planning, directing and controlling the activities of the Corporation.

N O T E S T O T H E C O N S O L I D AT E D F I N A N C I A L S TAT E M E N T SDecember 31, 2015
(In thousands of Canadian dollars, unless otherwise noted)
77ROYAL CANADIAN MINT ANNUAL REPORT 2015
Compensation of key management personnel was as follows:
For the year ended December 31
2015 2014
Wages, bonus and short-term benefits $ 2,979 $ 3,428
Post-employment and termination benefits 2,653 2,152
Other long-term benefits 101 102
Total compensation $ 5,733 $ 5,682
24. Reorganization
In mid-2015, the Corporation conducted a strategy review to identify opportunities to maximize profitable growth and adapt to the changing market. The review was completed in the third quarter. As a result, the Corporation reorganized its organizational structure in October 2015. Employees impacted as a result of the reorganization were offered severance or other internal job opportunities, as appropriate. The total cost related to involuntary terminations expensed in 2015 is approximately $2.8 million. Out of the $2.8 million cost, $0.4 million was included in the cost of sales, $1.7 million was included in the marketing and sales expenses and $0.7 million was included in the administration expenses. The majority of the severance amounts were paid in 2015 and the remainder will be paid in the first half year of 2016.
25. Divestiture of MintChipTM
MintChip™ project was launched in 2012. In February 2014, it was decided that further development and commercialization of MintChip™ should be accomplished through the private sector. In December 2015, the Company closed the sale of MintChip™ for a cash consideration of $5 million paid at closing and an $11 million, 4% interest-bearing, secured promissory note with interest payments due semi-annually and the principal amount due on December 16, 2022. The cash paid at closing as well as repayments of principal net of taxes and fees will be returned to the Government of Canada through incremental dividend payments the year following the cash being received.
The sale resulted in other income of $3.75 million, net of tax ($5 million pre-tax) and was presented as part of net loss from continuing operations in the consolidated statement of comprehensive (loss) income for the year ended December 31, 2015. Due to uncertainty over the collectability of the promissory note, no asset has been recorded in the consolidated financial statements and any additional future consideration related to interest and principal repayments will be recognized as other income upon receipt of cash.
26. Commitments, contingencies and guarantees
26.1 Precious metal leasesIn order to facilitate the production of precious metal coins and manage the risks associated with changes in metal prices, the Corporation may enter into firm fixed price purchase commitments, as well as precious metals leases. As at December 31, 2015 the Corporation had $47.0 million outstanding precious metal purchase commitments (2014 – $26.8 million).

N O T E S T O T H E C O N S O L I D AT E D F I N A N C I A L S TAT E M E N T SDecember 31, 2015
(In thousands of Canadian dollars, unless otherwise noted)
78 ROYAL CANADIAN MINT ANNUAL REPORT 2015
At the end of the period, the Corporation had entered into precious metal leases as follows:
As at December 31 (ounces)
2015 2014
Gold 321,747 31,564
Silver 6,746,665 6,640,171
Palladium 8,594 465
Platinum 13,042 6,763
The fees for these leases are based on market value. The precious metal lease payment expensed for 2015 is $5.1 million (2014 – $2.4 million). The value of the metals under these leases has not been reflected in the Corporation’s consolidated financial statements since the Corporation intends to settle these commitments through receipt or delivery of the underlying metal.
26.2 Base metal commitments In order to facilitate the production of circulation and non-circulation coins (for Canada and other countries) and manage the risks associated with changes in metal prices, the Corporation may enter into firm fixed-price purchase commitments. As at December 31, 2015, the Corporation had $22.5 million (2014 – $21.8 million) in purchase commitments outstanding.
26.3 Trade finance bonds and bank guarantees The Corporation has various outstanding bank guarantees and trade finance bonds associated with the production of foreign circulation coin contracts. These were issued in the normal course of business. The guarantees and bonds are delivered under standby facilities available to the Corporation through various financial institutions. Performance guarantees generally have a term up to one year depending on the applicable contract, while warranty guarantees can last up to five years. Bid bonds generally have a term of less than three months, depending on the length of the bid period for the applicable contract. The various contracts to which these guarantees or bid bonds apply generally have terms ranging from one to two years. Any potential payments which might become due under these commitments would relate to the Corporation’s non-performance under the applicable contract. The Corporation does not anticipate any material payments will be required in the future. As at December 31, 2015, under the guarantees and bid bonds, the maximum potential amount of future payments is $14.4 million (December 31, 2014 – $10.0 million).
26.4 Other commitments, guarantees and contingenciesThe Corporation may borrow money from the Consolidated Revenue Fund or any other source, subject to the approval of the Minister of Finance with respect to the time and terms and conditions. Since March 1999, following the enactment of changes to the Royal Canadian Mint Act, the aggregate of the amounts loaned to the Corporation and outstanding at any time shall not exceed $75 million. For the year ended December 31, 2015, approved short-term borrowings for working capital within this limit, were not to exceed $15.0 million (2014 – $25.0 million). The short term borrowing is restricted to USD overdraft coverage for clearing and settlement delays related to coinage and bullion sales.
To support such short-term borrowings as may be required from time to time, the Corporation has various commercial borrowing lines of credit, made available to it by Canadian financial institutions. These lines are unsecured and provide for borrowings up to 364 days in term based on negotiated rates. No amounts were borrowed under these lines of credit as at December 31, 2015 or 2014.
The Corporation has committed as at December 31, 2015 to spend approximately $4.3 million (December 31, 2014 – $12.8 million) on capital projects.

N O T E S T O T H E C O N S O L I D AT E D F I N A N C I A L S TAT E M E N T SDecember 31, 2015
(In thousands of Canadian dollars, unless otherwise noted)
79ROYAL CANADIAN MINT ANNUAL REPORT 2015
Total estimated minimum remaining future commitments are as follows:
As at December 31
2016 2017 2018 2019 20202021 and
Thereafter Total
Operating Leases $ 3,336 $ 3,429 $ 3,342 $ 2,231 $ 2,000 $ 7,575 $ 21,913
Other Commitments (no leases) 40,149 486 277 72 37 50 41,071
Total $ 43,485 $ 3,915 $ 3,619 $ 2,303 $ 2,037 $ 7,625 $ 62,984
There are various legal claims against the Corporation. Claims that are uncertain in terms of the outcome or potential outflow or that are not measurable are considered to be a contingency and are not recorded in the Corporation’s consolidated financial statements. $0.7 million provision for potential legal obligations is included in accounts payable and accrued liabilities (Note 14) as at December 31, 2015 (December 31, 2014 – $0.6 million). The amount and timing of the settlement of the provision is uncertain.
There have been no other material changes to the Corporation’s commitments, contingencies and guarantees since December 31, 2014.

EXECUTIVE OFFICERS
John MooreVice-President, Sales
Jennifer Camelon, CPA, CAChief Financial Officer and Vice-President of Finance and Administration
Simon KamelVice-President, General Counsel and Corporate Secretary, Corporate and Legal Affairs
Sandra L. Hanington, ICD.DPresident andChief Executive Officer
Michel BoucherVice-President, Human Resources and Quality Systems
Sean ByrneVice-President, Operations
80 ROYAL CANADIAN MINT ANNUAL REPORT 2015

BOUTIQUE LOCATIONS
Ottawa320 Sussex DriveOttawa, Ontario Canada K1A 0G8 613-933-8990
Winnipeg520 Lagimodière BoulevardWinnipeg, Manitoba Canada R2J 3E7204-983-6429
Vancouver 752 Granville StreetVancouver, British Columbia Canada V6Z 1A1604-681-6772
Visit our online store for a full selection of products at www.mint.ca
HEAD OFFICE AND OTTAWA PLANT
Royal Canadian Mint320 Sussex DriveOttawa, OntarioCanada K1A 0G8 613-993-3500
WINNIPEG PLANT
Royal Canadian Mint520 Lagimodière Boulevard Winnipeg, ManitobaCanada R2J 3E7204-983-6400

REMEMBERING THE PA ST


