Fó - World Meteorological Organization · 2012-01-09 · sink regions for the major anthropogenic...
32
Transcript of Fó - World Meteorological Organization · 2012-01-09 · sink regions for the major anthropogenic...


(
(
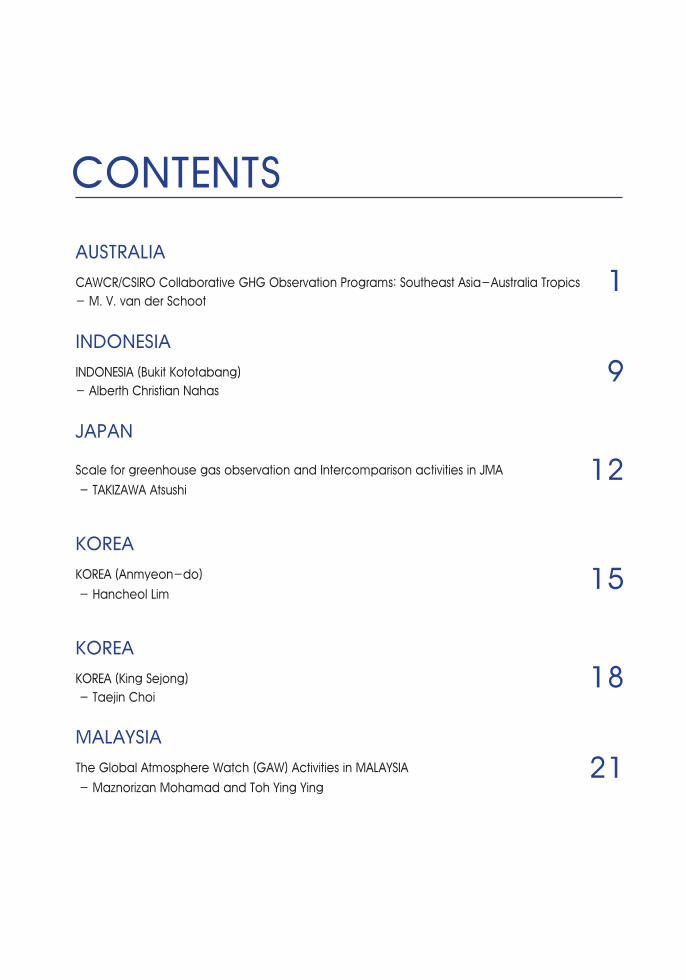
AUSTRALIA
CAWCR/CSIROCollaborativeGHGObservationPrograms:SoutheastAsia-AustraliaTropics
-M.V.vanderSchoot
INDONESIA
INDONESIA(BukitKototabang)
-AlberthChristianNahas
JAPAN
ScaleforgreenhousegasobservationandIntercomparisonactivitiesinJMA
-TAKIZAWAAtsushi
KOREA
KOREA(Anmyeon-do)
-HancheolLim
KOREA
KOREA(KingSejong)
-TaejinChoi
MALAYSIA
TheGlobalAtmosphereWatch(GAW)ActivitiesinMALAYSIA
-MaznorizanMohamadandTohYingYing
1
9
12
15
18
21
CONTENTS

(
(
Volume No.2, December, 2011 1
AUSTRALIA
CAWCR/CSIRO Collaborative GHG Observation Programs: Southeast Asia-Australia
Tropics
M. V. van der Schoot (Centre for Australian Weather and Climate Research, CSIRO Marine and Atmospheric Research)
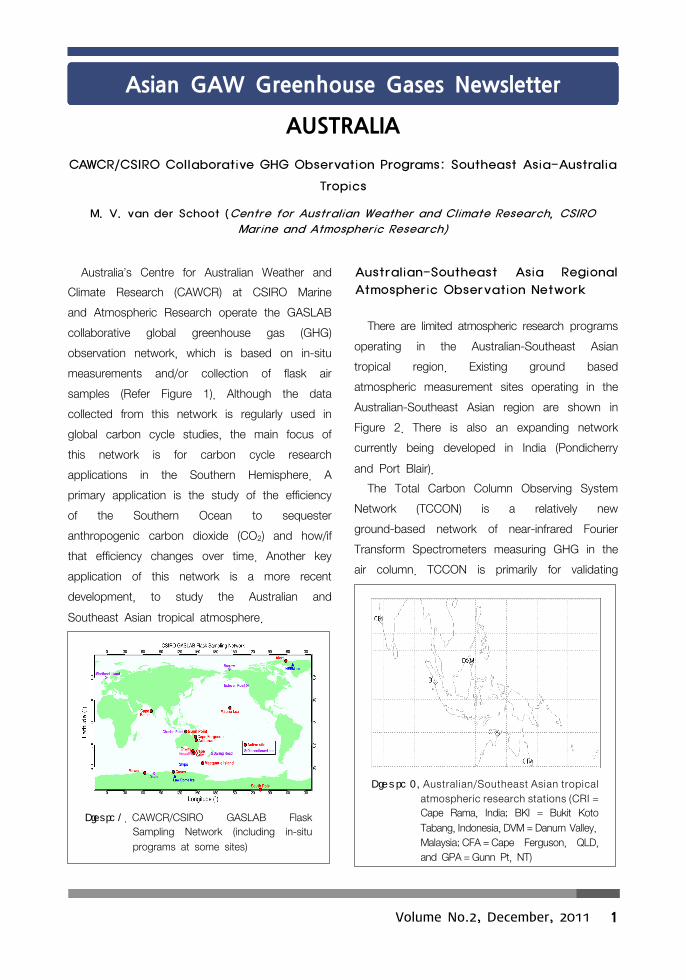
Australia’s Centre for Australian Weather and
Climate Research (CAWCR) at CSIRO Marine
and Atmospheric Research operate the GASLAB
collaborative global greenhouse gas (GHG)
observation network, which is based on in-situ
measurements and/or collection of flask air
samples (Refer Figure 1). Although the data
collected from this network is regularly used in
global carbon cycle studies, the main focus of
this network is for carbon cycle research
applications in the Southern Hemisphere. A
primary application is the study of the efficiency
of the Southern Ocean to sequester
anthropogenic carbon dioxide (CO2) and how/if
that efficiency changes over time. Another key
application of this network is a more recent
development, to study the Australian and
Southeast Asian tropical atmosphere.
Figure 1. CAWCR/CSIRO GASLAB Flask
Sampling Network (including in-situ
programs at some sites)
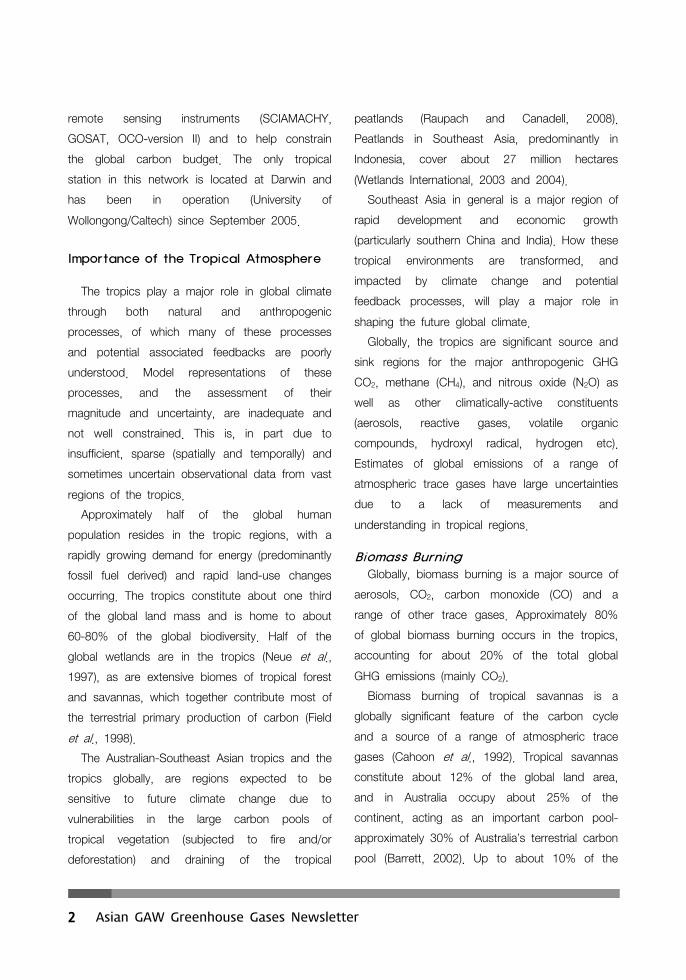
Australian-Southeast Asia Regional
Atmospheric Observation Network
There are limited atmospheric research programs
operating in the Australian-Southeast Asian
tropical region. Existing ground based
atmospheric measurement sites operating in the
Australian-Southeast Asian region are shown in
Figure 2. There is also an expanding network
currently being developed in India (Pondicherry
and Port Blair).
The Total Carbon Column Observing System
Network (TCCON) is a relatively new
ground-based network of near-infrared Fourier
Transform Spectrometers measuring GHG in the
air column. TCCON is primarily for validating
Figure 2. Austral ian/Southeast Asian tropical
atmospheric research stations (CRI =
Cape Rama, India; BKI = Bukit Koto
Tabang, Indonesia, DVM = Danum Valley,
Malaysia; CFA = Cape Ferguson, QLD,
and GPA = Gunn Pt, NT)
Asian GAW Greenhouse Gases Newsletter
2 Asian GAW Greenhouse Gases Newsletter
remote sensing instruments (SCIAMACHY,
GOSAT, OCO-version II) and to help constrain
the global carbon budget. The only tropical
station in this network is located at Darwin and
has been in operation (University of
Wollongong/Caltech) since September 2005.
Importance of the Tropical Atmosphere
The tropics play a major role in global climate
through both natural and anthropogenic
processes, of which many of these processes
and potential associated feedbacks are poorly
understood. Model representations of these
processes, and the assessment of their
magnitude and uncertainty, are inadequate and
not well constrained. This is, in part due to
insufficient, sparse (spatially and temporally) and
sometimes uncertain observational data from vast
regions of the tropics.
Approximately half of the global human
population resides in the tropic regions, with a
rapidly growing demand for energy (predominantly
fossil fuel derived) and rapid land-use changes
occurring. The tropics constitute about one third
of the global land mass and is home to about
60-80% of the global biodiversity. Half of the
global wetlands are in the tropics (Neue et al.,
1997), as are extensive biomes of tropical forest
and savannas, which together contribute most of
the terrestrial primary production of carbon (Field
et al., 1998).
The Australian-Southeast Asian tropics and the
tropics globally, are regions expected to be
sensitive to future climate change due to
vulnerabilities in the large carbon pools of
tropical vegetation (subjected to fire and/or
deforestation) and draining of the tropical
peatlands (Raupach and Canadell, 2008).
Peatlands in Southeast Asia, predominantly in
Indonesia, cover about 27 million hectares
(Wetlands International, 2003 and 2004).
Southeast Asia in general is a major region of
rapid development and economic growth
(particularly southern China and India). How these
tropical environments are transformed, and
impacted by climate change and potential
feedback processes, will play a major role in
shaping the future global climate.
Globally, the tropics are significant source and
sink regions for the major anthropogenic GHG
CO2, methane (CH4), and nitrous oxide (N2O) as
well as other climatically-active constituents
(aerosols, reactive gases, volatile organic
compounds, hydroxyl radical, hydrogen etc).
Estimates of global emissions of a range of
atmospheric trace gases have large uncertainties
due to a lack of measurements and
understanding in tropical regions.
Biomass BurningGlobally, biomass burning is a major source of
aerosols, CO2, carbon monoxide (CO) and a
range of other trace gases. Approximately 80%
of global biomass burning occurs in the tropics,
accounting for about 20% of the total global
GHG emissions (mainly CO2).
Biomass burning of tropical savannas is a
globally significant feature of the carbon cycle
and a source of a range of atmospheric trace
gases (Cahoon et al., 1992). Tropical savannas
constitute about 12% of the global land area,
and in Australia occupy about 25% of the
continent, acting as an important carbon pool-
approximately 30% of Australia’s terrestrial carbon
pool (Barrett, 2002). Up to about 10% of the

Volume No.2, December, 2011 3
total global biomass burning occurs in the
tropical savannas of Northern Australia alone (van
der Werf, et al., 2006). A large proportion of the
landmass of the Northern Territory each year is
exposed to regular seasonal biomass burning
(prescribed burning and wild fires).
The 1997 El Niño event fires in Indonesia
were estimated to have emitted the equivalent of
13-40% of the total annual global fossil fuel
emissions (Page et al., 2002). Southeast Asian
peatland drainage accounts for approximately 5%
of global CO2 emissions.
Atmospheric Carbon Dioxide
Numerous global carbon-cycle modelling
studies have been conducted, which have a
tropical component, however, a common
limitation with nearly all of these studies, is the
lack of data in the global tropical regions. The
international CO2 modelling community have
specified a requirement for "expansion of the
CO2 observation network within the tropics"to
reduce uncertainties in regional estimates of
CO2sources and sinks using atmospheric
transport models (Gurney et al., 2006).
An inverse modelling study has shown that
the introduction of a CO2 observation site in the
tropical Northwest Australian region would
dramatically reduce (approximately 50%) the
uncertainty of annual mean Australian CO2 fluxes
(Law et al., 2004).
Atmospheric Methane
After a decade (1996-2006) of near zero
global CH4 growth in the atmosphere, it would
appear there is a recent renewed growth rate of
CH4 (Rigby et al., 2008), potentially attributed to
increased growth in boreal and/or tropical
(wetlands) sources or influences from a changing
atmospheric sink (OH). The cause of these
unexpected changes in CH4 growth rate in the
atmosphere continues to undergo considerable
scientific debate. An inverse modelling study
(Bousquet et al., 2006) showed that the plateau
in global atmospheric CH4 concentrations was
due to a reduction in wetland CH4 emissions.
Two recent studies (employing simple
atmospheric mixing models) suggest conflicting
explanations (Aydin et al., and Kai et al., 2011)
for this behaviour. Using a method involving ice
firn ethane measurements, Aydin et al.concluded
their inferred pre-1980 fossil fuel based CH4
emissions were double those of standard
inventories, with a resultant 30% decrease in
CH4emissions post-1980,could account for the
long term decline in CH4 growth rate over the
last 30 years. In contrast, the method employed
by Kai et al., using global (surface) isotopic
measurements (13C-CH4 and 2H-CH4), indicated
this behaviour was due to a decrease in
microbial CH4 sources in the northern
hemisphere (primarily rice production) and that
the isotopic data was not consistent with
changes in fossil fuel CH4 emission sources.
The inter-annual variability (IAV) in CH4
emissions is dominated by tropical processes, in
particular tropical wetlands (about 70% of global
anomalies) in the order of +/- 12 Tg CH4 yr-1
(Bousquet et al., 2006). Biomass burning
accounts for about 15% of the CH4 IAV
(Denman et al., 2007).
The role of wetlands in global climate change
is critical, because of the magnitude of the
emissions and the potential for feedback from

4 Asian GAW Greenhouse Gases Newsletter
the temperature dependence of wetland
CH4emissions. While some studies (Whiting and
Chanton, 2001) suggest that wetlands could
have a net reduction of anthropogenic warming,
others (Shindell et al., 2004) find that a doubling
of atmospheric CO2 would likely lead to an
annual increase of 78% in CH4 emissions from
existing wetlands, largely in the tropics, leading
to an atmospheric increase of 430nmol mol-1
CH4 (~24%).
Termites are an additional natural source of
CH4, estimated to be in the range of 20-30 Tg
yr-1 (Denman et al., 2007). Termites, like
wetlands, produce more CH4 at higher
temperatures and humidity (Becker, 1970). Two
species of Australian savanna termites are
particularly large CH4 emitters, capable of greater
than 7mg CH4(kg termite biomass)-1 hr-1 (Fraser
et al., 1986).
Atmospheric Nitrous Oxide
Globally, N2O emissions are estimated to be 15
Tg (N) yr-1, of which 80% is attributed to
terrestrial sources and the remaining 20% from
ocean sources (Huang et al., 2008). The majority
of these N2O sources are from the tropics (80%),
and the remaining from the mid-latitude regions
(20%). Approximately 15% of the global N2Osource
is from the Southeast Asia (including China and
Japan) region and 7% from South Asia.
The IPCC Third Assessment Report concluded
that the tropical emissions had a large role in
the observed global spatial concentration
gradients of atmospheric N2O (Forster et al.,
2007).
Recent in-situ surface to stratosphere
measurements of N2O conducted on the HIAPER
Pole to Pole Observations campaigns (HIPPO)
show high concentrations of N2O in the tropics,
predominantly in the middle and upper
troposphere, indicating strong but very episodic
tropical source events (Kort et al, 2011).
New Australian Tropical Atmospheric
Research Facility
The establishment of an Australian tropical
atmospheric research observatory would build on
the extensive research infrastructure developed
by the Bureau of Meteorology and the US
Department of Energy Atmospheric Radiation
Measurement (ARM) Program, in tropical
Australia, which provides a background of
extensive and long term cloud, thermodynamic
and radiation measurements. This synergy would
provide a unique opportunity to provide high
quality aerosol and atmospheric composition
measurements, leading to a greater understand
of aerosol-cloud-climate interactions, a missing
link in climate research. This combined research
capability would enable atmospheric budget
studies yet to be undertaken on a continuous,
ongoing basis anywhere else in the tropics and
would increase scientific understanding in three
key areas:
1. address key uncertainties in aerosol-climate
interactions and their implication for the
hydrological cycle in the Australian tropics;
2. dramatically reduce the uncertainty in estimates
of total greenhouse gas (GHG) emissions from
Australia, and
3. provide key data on climatically active
atmospheric constituents and their sources
and sinks in the tropics in order to improve

Volume No.2, December, 2011 5
our understanding of climate change forcing.
This would enhance the capability of
Australia’s coupled climate and earth system
model - the Australian Community Climate and
Earth-System Simulator (ACCESS) as well as
providing valuable data for carbon-climate
coupled model and satellite validation
(SCIAMACHY1), GOSAT2), MOPITT3)).
A pilot Australian tropical atmospheric research
facility has recently (2010) been established at
the Gunn Point Radar Facility (operated by the
Australian Bureau of Meteorology) in Australia’s
Northern Territory (12.25S, 131.05E) (refer Figure
3). Figure 4 shows the view toward the west of
the station as observed from the radar tower
(coast is about 1-2 km across the surrounding
savannah). The prevailing dry season meteorology
at the Gunn Point site exposes the site to air
masses derived predominantly from tropical
northern Australia (northern Queensland and
Northern Territory). Importantly these synoptic
easterlies would entrain strong biomass burning
signals from continental Australia(savannah).
During the wet season (tropical monsoon), Gunn
Point is exposed to air masses from the
significant Southeast Asia GHG sources and
sinks regions, including: the Timor Sea,
Indonesian ‘warm pool’, Timor-Leste, Java,
Sumatra, Borneo, and Malaysia.
1) The SCanning Imaging Absorption SpectroMeter for Atmospheric CHartographY (SCIAMACHY)
[http://www.sciamachy.org/]
2) Greenhouse gases Observing SATellite (GOSAT) [http://www.gosat.nies.go.jp/index_e.html]
3) Measurements Of Pollution In The Troposphere (MOPITT) on NASA Terra Spacecraft
Figure 3. Gunn Point (Northern Territory, Australia)
radar facility with atmospheric chemistry
module
Figure 4. View looking west from radar tower at
Gunn Point site, Northern Territory
1) The SCanning Imaging Absorption SpectroMeter for Atmospheric CHartographY (SCIAMACHY) [http://www.sciamachy.org/]
2) Greenhouse gases Observing SATellite (GOSAT) [http://www.gosat.nies.go.jp/index_e.html]
3) Measurements Of Pollution In The Troposphere (MOPITT) on NASA Terra Spacecraft

6 Asian GAW Greenhouse Gases Newsletter
Atmospheric species Proposed analytical method Research group Operational
In-situ CO2 & 13CO2/12CO2 CRDS (Picarro) CMAR Yes
In-situ CH4 CRDS (Picarro) CMAR Yes
In-situ CO/N2O CRDS CMAR 2012
CO2, 13CO2/
12CO2, CO13O, CH4,
N2O, H2, CO
Flasks sampling (GC-FID,
GC-ECD, MS), FTIR
CMAR/University of
WollongongYes
Short-lived halocarbons, C4-C12
HCsGC-ECD/FID/PDD
University of Cambridge,
UK2012
CFCs, HCFCs, HFCs, PFCs, SF6,
CH3Br, CH3Cl, CH3IGC-MS-Medusa CMAR 2012/13?
Aerosols (AOD)Nephelometer / Aeronet sun
photometer. MAPPCMAR Campaign 2010
VOC PTR-MS / automatic samplers CMAR 2012/2013
O3 ML9810, OZSU; CMAR Yes
CO Trace Analytical CMAR Yes
NO/NOx Trace Analytical CMAR Yes
Particles (PM2.5, PM10) TEOM / HiVol CMAR 2012/2013
Radon ANSTO Radon Detector ANSTO Yes
OH radical (campaign) FAGE Leeds University, UK 2012/2013?
The current and proposed atmospheric measurement program for the tropical observatory at Gunn
Point is shown in Table 1.
Table 1. Current and proposed atmospheric measurement program for Gunn Point station

Volume No.2, December, 2011 7
References
Aydin, M. et al, (2011), Nature, 476, 198-201.
Barrett, D. J. (2002), Steady state turnover time of carbon in the Australian terrestrial biosphere.
Global Biogeochem. Cycles, 16 (4), 1108.
Becker, G. (1970), Rearing of termites andtesting methods used in the laboratory, in Biology of
Termites, edited by K. Krishna and F. M. Weesner, pp. 351-385, Academic Press, New York.
Bousquet, P., P. Ciais, J. B. Miller, E. Dlugokencky, D. A. Hauglustaine, C. Prigent, G. R. Van der
Werf, P. Peylin, E.-G. Brunke, C. Carouge, R. L. Langenfelds, J. Lathiere, F. Papa, M. Ramonet,
M. Schmidt, L. P. Steele, S. C. Tyler, and J. White (2006), Contribution of anthropogenic and
natural sources to atmospheric methane variability, Nature, 443.
Cahoon, D. R., Stocks, B. J. Cahoon, D. R., Stocks, B. J., Levine, J. S., Cofer, W. R. and O'Neill,
K. P. (1992), Seasonal distribution of African savanna fires, Nature 359 (6398): 812-815.
Denman, K. L., Brasseur, G., Chidthaisong, A., Ciais, P., Cox, P. M., Dickinson, R. E., Hauglustaine,
D. A., Heinze, C., Holland, E., Jacob, D. J., Lohmann, U., Ramachandran, S., da Silva Dias, P.
L., Wofsy, S. C. and Zhang, X. (2007), Couplings Between Changes in the Climate System and Biogeochemistry., in Climate Change 2007: The Physical Science Basis. Contribution of Working Group I to the Fourth Assessment Report of the Intergovernmental Panel on Climate Change,
edited by S. Solomon, et al., Cambridge University Press, Cambridge, United Kingdom and New
York, NY, USA.
Field, C. B., Behrenfeld, M. J., Randerson, J. T. and Falkowski, P. (1998), Primary Production of the
Biosphere: Integrating Terrestrial and Oceanic Components,Science 281(5374): 237-240.
Forster, P., V. Ramaswamy, P. Artaxo, T. Berntsen, R. Betts, D.W. Fahey, J. Haywood, J. Lean, D.C.
Lowe, G. Myhre, J. Nganga, R. Prinn, G. Raga, M. Schulz and R. Van Dorland, 2007, Changes In Atmospheric Constituents and in radiative Forcing. In: Climate Change 2007: The Physical Science Basis. Contribution of Working Group I to the Fourth Assessment Report of the Intergovernmental Panel on Climate Change[Solomon, S., D. Qin, M. Manning, Z. Chen, M.
Marquis, K.B. Averyt, M. Tignor and H. L. Miller (eds)]. Cambridge University Press, Cambridge,
United Kingdom and New York, NY, USA.
Fraser, P. J., Rasmussen, R. A., Creffield, J. W., French, J. R. and Khalil, M. A. K. (1986), Termites
and Global Methane - Another Assessment, Journal of Atmospheric Chemistry, 4, 295-310.
Gurney, K. R., Law, R. M. Denning, A. S., Rayner, P. J., Baker, D., Bousquet, P., Bruhwiler, L.,
Chen, Y-H., Ciais, P., Fan, S., Fung, I. Y., Gloor, M., Heimann, M., Higuchi, K., John, J., Maki,
T., Maksyutov, S., Masarie, K., Peylin, P., Prather, M., Pak, B., C., Randerson, J., Sarmiento, J.,
Taguchi, S., Takahashi, T., and Yuen, C-W. (2002), Towards robust regional estimates of CO2
sources and sinks using atmospheric transport models,Nature 415(6872): 626-630.

8 Asian GAW Greenhouse Gases Newsletter
Huang, J., Golombek, A., Prinn, R., Weiss, R., Fraser, P., Simmonds, P., Dlugokencky, E. J., Hall, B.,
Elkins, J., Steele, P., Langenfelds, R., Krummel, P., Dutton, G. and Porter, L. (2008), Estimation of regional emissions of nitrous oxide from 1997 to 2005 using multinetwork measurements, a
chemical transport model, and an inverse method, J. Geophys. Res. 113(D17): D17313.
Kai, F. M., Tyler, S. C., Randerson, J T., Blake, D. R. (2011), Reduced methane growth rate
explained by decreased Northern Hemisphere microbial sources, Nature 476(7359): 194-197.
Kort, E. A., Patra, P. K., Ishijima, K., Daube, B. C., Jiménez, R., Elkins, J., Hurst, D., Moore, F. L.,
Sweeney, C., Wofsy, S. C. (2011), Tropospheric distribution and variability of N2O: Evidence for
strong tropical emissions, Geophys. Res. Lett. 38(15): L15806.
Law, R. M.,Rayner, P. J. and Y. P. Wang (2004), Inversion of diurnally-varying synthetic CO2: network optimisation for an Australian test case, Global Biogeochemical Cycles, 18(1), GB1044, doi:
10.1029/2003GB002136
Neue, H. U., Gaunt, J. L.,Wang, Z. P., Becker-Heidmann, P. and Quijano, C. (1997), Carbon in
tropical wetlands, Geoderma, 79, 163-185.
Page, S. E., Siegert, F., Rieley, J. O., Boehm, H-D. V., Jaya, A. and Limin, S., (2002), The amount of
carbon released from peat and forest fires in Indonesia during 1997, Nature 420(6911): 61-65.
Raupach, M.R. and Canadell, J.G. (2008), Observing a vulnerable carbon cycle. In Observing the
Continental-Scale Greenhouse Gas Balance of Europe (Dolman, H. et al., eds), pp 5-32, Springer.
Rigby, M., R., Prinn, R. G., Fraser, P. J., Simmonds, P. G., Langenfelds, R. L., Huang, J., Cunnold,
D. M., Steele, L. P., Krummel, P. B., Weiss, R. F., O'Doherty, S., Salameh, P. K., Wang, H. J.,
Harth, C. M., Mühle, J. and Porter, L. W. (2008), Renewed growth of atmospheric methane,
Geophys. Res. Lett. 35(22): L22805.
Shindell, D. T., Walter, B. P. and Faluvegi, G. (2004), Impacts of climate change on methane
emissions from wetlands, Geophysical Research Letters, 31.
van der Werf, G. R., Randerson, J. T., Giglio, L., Collatz, G. J., Kasibhatla, P. S., and Arellano Jr., A.
F. (2006), Interannual variability in global biomass burning emissions from 1997 to 2004, Atmos.
Chem. Phys., 6, 3423–3441, http://www.atmos-chem-phys.net/6/3423/2006/.
Wetlands International (2003), Wetlands International, Map of Peatland Distribution Area and Carbon
Content in Sumatera 1990–2002, Wetlands International—Indonesia Programme & Wildlife Habitat
Canada, Bogor.
Wetlands International (2004), Wetlands International, Map of Peatland Distribution Area and Carbon
Content in Kalimantan 2000–2002, Wetlands International—Indonesia Programme & Wildlife Habitat
Canada, Bogor.
Whiting, G. J., and Chanton, J. P. (2001), Greenhouse carbon balance of wetlands: methane emission
versus carbon sequestration, Tellus, 53B, 521-528.

Volume No.2, December, 2011 9
INDONESIA (Bukit Kototabang)
Alberth Christian Nahas
(Indonesia Agency for Meteorology, Climatology and Geophysics)
Figure 1. GAW Bukit Kototabang
Global GAW Station Bukit Kototabang is a
remote site, surrounded by tropical rainforest in
the Island of Sumatra. Due to its position on the
equatorial region, this site is affected by both of
the earth’s hemispheres. Greenhouse gases
(GHGs) measurement in Bukit Kototabang has
been started since 2004, as a part of Global Air
Sampling Monitoring Network, conducted by
NOAA Earth System Research Laboratory (ESRL).
This measurement programme used air flask
sampling method on weekly-basis sampling time.
Four main GHGs are measured using this
method: CO2, CH4, N2O and SF6. However,
since March 2011, the programme has been
temporary terminated.
For about 8 years of measurement, result
shows that the concentration of all gases
increases every year, with the only exception for
CH4 which indicates fluctuate concentration
during the early years of measurement, but
Figure 2. CO2 concentration flying carpet (NOAA
ESRL, 2010).
suggests a slight positive trend for the last four
years. Seasonal variability is also observed for all
gases due to different air mass trajectory headed
toward the station (Nahas, 2010). CH4
concentration has increased with the growth rate
of ~2.69 ppb per year. However, in the last four
years, CH4 concentration has grown at the level
of ~4.10 ppb per year. A study by Bousquet et
al. (2011) using the wetland ecosystem emission
model ORCHIDEE over the period 2006-2008
has found that tropical natural wetlands are a
dominant contributor to the increasing trend of
CH4 concentration. Meanwhile, CO2 concentration
measured in Bukit Kototabang during the period
2004-2010 has grown at the rate of ~1.50 ppm
per year. A CO2 concentration profile depicted in
Figure 2 shows that CO2 concentration in the
equatorial region (marked as red) is in between
the two hemispheres, with large concentration

10 Asian GAW Greenhouse Gases Newsletter
variability observed in the Northern Hemisphere,
while relatively homogenous concentration in the
South. A similar increase is also found on N2O
and SF6 with these two gases have ~0.68 ppb
and ~0.23 ppt of annual growth rate,
respectively.
For ensuring the data continuity and also for
having a better data resolution, a continuous
monitoring instrument, Picarro Model G1301, has
been installed in Bukit Kototabang on October
2008. However, the initial operation of this
instrument was without proper calibration. It was
until late 2009, the calibrator unit, along with
NOAA standards gases, was installed to ensure
the data quality by providing calibration. The
installation of calibrator unit was funded by
MeteoSwiss and performed by Empa,
Switzerland. After having instrument failure for
several months, the instrument was fully operated
again since March 2011 with a relatively good
performance. In addition, a recent system and
performance audit by Empa in the early
November 2011 has provided additional working
standard gases to equip the measurement.
Picarro G1301 measures three GHGs
components: CO2 and CH4 (reported in ppm)
and H2O (% v/v). Six different air intakes are
used in the measurement process, they are
ambient air intake for three different levels and
the remaining three intakes are for standard
gases. Intakes from ambient air are taken from
inlets located at 10 m, 20 m and 32 m above
the ground. Calibrator unit controls which air
intake taken to the instrument by automatically
switching the valves that regulate which air or
gas is being sampled. Before entering the
instrument, the air and gas are dried to remove
the water vapour content. H2O concentration is
kept at ~0.05% v/v and therefore in this
measurement scheme, H2O concentration in
ambient air is not taking into account.
Figure 3 illustrates the diurnal variation of CO2
and CH4 concentration over the period
April-October 2011. Result shows that three inlet
levels give different response to the gases
measurement, particularly during the night time.
The top level inlet measures a considerably
smaller amount of CO2 and CH4, compared to
the two lower inlets. It is very likely due to
vegetation respiration which occurs during the
nighttime and gives a stronger influence to the
air taken from 10 m and 20 m. At the height of
10 m, gas concentration are measured at the
highest point because this level is affected more
by surface influences.
Figure 3. Diurnal variation (in local time) of CO2 and
CH4 concentration in Bukit Kototabang

Volume No.2, December, 2011 11
Inlet (m)CO2 (ppm) CH4 (ppb)
Day Night Difference Day Night Difference
10 391.3 409.3 18.0 1817.6 1820.1 2.5
20 390.3 404.5 14.2 1816.6 1819.3 2.7
32 389.8 399.4 9.6 1815.3 1815.3 0
Table 1. CO2 and CH4 concentration variation between day and night time at there different inlets.
A different trend is observed in the daytime
when CO2 and CH4 concentration are very
similar for all ambient air intakes, with a slight
tendency of air intake from 32 m is having the
highest CO2 concentration, particularly between 9
am to 3 pm. However, there is a significant
response of CH4 concentration during the
daytime. A small increase is observed in this
period, started from 12 pm until around 3 pm.
To sum up, GHGs measurement result in
Bukit Kototabang offers a perspective for the
trend in the equatorial region. Influences from
both hemispheres affect the seasonal variability
of GHGs concentration. The ongoing
measurement has enabled a diurnal monitoring
for CO2 and CH4. Result has indicated the
concentration variability for three different inlets
with strong surface influences for the lower
inlets. GHGs monitoring in Bukit Kototabang
should be continued and maintained to provide
important data, especially for the equatorial area
where a large data gap is exist.
REFERENCES
Bousquet, P. et al. 2011, Source attribution of the changes in atmospheric methane for 2006-2008,
Atmos. Chem. Phys., 11, 3689-3700.
Nahas, A.C. 2010, Asian GAW Greenhouse Gases Newsletter Volume No. 1, 11pp.
12 Asian GAW Greenhouse Gases Newsletter
JAPAN
Scale for greenhouse gas observation and Intercomparison activities in JMA
TAKIZAWA Atsushi (Japan Meteorological Agency)
The Activities of WCC for Methane
Under the WMO GAW programme, the Japan
Meteorological Agency (JMA) has served as the
GAW World Calibration Centre (WCC) for
methane (CH4) in Asia and the South-West
Pacific since 2001. The activities of this centre
include maintaining the CH4 standard gases
which is traceable with the WMO scale
maintained by National Oceanic and Atmospheric
Administration (NOAA), making calibration at the
request of GAW participating organizations in the
region, and organizing the CH4 reference gas
intercomparison experiments.
The purpose of the intercomparison is to
ascertain to what extent the current practiceof
calibration is working, and eventually to ensure
that the measurementsare intercomparable. In the
CH4 reference gas intercomparison experiments,
two cylinders containing different CH4 concentrations
are circulated in the GAW community and other
co-operative observation institutions in Australia,
China, Japan, New Zealand and the Republic of
Korea. JMA also circulates the same cylinders
through the laboratories in Japan, Tohoku
University (TU) and National Institute for
Environmental Studies (NIES) (Figure 1.) At the
beginning and the end of the circulation, JMA
measures the cylinders to check a possibledrift
during the circulation.
The intercomparison has been carried out
repeatedly since 2001. The 3rd CH4 reference
gas intercomparison for the South-West Pacific
region was carried out through 2010 and 2011,
and the 4th intercomparison for Asia region
started in 2011. JMA collects the measurement
results from each laboratory and disseminates
compiled results back to the participants. The
differences between the participants were smaller
in recent years than previous intercomparisons
since WMO CH4 scale was commonly used in
the GAW community (Figure 2).
The results of the intercomparison are
reported to WMO to be shared within the GAW
community. The details of the intercomparison
results and contact information at each laboratory
are available at the website of WCC for CH4
(Figure 3). To fulfill the responsibility of WCC,
JMA will continue to organize the
intercomparison experiment. We will appreciate
continued cooperation of the regular participants
and encourage other laboratories in the region to
participate in.
Figure1. CH4 Reference Gas Intercomparison

Volume No.2, December, 2011 13
Figure 2. The results of CH4 reference gas intercomparison (from 1st to 7th), Difference from JMA at the
beginning of circulation (JMA results are marked with red symbols)
Figure 3. Website of WCC for CH4 (http://gaw.kishou.go.jp/wcc/wcc.html)

14 Asian GAW Greenhouse Gases Newsletter
The JMA’s operational Calibration
System for Greenhouse Gases
In order to ensure traceability to GAW
international standards and maintain the accuracy
of the measurements, JMA standards for carbon
dioxide (CO2), CH4, carbon monoxide (CO),
nitrous oxide (N2O) and surface ozone (O3) have
adopted WMO scale through regular calibrations
at the WMO Central Calibration Laboratory
(CCLs). JMA has its own calibration systems for
CO2, CH4, N2O, CO and O3. These systems are
operated at our laboratory in the JMA
Headquarters in Tokyo. Taking CO2 as an
example, JMA has three ranks (primary,
secondary and working) of standard gases. First,
primary standards are calibrated with WMO scale
at NOAA Earth System Research Laboratory
(ESRL). Then secondary standards are calibrated
with the primary standards in the effort to
conserve the primary gases. Finally, working
standards are calibrated with the secondary
standards, and provided for various observation
programs (stations, ships and aircraft) in JMA.
Therefore, JMA’s measurements keep traceability
to WMO scales by using these calibration
systems.
On the other hand, laboratories in Japan other
than JMA maintain their own scale for
measurements of greenhouse gases. Taking the
opportunity of the WMO world trace gas
intercomparison during 2009 and 2010, the five
gases cylinders which consist of three WMO
reference gases and additional two JMA CO2
standard gases, were circulated among each
laboratory in Japan (Figure 4).
This circulation enabled the laboratories to
compare measurement data of their individual
scale. We aim to build a systematic
intercomparison framework of standard scales
among laboratories in Japan and to maintain
stability of standard scale over the long term.
Figure 4. CO2 Inter-laboratory Comparison Experiments
(Top: Global, Bottom: Japan)

Volume No.2, December, 2011 15
KOREA (Anmyeon-do)
Han-Cheol Lim (Korea Meteorological Administration)
Anmyeon-do (36°32′N, 126°19′E; 45.7 m above
mean sea level) is a regional GAW station
located on the west coast of the Korean
Peninsula (Figure 1). The observatory has been
operated by the Korea Global Atmosphere Watch
Center (KGAWC) of KMA since 1996, and
presently, 36 parameters, including greenhouse
gases, aerosols, ultraviolet radiation, ozone, and
precipitation chemistry, are being measured.
The Center is actively engaged in international
activities, such as participating in intercomparison
experiment of greenhouse gases, organizing
international workshops, and sharing data from
WDCGG (World Data Centre for Greenhouse
Gases). Due to its relatively pollution-free
environment, KGAWC provides an ideal site for
observations that are geographically representative of
the background atmosphere of Northeast Asia,
including the Korean Peninsula.
Since 1999, the Center has been monitoring
major greenhouse gases (GHGs) such as carbon
Figure 1. The Korea Global Atmosphere Watch
Center is located at the relatively
unpolluted western coastal area.
dioxide (CO2), methane (CH4), nitrous oxide
(N2O), and chlorofluorocarbons (CFC-11, CFC-12).
In 2007, the number of GHGs monitored at the
Center was increased to seven, with the addition
of chlorofluorocarbon (CFC-113) and sulfur
hexafluoride (SF6). Figure 2 shows the
concentration levels for the five GHG species
observed at Anmyeon-do from 1999 to 2010,
along with the NOAA/GMD global CO2
concentration trends. The CO2 concentrations at
Anmyeon-do are substantially higher than the
global average and the N2O concentrations are
steadily increasing, while CFCs exhibit a
continuously declining trend.
The average CO2 concentration for the year
2010 recorded 394.5 ppm, an increase of 23.8
ppm (6.4%) relative to the annual average of
370.7 ppm for 1999, and 5.9 ppm higher than
the global average of 388.6 ppm for the same
year as documented by NOAA/GMD. The annual
Figure 2. Annual averages of GHGs(CO2, CH4, N2O,
CFCs) concentration for 1999-2010.

16 Asian GAW Greenhouse Gases Newsletter
Table 1. Average concentrations for 2010 and annual mean growth rates for the 12-year period from
1999 through 2010 of major GHGs in the background atmosphere of the Korean Peninsula.
GHGs CO2 CH4 N2O CFC-11 CFC-12
Average concentrations in
2010
394.5
(ppm)
1.914
(ppm)
325.2
(ppb)
244.7
(ppt)
524.2
(ppt)
12-year avg. growth rates+2.12
(ppm/year)
+0.00320
(ppm/year)
+0.96
(ppb/year)
-2.30
(ppt/year)
-0.84
(ppt/year)
growth rate of CO2 for the 12-year period from
1999 through 2010 was 2.12 ppm/year, higher
than the global average of 1.9 ppm/year,
however ithas slowed in recent years. Table 1
summarizes the 12-year averaged annual growth
rates and 2010 annual average concentrations of
GHGs in Anmyeon-do.
KGAWC held the 3rdAsian GAW Workshop on
Greenhouse Gases in Seoul, Korea on September
2011. GAW station members coming from six
countries participated in the workshop to present
results of long-term monitoring of GHGs
observed in each country and to discuss about
Asian GAW issues. And also, there were some
invited addresses by SAGs and CCL of WMO/GAW
for introducing recent activities of WMO/CCL as
well as exchanging of measuring techniques and
new information. Furthermore, one of the
significant results in the workshop is that the
establishment of the Asian GAW Greenhouse Gases
Working Group which covers both Asian (RA2)
and South and west Pacific (RA4). The contact
person in each country is also decided. English
version of the ‘Summary of Korea Global Atmosphere
Watch 2010 Report’ is published in September
2011 (Figure 3, right).
Figure 3. The 3ndAsian GAW Workshop on Greenhouse Gases was held in Seoul, Korea (the left)
and Summary report published by KGAWC in 2011 (the right).

Volume No.2, December, 2011 17
KGAWC serves dangerous CO2 concentration
levels with easy visualization graphic style to the
general public through KMA web (called Climate
Change Information Center). Dangerous CO2
concentration level is defined by CO2
concentrations greater than 450 ppm as
suggested by many previously published papers.
Carbon dioxide concentration levels are divided
into three stages in the graphic display: (1)
Dangerous stage (420-450 ppm); (2) Notice
stage (380-420 ppm); (2) Recognition stage
(280-380 ppm). So, people can easily look at
the increasing trend of carbon dioxide
concentration in Korea, and they can get
information regarding when and how long does it
take to reach at dangerous stage (Figure 4).
Figure 4. Assessment and long-term monitoring of the anthropogenic increase of CO2 concentration. It is to
provide any climate information on increase of Carbon dioxides observed in Anmyeon-do station to
user.

18 Asian GAW Greenhouse Gases Newsletter
KOREA (King Sejong)
Taejin Choi (Korea Polar Research Institute)
Polar regions are important in past, present
and future global climate processes in terms of
global energy, water and thermohalic circulation.
In addition, they are ideal platforms for
monitoring background greenhouse gas
concentrations. Monitoring accurate levels of
atmospheric greenhouse gasat polar regions are
important in several aspects; accurate
quantification of background greenhouse gas
concentrations and their increasing rate at
present, better understanding of past climate
based on gases in the ice cores and evaluation
of greenhouse gas sinks or sources of areas
with lack of measurements based on precision
concentration measurements at some locations
and inverse methods. The Southern Ocean is
known as a strong sink for atmospheric CO2.
However, atmospheric CO2 uptake by the
Southern Ocean has been decreased recently
(e.g., Le Quéré, et al, 2007, Lenton and Matear,
2007). To reduce large uncertainties in the global
carbon budget and hence in the predicted
response to climate change related with the
Southern Ocean CO2 process, additional long
term measurements are needed at areas with
lack of measurements. Korea Polar Research
Institute (KOPRI) is an international polar research
institute operating the Antarctic King Sejong
Station (62o13´S, 58o47´W), the Arctic Dasan
Station (78o 55´N, 11o 56´E) and the
Ice-Breaking Research Vessel, Araon. In addition,
its 2nd Antarctic station, Jang Bogo station (74o
36´S, 164o 13´E) will be open in 2014. The King
Sejong station is located near the Antarctic
Peninsula, which is one of the regions
experiencing the rapid warming and
environmental change. The Jang Bogo station is
located on Terra Nova Bay, Northern Victoria
Land, where is the border of stratospheric ozone
hole and the warming area on Antarctica. The
Ice-breaker, Araon cruses along West Antarctica
between the King Sejong station and the Jang
Bogo station for research and logistics (Fig. 1).
At the Arctic sea, on board measurements can
be made at higher latitude than those at the
stations on Siberia, Alaska and Canada due to
the melting of sea ice on boreal summer
seasons. All of these research infra structure are
unique for the study on climate change at polar
regions through research programs such as
Figure 1. Greenhouse gasmonitoring area at the
Antarctic by KOPRI. The King Sejong
station (Antarctic Peninsula), Jang
Bogo station (Northern Victoria Land)
and the Ice Breaking Research Vessel,
Araon (the Pacific Sector of Antarctica)

Volume No.2, December, 2011 19
Figure 2. The Antarctic King Sejong station and
the observatory building for CO2 and other
trace gas concentration measurements
GAW. As a first step, KOPRI registered its first
Antarctic station, the King Sejong station, as a
GAW regional station together with Korea
Meteorological Administration (KMA) in 2010. For
background CO2 concentration measurement, a
cavity ring-down spectroscopy (CRDS) analyzer
(G1200, Picarro, Inc., USA) was installed in an
observatory building at the King Sejong Station
in December of 2009 (Fig. 2). The measurement
system consists of inlet outside the observatory
building, a diaphrame pump, dual dehumidifier, a
mass flow controller and the CRDS. Sampled air
moves from the inlet to the CRDSthrough
decarbon tube with a diameter of 3/8". The inlet
height is 6 m above the surface ground. Flow
rate into the CRDS is controlled 250 ml min-1 by
the mass flow controller. Water vapor
concentration in the sampled air is minimized to
be held below 0.1 %. CO2 concentration data
are recorded at an interval of 1 ~ 2 seconds
and they are averaged over 10 minutes for
further analysis. Wind direction and black carbon
mass concentration are used to filter out
possible contaminated air sample due to the
power plant and other sources in the station.
Two levels of standard CO2 (361.68 ± 0.2 ppm,
383.69 ± 0.2 ppm) are measured at aninterval
of 15-day to monitor the drift of the instrument
with time. The instrument is calibrated with new
coefficients when the concentration is different
from standard gas concentration over 0.1 ppm.
Figure 3 shows the variation of monthly-averaged
CO2 concentration in 2010. It ranged from
384.30 (± 0.32) ppm in February to 387.93 (±
0.17) ppm in October. There are two
characteristics in the annual variation of CO2
concentration. One is that the difference between
the maximum value and the minimum one was
3.63 ppm, a relative high difference. Based on
the CO2 data at the Jubany station ~ 6 km
away from the King Sejong station, the
difference was less than 3.0 ppm except for
3.58 in 2005. Second one is that the CO2
concentration in February was lower than one in
January. To understand the annual variation of
CO2 including low CO2 concentration at the site,
further analysis are in progress such as the
investigation on chlorophyll concentration sampled
near the station together with other supplementary
data.
T im e (M o n th )
D e c J a n F e b M a r A p r M a y J u n J u l A u g S e p O c t N o v D e c J a n
CO
2 C
onc.
(ppm
)
3 8 3
3 8 4
3 8 5
3 8 6
3 8 7
3 8 8
3 8 9
Figure 3. Monthly averaged CO2 concentration
at the King Sejong station in 2010.
Error bar indicates the standard
deviation.

20 Asian GAW Greenhouse Gases Newsletter
REFERENCES
Crosson, E.R., 2008, A cavity ring-down analyzer for measuring atmospheric levels of methane, carbon
dioxide, and water vapor, Appl. Phys. B 92, 403-408.
Lenton, A., and R. J. Matear (2007), Role of the Southern Annular Mode (SAM) in Southern Ocean
CO2 uptake, Global Biogeochem. Cycles, 21, GB2016, doi:10.1029/2006GB002714
Le Quéré, C., C. Rödenbeck, E.T. Buitenhuis, T. J. Conway, R. Langenfelds, A. Gomez, C.
Labuschagne, M. Ramonet, T. Nakazawa, N. Metzl, and N. Gillett, M. Heimann, 2007.
Saturation of the Southern ocean CO2sink due to recent climate change, Science, 316,
DOI:10.1126/science.1136188, 1735-1738.

Volume No.2, December, 2011 21
MALAYSIA
THE GLOBAL ATMOSPHERE WATCH (GAW) ACTIVITIES IN MALAYSIA
Maznorizan Mohamad and Toh Ying Ying (Malaysian Meteorological Department)
In order to support the Global Atmosphere
Watch (GAW) Programme of World Meteorological
Organization (WMO) as well as to contribute to the
national and international community, Malaysian
Meteorological Department (METMalaysia) has since
established GAW stations to carry out systematic
monitoring of atmospheric constituents in response
to acquire a high quality data to studyand
understand the regional issues of trans-boundary
haze, acid deposition, climate variability, climate
change and stratospheric ozone depletion.
METMalaysia has participated in the worldwide
network of GAW since 1998 and will continue to
play an active role in this international network in
many more years to come. There are presently 3
GAW monitoring stations operated by METMalaysia;
i. Regional GAW station
Located in Petaling Jaya in METMalaysia
Headquarters at Lat: 03°06’N, Long: 101° 39’E
Height above MSL: 87m.
It’s an urban site and started operating in
April 1998.
Figure 1. Regional GAW Station in Petaling Jaya
ii. Regional GAW Station
Located in Cameron Highlands at Lat:
04°28’N, Long: 101°23’E
Height above MSL: 1545 m
It’s a developing rural site and started
operating in early 1999.
Figure 2. Regional GAW Station in Cameron
Highlands
iii. Baseline/ Global GAW Station
Located in Danum Valley Sabah at Lat: 04°
59’N, Long: 117°51’E
Height above MSL: 427 m
It’s a remote site in pristine tropical rain
forest and started operating in 2004.
Figure 3. The Danum Valley Global GAW Station
is located in Pristine Forest, Sabah

22 Asian GAW Greenhouse Gases Newsletter
Figure 4. Global GAW Station in Danum Valley
Since November 2003, METMalaysia has
established a baseline or global GAW station in
Danum Valley, Sabah, located at the northeastern
part of Borneo. Danum Valley is one of the
best-known research sites in tropical rainforests
in the world. The GAW station located within Class
1 forest conservation area which offers an ideal
location for investigating atmospheric-biosphere
interactions in tropical rainforest environment,
study of long-range transport of pollutants and
ability of forests to act as sinks for atmospheric
pollutants. The station is the second of its kind
in Southeast Asia after one in Kototabang,
Sumatra and 23rd such centre worldwide,
provides with reliable high-quality data and
information on atmospheric environment. The
station consists of a laboratory, office, meeting
room, rooftop platform and 100 meter sampling
tower which is the highest point in Danum
Valley.
The Measurement Programme at Danum
Valley GAW Station
The Danum Valley GAW station with a
complete and comprehensive monitoring
programme is actively engaged in the local and
international collaboration and activities with
regard to the atmospheric composition monitoring
campaign. The monitoring programmes at Danum
Valley GAW station are data gathering for
parameters such as rainwater chemical
composition, physical and chemical properties of
aerosol, greenhouse gases (GHGs), reactive
gases and meteorological parameters.
The measurement started in 2004, and
because of its relatively pollution free
environment, Danum Valley GAW station is
considered as one of the ideal site for baseline
measurement of the atmospheric composition as
well as geographically representative of the
background atmosphere of the maritime
southeast Asia and the equatorial region.
There are several instruments installed at the
GAW station and among those are Wet-Only
Sampler, Filter Pack, Passive Sampler, LoFlo
Mark II CO2 Analyzer, Ozone Analyzer, Tapered
Element Oscillating Microbalance (TEOM),
Nephelometer, Multi Angle Absorption Photometer
(MAAP), Precision Filter Radiometer (PFR),
Persistent Organic Pollutants (POPs) PUF Disk
Sampler, Flask Sampling and Automatic Weather
System (AWS).

Volume No.2, December, 2011 23
The following are some of the analysis of
parameters measured using LoFlo, ozone
analyzer and flask sampling.
i) Reactive Gases
Reactive gases such as SO2, NOx, NH3, O3,
H2S, CO, VOC, H2SO4 and HNO3 of dry
deposition ofatmospheric pollutants remain an
elusive contribution to the total deposition of
pollutants from the air to surface. There are
several methods that have been engaged to
measure gaseous concentrations in Danum Valley
namely ozone analyzer, filter pack and passive
sampler.
Surface ozone plays an important role in
physical, chemical and radiative process in the
troposphere and has significantly influenced the
formation of photochemical smog that has an
effect on both biota and human health. The
measurement of surface ozone in Danum Valley
using the THERMO 49i UV Ozone Analyzer is
therefore important to characterize its global
background distribution and at the same time
METMalaysia is collaborating with National
Institute of Environmental Studies (NIES), Japan
Figure 5. The Monthly Mean O3 at Danum Valley
and Cameron Highland
Figure 6. The CO Concentrations at Danum Valley
GAW Station (Nov 2010 – July 2011)
using Flask Sampling to measure the CO
concentrations.
The analysis of the monthly mean ozone
concentrations in Figure 5 have shown that
theozone remained below 15ppb in Danum
Valley and ranged between 9 to 26 ppb in
Cameron Highlands. Whereas, the CO concentrations
ranged between 55 to 143 ppb (refer Figure 6).
ii) Greenhouse gas
In Danum Valley, CO2 concentrations are
measured continuously using CSIRO LoFlo Mark
II Carbon Dioxide Analyzer and automatic Flask
Sampling.
Figure 7 and 8 showed time series of hourly
mean CO2 and the comparison of CO2
concentrations using LoFlo analyzer and flask
sampling respectively. The range of the hourly
mean is between 386 - 396 ppm (Jan) and 385 -
399 ppm (July), whereas for the two different
instruments, the value is ranged between 385 –
400 ppm. Currently only CO2 data from Loflo
analyzer is submitted to the World Data Centre for
GHGs (WDCGG) at Japan Meteorological Agency.
Similarly with CO and in collaboration with
NIES, GHGs such as CH4, N2O and SF6 are
measured using flask sampling starting from
November 2010.
Cameron Highlands

24 Asian GAW Greenhouse Gases Newsletter
Figure 7. The Time Series of Hourly Mean CO2
at Danum Valley GAW Station
Figure 8. The Comparison of CO2 concentrations
using LoFlo Analyzer and Flask Sampling
Figure 9. The CH4 concentrations at Danum
Valley GAW Station (Nov 2010 – July
2011)
Figure 10. The N2O concentrations at Danum
Valley GAW Station (Nov 2010 – July
2011)
Figure 11. The SF6 concentrations at Danum
Valley GAW Station (Nov 2010 – July
2011)
Figure 9, 10 and 11 showed the time series
analysis of CH4, N2O and SF6. The
concentrations of these three GHG (CO2, CH4,
N2O) and SF6 are comparable with the range of
the global average values as issued by the 2009
WMO-GAW Greenhouse Bulletin.
It is known that these three major GHGs are
closely linked to anthropogenic activities and
have strong interactions with the biosphere and
the oceans. This is agreeable with the locality of
GAW Station in Danum Valley which is in the
pristine tropical forest and about 50 km from the
coast.

Volume No.2, December, 2011 25
Collaboration
Since the Danum Valley GAW station started
operatingin 2004, METMalaysia has embarked in
several collaboration with international research
institutes and among those collaboration
programmes are as follows:-
ⅰ. The National Institute of Environmental
Studies, Japan
Flask Sampling to measures greenhouse
gases and reactive gases.
ii. The International data Sharing and data
provider to the WMO World Data Centre
(WDCGG) for the GHGs with Japan
Meteorological Agency (JMA).
iii. The twinning programme with the World
Calibration Centre for physical aerosol
properties which is hosted by the Institute
for Tropospheric Research, Germany has
been ongoing since 2006. The
collaboration is focused on the
measurement of the aerosol physical
properties including the aerosol scattering
and absorption coefficient.
iv. The collaboration with the Environment
Canada on the Global Atmosphere Passive
Sampling (GAPS) programme started in
2005. Danum Valley GAW station is part of
the sampling network with approximately
65 sites on seven continents that was
established to investigate air concentrations
of persistent organic pollutant (POPs).
v. The EANET Activities
The Danum Valley GAW Station is one of
the 46 stations, participated in Acid
Deposition Monitoring Network in East Asia
(EANET) that focused on investigating the
state of acid deposition problem in East
Asia. The Danum Valley GAW station will
continue participating in this network as to
make sure that the atmosphere of this
pristineforest is closely monitored for any
acidic species that threaten its air quality.
vi. The Oxidant and Particle Photochemical
processes above South-East Asian tropical
Rain Forest (OP3) campaign is a three
year scientific research project (Oct. 2007
– Sept. 2010) with the objective to
understand how emissions of reactive trace
gases from tropical rain forest mediate the
regional scale production and processing
of oxidant and particles, and to better
understand the impact of these processes
on local, regional and global scale
atmospheric composition, chemistry and
climate. The consortium of this project
include the UK universities, METMalaysia,
University Malaysia Sabah and Sabah
Foundation
vii. The collaboration with CSIRO, Australia
started with the installation of LoFlo Mark
II to measure the CO2 concentrations in
the pristine forest of Sabah. The CO2 data
set is analyzed to study the pattern of
CO2 in forested area in Southeast Asia.
viii. The collaboration with World Radiation
Centre, Davos Switzerland regarding the
AOD monitoring using Precision Filter
Radiometer (PFR). This collaboration
started in 2007 and is still on-going. The
objective of this collaboration is to
measure the atmospheric AOD through the
vertical column of atmosphere over the

26 Asian GAW Greenhouse Gases Newsletter
equatorial region of Maritime Southeast
Asia.
Future Direction
The GAW Danum Valley is able to provide
good infrastructure for the research activities
focussing on the environment, air quality and
atmospheric composition as well as climate. As
such MET Malaysiais always welcome any
institution to participate and collaborate with us
with the objective of doing an extensive and
significant research work and subsequently
produce research findings that will be beneficial
to both parties and the world community as a
whole.
Reference
OP3-Danum-08, 2007. Oxidant and particle photochemical processes above a South-East Asian
tropical rain forest

(
(