FMT97 2 Ensure Adequate retirement income - OECD. · PDF fileHow to Ensure Adequate Retirement...
21
ISSN 1995-2864 Financial Market Trends © OECD 2009 Pre-publication version for Vol. 2009/2 OECD JOURNAL: FINANCIAL MARKET TRENDS – VOLUME 2009 – ISSUE 2 - ISSN 1995-2864 - © OECD 2009 1 0B Private Pensions and the Financial Crisis: How to Ensure Adequate Retirement Income from DC Pension Plans Pablo Antolin ∗ The current economic and financial crisis has shaken confidence in funded pension systems in general and in defined contribution (DC) pension plans in particular. The crisis has highlighted the impact of market conditions on retirement savings accumulated in DC pension plans and the uncertainty as to whether those retirement savings may prove adequate to finance retirement – particularly for those close to retirement. The purpose of this paper is to provide recommendations on how to ensure adequate retirement income from DC pension plans. In this context, this paper addresses three main questions: 1) How much do people need to save? 2) How can the effects of market risk on DC pension plans be alleviated? 3) How can retirement income be protected during the payout phase? The analysis concludes that in order to deliver adequate retirement income from DC pension plans with a certain degree of certainty, there is a need for comprehensive measures which include: higher contributions; increasing the contribution period by postponing retirement; setting as default options relatively conservative investment policies including life-cycle strategies; and managing risk in the payout phase with inflation- indexed life annuities. ∗ The author is Principal Economist of the Private Pensions Unit in the OECD Directorate for Financial and Enterprise Affairs. He would like to thank participants of the OECD Working Party on Private Pensions for their discussions and comments. The author would also like to thank André Laboul, Stephen Lumpkin, Fiona Stewart and Juan Yermo for their useful comments and suggestions. The financial contribution of BBVA is gratefully acknowledged. The views expressed are the author’s and do not necessarily reflect those of the OECD or its member countries. The author is solely responsible for any errors. The opinions expressed and arguments employed herein do not necessarily reflect the official views of the Organisation or of the governments of its member countries.
Transcript of FMT97 2 Ensure Adequate retirement income - OECD. · PDF fileHow to Ensure Adequate Retirement...

ISSN 1995-2864 Financial Market Trends © OECD 2009 Pre-publication version for Vol. 2009/2
OECD JOURNAL: FINANCIAL MARKET TRENDS – VOLUME 2009 – ISSUE 2 - ISSN 1995-2864 - © OECD 2009 1
0B
Private Pensions and the Financial Crisis: How to Ensure Adequate Retirement Income
from DC Pension Plans
Pablo Antolin ∗
The current economic and financial crisis has shaken confidence in funded pension systems in general and in defined contribution (DC) pension plans in particular. The crisis has highlighted the impact of market conditions on retirement savings accumulated in DC pension plans and the uncertainty as to whether those retirement savings may prove adequate to finance retirement – particularly for those close to retirement. The purpose of this paper is to provide recommendations on how to ensure adequate retirement income from DC pension plans. In this context, this paper addresses three main questions: 1) How much do people need to save? 2) How can the effects of market risk on DC pension plans be alleviated? 3) How can retirement income be protected during the payout phase? The analysis concludes that in order to deliver adequate retirement income from DC pension plans with a certain degree of certainty, there is a need for comprehensive measures which include: higher contributions; increasing the contribution period by postponing retirement; setting as default options relatively conservative investment policies including life-cycle strategies; and managing risk in the payout phase with inflation-indexed life annuities.
∗ The author is Principal Economist of the Private Pensions Unit in the OECD Directorate for Financial and Enterprise Affairs. He would
like to thank participants of the OECD Working Party on Private Pensions for their discussions and comments. The author would also like to thank André Laboul, Stephen Lumpkin, Fiona Stewart and Juan Yermo for their useful comments and suggestions. The financial contribution of BBVA is gratefully acknowledged. The views expressed are the author’s and do not necessarily reflect those of the OECD or its member countries. The author is solely responsible for any errors. The opinions expressed and arguments employed herein do not necessarily reflect the official views of the Organisation or of the governments of its member countries.
PRIVATE PENSIONS AND THE FINANCIAL CRISIS: HOW TO ENSURE ADEQUATE RETIREMENT INCOME FROM DC PENSION PLANS?
2 OECD JOURNAL: FINANCIAL MARKET TRENDS – VOLUME 2009 – ISSUE 2 - ISSN 1995-2864 - © OECD 2009
I. Introduction
The financial crisis has highlighted the impact of market conditions
The current economic and financial crisis has shaken confidence in funded pension systems in general, and in defined contribution (DC) pension plans in particular. The crisis has highlighted the impact of market conditions on retirement savings accumulated in DC pension plans, and the uncertainty as to whether those retirement savings may prove adequate to finance retirement – particularly for those close to retirement.
...on retirement income from DC pension plans
Assessing the adequacy of retirement income from DC pensions and the risks involved is far from straightforward. For one, the adequacy of income depends on the interaction among various pension parameters, some of which are beyond the control of individuals and policy makers. The final realisations of returns on investment, inflation, discount rates and life expectancy are key sources of this type of uncertainty. But risks to adequacy of retirement income can also arise from choices individuals, employers and policy makers make regarding parameters, such as the level of contributions, the length of the contribution and accumulation periods, the structure of the payout phase (that is, how assets accumulated at retirement are allocated), and on whether there are other sources of income to finance retirement, such as public pensions and defined benefit pension arrangements (Antolin, 2008).
This paper provides recommendations to ensure adequate retirement income
The purpose of this paper is to provide recommendations on how to ensure adequate retirement income from DC pension plans.1 In this context, this paper is organised around three key policy questions:
1. How much do people need to save?
2. How can the effects of market risk on DC pension plans be alleviated?
3. How can retirement income be protected during the payout phase?
People need to increase contributions
Section II addresses the first question. It assesses the amount of wages that would be needed to be put aside each period to finance a certain level of retirement income. It looks first at the level of retirement income relative to the final salary at the time of retirement (i.e. the replacement rate) for given values of the choice and risk variables. Second, it assesses the level of the choice variables – contribution rates and the length of the contribution period – needed to achieve a target replacement rate.
… increase the contribution period by postponing retirement
Section III assesses the impact of market conditions at the time of retirement on retirement income from DC pension plans, while section IV addresses the issue of the design of the payout phase and its impact on retirement income – looking at how to protect against both inflation and longevity risk.
… set relatively conservative default options; and manage risk in the payout phase
The final section (V) concludes with some key recommendations. The message stemming from this report is that to deliver adequate retirement income from DC pension plans with some degree of certainty, there is a need for comprehensive measures, which include higher contributions; increasing the contribution period by postponing retirement; setting as default options relatively conservative investment policies including life-cycle strategies; and managing risk in the payout phase with inflation-indexed life annuities.
PRIVATE PENSIONS AND THE FINANCIAL CRISIS: HOW TO ENSURE ADEQUATE RETIREMENT INCOME FROM DC PENSION PLANS?
OECD JOURNAL: FINANCIAL MARKET TRENDS – VOLUME 2009 – ISSUE 2 - ISSN 1995-2864 - © OECD 2009 3
II. How much do people need to save in DC pensions?
People need to put aside between 5% and 15% of wages during their working life to achieve an adequate level of retirement income
The replacement rate is the measure used to assess adequacy
The first issue to address is what constitutes an adequate level of retirement income. The concept of replacement rate – retirement income relative to final salary at the time of retirement – is the most common measure used to assess the adequacy of retirement income. Though this measure is not without problems,2 it is used in the analysis in this paper since it is widely accepted and understood. The target level of the replacement rate is also highly controversial. A general rule of thumb is a target replacement rate of 70%, based on assuming that mortgage costs amount to one third of income and that they are generally paid off just before retiring.3
… and its target level depends on the structure of the overall pension system
The second issue to address is how DC pension plans fit into the overall structure of the country’s pension system. The adequacy of retirement income from DC pension plans depends, in part, on the proportion of retirement income coming from public pensions. Consequently, if an adequate retirement income is taken as a 70% replacement rate, and public pensions provide benefits that amount to, say, 45% of final salary,4 DC pensions may need to provide benefits equal to only 25% of final salary. Alternatively, in countries where DC pensions are the main source of retirement income, they need to provide benefits equal to 70% of final salary.
The replacement rate increases with contributions
The level of replacement rate varies according to different values of pension parameters (Table 1). Obviously, replacement rates increase with contribution rates. There is a linear positive relationship between contribution rates and replacement rates. Contributions represent the flows into pension plans while retirement income (as measured by the replacement rate) corresponds to the flows out of pension plans. As one might expect, increases in the contribution rate, ceteris paribus, lead to increases in retirement income, as the individual will have accumulated more assets at retirement. Table 1 shows this relationship: doubling the contribution rate from 5% to 10% doubles the replacement rate from 25.3% to 50.7%. Equivalently, a 1% increase in the contribution rate will raise the replacement rate 5 ppt (percentage points), ceteris paribus.
… at an accelerating rate with the rate of return on investment, and at a decreasing rate with life expectancy
Moreover, the replacement rate increases at an accelerating rate as the rate of return on investment increases. Therefore, for low rates of return on investment, say 6% (base case in Table 1), a 1% increase lifts the replacement rate 6 ppt, while for high rates of return, say 10%, a 1% increase increases the replacement rate as much as 20 ppt (Table 1). This must have been the justification for shifting from defined benefit (DB) to DC pension plans, while at the same time reducing contribution rates. Unfortunately, the idea of obtaining very high rates of return over a long period, such as 35-40 years, may be wishful thinking.5 The relationship between replacement rates and life expectancy is such that the reduction in replacement rates resulting from higher life expectancy becomes smaller as life expectancy increases. Therefore, future increases in life expectancy will have smaller effects on replacement rates. Finally, an increase in the discount rate of 1 ppt raises replacement rates by 4 ppt, 9 ppt and 13 ppt, depending on the contribution rate.

PRIVATE PENSIONS AND THE FINANCIAL CRISIS: HOW TO ENSURE ADEQUATE RETIREMENT INCOME FROM DC PENSION PLANS?
4 OECD JOURNAL: FINANCIAL MARKET TRENDS – VOLUME 2009 – ISSUE 2 - ISSN 1995-2864 - © OECD 2009
Table 1. Replacement rate outcomes for given values of several pension parameters
5 7 8 9 10 11 10 15 25 30 3.5 5.5
5 25.3 20.4 31.7 40.0 50.9 65.2 84.1 41.7 30.7 22.2 20.2 23.2 27.610 50.7 40.9 63.4 80.1 101.8 130.5 168.3 83.3 61.4 44.5 40.5 46.4 55.215 76.0 61.3 95.1 120.1 152.8 195.7 251.4 125.0 92.1 66.7 60.7 69.6 82.7
Life expectancy at retirement (# of years)
Interest rate (discount rate)Rate of return on investments (%)Base
case1Contribution
rate
Notes: (1) the base case corresponds to individuals entering the workforce at age 25, working steadily for 40 years and retiring at age 65. Wages grow annually according to productivity growth of 1.75% and 2% inflation. Returns on portfolio investment are assumed to be 6% annually in nominal terms. Finally, in order to calculate replacement rates, the exercise assumes that at retirement individuals buy an immediate life annuity. The annuity payment is determined by the value of assets accumulated at retirement, life expectancy set at 20 years, and a long-term riskless interest rate of 4.5% at the time of retirement.
Source: OECD calculations.
The contribution needed depends on the number of years contributing, the number of years expected to be in retirement
The final step in this subsection is to evaluate the amount of wages needed to save for retirement, i.e. the contribution rate, to achieve a certain retirement income given changes in the main parameters of pension systems. This contribution effort depends on the rate of return on investments, the number of years contributing, which in turn is determined by the age entering the labour market and the age retiring, and the number of years expected to be spent in retirement, which is determined by life expectancy. The relationship between the number of years contributing and the number of years in retirement is crucial to assess the adequacy of income.
… the return on investment, interest rates, and life expectancy
Varying the parameters of the pension system will change the level of contribution necessary to achieve a certain replacement rate. Table 2 also shows the contribution rate necessary to achieve a target replacement rate of 25%, 50% or 70% at retirement for different rates of return on investment, interest rates, different life expectancy at retirement and different number of years contributing – either by joining the labour market earlier or by postponing retirement.
Table 2. Contribution rate needed to achieve a target replacement rate given different rates of return on investment, interest rates and life expectancy
Target RR
Base case1 5 7 8 9 10 2.5 3.5 5.5 6.5 10 15 25 30
25 5.2 6.4 4.1 3.3 2.6 2.0 6.1 5.6 4.8 4.5 3.1 4.3 5.9 6.550 10.3 12.8 8.2 6.5 5.1 4.0 12.1 11.2 9.6 8.9 6.3 8.5 11.8 12.970 14.4 17.9 11.5 9.1 7.2 5.6 17.0 15.6 13.4 12.5 8.8 11.9 16.5 18.1
Interest rate - Discount rateLife expectancy at retirement
(# of years)Rate of return on investments (%)
Notes: (1) the base case corresponds to individuals entering the workforce at age 25, working steadily for 40 years and retiring at age 65. Wages grow annually according to productivity growth of 1.75% and 2% inflation. Returns on portfolio investment are assumed to be 6% annually in nominal terms. Finally, in order to calculate replacement rates, the exercise assumes that at retirement individuals buy an immediate life annuity. The annuity payment is determined by the value of assets accumulated at retirement, life expectancy set at 20 years and a long-term riskless interest rate of 4.5% at the time of retirement.
Source: OECD calculations.
Contributions needed fall with higher rate of returns on
The impact on required contributions of changes in the rate of return on investment is higher the lower the rate of return. In this context, for lower rates of return, say 5%, a 1 ppt increase in the rate of return decreases the contribution

PRIVATE PENSIONS AND THE FINANCIAL CRISIS: HOW TO ENSURE ADEQUATE RETIREMENT INCOME FROM DC PENSION PLANS?
OECD JOURNAL: FINANCIAL MARKET TRENDS – VOLUME 2009 – ISSUE 2 - ISSN 1995-2864 - © OECD 2009 5
investment rate necessary to achieve a target replacement rate of 50% by almost 3 ppt. By contrast, for higher rates of return, say 9%, a 1 ppt increase in the rate of return decreases the contribution rate necessary to achieve a target replacement rate of 50% by 1.3 ppt. Table 2 also shows that the impact on contribution rates is smaller the smaller the target replacement rate (e.g. 25%), and vice versa for higher target replacement rates (e.g. 70%).
…and with higher discount rates
Higher discount rates reduce the contribution effort. As interest rates increase, the annuity conversion factor falls. As a result of lower annuity conversion factors, the amount of retirement income that an immediate life annuity bought at retirement will provide increases. Comparatively, the impact of a 1 ppt change in interest rates on the contribution effort is smaller than the impact of a 1 ppt change in rate of returns on investment.
… and higher life expectancy, but at a decreasing rate
Increases in life expectancy increase the contribution rate needed to achieve a certain level of retirement income. However, this increase is not linear as the increase in contribution rates needed is lower the higher the life expectancy. For example, looking at Table 2 (second panel), the contribution rate almost doubles when life expectancy doubles from 10 to 20 years, yet it increases only by approximately one third when life expectancy doubles from 20 to 30 years. This is an interesting result because it implies that as life expectancy becomes higher, the contribution effort required to maintain the same target replacement rate falls.
There is a need to put aside 5% to 15% of wages
Thus, depending on the target replacement rate there is a need to put aside a meaningful amount of wages to finance retirement – somewhere between 5% and 15%. Additionally, as life expectancy increases, the contribution effort required to maintain the adequacy of retirement income becomes less taxing.
Lengthening the contribution period by postponing retirement is the more efficient approach to increase retirement income
Adequacy is linked to the relationship between years saving for retirement and years in retirement
A key relationship used to assess the adequacy of retirement income is the number of years savings for retirement relative to the number of years in retirement. The higher this ratio, the higher the contribution effort required to achieve a target replacement rate and vice versa. The impact of the length of the period contributing to DC plans or saving for retirement on the contribution rate is negative. The longer the contributing period, the smaller the contribution effort necessary to achieve the same target level of retirement income. Table 3 shows that as people contribute for one or five years longer, the contribution rate needed to keep the same replacement rate – the contribution effort – falls.
Years of saving increase by starting to save earlier or by postponing retirement
However, the magnitude of the change in the contribution rate depends on whether the change in the number of years contributing is due to joining the labour market earlier or to postponing retirement. Focusing on the relationship between the number of years contributing and the number of years in retirement, postponing retirement one year affects in the right direction both the numerator – by increasing the number of years saving for retirement – and the denominator – by decreasing the number of years in retirement – reinforcing the positive effect of saving for retirement for one more year. Joining the labour force a year earlier

PRIVATE PENSIONS AND THE FINANCIAL CRISIS: HOW TO ENSURE ADEQUATE RETIREMENT INCOME FROM DC PENSION PLANS?
6 OECD JOURNAL: FINANCIAL MARKET TRENDS – VOLUME 2009 – ISSUE 2 - ISSN 1995-2864 - © OECD 2009
increases only the numerator. Therefore, increases in the number of years contributing for retirement by postponing retirement has a larger impact on contribution rates because the number of years in retirement decreases as well. Assuming 40 years of contributions to finance retirement and a target replacement rate of 50%, increasing the period contributing by one year by postponing retirement reduces the contribution effort by more than ½ ppt from 10.3% to 9.6% (Table 3). Increasing the contribution period by joining the labour market one year earlier requires a contribution effort of 9.9% instead of 10.3%, less than ½ ppt.
Table 3. Contribution effort given different lengths of the period contributing
Notes: (1) The base case correspond s to individuals entering the workforce at age 25, working steadily for 40 years and retiring at age 65. Wages grow annually according to productivity growth of 1.75% and 2% inflation. Returns on portfolio investment are assumed to be 6% annually in nominal terms. Finally, in order to calculate replacement rates, the exercise assumes that at retirement individuals buy an immediate life annuity. The annuity payment is determined by the value of assets accumulated at retirement, life expectancy set at 20 years and a long-term riskless interest rate of 4.5% at the time of retirement.
Source: OECD calculations.
III. How can the impact of negative market conditions at the time of retirement be alleviated?
Changing market conditions lead to volatile retirement income from DC plans
Depending on the market conditions at the time of retirement, retirement income from DC pension plans can be quite volatile. The current financial and economic crisis has highlighted the importance of market conditions at the time of retirement for the retirement income from DC pension plans. For example, two people with the same employment histories i.e. the same number of years contributing to a DC plan and the same contribution rate, wage growth profile and retirement age, would enjoy very different retirement incomes depending on whether they retired at the end of 2007 versus the end of 2008. This difference in retirement income is the result of different market conditions prevailing in these two years.6
Guarantees and investment default options may address this volatility
Policy has focused on whether guarantees and default investment options would reduce this volatility in retirement income. The volatility of retirement income due to the timing of retirement has led policy makers and regulators to consider changes in the design of DC pension plans. For example, they are revisiting the appropriateness of introducing guarantees in DC pension plans, in particular guaranteed minimum returns. Additionally, they are examining the benefits of requiring life-cycle strategies as default investment strategies.
Using hypothetical replacement rates from DC plans, this
Consequently, this section examines the volatility of retirement income derived from DC pension plans and whether having minimum return guarantees and/or life-cycle investment strategies would have reduced such volatility. For this
Target RR
Base case 1
1 year 5 yrs 1 year 5 yrs25 5.2 5.0 4.3 4.8 3.650 10.3 9.9 8.6 9.6 7.170 14.4 13.9 12.1 13.5 10.0
Increase in the length of the period contributing by
Joining labourmarket earlier
Postponingretirement

PRIVATE PENSIONS AND THE FINANCIAL CRISIS: HOW TO ENSURE ADEQUATE RETIREMENT INCOME FROM DC PENSION PLANS?
OECD JOURNAL: FINANCIAL MARKET TRENDS – VOLUME 2009 – ISSUE 2 - ISSN 1995-2864 - © OECD 2009 7
section assesses the magnitude of the market impact and the effectiveness of those measures
purpose, this section constructs hypothetical replacement rates for individuals with the same labour histories but retiring in different years from the 1940s until 2008 using historical data on equity and fixed income returns, as well as inflation for Japan and the United States.7 The following policy issues are addressed: i) the magnitude of the impact of the timing of retirement on retirement income; ii) whether introducing minimum guaranteed returns and/or a life-cycle investment strategy as an alternative default option would smooth out fluctuations in retirement income; and iii) whether individuals would have been better off with a pension system that guarantees at least the growth of wages in nominal terms.8
Different market conditions at the time of retirement create a lot of volatility in retirement income from DC pensions
The impact of the time at which people retire on retirement income from DC plans can be quite large
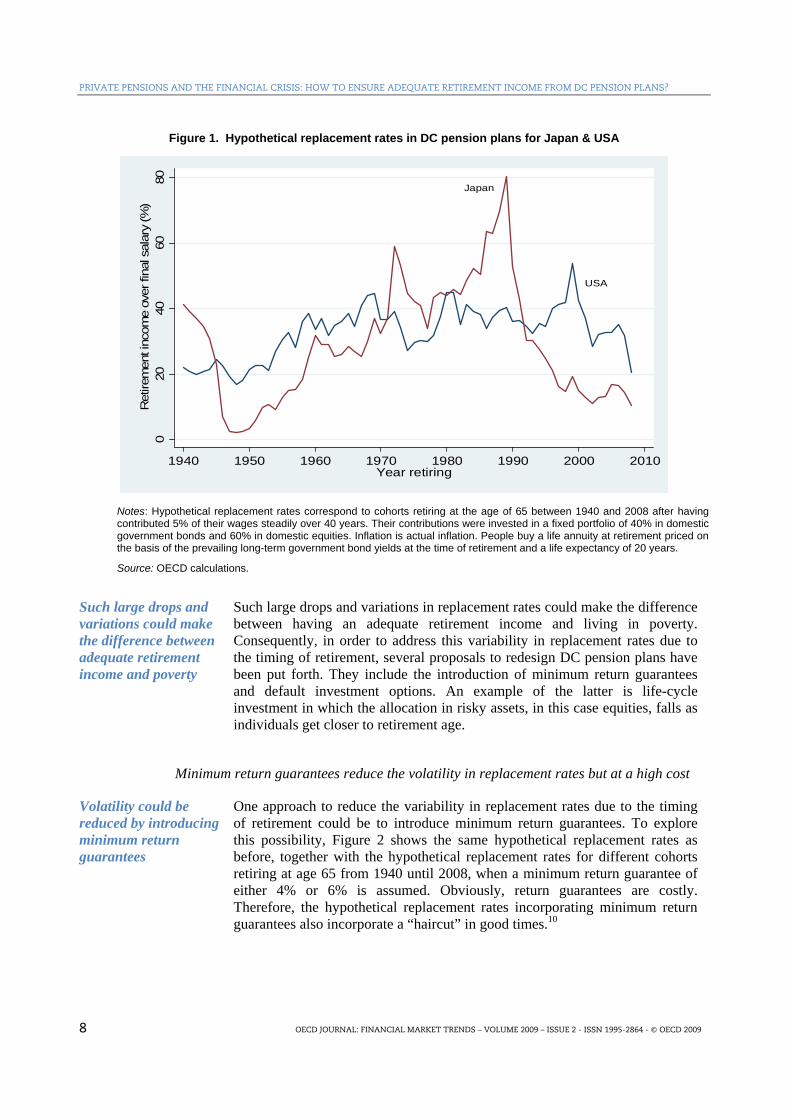
The impact that the time at which people retire has on their retirement income can be quite large. Figure 1 shows the hypothetical replacement rate in DC pension plans of individuals sharing the same work history but retiring in different years and thus being exposed to different market conditions.9 The first cohort retires in 1940 and the last cohort retires at the end of 2008. As a result of being exposed to different market conditions, two individuals with the same labour histories but retiring in two different years (e.g. 2007 and 2008) would have markedly different replacement rates (see the analysis in Figure 1).
For example, the different market conditions prevailing in 2007 and 2008 could have meant a drop in replacement rates close to 10 ppt
The different market conditions prevailing in 2007 and 2008, i.e. the market crash of 2008, could have led to a drop in replacement rates of almost 10 ppt. For example, an individual in the United States lucky enough to have reached retirement age (65 years old) in 2007 would have enjoyed a replacement rate equal to 24%, while the unlucky individual reaching the age of 65 at the end of 2008 would have enjoyed a replace rate of only 15%. Hypothetical replacement rates in Japan would have also been lower in 2008 compared to 2007. In the United States, people retiring in 1999 would have enjoyed the highest replacement rate ever from DC plans, around 39%, while those who reached retirement age just a few years later in 2002 would have enjoyed a replacement rate of 22%, a drop of 17 ppt. It is interesting to note that the large drop in replacement rates in the early 2000s did not produce as much of a backlash against DC pension plans as the fall in 2008. In the early 2000s, replacement rates fell from quite high levels back to previous levels. The high replacement rates of the late 1990s could have been perceived as positive outliers. In comparison, the large drops in replacement rates in 2008 to very low (below average) levels could be seen as negative outliers. The case of Japan is quite noteworthy: hypothetical replacement rates could have fallen as much as 30 ppt back in the early 1990s. But, most importantly, the lost decade of market losses and negative inflation would have had a very negative impact on replacement rates from DC plans. The question that comes to mind is whether the United States and Europe are heading for a lost decade like Japan in the 1990s, making saving in DC pension plans very unattractive, or whether a strong recovery in the markets will arrive sooner rather than later.
PRIVATE PENSIONS AND THE FINANCIAL CRISIS: HOW TO ENSURE ADEQUATE RETIREMENT INCOME FROM DC PENSION PLANS?
8 OECD JOURNAL: FINANCIAL MARKET TRENDS – VOLUME 2009 – ISSUE 2 - ISSN 1995-2864 - © OECD 2009
Figure 1. Hypothetical replacement rates in DC pension plans for Japan & USA
Japan
USA
020
4060
80R
etire
men
t inc
ome
over
fina
l sal
ary
(%)
1940 1950 1960 1970 1980 1990 2000 2010Year retiring
Notes: Hypothetical replacement rates correspond to cohorts retiring at the age of 65 between 1940 and 2008 after having contributed 5% of their wages steadily over 40 years. Their contributions were invested in a fixed portfolio of 40% in domestic government bonds and 60% in domestic equities. Inflation is actual inflation. People buy a life annuity at retirement priced on the basis of the prevailing long-term government bond yields at the time of retirement and a life expectancy of 20 years.
Source: OECD calculations.
Such large drops and variations could make the difference between adequate retirement income and poverty
Such large drops and variations in replacement rates could make the difference between having an adequate retirement income and living in poverty. Consequently, in order to address this variability in replacement rates due to the timing of retirement, several proposals to redesign DC pension plans have been put forth. They include the introduction of minimum return guarantees and default investment options. An example of the latter is life-cycle investment in which the allocation in risky assets, in this case equities, falls as individuals get closer to retirement age.
Minimum return guarantees reduce the volatility in replacement rates but at a high cost
Volatility could be reduced by introducing minimum return guarantees
One approach to reduce the variability in replacement rates due to the timing of retirement could be to introduce minimum return guarantees. To explore this possibility, Figure 2 shows the same hypothetical replacement rates as before, together with the hypothetical replacement rates for different cohorts retiring at age 65 from 1940 until 2008, when a minimum return guarantee of either 4% or 6% is assumed. Obviously, return guarantees are costly. Therefore, the hypothetical replacement rates incorporating minimum return guarantees also incorporate a “haircut” in good times.10

PRIVATE PENSIONS AND THE FINANCIAL CRISIS: HOW TO ENSURE ADEQUATE RETIREMENT INCOME FROM DC PENSION PLANS?
OECD JOURNAL: FINANCIAL MARKET TRENDS – VOLUME 2009 – ISSUE 2 - ISSN 1995-2864 - © OECD 2009 9
Figure 2. Hypothetical replacement rates in DC pension plans for Japan & USA
Market returns
Guaranteed returns (4% or 80% market)
Guaranteed returns (6% or 70% market)
USA0
510
1520
2530
3540
4550
55R
etire
men
t inc
ome
over
fina
l sal
ary
(%)
1940 1950 1960 1970 1980 1990 2000 2010Year retiring
Market returns
Guaranteed returns (4% or 80% market)
Guaranteed returns (6% or 70% market)
Japan
010
2030
4050
6070
80R
etire
men
t inc
ome
over
fina
l sal
ary
(%)
1940 1950 1960 1970 1980 1990 2000 2010Year retiring
Notes: Hypothetical replacement rates correspond to cohorts retiring at the age of 65 between 1940 and 2008 after having contributed 5% of their wages steadily over 40 years. Their contributions were invested in a fixed portfolio of 40% in domestic government bonds and 60% in domestic equities. Inflation is actual inflation. People buy a life annuity at retirement priced on the basis of the prevailing long-term government bond yields at the time of retirement and a life expectancy of 20 years.
Source: OECD calculations.
Minimum return guarantees do indeed reduce the volatility in replacement rates
Introducing minimum return guarantees does indeed reduce the volatility in replacement rates. Minimum return guarantees succeed in setting a floor on replacement rates, but this floor will not be binding unless the minimum guaranteed return is set quite high (e.g. 6% or higher). The results below show

PRIVATE PENSIONS AND THE FINANCIAL CRISIS: HOW TO ENSURE ADEQUATE RETIREMENT INCOME FROM DC PENSION PLANS?
10 OECD JOURNAL: FINANCIAL MARKET TRENDS – VOLUME 2009 – ISSUE 2 - ISSN 1995-2864 - © OECD 2009
that guaranteed returns of less than 4% would have never yielded replacement rates over the sample period higher than those that could be obtained by a fixed portfolio with 60% invested in equities and 40% in bonds. Guaranteed returns equal to 4% would have provided higher retirement income than the fixed portfolio from 1940 until the early 1950s. Guaranteed returns equal to 6% would have provided a binding floor up to the early 1980s, but would have missed the big upturn in equities over the next 25 years. Replacement rates in 2008 would have been higher in the fixed portfolio allocation than with a guaranteed minimum return of 6% because of the upswing in equities over the previous 25 years.
Yet, only relatively high minimum return guarantees would work
Yet, only relatively high minimum return guarantees would reduce market fluctuations in replacement rates and, at the same time, provide replacement rates somewhat comparable to market replacement rates. Only minimum return guarantees well above the riskless rate of return would work. Unfortunately, only insurers willing to bear more risk than the average market aversion to risk (i.e. more than other investors) could guarantee such high guarantee returns, which raises the issue of counterparty risk (Munell, 2009).
An additional guarantee is to provide returns equal to nominal wage growth
An additional guarantee in DC pension plans worth examining is to provide returns equal to nominal wage growth. The theoretical internal rate of return of pay-as-you-go (PAYG) financed pension arrangements is nominal wage growth. However, due to political increases in benefit rights, the rate of return on PAYG plans may in practice be higher. Nevertheless, it is worth comparing the hypothetical replacement rates of DC plans based on market returns for a fixed portfolio with the hypothetical replacement rates of a DC plan based on returns equal to nominal wage growth (Figure 3).
Theoretical replacement rates from DC plans returning nominal wage growth would have been lower except in periods of high wage inflation (1970s)
Hypothetical replacement rates from DC plans returning nominal wage growth on investments would have failed to match those of DC pension plans based on market rates. As a result of inflation and wage moderation since the mid-1980s, replacement rates actually would have been higher in DC plans yielding market returns than in DC plans yielding returns equal to nominal wage growth. Only in the era of high inflation and wage growth (the 1970s) would the theoretical replacement rates of DC plans matching nominal wage growth have been higher than those of DC plans earning market returns. Therefore, unless market returns are dismal (i.e. a long-lasting depression, Japan 1990s style) or wage inflation is high (obviously not a policy to endorse), market conditions may deliver higher replacement rates than DC plans based on nominal wage growth.
Default options like life-cycle investment policies would have succeeded in reducing the magnitude of the impact of the timing of retirement
Life-cycle investment strategies would have reduced the impact of timing
Life-cycle investment strategies would have reduced the magnitude of the impact of the timing of retirement when compared to fixed portfolio strategies but would have failed to fully remove it (Figure 3).11 For example, when using life-cycle investment strategies, the replacement rate of persons in the United States who would have retired at the end of 2008 would have been 19% compared to 22% in 2007, just a 3 ppt drop. Conversely, the drop in replacement rate when assuming a fixed portfolio investment strategy would have been from 28% to 19%.12

PRIVATE PENSIONS AND THE FINANCIAL CRISIS: HOW TO ENSURE ADEQUATE RETIREMENT INCOME FROM DC PENSION PLANS?
OECD JOURNAL: FINANCIAL MARKET TRENDS – VOLUME 2009 – ISSUE 2 - ISSN 1995-2864 - © OECD 2009 11
However, they may have resulted in lower replacement rates during market upswings
However, life-cycle investment strategies may have resulted in lower replacement rates for those individuals who would have retired during the market upswing. Additionally, life-cycle investment strategies may tend to reduce the average replacement rate, increasing the contribution effort needed to achieve the same target replacement rate than with a fixed portfolio strategy.13
Figure 3. Replacement rates with life-cycle and fixed allocation investment strategies
USAFixed portfolio (50-50)
Life cycle
05
1015
2025
3035
4045
50R
etire
men
t inc
ome
over
fina
l sal
ary
(%)
1940 1950 1960 1970 1980 1990 2000 2010Year retiring
JapanFixed portfolio (50-50)
Life cycle
05
1015
2025
3035
4045
5055
60R
etire
men
t inc
ome
over
fina
l sal
ary
(%)
1940 1950 1960 1970 1980 1990 2000 2010Year retiring
Notes: Replacement rates shown correspond to cohorts retiring at the age of 65 between 1940 and 2008 after having contributed 5% of their wages steadily over 40 years. Their contributions were invested in a fixed portfolio of 50% in domestic government bonds and 50% in domestic equities. Inflation is actual inflation. People buy a life annuity at retirement priced according to the prevailing long-term interest rates of government bonds at the time of retirement and a life expectancy of 20 years.
Source: OECD calculations.

PRIVATE PENSIONS AND THE FINANCIAL CRISIS: HOW TO ENSURE ADEQUATE RETIREMENT INCOME FROM DC PENSION PLANS?
12 OECD JOURNAL: FINANCIAL MARKET TRENDS – VOLUME 2009 – ISSUE 2 - ISSN 1995-2864 - © OECD 2009
The threat posed by varying market conditions to retirement income can be alleviated by guarantees and life-cycle investment strategies
This section has shown that the threat posed by varying market conditions at the time of retirement to retirement income from DC pensions is not negligible. The difference in replacement rates can be quite large, for example, 10 ppt when comparing 2008 with 2007. Minimum return guarantees and life-cycle investment strategies succeed in smoothing the fluctuations in replacement rates but at a cost. The level of the minimum guarantee has to be relatively high, which implies high costs and raises questions as to who would be willing to offer those guarantees. The use of life-cycle investment strategies means losing out on market upswings. Finally, a hypothetical DC pension plan paying a return equal to the growth in nominal wages would have failed to perform better than a DC pension plan fully exposed to market returns with a portfolio 60% invested in equities and 40% in bonds, except in periods of high inflation. In conclusion, countries where the main source of retirement income comes from DC pensions could introduce life-cycle investing as the default investment option to smooth out the fluctuations in replacement rates. Even though life-cycle strategies may not be optimal from a purely investment return point of view, they may achieve the goal of keeping replacement rates from falling too much when market conditions worsen.
IV. How can retirement income be protected during the payout phase?
The lack of inflation indexation could reduce the purchasing power of retirement income by as much as one third in 20 years
Private pensions may not always be indexed to inflation
The purchasing power of pension benefits during retirement depends on whether they are indexed to inflation. In general, annuity products provide a constant periodic stream of income in nominal terms. This constant amount of pension benefits will buy less as prices increase. Consequently, with inflation, the purchasing power of fixed pension benefits falls during retirement. 14 Alternatively, public pension benefits are indexed to inflation in order to maintain the purchasing power of retirees. Fortunately, there are annuity products that provide inflation-indexed pension benefits such as inflation-indexed life annuities.15
The lack of inflation indexing leads to pension purchasing power losses of as much as a third in just 20 years
Assuming that pension benefits from DC plans are not indexed to inflation, the purchasing power of those benefits could fall by as much as one third in just 20 years.16 Replacement rates measure retirement income relative to final salary. Therefore, for a constant periodic payment, the replacement rate will remain constant during retirement. However, this fixed amount of retirement income will not buy the same amount of goods because of inflation. As a result, a constant replacement rate hides a loss of purchasing power. Most central banks that target a specific inflation rate have a 2% target. But if actual inflation were at this level on average over a 20-year period, the purchasing power of a retirement income fixed in nominal terms (i.e. a constant nominal replacement rate during retirement) could fall by as much as one third (Table 4). The drop could be as much as 50% over a 35-year period. If inflation were to be 1 ppt higher, i.e. 3%, the loss of purchasing power could be as much as 45% in 20 years (Table 4).

PRIVATE PENSIONS AND THE FINANCIAL CRISIS: HOW TO ENSURE ADEQUATE RETIREMENT INCOME FROM DC PENSION PLANS?
OECD JOURNAL: FINANCIAL MARKET TRENDS – VOLUME 2009 – ISSUE 2 - ISSN 1995-2864 - © OECD 2009 13
Table 4. Purchasing power of retirement income during retirement
65 70 75 80 85 90 95 100 105Fixed retirement income
(% final salary) 25 25 25 25 25 25 25 25 25Purchasing power
(inflation=2%) 100.0 90.6 82.0 74.3 67.3 61.0 55.2 50.0 45.3Fixed retirement income
(% final salary) 25 25 25 25 25 25 25 25 25Purchasing power
(inflation=3%) 100.0 86.3 74.4 64.2 55.4 47.8 41.2 35.5 30.7
Inflation-indexed retirement income (% final salary) 25.0 27.6 30.5 33.6 37.1 41.0 45.3 50.0 55.2
Purchasing power (inflation=2%) 100 100 100 100 100 100 100 100 100
Source: OECD calculations.
To avoid such a loss, pension benefits from DC plans need to be indexed to inflation
Therefore, to avoid having retirement income from DC pension plans lose purchasing power during retirement, it is advisable to index it to inflation. However, this recommendation depends on the country context (Antolin, 2008). In countries where retirement income from DC plans is the main source of income to finance retirement, the need to index to inflation is greater than in countries where most of retirement income comes from public pensions, which are already indexed to inflation.
However, indexing pension benefits to inflation requires a bigger saving effort
However, indexing pension benefits to inflation requires a bigger saving effort. The saving effort (i.e. the contribution rate needed) to maintain the same target replacement rate independently of whether pensions are indexed to inflation needs to be higher when indexing pension benefits to inflation (in order to keep purchasing power constant). Table 5 shows that, as a result of indexing pension benefits to inflation, keeping the target replacement rate at 25% with an inflation rate of 2% requires the individual to contribute 1 ppt more every year. For target replacement rates of 50% and 70%, the contribution efforts are 1.9 ppt and 2.6 ppt higher respectively.
Table 5. Increase in contribution rates when pension benefits are indexed to inflation1
25 50 70Increase in contribution rates (percentage points) 0.93 1.86 2.61
Replacement rate
Notes: (1) This is the increase in contribution rates necessary to maintain replacement rates during the first year in retirement equal, independently of whether pension benefits are indexed to inflation or not.
Source: OECD calculations.
Combining life annuities with programmed withdrawals allows for a balance between flexibility, liquidity and bequest motives and protection from longevity risk
There are different ways of allocating assets accumulated to finance retirement
There are different ways of allocating assets accumulated to finance retirement (Antolin, 2008). Whether assets accumulated at retirement are used to buy a life annuity (fixed or variable), to finance a programmed withdrawal (fixed or variable), or any combination of these options may affect retirement income. This

PRIVATE PENSIONS AND THE FINANCIAL CRISIS: HOW TO ENSURE ADEQUATE RETIREMENT INCOME FROM DC PENSION PLANS?
14 OECD JOURNAL: FINANCIAL MARKET TRENDS – VOLUME 2009 – ISSUE 2 - ISSN 1995-2864 - © OECD 2009
section examines the impact on retirement income of five different payout options by looking at the retirement income relative to the final salary (i.e. the replacement rate) that retirees would receive at different ages (i.e. the age profile of replacement rates), as well as the accumulated retirement payments that would be received by retirees at each year in retirement (i.e. the age profile of accumulated payments).
Assets accumulated at retirement could be used to buy life annuities
Assets accumulated at retirement could be used to buy life annuities. The results in the previous two sections are based, in part, on the assumption that assets accumulated in pension accounts at retirement are used to buy an immediate fixed life annuity. Consequently, retirement savings are transformed into a periodic constant stream of income to finance retirement. This stream of income can be expressed in terms of final salary, which constitutes the replacement rate. However, Section III showed that fixed life annuities suffer a major potential problem: the purchasing power of that constant periodic stream of income falls over time as long as there is positive inflation. To overcome this weakness and maintain constant purchasing power, the individual could use the assets accumulated at retirement to buy an inflation-indexed life annuity.
…and also to finance programmed withdrawals
Assets accumulated at retirement could also be used to finance programmed withdrawals, which can take several forms. A fixed programmed withdrawal pays a periodic constant stream of income for a certain period. It can be calculated by dividing the assets accumulated at retirement by an annuity factor corresponding to an annuity certain.17 Alternatively, those assets could be used to finance a variable programmed withdrawal that pays a variable periodic stream of income. The periodic stream of income is variable because, every year, the amount of assets remaining, adjusted for portfolio gains the previous year, is divided by a changing life expectancy to obtain that year’s payment. For example, one might assume the life expectancy at age 65 to be 20 years, that is, the person may live up to the age of 85. However, after reaching 85 the individual’s life expectancy may be expected to be eight more years, bringing the age the person may be expected to live to 93. Both programmed withdrawals allow retirees to benefit from gains in portfolio investments. Moreover, as long as returns on investment are over and above inflation, both programmed withdrawals protect retirees from purchasing power losses resulting from inflation.
Life annuities provide protection from longevity risk, while programmed withdrawals allow for flexibility, liquidity and bequests
Life annuities provide protection from longevity risk, while programmed withdrawals allow for flexibility, liquidity and bequests. Buying a life annuity at retirement is an irreversible decision under which retirees lose ownership of their accumulated assets, but they offload longevity risk to the annuity provider. Joining a programmed withdrawal permits retirees to keep control of their accumulated assets so that if they were to pass away earlier than expected, the remaining balances go to their spouses or heirs. However, under a programmed withdrawal, retirees bear the longevity risk. Additionally, in the case of a fixed programmed withdrawal, the downside risk of market returns falls on the pension fund, whereas the retiree bears the downside risk in the case of a variable programmed withdrawal. Finally, all payout options provide relative protection from inflation, apart from fixed life annuities. However, only inflation-indexed life annuities provide full guaranteed protection against inflation.

PRIVATE PENSIONS AND THE FINANCIAL CRISIS: HOW TO ENSURE ADEQUATE RETIREMENT INCOME FROM DC PENSION PLANS?
OECD JOURNAL: FINANCIAL MARKET TRENDS – VOLUME 2009 – ISSUE 2 - ISSN 1995-2864 - © OECD 2009 15
An alternative approach is to combine a deferred life annuity and a programmed withdrawal
An alternative approach to structure the payout phase of DC pension plans is to combine a deferred life annuity and a programmed withdrawal. The deferred life annuity is bought at retirement but starts paying pension benefits at a later stage (e.g., age 85). The balance remaining after buying the deferred life annuity can be used to finance a programmed withdrawal for the intermediate period (e.g. from the age of 65 to 84). The goal is to have protection from longevity risk through the deferred annuity and to have flexibility, liquidity and the bequest option during the first years after retirement.18
… which allows striking a balance between protection from longevity risk on one side, and flexibility, liquidity and bequests on the other side
When choosing between different payout options, there is a balance to strike between protection from longevity risk on one side and flexibility, liquidity and bequests on the other. Assuming that the main criterion is protection from longevity risk, programmed withdrawals can be removed from the picture and only one of the other three payout options including a life annuity fits the criteria. However, when the bequest motive has an important weight in a person’s decision-making process, then programmed withdrawals look attractive. Programmed withdrawals also look attractive when a time preference for up-front higher retirement payments is a factor under consideration.
Assessing each option
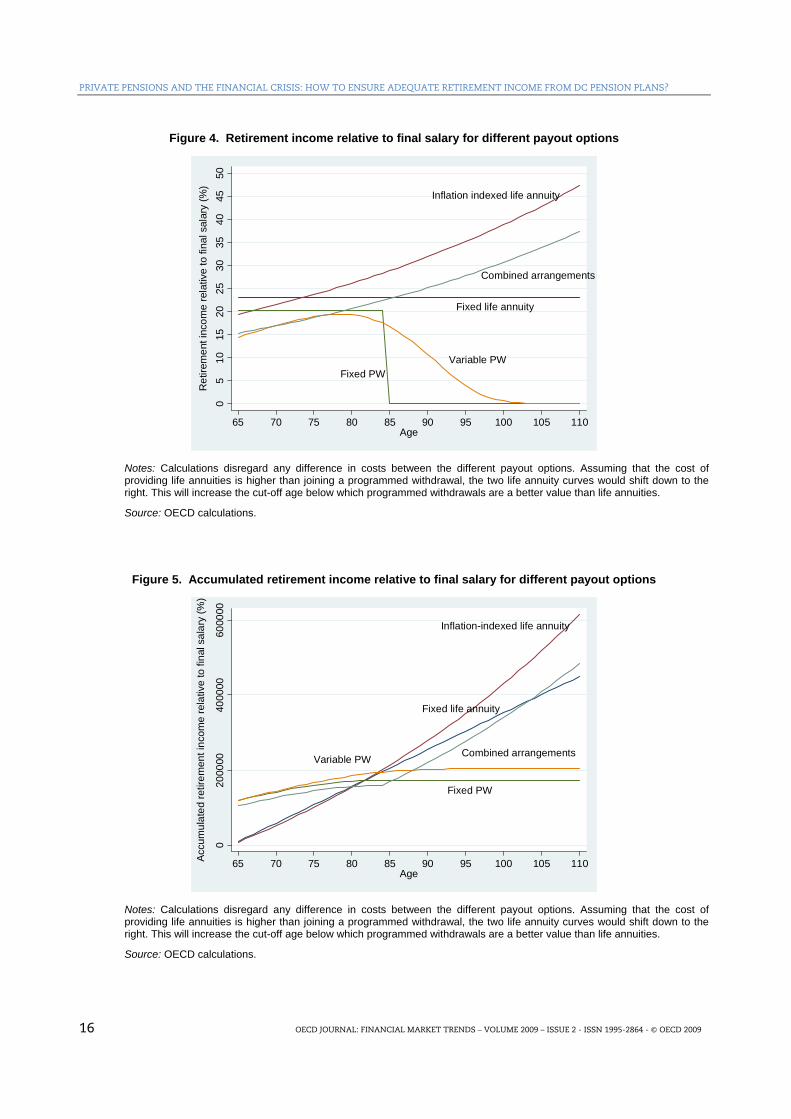
What follows is the assessment of the choice to be made between different payout options based on an examination of the replacement rates at different ages and the accumulated pension payments at each year in retirement. This age profile of replacement rates and accumulated pension payments allows the assessment of the benefits and drawbacks of each of the payout options, highlighting the trade-off between protection from longevity risk and bequests. The paper looks at five payout options – fixed and variable life annuities, fixed and variable programmed withdrawals, and the combination of a deferred life annuity and programmed withdrawal – which are designed so that their pension wealth is the same. That is, the present value of future pension payments, weighted by the probability of being alive at each age, is the same for all five payout options.19
… retirees may be better off by buying life annuities if the focus is only on the replacement rate at different ages
Retirees may be better off buying life annuities if the focus is only on the replacement rate at different ages. Figure 4 shows retirement payments from each of the five payout options at different ages relative to final salary, that is, the age profile of replacement rates. Life annuities provide a better deal for pensioners than programmed withdrawals. Replacement rates from the inflation-indexed life annuities are larger than for any other payout option, except for the fixed life annuity during the first years in retirement.
… but few retirees buy a life annuity at retirement
Despite the obvious benefits, few retirees buy a life annuity at retirement.20 This “annuity puzzle” is easily explained considering that retirees also attach value to having more money during the early years of retirement to face contingencies (flexibility and liquidity) and that they value the possibility of leaving a bequest if they were to pass away early. Figure 5 shows the amount of accumulated retirement payments that an individual would have received at each year in retirement were he or she to pass away that year. Under a programmed withdrawal, at the moment of death, the balances remaining in each person’s account go to the spouse or other heirs. As a result, when passing away during the first 15 years of retirement, payout options with programmed withdrawal arrangements (e.g. fixed and variable programmed withdrawals and combined arrangements) are better value.21 Yet, life annuities become better value thereafter.22
PRIVATE PENSIONS AND THE FINANCIAL CRISIS: HOW TO ENSURE ADEQUATE RETIREMENT INCOME FROM DC PENSION PLANS?
16 OECD JOURNAL: FINANCIAL MARKET TRENDS – VOLUME 2009 – ISSUE 2 - ISSN 1995-2864 - © OECD 2009
Figure 4. Retirement income relative to final salary for different payout options
Inflation indexed life annuity
Combined arrangements
Fixed life annuity
Variable PWFixed PW
05
1015
2025
3035
4045
50R
etire
men
t inc
ome
rela
tive
to fi
nal s
alar
y (%
)
65 70 75 80 85 90 95 100 105 110Age
Notes: Calculations disregard any difference in costs between the different payout options. Assuming that the cost of providing life annuities is higher than joining a programmed withdrawal, the two life annuity curves would shift down to the right. This will increase the cut-off age below which programmed withdrawals are a better value than life annuities.
Source: OECD calculations.
Figure 5. Accumulated retirement income relative to final salary for different payout options
Inflation-indexed life annuity
Combined arrangements
Fixed life annuity
Fixed PW
Variable PW
020
0000
4000
0060
0000
Accu
mul
ated
retir
emen
t inc
ome
rela
tive
to fi
nal s
alar
y (%
)
65 70 75 80 85 90 95 100 105 110Age
Notes: Calculations disregard any difference in costs between the different payout options. Assuming that the cost of providing life annuities is higher than joining a programmed withdrawal, the two life annuity curves would shift down to the right. This will increase the cut-off age below which programmed withdrawals are a better value than life annuities.
Source: OECD calculations.

PRIVATE PENSIONS AND THE FINANCIAL CRISIS: HOW TO ENSURE ADEQUATE RETIREMENT INCOME FROM DC PENSION PLANS?
OECD JOURNAL: FINANCIAL MARKET TRENDS – VOLUME 2009 – ISSUE 2 - ISSN 1995-2864 - © OECD 2009 17
… because if people were to pass away before the average life expectancy, programmed withdrawals might be better value
There is a point in time during retirement before which bequests make programmed withdrawals better value if individuals were to pass away during that period. This cut-off age is just below the average life expectancy. As retirees get closer to the average life expectancy, the benefits brought about by having the option of leaving bequests dwindle away and the benefits of life annuities, a pension for life, become more relevant. Consequently, after that cut-off age, life annuities become better value. People whose life expectancy is below that cut-off age may therefore be worse off giving their money “away” to annuity providers and thus subsidising those people with a higher life expectancy. Using French life expectancy tables for 2006, the probabilities of surviving until the ages of 80 and 85 having reached the age of 65 are 64% and 44%, respectively.23 Based on these percentages, somewhere between 50% of the people reaching retirement may be better off joining a programmed withdrawal.
Combining a deferred life annuity with a programmed withdrawal may be the best compromise as it provides protection from longevity risk, flexibility, liquidity and room for bequests
Combining a deferred life annuity with a programmed withdrawal may be the best compromise as it provides protection from longevity risk, flexibility, liquidity and room for bequests. When protection from longevity risk is the overriding concern, life annuities are superior (Figure 5), in particular, inflation-indexed life annuities.24 When the main goal is to leave bequests and have higher retirement income upfront, programmed withdrawals and combined arrangements seem to work better than life annuities alone. Combined arrangements may be the best compromise as they provide flexibility, liquidity and the ability to leave bequests during the first years thanks to the programmed withdrawal component, and protection from longevity risk thanks to the deferred annuity. Figure 5 shows that they offer better value than life annuities during the first 15 years of retirement and better value than programmed withdrawals thereafter.
V. Main conclusions and policy recommendations
Having examined the impact of changes in key pension parameters on retirement income from DC pension plans
This paper has examined the impact of changes in key pension parameters on retirement income from DC pension plans. It has looked at parameters such as contributions, length of the period contributing and the period in retirement, investment returns, inflation, interest rates and life expectancy. The paper has also assessed the risk associated with varying market conditions at the time of retirement. Two individuals with identical work histories could end up with markedly different retirement incomes just because they happen to retire in two different years with different market conditions. In this context, the report has also investigated whether different policy proposals e.g. minimum guarantees and life-cycle default strategies could be successful in smoothing out fluctuations in retirement income resulting from those risks. Finally, the report looked at how inflation and different arrangements during the payout phase may affect retirement income.
…the conclusion is that comprehensive measures are needed to deliver adequate and stable retirement incomes
The main conclusions suggest that in order to deliver adequate retirement income from DC pension plans with some degree of certainty there is a need for comprehensive measures, including:
1. Ensuring people save a meaningful amount of their wages every year for retirement. The contribution rate should be between 5% and 15%, depending of the target replacement rate, 25% or 70%, respectively.

PRIVATE PENSIONS AND THE FINANCIAL CRISIS: HOW TO ENSURE ADEQUATE RETIREMENT INCOME FROM DC PENSION PLANS?
18 OECD JOURNAL: FINANCIAL MARKET TRENDS – VOLUME 2009 – ISSUE 2 - ISSN 1995-2864 - © OECD 2009
2. Increasing the length of the contributing period by postponing retirement in order to raise replacement rates.
3. Having pension benefits indexed to inflation to avoid purchasing power losses during retirement.
4. Setting default life-cycle pension funds to smooth volatility in retirement income from DC pension plans caused by varying market conditions at the time of retirement.
5. Using assets accumulated to buy life annuities may be a better arrangement when longevity risk is the overriding concern, while programmed withdrawals are better when bequest is the driving goal. Combining a deferred life annuity bought at the time of retirement that starts paying at later ages (e.g. at the age of 85) with a programmed withdrawal during the intermediate period strikes a nice balance between protection from longevity risk on one hand and liquidity, flexibility and bequests on the other. These combined arrangements provide flexibility, liquidity and bequests during the first years of retirement and protection from longevity risk thereafter.

PRIVATE PENSIONS AND THE FINANCIAL CRISIS: HOW TO ENSURE ADEQUATE RETIREMENT INCOME FROM DC PENSION PLANS?
OECD JOURNAL: FINANCIAL MARKET TRENDS – VOLUME 2009 – ISSUE 2 - ISSN 1995-2864 - © OECD 2009 19
3BNOTES
1 The analysis in this paper is based on a deterministic approach. Antolin (2010b) addresses the impact on retirement
income and the risk of a shortfall when considering those parameters that fall outside the control of individuals, employers and policy makers: investment return, inflation, discount rate and life expectancy. It is important to assess the impact of this uncertainty using stochastic modelling, as that paper does.
2 For example, as replacement rates are calculated at the time of retirement, they fail to signal problems of declining purchasing power or poverty as people age.
3 This target replacement rate may have to be higher for low-income people, for example 100%.
4 This is approximately the un-weighted average replacement rate from public pensions in OECD countries (OECD, 2009).
5 The Credit Suisse Global Investment Returns Yearbook 2009 (Dimson et al., 2009) reports nominal equity, bond and bill returns of 9.2%, 5.2% and 4% in the United States for 1900-2008. The average rate of return for a hypothetical portfolio allocated 60% to equities, 25% to bonds and 15% to bills for all the 40-year periods from 1900 to 2009 would have been 8%.
6 The stock market crashed in 2008, greatly reducing returns on equities. Interest rates on long-term bonds were lower, thereby reducing returns on fixed income instruments and increasing annuity factors. Meanwhile inflation also fell. As a result, assets accumulated in DC plans lost value (how much depended on equity allocations) and could only afford lower annuity payments. Moreover, annuity payments also fell as a result of higher annuity factors resulting from lower long-term interest rates.
7 Results for France and the United Kingdom are available upon request (Antolin, 2010a). Additionally, we have data for several other countries (Australia, Belgium, Canada, Denmark, Germany, Ireland, Italy, South Africa Spain, Sweden, Switzerland, Europe and “world”). Therefore, we could reproduce the same analysis for those countries.
8 PAYG-financed pension arrangements provide, in theory, a rate of return on contributions equal to the rate of growth in nominal wages (generally called internal rate of return). However, in practice, due to political meddling, the internal rate of return of a PAYG-financed pension system can be quite different from the growth rate of nominal wages. This section examines only how much a guarantee equivalent to the theoretical internal rate of return of public pensions would have smoothed out the fluctuation in the retirement income from DC pension plans.
9 The impact of the timing of retirement on retirement income is measured by the ratio of retirement income to the last wage (i.e. replacement rate). The exercise assumes that individuals enter the workforce at age 25, work steadily for 40 years and retire at age 65. They contribute 5% of wages each year to a pension account investing 60% in equities and 40% in bonds. Additionally, the exercise assumes that wages grow 2% annually in real terms, and it uses equity return (which includes dividends) and government bonds return indices from Credit Suisse Global Investment Returns Yearbook 2009 (Dimson et al., 2009) to calculate returns on portfolio investment. Finally, in order to calculate replacement rates, the exercise assumes that at retirement individuals buy an annuity. The annuity payment is determined by the value of assets accumulated at retirement, life expectancy set at 20 years and the long-term riskless interest rate prevailing at the time of retirement, given by long-term government bonds yields.

PRIVATE PENSIONS AND THE FINANCIAL CRISIS: HOW TO ENSURE ADEQUATE RETIREMENT INCOME FROM DC PENSION PLANS?
20 OECD JOURNAL: FINANCIAL MARKET TRENDS – VOLUME 2009 – ISSUE 2 - ISSN 1995-2864 - © OECD 2009
10 The “haircut” is introduced as a percentage of actual market returns. For example, for the 4% guaranteed return, the
haircut is assumed to be 20% of the actual market return. Consequently, 20% is the cost of the guarantee.
11 Under the actual life-cycle investment strategy, the allocation in equities decreases linearly with the age of the individual, reaching 0% at the time of retirement. The allocation in equities decreases from an initial portfolio of 100% in equities. Inversely, the allocation in government bonds increases from an initial allocation of 0% to 100%. This life-cycle allocation has the same average exposure to equities that the fixed portfolio 50% in equities and 50% in bonds used for comparison.
12 The same numbers for Japan are 14.3% to 13.4% for the life-cycle strategy and 13.8% to 10.4% for the fixed portfolio strategy.
13 The stochastic analysis of uncertainty about investment returns, interest rates, inflation and life expectancy examined in Antolin (2010b) would clearly show the costs in terms of contribution effort of life-cycle investment strategies.
14 An additional problem for retirees with low income is that they may fall below the poverty threshold as they age. The average national income increases following inflation plus the growth in productivity gains. Consequently, if retirement income is not adjusted for inflation and productivity growth, retirement income may fall below the relative income poverty threshold over time.
15 Inflation-indexed life annuities exist in the UK annuity market but they fail to attract much demand. Inflation-indexed life annuities are generally more costly than traditional life annuity products.
16 Replacement rates measure retirement income relative to final salary. Therefore, for a constant periodic payment, the replacement rate will remain constant during retirement. However, this fixed amount of retirement income will not buy the same amount of goods because of inflation. As a result, a constant replacement rate hides a loss of purchasing power.
17 An annuity certain is an annuity that pays a periodic constant stream of income for a fixed number of years (e.g. 20 years). After that period, it does not pay anything.
18 The combined deferred life annuity and programmed withdrawal is designed by calculating the annuity factor of an inflation-indexed life annuity using the discount weight factors from the age of 85 onwards but evaluated from the age of 65. This will determine the deferred annuity premium (11.2% of assets at retirement) and the annuity payments from the age of 65 onwards. The remainder of the assets are used to finance a variable inflation-adjusted programmed withdrawal so that after the last payment at the age of 84 there is no balance left. Moreover, the difference between the last programmed withdrawal payment (at the age of 84) and the first payment from the life annuity (at the age of 85) is the inflation adjustment.
19 The calculations for each payout option abstract from costs. This has implications for the analysis discussed later. When calculating the pension wealth of each payout option, programmed withdrawals are not weighted by the probability of surviving at each age because in the event of death the balance is left to heirs.
20 In Chile, as of 2008, only 56.5% of retirees opted for a life annuity instead of a programmed withdrawal.
21 The fixed programmed withdrawal is better only in the first year of retirement. Thereafter, it is always dominated by the variable programmed withdrawal.
22 The inflation-indexed life annuity provides a higher replacement rate than the fixed life annuity or the combined arrangements (Figure 5). However, focusing on accumulated retirement payments at different ages (Figure 6), the fixed life annuity is superior to the inflation-indexed life annuity during the first years of retirement, but it is dominated by the combined arrangements, and the inflation-indexed life annuity at later ages.

PRIVATE PENSIONS AND THE FINANCIAL CRISIS: HOW TO ENSURE ADEQUATE RETIREMENT INCOME FROM DC PENSION PLANS?
OECD JOURNAL: FINANCIAL MARKET TRENDS – VOLUME 2009 – ISSUE 2 - ISSN 1995-2864 - © OECD 2009 21
23 Average life expectancy for males is around 80-83 years after the age of 65.
24 Supply of inflation-indexed life annuities at reasonable prices may be a problem as these annuity products may be costly.
REFERENCES
Antolin, Pablo (2008), “Policy Options for the Payout Phase”, OECD Working Paper Series in Insurance and Private Pensions No. 25.
Antolin, Pablo (2010a), Private pensions and the financial crisis: How to ensure adequate retirement income from DC pension plans, OECD Working Paper Series in Insurance and Private Pensions No. 39.
Antolin, Pablo (2010b), “How to protect retirement income? DC pension plans in a world of uncertainty”, OECD Working Paper Series in Insurance and Private Pensions, forthcoming.
Dimson, Elroy, Paul Marsh, Mike Staunton, and Jonathan J. Wilmot (2009), Credit Suisse Global Investment Returns Yearbook 2009, Credit Suisse Research Institute.
Munnell, Alicia H., Alex Golub-Sass, Richard W. Kopcke, and Anthony Webb (2009) “What does it cost to guarantee returns?”, Center for Retirement Research at Boston College, Brief No. 9-4, February.
OECD (2009), Pensions at a Glance 2009: Retirement-Income Systems in OECD Countries, OECD, Paris.