FlyPrimerBank: An Online Database for Drosophila melanogaster Gene
28
1 FlyPrimerBank: An Online Database for Drosophila melanogaster Gene Expression Analysis and Knockdown Evaluation of RNAi Reagents Yanhui Hu *,§,** , Richelle Sopko *,** , Marianna Foos * , Colleen Kelley * , Ian Flockhart *,§ , Noemie Ammeux * , Xiaowei Wang † , Lizabeth Perkins *, § , Norbert Perrimon *,‡ , Stephanie E. Mohr *, § * Department of Genetics, Harvard Medical School, 77 Avenue Louis Pasteur, Boston, MA 02115, USA § Drosophila RNAi Screening Center, Department of Genetics, Harvard Medical School, 77 Avenue Louis Pasteur, Boston, MA 02115, USA † Departments of Radiation Oncology, Washington University School of Medicine, St. Louis, MO 63108, USA ‡ Howard Hughes Medical Institute, 77 Avenue Louis Pasteur, Boston, MA 02115, USA ** Authors contributed equally to this work Running title: FlyPrimerBank for Drosophila gene expression analysis and RNAi knockdown evaluation Key words: Drosophila, real time PCR, gene expression, RNAi, knockdown evaluation Corresponding author: Stephanie Mohr New Research Building Room 336 77 Avenue Louis Pasteur Boston, MA 02115 Email: [email protected] Phone: (617)432-5626 G3: Genes|Genomes|Genetics Early Online, published on July 26, 2013 as doi:10.1534/g3.113.007021 © The Author(s) 2013. Published by the Genetics Society of America.
Transcript of FlyPrimerBank: An Online Database for Drosophila melanogaster Gene
1
FlyPrimerBank: An Online Database for Drosophila melanogaster Gene Expression Analysis
and Knockdown Evaluation of RNAi Reagents
Yanhui Hu*,§,**, Richelle Sopko*,**, Marianna Foos*, Colleen Kelley*, Ian Flockhart*,§, Noemie
Ammeux*, Xiaowei Wang†, Lizabeth Perkins*, §, Norbert Perrimon*,‡, Stephanie E. Mohr*, §
* Department of Genetics, Harvard Medical School, 77 Avenue Louis Pasteur, Boston, MA 02115,
USA
§ Drosophila RNAi Screening Center, Department of Genetics, Harvard Medical School, 77
Avenue Louis Pasteur, Boston, MA 02115, USA
† Departments of Radiation Oncology, Washington University School of Medicine, St. Louis, MO
63108, USA
‡ Howard Hughes Medical Institute, 77 Avenue Louis Pasteur, Boston, MA 02115, USA
** Authors contributed equally to this work
Running title: FlyPrimerBank for Drosophila gene expression analysis and RNAi knockdown
evaluation
Key words: Drosophila, real time PCR, gene expression, RNAi, knockdown evaluation
Corresponding author:
Stephanie Mohr
New Research Building Room 336
77 Avenue Louis Pasteur
Boston, MA 02115
Email: [email protected]
Phone: (617)432-5626
G3: Genes|Genomes|Genetics Early Online, published on July 26, 2013 as doi:10.1534/g3.113.007021
© The Author(s) 2013. Published by the Genetics Society of America.
2
Abstract
The evaluation of specific endogenous transcript levels is important for understanding
transcriptional regulation. More specifically, it is useful for independent confirmation of results
obtained using microarray analysis or RNA-seq, and for evaluating RNAi-mediated gene
knockdown. Designing specific and effective primers for high-quality, moderate-throughput
evaluation of transcript levels, i.e. quantitative real time PCR (qPCR), is nontrivial. To meet
community needs, pre-defined qPCR primer pairs for mammalian genes have been designed and
sequences made available, e.g. via PrimerBank. In this work, we adapted and refined the
algorithms used for the mammalian PrimerBank to design 45417 primer pairs for 13860
Drosophila melanogaster genes, with three or more primer pairs per gene. We experimentally
validated primer pairs for ~300 randomly selected genes expressed in early Drosophila embryos,
using SYBR Green-based qPCR and sequence analysis of products derived from conventional
PCR. All relevant information, including primer sequences, isoform specificity, spatial transcript
targeting, and any available validation results and/or user feedback, is available from an online
database (www.flyrnai.org/flyprimerbank). At FlyPrimerBank, researchers can retrieve primer
information for fly genes either one gene at a time or in batch mode. Importantly, we included
the overlap of each predicted amplified sequence with RNAi reagents from several public
resources, making it possible for researchers to choose primers suitable for knockdown
evaluation of RNAi reagents (i.e. to avoid amplification of the RNAi reagent itself). We
demonstrate the utility of this resource for validation of RNAi reagents in vivo.

3
Introduction
Quantitative real-time PCR (qPCR) is widely used for analysis of transcript levels because it is
sensitive, accurate, relatively easy to perform, and can be adapted to moderately high-
throughput modes. qPCR has become important for the study of transcriptional regulation, for
example to detect changes in specific transcript levels following treatment with different stimuli.
In particular, qPCR is commonly used to confirm results obtained using microarray analysis,
methods enabling the detection and quantitation of multiple RNAs such as Nanostring (GEISS et
al. 2008) and Luminex (PECK et al. 2006),or RNA-seq, as well as to evaluate the knockdown
efficiency of RNAi reagents. One barrier to performing qPCR assays efficiently is that the design
of oligonucleotide primers for qPCR is not as straightforward as the design of primers for
conventional PCR or sequencing, as qPCR is much more sensitive to non-specific amplification
(WANG and SEED 2003). Several tools and resources have been developed to assist people in
designing qPCR primers, including qPrimerDepot, PrimerBank and RTPrimerDB (CUI et al. 2007;
LEFEVER et al. 2009; PATTYN et al. 2006; PATTYN et al. 2003; SPANDIDOS et al. 2010; WANG and SEED
2003; WANG et al. 2012). qPrimerDepot provides qPCR primer sequences for 99.96% of human
RefSeq sequences (CUI et al. 2007) and PrimerBank is an online genome-scale primer resource
for human and mouse genes (SPANDIDOS et al. 2010; WANG and SEED 2003; WANG et al. 2012).
RTPrimerDB is a collection of 8609 experimentally validated qPCR primer sequences from the
scientific community for 27 different species but currently only 5 primer pairs in RTPrimerDB
target Drosophila genes (LEFEVER et al. 2009; PATTYN et al. 2006; PATTYN et al. 2003). Relevant to
our goals, none of these resources provides comprehensive coverage of Drosophila genes.
RNAi is a widely adopted experimental tool for loss-of-function studies. Unlike the siRNA
reagents used in mammalian systems, long double-stranded RNA (dsRNA) sequences of
approximately 200-500 bps are common in reagent libraries for Drosophila cell-based RNAi. For
Drosophila in vivo studies, RNAi reagents are generally either long dsRNA hairpins (usually
between 200-500 bps) with gene fragments cloned by PCR as inverted repeats, or short hairpins
(shRNAs) of 19-21 bps generated from oligonucleotides (CLEMENS et al. 2000; HAMMOND et al.
2000). Genome-scale RNAi reagents targeting Drosophila genes have been made available by
several independent groups (DIETZL et al. 2007; FLOCKHART et al. 2011; HORN et al. 2010; NI et al.
2009; NI et al. 2011; PERRIMON et al. 2010; YAMAMOTO 2010). Studies using RNAi reagents in
cultured cells, as well as in vivo in Drosophila, have made contributions to a number of areas of

4
study, and qPCR analysis is a common method used to assess the level of target gene
knockdown. To accurately assess dsRNA-mediated knockdown, qPCR primer pairs must not
amplify regions that are also part of the reagent sequence; otherwise, the primers might amplify
the RNAi reagent itself. This is not a concern for shRNA reagents, which are generally too small
to be amplified by qPCR primers.
Thus, although several qPCR primer design tools are available, there remains a need for
a comprehensive and quality-analyzed set of primers useful for Drosophila, including for the
analysis of RNAi-mediated knockdown. To address this need, we implemented the PrimerBank
algorithm for Drosophila genes and designed three or more primer pairs for each Drosophila
protein-coding gene. We supplemented the resource using an alternative algorithm with
additional primer pairs for genes for which the PrimerBank design algorithm generated fewer
than 3 primer pairs per gene. Following primer design, we systematically evaluated the overlap
of each primer with long dsRNA reagents for Drosophila genes from publicly available sources. A
subset of the FlyPrimerBank primers were experimentally evaluated using SYBR Green-based
thermal analysis as well as gel electrophoresis and sequencing of PCR products after
conventional PCR with 326 randomly selected Drosophila-specific primer pairs. In addition, we
assessed primers in two additional test cases. One was the evaluation of a collection of
transgenic fly lines bearing shRNAs for RNAi to knock down protein kinases and phosphatases.
The other was the stimulation of the JNK pathway in Drosophila S2 cells. Finally, we have made
FlyPrimerBank available online, including an option for user input and feedback, making
FlyPrimerBank a useful community resource that can further improve over time.

5
Results
Primer design and annotation
Quantitative real time PCR (qPCR) has become commonplace for transcript abundance
analysis. Typical applications involve monitoring the amplification products indirectly, such as by
measuring binding-dependent fluorescence of specific dyes (e.g. SYBR Green). The technique,
however, is vulnerable to non-desirable side products such as primer dimers or mis-priming to
non-target sites, a significant concern when a sample contains thousands of transcripts. Most
existing primer design programs are predicted based solely on the target sequence. By contrast,
the PrimerBank algorithm takes into account the complexity of entire transcriptomes and
applies stringent primer cross-reactivity filters in addition to running BLAST (WANG and SEED
2003) . The algorithm used for PrimerBank primer design was proven optimal for real time PCR
analysis of gene expression, and primers were experimentally evaluated. It was shown to
achieve 94% success in terms of gene amplification specificity as assessed by thermal analysis
and approximately 82% confirmed with respect to DNA sequence identity, assessed by
sequencing PCR products following gel electrophoresis (SPANDIDOS et al. 2010; WANG and SEED
2003; WANG et al. 2012). Thus, to begin to create a comprehensive qPCR primer resource for
Drosophila, we first chose to use the PrimerBank algorithm to design up to three primer pairs
targeting the coding sequence (CDS) region for all Drosophila protein-coding genes (FlyBase
release 5.44). By design, all of these primer sets are predicted to be gene-specific and isoform
non-specific. Our decision to target CDS regions is based on the observation that annotations of
un-translated regions (UTRs) change much more frequently than CDS regions. We compared
transcript annotations from FlyBase release 5.34 (Feb 18th, 2011) with those from FlyBase
release 5.44 (March 2nd, 2012). We found that 833 transcripts were removed, 3407 new
transcripts were added, and 2917 transcripts have different sequences. The sequence changes
of the 2917 transcripts occurred only in the UTR regions (HU et al. 2013).
Using the PrimerBank algorithm, three primer pairs were successfully designed for
11,688 fly protein-coding genes. Primers were selected based on stringent criteria, in particular
with regard to the sequence specificity check step (details described in Wang and Seed 2003). A
total of 574 genes failed the design process completely and 1647 genes are covered with only 1
or 2 primer pairs. To increase primer coverage, we implemented an alternative algorithm for
these genes using Primer3 for primer design. Common exon-exon junction regions, as well as
common exons shared by all isoforms, were extracted from FlyBase release files (r5.44) and

6
used as the input for Primer3. For a small number of genes, no common region(s) could be
identified. We therefore repeated the process, removing one isoform at a time, to identify
common region(s) among the remaining isoforms. We make note of these exceptional cases and
users are alerted when these genes are queried on the website. The primers designed using
Primer3 were ranked based on predicted gene specificity and assessed using the NCBI Basic
Local Alignment Search Tool (BLAST), searching Drosophila transcriptome and genome
sequences. The top three designs were selected to supplement the database (Fig. 1). By
implementing the alternative algorithm Primer3, which is less stringent than PrimerBank in
terms of primer specificity as well as coverage for all gene specific isoforms, we were able to
design at least 3 pairs of primers for each Drosophila protein-coding gene.
In total, FlyPrimerBank contains 45158 pre-designed primer pairs for 13860 Drosophila
genes with at least 3 primer pairs per gene (Table 1). In total, 37647 primer pairs were designed
using PrimerBank and 7511 primer pairs were designed using the alternative approach. 44951
primer pairs (99.5%) are predicted to be gene specific and isoform non-specific, whereas 207
primer pairs (0.5%) are predicted to amplify most but not all isoforms. In addition, 10635 primer
pairs (24%) are exon-junction spanning whereas 34523 primer pairs (76%) amplify regions within
exons. The average predicted PCR product is between 50-250 bps and the average theoretical
melting temperature for any primer pair is approximately 60°C. Following primer design, we
systematically evaluated the overlap of each primer with publicly available dsRNA reagents,
which include the genome-wide dsRNA amplicon library for cell-based studies from the
Drosophila RNAi Screening Center at Harvard Medical School (DRSC), as well as long dsRNA
hairpins in transgenic fly stocks from National Institute of Genetics at Japan (NIG-FLY), Vienna
Drosophila RNAi Center (VDRC) and Transgenic RNAi Project of Harvard Medical School (TRiP)
(DIETZL et al. 2007; FLOCKHART et al. 2011; MOHR et al. 2010; NI et al. 2009; NI et al. 2011;
YAMAMOTO 2010). Annotation of the overlap with RNAi reagents will help scientists choose
primer pairs that avoid the reagent itself, making them suitable for confirmation of RNAi-based
knockdown (Table 1).
Evaluation of FlyPrimerBank
We established a primer-testing pipeline using cDNA isolated from early Drosophila
embryos in compliance with the "Minimum Information for the publication of real-time
Quantitative PCR Experiments" (MIQE) guidelines (BUSTIN et al. 2009). Primers were tested by
7
thermal analysis using SYBR Green-based qPCR as well as by size analysis using gel
electrophoresis and sequencing after conventional PCR. To generate the cDNA template,
embryos (0-4 hr) were collected and RNA was extracted, enriching for RNAs larger than 200 bps.
Purified RNA was treated with DNAse and subsequently used for in vitro transcription to
generate a cDNA library. cDNA was then serially diluted four times, starting with 1 ug of cDNA
and decreasing the concentration with each dilution by a factor of four. R-squared values and
primer efficiencies were calculated using Bio-Rad CFX Manager based on the results of a two-
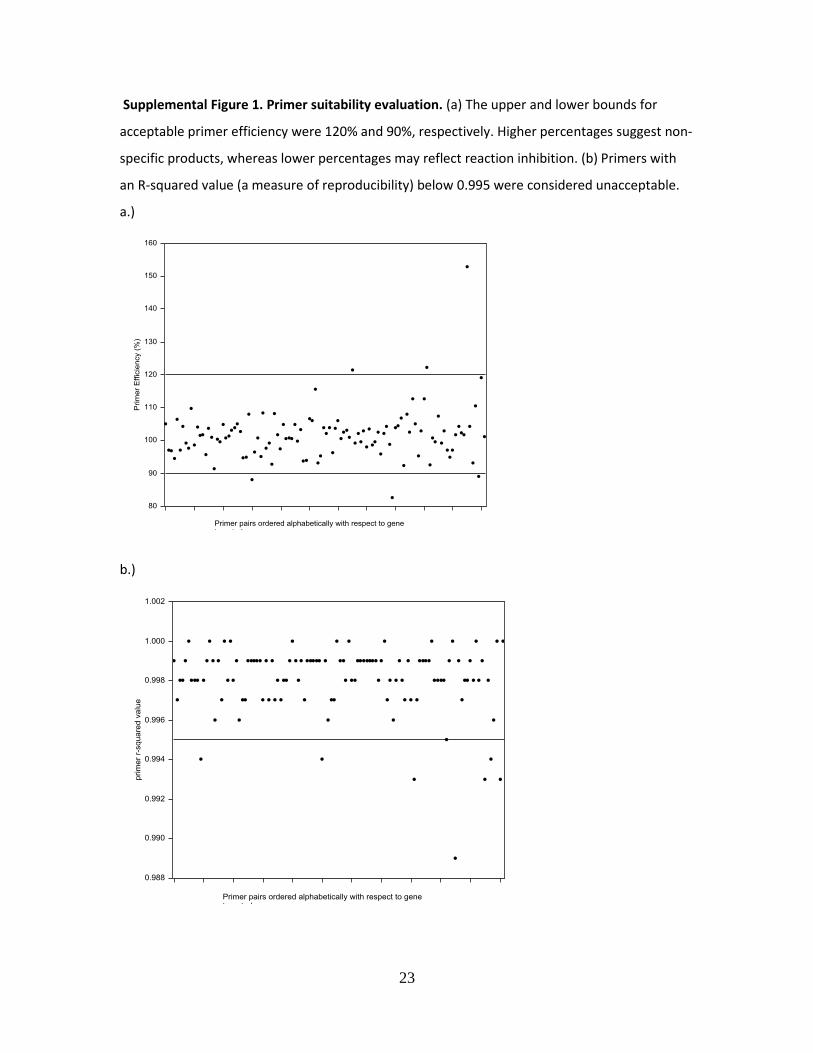
step qPCR program. Using preliminary data, we established acceptance criteria for assay
performance (Fig. 2), which included 90-120% PCR amplification efficiency, linear regression
with R-squared values >0.995, and the following three visual features of amplification/melting
calibration curves: 1) dilution curves are evenly distributed with two cycles separating each,
indicative of a linear dynamic range; 2) the curve corresponding to the most diluted sample
crosses a single threshold before cycle 30 and is at least 5 cycles away from a no template
control (reaction mix and primers with no cDNA template); and 3) a single unique and sharp
melting peak is observed (Supplemental Fig. 1).
To establish a test set of genes, we considered genes for which there is evidence of
expression in early embryos based on RNA-seq data (GRAVELEY et al. 2011). To first determine a
cutoff for “expressed” genes, we chose six genes of varied expression with RPKM (Reads Per
Kilobase per Million mapped reads) values between 0 and 7 in 0-2 and 2-4 hr embryonic RNA-
Seq datasets. Primer testing indicated that transcripts with RPKM values above 3 at any of the
two time points were suitable for qPCR-based gene expression analysis (Supplemental Fig. 2).
We next randomly selected one FlyPrimerBank primer pair for each of 326 randomly selected
genes expressed in 0-4 hr old Drosophila embryos, based on the above criteria, for experimental
qPCR primer testing. Our thermal analysis using cDNA isolated from 0-4 hr old Drosophila
embryos revealed that 86% of the primer pairs tested met our acceptance criteria
(Supplemental table 1).
We additionally performed conventional PCR using the same cDNA as the template and
separated the PCR products on an agarose gel to assess if single bands of the expected size were
generated. All of the primer pairs in the 326-gene evaluation set generated PCR products with
correct sizes as judged by gel electrophoresis. Additionally, PCR products from conventional PCR
were purified and sequenced using independently designed sequencing primers downstream of
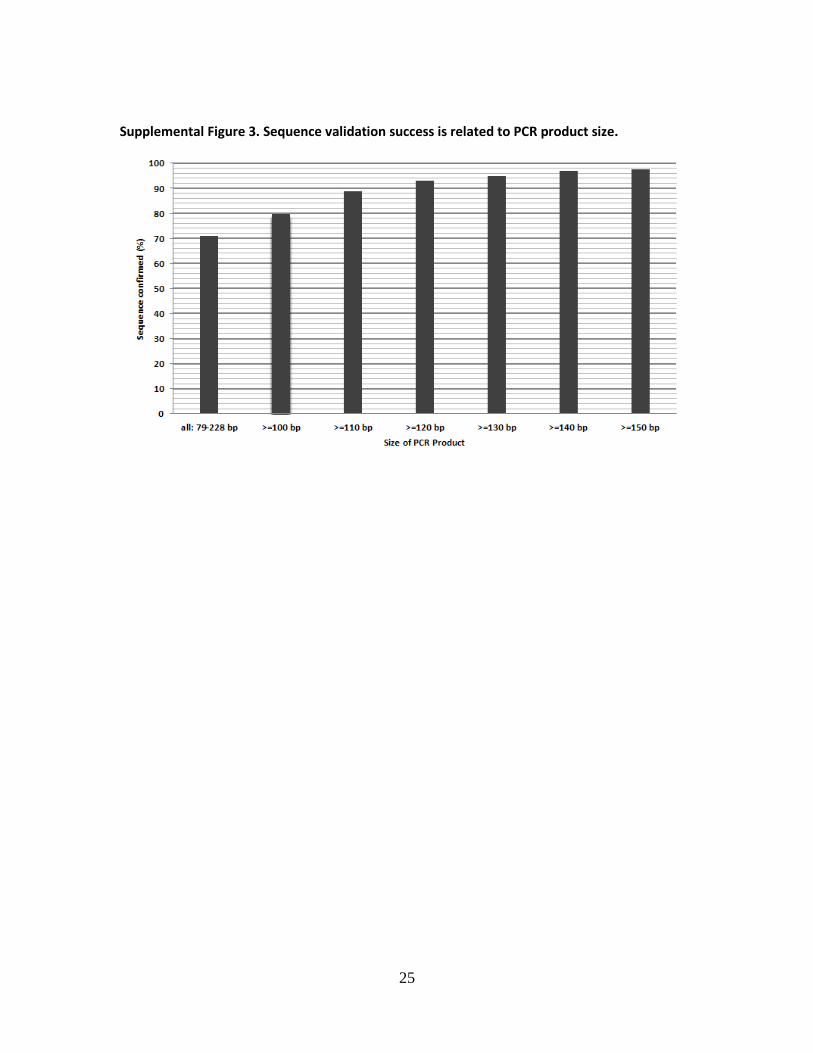
the forward qPCR primers (Fig. 2). The sequencing validation rate varied from 71% to 98% and

8
was highly correlated with the size of the PCR product (Supplemental Fig. 3). For example, 98%
of PCR products longer than 150 bp were validated and 80% of PCR products longer than 100 bp
were validated. We suspect that the majority of sequence validation failures were due to a
technical limitation, i.e. the difficulty of directly sequencing small PCR products based on the
observation that low quality reads were generated even after we optimized the PCR product
purification step and repeated the sequencing a number of times.
We next asked if primer failure correlated with any features of the PCR amplified
regions. We found enrichment among ‘failed’ primers for primers that span exon:exon junctions
where the spliced intron is small (Fig. 3). In addition, with a bigger dataset that includes results
from additional studies (R. Sopko, personal communication), we found that primers
corresponding to genes expressed at low levels as well as genes that are ‘poorly’ understood
(i.e. genes associated with smaller numbers of gene ontology (GO) terms or publications) are
more likely to fail than the primers targeting the genes expressed at high levels and/or relatively
well-studied genes (i.e. genes with more GO terms and publications).
Applications of FlyPrimerBank
Assessing gene knockdown efficiency in vivo
We next evaluated the utility of primers in FlyPrimerBank to assess knockdown in
transgenic fly lines bearing shRNAs targeting embryonic Drosophila protein kinases and
phosphatases (KPs). We first assembled a target list of KP genes. A few studies have been
performed to identify Drosophila KPs on a genome-wide level using sequence comparison-based
algorithms (MANNING et al. 2002; MORRISON et al. 2000). To supplement the gene list from these
publications, we mined Drosophila structural and functional gene annotations from public
databases. Additionally, we mapped human KP genes to fly genes using DIOPT, an ortholog
prediction tool (HU et al. 2011). The assembled KP list contains 268 kinase and 112 phosphatases
(Supplemental table 2). Based on modEncode RNA-seq analysis (GRAVELEY et al. 2011), we
selected 474 TRiP fly stocks bearing shRNAs targeting 344 KPs that are expressed (FPKM > 3) in
early Drosophila embryos for knockdown assessment. To measure transcripts in early embryos
(0-4 hr) expressing a unique KP-targeting shRNA as compared to embryos expressing a control
shRNA targeting EGFP, we established a medium-throughput pipeline again compliant with the
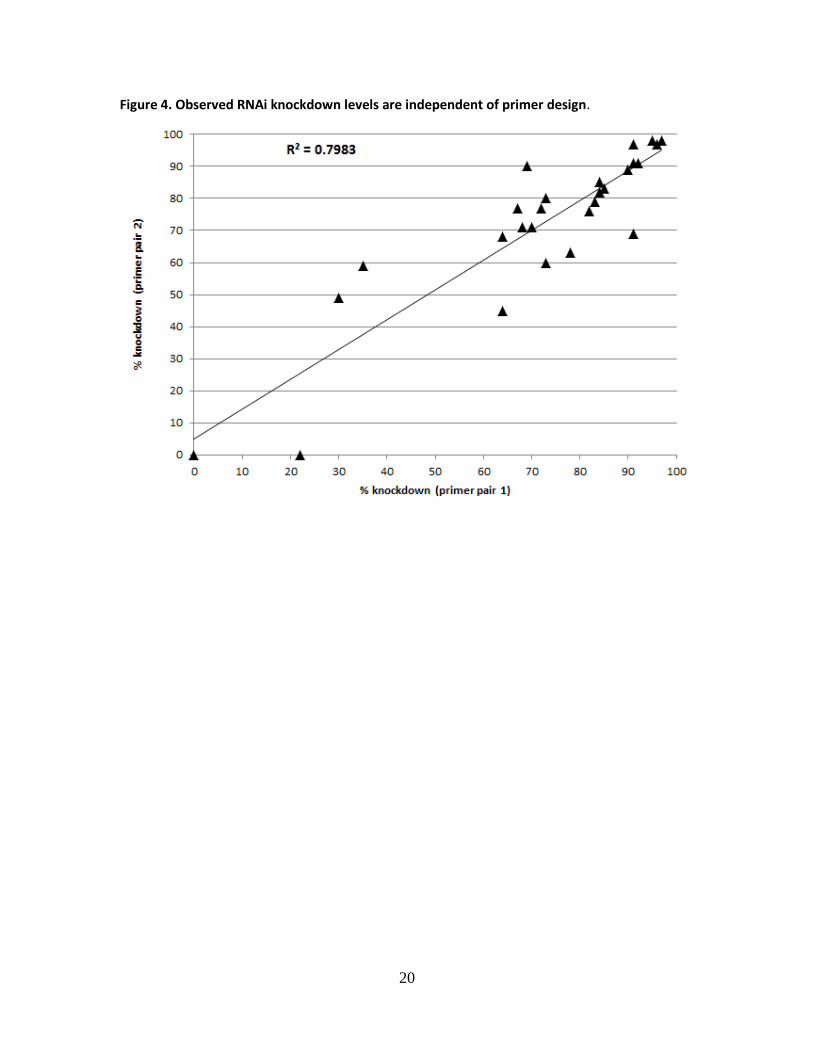
MIQE guidelines (BUSTIN et al. 2009). For 27 lines, we assessed transcript levels using two
different primer pairs. Linear regression of knockdown levels of this subset generated an R-
9
squared value of 0.8 (Pearson correlation co-efficiency was 0.9) (Fig. 4), indicating that primers
of independent designs led to similar conclusions regarding the level of knockdown.
Furthermore, our analysis revealed that 60% of the transgenic lines tested achieved 60% or
more down-regulation of their intended target transcript(s). Moreover, we found that in nearly
all cases for which the shRNA was associated with an embryonic phenotype, we measured more
than 60% knockdown of the intended transcript (Sopko et al. manuscript in preparation), further
substantiating our primer design and qPCR testing approach. The lines that failed to achieve 60%
knockdown are highly enriched for shRNAs targeting UTR regions (p value = 0.004), likely
reflecting inaccuracies in UTR annotation (Hu et al. manuscript in press).
Assessing transcriptional responses in cultured cells
We used primers in FlyPrimerBank to monitor activation of the Jun N-terminal kinase
(JNK) signaling pathway (Fig. 5). Activation of the JNK pathway has been extensively studied in
Drosophila cell culture (BOND et al. 2008; PARK et al. 2004; PEREIRA et al. 2011; STRONACH 2005).
Various endogenous or immune stimuli can activate the pathway, including lipopolysaccharides
(LPS), components of the cell wall of gram-negative bacteria. The puckered (puc) gene is a direct
target of the JNK pathway and transcriptional up-regulation of puc is commonly used as a
reporter of JNK activation. We assessed JNK pathway stimulation in Drosophila S2 cells by
monitoring puc expression following the addition of LPS to culture media for 30 min, 1 hr, and 2
hr. Wnt5, a ligand of the Wnt/Wg signaling pathway, whose regulation is considered
independent of JNK pathway activity in this cell line and expression level is comparable with puc,
was used as a negative control. The transcriptional levels of puc and Wnt5 were analyzed using
SYBR Green-based qPCR analysis with primer pairs from FlyPrimerBank, validated using the
same primer analysis procedure and acceptance criteria described above. We observed similar
levels of transient up-regulation of puc expression (down after 2 hr stimulation) with two
independent primer pairs. Meanwhile the transcript level of Wnt5 remained stable during the
time course. The rapid up-regulation of puc expression detected using our qPCR assay is
characteristic of the LPS transcriptional response in the S2 Drosophila cell line (PARK et al. 2004).
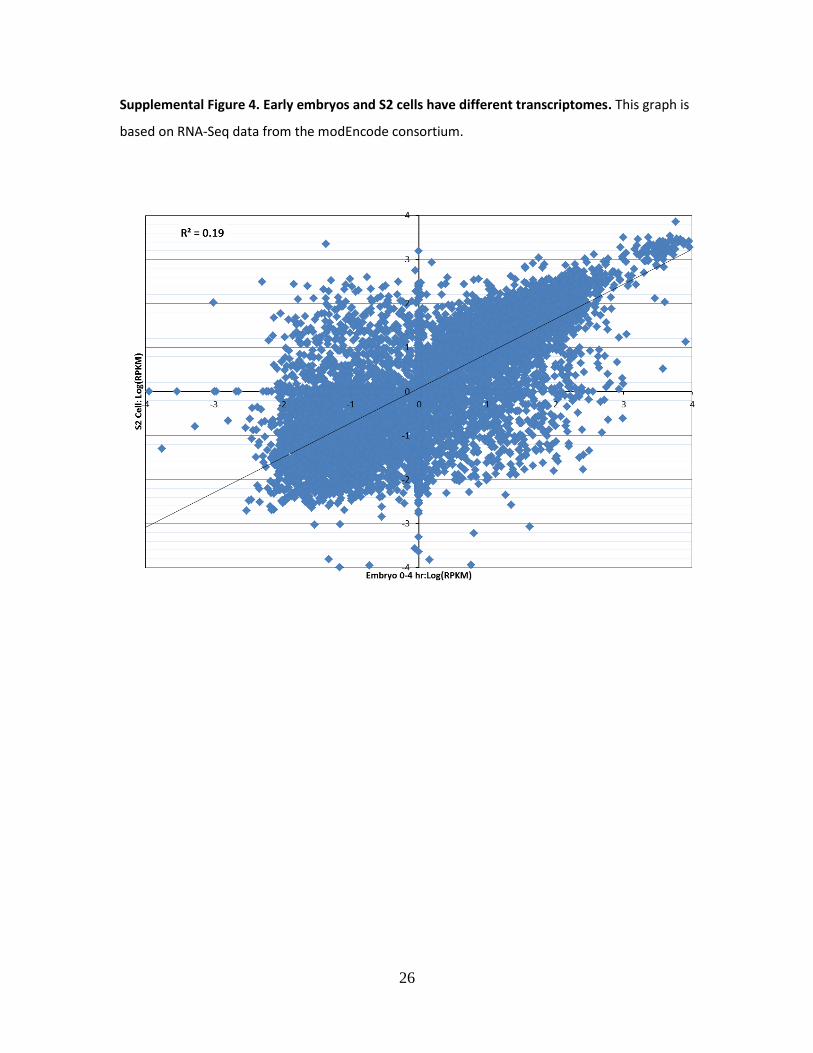
Our first application of FlyPrimerBank primers involved the evaluation of RNAi
knockdown efficiency in early Drosophila embryos and the second examined transcriptional
regulation by the JNK signaling pathway activity in cultured Drosophila cells. The two systems
have completely distinct transcriptomes (eg. as shown by modEncode RNA-Seq (CHERBAS et al.
10
2011; GRAVELEY et al. 2011)), suggesting the utility of FlyPrimerBank primers for examination of
transcript levels in diverse sample types (Supplemental Fig. 4).
Implementation of a FlyPrimerBank online tool
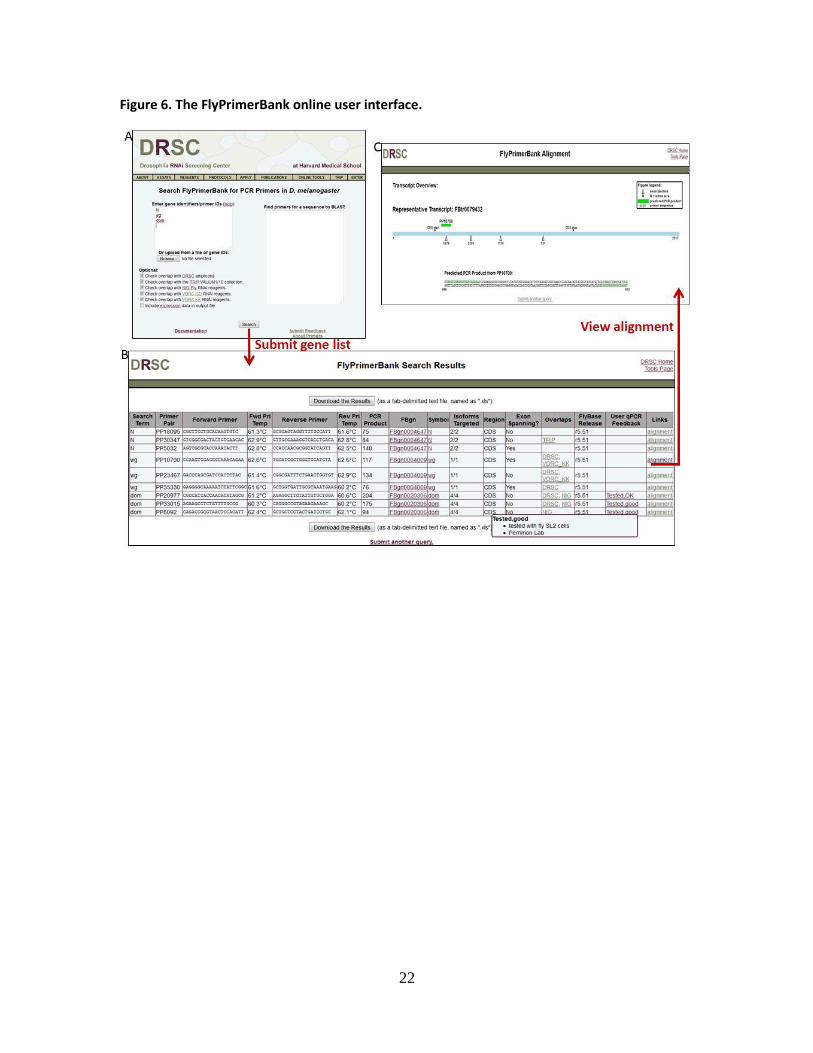
We implemented the FlyPrimerBank online tool to allow researchers to search for and
identify qPCR primer pairs for Drosophila genes of interest. The user interface allows the user to
search one or multiple genes with a single query. Gene ID mapping is built into the system so
that users can query with any type of gene or protein identifier from FlyBase, including FBgn
number, CG number or gene symbol. The user interface also supports gene identification from
sequence by BLAST search. The search results page shows the overlap of conceptually amplified
products with RNAi reagents from various collections, as well as primer pair information,
including sequences, melting temperatures and the size of the predicted PCR product. Each
primer pair is hyperlinked to a detailed annotation page where PCR products are aligned to the
reference transcript sequence, and exon-exon junctions and the CDS start and stop are visually
displayed. As described above, our results indicate that primer pairs are more likely to fail in
instances where the exon-exon junction they span has a small intron as compared to primer
pairs spanning exon-exon junctions of large intron size or primers pairs that do not span exon-
exon junctions. Therefore, on the detailed annotation page we also display the size of the intron
spliced out at each exon-exon junction. Due to changes in gene annotations associated with new
FlyBase releases, we plan to periodically re-annotate the primers. At the time of manuscript
preparation, the annotation at FlyPrimerBank was based on FlyBase release 5.51 (May 7th,
2013).
Unique to the FlyPrimerBank interface as compared to existing tools is a section where
users can give feedback. Users can upload feedback about FlyPrimerBank primers they have
tested and submit primers that were not designed by FlyPrimerBank but have been
experimentally validated. This information will be displayed and as it accumulates, this added
information will help researchers choose the best primer pairs, as well as allow us to identify
genes for which new primers should be designed. Notably, we found that expression levels
correlate with primer failure with respect to our thermal analysis criteria (Fig. 2). However, a
primer considered to have ‘failed’ in our early embryo tests is not necessarily a suboptimal
primer design, as it might meet criteria when levels of the gene are higher (e.g. at other
developmental stages or in specific tissues). As such, users are required to submit information

11
regarding the tissue, stage or cell type from which cDNA was isolated when submitting feedback
on the results obtained with a given primer pair. To help assess potential qPCR targets and
troubleshoot qPCR failure, we also provide users with gene expression data from a large-scale
effort to determine expression levels in various cell lines and embryonic developmental stages
(CHERBAS et al. 2011; GRAVELEY et al. 2011).
Concluding Remarks
FlyPrimerBank is a comprehensive qPCR primer database for Drosophila, facilitating
selection of primers for small- or large-scale studies. FlyPrimerBank is more flexible than most
resources in that it provides an interface for submission of user feedback on primers in the
database and for submission of alternative experimentally validated qPCR primer sequences.
Evaluation of RNAi reagents by qPCR is becoming common practice for gene loss-of-function
studies. However, the long dsRNA reagents widely used for Drosophila genes often overlap
regions amplified by qPCR primers, potentially confounding their evaluation. For this reason, our
systematic qPCR primer design strategy considers long dsRNA reagents from several public
resources and relevant information is made available online. The results of our quality analyses,
from both in vivo and cell-based studies, demonstrate the utility and quality of the resource.
Materials and Methods
Primer design and annotation Sequence information for Drosophila genes was retrieved from FlyBase
(ftp://ftp.flybase.net/releases/). CDS sequences were formatted as input for uPrimer, the primer
design program implemented in Perl for PrimerBank. Up to three primer pairs per gene were
selected based on primer parameters as well as predicted gene specificity (WANG and SEED
2003). The alternative algorithm and primer annotation program was developed in Java. DRSC
and TRiP RNAi reagent information were retrieved from flyrnai.org. NIG stock information was
retrieved from the NIG catalog (http://www.shigen.nig.ac.jp/fly/nigfly/download/files/rnai.tsv).
VDRC stock information was retrieved from the VDRC catalog
(http://stockcenter.vdrc.at/control/fullCatalogueExcel). The primer sequences for making
double-stranded long RNAi reagents were collected and amplicon sequences of RNAi reagents
were assembled by virtual PCR based on FlyBase release 5.51 using UP-TORR (HU et al. 2013).
The primer sequences from FlyPrimerBank were blasted against the sequences of RNAi reagents
12
and the overlap of each primer sequence with RNAi reagents was analyzed using a program
developed in-house in Java.
Isolation of embryonic RNA
Approximately 300 embryos (0-4 hr old) were collected and chorions were removed by
incubation for 5 min in 50% bleach. Embryos were washed with 0.1% TritonX-100, then an equal
volume of Trizol (Invitrogen) and RNase-free 0.5 mm glass beads (Next Advance) were added to
an Eppendorf Safe-Lock 1.5ml microcentrifuge tube (VWR). Embryos were homogenized by bead
beating 3x3 min at 40C at a setting of 8 in a Bullet Blender (Next Advance) and stored at -800C
until further processing. RNA was extracted with chloroform and precipitated with isopropanol.
An RNA pellet was re-suspended in RDD buffer (Qiagen) and incubated with DNAse I (Qiagen)
for 10 min at room temperature. The sample was then diluted in RLT buffer and ethanol. Further
cleanup proceeded with an RNeasy MinElute Cleanup Kit (Qiagen). RNA was eluted with RNAse-
free water. RNA concentration and purity (criteria: A260/A280 ratio near 2) was assessed using a
Nanodrop 8000 spectrophotometer (Thermo-Scientific).
Generation of embryonic cDNA
A total of 1 microgram RNA was incubated with a mix of oligo(dT) and random hexamer primers
in iScript reaction mix and iScript reverse transcriptase (iScript cDNA Synthesis Kit, Bio-Rad) for
reverse transcription. Reaction conditions were: 5 min at 250C, 30 min at 420C, 5 min at 850C.
Evaluation of primers by thermal analysis/calibration curve analysis
cDNA from embryos expressing a control shRNA targeting EGFP was serially diluted four times
by a factor of four (Bio-rad), starting with 1/20th of cDNA synthesis reaction volume. qPCR
reactions included each primer at 0.4 micromolar in iQ SYBR Green Supermix with a reaction
volume of 13 microliters. R-squared values and PCR efficiency were calculated using Bio-Rad CFX
Manager based on the results of a two-step qPCR program (40 cycles, alternating between 10
sec at 950C and 30 sec at 560C) using a Biorad CFX96 Touch Real-Time PCR Detection System.
Melt curve analysis was based on temperature ramping from 550C to 950C in 0.50C increments
over 5 min.
Evaluation of primers by conventional PCR
PCR master mix included 15 microliters 2x GoTaq Green (Promega), 11.65 microliters water, 2.5
microliters cDNA and 0.85 microliters primer (10uM forward and reverse). The PCR program was
95°C, 2 min, then 40 cycles alternating between 30 sec at 95°C, 30 sec at 60°C and 40 sec at
72°C. Four microliters of PCR product was run on a 1% agarose gel for visual inspection of size.
13
26 microliters of the remaining PCR product was transferred to a flat bottom 96-well PCR plate
(VWR). 90 microliters of PM buffer (QIAquick 96-well PCR Purification kit - Qiagen), were added
to each sample, mixed by pipetting, and transferred to the QIAquick PCR purification column
plate. Once added, the samples were vacuumed to remove the buffer and washed with 900
microliters PE buffer. The purification column plate was spun at 4,000 rpm for 5 min and
vacuumed for 5 min to remove ethanol. The column plate was placed into a Nunclon 96-well
plate (Sigma Aldrich). 60 microliters of water were added to each well, incubated at room
temperate for 2 min, and spun at 4,000rpm for 5 min. The concentration of the purified DNA
was measured using a Nanodrop 8000 spectrophotometer (Thermo-Scientific), which ranged
from 5-45 nanograms/microliter. Purified DNA samples were sent for Sanger sequencing (Dana
Farber/Harvard Cancer Center DNA Resource Core) using a sequencing primer downstream of
the forward PCR primer. Sequencing results were aligned to the Drosophila transcriptome using
NCBI Blast.
Assessment of transcript knockdown in shRNA-expressing embryos
Expression of shRNAs targeting EGFP (control) and shRNAs targeting various PKs was induced
specifically in the female germline using the Gal4-UAS system (BRAND and PERRIMON 1993).
Females heterozygous for the UAS-shRNA and either MTD-Gal4 (PETRELLA et al. 2007), a line
bearing three versions of Gal4 expressed sequentially throughout oogenesis, or tub-Gal4, a line
bearing two insertions of Gal4 expressed from a maternal tubulin promoter during mid and late
oogenesis (STALLER et al. 2013), were crossed to shRNA-bearing males in order to recover
fertilized eggs. RNA was prepared as indicated above, from 0-4 hr old eggs derived from
Gal4/shRNA females cultured at 270C. cDNA was generated from 1 microgram of purified RNA as
outlined above. qPCR analysis was performed twice with technical triplicates using validated
primers (above) in iQ SYBR Green Supermix (Bio-Rad), using a CFX96 Real-Time PCR detection
system (Bio-Rad). Query transcript detection was normalized to the expression of three
reference genes: ribosomal protein L32, alpha-tubulin, and either nuclear fallout or Gapdh1.
These reference genes range in expression from high to low in 0-4 hr embryos, based on RNA-
Seq data (GRAVELEY et al. 2011).
Monitoring stimulation of the JNK pathway in cells
The LPS (Lipopolysaccharide) -responsive Schneider S2 cells were grown at 250C in Schneider’s
Drosophila medium (GibcoBRL) supplemented with 10% fetal bovine serum, and antibiotics (50
14
units/milliliter penicillin and 50 micrograms/milliliter streptomycin). A commercial LPS
preparation (Sigma E. coli strain O55:B5) was dissolved in water and applied to cells in culture
media at a final concentration of 10 micrograms/milliliter (BOUTROS et al. 2002; HORN et al.
2010). Cells were incubated with LPS in the culture media for 30 min, 1 hr or 2 hr before
harvesting by scraping. Total RNA was isolated using a Qiagen RNeasy kit, with final elution in
water. RNA quality and concentration were assessed using a Nanodrop 8000 spectrophotometer
(Thermo-Scientific). cDNA synthesis was performed as outlined above. Gene expression levels
were assessed by qPCR in triplicate and normalized to alpha-tubulin and Gapdh1. Fold induction
was determined by comparing expression levels in treated cells versus non-treated cells. qPCR
reactions included each primer at 0.1 micromolar in an 11 microliter reaction volume.
Online Implementation of FlyPrimerBank
The user interface was implemented as a collection of CGI scripts written in Perl. They are
hosted on a shared server provided by the Research IT Group (RITG) at Harvard Medical School.
The database is hosted on a MySQL server also provided by RITG. The alignment of the virtual
PCR product on the target transcript is drawn on an HTML5 canvas using JavaScript.
Supplementary Material
1. Supplemental table 1: Results of primer pair testing.
2. Supplemental table 2: Protein kinase and phosphatase list
3. Supplemental figure 1: Determining the expression cutoff for primer evaluation.
4. Supplemental figure 2: Primer suitability test
5. Supplemental figure 3: Sequence and PCR product size
6. Supplemental figure 4: Comparison of the transcriptome of early embryo and S2 cells
Acknowledgements
We would like to thank the members of the Drosophila RNAi Screening Center, Transgenic RNAi
Project and Perrimon laboratory for the suggestions and support. In particularly, we would like
to thank Charles Roesel, Laura Holderbaum, Michael Buckner and Quentin Gilly for their help.
We also thank all of the past and current users of the DRSC and TRiP for providing valuable
feedback. This work was supported in large part by NIGMS R01 GM067761 and GM084947, with
additional support from NCRR/ORIP R24 RR032668. S.E.M. is also supported in part by the Dana
Farber/Harvard Cancer Center and N.P. is an investigator of the Howard Hughes Medical

15
Institute.

16
Table 1. FlyPrimerBank statistics
All primers 45158 (for 13860
genes)
Designed by PrimerBank algorithm 37647 (83%)
Designed by alternative algorithm 7511 (17%)
Isoform non-specific 44951 (99.5%)
Isoform specific 207 (0.5%)
Exon-exon junction spanning 10635 (24%)
Non exon-exon junction spanning 34523 (76%)
Ovelap with any DRSC RNAi Reagents 17325 (38%)
Overlap with any NIG RNAi Reagents 11742 (26%)
Overlap with any VDRC-GD RNAi Reagents 9901 (22%)
Overlap with any VDRC-KK RNAi Reagents* 6591 (15%)
Overlap with any TRiP long hairpin Reagents* 1520 (3%)
* Please note that the percentage overlap is low for these in part because they are not full-
genome collections.

17
Figure 1. Primer design and annotation pipeline.

18
Figure 2. Primer testing pipeline and qPCR testing criteria.

19
Figure 3. Primers that failed qPCR testing as a function of intron size.
20
Figure 4. Observed RNAi knockdown levels are independent of primer design.

21
Figure 5. Monitoring JNK pathway activation. The puc gene is a direct target of the JNK
pathway and is commonly used as a reporter for JNK activation (Boutros et al. 2002). A transient
response of puckered (down after 2 hr stimulation) upon LPS stimulation in a Drosophila S2 cell
line was observed. Wnt5 serves as a negative control. Two independent puckered qPCR primer
pairs (PP19428 and PP31584) in FlyPrimerBank show a similar trend in response.
22
Figure 6. The FlyPrimerBank online user interface.
23
Supplemental Figure 1. Primer suitability evaluation. (a) The upper and lower bounds for
acceptable primer efficiency were 120% and 90%, respectively. Higher percentages suggest non-
specific products, whereas lower percentages may reflect reaction inhibition. (b) Primers with
an R-squared value (a measure of reproducibility) below 0.995 were considered unacceptable.
a.)
b.)

24
Supplemental Figure 2. Determining the expression cutoff for primer evaluation.
Genes represented in the left panels (CG42866, pcl and jim) do not express and are not suitable
for primer evaluation in Drosophila early embryos while the genes in the right panels (sim, peb
and tai) express and are suitable for primer evaluation.
25
Supplemental Figure 3. Sequence validation success is related to PCR product size.
26
Supplemental Figure 4. Early embryos and S2 cells have different transcriptomes. This graph is
based on RNA-Seq data from the modEncode consortium.

27
References
BOND, D., D. A. PRIMROSE and E. FOLEY, 2008 Quantitative evaluation of signaling
events in Drosophila S2 cells. Biol Proced Online 10: 20-28.
BOUTROS, M., H. AGAISSE and N. PERRIMON, 2002 Sequential activation of signaling
pathways during innate immune responses in Drosophila. Dev Cell 3: 711-722.
BRAND, A. H., and N. PERRIMON, 1993 Targeted gene expression as a means of altering
cell fates and generating dominant phenotypes. Development 118: 401-415.
BUSTIN, S. A., V. BENES, J. A. GARSON, J. HELLEMANS, J. HUGGETT et al., 2009 The
MIQE guidelines: minimum information for publication of quantitative real-time
PCR experiments. Clin Chem 55: 611-622.
CHERBAS, L., A. WILLINGHAM, D. ZHANG, L. YANG, Y. ZOU et al., 2011 The
transcriptional diversity of 25 Drosophila cell lines. Genome Res 21: 301-314.
CLEMENS, J. C., C. A. WORBY, N. SIMONSON-LEFF, M. MUDA, T. MAEHAMA et al., 2000
Use of double-stranded RNA interference in Drosophila cell lines to dissect signal
transduction pathways. Proc Natl Acad Sci U S A 97: 6499-6503.
CUI, W., D. D. TAUB and K. GARDNER, 2007 qPrimerDepot: a primer database for
quantitative real time PCR. Nucleic Acids Res 35: D805-809.
DIETZL, G., D. CHEN, F. SCHNORRER, K. C. SU, Y. BARINOVA et al., 2007 A genome-wide
transgenic RNAi library for conditional gene inactivation in Drosophila. Nature
448: 151-156.
FLOCKHART, I. T., M. BOOKER, Y. HU, B. MCELVANY, Q. GILLY et al., 2011
FlyRNAi.org--the database of the Drosophila RNAi screening center: 2012
update. Nucleic Acids Res 40: D715-719.
GEISS, G. K., R. E. BUMGARNER, B. BIRDITT, T. DAHL, N. DOWIDAR et al., 2008 Direct
multiplexed measurement of gene expression with color-coded probe pairs. Nat
Biotechnol 26: 317-325.
GRAVELEY, B. R., A. N. BROOKS, J. W. CARLSON, M. O. DUFF, J. M. LANDOLIN et al.,
2011 The developmental transcriptome of Drosophila melanogaster. Nature 471:
473-479.
HAMMOND, S. M., E. BERNSTEIN, D. BEACH and G. J. HANNON, 2000 An RNA-directed
nuclease mediates post-transcriptional gene silencing in Drosophila cells. Nature
404: 293-296.
HORN, T., T. SANDMANN and M. BOUTROS, 2010 Design and evaluation of genome-wide
libraries for RNA interference screens. Genome Biol 11: R61.
HU, Y., I. FLOCKHART, A. VINAYAGAM, C. BERGWITZ, B. BERGER et al., 2011 An
integrative approach to ortholog prediction for disease-focused and other
functional studies. BMC Bioinformatics 12: 357.
HU, Y., C. ROESEL, I. FLOCKHART, L. PERKINS, N. PERRIMON et al., 2013 UP-TORR:
Online Tool for Accurate and Up-to-Date Annotation of RNAi Reagents.
Genetics.
LEFEVER, S., J. VANDESOMPELE, F. SPELEMAN and F. PATTYN, 2009 RTPrimerDB: the
portal for real-time PCR primers and probes. Nucleic Acids Res 37: D942-945.
MANNING, G., G. D. PLOWMAN, T. HUNTER and S. SUDARSANAM, 2002 Evolution of
protein kinase signaling from yeast to man. Trends Biochem Sci 27: 514-520.
MOHR, S., C. BAKAL and N. PERRIMON, 2010 Genomic screening with RNAi: results and
challenges. Annu Rev Biochem 79: 37-64.
28
MORRISON, D. K., M. S. MURAKAMI and V. CLEGHON, 2000 Protein kinases and
phosphatases in the Drosophila genome. J Cell Biol 150: F57-62.
NI, J. Q., L. P. LIU, R. BINARI, R. HARDY, H. S. SHIM et al., 2009 A Drosophila resource
of transgenic RNAi lines for neurogenetics. Genetics 182: 1089-1100.
NI, J. Q., R. ZHOU, B. CZECH, L. P. LIU, L. HOLDERBAUM et al., 2011 A genome-scale
shRNA resource for transgenic RNAi in Drosophila. Nat Methods 8: 405-407.
PARK, J. M., H. BRADY, M. G. RUOCCO, H. SUN, D. WILLIAMS et al., 2004 Targeting of
TAK1 by the NF-kappa B protein Relish regulates the JNK-mediated immune
response in Drosophila. Genes Dev 18: 584-594.
PATTYN, F., P. ROBBRECHT, A. DE PAEPE, F. SPELEMAN and J. VANDESOMPELE, 2006
RTPrimerDB: the real-time PCR primer and probe database, major update 2006.
Nucleic Acids Res 34: D684-688.
PATTYN, F., F. SPELEMAN, A. DE PAEPE and J. VANDESOMPELE, 2003 RTPrimerDB: the
real-time PCR primer and probe database. Nucleic Acids Res 31: 122-123.
PECK, D., E. D. CRAWFORD, K. N. ROSS, K. STEGMAIER, T. R. GOLUB et al., 2006 A
method for high-throughput gene expression signature analysis. Genome Biol 7:
R61.
PEREIRA, A. M., C. TUDOR, J. S. KANGER, V. SUBRAMANIAM and E. MARTIN-BLANCO,
2011 Integrin-dependent activation of the JNK signaling pathway by mechanical
stress. PLoS One 6: e26182.
PERRIMON, N., J. Q. NI and L. PERKINS, 2010 In vivo RNAi: today and tomorrow. Cold
Spring Harb Perspect Biol 2: a003640.
PETRELLA, L. N., T. SMITH-LEIKER and L. COOLEY, 2007 The Ovhts polyprotein is
cleaved to produce fusome and ring canal proteins required for Drosophila
oogenesis. Development 134: 703-712.
SPANDIDOS, A., X. WANG, H. WANG and B. SEED, 2010 PrimerBank: a resource of
human and mouse PCR primer pairs for gene expression detection and
quantification. Nucleic Acids Res 38: D792-799.
STALLER, M. V., D. YAN, S. RANDKLEV, M. D. BRAGDON, Z. B. WUNDERLICH et al., 2013
Depleting gene activities in early Drosophila embryos with the "maternal-Gal4-
shRNA" system. Genetics 193: 51-61.
STRONACH, B., 2005 Dissecting JNK signaling, one KKKinase at a time. Dev Dyn 232:
575-584.
WANG, X., and B. SEED, 2003 A PCR primer bank for quantitative gene expression
analysis. Nucleic Acids Res 31: e154.
WANG, X., A. SPANDIDOS, H. WANG and B. SEED, 2012 PrimerBank: a PCR primer
database for quantitative gene expression analysis, 2012 update. Nucleic Acids
Res 40: D1144-1149.
YAMAMOTO, M. T., 2010 Drosophila Genetic Resource and Stock Center; The National
BioResource Project. Exp Anim 59: 125-138.