Flux optimization in air gap membrane distillation system for water desalination
17
Date: 18 th March, 2015 Submitted to Sixth Student Conference By Dahiru Umar Lawal King Fahd University of Petroleum & Minerals (KFUPM) Mechanical Engineering Department Dhahran 31261, Saudi Arabia
-
Upload
dahiru-lawal -
Category
Engineering
-
view
482 -
download
2
Transcript of Flux optimization in air gap membrane distillation system for water desalination
Date: 18th
March, 2015
Submitted to
Sixth Student Conference
By
Dahiru Umar Lawal
King Fahd University of Petroleum & Minerals (KFUPM)
Mechanical Engineering Department
Dhahran 31261, Saudi Arabia
2
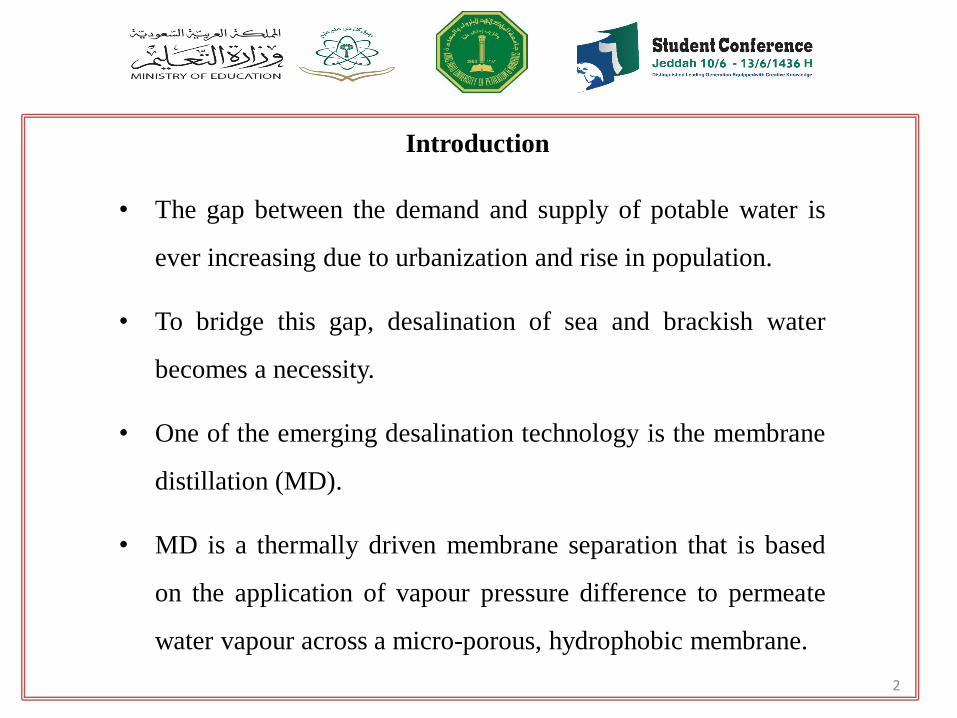
• The gap between the demand and supply of potable water is
ever increasing due to urbanization and rise in population.
• To bridge this gap, desalination of sea and brackish water
becomes a necessity.
• One of the emerging desalination technology is the membrane
distillation (MD).
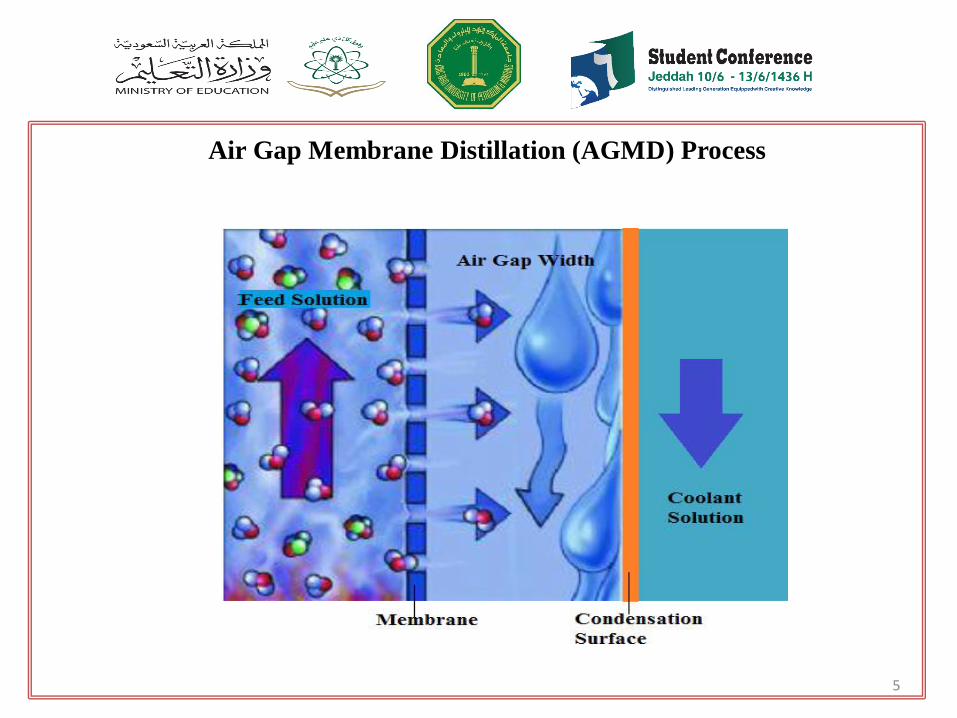
• MD is a thermally driven membrane separation that is based
on the application of vapour pressure difference to permeate
water vapour across a micro-porous, hydrophobic membrane.
Introduction
3
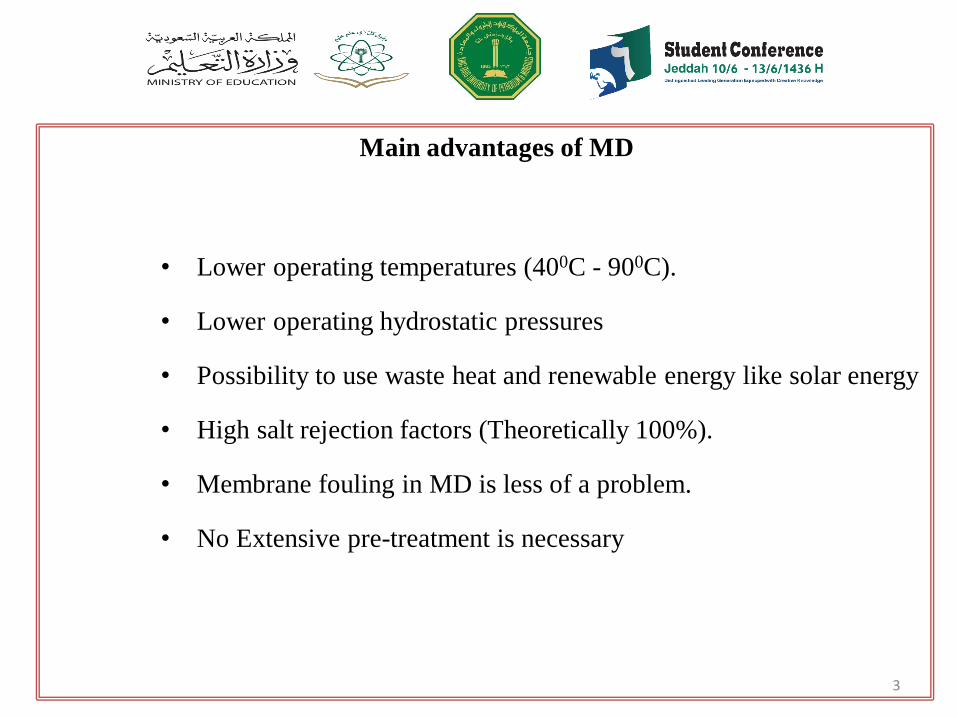
• Lower operating temperatures (400C - 900C).
• Lower operating hydrostatic pressures
• Possibility to use waste heat and renewable energy like solar energy
• High salt rejection factors (Theoretically 100%).
• Membrane fouling in MD is less of a problem.
• No Extensive pre-treatment is necessary
Main advantages of MD
4
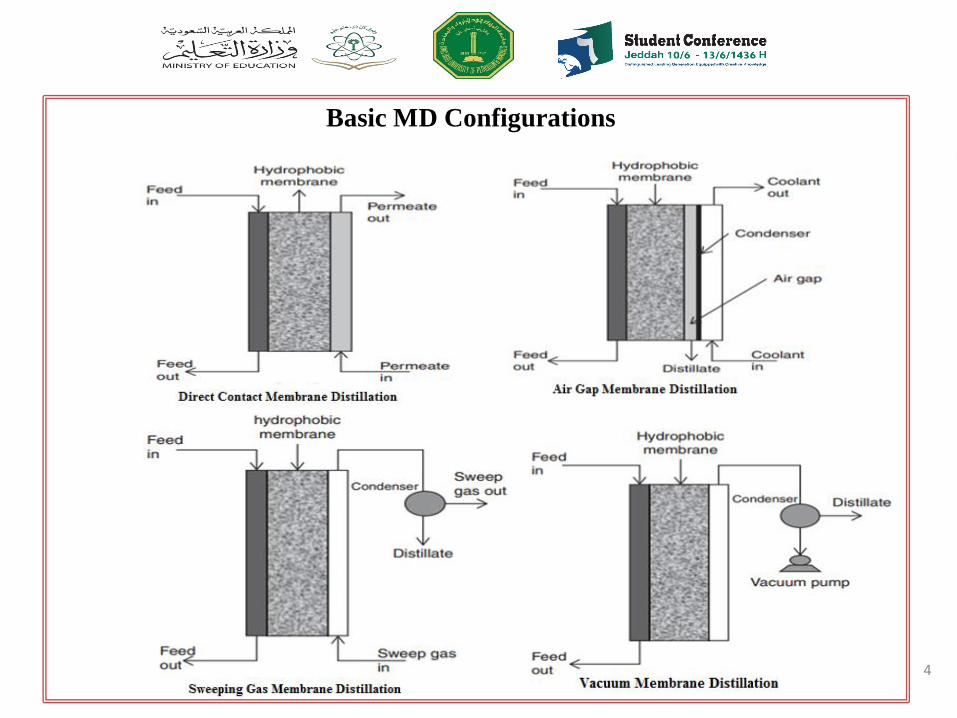
•
Basic MD Configurations
5
Air Gap Membrane Distillation (AGMD) Process
6
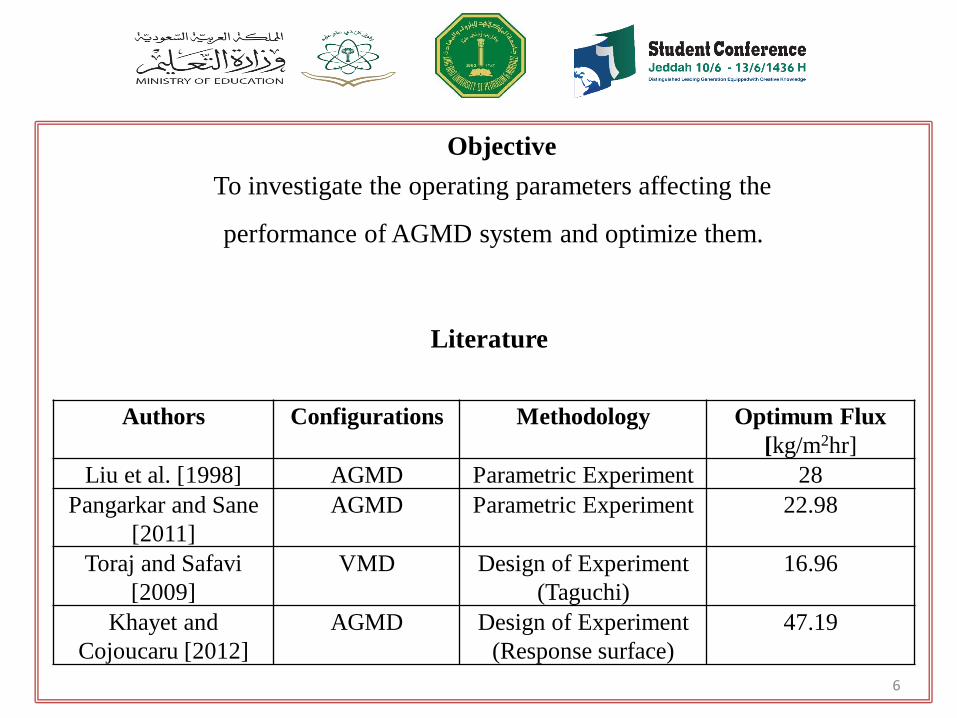
Authors Configurations Methodology Optimum Flux
[kg/m2hr]
Liu et al. [1998] AGMD Parametric Experiment 28
Pangarkar and Sane
[2011]
AGMD Parametric Experiment 22.98
Toraj and Safavi
[2009]
VMD Design of Experiment
(Taguchi)
16.96
Khayet and
Cojoucaru [2012]
AGMD Design of Experiment
(Response surface)
47.19
To investigate the operating parameters affecting the
performance of AGMD system and optimize them.
Objective
Literature
7
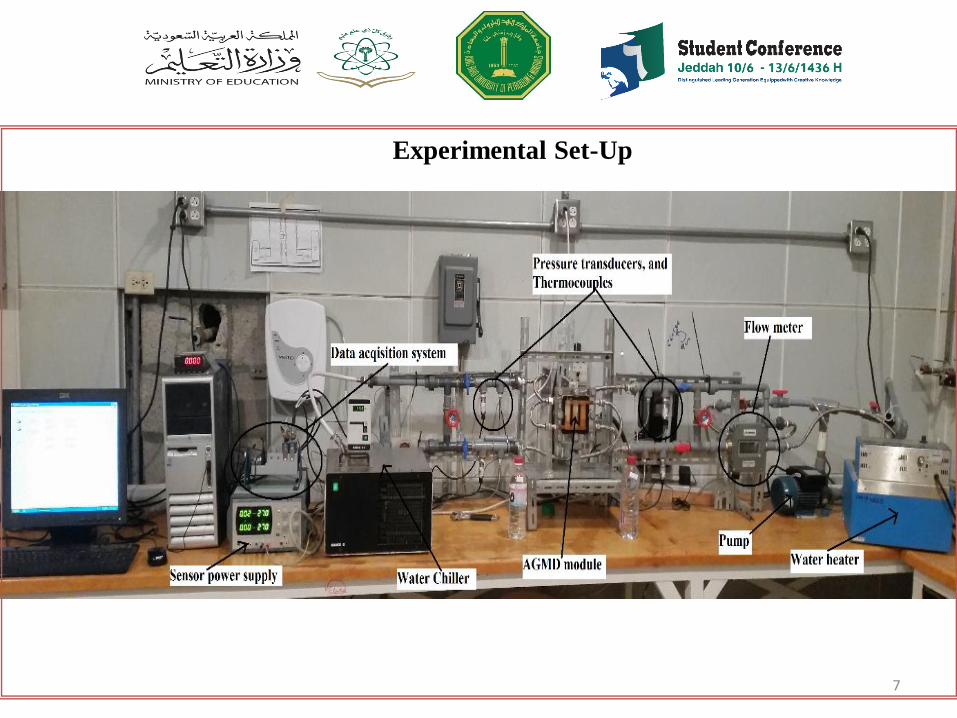
Experimental Set-Up
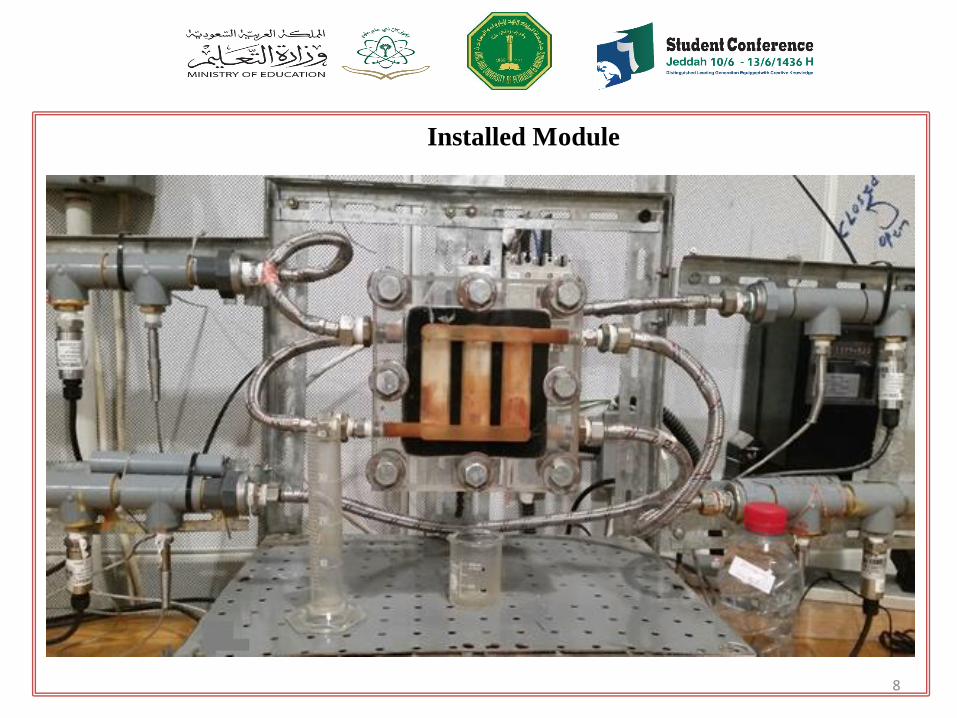
8
Installed Module
9
30
35
40
45
50
55
60
1 2 3 4 5
Per
mea
te F
lux
[K
g/m
2h
r]
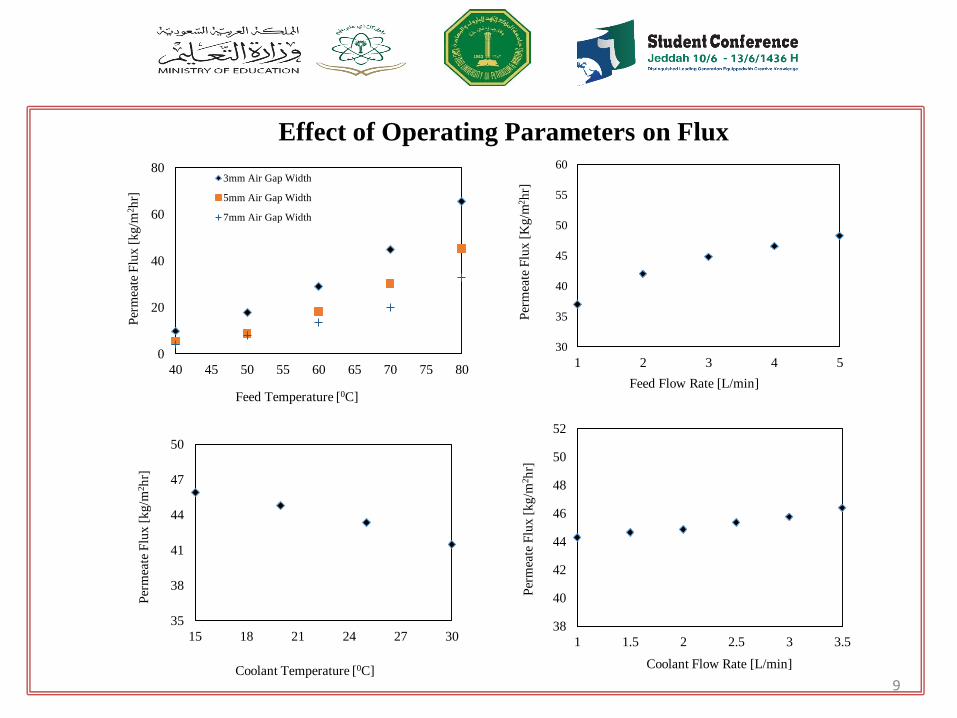
Feed Flow Rate [L/min]
Effect of Operating Parameters on Flux
0
20
40
60
80
40 45 50 55 60 65 70 75 80
Per
mea
te F
lux
[k
g/m
2h
r]
Feed Temperature [0C]
3mm Air Gap Width
5mm Air Gap Width
7mm Air Gap Width
35
38
41
44
47
50
15 18 21 24 27 30
Per
mea
te F
lux [
kg/m
2h
r]
Coolant Temperature [0C]
38
40
42
44
46
48
50
52
1 1.5 2 2.5 3 3.5
Per
mea
te F
lux [
kg/m
2h
r]
Coolant Flow Rate [L/min]
10
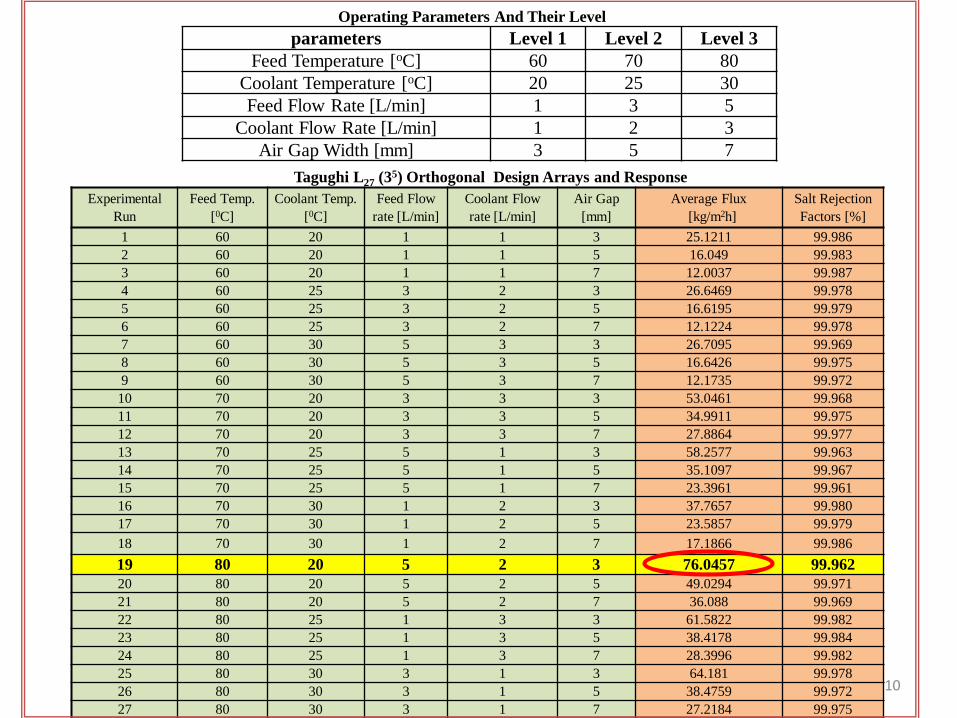
Experimental
Run
Feed Temp.
[0C]
Coolant Temp.
[0C]
Feed Flow
rate [L/min]
Coolant Flow
rate [L/min]
Air Gap
[mm]
Average Flux
[kg/m2h]
Salt Rejection
Factors [%]
1 60 20 1 1 3 25.1211 99.986
2 60 20 1 1 5 16.049 99.983
3 60 20 1 1 7 12.0037 99.987
4 60 25 3 2 3 26.6469 99.978
5 60 25 3 2 5 16.6195 99.979
6 60 25 3 2 7 12.1224 99.978
7 60 30 5 3 3 26.7095 99.969
8 60 30 5 3 5 16.6426 99.975
9 60 30 5 3 7 12.1735 99.972
10 70 20 3 3 3 53.0461 99.968
11 70 20 3 3 5 34.9911 99.975
12 70 20 3 3 7 27.8864 99.977
13 70 25 5 1 3 58.2577 99.963
14 70 25 5 1 5 35.1097 99.967
15 70 25 5 1 7 23.3961 99.961
16 70 30 1 2 3 37.7657 99.980
17 70 30 1 2 5 23.5857 99.979
18 70 30 1 2 7 17.1866 99.986
19 80 20 5 2 3 76.0457 99.962
20 80 20 5 2 5 49.0294 99.971
21 80 20 5 2 7 36.088 99.969
22 80 25 1 3 3 61.5822 99.982
23 80 25 1 3 5 38.4178 99.984
24 80 25 1 3 7 28.3996 99.982
25 80 30 3 1 3 64.181 99.978
26 80 30 3 1 5 38.4759 99.972
27 80 30 3 1 7 27.2184 99.975
parameters Level 1 Level 2 Level 3
Feed Temperature [oC] 60 70 80
Coolant Temperature [oC] 20 25 30
Feed Flow Rate [L/min] 1 3 5
Coolant Flow Rate [L/min] 1 2 3
Air Gap Width [mm] 3 5 7
Operating Parameters And Their Level
Tagughi L27 (35) Orthogonal Design Arrays and Response
11
807060
50
40
30
20
302520 531
321
50
40
30
20
753
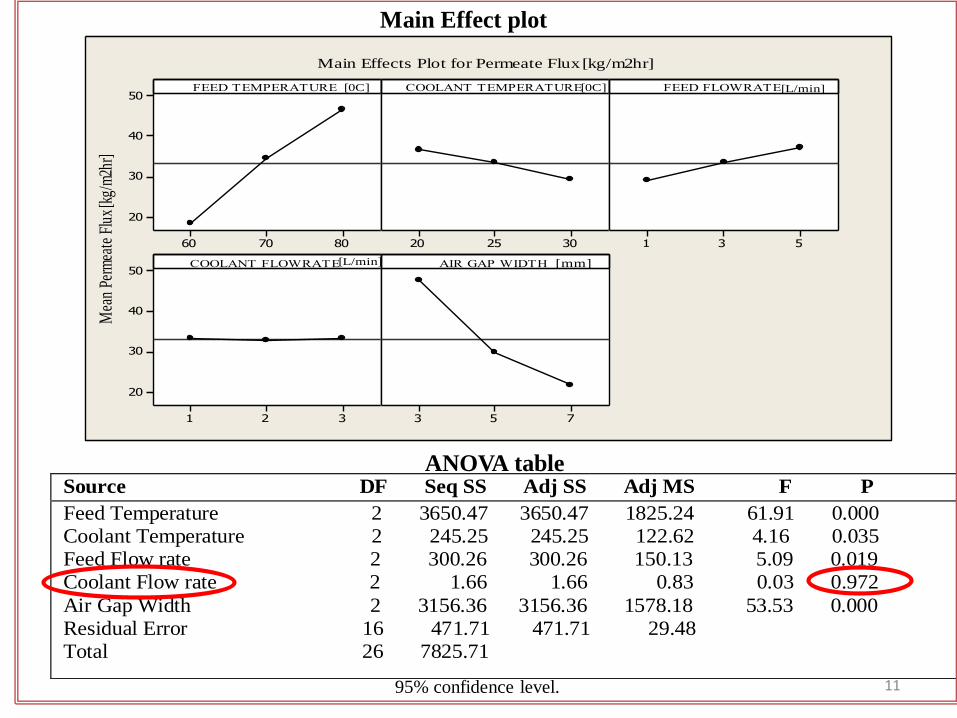
FEED TEMPERATURE
Mea
n Pe
rmea
te F
lux
[kg/
m2h
r]COOLANT TEMPERATURE FEED FLOWRATE
COOLANT FLOWRATE AIR GAP WIDTH
Main Effects Plot for Permeate Flux [kg/m2hr]
[0C] [0C] [L/min]
[L/min] [mm]
Source DF Seq SS Adj SS Adj MS F P
Feed Temperature 2 3650.47 3650.47 1825.24 61.91 0.000 Coolant Temperature 2 245.25 245.25 122.62 4.16 0.035 Feed Flow rate 2 300.26 300.26 150.13 5.09 0.019 Coolant Flow rate 2 1.66 1.66 0.83 0.03 0.972
Air Gap Width 2 3156.36 3156.36 1578.18 53.53 0.000 Residual Error 16 471.71 471.71 29.48 Total 26 7825.71
95% confidence level.
ANOVA table
Main Effect plot
12
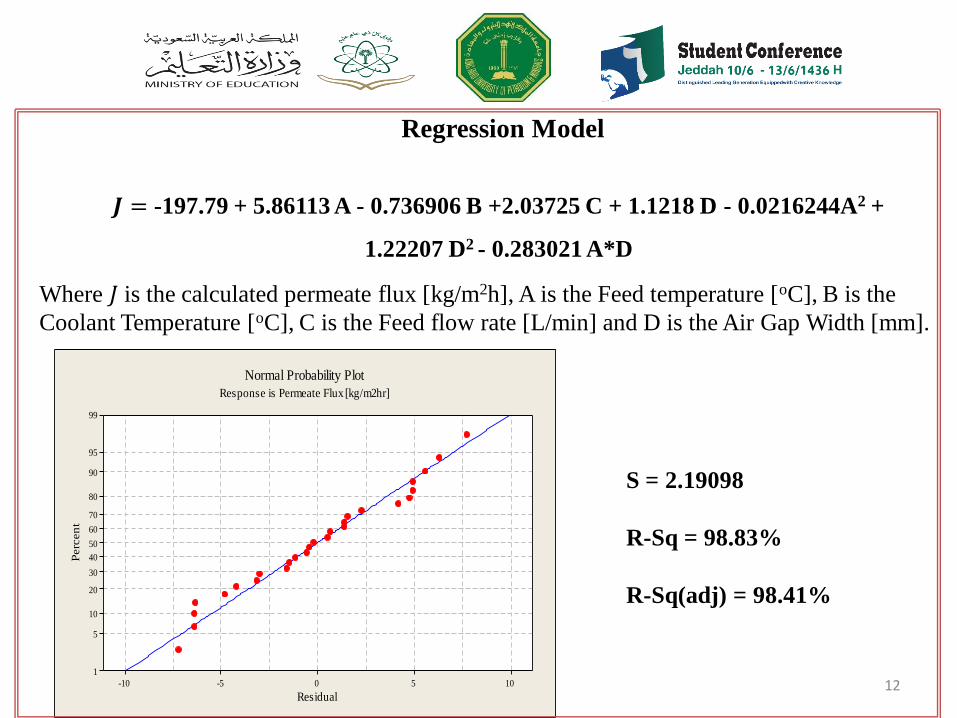
Where 𝐽 is the calculated permeate flux [kg/m2h], A is the Feed temperature [oC], B is the
Coolant Temperature [oC], C is the Feed flow rate [L/min] and D is the Air Gap Width [mm].
𝑱 = -197.79 + 5.86113 A - 0.736906 B +2.03725 C + 1.1218 D - 0.0216244A2 +
1.22207 D2 - 0.283021 A*D
S = 2.19098
R-Sq = 98.83%
R-Sq(adj) = 98.41%
1050-5-10
99
95
90
80
70
60
50
40
30
20
10
5
1
Residual
Perc
en
t
Normal Probability Plot
Response is Permeate Flux [kg/m2hr]
Regression Model
13
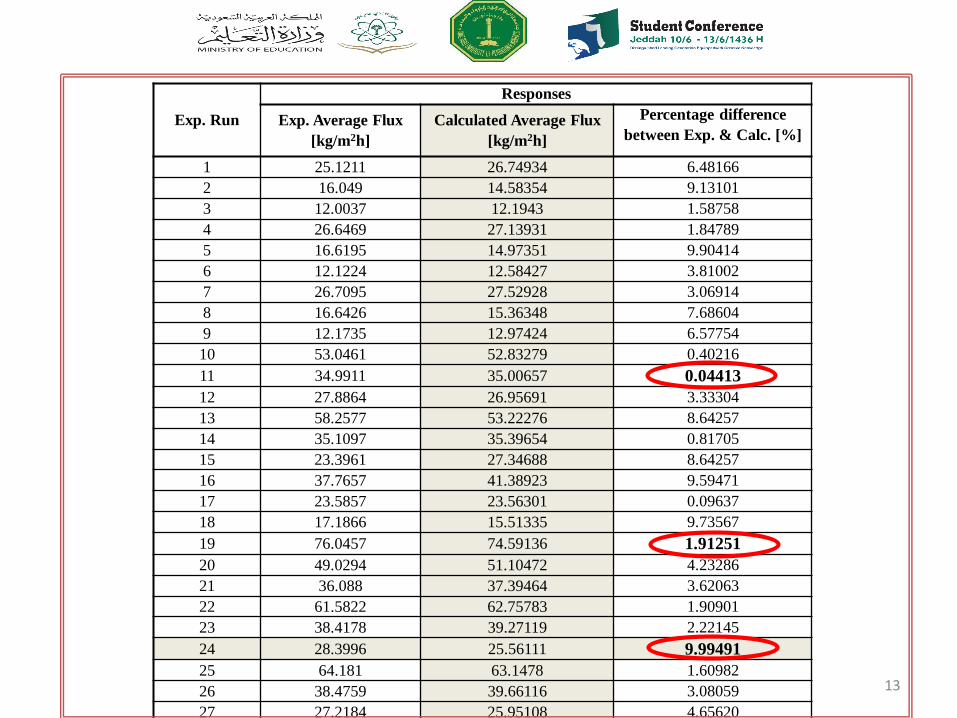
Exp. Run
Responses
Exp. Average Flux
[kg/m2h]
Calculated Average Flux
[kg/m2h]
Percentage difference
between Exp. & Calc. [%]
1 25.1211 26.74934 6.48166
2 16.049 14.58354 9.13101
3 12.0037 12.1943 1.58758
4 26.6469 27.13931 1.84789
5 16.6195 14.97351 9.90414
6 12.1224 12.58427 3.81002
7 26.7095 27.52928 3.06914
8 16.6426 15.36348 7.68604
9 12.1735 12.97424 6.57754
10 53.0461 52.83279 0.40216
11 34.9911 35.00657 0.04413
12 27.8864 26.95691 3.33304
13 58.2577 53.22276 8.64257
14 35.1097 35.39654 0.81705
15 23.3961 27.34688 8.64257
16 37.7657 41.38923 9.59471
17 23.5857 23.56301 0.09637
18 17.1866 15.51335 9.73567
19 76.0457 74.59136 1.91251
20 49.0294 51.10472 4.23286
21 36.088 37.39464 3.62063
22 61.5822 62.75783 1.90901
23 38.4178 39.27119 2.22145
24 28.3996 25.56111 9.99491
25 64.181 63.1478 1.60982
26 38.4759 39.66116 3.08059
27 27.2184 25.95108 4.65620
14
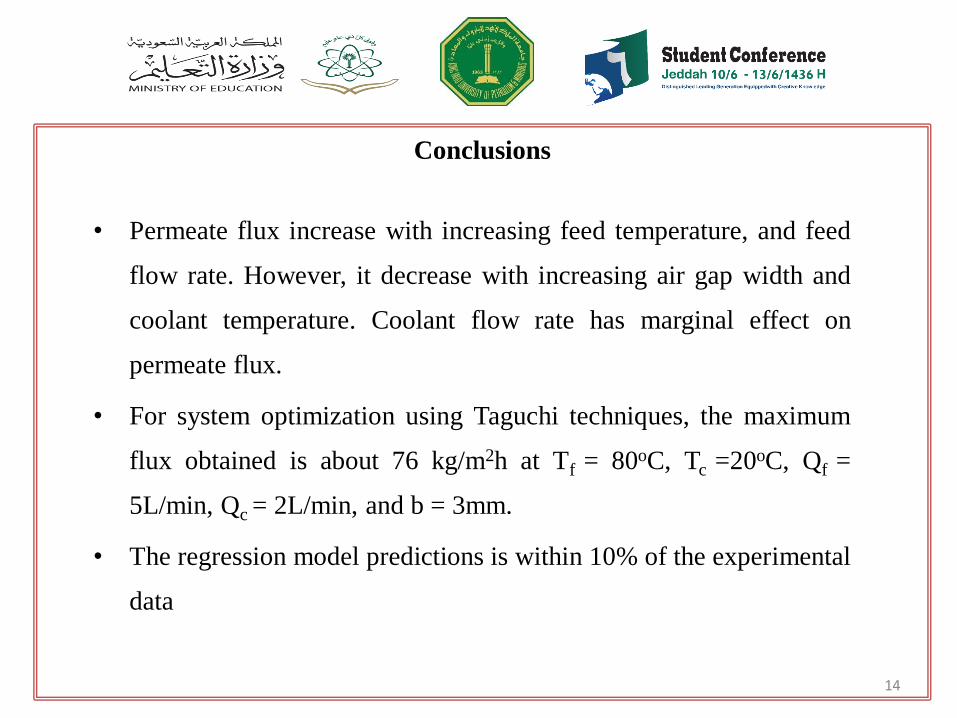
• Permeate flux increase with increasing feed temperature, and feed
flow rate. However, it decrease with increasing air gap width and
coolant temperature. Coolant flow rate has marginal effect on
permeate flux.
• For system optimization using Taguchi techniques, the maximum
flux obtained is about 76 kg/m2h at Tf = 80oC, Tc =20oC, Qf =
5L/min, Qc = 2L/min, and b = 3mm.
• The regression model predictions is within 10% of the experimental
data
Conclusions
15
• Pangarkar, B.L.; and Sane, M.; (2011) Performance of air gap membrane distillation for
desalination of ground water and seawater. Word Academy of Science, Eng. Technol,.
75: pp. 973-977.
• Toraj, M.; and Safavi, M. A.; (2009) Application of Taguchi method in optimization of
desalination by vacuum membrane distillation, Desalination 249: pp. 83–89.
• Khayet M.; Cojoucaru C. (2012) Air gap membrane distillation: Desalination, modeling
and optimization, Desalination 287: pp. 138-145.
• Liu, G. L; Zhu, C.; Cheung, C. S.; and Leung C. W., (1998) Theoretical and
experimental studies on air gap membrane distillation. Heat and mass transfer, 34(4):
pp. 329-335.
References

16

Comments
&
Contributions