Fluorescence Microscopy to Investigate Cell-Cell …inbios21/PDF/Fall2008/Falk_12032008.pdf ·...
44
BioS95: Bioscience in the 21 st Century, LU 12-03-08 Fluorescence Microscopy to Investigate Cell-Cell Communication Matthias M. Falk, Ph.D. Lehigh University Department of Biological Sciences Iacocca Hall, #D218 111 Research Drive Bethlehem, PA 18015 610-758-5896 [email protected] http://www3.lehigh.edu /~ inbios/faculty/falk.htm
Transcript of Fluorescence Microscopy to Investigate Cell-Cell …inbios21/PDF/Fall2008/Falk_12032008.pdf ·...

BioS95: Bioscience in the 21st Century, LU 12-03-08
Fluorescence Microscopy to InvestigateCell-Cell Communication
Matthias M. Falk, Ph.D.
Lehigh UniversityDepartment of Biological Sciences
Iacocca Hall, #D218111 Research Drive
Bethlehem, PA 18015610-758-5896
[email protected]://www3.lehigh.edu/~inbios/faculty/falk.htm

Figure 1-9Figure 1-6 ©M. Falk, All Rights Reserved
How big is a cell and how big are its components?
Light Microscope
X-ray CrystallographyElectron Microscope
Unaided Eye
©M. Falk, All Rights Reserved

Antonie van Leeuwenhoek, 1632-1723
Early Light Microscopes
Zeiss, ca, 1900
Compound
The resolution limit for self-luminousobjects is given in Rayleigh’s law:
d = 1.22 x λ
2 x NA
d = smallest resolvable distance between 2 points
λ = wavelength in nm (eGFPem. max. = 509 nm)
NA = Numerical Aperture (How much light a lens collects, high NA = high resolution)
d = 1.22 x 509
2 x 1.4
= 222 nm ©M. Falk, All Rights Reserved

BioS 368 Cell Biology Lab (Fall ‘05)
©M. Falk, All Rights Reserved

©M. Falk, All Rights Reserved
BioS 368 Cell Biology Lab (Fall ‘05)
Fluorescence Light Microscopes

Dr. Heinz Falk 1923 - 2001Siemens Electron Microscope
©M. Falk, All Rights Reserved

©M. Falk, All Rights Reserved
Cell CultureIncubator

(1) Cell Culture Techniques:Lots of cells in the incubator
©Image: LU BioS368, Instructor: Prof. M. Falk; all rights reserved

Human Epithelial Cells (HeLa), Bright Field
©M. Falk, All Rights Reserved
50 µm

HeLa CellsPhase Contrast Differential Interference Contrast, DIC
©M. Falk, All Rights Reserved50 µm

100 Trillion = 1014 cells/human body; >200 different cell types
From: Alberts et al. Molecular Biology of the Cell, 4th ed., Garland Sciences, 2002

Histochemical Stains of Tissue Sections
Skeletal Muscle
©M. Falk, All Rights Reserved

Fluorescent Dyes and their Excitation and Emission Wavelengths
DAPI
Fluorescein
Rhodamine©M. Falk, All Rights Reserved

©M. Falk, All Rights Reserved
Inverted

Mitochondria of a living HeLa cell stained with Mito Tracker Green.Note the long, tubular structure of the mitochondria in this cell type. The nucleus was stained withHoechst33342.
©Image: LU BioS368, Instructor: Prof. M. Falk; all rights reserved

Endoplasmic reticulum (ER) stained with ER-Tracker Blue-White in a liveHeLa cell. Note the fine, tubular reticulum extending throughout the cytoplasm.
©Image: LU BioS368, Instructor: Prof. M. Falk; all rights reserved

The Golgi apparatus of living HeLa cells stained with BODIPY TR-labeledceramide. Note the cap-like appearance of the Golgi cisternae on one side of the nucleus. Cellnuclei were stained with Hoechst33342.
©Image: LU BioS368, Instructor: Prof. M. Falk; all rights reserved
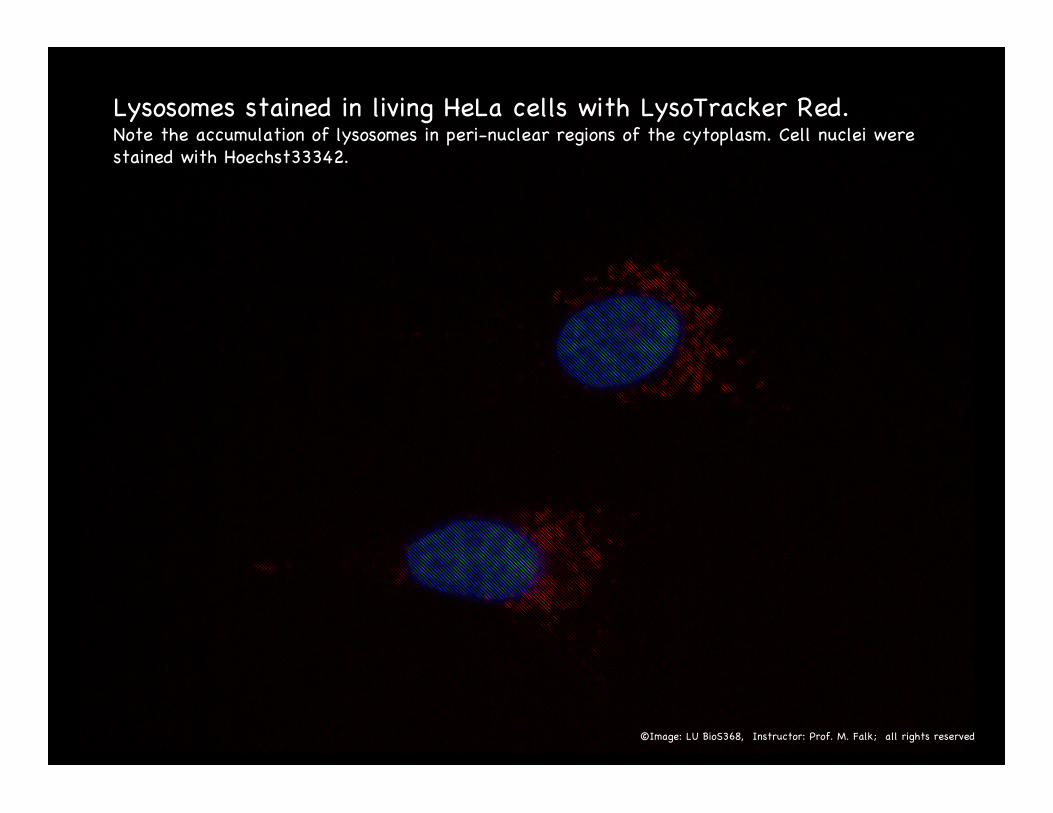
Lysosomes stained in living HeLa cells with LysoTracker Red.Note the accumulation of lysosomes in peri-nuclear regions of the cytoplasm. Cell nuclei werestained with Hoechst33342.
©Image: LU BioS368, Instructor: Prof. M. Falk; all rights reserved

DNA and RNA visualized in living HeLa cell. The dye acridine orange fluorescesred when bound to single stand nucleic acids, and green when bound to double-strand nucleicacids. Note the green nucleus (chromatin), the red hot-spots of mRNA translation in thecytoplasm, and the red-yellow nucleoli (ribosomal RNA synthesis centers) in the nucleus.
©Image: LU BioS368, Instructor: Prof. M. Falk; all rights reserved

Stress-fibers assembled from bundles of actin filaments crossing thecell body were stained with Alexa488-labed phalloidin in fixed HeLacells. Phalloidin is a cyclic peptide that efficiently binds to actin filaments and interferes withtheir dynamics, making mushrooms of the Amanita family deadly poisonous. The nucleus was stainedwith DAPI.
©Image: LU BioS368, Instructor: Prof. M. Falk; all rights reserved

Cell/extracellular matrix interactions (Focal Adhesions) visualized by stainingfixed HeLa cells with monoclonal anti-human vinculin (a protein of focal adhesion sites) and secondaryCy3-labeled goat anti-mouse specific antibodies, Alexa488-labeled phalloidin, and DAPI. Note thelocalization of vinculin at the end of stress-fibers especially in the cell periphery.
©Image: LU BioS368, Instructor: Prof. M. Falk; all rights reserved
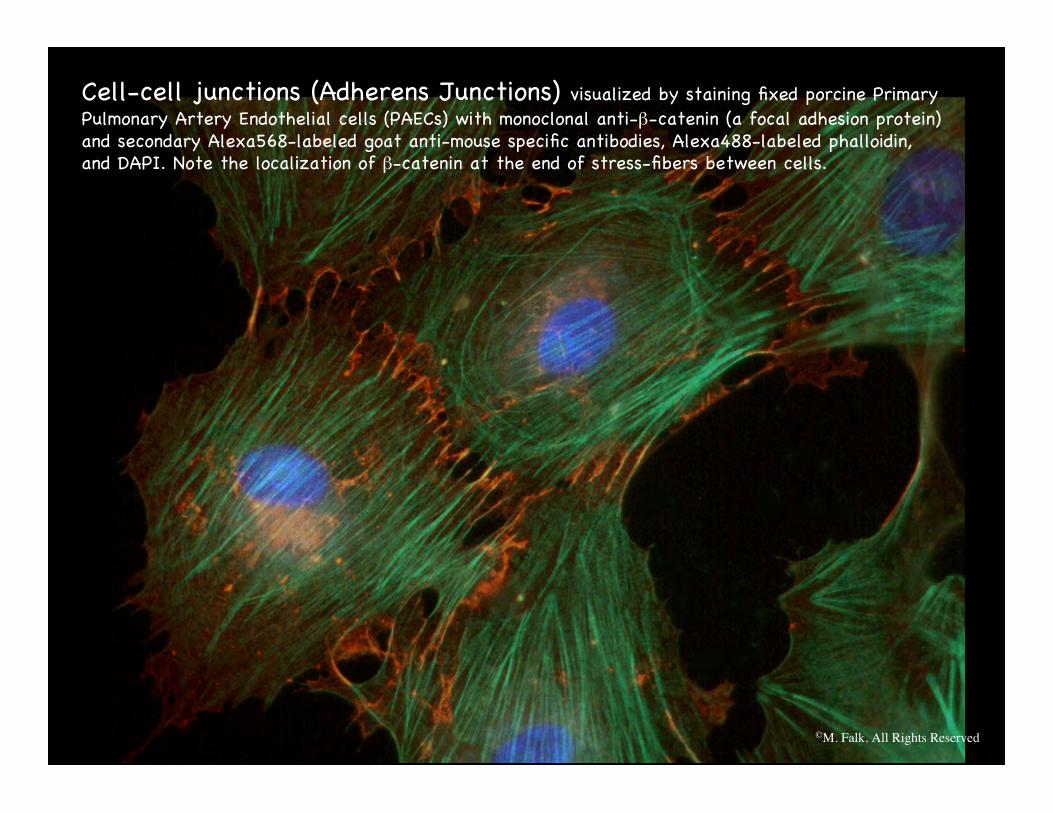
Cell-cell junctions (Adherens Junctions) visualized by staining fixed porcine PrimaryPulmonary Artery Endothelial cells (PAECs) with monoclonal anti-β-catenin (a focal adhesion protein)and secondary Alexa568-labeled goat anti-mouse specific antibodies, Alexa488-labeled phalloidin,and DAPI. Note the localization of β-catenin at the end of stress-fibers between cells.
©M. Falk, All Rights Reserved
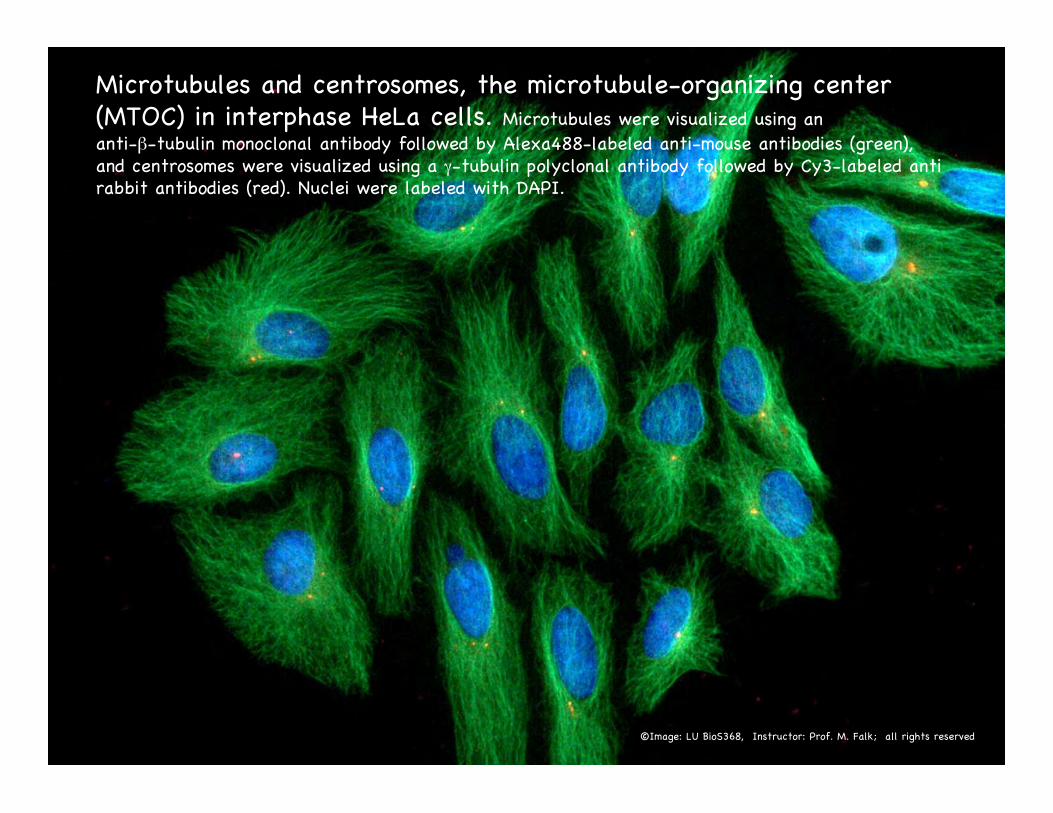
Microtubules and centrosomes, the microtubule-organizing center(MTOC) in interphase HeLa cells. Microtubules were visualized using ananti-β-tubulin monoclonal antibody followed by Alexa488-labeled anti-mouse antibodies (green),and centrosomes were visualized using a γ-tubulin polyclonal antibody followed by Cy3-labeled antirabbit antibodies (red). Nuclei were labeled with DAPI.
©Image: LU BioS368, Instructor: Prof. M. Falk; all rights reserved

Mitotic HeLa cells in Metaphase (left), early Anaphase (center), andCytokinesis (right). In Metaphase the condensed sister-chromosomes are aligned in thecenter of the spindle in the spindle plate, and in Anaphase are separated and moved to thespindle poles. Cytokinesis is the process of complete cell-separation.
©Image: LU BioS368, Instructor: Prof. M. Falk; all rights reserved

Live-Cell Chamber on Microscope Stage
©M. Falk, All Rights Reserved

Hours:min
Human Cultured Cells (HeLa) Growing on a Glass Coverslip
©M. Falk, All Rights Reserved

©M. Falk, All Rights Reserved
Green Fluorescent Protein (GFP) and Derivatives
Roger Tsien, Nobel Prize in ChemistryWinner, 2008, UCSD

Expression of green (GFP), yellow (KO), and red fluorescent (DsRed)proteins in transiently transfected HeLa cells. Fluorescence image on the left, combined phase-contrast and fluorescence image on the right.
©Image: LU BioS368, Instructor: Prof. M. Falk; all rights reserved

Ca2+Ca2+Electrical CurrentsElectrical Currents2nd Messengers (IP3)2nd Messengers (IP3)
ProteinsProteinsNucleic AcidsNucleic Acids
7nm 1.5nm
17 nm
3 nm
Gap Junction Structure and Function
Freeze Fracture
200 nm
Negative Stain
100 nm
EM Thin Section
(From: Falk, J. Cell Sci., 2000 Falk, Trends Cell Biol., 2002 Segretain & Falk, BBA, 2004)
100 nm

Cx43-GFP
Cx32-GFP
Gap Junction Plaques Assembled fromDifferent GFP-tagged Connexins
20
(From Falk, J. Cell Sci. 113:4109-20, 2000)
(Transfected HeLa cells)
Cx26-GFP

Volume Reconstruction of a Gap Junction Plaque
Unprocessed Deconvolved 3D-Volume Reconstruction
50 consecutive sections, z-steps 0.2 µm
(From Falk, J. Cell Sci.113:4109-20, 2000)
Objective lens
(not drawn to scale)
Focal plane
Z

Structural Composition of Gap Junction Plaques
(From Falk, J. Cell Sci. 113:4109-20, 2000)
SeparatedHomoHomomeric
Heteromeric
Channel Type and Arrangement:
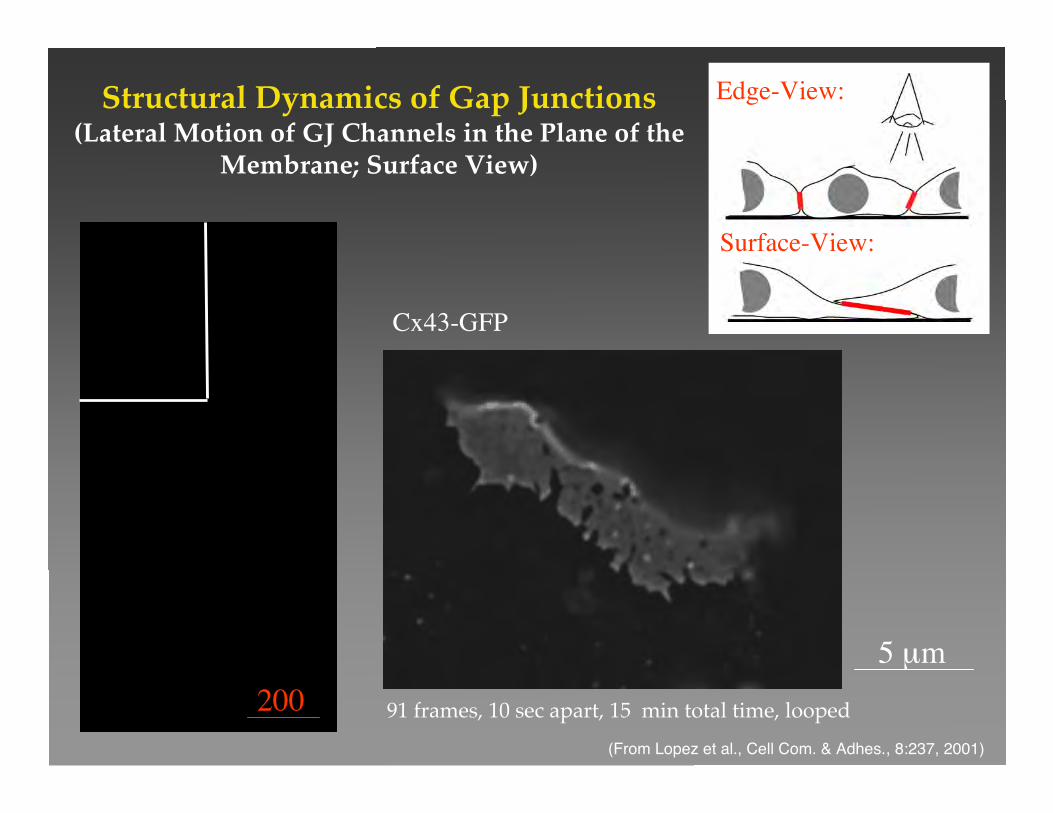
91 frames, 10 sec apart, 15 min total time, looped
5 µm
Cx43-GFP
Structural Dynamics of Gap Junctions(Lateral Motion of GJ Channels in the Plane of the
Membrane; Surface View)
200(From Lopez et al., Cell Com. & Adhes., 8:237, 2001)
Edge-View:
Surface-View:
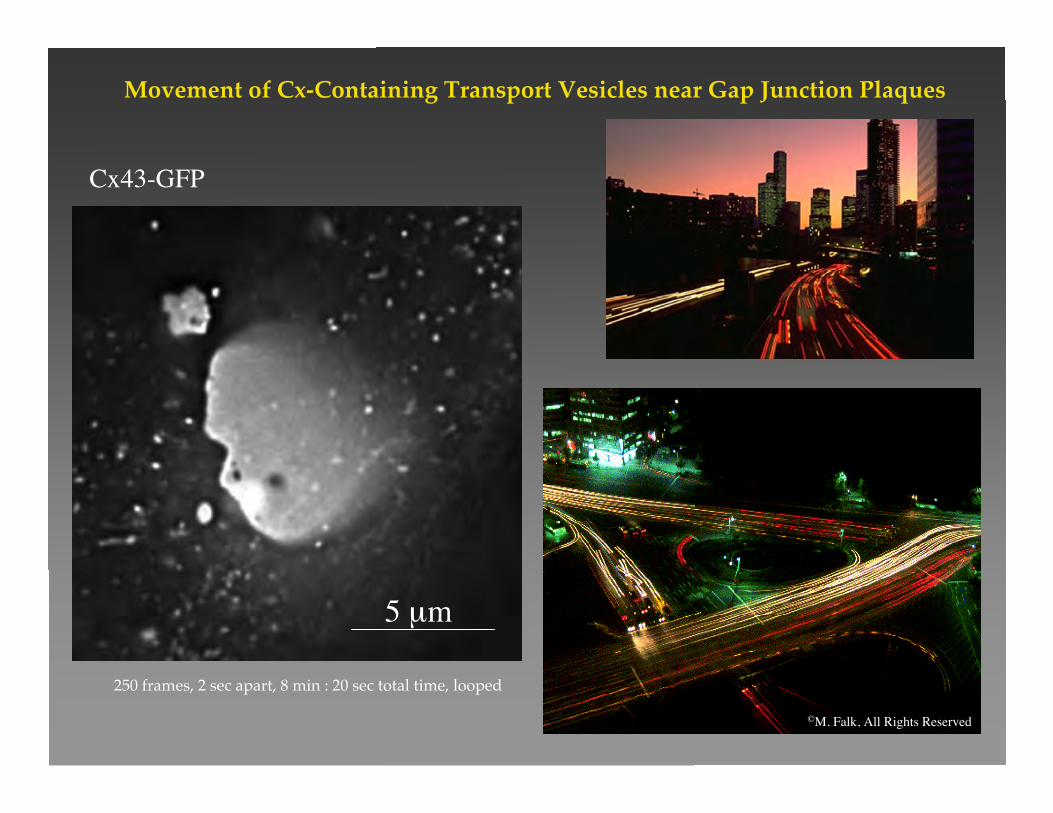
Movement of Cx-Containing Transport Vesicles near Gap Junction Plaques
250 frames, 2 sec apart, 8 min : 20 sec total time, looped
5
Cx43-GFP
©M. Falk, All Rights Reserved
5 µm

Trafficking of Exocytic and Endocytic Vesicular Connexin-Cargo along Microtubules
40 frames, 15 sec apart, 10 min total time, looped
10
Cx43-CFPCx43-CFP / / LysoTrackerLysoTracker / / ββ--TubulinTubulin-YFP-YFP
(From Lauf, …, & Falk, PNAS 99,10446-10451, 2002)
10 µm

40 frames, 15 sec apart, 10 min total time, looped
Cx43-CFP / β-Tubulin-YFP TP 1 - 21 (Merged)
TP 2 - 17
5 µm
Transport of Secretory Cx-Cargo along Microtubules
©M. Falk, All Rights Reserved

Gap Junction Channels are Recruited to the Edge of Channel Clusters(Fluorescence Recovery After Photobleaching, FRAP)
Cx43-GFP
(From Lauf et al., PNAS, 99:10446, 2002)
Surface Views
Edge Views

©M. Falk, All Rights Reserved
Gap Junction Channels are Recruited to the Edge of Channel Clusters(Photoconversion of Cx43-Dendra2)
1 hour post-conversion
5 µm

(From: Piehl et al.,MBC, 2007)
Entire Gap JunctionPlaques can Internalize to
form Annular GapJunctions (AGJs)
(Fluorecence Time LapseMicroscopy)
(Transfected HeLa cells)Hours:min
(Fluorescence and DIC)

Biosynthesis and Degradation of Gap Junctions(A Summary)
(From: Segretain & Falk, BBA, 2004)

More Than Pretty Pictures: Image Analysis(An Example)
©M
. Fal
k, A
ll Ri
ghts
Rese
rved

©M. Falk, All Rights Reserved
Detection of Cells Growing on Non-Transparent Objects:MC3T3 bone-precursor cells growing on non-transparent bio-glass, (nuclei stained with DAPI, combined fluorescence and reflection illumination)

©M. Falk, All Rights Reserved
X-Z
Y-Z
1 of 50 sections
Projections: 3D Volume Reconstructions:Scanning EM:
Detection of Cells Growing on Non-Transparent Objects:MC3T3 bone-precursor cells growing on non-transparent bio-glass, (nuclei stained with Propidium Iodide, Actin decorated with Alexa488-Phalloidin

Thank You!Thank You!