
Fluidized-Bed Reactor Systems for Chemical-Looping ...anly/co2/41_Eva_thesis_kappa.pdf ·...
71
i THESIS FOR THE DEGREE OF DOCTOR OF PHILOSOPHY Fluidized-Bed Reactor Systems for Chemical-Looping Combustion with Inherent Separation of CO 2 EVA JOHANSSON Department of Energy and Environment Division of Energy Technology CHALMERS UNIVERSITY OF TECHNOLOGY Göteborg, Sweden, 2005
Transcript of Fluidized-Bed Reactor Systems for Chemical-Looping ...anly/co2/41_Eva_thesis_kappa.pdf ·...

i
THESIS FOR THE DEGREE OF DOCTOR OF PHILOSOPHY
Fluidized-Bed Reactor Systems
for Chemical-Looping Combustion
with Inherent Separation of CO2
EVA JOHANSSON
Department of Energy and Environment
Division of Energy Technology
CHALMERS UNIVERSITY OF TECHNOLOGY
Göteborg, Sweden, 2005

ii
Fluidized-Bed Reactor Systems
for Chemical-Looping Combustion
with Inherent Separation of CO2
EVA JOHANSSON
ISBN 91-7291-685-0
© EVA JOHANSSON, 2005
Doktorsavhandlingar vid Chalmers tekniska högskola
Ny serie nr 2367
ISSN 0346-718X
Department of Energy and Environment
Division of Energy Technology
Chalmers University of Technology
SE-412 96 Göteborg
Sweden
Telephone +46 (0)31 7721000
Cover: Investigation of carbon dioxide capture in the hot 300 W reactor.
Printed in Sweden
[Reproservice, Chalmers University of Technology]
Göteborg, 2005

iii
Fluidized-Bed Reactor Systems for Chemical-Looping Combustion
with Inherent Separation of CO2
EVA JOHANSSON
Department of Energy and Environment
Division of Energy Technology
Chalmers University of Technology
Abstract
In chemical-looping combustion (CLC) a gaseous fuel can be burnt with inherent
separation of carbon dioxide. The system consists of two reactors, a fuel reactor and
an air reactor and an oxygen-carrier in the form of metal oxide particles that transports
oxygen from the air to the fuel. The gas leaving the air reactor consists of nitrogen
and unreacted oxygen, while the gas from the fuel reactor consists of water and
carbon dioxide. The water can easily be condensed, and the remaining carbon dioxide
can be liquefied for subsequent storage.
A CLC reactor system can be designed with two interconnected fluidized beds. Two
types of cold-flow models of CLC systems and one 300 Wth chemical-looping
combustor have been designed and constructed, and tested with respect to parameters
which are important for CLC. The first design is similar to a circulating fluidized bed,
with an extra bubbling bed added on the return side. This bubbling bed is the fuel
reactor and the riser is the air reactor. The main purpose of testing the reactor was to
establish suitable operating conditions as well as testing the influence of bed mass and
fluidization velocities on solids circulation flux and gas leakage. The second design is
a two-compartment reactor, where a downcomer transports particles from the air
reactor to the fuel reactor, and a slot in the bottom of the wall between the reactors
leads the particles back to the air reactor. The second design was used both for a cold-
flow model and the 300 Wth chemical-looping combustor.
Both cold-flow models indicated that the solids circulation rate between air and fuel
reactor was high enough for CLC, and that leakage was small and could be lowered
even more with simple countermeasures. The second design was also successfully
tested with combustion of natural gas and syngas in the temperature range 800-950˚C,
using two different nickel based oxygen-carriers. One oxygen-carrier was tested with
syngas, and the conversion of the fuel was high, often exceeding 99%, with hydrogen
and carbon monoxide concentrations close to thermodynamic equilibrium. For natural
gas, high conversion of the fuel was found for both oxygen-carriers, also around 99%.
One of the particles tested was in operation for 150 h, of which 30 h with combustion,
the other particle for 18 h, of which 8 h with combustion. No loss in reactivity was
observed during testing and virtually no attrition of the two particles was detected.
Keywords: Chemical-Looping Combustion, Interconnected Fluidized Beds, Carbon
Dioxide Capture.

iv

v
The thesis is based on the following papers:
I. Johansson, E., A. Lyngfelt, T. Mattisson and F. Johnsson. A Circulating
Fluidized Bed Combustor System with Inherent CO2 Separation –Application of
Chemical Looping Combustion, in J.R. Grace, J. Zhu and H. de Lasa (ed.)
Seventh International Conference on Circulating Fluidized bed, Niagara Falls,
Canada, 2002, pp. 717-724
II. Johansson, E., A. Lyngfelt, T. Mattisson and F. Johnsson. Gas Leakage
Measurements in a Cold Model of an Interconnected Fluidized Bed for
Chemical-Looping Combustion, Powder Technology 134 (2003) pp. 210-217
III. Johansson, E., B. Kronberger, G. Löffler, T. Mattisson, A. Lyngfelt, H.
Hofbauer. A Two-Compartment Fluidized Bed for Chemical-Looping
Combustion –Design and Experiments, Seventh International Conference on
Energy for a Clean Environment, Lisbon, Portugal, 2003
IV. Kronberger, B., E. Johansson, G. Löffler, T. Mattisson, A. Lyngfelt, H.
Hofbauer. A Two-Compartment Fluidized Bed Reactor for CO2 Capture by
Chemical-Looping Combustion Chemical Engineering and Technology 27
(2004) pp. 1318-1326
V. Johansson, E., T. Mattisson, A. Lyngfelt and H. Thunman. A 300 W Laboratory
Reactor System for Chemical-Looping Combustion with Particle Circulation,
submitted for publication
VI. Johansson, E., T. Mattisson, A. Lyngfelt and H. Thunman. Combustion of
Syngas and Natural Gas in a 300 W Chemical-Looping Combustor, submitted
for publication

vi

vii
TABLE OF CONTENTS
ACKNOWLEDGEMENT..........................................................................................ix
1 INTRODUCTION................................................................................................1
1.1 The greenhouse effect and CO2 mitigation............................................1
1.2 CO2 separation and sequestration ..........................................................4
1.2.1 Post-combustion.....................................................................................4
1.2.2 Pre-combustion ......................................................................................5
1.2.3 O2/CO2-combustion (oxy fuel) ..............................................................5
1.2.4 Unmixed combustion .............................................................................6
1.3 Scope of the thesis .................................................................................7
2 CHEMICAL-LOOPING COMBUSTION (CLC)............................................9
2.1 Reactor system.....................................................................................11
2.1.1 Net solids flux ......................................................................................11
2.1.2 Bed material .........................................................................................12
2.1.3 Gas leakage ..........................................................................................12
2.2 Theory ..................................................................................................12
2.3 Fluidization ..........................................................................................14
2.4 The chemical-looping process .............................................................14
2.5 Oxygen-carriers....................................................................................15
2.5.1 Environmental and health aspects of oxygen-carriers .........................17
2.6 Interconnected fluidized beds ..............................................................17
3 EXPERIMENTAL.............................................................................................21
3.1 Chosen designs and experimental set-ups............................................22
3.1.1 The CFB-like model (Papers I-II)........................................................22
3.1.2 The cold-flow model of 300 W unit (Papers III-IV)............................24
3.1.3 The 300 W unit (Papers V-VI).............................................................27
3.2 Experimental procedure .......................................................................30
3.2.1 Circulation flow of particles in a CFB-like model (Paper I) ...............30
3.2.2 Gas leakage between two reactors in a CFB-like model (Paper II) .....30
3.2.3 Circulation flow and gas leakage in a cold-flow model of a 300 W unit
(Papers III-IV)......................................................................................31
3.2.4 Leakage and combustion measurements in a 300 W unit (Paper V) ...32
3.2.5 Combustion measurements in a 300 W unit (Paper VI) ......................33
4 RESULTS AND DISCUSSION ........................................................................35
4.1 The CFB-like model (Papers I-II)........................................................36
4.1.1 Solids circulation .................................................................................36
4.1.2 Gas leakage ..........................................................................................37
4.2 The cold-flow model of a 300 W unit (Papers III-IV).........................38
4.2.1 Solids circulation .................................................................................38
4.2.2 Gas leakage ..........................................................................................39
4.3 The 300 W unit (Papers V-VI).............................................................40
4.3.1 Gas leakage ..........................................................................................40
4.3.2 Combustion ..........................................................................................42
4.3.3 Oxygen-carrier .....................................................................................47
5 CONCLUSIONS ................................................................................................49
NOTATION................................................................................................................53
REFERENCES...........................................................................................................55
PAPERS I-VI

viii

ix
ACKNOWLEDGEMENT
I would like to express my gratitude to all the persons who in one way or another
contributed to this thesis. I particular, I would like to thank:
My supervisor Professor Anders Lyngfelt for providing me the opportunity to work in
this interesting field and accomplish this thesis work. As well, I would like to thank
him for his interest in my work, his availability and encouragement.
My supervisor Associate Professor Tobias Mattisson for valuable discussions,
encouragement and experimental suggestions.
All colleagues in the chemical-looping group at Chalmers and in the CCCC-project.
Paul Cho for valuable discussions not always concerning chemical-looping
combustion, Marcus Johansson for the graphs provided to me even though I did not
always know what I wanted and Magnus Rydén for creative new ideas like “ebonit-
katt-kraftverket”. I would also like to mention Professor Filip Johnsson, dr Bernhard
Kronberger and Hilmer Thunman.
Lennart Darell, Niklas Hansson at VTS and Ulrik Rosen at 7rs Mekaniska for help
with the experimental devices.
All the colleagues that are or have been working at the department during these years
for providing a friendly and inspiring environment. I would like to mention Ulrika
Claeson-Colpier, Jenny Sahlin, Anna Krook and of course all participants in the “ten-
o’clock coffee group”.
Financial support from Miljösektionen, the project CCCC Capture of CO2 in Coal
Combustion (ECSE contract No 7220-PR-125) and the Swedish Energy Agency.
Family and friends for all the things that really matters. Special thanks to Magnus and
our lovely son Oskar.

x
xi
To Magnus and Oskar
“Without changing our pattern of thought,
we will not be able to solve the problems we
created with our current patterns of thought”
/Albert Einstein

xii

1
Chapter 1
1 INTRODUCTION
This thesis treats a technique for separation of carbon dioxide in combustion of fossil
fuels. Carbon dioxide is a greenhouse gas, and about 75% of the anthropogenic
release of carbon dioxide comes from combustion of fossil fuels, (IPCC 2001). It is
generally accepted that greenhouse gases contribute to the increased global
temperature. In order to stabilize the atmospheric concentration of CO2, substantial
measures are necessary quickly. At present, renewable energy sources with moderate
costs, such as wind energy and biomass, seem to have a limited potential for
substitution of fossil energy (Strömberg 2001). One possibility to decrease the CO2
emissions is to capture and dispose of the carbon dioxide from fossil fuels.
After a short summary of the greenhouse effect and an introduction to different
techniques for separating carbon dioxide, this thesis will focus on one of these
techniques, chemical-looping combustion.
1.1 The greenhouse effect and CO2 mitigation
There are indications of an increased global average temperature during the last
century. Increasing temperature can give several different effects, such as increase of
the sea water level, agriculture and fisheries may be disrupted, and the prevalence of
diseases such as malaria may increase. Also ecological systems will be influenced. A
change in the temperature disturbs the ecological equilibrium, affecting location of
ecological systems and the mix of species that they contain. The faster the change, the
greater the disequilibria may be, and the harder it will be for ecosystems to adapt.

2
The concentration of CO2 in the atmosphere has increased from 280 to 350 ppm since
the industrialization. Measurements have shown that the global annual average
temperature has increased 0.6°C ± 0.2°C during the last century, (IPCC 2001).
Greenhouse gases absorb long wave radiation and contribute to the global warming.
Carbon dioxide is the gas that contributes the most, about 55%, when both
concentration and absorption are taken into account, (Harvey 2000). Carbon dioxide
has the lowest relative heat trapping ability of the greenhouse gases, but the amount of
carbon dioxide emitted is much larger than other greenhouse gases. The climate
sensitivity is about 2.5°C for a doubling of the carbon dioxide concentration in the
atmosphere (Azar and Rodhe 1997). This value is uncertain and may vary in the range
of 1.5-4.5°C due to feedbacks such as change in water vapour concentration, clouds
and ice cover. If the emission of greenhouse gases continues to increase at the present
rate, the temperature may change about 0.3 degrees per decade (Davis 1986). The
rates of change in temperature may be greater than the time necessary for ecological
systems to adapt. The greater the rate and extent of the change, the higher is the
probability of substantial ecosystem disruption and species extinction (IPCC 1998).
For example the greatest documented movement for trees are in average 20-25 km per
century, which in the Great Lakes USA region corresponds to a temperature increase
of about 0.2-0.25 degrees per century (Davis 1986).
Warmer climate causes a movement of the vegetation belts polewards and upwards in
altitude to compensate for the temperature increase. The moving vegetation can be
limited by inadequate light, oceans, seas, mountains and poor soil (IPCC 1998;
Walther et al. 2002). Also human activities, such as farming, prevent vegetation from
movement. The nutrient limits for different species differ; e.g. deciduous forests have
a high need of mineral nutrient while conifer forests live where the amount of mineral
nutrients in the soil are poor.
Climate changes affect the ecosystems directly, and also in indirect ways, e.g.,
changes in soil moisture. Inputs to soil water are rain and snowmelt; outputs are
evapotranspiration, direct evaporation from bare soils and subsurface drainage. An
increase in air temperature will evaporate more water from the soil and thereby dry
the soil. However, it is likely that changes in temperature profiles will change the

3
structure of precipitation. Climate models suggest that days with heavy rainfall are
likely to increase, even in areas where the yearly total amount of precipitation is the
same or less, (Harvey 2000). More intense rain means more water during a shorter
time. Since the runoff from soil increases with the moisture content, more of the total
rainfall will run off, causing even higher reduction in soil moisture.
An observed rise in sea level is due to temperature increase, but there are also other
minor anthropogenic effects (permanent removal of water from aquifers, loss in soil
moisture because of deforestation and reduction in the extent of wetlands among
others). A temperature increase causes melting of glaciers and other ice masses, and
also a thermal expansion of the ocean water (Harvey 2000).
Although the specific effects, e.g. local temperature changes and changes in rain and
dry periods, of an increased concentration of CO2 in the atmosphere are uncertain, it is
clear that the ecological systems will be affected. It is therefore of great importance to
stabilize the atmospheric concentration of greenhouse gases, especially CO2. This
means that a drastic reduction in the release of CO2 from combustion of fossil fuels is
necessary. This could be achieved by:
• Increased efficiency in conversion and use of energy.
• Change to fuels with lower carbon content, i.e. that emits less CO2 per unit of
useful energy.
• Increased utilization of renewable energy sources.
• Increased utilization of nuclear power.
• Increased sequestration of carbon dioxide by natural sinks that is the terrestrial
biosphere.
• Capture and sequestration of carbon dioxide from energy plants and other
sources.
• Decreased energy consumption per capita
In a world where the energy demand is expected to increase with growth in economy
it is not likely that any one of these measures in itself will be enough, but rather a
combination of these. In this thesis a technology for capture of CO2 called chemical-
looping combustion (CLC) has been investigated.

4
1.2 CO2 separation and sequestration
To achieve a slightly concentrated stream of carbon dioxide several methods can be
used. These techniques are normally divided into three principal groups.
• Post combustion
• Pre combustion
• O2/CO2 combustion (“oxy fuel “)
Chemical-Looping Combustion, which is a combustion technique with inherent
separation of CO2, does not fit into either of these groups. It would best fit in a fourth
category, i.e.:
• Unmixed combustion.
The different techniques will be briefly presented below.
1.2.1 Post-combustion
In post combustion capture, the carbon dioxide is separated from the flue gas, Figure
1. This means that the combustion process itself is not affected, but the separation step
needs energy, and this energy is taken from the combustion step, which lowers the
energy efficiency of the process.
Figure 1. Post-combustion principle
The separation step can be an absorption/desorption process with for example
monoethylene amine (MEA) as absorber. In this case the flue gas is led through an
absorption tower, where an absorber (MEA) absorbs the carbon dioxide. The rest of
the flue gas is released to the atmosphere, while the CO2-rich absorber is led into a
CO2 stripper tower, where CO2 is released, and the MEA is then recycled back into
the absorption tower. The technology is commercially available and has been used for
various applications since the late seventies.
Power process
CO2
separation Flue gas Flue gas
Energy Electricity CO2
Air
Fuel

5
Other possibilities for the CO2 separation step are adsorption, membrane separation
and regenerable solid solvent.
1.2.2 Pre-combustion
The idea is to convert the fuel to CO2 and H2 and to separate the CO2 before the
combustion, Figure 2. The first step is to convert the fuel to a suitable gas containing
CO, CO2, H2 and H2O by partial oxidation, reforming or a combination of these. In
the second step CO and H2O are shifted to CO2 and H2. Thereafter, the carbon dioxide
is removed from the gas mixture. This is done for example by using absorption.
Because the concentration of carbon dioxide is quite high the gas separation step is
cheaper compared to post-combustion where a stream highly diluted with nitrogen
needs to be treated. The remaining hydrogen can be used for instance in fuel cells or a
combined gas turbine cycle.
Figure 2. Pre-combustion principle, also called CO-shift.
1.2.3 O2/CO2-combustion (oxy fuel)
The oxy-fuel principle is shown in Figure 3. The combustion of the fuel is
accomplished with a mixture of oxygen and recirculated carbon dioxide instead of air.
Before the combustion chamber, a unit separating oxygen from the air is needed.
Since no nitrogen is present, the flue gas will consist of carbon dioxide, water and
some argon. The argon is present since it follows the oxygen and not the nitrogen in
the air separation process. After the combustion a flue gas treatment, involving
condensing and removal of water and removal of non-condensable gases, the carbon
dioxide is received pure. Some of the carbon dioxide is circulated to the combustion
chamber because of difficulties of using pure oxygen in combustion.
Gasification/
reforming
CO shift:
H2O + CO →
H2 + CO2
CO2
separation
Combustion
(gas turbine)
H2
Flue
gas
Air/O2/H2O
Fuel
CO2 Air

6
Figure 3. Oxy-fuel principle
1.2.4 Unmixed combustion
There are some combustion methods where the combustion air and the fuel never are
mixed, and therefore the carbon dioxide is inherently separated during combustion,
without using any gas separation step. Examples of unmixed combustion are fuel
cells, AZEP and chemical-looping combustion.
In a fuel cell chemical energy is converted to electrical energy. A special type of fuel
cell can be used to produce electricity and separate oxygen from air. First, the
hydrocarbon fuel has to be converted to CO and H2 at the anode. Thereafter these
products are oxidized to CO2 and H2O by oxygen ions that diffuse through the
electrolyte from the cathode. Since the electrolyte is selective and only transports
oxygen, the carbon dioxide and water are received pure.
AZEP, Advanced Zero Emissions Power Plant, is a technology where O2 is
transferred from the combustion air through a membrane in the combustion reactor.
Then, the combustion takes place in a nitrogen free environment, and the flue gas
consists of carbon dioxide and water. The reactor is integrated in a gas turbine
(Sundkvist et al. 2001).
Chemical-looping combustion is a combustion method with inherent separation of
carbon dioxide. The air is never mixed with the fuel, two flue gas streams leave the
system, one with the reaction products and one with nitrogen and some oxygen from
the air. The technique will be explained in the next chapter.
Power process
Flue gas
treatment and
condensation
Air separation
Air N2 Electricity
Flue gas
N2, O2, Ar,
NO, SOx
CO2
H2O
7
1.3 Scope of the thesis
The aim of the thesis is to investigate possible designs of chemical-looping
combustion reactors. The dissertation is based on six papers. The first four papers
present two different designs of a chemical-looping system, and tests made in cold-
flow models. The last two papers show results from a 300 W chemical-looping
combustor based on the optimised design in papers III and IV.

8
9
Chapter 2
2 CHEMICAL-LOOPING COMBUSTION (CLC)
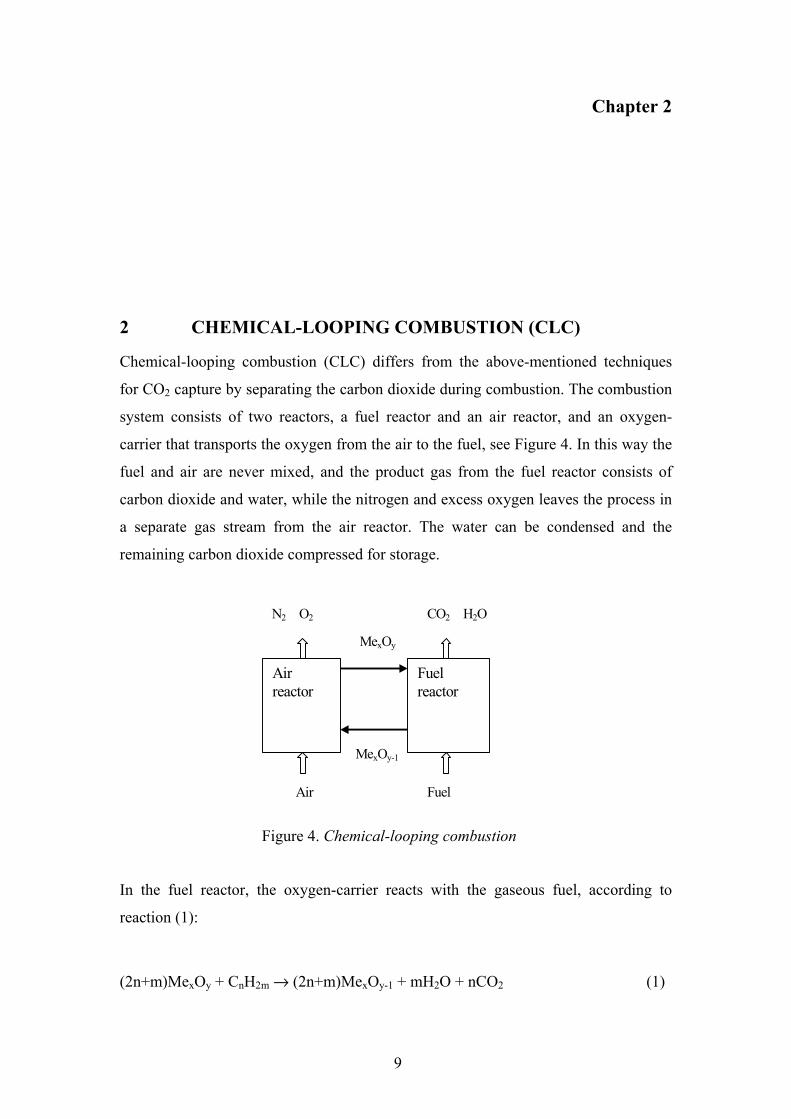
Chemical-looping combustion (CLC) differs from the above-mentioned techniques
for CO2 capture by separating the carbon dioxide during combustion. The combustion
system consists of two reactors, a fuel reactor and an air reactor, and an oxygen-
carrier that transports the oxygen from the air to the fuel, see Figure 4. In this way the
fuel and air are never mixed, and the product gas from the fuel reactor consists of
carbon dioxide and water, while the nitrogen and excess oxygen leaves the process in
a separate gas stream from the air reactor. The water can be condensed and the
remaining carbon dioxide compressed for storage.
N2 O2
MexOy
CO2 H2O
Fuel Air
MexOy-1
Air
reactor Fuel
reactor
Figure 4. Chemical-looping combustion
In the fuel reactor, the oxygen-carrier reacts with the gaseous fuel, according to
reaction (1):
(2n+m)MexOy + CnH2m → (2n+m)MexOy-1 + mH2O + nCO2 (1)

10
The reduced oxygen-carrier is transported to the air reactor where it is oxidized by the
oxygen in the incoming air.
MexOy-1 + ½O2 → MexOy (2)
The total reaction is the sum of reactions (1) and (2), and the same as for normal
combustion in air.
CnH2m + (n+m/2)O2→ mH2O + nCO2 (3)
Thus, the oxygen-carrier is oxidized back to the original metal oxide, and can be
returned to the fuel reactor for a new cycle. Possible metal oxides which could be
used in a chemical-looping combustor are some oxides of common transition-state
metals, such as iron, nickel, copper and manganese, (Cho 2005). Reaction (1) is
exothermic with subsequent heat release, while reaction (2) may be endothermic or
exothermic, depending on oxygen-carrier and fuel. However, the total heat released is
the same as for conventional combustion when oxygen and fuel are in direct contact.
In this work reactor systems of interconnected fluidized beds are investigated for
chemical-looping combustion. Below a background for this work is given. First, some
important criteria for a chemical-looping combustion reactor system are discussed in
section 2.1. Second, some fundamental relations for chemical-looping combustion
will be given in section 2.2, followed by an introduction to fluidization, 2.3. Work on
chemical-looping combustion has been focused on three areas, thermodynamic studies
of the process, development and tests of oxygen-carriers and development and tests of
reactor designs. Overviews of these areas are presented in sections 2.4, 2.5 and 2.6
respectively.

11
2.1 Reactor system
Important criteria for the CLC system are:
i) The rate of circulation of oxygen-carrier between the reactors needs to be
sufficient to transport the amount of oxygen needed for the combustion of
the fuel. For the case of endothermic reaction in the fuel reactor the
circulation also needs to be sufficient for maintaining an adequate
temperature in the fuel reactor.
ii) The amount of bed material in both of the reactors has to be adequate for
sufficient conversion of gas.
iii) The gas leakage between the two reactors must be minimized to prevent
the carbon dioxide from being diluted with nitrogen, which will increase
the power needed to liquefy the CO2, or to prevent carbon dioxide from
leaking to the air reactor decreasing the efficiency of carbon dioxide
capture.
In this work interconnected fluidized beds were chosen for the design of the CLC
system, and the oxygen-carrier acts as bed material. Fluidized beds are suitable since
in fluidization there is a large contact area between gaseous and solid phase, and
proven technology is also available for moving particles between reactors.
The reasons why these three different criteria are important for a CLC reactor system
are further discussed below.
2.1.1 Net solids flux
The needed solids circulation is determined by two factors. The first is the oxygen
needed for combustion. Since the particles are carrying the oxygen for the combustion
reaction, the net solids flux between the reactors has to be high enough to transfer the
needed amount of oxygen. The second is the heat. The reaction in the air reactor is
exothermic, but the reaction in the fuel reactor is often endothermic. For the case
when the reaction in the fuel reactor is endothermic, the particles are not only
transferring the oxygen but also the heat to reach sufficient temperature in the fuel
reactor.

12
2.1.2 Bed material
The amounts of bed material in the air and fuel reactors are dependent on the rate of
the reaction between the gas and the oxygen-carrier, i.e. for a slow reaction more
material is needed
2.1.3 Gas leakage
The gas leakage between the reactors has to be minimized. If there is a leakage from
the fuel reactor into the air reactor, the carbon dioxide capture efficiency will decrease
since carbon dioxide will escape into the atmosphere. A leakage in the other direction,
i.e. from the air reactor to the fuel reactor, will cause the carbon dioxide stream to be
diluted with nitrogen, and extra costs for purification of CO2 might be incurred.
2.2 Theory
The heat released at combustion with an oxygen-carrier is the same as for
conventional combustion. Below some fundamental relations relevant for chemical-
looping combustion are given. They have been presented previously by for instance
Lyngfelt et al. (2001). Assuming total combustion of a fuel with heat value of Hi, and
the thermal power, Pth, the mass flow of fuel is given by:
i
thfuel
H
Pm =& (4)
The oxygen needed is given from the stoichiometric combustion of the fuel:
r
fuel
fuel
Oo SM
mMm ⋅⋅=
&&
2 (5)
Where Sr is the stoichiometric ratio between oxygen and fuel, M is the molar mass for
oxygen and fuel respectively. With combustion an excess of air is needed to make
sure that all fuel is burnt out. This excess air ratio, λ, is the ratio between air actually
added and stoichiometric needed air. The air mass flow is then given by:
air
O
o
air MM
mm ⋅⋅
⋅= λ
21.02
&& (6)

13
The cross-section area, A, of both reactors is determined from the gas flow and the
velocity chosen.
u
mA
⋅=
ρ
& (7)
Where ρ is the density of the gas at the actual temperature in the reactor and u is the
velocity. The velocity is chosen to obtain suitable fluidization conditions.
The degree of oxidation, or conversion, of an oxygen-carrier is defined as:
redox
red
mm
mmX
−
−= (8)
where m is the actual mass of the oxygen-carrier, mox is the mass of the oxygen-
carrier when fully oxidized, mred is the mass of the oxygen-carrier when fully reduced.
Since oxygen is transferred from the air reactor to the fuel reactor, the conversion is
higher in the air reactor than in the fuel reactor, and the difference in conversion, ∆X,
is:
redox XXX −=∆ (9)
The oxygen ratio, Ro, is the mass fraction of oxygen that can be used in he oxygen
transfer. It shows the maximum oxygen that can be transported from the air reactor to
the fuel reactor. It is defined as:
ox
redoxo
m
mmR
−= (10)
A mass-conversion based on the mass of the oxygen-carrier is defined as:
( )11 −+== XRm
mo
ox
ω (11)
The rate of circulation of oxygen-carrier based on oxygen transfer between the
reactors can be calculated from:
o
ooairsol
RX
mmm
⋅∆≈
∆
⋅=
&&&
ω
ω (12)
The amount of oxygen-carrier needed in each reactor is inversely proportional to the
reactivity of the oxygen-carrier and can be calculated from:

14
dtd
mm o
bed/ω
ω &⋅= (13)
2.3 Fluidization
Fluidization is a technique where a bed of solids (particles) is exposed to an upward
stream of fluid (gas or liquid) and behaves like a fluid. To obtain fluidization, the gas
velocity must exceed the minimum fluidization velocity, umf, which occurs when the
pressure drop caused by friction between solids and gas becomes equal with the
weight of the bed. Required gas velocity depends on the properties of the gas and
particle. The pressure drop over the bed becomes constant even when the gas velocity
exceeds the minimum fluidization velocity. This is because excess gas leaves the bed
in bubbles, and therefore the particles do not experience a gas velocity higher than
umf. This region is called bubbling fluidization.
The terminal velocity, ut, is reached when the drag force is equal with the weight of a
single particle. When the gas velocity exceeds the terminal velocity, the particles can
be carried away from the bed by the gas. A fluidized bed operated at velocities above
the terminal velocity will have a dense bottom bed, and above this a suspension of
particles. The particle concentration is decreases with the height of the vessel.
2.4 The chemical-looping process
The chemical-looping combustion process was first presented by Richter and Knoche
(1983). Later, the process was named chemical-looping combustion (Ishida et al.
1987). When the process was first introduced, the main objective was to increase the
overall thermal power plant efficiency. Now, the main objective is on carbon dioxide
capture.
Thermodynamic studies have been focused on comparative studies of thermal power
processed with chemical-looping combustion, and often including exergy analysis of
chemical-looping combustion. This has been addressed by research groups at
Dartmouth College (Harvey 1994), at Tokyo Institute of Technology, e.g. (Ishida and
Jin 1994), Royal Institute of Technology e.g. (Anheden et al. 1995; Anheden and

15
Svedberg 1996; Wolf 2004), at Norwegian University of Science and Technology
(Naqvi et al. 2004; Brandvoll 2005), at University of Genoa (Bisio et al. 1998), at
Louisiana State University (Yu et al. 2003) and at Politecnico di Milano (Consonni
and Vigano 2005). The main focus has been on pressurized systems with combined
cycles, and generally, the studies show high efficiencies for chemical-looping
combustion. The efficiencies presented are equal or even higher than conventional
technology, with the benefit of carbon dioxide capture. Note that this work is
theoretical and not based on verified performance of actual oxygen-carriers, for
example being able to sustain high temperatures. Nevertheless, the studies show that
the potential for chemical-looping combustion is high. They also provide
requirements on temperatures and pressure for optimization of the efficiency.
2.5 Oxygen-carriers
There are some important criteria for the oxygen-carrier. The rate of oxidation and
reduction has to be sufficient. Otherwise the amount of oxygen-carrier needed in the
two reactors would be too large. Also the oxygen carrying capacity needs to be
sufficient. This is to avoid the circulation of particles between the reactors from being
very large. Since the proposed reactor system consists of fluidized beds, the particles
need to have good strength, and low tendency for fragmentation and attrition. They
also need to have a low tendency for agglomeration at the high temperatures used.
There are also other aspects than chemical and physical, such as the cost of the
oxygen-carrier, and environmental and health issues.
A few authors have presented reactivity data from tests with pure metal oxides, such
as iron ore, e.g. (Mattisson et al. 2001). However, most studies have been conducted
with metal oxides which are combined with an inert material. This gives the oxygen-
carrier a more porous structure, and thereby increases the surface area for reaction. It
may also increase the mechanical strength and attrition resistance, (Adánez et al.
2004).

16
Table 1. The oxygen ratio, Ro, eq (10), for different metal oxides.
MexOy/MexOy-1 Ro
NiO/Ni 0.21
CuO/Cu 0.20
Mn3O4/MnO 0.07
Fe2O3/Fe3O4 0.03
Different oxygen-carrier particles have been tested, and a number of publications
related to the development of oxygen-carrier particles have been issued by different
research groups at Tokyo Institute of Technology, e.g. (Jin et al. 1999; Ishida et al.
2002), Chalmers University of Technology, e.g. (Cho et al. 2004; Mattisson et al.
2004), Korea Institute of Energy Research, e.g. (Song et al. 2003), TDA Inc, e.g.
(Copeland et al. 2001), CSIC-ICB in Zaragoza, e.g. (Adánez et al. 2004), National
Institute for Resources and Environment in Japan, (Hatanaka et al. 1997), Politecnico
di Milano (Villa et al. 2003) and Norwegian University of Science and Technology
(Brandvoll 2005). An overview of the work which has been performed on different
oxygen-carriers can be found in theses by Cho (2005) and Brandvoll (2005). In
general, particles tested have active oxides of Fe, Ni, Cu or Mn as active part,
combined with some type of inert carriers, such as Al2O3, ZrO2, TiO2 or MgO. The
amount of oxygen which can be transferred between the reactors is dependent on the
metal oxide system used, and can be seen by the oxygen-carrier ratio, Ro, for the most
common metal oxides, see Table 1. It should be noted that the table presents the
oxygen ratio for the pure metal oxides, and the oxygen ratio would be lower when
inert material is added. There are also thermodynamic limitations which should be
considered. Fe, Cu and Mn have oxide systems which have the ability to fully convert
methane and syngas completely to CO2 and H2O, but for Ni there is a thermodynamic
limit of 99-99.5%. This will be discussed later. The reactivity under alternatively
oxidising and reducing conditions can vary greatly between different oxygen-carriers,
and is a function of the metal oxide and inert used, the preparation method and
temperature during heat treatment. In general, NiO has been found to be the most
reactive oxygen-carrier with methane, although well suited particles based on Cu, Mn
and Fe have also been developed, e.g. (Adánez et al. 2004; Johansson et al. 2005).
Only limited experimental studies have been performed with syngas as fuel.

17
2.5.1 Environmental and health aspects of oxygen-carriers
The availability of the proposed materials for oxygen-carriers differs. Iron is after
alumina the most common metal, and the fourth most common element on earth. Also
manganese is common, while copper and nickel exist in lower concentration. To
compare, the mineable reserve of iron is estimated to be 110000 million tons, while
for nickel it is 60 million tons, (NE 2005). In general, the environmental impact of
mining a metal that exists in high concentration is smaller than mining a rare metal.
After use in a chemical-looping combustor, it is a possibility that the oxygen-carrier
material could be recycled and used for other purposes instead of being treated as
waste. Also, it might be a possibility to use waste products from the industry, e.g.
steel industry, to produce oxygen-carriers for chemical-looping combustion.
Also with respect to health aspects the metals differ from each other. For instance iron
has a very low toxicity, whereas nickel is the unhealthiest metal of the proposed ones.
The latter can cause contact allergy and inhalation of nickel dust may cause chronic
respiratory infections and asthma like conditions. Also the olfactory sense can be
damaged and it may cause cancer in lung and sinus. Copper and manganese can also
have adverse effects. Serious poisoning of copper is unusual since the uptake from the
intestine is low, but inhalation of metal smoke containing copper can give metal
ague/shiver, with respiratory irritation, cough and fever. Exposure of manganese can
cause damages on the lungs and neurological disorders. (NE 2005). Although long
term exposure of some of these metals or metal oxides may cause health problems, all
are handled and used in large scale industrial applications. Furthermore, chemical-
looping combustion is expected to be used in a system with highly efficient separation
of particles.
2.6 Interconnected fluidized beds
For chemical-looping combustion two inter-connected reactors are needed. Various
systems of interconnected fluidized beds are in actual use for various applications or
have been proposed in the literature. Below some systems are discussed as
background for understanding possible choices for actual full-scale plants but also as

18
options for systems suitable for use in laboratory. First two designs considered as
laboratory chemical-looping combustors are presented. The second design was chosen
and built both as cold-flow model and chemical-looping combustor. Thereafter,
systems of possible relevance for design of a full-scale plant are discussed.
A four-compartment reactor was first proposed by Kuramoto et al., (1986), to be used
for gasification of biomass and municipal waste, and it has been further investigated
by others, (Fox et al. 1989; Snip et al. 1996; Abellon et al. 1997; Snieders et al. 1999)
This reactor consists of two slow fluidized beds and two more vigorously fluidized
beds. Overflows lead the particles from the fast to the slow beds, and orifices in the
bottom of the wall leads the particles from the slow to the fast beds. In this way the
particles circulate between the four reactors.
Chong et al. (1986) presented a two-compartment reactor for oil shale retort, and this
reactor has been further investigated by He et. al. (1993) and Fang et al., (2003). This
reactor system has a vigorously fluidized bed connected to a slow fluidized bed. The
particles follow the gas in the vigorously fluidized bed, and fall down into a
downcomer between the beds, and are transported into the slow bed. The pressure
induced by the particle column in the downcomer forces particles into the slow bed,
raising the pressure drop of this. Thus, the pressure drop in the slow bed becomes
higher than in the other bed, and therefore the particles are pressed back into the fast
bed through an orifice in the lower part of the wall between the beds.
Fluid catalytic cracking (FCC) was developed in the 1940s and was the beginning of
modern fluidization technology, (Avidan and Shinnar 1990). Now it is the most
common application of interconnected fluidized beds (Avidan 1997). There are
different designs for FCC, but they consist of a regenerator and a reactor. There is a
circulation of particles between these two fluidized beds, often consisting of an outlet
in the bottom of the bed, and pneumatic transport through a tube to the other fluidized
bed. Depending on the cracker design, there may also be solids circulation loops
within the regenerator and reactor. The technology is very specific for cracking, and
the temperatures used are lower than those needed for chemical-looping.

19
o
o
oo
oo
o
o
Figure 5. A CFB-boiler. 1) riser,
2) cyclone, 3) particle seal, 4)
fluidized bed heat exchanger.
Figure 6. Layout of a chemical-
looping combustor, with two
interconnected fluidized beds. 1) air
reactor, 2) cyclone, 3) fuel reactor, 4)
particle seals.
A proven technology for combustion of solid fuels is circulating fluidized bed boilers.
The first circulating fluidized bed (CFB) boiler was built in the end of 1970s. Today,
CFB boilers of the size 550 MWth are in use. A circulating fluidized bed boiler is
operated at velocities above the terminal velocity in the riser and has equipment, e.g. a
cyclone, to return the particles back to the bed, see Figure 5. Often the CFB boiler has
a small bubbling fluidized bed which the particles pass before returning to the riser.
This is used for extracting heat from the process and is called fluidized bed heat
exchanger. The CFB boiler operates in about the same temperature range as CLC, and
with minor modifications, a CFB boiler could be converted to a chemical-looping
combustor, (Morin and Béal 2005). The riser is used as air reactor, and after the
cyclone, a bubbling bed is added as fuel reactor. A chemical-looping combustor with
this design was proposed by Lyngfelt et al. (2001), Figure 6. The important difference
compared to the CFB boiler in Figure 5, is that the fluidized bed heat exchanger is
exchanged for a fuel reactor and that an additional particle seal is added.
air fuel
1
3
CO2 + H2O
2
N2 + O2
4
4
1
2
3
4

20
A similar system, a circulating fluidized bed for gasification of biomass was built and
tested as cold-flow model (Kehlenbeck et al. 2001) and also a 100 kWth steam gasifier
was built, (Pfeifer et al. 2004). The gasification system consists of a gasification
reactor and a combustion reactor, and using nickel-enriched catalytic particles as bed
material. The combustion reactor is a riser ending in a bubbling fluidized bed. In the
bottom of this bubbling bed a downcomer leads the particles to the gasification
reactor, a bubbling fluidized bed, and from the bottom of this reactor, the particles are
led back into the riser. The gasification reactor is fluidized with steam, and the
combustion reactor with air, and the flue gases leaves the system separately. In this
way, the product gas is free of nitrogen.
In addition to the system presented in this work, two chemical-looping combustors
have been presented in the literature, a 10 kW unit at Chalmers University of
Technology (Lyngfelt et al. 2004; Lyngfelt and Thunman 2005) and a 50 kW unit at
Korea Institute of energy Research (Ryu et al. 2004). The 10 kW unit has the
principal design shown in Figure 6, and it was first tested as a cold-flow model at
Vienna University by Kronberger et al. (Kronberger et al. 2005). Stable and suitable
operating conditions were identified. In the 10 kW chemical-looping combustor, an
oxygen-carrier based on nickel oxide was operated for 100 h with natural gas as fuel.
A fuel conversion efficiency of 99.5% was achieved, and no carbon dioxide escaped
to the air reactor, hence, all carbon dioxide was captured in the process. Only small
losses of fines were observed. The 50 kW chemical-looping combustor was operated
with methane as fuel and two types of oxygen-carriers. A nickel oxide oxygen-carrier
was tested during 3.5 h and a cobalt oxide was tested during 25 h. For the nickel oxide
oxygen-carrier, the concentration based on dry flue gases of CO2 leaving the fuel
reactor was 98% and for cobalt oxide 97%. The two units have a similar design, but
differ at the return from the fuel reactor. In the 10 kW unit the particles leave the fuel
reactor through an overflow, i.e. the bed height in the fuel reactor is always constant,
while in the 50 kW unit the particles leave the fuel reactor from the bottom of the bed,
and the particle flow i.e. the bed height of the fuel reactor, is controlled by an L-valve.

21
Chapter 3
3 EXPERIMENTAL
Prior to this work, only limited work had been conducted with respect to chemical-
looping combustion, and that work was almost entirely focused on development of
oxygen-carrier particles. Thus, there was a need to investigate reactor designs.
Three fluidized units for chemical-looping combustion were designed and
constructed; two cold-flow models and one 300 W chemical-looping combustor. The
main purpose with the first cold-flow unit to investigate a possible design for a pilot
reactor. The chosen design was similar to a circulating fluidized bed, but with a
bubbling fluidized bed on the return from the cyclone.
Oxygen-carriers had earlier been tested in batch reactors, but there was a need for a
continuously operating small size chemical-looping combustor to i) study the process
and ii) test oxygen particles in real chemical-looping combustion. A simpler design
than the CFB-like reactor tested above was preferred, and a two-chamber fluidized
bed was chosen, first proposed by Chong et al. (1986). A laboratory chemical-looping
combustion reactor system with a thermal power of 100-300 W was designed, and
first a cold-flow model was built and tested. The testing in the cold-flow model
indicated that the design was suitable and subsequently the 300 W chemical-looping
combustor was built with only some minor modifications. In this unit it was possible
to demonstrate the process and test performance of oxygen-carrier particles in
extended operation using both syngas and natural gas as fuel.
A cold-flow model has some benefits compared to a hot unit, and therefore it is an
advantage to first construct and study a cold-flow model. They are cheaper, easier to

22
handle and allow visual observation of flow structures. Pressure profiles, solids
circulation data, gas leakage between the reactors are parameters that can be predicted
for a hot unit by studies in a cold-flow model.
The two cold-flow models were built and operated according to the simplified scaling
laws for fluid dynamics proposed by Glicksman et al (Glicksman et al. 1993). The
following dimensionless numbers are kept constant during scaling:
,,,,0
0
2
0
u
G
u
u
Lg
u
s
s
mff
s
⋅⋅ ρρ
ρBed Geometry, φ, Particle size distribution (14)
where u0 is the superficial gas velocity, umf is the minimum gas velocity, g is the
acceleration due to gravity, L is the characteristic length in the system, Gs is the solids
circulation rate, φ the particle coefficient, and ρs and ρf is the density of the solids and
the fluid respectively. Design calculations concerning fluidization were made
according to Kunii and Levenspiel (1991).
3.1 Chosen designs and experimental set-ups
3.1.1 The CFB-like model (Papers I-II)
The design of the cold-flow model used in papers 1-2 is shown in Figure 7. The
reactor configuration is similar to a circulating fluidized bed (CFB), but with the
addition of a bubbling fluidized bed on the solids return side. This design is chosen
since it is simple and there is long experience on CFBs for combustion of solid fuels.
The bubbling bed (3), which is situated below the downcomer from the cyclone, acts
as the fuel reactor where oxygen is transferred from the particles to the gaseous fuel.
An overflow leads the reduced oxygen-carriers to the riser (1) that acts as the air
reactor where the previously reduced metal oxide is regenerated. Two particle seals
prevent gas mixing between the two reactors: one pot-seal in position (5) and one at
the bottom of the downcomer from the cyclone. This means that the fuel reactor also
has the function of a particle seal. The actual model was constructed in Perspex and is
shown in Figure 8.

23
5
3 1
2
4
Table 2 summarizes the scaling of a 30 MWth CLC pressurized system to the ambient
system. The basis for the scaling of the model is the air reactor, where the model has
an inner diameter of 0.19 m and a height of 1.9 m, using air as fluid. The dimensions
of the fuel reactor are also scaled, 0.19 m ID and 0.5 m in height, but since the fluid in
the real combustor is a gaseous fuel, the density ratio in Equation (14) is not possible
to fulfil with air. A hydrocarbon fuel would also react to form CO2 and water, causing
a dramatic increase in the volume flow as the gas passes the bed. This can obviously
not be simulated in a cold model. For the circulation of particles the conditions in the
air reactor are of most importance. The cyclone is not scaled, but was designed for
optimal separation, and is therefore larger than the scaled size. The cold model is
equipped with 24 pressure transducers. Most transducers measure differential pressure
between two pressure taps, whereas a few measure the pressure difference from one
tap to the atmospheric pressure. The taps are inclined at an angle of 45° to prevent
blocking and they are connected to a three-way valve to facilitate purging.
Figure 7. Layout of the model.
1) air reactor, 2) cyclone, 3) fuel
reactor, 4) downcomer
5) particle pot-seal
Figure 8. Picture of the
experimental set-up
24
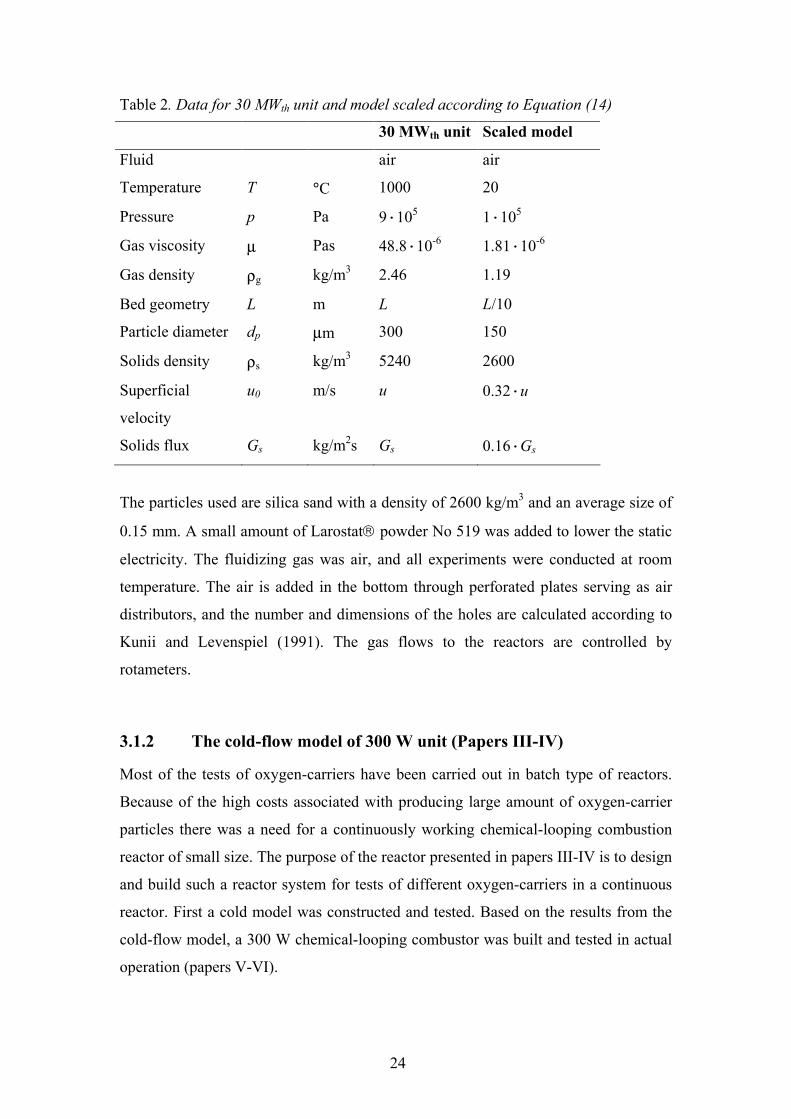
Table 2. Data for 30 MWth unit and model scaled according to Equation (14)
30 MWth unit Scaled model
Fluid air air
Temperature T °C 1000 20
Pressure p Pa 9·105
1·105
Gas viscosity µ Pas 48.8·10-6
1.81·10-6
Gas density ρg kg/m3 2.46 1.19
Bed geometry L m L L/10
Particle diameter dp µm 300 150
Solids density ρs kg/m3 5240 2600
Superficial
velocity
u0 m/s u 0.32·u
Solids flux Gs kg/m2s Gs 0.16·Gs
The particles used are silica sand with a density of 2600 kg/m3 and an average size of
0.15 mm. A small amount of Larostat powder No 519 was added to lower the static
electricity. The fluidizing gas was air, and all experiments were conducted at room
temperature. The air is added in the bottom through perforated plates serving as air
distributors, and the number and dimensions of the holes are calculated according to
Kunii and Levenspiel (1991). The gas flows to the reactors are controlled by
rotameters.
3.1.2 The cold-flow model of 300 W unit (Papers III-IV)
Most of the tests of oxygen-carriers have been carried out in batch type of reactors.
Because of the high costs associated with producing large amount of oxygen-carrier
particles there was a need for a continuously working chemical-looping combustion
reactor of small size. The purpose of the reactor presented in papers III-IV is to design
and build such a reactor system for tests of different oxygen-carriers in a continuous
reactor. First a cold model was constructed and tested. Based on the results from the
cold-flow model, a 300 W chemical-looping combustor was built and tested in actual
operation (papers V-VI).

25
12
3
4
Figure 9. A two-compartment
fluidized bed. 1) air reactor, 2)
downcomer, 3) fuel reactor, 4) slot
The design of the two-compartment fluidized bed proposed by Chong (Chong et al.
1986) for oil shale retort is used in papers III-VI, see Figure 9. The air reactor, (1), has
a higher velocity causing particles to be thrown upwards, and some of them fall into a
downcomer, (2), leading to the fuel reactor, (3). There is a slot, (4), in the bottom of
the wall between the two reactors, and the particles move through this slot from the
fuel reactor to the air reactor.
The chemical-looping combustor was designed for a power range of 100 to 300 W
depending on the fuel and the particle size and density of the oxygen-carrier. As basis
for the design of the unit, was chosen particles with a density of 2300 kg/m3 and a
mean diameter of 95 µm. To simulate this, a suitable particle for the cold-flow model
is powder used for fluid catalytic cracking (FCC), with a particle density of 1500
kg/m3 and a mean particle diameter of 70 µm. The idealized relationships between the
hot unit and the cold-flow model are shown in Table 3.
The dimensions of the system are very small and for this reason surface effects may
not be negligible. The scaling rules are based on similarity in hydrodynamics and
interparticle effects, whereas effects between particles and wall are neglected. This
should be kept in mind when the results are transferred between the cold-flow model
and the hot unit, but might not be crucial. The difference in size between the cold-
flow model and the hot laboratory unit is quite small, although the hot unit is

26
somewhat bigger than the cold-flow model. Therefore the wall effects might be lesser
in the hot unit, and the particle recirculation somewhat higher.
The pressure was measured along the height of the reactors. The gas flows were
controlled by mass-flow controllers. A gas bubble meter was utilized to calibrate the
mass-flow meters.
Table 3. Idealized relationship between the hot laboratory unit and the cold-flow
model.
Parameter Dimension Chemical-looping
combustor
cold-flow
model
Gas, air reactor - air N2/He (13/87)
Gas, fuel reactor - CO/H2 (50/50) N2/He (13/87)
Temperature T 950°C 25°C
Particles oxygen-carrier FCC
Mean diameter µm 95 70
Density of particles kg/m3 2300 1500
Length m L 0.75*L
Area m2 A 0.56*A
Superficial velocity m/s u 0.86*u
Volume flow m3/s U 0.48*U
Circulation rate kg/s Mcirc 0.74*Mcirc
The cold-flow model, Figure 10, has some fixed dimensions and some which could be
slightly varied. The cross-section of the fuel reactor is constant with both a depth and
width of 19 mm. The air reactor had a larger cross-sectional area in the bottom, see
Figure 9, where the dimensions were 19×27 mm. In the top section next to the
downcomer, the area was smaller with a width of either 15 of 17 mm. Further, the
height from the bottom plate to the slot is 4 mm, the height from the bottom plate to
the downcomer exit 38 mm, and the total height of the downcomer, including the
sloped part, is 85 mm. The height of the slot between the reactors was varied between
1.2 and 8 mm. The profile of the wall beneath the slot was altered from the shape of

27
an I to a T by adding a horizontal plate beneath the slot. The width of the downcomer
was also altered between 9 and 11 mm. The different designs are presented in Table 4.
a) frontview b) sideview
Figure 10. The cold-flow model.
Table 4. Design variations and main dimensions
design FR
dimension
AR dimension
(bottom)
Downcomer
width
Slot height Slot profile
[mm] [mm] [mm] [mm] [mm]
A 19 × 19 19 × 27 9 8 I
B 19 × 19 19 × 27 9 4.5 I
C 19 × 19 19 × 27 11 1.5 I
D 19 × 19 19 × 27 11 1.2 T
3.1.3 The 300 W unit (Papers V-VI)
With the experience gained in the work with the cold-flow model presented in papers
III and IV, a 300 W chemical-looping combustor was constructed and is presented in
papers V-VI. The design is the same as the cold-flow model in papers III and IV, but
with some minor changes. A possibility to fluidize the downcomer is added, and the
slot is somewhat altered with fluidization possibilities, see Figure 11.

28
a) the lower part, frontview b) entire reactor,
frontview
c) entire reactor, sideview
Figure 11. The principal sketch of the reactor. 1) air reactor, 2) downcomer, 3) fuel
reactor, 4) slot, 5) gas distributor plate, 6) wind box, 7) reactor part, 8) particle
separator, 9) leaning wall. Fluidization in the downcomer (x) and slot (o) is also
indicated. The dashed lines in 2a indicate typically expected bed heights during
combustion.
The reactor is designed to work with a thermal power in the range 100 to 300 W for
either natural gas or syngas as fuel. Depending on size and density of the oxygen-
carrier particles, the thermal power might have other limits.
The experimental set-up is shown in Figure 11 and Figure 12. The air reactor, (1), has
a velocity high enough for particles to be thrown upwards, with a certain fraction of
them falling into a downcomer, (2), leading to the fuel reactor, (3). There is a particle
column in the downcomer preventing gas to leak between the reactors. Particles that
fall into the downcomer increase the column height and create a pressure, forcing
particles into the fuel reactor. Thereby, the bed height and pressure are also increased
in the fuel reactor. The higher pressure in the fuel reactor forces the particles through
the opening (4), situated in the bottom of the wall between the reactors, back into the
air reactor.
8
8
7
8
7 7
9 91
2
3
4
56 6
x

29
Figure 12. The hot chemical-looping
combustor
Fuel and air enter in two separate wind boxes, and two porous quartz plates act as
distributors for the gases entering the reactors. The fuel reactor has a depth and a
width of 25 mm. The dimensions of the air reactor are 25×40 mm in the bottom, and
25×25 mm in the upper narrow part. The reactor part is 200 mm high, and above this
part a section for separation of particles is situated. In this section the reactors widen
to decrease the gas velocities and allow particles to fall back into the reactors, Figure
11c. The particle separation section is totally 240 mm high, in the first 180 mm the
reactor depth expands from 25 mm to 105 mm. The last 60 mm has a constant cross-
section area, and just before the exits of the reactors a leaning plate is added to reduce
elutriation of particles. The particles falling down in the sloping section above the air
reactor are led to the downcomer by a leaning wall, Figure 11b-c. The downcomer has
a width of 12 mm and the upper part of the wall separating it from the air reactor ends
at 170 mm height. The upper part of the downcomer opening to the fuel reactor is at a
height of 75 mm and this opening is 25 mm high. It is possible to add a gas in the side
of the downcomer, and in that way fluidize the particle column. Tests in the cold-flow
model show that this improves particle circulation. The slot in Figure 11 through
which the particles from the fuel reactor are circulated to the air reactor was designed
to minimize gas leakage between the reactors. It has two 15-mm walls rising from the

30
bottom plate, separated by 10 mm. The single wall separating the fuel and air reactor
is situated between these two walls and stops 11 mm above the bottom plate, Figure
11a. Between the two walls is a pipe, and this pipe has three 1-mm holes directed
downwards through which fluidizing gas, e.g. argon, is injected.
The two gas flows leaving the reactors are each connected to a gas sampling system
containing particle filter, cooling system for condensation of water and on-line gas
analysers (SICK MAIHAK S710). The following gases are possible to measure with
the analysers: carbon monoxide, carbon dioxide, oxygen and methane. Measurements
of H2, CO and CO2 in the gas stream from the fuel reactor were also made with a gas
chromatograph (Varian Micro-GC CP4900 equipped with a Molesieve 5A and
PoraPLOT Q column). On the exit pipe from the fuel reactor, there is a water trap.
The height of the water column can be varied and thus the water trap can be used to
control the pressure balance between the reactors.
3.2 Experimental procedure
3.2.1 Circulation flow of particles in a CFB-like model (Paper I)
The model shown in Figure 7 and Figure 8 was operated with different solids
inventories in the range from 5 to 10 kg. The superficial gas velocity in the air reactor
(riser) was varied from 0.7 to 1.2 m/s, while the velocity in the fuel reactor was held
constant at 0.12 m/s in all runs. The latter corresponds to a flow that is somewhat
lower than the product gas flow of CO2 and H2O.
The net solids flux, Gs, was measured by closing a butterfly valve situated in the
downcomer after the cyclone. Pressure drop in the reactors was measured to obtain
the solids hold-up and the vertical distribution of solids in the riser.
3.2.2 Gas leakage between two reactors in a CFB-like model (Paper II)
The model was operated with 9 kg of sand. The velocity in the air reactor was varied
between 0.75 and 1.15 m/s, the velocity in the fuel reactor from 0.09 to 0.31 m/s, and
the velocity in the particle lock between 0.065 and 0.097 m/s. Helium was added to

31
the inlet air in one of the following: fuel reactor, air reactor or particle pot-seal. The
concentration of helium was measured with a mass spectrometer either in the
outgoing gas flows from the cyclone, the fuel reactor, or in the outlet from the particle
pot-seal into the air reactor. The leakage is defined as the fraction of gas added to one
reactor, which escapes out of the other reactor.
3.2.3 Circulation flow and gas leakage in a cold-flow model of a 300 W
unit (Papers III-IV)
The cold-flow model was operated with FCC particles, and the total solids inventory
was varied between 40 and 70 g. The gas volume flow in the air reactor varied from 5
to 7 L/min. This gives a velocity in the narrow part of the riser of 0.26 to 0.36 m/s for
deigns A and B, and a velocity of 0.29 to 0.41 m/s for designs C and D. The reason
for the different gas velocities is due to the change in downcomer width, causing a
change in the riser cross-sectional area. The different designs are presented in Table 4.
The gas flow in the fuel reactor was varied between 1.1 and 3 l/min giving the
velocities of 0.05 to 0.14 m/s. In addition to variations of the slot design and gas
velocities the additional fluidisation of the downcomer was tested.
A very simple tracer method was used to determine the solids circulation rate. As the
bed material was white, a very fine black powder (ground coal dust) was introduced
in the downcomer at the top surface of the particle column. The time for the tracer
“point” to move a certain distance was measured, giving the velocity of the particle
column. For confirmation of the results, a second measurement method was used. A
small ball was introduced in the downcomer, and was taken along by the moving solid
column. The movement of a thin thread connected to the ball indicated the velocity of
the moving solids column and therefore also the mass flow.
For gas leakage measurements the nitrogen in the standard fluidization gas in one of
the reactors was substituted with air, which results in an oxygen concentration of
2.73%vol. The oxygen concentration out from both reactors was measured. Also the
outlet volume flows and concentration of the inlet air/helium gas were measured to
verify the quality of the results.

32
3.2.4 Leakage and combustion measurements in a 300 W unit (Paper V)
Leakage tests as well as combustion tests with natural gas, consisting of 88% methane
and with an H/C ratio of 3.7, were performed in the reactor shown in Figure 12. The
leakage tests were made to assess the performance of the reactor system and to
support the evaluation of data from the combustion tests.
The oxygen-carrier used has nickel oxide as active part, and magnesium aluminates as
support material, NiO/MgAl2O3. The mass fraction of active/support material in the
particle is 60/40%. The total solids inventory used was 340 g.
The first leakage test series was made with carbon dioxide as fluidization gas in the
fuel reactor, air in the air reactor and argon in the downcomer and the slot. The
volume percentage of carbon dioxide and oxygen was measured in both outgoing gas
streams. In all leakage tests the temperature in the fuel reactor was 850°C. Table 5
shows the volume flows in the different tests.
The second series of leakage measurements was made with carbon dioxide instead of
argon in the downcomer and slot, nitrogen in the fuel reactor and air in the air reactor.
The same tests were made as for the first leakage series.
Table 5. First and second leakage test series.
Test number UFR UAR UDC USL TFR
Ln/min Ln/min Ln/min Ln/min °C
L1 0.15-0.9 6 0.01 0.02 850
L2 0.35 4-6.5 0.01 0.02 850
L3 0.15-0.55 1.7-6.3 0.01 0.02 850
L4 0.35 4 0-0.04 0.02 850
L5 0.35 4 0.01 0.01-0.04 850
Ln is the flow normalised to 0˚C and 1 bar.
Combustion measurements with natural gas as fuel in the fuel reactor were also made.
The fuel flow, the air flow and the temperature in the reactors were varied one at a
time, see Table 6.
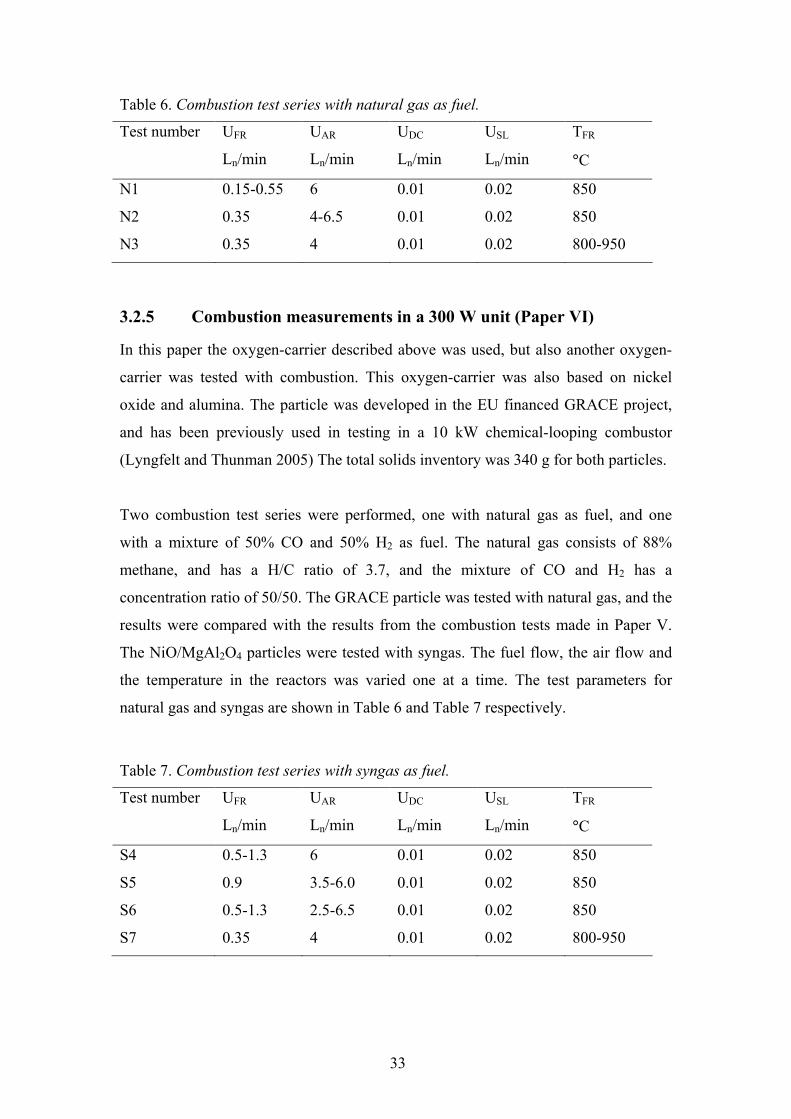
33
Table 6. Combustion test series with natural gas as fuel.
Test number UFR UAR UDC USL TFR
Ln/min Ln/min Ln/min Ln/min °C
N1 0.15-0.55 6 0.01 0.02 850
N2 0.35 4-6.5 0.01 0.02 850
N3 0.35 4 0.01 0.02 800-950
3.2.5 Combustion measurements in a 300 W unit (Paper VI)
In this paper the oxygen-carrier described above was used, but also another oxygen-
carrier was tested with combustion. This oxygen-carrier was also based on nickel
oxide and alumina. The particle was developed in the EU financed GRACE project,
and has been previously used in testing in a 10 kW chemical-looping combustor
(Lyngfelt and Thunman 2005) The total solids inventory was 340 g for both particles.
Two combustion test series were performed, one with natural gas as fuel, and one
with a mixture of 50% CO and 50% H2 as fuel. The natural gas consists of 88%
methane, and has a H/C ratio of 3.7, and the mixture of CO and H2 has a
concentration ratio of 50/50. The GRACE particle was tested with natural gas, and the
results were compared with the results from the combustion tests made in Paper V.
The NiO/MgAl2O4 particles were tested with syngas. The fuel flow, the air flow and
the temperature in the reactors was varied one at a time. The test parameters for
natural gas and syngas are shown in Table 6 and Table 7 respectively.
Table 7. Combustion test series with syngas as fuel.
Test number UFR UAR UDC USL TFR
Ln/min Ln/min Ln/min Ln/min °C
S4 0.5-1.3 6 0.01 0.02 850
S5 0.9 3.5-6.0 0.01 0.02 850
S6 0.5-1.3 2.5-6.5 0.01 0.02 850
S7 0.35 4 0.01 0.02 800-950

34
Measurements of concentrations of CO, CO2, CH4 and O2 in the streams leaving both
reactors were made using on-line gas analysers (SICK MAIHAK S710). When syngas
was used as fuel, measurements of H2, CO and CO2 in the gas stream from the fuel
reactor were also made with a gas chromatograph (Varian Micro-GC CP4900
equipped with a Molesieve 5A and PoraPLOT Q column).
35
Chapter 4
4 RESULTS AND DISCUSSION
Experimental studies of reactor systems for chemical-looping combustion have been
performed. One purpose of this work was to evaluate the suitability of different
designs as possible choices as full-scale plants and laboratory reactors. An additional
goal was to demonstrate this new combustion technology in a small scale and test the
performance of oxygen-carrier particles in real operation. This thesis presents data
from two types of cold-flow units and one 300 W chemical-looping combustor.
The first, a CFB-like design, was proposed as a design possibility for a 30 MW
pressurized chemical-looping combustor. It was built as a cold-flow model in
Perspex, and circulation of particles (Paper I) and leakage of gas between the reactors
(Paper II) were measured.
The second type of reactor system was designed primarily for testing smaller amounts
of oxygen-carriers in real operation. A simpler design than the CFB-like reactor tested
above was preferred, and a two-chamber fluidized bed was chosen. In order to
evaluate its suitability as a chemical-looping combustor, this simpler design was first
built as a cold-flow model, and tested with respect to particle circulation and gas
leakage (Papers III and IV). Thereafter a hot unit was built and operated with two
different nickel-based oxygen-carriers (Papers V and VI). Leakage and combustion
tests with natural gas and syngas were investigated.
Below, some major quantitative results are given. The full results can be found in the
enclosed papers.

36
4.1 The CFB-like model (Papers I-II)
4.1.1 Solids circulation
The rate of circulation of solid material from the air to the fuel reactor, i.e. the net
solids flux, Gs, is dependent on both the fluidization velocity and the total mass of bed
material in the system, Figure 13. Figure 14 shows the net solids flux as a function of
the superficial velocity for different total pressure drops over the air reactor. As can
be seen in Figure 14 it is clear that Gs is rather independent of the pressure drop of the
riser in the range 0.6 to 1.2 kPa. This indicates that the circulation of particles is
almost independent of the bed mass when there is enough bed material in the system
to give a pressure drop of at least 0.6 kPa in the riser. In this system, the fuel reactor
and the pot-seal will first be filled to their overflows, the rest of the particles will be in
the air reactor and circulation system. Figure 13 indicates that 5 and 6 kg is not
enough for this system since the air reactor will be emptied, and thus the solid flux
will be lost.
0.7 0.8 0.9 1 1.1 1.2
u [m/s]
0
2
4
6
8
Gs [
kg
/m2s]
mtot = 5 kg
mtot = 6 kg
mtot = 7 kg
mtot = 8 kg
mtot = 9 kg
mtot = 10 kg
0.7 0.8 0.9 1 1.1 1.2
u [m/s]
0
2
4
6
8
Gs [
kg
/m2,s
]
∆p = 0.6 kPa
∆p = 0.7 kPa
∆p = 0.8 kPa
∆p = 0.9 kPa
∆p = 1 kPa
∆p = 1.1 kPa
∆p = 1.2 kPa
Figure 13. Average values of Gs versus
superficial velocity in the air reactor.
Figure 14. Gs versus velocity for different
pressure drops
The highest measured net solids flux in the cold model corresponds to a scaled up
solids flux of 48 kg/m2s, or 4.6 kg/s,MWth. The limit of the solids flux was caused by
the return system, i.e. the particle flow coming out of the downcomers. Concerning
oxygen transport, the mass flow measured is most likely sufficient for metal oxides

37
like nickel oxide, copper oxide and manganese oxide, but there is an uncertainty
whether a flow of 4.6 kg/s,MWth would be sufficient for iron oxide, Fe2O3. If a solids
circulation of 4 kg/s,MWth is to be enough the change in mass conversion, ∆ω, over a
cycle has to be 0.02. This corresponds to a complete conversion of Fe2O3 to Fe3O4 if
there is 40% inert material in the particle, (Mattisson et al. 2004). Because of
thermodynamic restraints it is not possible to use lower forms of iron oxide, i.e. FeO,
(Mattisson and Lyngfelt 2001). Thus, iron oxide might require a somewhat higher
fluidization velocity compared to those used in the present study to reach a sufficient
recirculation.
4.1.2 Gas leakage
Under normal operating conditions the gas leakage between the fuel and air reactor is
small. The pressure balance for the system is important for the gas leakage. The
pressure difference between the fuel reactor and the rest of the system should be as
small as possible. If the fuel reactor pressure deviated much from the rest of the
system large leakages occurred. The pressure in the fuel reactor should be higher than
in the cyclone, but lower than in the air reactor and the particle pot-seal.
The gas leakage from the fuel reactor to the air reactor depends on the velocity in the
fuel reactor, see Figure 15. At normal operating conditions, the leakage is about 2%,
which means that 2% of the carbon dioxide will not be captured. This gas leakage is
reduced as the net solids flux is increased. At high net solids flux as the particles in
the downcomer will not be fluidized but instead the particles will entrain gas from the
cyclone down into the fuel reactor.
The leakage from the particle pot-seal to the fuel reactor depends on the velocity in
the pot-seal, see Figure 16. The total range of leakage from the pot-seal to the fuel
reactor was 2-12%, which, if fluidized by air, would cause a dilution of the produced
CO2 by 2.4 to 15% air. This leakage is probably high enough to motivate
countermeasures, for instance fluidization with steam instead of air below the
downcomer.

38
0 0.1 0.2 0.3 0.4
uFR [m/s]
0
1
2
3
Le
aka
ge
fro
m F
R to
AR
[%
]
0 0.02 0.04 0.06 0.08 0.1
uPPS [m/s]
0
2
4
6
8
Lea
kag
e fro
m P
PS
to F
R [
%]
Figure 15. Leakage from the fuel reactor
to the cyclone, against the velocity in the
fuel reactor, uFR
Figure 16. Leakage from the particle pot-
seal (pps) to the fuel reactor, against the
velocity in the particle pot-seal, uPPS
Helium was added in the air reactor, and the concentration out from the fuel reactor
measured. This was made to investigate whether the carbon dioxide would be diluted
by nitrogen or not. No leakage in this direction could be detected.
4.2 The cold-flow model of a 300 W unit (Papers III-IV)
4.2.1 Solids circulation
Figure 17 shows the solids circulation rate against the velocity in the air reactor, for
the four different designs, see Table 4. By velocity in air reactor is meant the velocity
in the upper, narrow part, along the downcomer. Since two of the designs, C and D,
have a more narrow section, they will have higher velocities for the three volume
flows used. The velocity in the fuel reactor is held constant at 0.05 m/s, which
corresponds to 100 W in the hot laboratory unit. The trend is that the lower the slot
height, the lower is the particle flow between the reactors. However, the design with
the largest slot, A, did not have the highest recirculation.
The needed solids circulation is expected to fall within the range 2-8 g/s,kW
depending on the metal oxide used, the inert fraction and the conversion in each cycle.
Typically CuO and NiO needs lower solids circulation, and Fe2O3 the highest. For a
particle with a needed solids circulation of 2 g/s,kW in the hot unit, this would
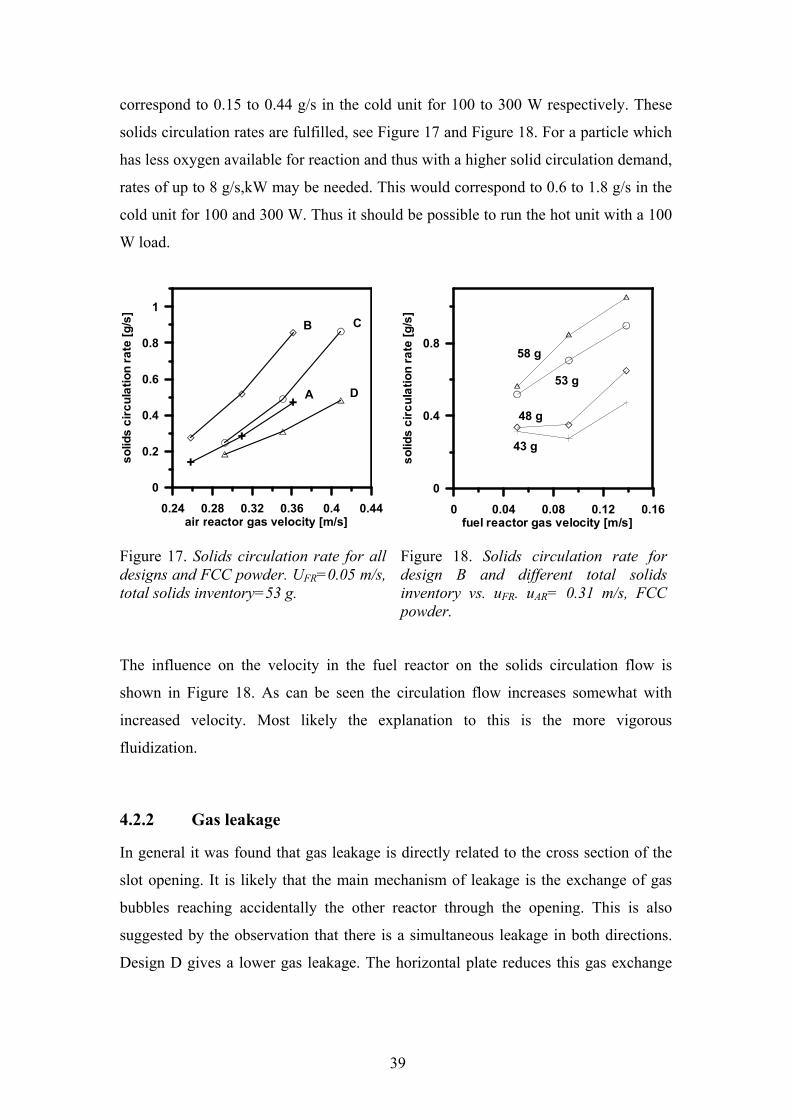
39
correspond to 0.15 to 0.44 g/s in the cold unit for 100 to 300 W respectively. These
solids circulation rates are fulfilled, see Figure 17 and Figure 18. For a particle which
has less oxygen available for reaction and thus with a higher solid circulation demand,
rates of up to 8 g/s,kW may be needed. This would correspond to 0.6 to 1.8 g/s in the
cold unit for 100 and 300 W. Thus it should be possible to run the hot unit with a 100
W load.
0.24 0.28 0.32 0.36 0.4 0.44air reactor gas velocity [m/s]
0
0.2
0.4
0.6
0.8
1
solids circulation rate [g/s]
A
B C
D
0 0.04 0.08 0.12 0.16fuel reactor gas velocity [m/s]
0
0.4
0.8
solids circulation rate [g/s]
43 g
48 g
53 g
58 g
Figure 17. Solids circulation rate for all
designs and FCC powder. UFR=0.05 m/s,
total solids inventory=53 g.
Figure 18. Solids circulation rate for
design B and different total solids
inventory vs. uFR. uAR= 0.31 m/s, FCC
powder.
The influence on the velocity in the fuel reactor on the solids circulation flow is
shown in Figure 18. As can be seen the circulation flow increases somewhat with
increased velocity. Most likely the explanation to this is the more vigorous
fluidization.
4.2.2 Gas leakage
In general it was found that gas leakage is directly related to the cross section of the
slot opening. It is likely that the main mechanism of leakage is the exchange of gas
bubbles reaching accidentally the other reactor through the opening. This is also
suggested by the observation that there is a simultaneous leakage in both directions.
Design D gives a lower gas leakage. The horizontal plate reduces this gas exchange
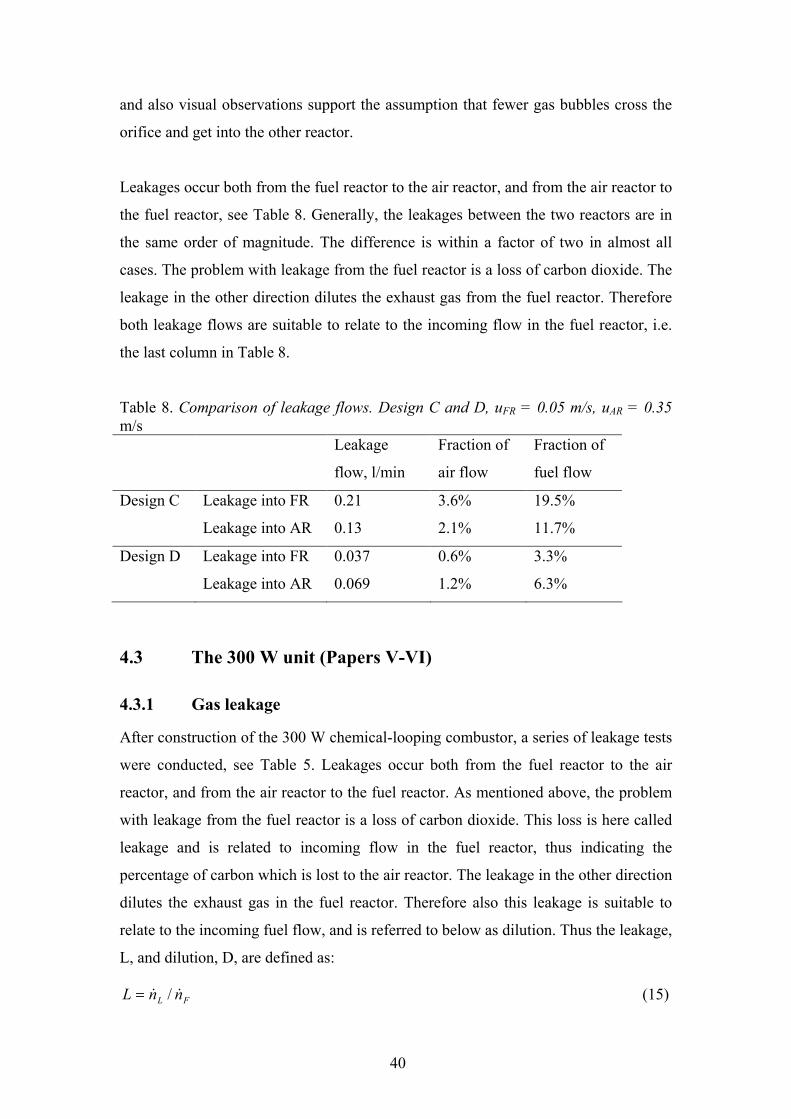
40
and also visual observations support the assumption that fewer gas bubbles cross the
orifice and get into the other reactor.
Leakages occur both from the fuel reactor to the air reactor, and from the air reactor to
the fuel reactor, see Table 8. Generally, the leakages between the two reactors are in
the same order of magnitude. The difference is within a factor of two in almost all
cases. The problem with leakage from the fuel reactor is a loss of carbon dioxide. The
leakage in the other direction dilutes the exhaust gas from the fuel reactor. Therefore
both leakage flows are suitable to relate to the incoming flow in the fuel reactor, i.e.
the last column in Table 8.
Table 8. Comparison of leakage flows. Design C and D, uFR = 0.05 m/s, uAR = 0.35
m/s
Leakage
flow, l/min
Fraction of
air flow
Fraction of
fuel flow
Design C Leakage into FR 0.21 3.6% 19.5%
Leakage into AR 0.13 2.1% 11.7%
Design D Leakage into FR 0.037 0.6% 3.3%
Leakage into AR 0.069 1.2% 6.3%
4.3 The 300 W unit (Papers V-VI)
4.3.1 Gas leakage
After construction of the 300 W chemical-looping combustor, a series of leakage tests
were conducted, see Table 5. Leakages occur both from the fuel reactor to the air
reactor, and from the air reactor to the fuel reactor. As mentioned above, the problem
with leakage from the fuel reactor is a loss of carbon dioxide. This loss is here called
leakage and is related to incoming flow in the fuel reactor, thus indicating the
percentage of carbon which is lost to the air reactor. The leakage in the other direction
dilutes the exhaust gas in the fuel reactor. Therefore also this leakage is suitable to
relate to the incoming fuel flow, and is referred to below as dilution. Thus the leakage,
L, and dilution, D, are defined as:
FL nnL && /= (15)

41
FD nnD && /= (16)
where Ln& is the molar flow of gas leaking from the fuel to the air reactor, Fn& is the
molar flow of gas entering the fuel reactor and Dn& is the molar flow of gas leaking
from the air to the fuel reactor.
The leakage and the dilution are shown in Figure 19 as a function of the flow rate to
the fuel reactor. Both the leakage and dilution are highly dependent on the fuel flow
and the leakage varies from 35 to 15% while the dilution varies from 25 to 10%. A
higher flow in the fuel reactor significantly decreases both the leakage and dilution.
However, the absolute leakage flows in both directions, Dn& and Ln& increase. The two
beds are connected via the slot. Pressure fluctuations and passing bubbles cause gas
exchange in both directions. A higher fuel flow leads to more vigorous fluidization,
which may result in higher flows from the fuel reactor to the air reactor. All the same,
the leakage and dilution, which are related to the fuel flow, Fn& , decrease as the fuel
flow increase. The leakage from the fuel reactor is roughly twice as large as the
dilution of the fuel reactor, which is also seen in the tests reported below. A reason for
the higher leakage to the air reactor compared to leakage in the opposite direction is
believed to be the higher pressure in the fuel reactor compared to the air reactor. The
downcomer is also preventing gas to leak from the air reactor to the fuel reactor, while
some gas from the fuel reactor may pass the column upwards.
The leakage and dilution measured in combustion test N1 are also shown in Figure
19. These measurements are more scattered, but gave a similar decreasing trend of the
leakage, and in the same range, as the leakage tests. The leakage in the combustion
tests is measured directly as the amount of carbon dioxide out from the air reactor, the
dilution from the same tests is measured indirectly as the total flow out from the fuel
reactor minus the flow of CO, CO2, CH4 and inert gas, and therefore the uncertainty is
higher. Leakage and dilution measured in combustion tests are not directly
comparable with the leakage and dilution tests without combustion, since there is a
gas flow reduction in the air reactor due to oxygen reacting with the oxygen-carrier
and a gas flow increase in the fuel reactor due to formation of CO2 and H2O from the
fuel. The reduction in the air reactor is not very high because of the excess of air, but
the reactions in the fuel reactor cause a significant flow increase.

42
0 0.2 0.4 0.6 0.8 1UFR (L/min)
0
10
20
30
40
50Leakage and dilution (%
vol)
Dilution of FR
Leakage from FR
Dilution, combustion
Leakage, combustion
0 2 4 6 8UAR (L/min)
0
5
10
15
20
25
Leakage and dilution (%vol)
Dilution
Leakage
Dilution,combustion
Leakage, combustion
Figure 19. The leakage and dilution as a
function of the volume flow in the fuel
reactor, UFR. Test L1 and leakage from
test N1.
Figure 20. The leakage and dilution as a
function of the volume flow in the air
reactor, UAR. Test L2 and leakage from
test N2.
The leakage from the fuel reactor increases as the velocity in the air reactor increases,
Figure 20. Several mechanisms could explain this. Firstly, a higher particle circulation
causes a higher pressure in the fuel reactor. Secondly, some gas is expected to follow
the particles, and therefore would a higher particle circulation cause higher leakage.
Thirdly, an increase of pressure fluctuations should promote the gas exchange through
the slot. The latter could also explain why the leakage into the fuel reactor, i.e. the
dilution, increases as the velocity in the air reactor increases. The leakage and the
dilution vary in the range 13-22% and 5-10%. This is lower than in the previous test
series shown in Figure 19, which was made at a high air flow. The leakage and
dilution measured in combustion test N2 are also shown in the figure. Again the
leakage and dilution were of the same order as in the leakage tests, and also the trends
were the same.
4.3.2 Combustion
The carbon monoxide in the gas from the fuel reactor is presented below as fraction of
total carbon leaving the fuel reactor, i.e. CO, CO2 and CH4.
42 CHCOCO
CO
COxxx
xf
++= (17)

43
where xi is the molar fraction of i in dry exit gas from the fuel reactor. Similarly, the
methane and hydrogen in the flue gas is given as fraction of total carbon.
42
4
4
CHCOCO
CH
CHxxx
xf
++= (18)
42
2
2
CHCOCO
H
Hxxx
xf
++= (19)
The actual concentrations of CO, CH4 and H2 are somewhat lower because of the
dilution by nitrogen from the air reactor and inert gas from the downcomer and slot.
The conversion of natural gas to carbon dioxide is high for both of the tested Ni based
particles for all the investigated conditions. For the GRACE particle the fraction of
CO is rather constant around 0.5%, i.e. very close to thermodynamic equilibrium at
850°C. For this carrier there was always some CH4 from the outlet of the fuel reactor,
typically 0.5-1.5%. Unconverted methane has been found in previous work with this
particle in tests with high circulation (Lyngfelt and Thunman 2005), and was
associated with high degree of oxidation of the particle which inhibits intermediate
reforming steps which occur on nickel surface. The other particle, NiO/MgAl2O4,
converts all the methane, but gives a higher amount of carbon monoxide than the
equilibrium, typically 0.5-3%. Thermodynamic calculations show that NiO can not
convert methane to CO2 and H2O completely, but at equilibrium conditions some CO
and H2 will be present. At 850°C the fraction of CO, fCO, is 0.71% at equilibrium and
the fraction of H2 of the total hydrogen, i.e. ( )OHwetHwetHwetH xxxf2222 ,,,
' / += is 0.64%
at equilibrium. The value of 2H
f , see eq (19), at equilibrium is dependent on the
hydrogen to carbon ratio of the fuel, which is 3.7 for natural gas. Thus, 2H
f at
equilibrium is 17.127.3'
2=⋅Hf .
For the experiments conducted with syngas and the NiO/MgAl2O4 oxygen-carrier, the
carbon monoxide is presented below as fCO, the fraction of carbon products leaving
the fuel reactor,
COCO
CO
COxx
xf
+=
2
(20)

44
and the hydrogen is presented in a similar way, i.e. as the fraction of total hydrogen
leaving the reactor, 2H
f . Since the fuel consists of 50% CO and 50% H2, the total
molar amount of H2 plus H2O leaving the reactor is equal to CO plus CO2.
COdryCOdry
Hdry
HwetOHwet
Hwet
Hxx
x
xx
xf
,,
,
,,
,
2
2
22
2
2 +=
+= (21)
The degree of unburnt increases as the fuel load increases, see Figure 21 and Figure
22. This is expected, firstly because a larger amount of fuel has to react with the same
amount of particles. Secondly, there is also a less efficient contact between the
particles and the gas at higher velocities when a larger fraction of the gas will be in
the bubble-phase.
0 0.2 0.4 0.6UFR [L/min]
0
1
2
3
fraction [% vol]
CO, C
CH4, C
CO, G
CH4, G
0 0.4 0.8 1.2 1.6UFR [L/min]
0
0.5
1
1.5
2
2.5
fraction [%vol]
CO
H2 (GC)
CO (GC)
Figure 21. Fraction of carbon monoxide
(dashed lines) and methane (continuous
lines) in the combustion products, as a
function of the flow in the fuel reactor. C
is the CCCC particle NiO/MgAl2O4, and
G is the GRACE particle. Results with
natural gas, test series N1.
Figure 22. Fraction of carbon monoxide
and hydrogen in the combustion products,
as a function of the flow in the fuel
reactor. Result with syngas, test series S1.
For natural gas, a slight decrease of the CO fraction for the NiO/MgAl2O4 particle can
be seen when the velocity in the air reactor increases, see Figure 23. For the GRACE
particle, the CO is approximately constant and CH4 increases somewhat. When
syngas is used as fuel, an increase of the gas flow in the air reactor decreases the

45
concentration of carbon monoxide and hydrogen in the flue gas from the fuel reactor,
Figure 24. An increased air flow means a higher concentration of oxygen in the air
reactor and also a higher circulation rate of the particles, which was shown in Papers
III and IV. The decrease is small though, and could also be an effect of increased
leakage.
0 2 4 6 8UAR [L/min]
0
0.5
1
1.5
2
2.5
fraction [%vol]
CO, C
CH4, C
CO, G
CH4, G
0 2 4 6 8
UAR [L/min]
0
0.4
0.8
1.2
fraction [%vol]
CO
H2 (GC)
CO (GC)
Figure 23. Fraction of carbon monoxide
(dashed lines) and methane (continuous
lines) in the combustion products, as a
function of the flow in the air reactor. C
is the CCCC particle NiO/MgAl2O4, and
G is the GRACE particle. Results with
natural gas, test series N2.
Figure 24. Concentration of carbon
monoxide and hydrogen in the
combustion products, as a function of the
flow in the air reactor. Results with
syngas, test series S2.
The gas conversion for both oxygen-carriers with natural gas is shown as a function of
temperature in Figure 25. The fractions of methane and carbon monoxide for the
GRACE particle were both about 0.5% in the temperature range tested. For the other
particle, NiO/MgAl2O4, methane was close to zero while CO was about 3% at 800°C,
but this fell to 1.5% at the higher temperatures tested. The equilibrium line for CO in
the flue gas is also shown in Figure 25. This shows that the GRACE particle gives a
fraction of CO that fits well with the equilibrium, while the NiO/MgAl2O4 particle
does not reach equilibrium for carbon monoxide. However, from the figure it seems
as if the fraction of CO approaches equilibrium at the higher temperatures. To be
noted is that the reactivity of the two particles is reversed for methane compared to
CO, i.e. the methane fraction is close to the equilibrium which is 0% for the
NiO/MgAl2O4 particle and significantly higher for the GRACE particle.

46
800 900 1000Temperature [C]
0
1
2
3
4fraction [%vol]
CO, C
CH4, C
CO, G
CH4, G
750 800 850 900 950 1000
T [oC]
0
0.4
0.8
1.2
1.6
fraction [%vol]
CO
H2 (GC)
CO (GC)
H2, eq
COeq
Figure 25. Fraction of carbon monoxide
and methane in the combustion products,
as a function of the temperature in the
fuel reactor. Results from test series N3.
C is the CCCC particle NiO/MgAl2O4,
and G is the GRACE particle. The dashed
line is the equilibrium line for CO.
Figure 26. Fraction of carbon monoxide
and hydrogen in the combustion products,
as a function of the temperature in the
fuel reactor. Results from test series S4.
The dashed lines are the equilibrium lines
for CO (short lines) and H2 (long lines).
With syngas the degree of conversion to CO2 is also improved at higher temperatures
for the CCCC particle, as is seen in Figure 26. From 900°C the CO and H2 reach and
follow the equilibrium lines, and thereby the conversion decreases. However, even at
a low temperature of 800°C the conversion of syngas to carbon dioxide and water is
high. The equilibrium lines for carbon monoxide and hydrogen are also presented in
the figure. At temperatures from 850°C the fraction of hydrogen reaches equilibrium.
Measured with the gas chromatograph (GC), carbon monoxide reaches equilibrium at
900 and 950°C, but the measurements with the gas analyser show a somewhat lower
fraction of carbon monoxide than equilibrium.
A possible explanation for fractions lower than equilibrium seen in Figure 26 and
especially in Figure 22 is that some of the oxygen leaking from the air to the fuel
reactor does not react on the way up through the bed, but reacts with carbon monoxide
and hydrogen above the bed, thus lowering the concentrations below the equilibrium
values. Normally, the leakage of oxygen is in the order of 1% of the total oxygen
supplied to the fuel in the fuel reactor and since most of this oxygen is likely to be
consumed in the lower part by reaction with particles or fuel, the leakage is expected

47
to have a minor effect on the outgoing concentrations. However, during conditions
with a low flow in the fuel reactor and a high flow in the air reactor, the leakage of
oxygen from the air reactor to the fuel reactor is larger, up to 6% of the total oxygen
supplied to the fuel in the fuel reactor. Thus, a possible explanation for these low
fractions is that some of the oxygen leaking from the air reactor does not react on the
way up through the bed, but reacts with carbon monoxide and hydrogen above the
bed, thus lowering the concentrations below the equilibrium values.
Table 9 gives a summary of gas fraction out of the fuel reactor, and combustion
efficiency compared to the theoretical maximum combustion efficiency. The results
presented are from tests N3 and S4 at 850°C. For syngas results are shown both for
online gas analyser (GA) and for gas chromatograph (GC). The combustion
efficiencies are all close to the theoretical maximum. The fraction of hydrogen for
natural gas and the NiO/MgAl2O4 particle was not measured but assumed based on
the water shift equilibrium. It is possible that this value is overestimated, causing a
lower combustion efficiency. The value of the combustion efficiency is probably
lower than the efficiency for the GRACE particle, but the amount is uncertain.
Table 9. Summary of gas fractions out from the fuel reactor, and combustion
efficiencies.
2H
f [%] COf [%] 4CHf [%]
ηcombustion [%] ηtheoretical
maximum [%]
Natural gas, G 1.171 0.71
1 0.38 98.98 99.42
Natural gas, C 3.032 1.48 0.08 98.40 99.42
Syngas, C (GC) 0.68 0.94 99.18 99.32
Syngas, C (GA) 0.641 0.71
1 99.32 99.32
G is the GRACE particle, C is the NiO/MgAl2O4 particle 1from NiO-equilibrium, since the measured value of CO was lower than equilibrium
and H2 was not analysed. 2not analysed, assumed value based on CO and assuming water shift equilibrium.
4.3.3 Oxygen-carrier
Totally, the NiO/MgAl2O4 particle was fluidized 150 hours in hot conditions, of
which 30 h were with combustion. No loss in reactivity was observed during the tests.

48
Before and after the test series the particles were weighed and there was a total loss in
the mass balance of 13 g, or 4%, of the solids inventory. This corresponds to a loss of
0.027% per h. No measurable amounts of particles were found in the filters, so it is
not clear how this mass was lost. Minor losses could be associated with the opening of
the reactor system, leakages through pressure taps, and another possibility is deposits
in the ducts leading to the filters. Reduction, i.e. reduced degree of oxidation, could be
another cause for mass reduction, although the particles in the reactor system were run
without fuel, i.e. oxidized before they were taken out. In total, the absence of fines in
the filters and the low mass loss suggest that the particle have a high durability. It
should be noted that the fluidization velocities are low, and not comparable with
velocities expected in a full-scale fluidized-bed chemical-looping combustor.
The GRACE particles were run in this reactor under hot conditions for 18 hours, of
which 8 h were with combustion. Before these tests, the same particles had been run
in a 10 kW unit with more than 100 hours of combustion, (Lyngfelt and Thunman
2005).
49
Chapter 5
5 CONCLUSIONS
Chemical-looping combustion has emerged as a promising technology for achieving
CO2 capture from combustion without large energy penalties. Thus, there has been a
large amount of research conducted in the last years, mainly focusing on oxygen-
carrier preparation and testing as well as system studies. However, there was also a
need for better understanding of reactor system design and especially a smaller unit
where particles can be tested in real operation was needed. This thesis has focused on
the study of reactor systems and includes experimental results from two cold-flow
models and one 300 W chemical-looping combustor. The first cold-flow model had a
CFB-like design, whereas the second cold-flow model and the 300 W chemical-
looping combustor had a two-chamber fluidized-bed system with a simplified system
for circulation.
A CFB like reactor system was built in Perspex and in this solids circulation rate and
gas leakage was investigated. The amount of bed material and gas velocity were
varied to find suitable operation conditions. The main results from this study were:
• The relation between solids circulation and fluidizing velocity was determined for
different solids inventories. The solids circulation rates studied were in a range
sufficient for metal oxides like copper oxide, nickel oxide and manganese oxide.
However, there was an uncertainty whether the flow is high enough for particles
with lower oxygen transfer capacity like iron oxide, Fe2O3. It was not possible to
achieve stable conditions during higher velocities because the inlet to the fuel
reactor from the downcomer was limiting the circulation flow of particles.

50
• The gas leakage from the fuel reactor to the cyclone varied in the range 1-3.5%,
with a typical value of 2%, which means that about 2% of the carbon dioxide will
be lost to the atmosphere. In order to avoid this leakage it is possible to use steam
for fluidizing, either in a separate pot-seal, or for the section right below the
downcomer.
• The gas leakage from the pot-seal to the fuel reactor in the CFB design was
significant. The produced carbon dioxide would be diluted with 2-15% air. This is
most likely too high to be acceptable and motivates countermeasures, for instance
fluidization with steam either below the downcomer or in the whole pot-seal.
It should be pointed out that gas leakage is not a major problem in this design of a
CLC system since it can be avoided by using steam. However, it is important to
estimate the leakage flows in order to assess the need for countermeasures.
Since there was a need to develop a small chemical-looping combustor for particle
testing, a smaller two-compartment fluidized bed was investigated. It was first built
and studied as a cold-flow model. After successful operation of the cold-flow model
the corresponding 300 W chemical-looping combustor was built with some minor
modifications compared to the cold-flow model design. From the tests in the cold-
flow model and the 300 W chemical-looping combustor the following conclusions
were made:
• Experiments with different flow model designs showed that it is possible to
achieve sufficient circulation of particles for the oxygen transfer in a model
running between 100 and 300 W. Since the laboratory system is to be placed in an
oven, the energy balance of the system does not need to be met.
• The gas leakage between the reactors was low enough for a laboratory reactor, and
in the hot design it was further reduced by changing the height and design of the
slot, where particles are transferred from the fuel reactor to the air reactor. The
possibility of fluidizing below the slot with inert gas was also introduced to reduce
the gas leakage.

51
• Operation in the 300 W unit was successfully demonstrated using two fuels,
natural gas and syngas consisting of 50% CO and 50% H2, and two nickel-based
oxygen-carriers.
• The design and operation of the 300 W chemical-looping combustor was
satisfactory. The leakage was low enough to enable evaluation of the results, and
the particle circulation was high enough to transport oxygen from the air to the
fuel.
• The first particle tested in the 300 W unit and with natural gas as fuel, a nickel
based particle, NiO/MgAl2O4, was found to be suitable as oxygen-carrier. It gave a
high conversion of the natural gas. No methane was detected in the gas from the
fuel reactor, and the fraction of CO varied between 0.5 and 3%. The combustion
efficiency at 850˚C was 98.4%.
• No significant amount of fines was found after fluidization for 150 hours in hot
conditions, of which 30 h were with combustion, which indicates that the
NiO/MgAl2O4 particles had a high durability. It must be noted though, that the
fluidization velocities are low, and not comparable with velocities expected in a
full-scale fluidized-bed chemical-looping combustor. Furthermore, no loss in
reactivity was observed during the tests.
• Syngas was also tested as fuel with the NiO/MgAl2O4 particle as oxygen-carrier.
The tests were successful with high conversion of the fuel, often exceeding 99%.
The fraction of CO leaving the reactor has a maximum value of 2%, and the H2 has
a maximum value of 1.8%. The concentrations of CO and H2 were strongly
correlated when different parameters were varied. The concentration of CO in the
measurements is 17-37% higher than the concentration of H2.
• With natural gas another NiO-based particle, called the GRACE particle, was also
tested for comparison. Also this particle had a high conversion of the natural gas to
carbon dioxide and water. However, there is an interesting difference between the

52
two particles when it comes to conversion of CH4 compared to CO. With the
NiO/MgAl2O4 particles there is no methane in the gas from the fuel reactor when
natural gas is used as fuel, while the GRACE particle does not have full conversion
of methane. On the other hand, the GRACE particle shows a higher conversion of
CO close to thermodynamics equilibrium, which is also higher than the conversion
attained for the NiO/MgAl2O4 particle. The total combustion efficiency for natural
gas at 850˚C is 99% for the GRACE particle, and 98.4% for the NiO/MgAl2O4
particle.
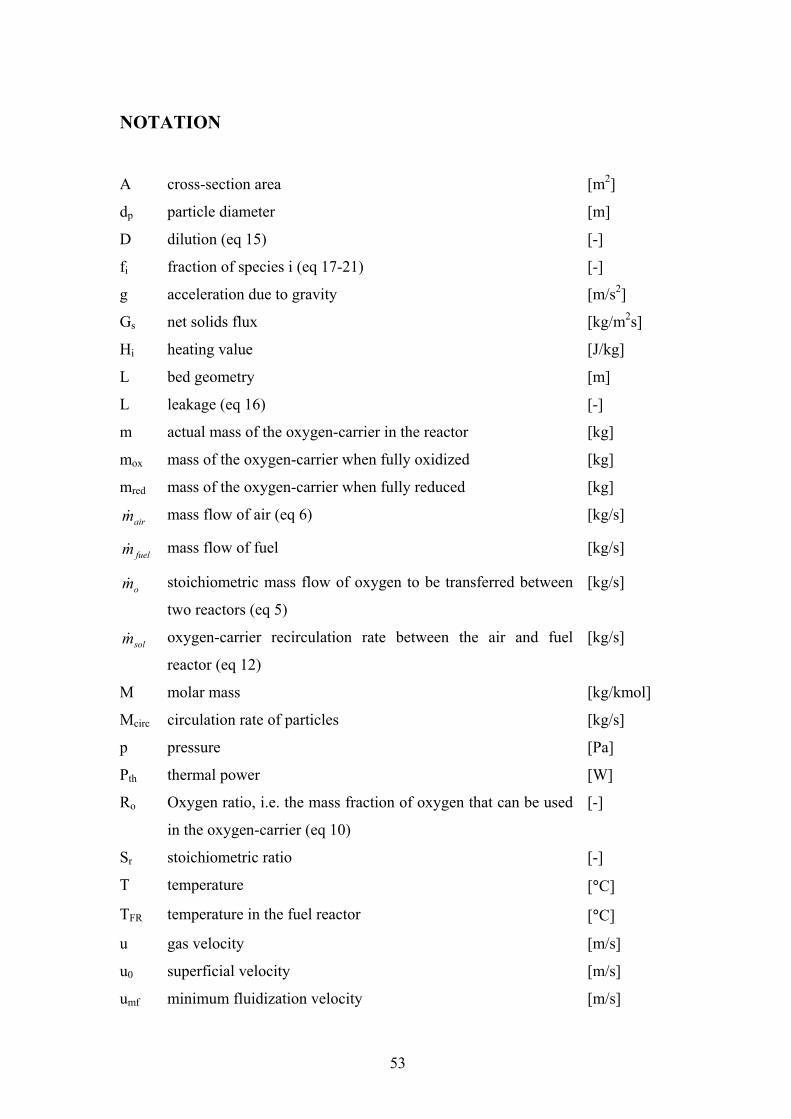
53
NOTATION
A cross-section area [m2]
dp particle diameter [m]
D dilution (eq 15) [-]
fi fraction of species i (eq 17-21) [-]
g acceleration due to gravity [m/s2]
Gs net solids flux [kg/m2s]
Hi heating value [J/kg]
L bed geometry [m]
L leakage (eq 16) [-]
m actual mass of the oxygen-carrier in the reactor [kg]
mox mass of the oxygen-carrier when fully oxidized [kg]
mred mass of the oxygen-carrier when fully reduced [kg]
airm& mass flow of air (eq 6) [kg/s]
fuelm& mass flow of fuel [kg/s]
om& stoichiometric mass flow of oxygen to be transferred between
two reactors (eq 5)
[kg/s]
solm& oxygen-carrier recirculation rate between the air and fuel
reactor (eq 12)
[kg/s]
M molar mass [kg/kmol]
Mcirc circulation rate of particles [kg/s]
p pressure [Pa]
Pth thermal power [W]
Ro Oxygen ratio, i.e. the mass fraction of oxygen that can be used
in the oxygen-carrier (eq 10)
[-]
Sr stoichiometric ratio [-]
T temperature [°C]
TFR temperature in the fuel reactor [°C]
u gas velocity [m/s]
u0 superficial velocity [m/s]
umf minimum fluidization velocity [m/s]

54
U volume flow [m3/s,
L/min]
UAR volume flow in the air reactor [L/min]
UDC volume flow in the downcomer [L/min]
UFR volume flow in the fuel reactor [L/min]
USL volume flow in the slot [L/min]
xi molar fraction of species i [-]
X conversion of oxygen-carrier, degree of oxidation [-]
Xox conversion of the oxygen-carrier in the air reactor [-]
Xred conversion of the oxygen-carrier in the fuel reactor [-]
∆X the difference in conversion [-]
φ particle coefficient [-]
λ air ratio [-]
ρ density [kg/m3]
ρf density of the fluid [kg/m3]
ρs density of the solids [kg/m3]
∆ω change of mass conversion of a cycle [-]
ω mass-conversion (eq 11) [-]

55
REFERENCES
Abellon, R. D., Z. I. Kolar, W. den Hollander, J. J. M. de Goeij, J. C. Schouten and C.
M. van den Bleek "A single radiotracer particle method for the determination
of solids circulation rate in interconnected fluidized beds." Powder
Technology (1997). 92: 53-60.
Adánez, J., L. F. de Diego, F. García-Labiano, P. Gayán, A. Abad and J. M. Palacios
"Selection of Oxygen Carriers for Chemical-Looping Combustion." Energy
and Fuels (2004). 18: 371-377.
Anheden, M., A.-S. Näsholm and G. Svedberg (1995). Chemical-Looping
Combustion -Efficient Conversion of Chemical Energy in Fuels into Work.
30th Intersociety Energy Conversion Engineering Conference, IECEC,
Orlando, USA. 75-81
Anheden, M. and G. Svedberg (1996). Chemical-Looping Combustion in
Combination with Integrated Coal Gasification. 31th Intersociety Energy
Conversion Engineering Conference, IECEC, Washington DC, USA, IEEE,
Piscataway, NJ, USA. 2045-2050
Avidan, A. A. (1997). Fluid Catalytic Cracking. Circulating Fluidized Beds. J. R.
Grace, A. A. Avidan and T. M. Knowlton, Chapman and Hall: 466-488.
Avidan, A. A. and R. Shinnar "Development of Catalytic Cracking Technology. A
Lesson in Chemical Reactor Design." Industrial and Engineering Chemistry
Research (1990). 29: 931-942.
Azar, C. and H. Rodhe "Targets for Stabilization of Atmospheric CO2." Science
(1997). 276: 1818-1819.
Bisio, G., L. Marletta and G. Rubatto (1998). Two-Step Fuel Oxidation to Improve
Efficiency in the Conversion of Chemical Exergy into Work. Intersoc. Energy
Conversion Eng. Conf.
Brandvoll, Ø. (2005) Chemical Looping Combustion - Fuel Conversion with Inherent
CO2 Capture PhD Thesis, Norwegian University of Science and Technology,
Trondheim
Cho, P. (2005) Development and Characterisation of Oxygen-Carrier Materials for
Chemical-Looping Combustion PhD Thesis, Chalmers University of
Technology, Göteborg
Cho, P., T. Mattisson and A. Lyngfelt "Comparison of Iron-, Nickel-, Copper and
Manganese-Based Oxygen Carriers for Chemical-Looping Combustion." Fuel
(2004). 83: 1215-1225.

56
Chong, Y. O., D. J. Nicklin and P. J. Tait "Solids Exchange Between Adjacent Fluid
Beds Without Gas Mixing." Powder Technology (1986). 47: 151-156.
Consonni, S. and F. Vigano "Decarbonized hydrogen and electricity from natural
gas." International Journal of Hydrogen Energy (2005). 30(7): 701.
Copeland, R. J., G. Alptekin, M. Cesario and Y. Gershanovich (2001). A Novel CO2
Separation System. First National Conference on Carbon Sequestration, U.S.
Department of Energy, National Energy Technology Laboratory, Pittsburgh,
PA, USA.
Davis, M. (1986). Climatic Change and the Survival of Forest Species. The Earth in
Transition - Patterns and Processes of Biotic Impoverishment. G. M.
Woodwell, Cambridge University Press: 99-110.
Fang, M., C. Yu, Z. Shi, Q. Wang, Z. Lou and K. Cen "Experimental research on
solid circulation in a twin fluidized bed system." Chemical Engineering
Journal (2003). 94: 171-178.
Fox, D., Y. Molodtsof and J. F. Large "Control Mechanisms of Fluidized Solids
Circulation Between Adjacent Vessels." AIChE Journal (1989). 35(12): 1933-
1941.
Glicksman, L. R., M. R. Hyre and K. Woloshun "Simplified scaling relationships for
fluidized beds." Powder Technology (1993). 77: 177-199.
Harvey, D. L. D. (2000). Global Warming - The Hard Science. Singapore, Pearson
Education Limited.
Harvey, S. P. (1994) Reversibility of Combustion Processes PhD Thesis, Dartmouth
College, Hanover
Hatanaka, T., S. Matsuda and H. Hatano (1997). A Mew-Concept Gas-Solid
Combustion System "MERIT" for High Combustion Efficiency and Low
Emission. Intersociety Energy Conversion Engineering Conference, Honolulu,
Hawaii. 944-948
He, Y., V. Rudolph, D. J. Nicklin and Y. O. Chong "Circulating Fluidized Oil Shale
Retort." Fuel (1993). 72(6): 879-883.
IPCC (1998). The Regional Impacts of Climate Change - An Assessment of
Vulnerability, Cambridge University Press.
IPCC (2001). Climate Change 2001 - The Scientific Basis, Cambridge University
Press.
Ishida, M. and H. Jin "A new Advanced Power-Generation System using Chemical-
Looping Combustion." Energy (1994). 19(4): 415-422.

57
Ishida, M., M. Yamamoto and T. Ohba "Experimental results of chemical-looping
combustion with NiO/NiAl2O4 particle circulation at 1200 °C." Energy
Conversion and Management (2002). 43: 1469-1478.
Ishida, M., D. Zheng and T. Akehata "Evaluation of a Chemical-Looping-
Combustion Power-Generation System by Graphic Exergy Analysis." Energy
(1987). 12(2): 147-154.
Jin, H., T. Okamoto and M. Ishida "Development of a Novel Chemical-Looping
Combustion: Synthesis of a Solid Looping Material of NiO/NiAl2O4."
Industrial and Engineering Chemistry Research (1999). 38: 126-132.
Johansson, M., T. Mattisson and A. Lyngfelt (2005). Comparison of Oxygen Carriers
for Chemical-Looping Combustion. International Symposium: Moving
towards zero-emission plants, Leptokarya Piera, Greece, CERTH/ISTFA.
Kehlenbeck, R., J. G. Yates, D. Cheesman, R. di Felice, H. Hofbauer and R. Rauch
"Experimentelle Untersuchungen in einer Zirkulierenden Wirbelschicht zum
Vergasen von Biomasse." Energie aus Biomasse (2001). 73: 1215-1218.
Kronberger, B., A. Lyngfelt, G. Löffler and H. Hofbauer "Design and Fluid Dynamic
Analysis of a Bench-Scale Combustion System with CO2 Separation -
Chemical-Looping Combustion." Industrial and Engineering Chemistry
Research (2005). 44: 546-556.
Kunii, D. and O. Levenspiel (1991). Fluidization Engineering. Stoneham, Reed
Publishing Inc.
Kuramoto, M., D. Kunii and T. Furusawa "Flow of Dense Fluidized articles through
an Opening in a Circulation System." Powder Technology (1986). 47: 141-
149.
Lyngfelt, A., B. Kronberger, J. Adanez, J. X. Morin and P. Hurst (2004). The Grace
Project. Development of Oxygen Carrier Particles for Chemical-Looping
Combustion. Design and Operation of a 10 kW Chemical-Looping Combustor.
7th International Conference on Greenhouse Gas Control Technologies,
Vancouver, Canada.
Lyngfelt, A., B. Leckner and T. Mattisson "A fluidized-bed combustor process with
inherent CO2 separation; application of chemical-looping combustion."
Chemical Engineering Science (2001). 56: 3101-3113.
Lyngfelt, A. and H. Thunman (2005). Construction and 100 h of Operational
Experience of a 10-kW Chemical Looping Combustor. Carbon Dioxide
Capture for Storage in Deep Geologic Formations - Results from the CO2
Capture Project. D. Thomas, Elsevier Science. 1 - Capture and Separation of
Carbon Dioxide From Combustion Sources: 625-646.
58
Mattisson, T., M. Johansson and A. Lyngfelt "Multi-Cycle Reduction and Oxidation
of Different Types of Iron Oxide Particles - Application to Chemical-Looping
Combustion." Energy and Fuels (2004). 18: 628-637.
Mattisson, T. and A. Lyngfelt (2001). Capture of CO2 Using Chemical-Looping
Combustion. First Biennial Meeting of Scandinavian-Nordic Section of the
Combustion Institute, Göteborg, Sweden. 163-168
Mattisson, T., A. Lyngfelt and P. Cho "The Use of Iron Oxide as an Oxygen Carrier
in Chemical-Looping Combustion of Methane with Inherent Separation of
CO2." Fuel (2001). 80: 1953-1962.
Morin, J. X. and C. Béal (2005). Chemical Looping Combustion of Refinery Fuel Gas
with CO2 Capture. Carbon Dioxide Capture for Storage in Deep Geologic
Formations - Results from the CO2 Capture Project. D. Thomas, Elsevier
Science. 1 - Capture and Separation of Carbon Dioxide From Combustion
Sources: 647-654.
Naqvi, R., O. Bolland, O. Brandvoll and K. Helle (2004). Chemical looping
combustion-analysis of natural gas fired power cycles with inherent CO2
capture, Vienna, Austria, American Society of Mechanical Engineers, New
York, NY 10016-5990, United States. 301
NE (2005). Nationalencyclopedin, www.ne.se.
Pfeifer, C., R. Rauch and H. Hofbauer "In-Bed Catalytid Tar Reduction in a Dual
Fluidized Bed Biomass Steam Gasifier." Industrial and Engineering
Chemistry Research (2004). 43: 1634-1640.
Richter, H. J. and K. F. Knoche "Reversibility of Combustion Processes." ACS
Symposium Series (1983). 235: 71-85.
Ryu, H. J., G.-T. Jin and C.-K. Yi (2004). Demonstration of Inherent CO2 Separation
and no NOx Emission in a 50 kW Chemical-Looping Combustor: Continuous
Reduction and Oxidation Experiment. 7th International Conference on
Greenhouse Gas Control Technologies, Vancouver, Canada. Poster
Snieders, F. F., A. C. Hoffmann, D. Cheesman, J. G. Yates, M. Stein and J. P. K.
Seville "The dynamics of large particles in a four-compartment
interconnected fluidized bed." Powder Technology (1999). 101: 229-239.
Snip, O. C., M. Woods, R. Korbee, J. C. Schouten and C. M. van den Bleek
"Regenerative removal of SO2 and NOx for a 150 MWe power plant in an
interconnected fluidized bed facility." Chemical Engineering Science (1996).
51(10): 2021-2029.
Song, K., Y. Seo, H. Yoon and S.-H. Cho "Characteristics of the NiO/Hexaaluminate
for Chemical-Looping Combustion." Korean Journal of Chemical
Engineering (2003). 20(3): 471-475.

59
Strömberg, L. (2001). Combustion in a CO2/O2 Mixture for a CO2 Emission Free
Process. Second Nordic Minisymposium on Carbon Dioxide Capture and
Storage, Gothenburg, Sweden. 58-63
Sundkvist, S.-G., T. Griffin and N. P. Thorshaug (2001). AZEP - Development of an
Integrated Air Separation Membrane - Gas Turbine. Second Nordic
Minisymposium on Carbon Dioxide Capture and Storage, Göteborg, Sweden.
52-57
Walther, G.-R., E. Post, P. Convey, A. Menzel, C. Parmesan, T. J. C. Beebee, J.-M.
Fromentin, O. Hoegh-Guldberg and F. Bairlein "Ecological Responses to
Recent Climate Change." Nature (2002). 416: 389-395.
Villa, R., C. Cristiani, G. Groppi, L. Lietti, P. Forsatti, U. Cornaro and S. Rossini "Ni
Based Mixed Oxide Materials for CH4 Oxidation under Redox Cycle
Conditions." Journal of Molecular Catalysis A: Chemical (2003). 204-205:
637-646.
Wolf, J. (2004) CO2 Mitigation in Advanced Power Cycles -Chemical Looping
Combustion and Steam-Based Gasification Doctoral Thesis, KTH - Royal
Institute of Technology, Stockholm
Yu, J., A. Corripio, D. Harrison and R. J. Copeland "Analysis of the Sorbent Energy
Transfer System (SETS) for Power Generation and CO2 Capture." Advanced
Environmental Research (2003). 7: 335-345.


