Fluid volume assessment in hemodialysis patients · · 2018-03-11investigating the literature...
93
Fluid volume assessment in hemodialysis patients by Sylvia Adel Rizk Kalainy A thesis submitted in partial fulfillment of the requirements for the degree of Master of Science Experimental Medicine Department of Medicine University of Alberta © Sylvia Adel Rizk Kalainy, 2015
Transcript of Fluid volume assessment in hemodialysis patients · · 2018-03-11investigating the literature...

Fluid volume assessment in hemodialysis patients
by
Sylvia Adel Rizk Kalainy
A thesis submitted in partial fulfillment of the requirements for the degree of
Master of Science
Experimental Medicine
Department of Medicine
University of Alberta
© Sylvia Adel Rizk Kalainy, 2015

ii
Abstract
Achievement of normal volume status is crucial in hemodialysis (HD), since both volume
overload and volume depletion have been associated with adverse outcome and events. The main
objectives of this thesis were to find out the prevalence of volume overload and to identify the
best clinical parameter or set of parameters that can predict volume overload in HD patients
along with the development of volume management protocol. Another objective was
investigating the literature about the use of sodium profiling in alleviating intradialytic side
effects. Volume status of 194 HD patients in 2 hemodialysis units was assessed by multi-
frequency bio-impedance spectroscopy. Of all patients 48% (n=94) were volume expanded.
ECFV depletion was present in 9% of patients (n=17). Interdialytic weight gain (IDWG) was
not different between hypovolemic, normovolemic and hypervolemic patients. Only 50% of the
volume overloaded patients were hypertensive (>140/90mmHg). Paradoxical hypertension was
common (31% of all patients) in our HD population, however, its incidence was not different
between patients. Intradialytic hypotension was relatively common and was more frequent
amongst hypovolemic patients. Blood pressure was neither sensitive nor specific for volume
assessment. Edema was highly specific for detection of volume overload but lacks sensitivity. In
sum, the study indicates that volume overload is highly prevalent in HD population and could not
be identified using clinical parameters alone. Only 4 clinical parameters (edema, SBP, lower
BMI, smoking) were found to be significant predictors for volume overload. None of the 4
parameters was sensitive and specific. We found that bio-impedance was a helpful bedside
method to better identify hidden volume overload.

iii
Preface
The research project, of which this thesis is a part, received research ethics approval from the
University of Alberta Research Ethics Board, project name ‘Clinical and bio-impedance based
fluid volume assessment in hemodialysis’, No. Pro00031776, June 2012.
Chapter 2 of this thesis will be submitted for publication. I was responsible for patient
recruitment, data collection and analysis as well as writing the manuscript. Ryan Reid
contributed to designing the study, applying for ethics approval and assisted in data collection.
Dr. Neesh Pannu and Dr. kailash Jindal contributed to revising the manuscript. Dr. Branko
Braam was responsible for designing the study, ethics approval, data analysis and writing the
manuscript.

iv
I dedicate this thesis to my family whose continuous love and support gave me strength to make
this work possible

v
Acknowledgments
I wish to acknowledge and express my sincere gratitude to all of the following people who were
supportive and cooperative in the successful completion of this thesis.
I would like to express my utmost gratitude to my supervisor, Dr. Branko Braam, for his
guidance, kindness, support and patience and valuable suggestions. I would like also to thank
the members of my supervisory committee, Dr. Neesh Pannu, and Dr. Kailash Jindal for this
guidance and valuable suggestions.
I am also grateful to the Department of Medicine, University of Alberta for giving me the chance
to pursue my graduate studies. I would like also to thank the Division of Nephrology, University
of Alberta for supporting my studies and paying my educational fees.
Especially, I would like to express my gratitude and love to my friends and beloved family for
their understanding, endless love and intensive support through the duration of my studies.

vi
Table of contents
Chapter 1 ......................................................................................................................................... 1
1. Introduction ............................................................................................................................. 1
1.1. Importance of volume assessment in HD patients ............................................................... 2
1.2. Methods of volume assessment ........................................................................................... 3
1.2.1. Clinical methods (the dry weight concept) ...................................................................... 3
1.2.2. Measurement of inferior vena cava diameter ................................................................... 4
1.2.3. Cardiac biomarkers .......................................................................................................... 5
1.2.4. Dilution methods .............................................................................................................. 6
1.2.5. Continuous blood volume monitoring ............................................................................. 6
1.2.6. Multi-frequency bio-impedance spectroscopy ................................................................. 7
1.2.7. Lung ultrasound................................................................................................................ 8
1.3. Management of volume overload in HD patients .............................................................. 11
Dietary measures .......................................................................................................................... 11
1.4. Linking between volume and blood pressure control ........................................................ 12
1.5. Intradialytic hypotension ................................................................................................... 13
1.6. Sodium profiling ................................................................................................................ 13
1.7. Hypotheses ......................................................................................................................... 14
Chapter 2 ....................................................................................................................................... 17
2. Hidden fluid overload is prevalent in hemodialysis patients: a bio-impedance study .. 17
2.1. Introduction ........................................................................................................................ 18
2.2. Materials and Methods ....................................................................................................... 19
2.3. Results ................................................................................................................................ 22
2.3.1. General characteristics of the study population ............................................................. 22
2.3.2. Prevalence of volume abnormalities .............................................................................. 23
2.3.3. Clinical and biochemical characteristics in hypovolemic, normovolemic and hypervolemic patients ................................................................................................................... 24
2.3.4. Relation between interdialytic weight gain and volume overload ................................. 24
2.3.5. Relation between blood pressure and volume status as assessed by bio-impedance ..... 25

vii
2.3.6. Incidence of intradialytic hypotension and paradoxical hypertension ........................... 25
2.3.7. Using clinical parameters to identify volume overloaded patients ................................ 28
2.4. Discussion .......................................................................................................................... 29
Chapter 3 ....................................................................................................................................... 34
3. Sodium profiling in hemodialysis.......................................................................................... 34
3.1. Introduction ........................................................................................................................ 35
3.2. Sodium balance in HD patients.......................................................................................... 36
3.3. Pathophysiology of intradialytic hypotension ................................................................... 37
3.3.1. Intradialytic hypotension and cardiac output: ................................................................ 37
3.3.2. Intradialytic hypotension and heart rate variability........................................................ 38
3.3.3. Intradialytic hypotension and refilling rate .................................................................... 39
3.3.4. Blood volume changes and IH ....................................................................................... 39
3.4. Primary and secondary responses to high dialysate sodium concentration ....................... 41
3.4.1. Primary response: change in plasma sodium concentration........................................... 41
3.4.2. Secondary responses to increased plasma sodium concentration: ................................. 42
3.4.2.1. ADH changes during hemodialysis ............................................................................ 42
3.4.2.2. Thirst sensation ........................................................................................................... 43
3.4.2.3. Effect of sodium load on vascular endothelium ......................................................... 43
3.5. Effect of plasma sodium concentration on blood pressure ................................................ 44
3.6. Effect of sodium profiling on compensatory mechanisms ................................................ 45
3.7. Sodium profiling ................................................................................................................ 47
3.7.1. Sodium positive profiling ............................................................................................... 48
3.7.2. Sodium neutral profiling and sodium setpoint ............................................................... 55
3.7.3. Sodium and ultrafiltration profiling ............................................................................... 56
3.8. Conclusion ......................................................................................................................... 57
Chapter 4 ....................................................................................................................................... 59
4. Overall discussion.................................................................................................................. 59
4.1. Prevalence of volume overload and volume depletion in HD ........................................... 60
4.2. Wide variability of BP and IDWG..................................................................................... 60

viii
4.3. Incidence of intradialytic hypotension and paradoxical hypertension ............................... 61
4.4. Sodium profiling ................................................................................................................ 62
4.5. Multifactorial intervention to improve volume and blood pressure control in HD patients 63
Chapter 5 ....................................................................................................................................... 65
5. Future directions .................................................................................................................... 65
5.1. Volume management protocol ........................................................................................... 66
5.2. Effect of volume overload on survival ............................................................................... 67
5.3. Volume depletion and myocardial stunning ...................................................................... 68
References ..................................................................................................................................... 69
ix
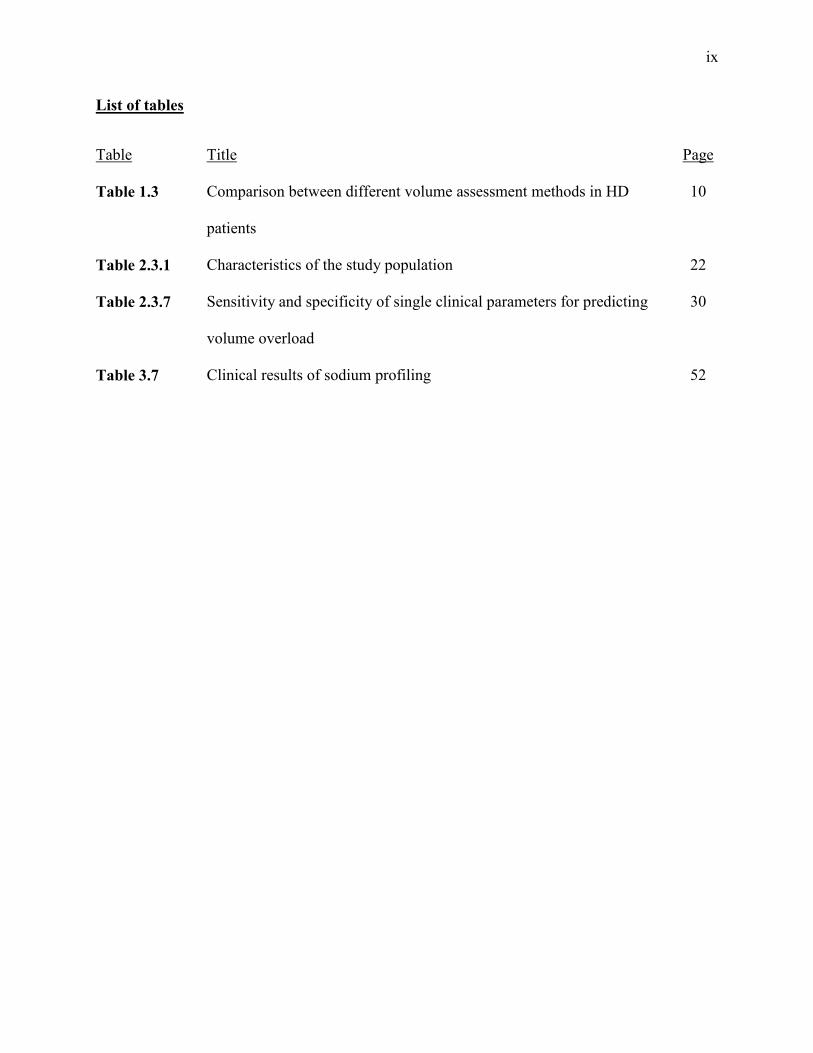
List of tables
Table Title Page
Table 1.3 Comparison between different volume assessment methods in HD
patients
10
Table 2.3.1 Characteristics of the study population 22
Table 2.3.7 Sensitivity and specificity of single clinical parameters for predicting
volume overload
30
Table 3.7 Clinical results of sodium profiling 52

x
List of figures
Figure Title Page
Figure 2.3.2 Frequency distribution of volume status and IDWG 24
Figure 2.3.4 Correlation between IDWG and volume overload 26
Figure 2.3.5 Correlation between blood pressure and volume status assessed by bio-
impedance
28
Figure 2.3.6 Frequency distribution of severity of paradoxical hypertension 29
Figure 3.3 Patho-physiology of intradialytic hypotension 42
Figure 3.6 Mechanism of action of sodium profiling 48
Figure 4.4 Plasma sodium level for the study population 64
Figure 5.1
Adjustment of Dry weight using bio-impedance spectroscopy 68

xi
List of abbreviations
DW Dry weight
ANP Atrial natruiritic peptide
BNP Brain natruiritic peptide
ECFV Extracellular fluid volume
BP Blood pressure
IVC Inferior vena cava
IVCD Inferior vena cava diameter
CI Collapse index
CTNT Cardiac troponins
TBW Total body water
BCM Body composition monitor
CHF Congestive heart failure
IDWG Inter-dialytic weight gain
ESRD End stage renal disease
IH Intradialytic hypotension
CO Cardiac output
TPR Total peripheral resistance

xii
BV Blood volume
IHD Ischemic heart disease
SV Stroke volume
MAP Mean arterial pressure
UF Ultrafiltration
BBs Beta blockers
CCBs Calcium channel blockers
LVH Left ventricular hypertrophy
ICFV Intracellular fluid volume
ADH Anti-diuretic hormone
MCV Mean corpuscular volume
PNa Plasma sodium
DNa Dialysate sodium
VS Volume status
VS/ECFV Volume status/Extracellular fluid volume
AV Arterio-venous

1
Chapter 1
1. Introduction

2
1.1. Importance of volume assessment in HD patients
In healthy subjects, hypervolemia activates renal mechanisms which aim to diminish
extracellular fluid volume (ECFV) expansion. However, patients with impaired renal function
will not show these mechanisms and ECFV expansion will have drastic outcomes. Therefore it
is important to understand how the body (specifically the vasculature and the kidneys) responds
to volume expansion. As the ECFV (and therefore the blood volume) expands, rising cardiac
output drives tissue perfusion beyond that required for the metabolic needs of the tissue. In
response, autoregulatory mechanisms increase total peripheral resistance first by systemic
vasoconstriction and, over time, by structural alterations that narrow the lumen of blood vessels
(1).. This so-called total body autoregulation will raise arterial pressure which will be corrected
by normal kidneys through ‘pressure natriuresis’ (1).
Small increases in the ECFV will trigger the autoregulatory response and this can lead to
hypertension (1). This is of great importance to end stage renal disease patients who do not have
kidneys capable of reacting properly to increased ECFV (2); these patients will likely be
hypertensive unless body fluid volumes are carefully and accurately maintained as close to
normal as possible through ultrafilatration during dialysis (2). Accordingly, it is crucial that
volume assessment in the clinical setting accurately determines the hydration status of dialysis
patients

3
1.2. Methods of volume assessment
1.2.1. Clinical methods (the dry weight concept)
The concept of dry weight (DW) is crucial for dialysis therapy. DW refers to the body weight at
physiological extracellular fluid volume (3). The term DW was introduced in 1960s as “not
merely the absence of edema, but the edge of hypovolemia which should be achieved by the end
of the session, to allow the patient to gain some weight up to the next dialysis session without
becoming hypertensive” (4). Daugirdas defined DW as “the post dialysis weight at which all or
most excess body fluid had been removed, below which the patient more often than not will
develop symptoms of hypotension” (5). Both are clearly not accurate definitions but are
commonly used. The use of these clinical definitions of DW is mainly due to the lack of
accurate objective methods for DW assessment (3).
Numerous methods have been investigated to assess the DW, such as clinical, bedside
assessment of volume status, inferior vena cava collapse index using ultrasound, biomarkers for
volume overload (atrial natriuretic peptide, ANP; brain natriuretic peptide, BNP), and cardio-
thoracic ratio by chest X-ray. Dilution methods used to be the gold standard method for volume
assessment; however, it is not a clinically feasible approach (4). Multi-frequency bio-impedance
measurement is easy to use and can yield relatively reliable estimates of intra- and extracellular
fluid volume. Dilution methods used to be the gold standard method for volume assessment;
however, it is not a clinically feasible approach (4). A recent report stated that there is no gold
standard with absolute accuracy especially in dialysis patients. They found a proportional error
with both bio-impedance and dilution methods as shown by regression analysis (5).

4
Assessing DW by body weight measurement does not take into account changes in nutritional
status (lean and fat body mass). The two most frequently used methods are measurement of
blood pressure and body weight. In absence of overt clinical signs of hypervolemia or
hypovolemia, normal blood pressure is often considered as a sign for normovolemia, however, it
is not usually the case (6). DW then approached by trial and error. This is cumbersome both for
the patient and dialysis staff, because (1) BP is affected by other factors other than ECFV
expansion, (2) the effect of volume control on BP may be delayed by weeks or even months (lag
phenomenon) (3). Available evidence suggests that clinical examination lacks sensitivity and
specificity in diagnosis of either volume overload or hypovolemia (7-9). The ability of clinical
examination to detect modest degree of volume depletion or volume overload is poor (10).
1.2.2. Measurement of inferior vena cava diameter
Imaging studies of diameter of inferior vena cava (IVC) can be used to assess intravascular
volume in HD patients. Measuring IVC diameter has been shown to correlate well with central
venous pressure (11) . As ultrasonography is non-invasive and fast, it has been investigated as a
method to assess volume status. Ultrasound guidance for the determination of DW has been
tested by measuring IVC diameter and its decrease on deep inspiration, better known as the
collapse index (CI). Calculation of CI follows the following formula (10):
CI= [(end expiratory IVCD – end inspiratory IVCD) / end expiratory IVCD] x 100
Nonlinear regression analysis found that the CI strongly correlated with mean right atrial
pressure, as assessed by cardiac catheterization. Hypervolemia is defined as a decrease in IVC
diameter during inspiration less than 25% of the baseline diameter during expiration.

5
Hypovolemia is defined as a decrease in IVC diameter during inspiration more than 60% of the
baseline diameter during expiration (10).
If IVCD measuring is performed before post-dialysis refilling has ceased, it will underestimate
fluid volume and also has disadvantages in terms of costs and interoperator error. Its
applicability in patients with congestive heart failure and valvular heart disease is also limited
(12).
1.2.3. Cardiac biomarkers
Much attention has been given to biochemical markers of changes in extracellular fluid volume.
Brain natruiritic peptide (BNP) and N-Terminal–pro BNP (NT-proBNP) are produced by
stretched atrial and ventricular cardiomyocytes and seem to be valuable cardiac markers in HD
patients with volume overload . However, these markers do not accurately reflect ECFV as
cardiac stretch is not well correlated with ECFV .
Cardiac troponin (cTNT) is proposed to be the most reliable biomarker for the diagnosis of acute
myocardial infarction . CTNT is exclusively expressed in cardiomyocytes and is released into
the circulation after irreversible myocardial damage. In HD patients, cTNT is elevated in a high
percentage of patients despite absence of acute myocardial ischemia . Recent studies have
documented that cTNT is of cardiac origin and that the presence and magnitude of CTNT is an
independent variable with respect to morbidity and mortality in HD patients .
Similar to IVCD measurement, these biomarkers are not useful in patients with congestive heart
failure or tricuspid or mitral valve disease. Another important limitation of these markers is their
6
inability to detect volume depletion, since there is no difference in values between normovolemia
and hypovolemia .
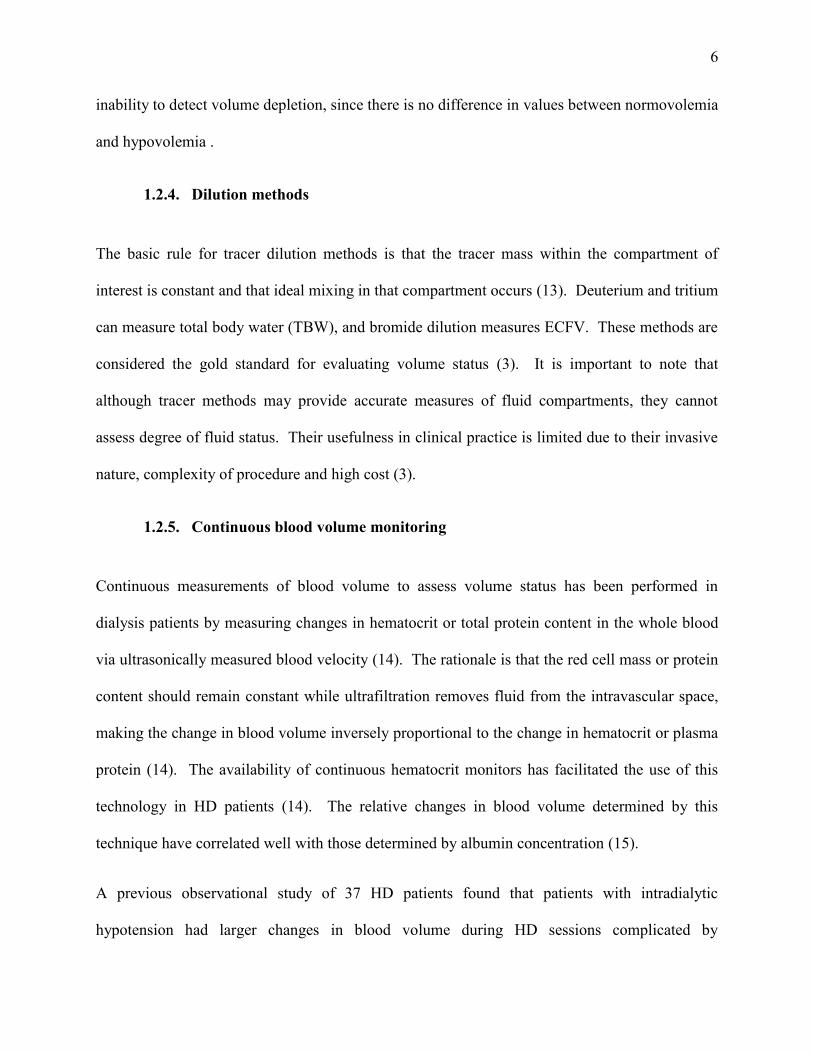
1.2.4. Dilution methods
The basic rule for tracer dilution methods is that the tracer mass within the compartment of
interest is constant and that ideal mixing in that compartment occurs (13). Deuterium and tritium
can measure total body water (TBW), and bromide dilution measures ECFV. These methods are
considered the gold standard for evaluating volume status (3). It is important to note that
although tracer methods may provide accurate measures of fluid compartments, they cannot
assess degree of fluid status. Their usefulness in clinical practice is limited due to their invasive
nature, complexity of procedure and high cost (3).
1.2.5. Continuous blood volume monitoring
Continuous measurements of blood volume to assess volume status has been performed in
dialysis patients by measuring changes in hematocrit or total protein content in the whole blood
via ultrasonically measured blood velocity (14). The rationale is that the red cell mass or protein
content should remain constant while ultrafiltration removes fluid from the intravascular space,
making the change in blood volume inversely proportional to the change in hematocrit or plasma
protein (14). The availability of continuous hematocrit monitors has facilitated the use of this
technology in HD patients (14). The relative changes in blood volume determined by this
technique have correlated well with those determined by albumin concentration (15).
A previous observational study of 37 HD patients found that patients with intradialytic
hypotension had larger changes in blood volume during HD sessions complicated by

7
hypotension than in uncomplicated sessions (16). In a prospective randomized trial, using blood
volume monitoring resulted in a decrease in the incidence of intradialytic hypotension.
Intradialytic hypotensive events were reduced by 30% compared to 33.5% during the control
period (17). In another study of hypotensive prone patients, only 8 out of 13 patients, a
hematocrit threshold could be found. Blood volume monitoring was not useful in the remaining
5 patients (15).
The use of blood volume monitoring has been shown to be a useful tool to prevent hypotensive
episodes and identify patients with volume overload (10). While the technique is easy and
feasible, several limitations apply: there is no standardization of blood volume (no absolute
values exist), it also requires active changes during dialysis to achieve best results, and lastly the
expense of this equipment could limit its use in HD.
1.2.6. Multi-frequency bio-impedance spectroscopy
Bio-impedance spectroscopy is a non-invasive, objective and relatively inexpensive method that
can be used to detect body fluid compartments in healthy individuals as well as HD patients (18).
An example of a modern bio-impedance device is the body composition monitor (BCM),
marketed by Fresenius. This device works by alternating current at 50 different frequencies (5-
1000 kHz). The way in which the current is retarded or impeded by the body structures allows
for determination of the body fluid volume. This measurement is harmless, quick, and reliable
and has been applied to many patients worldwide. A patient height, gender, and age are entered,
electrodes are applied on one wrist and foot of the same side then, the measurement can be done.
It gives information about the patient’s nutritional and fluid status by measuring total body

8
water, ECFV, intracellular fluid volume, lean tissue index, fat tissue index and body cell mass. It
is very easy and rapid method for assessing the fluid status of HD patients.
The basic theory behind bio-impedance spectroscopy is that low frequency alternating currents
cannot cross the cell membrane and travels only through the extracellular fluid volume allowing
for measurement of this compartment, whereas high frequency alternating current can travel
through both intracellular and extracellular fluid volumes (19). Recent studies used the BCM to
estimate volume overload and DW in HD patients. They proved that using the BCM to assess
and adjust DW was very effective to improve IDWG, BP control, and cardiovascular outcome
(20, 21). Bio-impedance spectroscopy was also extensively validated against the gold standard
dilution methods, and there was a strong agreement between the two methods for volume
assessment (22). Comparison between different methods for volume assessment is shown in
table 1.3.
1.2.7. Lung ultrasound
Lung ultrasound has been recently introduced as a method for fluid volume assessment in
dialysis patients. Lung ultrasound can evaluate extravascular lung water by identifying B-lines,
vertical artifacts arising from the pleural line and extending to the edge of the screen that move
synchronously with respiratory acts (23). Such artifacts arise from internal reverberation due to
increase in fluid in lung lobes and segments. There is a good evidence of correlation between
such ultrasound findings and extravascular lung water evaluated by invasive methods (24)
There was a significant reduction in the number of B-lines when lung ultrasound was done
before and after dialysis, confirming that these artifacts seen before dialysis are due to fluid
overload (23). The finding that post-dialysis B-lines number correlated with excess residual

9
weight as assessed by bio-impedance spectroscopy, suggests the use of lung ultrasound for
determination of volume status. However, lung ultrasound only gives information on volume
overload (the minimal number of B lines is zero), so it cannot differentiate between
normovolemia and hypovolemia (23). Another limitation of this technique is that it B-lines will
be higher and will not accurately reflect volume status in patients with heart failure especially
patients with NYHA class ΙΙΙ- ΙV (23)

10
Table 1.3: Comparison between different volume assessment methods in HD patients:
Method Advantages Disadvantages Clinical assessment Easy to perform
Inexpensive Lacks sensitivity and
specificity. Indirect method for
volume assessment.
Ultrasound of IVC Non-invasive Strong correlation with right
sided heart failure
Costly Inter-operator error Limited applicability
in patients with CHF and valvular heart disease
Dilution methods Accurate Direct method for volume
assessment
Time consuming Invasive Cannot be used in
daily clinical practice
Continuous blood volume monitoring
Easy to use, non-invasive. Helps to prevent
intradialytic hypotension
There is no standardization of blood volume
Indirect method for volume assessment.
It only measures changes in BV during dialysis not absolute BV
Multi-frequency bio-impedance spectroscopy
Fast, non-invasive, bedside method.
Accurate. Can identify both hyper and
hypovolemia
Relatively expensive
Lung ultrasound Non-invasive Cannot differentiate between normovolemia and hypovolemia Limited applicability in patients with CHF

11
1.3. Management of volume overload in HD patients
Dietary measures
The first mention of the ability to control hypertension in HD patients without the use of drugs
was in 1961 (25). The first four patients treated by long term dialysis in Seattle were
hypertensive, and their hypertension was controlled by low sodium diet and ultrafiltration (25).
Similar observations have been recorded from Tassin, France where low sodium diet was
combined with extended hours of dialysis and ultrafiltration (26). More recently salt restriction
was neglected (27). Previous interventional studies have examined the effects of reducing
sodium in diet (28). Almost all of them showed that a low salt diet is essential for BP control in
HD patients.
A recent study evaluated the effect of dietary sodium restriction on fluid volume and blood
pressure control (29). They concluded that dietary sodium restriction did not significantly affect
inter-dialytic weight gain (IDWG) and blood pressure (29). However, there were many
limitations for this study such as the small number of patients and the absence of an accurate
method to evaluate the amount of sodium consumed. Moreover, bio-impedance measurements
were performed after dialysis sessions, and were not used to adjust the DW (29).
Another factor which may have contributed to the worldwide neglect of salt restriction is the
unjustified emphasis on water restriction instead of salt restriction (30). Altogether, in order to
achieve DW under the present conditions, with short HD duration, it is essential to reduce IDWG
through low salt diet (28) .

12
1.4. Linking between volume and blood pressure control
Numerous studies indicate that maintenance of dry weight in dialysis patients leads to better
blood pressure control. In a small study of ESRD patients, ultrafiltration alone significantly
lowered blood pressure in one hypertensive subgroup (31). Other studies also suggest that
improved volume control has a beneficial impact on blood pressure. A previous study focusing
on ultrafiltration and salt restriction reported a reduction of systolic blood pressure from 173+17
to 118+12 mmHg over a 36-month period (32). Also of interest is the observation that 6 months
of nocturnal hemodialysis (5-6 sessions weekly) reduced both left ventricular mass and systolic
blood pressure (33). This is consistent with better control over body fluid volumes, as volume
expansion is a causal factor in both left ventricular hypertrophy and hypertension (2, 34).
Another study of HD patients from Tassin, France found that three 8 hour dialysis sessions per
week results in normotension in 98% of the patients (35). The benefit of achieving
normovolemia and normotension was clearly demonstrated by the long-term survival of the
Tassin patients relative to other HD patient studies likely due to prevention of cardiovascular
disease (35).
Altogether, this suggests that improved blood pressure control can be achieved by maintaining
dry weight through improved volume control. Further, normotension is associated with
improved survival in dialysis patients. This also indicates the importance of identifying accurate
methods for volume assessment.

13
1.5. Intradialytic hypotension
Intradialytic hypotension (IH) is a common adverse reaction that occurs in about 15-25% of HD
patients (36-38). IH is a major clinical problem not only causing discomfort but also it increases
the patient mortality. According to recent data, a low post-dialysis blood pressure is associated
with significant increase risk of mortality (39, 40).
IH is defined as gradual or acute fall in blood pressure with accompanying clinical symptoms
that occurs during the dialysis sessions and is caused by exhaustion or failure of compensatory
mechanisms to maintain adequate perfusion of tissues. Blood pressure is the resultant product of
cardiac output (CO) and total peripheral resistance (TPR) (41). Therefore, IH is the result of
lowered CO and/ or inappropriately low TPR (41). Compensatory mechanisms to prevent IH
will work by maintaining CO and/or TPR. The compensatory mechanisms can become activated
to a maximum, so that further compensation is not possible. Alternatively, the compensation may
fail, due to the pathophysiology of the ESRD patient, or due to medications. Pathophysiology of
intradialytic hypotension will be discussed in detail in the next few chapters.
1.6. Sodium profiling
Sodium profiling has been introduced as a method to reduce IH episodes occurring during
dialysis sessions (42). Sodium profiling is mainly performed by using a higher dialysate sodium
concentration at the beginning of the dialysis session and then decreasing sodium concentration
in the dialysate either gradually or abruptly towards the end of dialysis session (43). The highest
sodium concentration is used at the beginning of the dialysis session when blood urea

14
concentration and urea removal is high (44). One tries to avoid the inevitable drop in plasma
osmolality due to urea removal. The lower dialysate sodium concentration for the rest of dialysis
session then functions to avoid sodium accumulation (44).
In a previous study at the university of Alberta hospital, they divided participating patients into 3
groups; for the 1st group, they used a steady dialysate sodium concentration of 140mEq/L, the 2nd
group with linear dialysate sodium ramping from 155mEq/L to 140mEq/L, the 3rd group with
stepwise ramping (155mEq/L for 3 hours then 140mEq/L for 1hour) (42). There were fewer IH
episodes in the 2 ramping protocols comparing to standard protocol. Thirst and IDWG were
increased with the 2 ramping protocols compared to standard dialysis. There was no difference
between the 2 ramping protocols (42). However, pre-dialysis blood pressure was the highest with
the stepwise ramping protocol (42).
Few side effects have appeared with the use of sodium profiling like increased thirst sensation
which will in turn increase fluid intake and IDWG in these patients (45). This would
paradoxically lead to some volume expansion. If one optimizes the sodium profiling by using a
dialysate sodium concentration not much exceeding the standard dialysate sodium concentration,
this would prevent IH episodes and while not leading to increased thirst sensation and IDWG in
HD patients.
1.7. Hypotheses
Volume expansion in HD patients leads to hypertension and cardiovascular complications. On
the other hand, episodes of intradialytic hypotension (IH) occur in up to 25% of dialysis sessions.
Hypotension is a major clinical problem not only because it’s frequency but also because it
substantially affects the well-being of the dialysis patients. Unfortunately, these episodes of

15
symptomatic hypotension and muscle cramps during dialysis sessions frequently lead to the
misconception that patients are normo or even hypovolemic. Obviously this is not necessarily
the case, but leads often to increases in target weight and using techniques to alleviate these
symptoms like sodium profiling. Taken together, if volume overload is the major cause for
hypertension, hypotensive episodes and cardiovascular complications, it should be adequately
controlled. Therefore we were looking for more objective methods for volume assessment. Also
important is investigating the use of sodium profiling for prevention of intradialytic hypotension.
Our hypotheses are:
1. Clinical parameters are not sufficient to evaluate volume status in hemodialysis patients:
To test this hypothesis, we compared clinical parameters with bio-impedance spectroscopy for
volume assessment in a cohort of hemodialysis patients. We were expecting to have a subgroup
of patients who are considered volume overloaded by clinical examination and by the BCM, a
subgroup of patients who are identified as volume overloaded by the BCM but not by clinical
assessment, and finally a subgroup of patients in which the BCM and clinical assessment did not
indicate fluid overload. We wanted to compare bio-impedance spectroscopy as a method for
volume assessment with clinical parameters.
2. Side effects of sodium profiling outweighs its benefits in HD patients
To test this hypothesis, we investigated the literature for most of the studies that used sodium
profiling in HD patients. We wanted to investigate the best sodium profiling protocol, and
whether the use of sodium profiling could be recommended for all HD patients or in select cases.
Through this literature review we identified different sodium profiling protocols with advantages

16
and side effects of each. Also we investigated the patho-physiology of sodium profiling and how
it ameliorates intradialytic complications.

17
Chapter 2
2. Hidden fluid overload is prevalent in hemodialysis patients: a bio-impedance study

18
2.1. Introduction
Accurate assessment of volume status remains one of the greatest challenges in the treatment of
hemodialysis (HD) patients (10, 46). Chronic volume overload contributes to hypertension, left
ventricular hypertrophy and heart failure in HD patients (47, 48). Therefore, adequate
extracellular fluid volume (ECFV) control is crucial for blood pressure regulation (49) and to
prevent cardiovascular complications in this population (50, 51). Conversely, hypovolemia
could predispose the HD patient to intradialytic hypotension, cramps, arrhythmias, and reduced
well-being after treatment (2). As such, ECFV expansion and depletion can negatively impact
HD patients.
Clinical assessment of volume overload by assessing blood pressure, edema and central venous
pressure has limitations (3, 13, 52, 53). Interdialytic weight gain is not an accurate measure of
volume overload since it does not necessarily correlate with actual ECFV expansion (54). The
inferior vena cava collapse index (10), ultrasound assisted assessment of pulmonary fluid content
(23) and echocardiography (10) can contribute to the assessment of fluid volume status but they
do not provide an accurate estimate of fluid expansion or depletion and are difficult to implement
in clinical practice. Multifrequency bio-impedance spectroscopy is a convenient bedside method
to assess extracellular and intracellular fluid volume compartments (55). This method had been
validated against gold standard dilution methods (55, 56), and is generally applicable in the
setting of HD.
Given the high risk of mortality associated with ECFV expansion (57) and the knowledge that
adequate volume control provides better control of blood pressure (58), more accurate objective
methods for volume assessment would be valuable. In the current study, we tested the hypothesis
19
that volume overload is highly prevalent in HD patients, likely due to the inability to judge
volume status from clinical parameters. We used bio-impedance spectroscopy to assess volume
status in our HD population and to compare it with clinical volume assessment. Our aims were
(1) to assess the prevalence of volume overload and volume depletion in our HD population
using bio-impedance spectroscopy measurements, (2) to investigate the association between
clinical parameters and volume status as assessed by the BCM, and (3) to search for a set of
clinical parameters that best predict volume status in HD patients.
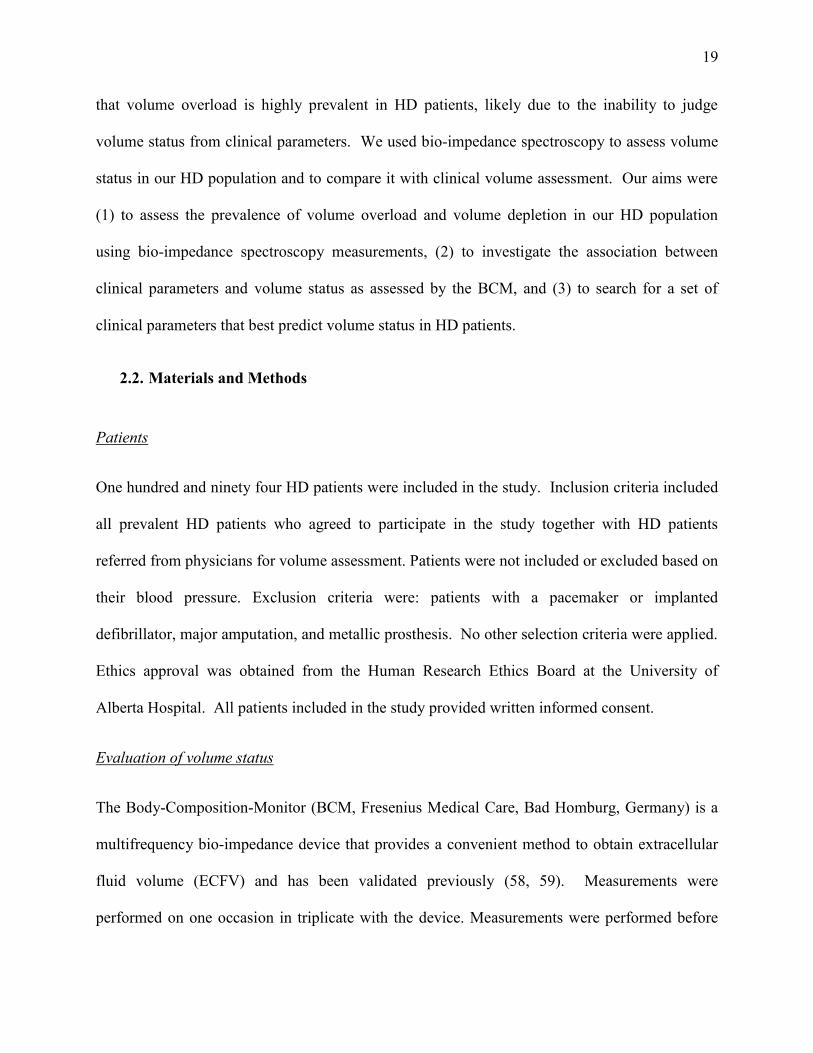
2.2. Materials and Methods
Patients
One hundred and ninety four HD patients were included in the study. Inclusion criteria included
all prevalent HD patients who agreed to participate in the study together with HD patients
referred from physicians for volume assessment. Patients were not included or excluded based on
their blood pressure. Exclusion criteria were: patients with a pacemaker or implanted
defibrillator, major amputation, and metallic prosthesis. No other selection criteria were applied.
Ethics approval was obtained from the Human Research Ethics Board at the University of
Alberta Hospital. All patients included in the study provided written informed consent.
Evaluation of volume status
The Body-Composition-Monitor (BCM, Fresenius Medical Care, Bad Homburg, Germany) is a
multifrequency bio-impedance device that provides a convenient method to obtain extracellular
fluid volume (ECFV) and has been validated previously (58, 59). Measurements were
performed on one occasion in triplicate with the device. Measurements were performed before

20
the start of mid-week HD treatment with the patients in supine position for 10 minutes.
Electrodes were applied on the ipsilateral arm and foot of the non- AV- fistula side.
The BCM device measures the impedance of different body compartments at 50 different
frequencies between 5 kHz and 1000 kHz. The BCM calculates volume status (VS) which is
expressed as volume excess or depletion in liters compared to the estimated ideal ECFV. The
accuracy of bio-impedance in ECFV was within -0.4±1.4L when compared to dilution methods
(59). To facilitate comparison between patients, the volume status was related to estimated ideal
extracellular fluid volume (VS/ECFV). The patient population was divided into hypovolemic,
normovolemic and hypervolemic groups. Hypovolemia was considered more than 7% below
normal ECFV (equivalent to 1.1L below normal ECFV). Normovolemia was considered any
measurement between -7% and 7% relative to normal ECFV. Hypervolemia was considered
more than 7% above normal ECFV (equivalent to 1.1L above normal ECFV). The 7% cutoff
point was based on 1.1L above normal ECFV (based on optimal daily dietary sodium intake) and
corrected for the average ECFV for the study population.
Clinical and biochemical parameters
Clinical parameters collected include pre and post dialysis blood pressure for the same session
and 5 previous sessions. Hypertension was considered as the average pre-dialysis BP
>140/90mmHg for the 5 previous sessions. Intradialytic hypotension was defined as post dialysis
SBP falling below 100mmHg and the difference between pre dialysis SBP to post dialysis SBP
>20 mmHg with accompanying clinical symptoms during dialysis that required an intervention
or cessation of UF (60). As there is no widely accepted definition of paradoxical hypertension,
we considered it as a rise of SBP of >20mmHg during or after dialysis with post dialysis BP

21
exceeding 140/90mmHg. Patients were considered diabetic if it was mentioned in their charts
or if the patient was on anti-diabetic medications. Pedal edema was assessed as present or absent.
DW was obtained from the patient charts, however, we are not aware of how recently the DW
was assessed by physicians. Interdialytic weight gain (IDWG) for the previous 5 sessions was
recorded. IDWG was calculated by subtracting the post-dialysis weight of HD session from the
pre-dialysis weight of the subsequent HD session. To determine the correlation between IDWG
and volume overload, IDWG more than 7% of ideal ECFV was considered elevated. All
biochemical parameters (plasma Na, K+, serum albumin, WBCs, urea reduction ratio, and
cholesterol level) were obtained from the most recent monthly blood work of the patient.
Clinical volume assessment routinely assessed by rounding physicians by assessment of regular
clinical parameters such as edema, shortness of breath and blood pressure. The rounding
physicians according to their judgment of volume status adjusted dry weight.
Statistical analysis
Continuous data are expressed as mean± standard deviation. Categorical variables are expressed
as percentage of total. One way ANOVA was used for univariate comparisons. Pearson’s test
was used for univariate correlations. Multivariate linear regression was performed with volume
overload as the target variable, to find predictors for volume overload. Variables selected for the
multivariate model based on a significant univariate analysis with a P- value<0.10. All data
analysis was done with Graph prism (Graphpad 5, San Diego, CA, USA), and SPSS version 21
(SPSS Inc., Chicago, IL, USA). A P-value <0.05 was considered statistically significant.
22
2.3. Results
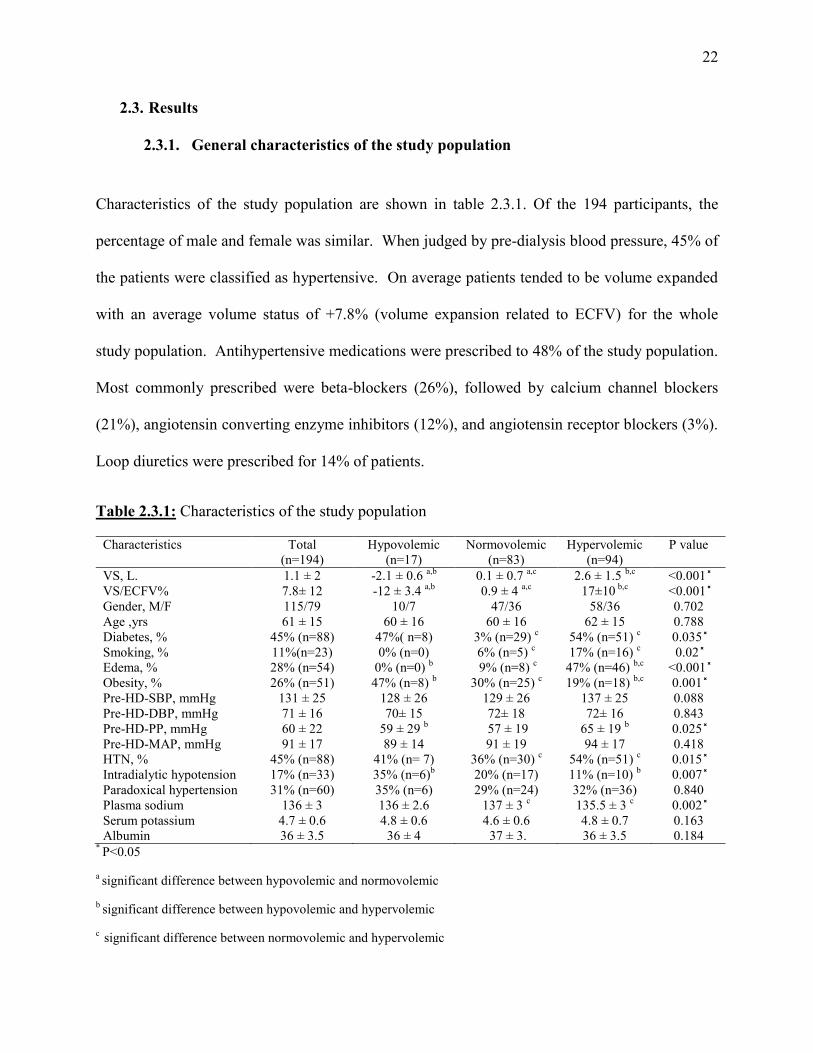
2.3.1. General characteristics of the study population
Characteristics of the study population are shown in table 2.3.1. Of the 194 participants, the
percentage of male and female was similar. When judged by pre-dialysis blood pressure, 45% of
the patients were classified as hypertensive. On average patients tended to be volume expanded
with an average volume status of +7.8% (volume expansion related to ECFV) for the whole
study population. Antihypertensive medications were prescribed to 48% of the study population.
Most commonly prescribed were beta-blockers (26%), followed by calcium channel blockers
(21%), angiotensin converting enzyme inhibitors (12%), and angiotensin receptor blockers (3%).
Loop diuretics were prescribed for 14% of patients.
Table 2.3.1: Characteristics of the study population
Characteristics Total (n=194)
Hypovolemic (n=17)
Normovolemic (n=83)
Hypervolemic (n=94)
P value
VS, L. 1.1 ± 2 -2.1 ± 0.6 a,b 0.1 ± 0.7 a,c 2.6 ± 1.5 b,c <0.001 ̽ VS/ECFV% 7.8± 12 -12 ± 3.4 a,b 0.9 ± 4 a,c 17±10 b,c <0.001 ̽ Gender, M/F 115/79 10/7 47/36 58/36 0.702 Age ,yrs 61 ± 15 60 ± 16 60 ± 16 62 ± 15 0.788 Diabetes, % 45% (n=88) 47%( n=8) 3% (n=29) c 54% (n=51) c 0.035 ̽ Smoking, % 11%(n=23) 0% (n=0) 6% (n=5) c 17% (n=16) c 0.02 ̽ Edema, % 28% (n=54) 0% (n=0) b 9% (n=8) c 47% (n=46) b,c <0.001 ̽ Obesity, % 26% (n=51) 47% (n=8) b 30% (n=25) c 19% (n=18) b,c 0.001 ̽ Pre-HD-SBP, mmHg 131 ± 25 128 ± 26 129 ± 26 137 ± 25 0.088 Pre-HD-DBP, mmHg 71 ± 16 70± 15 72± 18 72± 16 0.843 Pre-HD-PP, mmHg 60 ± 22 59 ± 29 b 57 ± 19 65 ± 19 b 0.025 ̽ Pre-HD-MAP, mmHg 91 ± 17 89 ± 14 91 ± 19 94 ± 17 0.418 HTN, % 45% (n=88) 41% (n= 7) 36% (n=30) c 54% (n=51) c 0.015 ̽ Intradialytic hypotension 17% (n=33) 35% (n=6)b 20% (n=17) 11% (n=10) b 0.007 ̽ Paradoxical hypertension 31% (n=60) 35% (n=6) 29% (n=24) 32% (n=36) 0.840 Plasma sodium 136 ± 3 136 ± 2.6 137 ± 3 c 135.5 ± 3 c 0.002 ̽ Serum potassium 4.7 ± 0.6 4.8 ± 0.6 4.6 ± 0.6 4.8 ± 0.7 0.163 Albumin 36 ± 3.5 36 ± 4 37 ± 3. 36 ± 3.5 0.184
* P<0.05
a significant difference between hypovolemic and normovolemic
b significant difference between hypovolemic and hypervolemic
c significant difference between normovolemic and hypervolemic

23
2.3.2. Prevalence of volume abnormalities
Frequency distribution of volume status and comparison between the 3 groups is shown in figure
2.3.2; 43% of participants had normal volume status, defined as any measurement lying between
-7% and 7% of the ideal ECFV; 48% of all patients had volume overload more than 7% of
normal extracellular fluid volume. Of these fluid overloaded patients, in 47% (23 % of the
whole study group) volume overload exceeded 15% of normal extracellular fluid volume
(equivalent to 2.5L when related to an average ideal ECFV). Hypovolemia was observed in 9%
of all patients.
Figure 2.3.2: Frequency distribution of volume status and IDWG
-25 -20 -15 -10 -5 0 5 10 15 20 25 30 35 40 45 50 550
10
20
30
40
50
60
VS/ECFV%
Freq
uenc
y
Hypovolemic Normovolemic Hypervolemic-40
-20
0
20
40
60
VS/E
CFV,
%
-10 -5 0 5 10 15 20 25 30 35 400
10
20
30
40
50
60
IDWG/ECFV %
Freq
uenc
y
Hypovolemic Normovolemic Hypervolemic-10
0
10
20
30
40
IDW
G/E
CFV
%
Mean=7.8SD=12n=194
Mean=10SD=8n=165
P<0.001
P=0.486
A B
C D
A)Frequency distribution of volume status corrected for extracellular fluid volume (VS/ECFV) for the whole study population, B) Significant difference in VS/ECFV between the 3 study groups, (P<0.0001). C)Frequency distribution of interdialytic weight gain (IDWG) for the whole study population corrected for ECFV, D) No significant difference in IDWG between the 3 patient groups as assessed by one way ANOVA, P=0.486

24
2.3.3. Clinical and biochemical characteristics in hypovolemic, normovolemic and hypervolemic patients
Age was not significantly different between patients. Volume status (VS) and volume status
corrected for extracellular fluid volume (VS/ECFV) were significantly different between 3
groups. Hypervolemic patients had diabetes and hypertension more frequently. Pre-HD systolic
blood pressure (Pre-HD-SBP) and diastolic blood pressure (Pre-HD-DBP) were not different
between groups; pulse pressure, however, was higher in the hypervolemic group.. Plasma sodium
levels were slightly but significantly lower in hypervolemic patients compared to normovolemic
patients. When the hypervolemic group was divided further into two groups; patients with mild
hypervolemia (1.1<VS<2.5L), and severe hypervolemia (VS>2.5L), incidence of edema was
higher among patients with severe hypervolemia. Also potassium level was higher (5±0.7mEq/l)
among patients with severe hypervolemia compared with patients with mild hypervolemia
(4.6±0.6mEq/l). No other clinical parameters were different between these patients.
2.3.4. Relation between interdialytic weight gain and volume overload
On testing whether a relation between IDWG and volume status existed, the data did not reveal
a correlation between IDWG and volume status both corrected for ECFV (figure 2.3.4).
Moreover, IDWG was not elevated (IDWG<7% of ECFV) in all hypervolemic patients, but was
also elevated (IDWG>7% of ECFV) in a subset of the normovolemic and hypovolemic patients.
Altogether, IDWG was widely variable between patients regardless of their volume status (figure
2.3.2).


26
Intradialytic hypotension was found in 17% of the study population. Incidence of intradialytic
hypotension was significantly higher among hypovolemic patients (p=0.007). . Incidence of
paradoxical hypertension was high (31% of all study population). The average rise of blood
pressure was 38+15 mmHg for all patients with paradoxical hypertension. Numerically,
paradoxical hypertension appeared more frequent in hypervolemic (18% of all study population)
and normovolemic patients (14% of all study population) compared to the low frequency in
hypovolemic patients (3% of all study population), yet this was not statistically significant. The
distribution of severity of paradoxical hypertension is shown in figure 2.3.6.

27
Figure 2.3.5: Correlation between blood pressure and volume status assessed by bio-impedance
-40 -20 0 20 40 600
50
100
150
200
250
VS/ECFV%
Pre
-HD
-SB
P,m
mH
g
-40 -20 0 20 40 600
50
100
150
200
VS/ECFV%
Pre
-HD
-DB
P,m
mH
g
-40 -20 0 20 40 600
50
100
150
VS/ECFV%
Pre
-HD
-PP
,mm
Hg
A
B
C
r=0.153P=0.033
r=0.08P=0.264
r=0.124P=0.085
A) Significant correlation between volume status and pre-HD SBP, B) No significant correlation between volume status and pre-HD DBP, C) No significant correlation between volume status and pre-HD pulse pressure (Pre-HD-PP).

28
Figure 2.3.6: Frequency distribution of severity of paradoxical hypertension
20 25 30 35 40 45 50 55 60 65 70 75 80 850
5
10
15
20
SBP Diff. mmHg
Freq
uenc
y
Frequency distribution of severity of paradoxical hypertension, illustrated as rise in SBP in mmHg (post-dialysis SBP – pre-dialysis SBP), average rise of SBP from pre- to post-dialysis was 38mmHg
2.3.7. Using clinical parameters to identify volume overloaded patients
In an attempt to develop a volume overload score, we performed multiple linear regression to
identify independent predictors of volume overload. Based on univariate analysis, 9 variables
were selected for the multiple regression model (DM, HTN, edema, BMI, smoking, Pre-HD-PP,
Pre-HD-SBP, sodium, and albumin). Edema, lower BMI, higher SBP, and smoking were the
only significant predictors for volume overload, with a p-values of <0.0001, <0.0001, 0.001, and
0.037 respectively. Volume overloaded patients were 2.4 times more likely to have edema
(relative risk=2.439), 1.6 times more likely to have lower BMI, and1.5 times more likely to have
higher SBP (>140mmHg) and to be a smoker. We could not develop a volume overload score
due to the presence of very few predictors as revealed by regression analysis. Sensitivity,
specificity and positive and negative predictive values for the 4 individual parameters are shown
in table 2.3.7.

29
Table 2.3.7: Sensitivity and specificity of single clinical parameters in predicting volume overload
Criteria Relative Risk PPV NPV Sensitivity Specificity Edema 2.4 85 % 65% 47 % 92 % Lower BMI 1.6 54 % 67 % 84 % 32 % Pre-HD-SBP 1.5 60 % 60% 55 % 64 % Smoking 1.5 73 % 54 % 16 % 94 %
2.4. Discussion
In the current study, we assessed volume status and clinical parameters in a stable hemodialysis
population. First, we demonstrate that a large proportion of our HD patients are volume
overloaded (48%). Second, we describe discordance between clinical parameters that are
routinely used to assess dry weight (DW) and bio-impedance spectroscopy.
Volume overload (more than 15% relative to normal ECFV) is associated with hypertension,
dilated cardiomyopathy, heart failure and eventually with high mortality rates (61). Most
important finding was despite clinical volume management, about 50% of our patients had
volume overload (>7% of ECFV). Severe volume overload (>15% of ECFV) was observed in
23% of the study population. Previous studies using bio-impedance for quantification of volume
status reported the similar findings (50, 61, 62). Interestingly, interdialytic weight gain was not
significantly correlated to volume status assessed by bio-impedance. Among patients with high
IDWG, there are patients of whom dry weight is not set at the level of normovolemia. Others
have large intake of sodium and water, and thereby would benefit from salt restriction. This
information implies that strategies to improve volume status need to address both components of
volume regulation.

30
Volume depletion was detected in 9% of the study population. A previous study reported a
slightly lower fraction of 5% of patients with predialysis volume depletion more than 1.1L pre-
dialysis (47). Clinical characteristics of the volume depleted patients were not different from
normo- or hypervolemic patients except for the higher incidence of intradialytic hypotension.
Incidence of paradoxical hypertension was not different between patients. If one takes into
account that the volume status of the patients was assessed pre-dialysis, and several hypovolemic
patients had interdialytic weight gains of >25% of estimated optimal ECFV, with excessive UF
these patients would be severely hypovolemic post dialysis. Although several patients with
volume depletion had very substantial interdialytic weight gain, no correlation could be
established between higher interdialytic weight gain and more severe hypovolemia, others have
reported that volume depletion indeed may trigger higher IDWG (54). Recent literature suggests
that these large swings in extracellular fluid volume, perhaps even more so that volume status per
se is associated with cardiac stunning (63) and with cardiac hypertrophy (64). In one study,
reducing the interdialytic weight gain without changing the dry weight reduced ventricular
hypertrophy. Therefore, a risk might be imposed also in the volume depleted patients.
Extracellular fluid volume expansion is a major cause of hypertension in HD patients (2, 65).
One half of the hypervolemic patients in this study were hypertensive (27% of total), the other
half had normal blood pressure despite volume overload (22% of total). Twenty percent of all
patients had hypertension and were not volume overloaded. This shows that the relationship
between blood pressure and volume status is complex. Yet ECFV expansion and systolic blood
pressure were correlated, in contrast to ECFV expansion and diastolic and pulse pressure. Using
a comparable methodology, Wabel et al. analyzed the relation between blood pressure and
volume overload in 500 HD patients and developed a hydration reference plot where volume

31
overload is plotted against blood pressure (66). Volume dependent hypertension was found in
15% of patients, majority of patients (27%) were normotensive and normovolemic. Only 10% of
patients had normal blood pressure despite volume overload. Only 48% of our patients were
prescribed antihypertensive medications. Previous studies reported higher percentage up to 70%
(65). The reasons for this observation are not clear.
Paradoxical hypertension was a common complication of HD treatment in our study population
(31%). Interestingly, the incidence of paradoxical hypertension was not significantly different
between the 3 patient groups. To our knowledge, the prevalence of paradoxical hypertension and
its relation to volume status has not been assessed in a large HD population. A previous study
using similar definition of paradoxical hypertension reported prevalence of 21% among their
patients (67). They also reported that UF rate was significantly lower in patients with
paradoxical hypertension but all other parameters related to weight gain were similar between
patient groups (67). A recent study reported a decline in the incidence of paradoxical
hypertension with excessive ultrafiltration concluding that intradialytic hypertension may be a
sign of volume overload (68), however, they did not use any method to assess volume. Another
study reported that paradoxical hypertension was associated with higher hazard ratio for
mortality (69). Intradialytic hypotension occurred in 17 % of all patients. Previous studies
reported the incidence of intradialytic hypotension to be between 15-25% of HD sessions (30,
39). Hypovolemia has been shown to be the major cause for intradialytic hypotension, (41, 70)
Incidence of intradialytic hypotension was significantly higher in hypovolemic patients. .
Only 50% of hypervolemic patients had edema, the other half did not show any signs of volume
overload (hidden volume overload). A previous study reported that pedal edema correlates well
with cardiovascular risk factors and left ventricular mass but it did not reflect volume in HD

32
patients as assessed by cardiac biomarkers and echocardiography (71). Hypertension in the
present study was a poor indicator of volume overload with a low sensitivity and specificity.
Fifty percent of all patients had hypertension, however only 27% had volume overload as well.
This finding is similar to a previous study using bio-impedance for volume assessment (72). A
substantial proportion of the patients were hypertensive but normohydrated indicating that
hypertension in HD patients is not only due to volume expansion. No correlation was found
between blood pressure and volume status assessed by U/S of inferior vena cava diameter in a
previous study (73). Using a similar methodology in PD patients, multiple regression analysis
revealed that DM, higher SBP, older age, male gender, lower serum albumin, and lower BMI
were significant predictors for volume overload (74). We only found 4 significant predictors for
volume overload in our study (edema, lower BMI, higher SBP, and smoking) in hemodialysis
patients.
Our study has several limitations. First of all, the bio-impedance spectroscopy-based estimate of
extracellular fluid volume has some error. In validity studies (59) ECFV had an error of -
0.4±1.4L compared to the gold standard dilution methods, however a recent report stated that
there is no real gold standard with absolute accuracy especially in dialysis patients (22). They
found an error with both bio-impedance and dilution methods reflected by regression analysis.
Although there is an error with bio-impedance in measuring the absolute volume of ECFV, it has
been shown to be accurate in detecting fluid changes in the same patient. Also bio-impedance is
highly reproducible with interobserver and intraobserver errors of less than 2% (75). Second, the
measurement was performed once, prior to the 2nd dialysis session of the week. This could result
in over/underestimation of the issue. Third, the clinical variables we used as edema are
subjective and will depend on the observer. Also, we did not compare bio-impedance with other

33
methods like echocardiography or lung ultrasound to confirm volume assessment. Lastly, 42% of
our study population was referred by physicians for volume assessment, so they might have been
a clinical suspicion for volume overload or depletion.
In summary, using bio-impedance spectroscopy, we found that volume overload is highly
prevalent in our HD patients and hypovolemia was also not uncommon. Neither fluid overload
nor depletion could be reliably identified by clinical parameters. IDWG and BP showed wide
variability among the patients regardless of their volume state. This study indicates that bio-
impedance technology is a helpful tool beside clinical assessment to better recognize hidden
fluid overload in hemodialysis patients.

34
Chapter 3
3. Sodium profiling in hemodialysis
35
3.1. Introduction
The relatively short period of hemodialysis (HD) sessions nowadays induces acute changes in
fluid volume and sodium concentration. This led to the development of dialysis discomfort in
the form of intradialytic hypotension, muscle cramps, nausea, vomiting, and increased thirst
sensation. These intradialytic complications are mainly due to rapid changes in sodium
concentration and water shifts between the intracellular and extracellular fluid compartments
(10).
Intradialytic hypotension (IH) is a common adverse reaction that occurs in about 15-25% of HD
sessions (36-38). IH is a major clinical problem not only causing discomfort but also it increases
the patient mortality. On the other hand, some reports suggested that a mild fall in blood
pressure during HD may be advantageous compared to no changes or a rise in blood pressure
during HD (76).
The use of sodium profiling in HD has been introduced as a method to improve intradialytic
hypotension, but its use still controversial. The aim of the current review is to address the
benefits and drawbacks associated with the use of sodium profiling.
Sodium profiling means the application of a variable dialysate sodium concentration at any point
of the HD session then increasing or decreasing either gradually or abruptly sodium
concentration for the remaining of the HD session (77). Sodium profiling has shown to be very
effective in prevention of IH if it is conducted in the right way. However, many studies reported
that using sodium profiling was associated with increased plasma sodium concentration,
excessive interdialytic weight gain (IDWG), increased thirst sensation and elevated blood
pressure levels (78).

36
A literature search was undertaken using Pubmed. Since the studies were small in number, small
in sample sizes and very heterogeneous, we could not perform a systematic review and/or meta-
analysis. We included all clinical trials that used sodium profiling to compare it with
conventional hemodialysis or to compare it with other sodium profiling protocols. Search terms
were sodium profiling in hemodialysis. Exclusion criteria included abstracts, review articles,
case reports and articles published in a language other than English. Twenty four articles were
included in our review.
3.2. Sodium balance in HD patients
Sodium balance in dialysis patients is different from healthy subjects. Individuals with normal
kidney function excrete sodium and water continuously, while in dialysis patients, sodium and
water are removed mainly through dialysis (77). The excess sodium and water accumulated
during the interdialytic interval is mainly stored in the extracellular fluid compartment (77).
Therefore, plasma sodium concentration and ECFV in dialysis patients are mainly dependent on
salt and water ingestion during the interdialytic period. Sodium and water balance can be
maintained only when the patient’s salt and water intake is equal to the amount removed during
dialysis (77). As sodium moves freely across dialysis membranes, dialysate sodium levels
influence plasma sodium concentration, and in turn the resulting fluid shift between different
body compartments during HD. Therefore dialysate sodium concentration is usually chosen to
be close or equal to plasma sodium concentration. Osmotic disequilibrium may occur when
there is a large difference between plasma and dialysate sodium concentrations (79). Most of the
excess sodium is removed by convection together with excess water (ultrafiltration). Diffusive
sodium transport depends on the difference between dialysate to plasma sodium concentrations.

37
If no significant amount of sodium is gained or lost by diffusion, the dialysis treatment can be
called isonatremic. Under current HD practice, more than 80% of sodium removal is convective
and only 15-20% is diffusive (80). The aim of sodium profiling is to support plasma refilling in
order to prevent intradialytic hypotension.
3.3. Pathophysiology of intradialytic hypotension
Intradialytic hypotension (IH) is still a highly prevalent complication that occurs in up to 25% of
HD sessions (36-38). IH is associated with increased morbidity and mortality, but this may be
due to the fact that low pre-dialysis blood pressure can be a sign of pre-existing cardiac disease
(39, 40).
IH is defined as acute or gradual fall in blood pressure with accompanying clinical symptoms
that occurs during the dialysis sessions and is caused by exhaustion or failure of compensatory
mechanisms to maintain blood pressure during acute changes in ECFV. Blood pressure is the
resultant product of cardiac output (CO) and total peripheral resistance (TPR) (41). Therefore,
IH is the result of lowered CO and/ or inappropriately low TPR (41). In turn, compensatory
mechanisms to prevent IH will work by maintaining CO and/or TPR. The compensatory
mechanisms can become activated to a maximum, so that further compensation is not possible.
Alternatively, the compensation may fail, due to the pathophysiology of the ESRD patient, or
due to medications. In the next section we will analyze the pathophysiology of IH.
3.3.1. Intradialytic hypotension and cardiac output:
A drop in CO was associated with IH in 6 previous studies, of which two deserve special
attention. In the 1st study (81), 13 chronic HD patients were monitored twice during their

38
midweek session regarding intradialytic variations of blood volume and CO. Before the HD
session, BV was determined by Evans blue dilution method. Changes in BV were continuously
monitored by means of an optical monitor. Monitoring of CO was carried out every 30 minutes
by means of impedance cardiography and by the echocardiography. A weak correlation between
variation in BV and intradialytic BP changes was found. The percent change of BV did not
predict the onset of IH. Refilling rate increased significantly when BP decreased.
In the 2nd study (82), 48 HD patients were divided into unstable group (n=18) and stable group
(n=30) depending on the frequency of IH. Continuous non-invasive cardiac monitoring
(Physioflow) was done 30 minutes before, during and 30 minutes after a regular dialysis session.
Patients in the unstable group had higher incidence of ischemic heart disease (IHD) and were
using more beta blockers and calcium channel blockers than in the stable group. Changes in the
filling index, cardiac output, ejection fraction and systemic vascular resistance during dialysis
were not significantly different between the two groups. Within the unstable group, 2 subgroups
were distinguished: one group with decreased CO (n=11) and higher TPR, the other group with
stable CO (n=7) and reduced TPR. This may represent 2 separate groups of patients with
different pathophysiologic mechanisms of IH, such as increased vascular resistance associated
with a failing or ischemic heart, or vasodilatation due to autonomic dysfunction and inefficient
compensatory vasoconstriction.
3.3.2. Intradialytic hypotension and heart rate variability
During UF, CO and SV decrease and MAP is maintained through an increase in heart rate.
Increase in heart rate was previously observed in HD (83, 84). The greatest increase in heart rate
was observed in hypotension prone patients with impaired baroreflex sensitivity (84). Baroreflex
39
sensitivity was impaired only in hypotension prone patients in 2 studies (83, 85), while it was
impaired in a hypotension prone and hypotension resistant patients in another study (84).
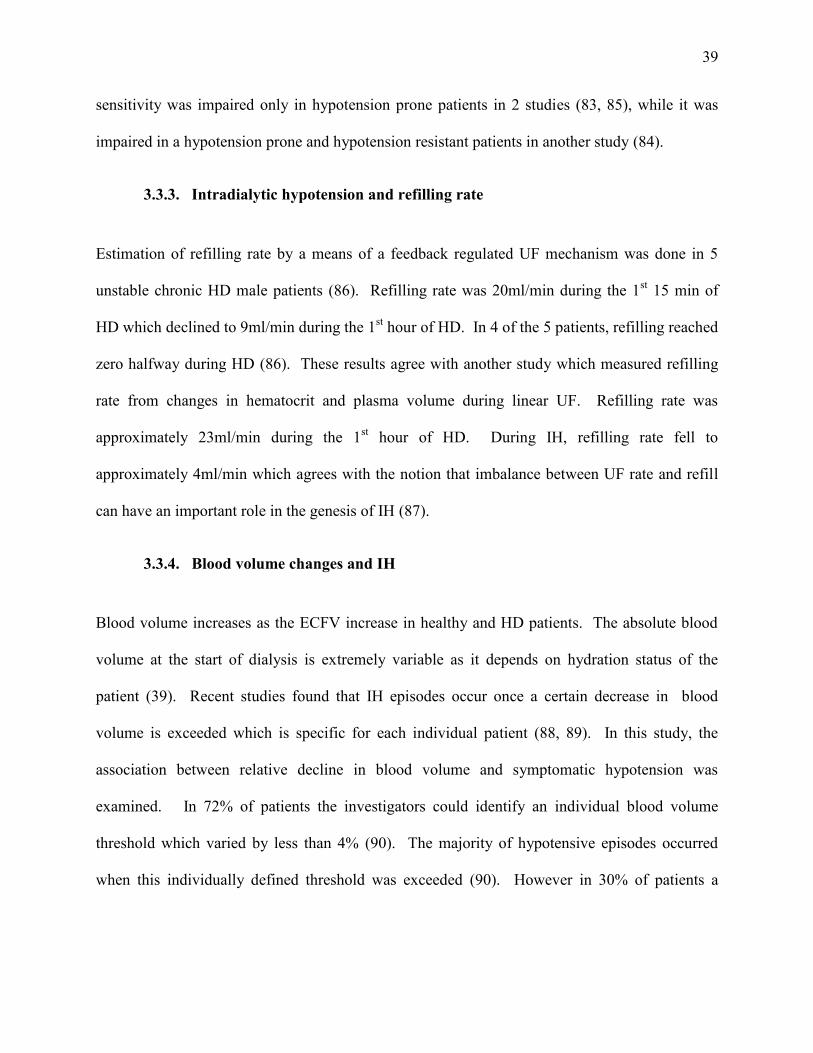
3.3.3. Intradialytic hypotension and refilling rate
Estimation of refilling rate by a means of a feedback regulated UF mechanism was done in 5
unstable chronic HD male patients (86). Refilling rate was 20ml/min during the 1st 15 min of
HD which declined to 9ml/min during the 1st hour of HD. In 4 of the 5 patients, refilling reached
zero halfway during HD (86). These results agree with another study which measured refilling
rate from changes in hematocrit and plasma volume during linear UF. Refilling rate was
approximately 23ml/min during the 1st hour of HD. During IH, refilling rate fell to
approximately 4ml/min which agrees with the notion that imbalance between UF rate and refill
can have an important role in the genesis of IH (87).
3.3.4. Blood volume changes and IH
Blood volume increases as the ECFV increase in healthy and HD patients. The absolute blood
volume at the start of dialysis is extremely variable as it depends on hydration status of the
patient (39). Recent studies found that IH episodes occur once a certain decrease in blood
volume is exceeded which is specific for each individual patient (88, 89). In this study, the
association between relative decline in blood volume and symptomatic hypotension was
examined. In 72% of patients the investigators could identify an individual blood volume
threshold which varied by less than 4% (90). The majority of hypotensive episodes occurred
when this individually defined threshold was exceeded (90). However in 30% of patients a

40
critical threshold couldn’t be identified (90). This blood volume threshold could not be
identified in other studies (81).
During HD, the ultra-filtrated volume will be withdrawn from the intravascular compartment. A
fluid shift from the overhydrated interstituim towards this compartment forms the only
compensatory mechanism to overcome or diminish hypovolemia (91). Previous reports have
shown that conventional hemodialysis causes a transcellular fluid shift from the ECFV to the
(intracellular fluid volume) ICFV compartment (91). Consequently the refill of the intravascular
compartment might be diminished since the amount of the ECFV available for the compensatory
process decreases (91). It was demonstrated that the use of dialysate with high sodium
concentration could remove fluid from the ECFV as well as from the ICFV compartments by
inducing a transcellular fluid shift in the opposite direction (91). A significant correlation
between the change in ICFV and the ratio post-dialysis: pre-dialysis serum sodium concentration
was found. The greater the latter ratio, the more the observed ICFV decreased (91).


42
using high dialysate sodium concentration led to contraction in intracellular compartment and
was significantly correlated with changes in intracellular fluid volume (91, 92). A previous
report stated that, at a given difference between dialysate and plasma sodium concentrations of
5mmol/L, the diffusive sodium transport was about 10gm during 5 hours of dialysis (94).
Another study reported that an hourly variation of dialysate sodium concentration between 160-
140mmol/L, led to increase in plasma sodium concentration from 140-152mmol/L without UF
(79). This is equivalent to ingestion of about 25g of sodium chloride to the patient (79).
3.4.2. Secondary responses to increased plasma sodium concentration:
3.4.2.1. ADH changes during hemodialysis
In hemodialysis patients, vasopressin clearance rate may be lowered which would lead to
increased vasopressin levels (95). However, vasopressin levels typically falls during
hemodialysis despite volume removal. Autonomic dysfunction which is very common among
HD patients and a fall in osmolality are thought to be the cause for the fall in plasma vasopressin
level (96-98). Vasopressin secretion is closely related to changes in plasma osmolality (95, 96,
99). In a previous study, infusion of hypertonic saline enhanced vasopressin release in HD
patients suggesting the role of vasopressin in intradialytic hypotension (99). Evidence that
vasopressin deficiency contributes to intradialytic hypotension is that administration of
exogenous vasopressin prevented drop in blood pressure during hemodialysis in patients with
autonomic dysfunction (100).
In other studies, there was no change in vasopressin levels in response to pressure/volume
stimuli until significant hypotension or hypovolemia occurred (101, 102). Vasopressin also
plays a role in salt-sensitive hypertension in animals and in man with volume mediated

43
hypertension including end stage renal disease patients, the administration of V1a receptor
antagonist significantly lowered blood pressure in these patients (103, 104).
Using sodium profiling and other therapies to support blood pressure during hemodialysis were
traditionally thought to stabilize blood pressure by affecting plasma refilling rate. There is also
an evidence that vasopressin may play a role in their efficacy. As during sodium profiling, the
fall in serum osmolality and plasma vasopressin level will be prevented (105). This finding
suggests that preventing the fall in vasopressin level during dialysis results in part from changes
in osmolality and the blood pressure stabilizing effects of therapies such as sodium profiling
(106). There is some evidence that sodium profiling raises plasma osmolality and plasma
vasopressin levels which preserves blood pressure during hemodialysis.
3.4.2.2. Thirst sensation
Increased plasma sodium concentration will increase plasma osmolality, and vasopressin levels,
which in turn will increase thirst sensation (107). Increased thirst sensation was associated with
higher IDWG (108). Sodium profiling was compared to standard HD in 4 studies, two of them
(109, 110) found higher IDWG and increased thirst sensation with sodium profiling compared to
standard HD, while the other 2 studies found no difference in IDWG and thirst between 2
treatment modalities (111, 112). Data in subjects with normal renal function show that the
relationship between thirst and plasma osmolality (sodium setpoint) varies from person to person
but quite constant in the same individual (113).
3.4.2.3. Effect of sodium load on vascular endothelium

44
High plasma sodium concentration was associated with endothelial cell stiffness in the presence
of aldosterone. Absence of aldosterone in culture medium (unphysiological conditions) or
treatment with sodium channel blocker (amiloride) prevented this effect (114). High plasma
sodium concentration was also associated with down regulation of nitric oxide release. In the
absence of aldosterone, cells were insensitive to changes in plasma sodium concentration (114).
Acute increase in plasma sodium concentration within narrow range (135-145mmol/L) can alter
the mechanical properties of the vascular endothelium (115). In cultured human endothelial
cells, cell stiffness increased by 20% in a few minutes of raising plasma sodium concentration
from 135 to 145mmol/L. This was associated with reduction in nitric oxide and endothelial
nitric oxide synthase activity, suggesting a functional link between nitric oxide metabolism and
plasma sodium concentration (114).
3.5. Effect of plasma sodium concentration on blood pressure
Sodium balance is the cornerstone of good interdialytic blood pressure control (45). Although
sodium balance in dialysis patients is determined by several factors, changes in dialysate sodium
concentration have an immediate and major effect on plasma sodium (116). Numerous studies
have demonstrated that lower sodium dialysate (117, 118), particularly in combination with a
low dietary sodium intake (119, 120), reduces interdialytic weight gain, improves blood pressure
control, decreases the severity of interdialytic symptoms and decreases cardiac volume loading.
Furthermore, gradual decrease of dialysate sodium concentration doesn’t increase the frequency
of substantive hypotension, headache, nausea, and vomiting or dialysis morbidity (121). The
mechanisms whereby plasma sodium directly affects blood pressure are not fully understood.

45
There is compelling evidence demonstrating that dietary salt intake has major effect on blood
pressure regulation. Clinical trials on hypertensive and normotensive individuals has shown that
an increase or decrease in salt intake causes parallel changes in plasma sodium, and the change
in plasma sodium was weakly but significantly correlated with changes in systolic blood pressure
(122). Several epidemiological studies in the general population have shown a positive
association between plasma sodium and blood pressure on the individuals’ usual diet (123, 124).
It has been shown that a meal containing salt has immediate and significant effect on plasma
sodium levels (122). To further study the relationship between plasma sodium and blood
pressure, a retrospective audit was carried out (122). Univariate analysis of their data showed
significant relation between plasma sodium and both systolic and diastolic blood pressure. An
increase of 1 mmol of plasma sodium was associated with an increase of 0.53 mmHg in systolic
and 0.30 mmHg in diastolic blood pressure (122).
3.6. Effect of sodium profiling on compensatory mechanisms
The effect of sodium profiling on hemodynamic parameters has been studied previously. CO
and SV as measured by Echocardiogram in 8 HD patients for 10 sessions duration for each
protocol were more stable during sodium profiling than during standard HD (125). Intradialytic
cardiovascular stability improved during profiled HD as compared to constant HD as measured
by Echo before, during and after one HD session for each protocol in 20 HD patients with
frequent IH episodes (126). Another study also reported that CO and SV improved during
profiled HD compared to constant HD with quicker post dialysis return to basal conditions as
measured by Echo in 12 unstable HD patients (127).

46
Using dialysate sodium concentration higher than plasma sodium concentration reduces the
osmolar water shift leading to increased refilling rate as compared to conventional HD (86). In a
previous study, the effect of cool dialysate and sodium profiling on refilling rate was compared
in 6 stable HD patients. Sodium profiling but not cool dialysate increased refilling rate
significantly from baseline (86). Another study evaluated the effect of 3 different profiles on 15
stable HD patients. The 1st profile had constant UF rate with constant dialysate sodium
concentration, the 2nd with dialysate sodium profiling with constant UF rate, the 3rd profile with
combined UF and dialysate sodium profiling. Total UF volume was the same for all treatments.
Better preservation of BV was reported with the high sodium treatment which could be explained
by improved refilling during sodium profiling treatments (91).
Changes in erythrocyte volume are mainly due to changes in water content of the cell leading to
changes in MCV. In a previous study, changes in erythrocyte volume during HD were tested
through measuring packed cell volume in 5 patients dialyzing with high, low and normal
dialysate sodium concentrations for 2 hours each (128). Erythrocyte water content decreased
with high and increased with low dialysate sodium concentration (128). Erythrocyte volume
calculated from MCHC decreased with high and increased with low dialysate sodium
concentration (128). Erythrocyte volume correlated with changes in plasma sodium
concentrations (128).

48
negative sodium balance and isonatremic sodium balance. Isonatremic (neutral) sodium balance
is the ideal form of sodium profiling. There is a wide variety of sodium profiles with a very wide
range in the dialysate sodium level used extending from 190mEq/L to 130mEq/L (77).
Decreasing sodium profiles were the most commonly employed, it takes the advantage of high
dialysate sodium concentration at the beginning of dialysis when ultrafiltration is best tolerated.
This method has been shown to improve IDWG, thirst, hypotension and disequilibrium
syndrome (44). Alternating sodium profiles improves disequilibrium syndrome by preserving
the plasma volume through induction of alternating fluid shift across the cellular membrane to
improve the transport of uremic toxins (44). Increasing sodium profiles are less commonly used,
they are used to preserve the plasma volume during the last period of dialysis allowing a lower
incidence of cramps compared to constant or decreasing profiles, probably because of reduced
sodium removal (44). Combining UF profiling with sodium profiling may enhance the effect of
sodium profiling.
3.7.1. Sodium positive profiling
The results from 24 previous studies are cited in table 2. A wide variety of sodium profiles have
been used. Decreasing sodium profiles were mostly employed. The effects of linear, stepwise
and exponential profiles had been also compared in some studies. Early intradialytic
hypotension and post-dialysis hypotension were best reduced by decreasing stepwise profiles
(111). Muscle cramps and late intradialytic hypotension were best reduced by decreasing linear
sodium profiles (111). Sodium profiling was found to be beneficial in young adults (111) and
geriatric patients (37).

49
Independent of the sodium profiling protocol used, 16 of these studies showed a reduced
incidence of intradialytic hypotension with sodium profiling. Another 2 studies showed a
reduced incidence of muscle cramps but not hypotension during dialysis (111, 130). Better
cardiovascular stability through more stable blood volume was shown in 5 studies (37, 86, 125,
131, 132).
Regarding the possibility of sodium accumulation with the use of sodium profiling, it is worth
noting that there was no follow up for pre or post-dialysis plasma sodium levels in 9 studies.
Clinical or laboratory signs of sodium accumulation were found in 8 studies but not in another 7
studies. Some studies found that sodium profiling is beneficial for the majority of their patients
(37, 111), while others found it to be beneficial for a small group of their patients (109). Some
of these studies were very brief being only one session to test for each sodium profiling protocol.
Accordingly most of them only focus on short term effects except in few studies where the
duration was longer. One of the long term studies lasted for one year (78) , they found that
sodium profiling was useful to alleviate intradialytic symptoms but was associated with
increased thirst sensation, IDWG, and increased plasma sodium concentration. The only
weakness of this study (78) is there small sample size (20 patients), and only 9 patients in the
treatment group (profiled HD). Another study by Flanigan et al. (133) compared standard HD to
exponential decreasing sodium profiling (3.5 months for each treatment protocol). Incidence of
hypotension did not decrease with sodium profiling, also IDWG did not increase.
Regarding sodium balance neutral sodium profiling, a study by Song et al. (134) compared 8
different sodium profiling protocols. They found that sodium neutral balance sodium profiling
plus UF profiling decreased incidence of intradialytic hypotension and was not associated with
increase in IDWG or sodium accumulation. In another study (135), they concluded that using

50
sodium balance neutral sodium profiling failed to decrease intradialytic symptoms even when
combined with UF profiling.

51
Table 3.7: Clinical results of sodium profiling
Reference N Duration Sodium protocols IH Muscle
cramps
IDWG Thirst BP Plasma
Na
BV Refilling
rate
1-(43) Prospective study
14 10 sessions each
1-Constant (139mmol/L)+constant UF rate 2-Linear profile (147 to 131 mmol/L)+UF profile 3-Linear profile (147 to 131 mmol/L) + constant UF rate
Not N/A N/A N/A N/A
2(136) Randomized crossover study
22 12 sessions each
1- Standard HD (139 mmol/L). 2- Profiling HD (from 147 to138 mmol/L) either stepwise or linear.
with linear profile
Not N/A with linear profile
N/A N/A N/A
3-(86)
6 1 session each
1- Exponential profile (150 to 140mmol/L) 2- Cool dialysate 1˚C below core body temperature.
N/A N/A N/A N/A N/A More stable
4-(78) Randomized controlled trail
20 One year 1- Standard HD (140mmol/L) 2- Linear decreasing profile (144 to 140mmol/L)
Not N/A N/A N/A
5-(38) 14 12 sessions 1-Standard HD (139mmol/L). 2-Linear profile (147mmol/L to 139mmol/L).
Not N/A N/A N/A N/A
6-(42) Non randomized cross over study
13 4 weeks each
1- Standard HD (135-140mmol/L) 2- Linear profile (150 to 140mmol/L).
N/A Not N/A N/A

52
Reference N Duration Sodium protocols IH Muscle cramps
IDWG Thirst BP Plasma Na
BV Refilling rate
7-(125) Randomized cross over controlled trial
8 10 sessions each
1- Standard HD (138mmol/L) + constant UF 2- Linear profile (148 to 131mol/L) + constant UF 3- Linear UF profile + constant dialysate sodium (138mmol/L) 4-Sodium + UF profiling
with Na+UF profile
N/A with Na+UF profile
N/A N/A Not More stable (Na+ UF
profile
N/A
8-(134) Prospective study
11 33 sessions each
1- Conventional HD 2-Sodium balance positive step down profiling (PS) 3-Sodium down neutral step down profiling (NS) 4-Sodium balance neutral alternating profiling (NA) 5- UF profiling only (UFP) 6- PS+UFP 7- NS+UFP 8- NA+UFP
N/A with PS,
PS+UFP
N/A N/A N/A
9- (137) Prospective study
40 6 weeks 1- Profiled HD (146 to 138mmol/L) + UF profiling.
Not N/A Not N/A N/A N/A
10- (138) Single blind cross over study
27 9 sessions each
1- Standard HD (138mmol/L) 2-Individualized dialysate sodium concentration according to the mean pre-HD plasma sodium multiplied by the Donnan coefficient (0.95).
N/A N/A N/A N/A N/A N/A
11-(129) Cross over non-randomized trial
11 1- Standard HD (138mmol/L). 2- Profiled HD (145 to 135mmol/L, with TAC140). 3- Profiled HD, (158 to 130, with TAC147). Depending on the TAC, they designed the final Na to be the lowest during the highest TAC and highest during lower TAC.
N/A N/A N/A N/A

53
Reference N duration Sodium protocols IH Muscle cramps
IDWG Thirst BP Plasma Na
BV Refilling rate
12-(135) Randomized cross over study
9 3 months 1- Linear profile (145 to 133mmol/L) with linear UF profiling. 2- Stepwise UF profile with/without stepwise sodium profile (145 to 133mmol/L)
Not Not N/A N/A N/A No change
N/A
13(139) Randomized controlled cross over study
32 4 weeks 1- Standard HD (142mmol/L), constant UF 2-Exponential profile (152 to 142mmol/L) + exponential UF profile.
Not N/A More stable
N/A
14-(131) Non-randomized controlled cross over study
11 2 HD sessions
1- standard HD (138-144mmol/L) 2- Profiled HD (they used a mathematical model to determine the profile for each patient according to plasma sodium concentration and desired sodium balance)
N/A Not Not Not Not More stable
N/A
15-(109) Randomized cross over controlled trial
23 2 weeks each
1- Standard HD (140mmol/L) 2- Linear profile (155 to 140mmol/L) 3- Stepwise profile (155 to 140mmol/L)
N/A N/A
16-(133) Randomized cross over trial
18 7 months 1- Standard HD (140mmol/L) 2-Exponential profile (155 to 135mmol/L)
Not N/A Not N/A N/A N/A N/A N/A
17-(132) 10 3 HD sessions
1- Standard HD ( 141mmol/L) 2-Decreasing profile (160 to 133mmol/L) 3-Increasing profile (133 to 160mmol/L)
N/A N/A Not Not Not Not More stable (decreasing profile)
N/A
18-(44) 16 4 months 1-Standard HD 2-Biofeedback technique to individualized dialysate sodium concentration according to the patients plasma sodium
Not Not Not Not N/A N/A

54
Reference N Duration Sodium protocols IH Muscle
cramps IDWG Thirst BP Plasma
Na BV Refilling
rate 19-(37) Randomized crossover
10 1 session each
1-Linear profile (160 to 140mmol/L) 2-Stepwise profile(160 to 140mmol//L) 3- Standard HD (150mmol/L) + constant UF 4- Standard HD (140mmol/L) + constant UF
N/A N/A N/A N/A N/A More stable
N/A
20-(130) Randomized cross over double blinded
16 3 weeks 1- Standard HD (140mmol/L) 2- Stepwise profile (155-160 to 140mmol/L for the last hour of HD)
Not Not N/A N/A N/A
21-(140) Double blind cross over trial
22 7 sessions each
1-Standard HD (137mmol/L) + constant UF 2- Linear profile (from137 to 128mmol/L) + UF profiling
N/A Not N/A N/A N/A
22-(111) Randomized cross over trial
16 8 weeks 1- Standard HD (138mmol/L) 2- Linear (148-138mmol/L) 3- Stepwise (148-138mmol/L) 4- Exponential (148-138mmol/L)
N/A with linear,
stepwise profiles
N/A
N/A
N/A
N/A N/A
23-(141) 39 9 weeks 1- Standard HD (140mmol/L) 2- Stepwise profile (starting from 149mmol/L) 3- Linear profile (starting from 149mmol/L) 4-Exponential profile(starting from 149mmol/L)
Not Not Not N/A N/A
24- (142) Non-randomized cross over trial
15 1 session each
1- Standard HD (140mmol/L) 2-Stepwise profile (140 to 148mmol/L)+ constant UF rate 3- Stepwise profiling as above + UF profiling
N/A N/A N/A N/A N/A

55
3.7.2. Sodium neutral profiling and sodium setpoint
Pre-dialysis plasma sodium concentration (PNa) can be regarded as the sodium setpoint. By the
end of dialysis PNa approaches the prescribed dialysate sodium concentration (DNa), therefore
the difference between DNa and PNa can be considered as the sodium gradient (143). As a
consequence of positive or negative sodium gradient, patients either experience sodium loss or
gain (144). Most recent data demonstrate that HD patients have a fixed osmolar setpoint above
which thirst sensation will develop (145-147). Higher sodium gradient was associated with
greater interdialytic weigh gain (IDWG) (143). However, individualized DNa levels have been
recommended (144, 147, 148) , there is no available data about its long term effects.
Plasma water sodium concentration is 7% greater than total plasma sodium concentration
because of the volume occupied by plasma proteins (77). Roughly cancelling this is the
negatively charged proteins mainly albumin which cause a small electrical potential difference
across the membrane that retards the movement of positively charged sodium ions (Donnan
effect) (149).
There are a few studies regarding sodium neutral balance sodium profiling. One of these studies
evaluated the relationship between IDWG and 3 different dialysate sodium concentrations,
including standard dialysate sodium concentration of 138mmol/L, dialysate sodium equal to the
mean pre-dialysis plasma sodium concentrations, and individualized dialysate sodium
concentration (0.95 X mean pre-dialysis plasma sodium to account for Gibbs-Donnan effect)
(138). They observed similar pre-dialysis plasma sodium concentrations during the 3 treatments,
and a decrease in IDWG and thirst sensation with individualized dialysate sodium compared to
standard dialysate sodium concentration. Song et al. used 8 different sodium profiling protocols

56
for 6 weeks each and they found that sodium neutral profiling with UF profiling was very useful
for their patients without reporting increased thirst or any other interdialytic side effects (134).
Other studies could not demonstrate the same beneficial effects of sodium neutral balance
sodium profiling (135).
3.7.3. Sodium and ultrafiltration profiling
Frequently, sodium profiles combine a variable dialysate sodium concentration during a dialysis
session with a variable UF rate. High dialysate sodium concentration is recommended in
combination with high UF rates (and vice versa), an approach that optimizes plasma refilling
when UF induced plasma volume reductions are the highest (139). Ultrafiltration profiling has
been shown to be successful in alleviating intradialytic hypotension without carrying the risk of
high post-dialysis plasma sodium concentration. Evidence of blood pressure stabilizing effect of
ultrafiltration profiling alone and in combination with sodium profiling has already been shown
(150, 151), but long term benefits of profiled dialysis have yet to be identified. Two studies
compared UF profiling with constant UF rate, one of them (152) found no effect on thirst or
IDWG between 2 treatments, the other study (112) reported increased thirst with constant UF.
Combined ultrafiltration and sodium profiling may be a further step toward an optimal,
individualized dialysis therapy, especially for hypotension prone patients. Both profiles have to
be chosen for the individual patient according to patient’s plasma sodium concentration. Both
intradialytic and interdialytic symptoms must be taken into account. Combined sodium and
ultrafiltration profiling should be used as a method to reduce intradialytic morbidity while
avoiding sodium accumulation in HD patients. The introduction of an online continuous blood

57
volume monitoring has offered the opportunity of changing both the UF rate and dialysate
sodium concentration in order to maintain a constant blood volume reduction rate (153, 154).
3.8. Conclusion
Studies of sodium profiling published to date have some weak points. First, most studies had
small number of patients with short duration with no long term follow up. Second, most of the
studies used high sodium profiles which added sodium by diffusion. Thus they increase plasma
sodium concentration which may explain the reported short term benefits (91, 141). Also plasma
sodium concentrations were not assessed in many studies. Third, most of the studies included
unstable HD patients with more frequent hypotensive episodes; however, a special attention
should be given to these patients. Hypotensive episodes could occur in hypervolemic patients
due to high UF targets that could not be compensated by refilling, and also can occur in
hypovolemic patients due to excessive UF leading to volume depletion. Assessing volume status
of these patients before applying sodium profiling would be more helpful. Dietary sodium
restriction would be a better intervention in hypervolemic patients to decrease their IDWG and as
a result UF target. Correcting hypovolemia by accurate adjustment of DW would be better than
giving excess sodium to the patients.
In summary, sodium profiling has been shown to be effective in preventing intradialytic
hypotension, however, sodium accumulation could account for the observed short term benefits.
More studies with a large sample size and long term follow-up are needed. Evaluation of
volume status before applying sodium profiling could be better approach to alleviate intradialytic
symptoms. Using mathematical models and biofeedback techniques to individualize dialysate
sodium are very promising techniques but they need more evidence.

58

59
Chapter 4
4. Overall discussion
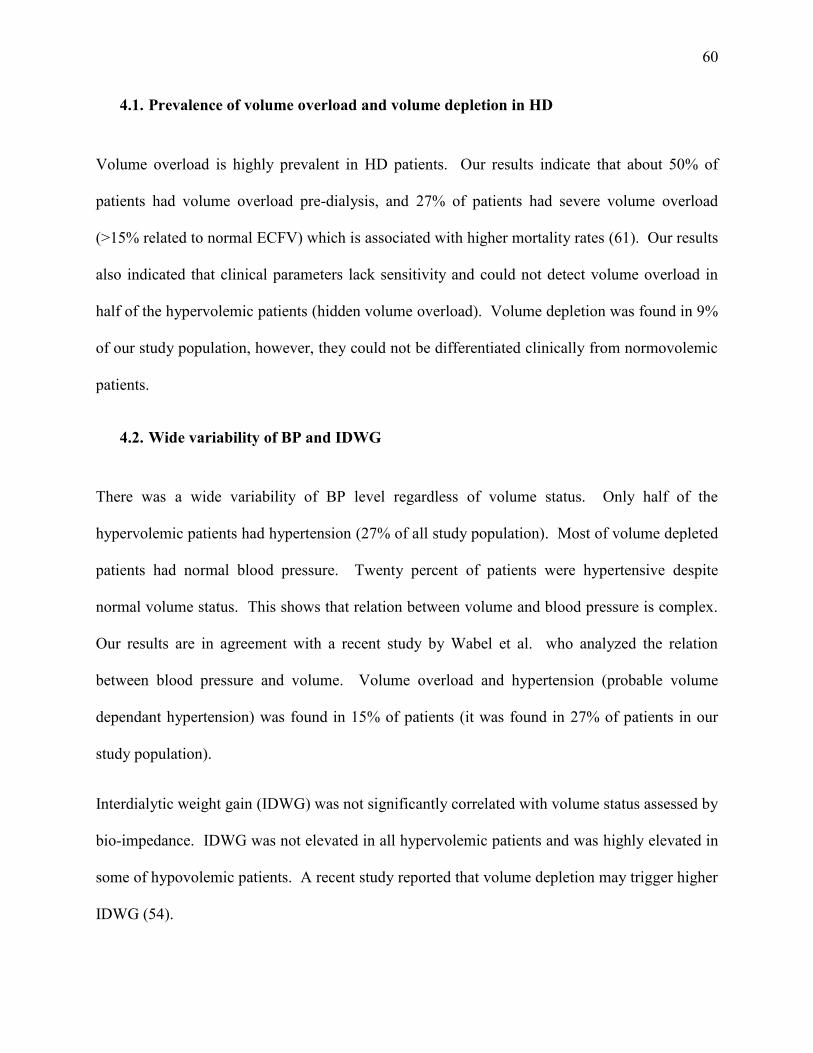
60
4.1. Prevalence of volume overload and volume depletion in HD
Volume overload is highly prevalent in HD patients. Our results indicate that about 50% of
patients had volume overload pre-dialysis, and 27% of patients had severe volume overload
(>15% related to normal ECFV) which is associated with higher mortality rates (61). Our results
also indicated that clinical parameters lack sensitivity and could not detect volume overload in
half of the hypervolemic patients (hidden volume overload). Volume depletion was found in 9%
of our study population, however, they could not be differentiated clinically from normovolemic
patients.
4.2. Wide variability of BP and IDWG
There was a wide variability of BP level regardless of volume status. Only half of the
hypervolemic patients had hypertension (27% of all study population). Most of volume depleted
patients had normal blood pressure. Twenty percent of patients were hypertensive despite
normal volume status. This shows that relation between volume and blood pressure is complex.
Our results are in agreement with a recent study by Wabel et al. who analyzed the relation
between blood pressure and volume. Volume overload and hypertension (probable volume
dependant hypertension) was found in 15% of patients (it was found in 27% of patients in our
study population).
Interdialytic weight gain (IDWG) was not significantly correlated with volume status assessed by
bio-impedance. IDWG was not elevated in all hypervolemic patients and was highly elevated in
some of hypovolemic patients. A recent study reported that volume depletion may trigger higher
IDWG (54).

61
4.3. Incidence of intradialytic hypotension and paradoxical hypertension
However intradialytic hypotension is a common intradialytic complication that occur in about
15-25% of dialysis sessions (36-38), incidence of intradialytic hypotension was 17% in our study
population.
There is no widely accepted definition for paradoxical hypertension. In fact there is not even a
widely acceptable level of blood pressure which is required to meet the definition of paradoxical
hypertension (155). Few definitions had emerged from clinical studies, and include the
following: any increase in mean arterial pressure (MAP) of 15mmHg or more during or
immediately after HD (156). An increase in blood pressure during dialysis that is resistant to
ultrafiltration (157). An increase in SBP of more than 10mmHg during or immediately after HD
(67). It has been shown that every 10mmHg increase in SBP after dialysis is associated with a
6% increased hazard of death (69). Due to lack of a common definition, the prevalence of
paradoxical hypertension is widely variable in the literature. Incidence of paradoxical
hypertension was 31% in our study population. The incidence was not different among the
hypo/normo/hypervolemic patients. A previous study reported a slightly lower incidence of 21%
(67), however, they followed up with patients for a longer duration, while in our study, we only
assessed patients during one dialysis session.

62
4.4. Sodium profiling
We assessed volume status using bio-impedance spectroscopy in 200 HD patients. Pre-dialysis
plasma sodium levels obtained from the most recently blood work varied widely between
patients in our cohort (figure 4.4). Mean plasma sodium concentration was 136mmol/L.
Dialysate sodium concentration was set to 137mmol/L for most of the patients. Using the same
constant dialysate sodium concentration for most of the patients without considering their pre-
dialysis plasma sodium level will lead to sodium gain in some patients and sodium loss in others.
Even with the use of the same sodium profiling protocol without considering plasma sodium
concentration, this will lead to either sodium gain or loss. As mentioned previously
individualized dialysate sodium profiling is the best way to alleviate intradialytic complications
without increasing interdialytic side effects. Assessment of volume status before using sodium
profiling will prevent undesirable side effects of sodium profiling. Using sodium profiling in
volume overloaded patients may lead to sodium gain. Also using sodium profiling in volume
depleted patients is like treating intradialytic hypotension by saline infusion, instead of
decreasing UF target.

63
Figure 4.4: Plasma sodium level for the study population
128 130 132 134 136 138 140 142 1440
10
20
30
40 Mean=136SD=3.2n=192
Plasma Na,mmol/L
Freq
uenc
y
Frequency distribution of plasma sodium levels for 192 HD patients, obtained from their monthly blood work. Mean plasma sodium level was 136mmol/L
4.5. Multifactorial intervention to improve volume and blood pressure control in HD patients
In an attempt to provide a multifactorial approach (DW adjustment, dietary sodium restriction,
sodium profiling and cold dialysate) to control volume overload in our patients using bio-
impedance for volume assessment. We realized that blinding will not be possible as after
assessing the volume status, both the patient and the treating physician are curious to know the
results and start correcting volume status immediately mainly through adjusting dry weight
according to the measurement. Our plan was to include all volume overloaded patients as
assessed by bio-impedance. We would have a control period for 6 weeks without any
intervention and then an intervention period (dietary sodium restriction, DW adjustment, sodium
profiling, and cool dialysate). We found that providing patients and physicians with the volume
status information is an intervention per se. We could not have a control period as physicians
64
started correcting patients immediately mainly by adjusting their DW according to the BCM
measurements. Physicians even requested repeating the measurements for some patients when
clinically indicated or just for follow up. Our aims were to provide better volume control and
assess the effect of volume control on blood pressure and cardiovascular outcome. We were not
able to continue the study due to the above mentioned reasons, however, we are interested to re-
evaluate these patients after a period of time to evaluate effectiveness of volume assessment
using bio-impedance.

65
Chapter 5
5. Future directions
66
5.1. Volume management protocol
Towards volume control protocol, we developed a multifactorial intervention for volume control.
This intervention failed as a study as we could not have a control period followed by an
intervention period to compare with; however, it would be useful as a volume management
protocol for volume overloaded patients. Our protocol includes dry weight assessment and
adjustment through regular bio-impedance measurements every 4-6 weeks, and dietary sodium
restriction of 2g/day. Gradual adjustment of DW will be done according to bio-impedance
assessment (figure 5.1). Dietary sodium restriction will be done through educational tools about
sodium intake and food labels, feedback about sodium intake will be given to the patients
through their interdialytic weight gains. For patients with frequent IH, sodium profiling and /or
cold dialysate will be used. We will use a linear sodium profiling starting with 4mmol/L above
the average of pre-dialysis plasma sodium concentration for 4 previous HD sessions and ending
by 4mmol/L below this average. Patients will be followed up by bio-impedance measurements
for continuous volume assessment. Blood pressure will be assessed for each dialysis session to
determine the effect of volume control on blood pressure.


68
5.3. Volume depletion and myocardial stunning
It is widely known that cardiovascular disease is the major cause of death in HD patients (158).
It has long been suspected that myocardial ischemia may be precipitated by HD. HD treatments
exert significant hemodynamic effects and are even complicated by episodes of intradialytic
hypotension (159). Repeated episodes of myocardial ischemia are associated with irreversible
loss of contractile function (160). A previous study reported that myocardial stunning was
detected in 64% of their patients, and that myocardial stunning was associated with increased
relative mortality after 12 months follow up (161). There is evidence that subclinical ischemia is
precipitated by HD. Episodes of ischemia may have a potential role in the development of heart
failure, and as a trigger for arrhythmias (162). Therefore reducing the impact of dialysis on the
cardiovascular system would be a desirable therapeutic target (162). More understanding of
myocardial stunning would provide methods to reduce cardiovascular mortality in HD patients
(161). We would like to determine the prevalence of myocardial stunning in a subgroup of HD
patients. We would also like to combine it with volume assessment to determine the effect of
volume status on myocardial blood flow.

69
References
1. Guyton AC. The relationship of cardiac output and arterial pressure control. Circulation. 1981 Dec;64(6):1079-88.
2. Braam B, Jindal K, Mees EJD. Hypertension and cardiovascular aspects of dialysis treatment: Clinical management of volume control. Pabst Science Publishers; 2011.
3. Raimann J, Liu L, Tyagi S, Levin NW, Kotanko P. A fresh look at dry weight. Hemodialysis international. 2008;12(4):395-405.
4. Thomson GE, Waterhouse K, McDonald HP, Friedman EA. Hemodialysis for chronic renal failure: Clinical observations. Arch Intern Med. 1967;120(2):153-67.
5. Daugirdas JT, Blake PG, Ing TS. Handbook of dialysis. Lippincott Williams & Wilkins; 2007.
6. Dolgos S, Hartmann A, Bollerslev J, Vörös P, Rosivall L. The importance of body composition and dry weight assessments in patients with chronic kidney disease (review). Acta Physiol Hung. 2011;98(2):105-16.
7. Badgett RG, Lucey CR, Mulrow CD. Can the clinical examination diagnose left-sided heart failure in adults? JAMA. 1997;277(21):1712-9.
8. Chung H, Kluge R, Schrier RW, Anderson RJ. Clinical assessment of extracellular fluid volume in hyponatremia. Am J Med. 1987;83(5):905-8.
9. McGee S, Abernethy III WB, Simel DL. Is this patient hypovolemic? JAMA. 1999;281(11):1022-9.
10. Ishibe S, Peixoto AJ. Methods of assessment of volume status and intercompartmental fluid shifts in hemodialysis patients: Implications in clinical practice. Seminars in dialysis; Wiley Online Library; 2004.
11. Natori H, Tamaki S, Kira S. Ultrasonographic evaluation of ventilatory effect on inferior vena caval configuration. Am Rev Respir Dis. 1979 Aug;120(2):421-7.
12. Mandelbaum A, Ritz E. Vena cava diameter measurement for estimation of dry weight in haemodialysis patients. Nephrol Dial Transplant. 1996;11 Suppl 2:24-7.
13. Dou Y, Zhu F, Kotanko P. Assessment of extracellular fluid volume and fluid status in hemodialysis patients: Current status and technical advances. Seminars in dialysis; Wiley Online Library; 2012.

70
14. Koomans HA, Geers AB, Mees ED. Plasma volume recovery after ultrafiltration in patients with chronic renal failure. Kidney Int. 1984;26(6):848-54.
15. Leypoldt JK, Cheung AK, Steuer RR, Harris DH, Conis JM. Determination of circulating blood volume by continuously monitoring hematocrit during hemodialysis. J Am Soc Nephrol. 1995 Aug;6(2):214-9.
16. De Vries J, Kouw PM, Van der Meer, Nardo J M, Olthof CG, Oe LP, Donker A, et al. Non-invasive monitoring of blood volume during hemodialysis: Its relation with post-dialytic dry weight. Kidney Int. 1993;44:851-.
17. Santoro A, Mancini E, Basile C, Amoroso L, Di Giulio S, Usberti M, et al. Blood volume controlled hemodialysis in hypotension-prone patients: A randomized, multicenter controlled trial. Kidney Int. 2002;62(3):1034-45.
18. Jaffrin MY. Body composition determination by bioimpedance: An update. Curr Opin Clin Nutr Metab Care. 2009 Sep;12(5):482-6.
19. De Lorenzo A, Andreoli A, Matthie J, Withers P. Predicting body cell mass with bioimpedance by using theoretical methods: A technological review. J Appl Physiol (1985). 1997 May;82(5):1542-58.
20. Liu L, Long G, Ren J, Li J, Xu J, Lei J, et al. A randomized controlled trial of long term effect of BCM guided fluid management in MHD patients (BOCOMO study): Rationales and study design. BMC Nephrol. 2012 Sep 25;13:120,2369-13-120.
21. Hur E, Usta M, Toz H, Asci G, Wabel P, Kahvecioglu S, et al. Effect of fluid management guided by bioimpedance spectroscopy on cardiovascular parameters in hemodialysis patients: A randomized controlled trial. American Journal of Kidney Diseases. 2013;61(6):957-65.
22. Raimann JG, Zhu F, Wang J, Thijssen S, Kuhlmann MK, Kotanko P, et al. Comparison of fluid volume estimates in chronic hemodialysis patients by bioimpedance, direct isotopic, and dilution methods. Kidney Int. 2013.
23. Vitturi N, Dugo M, Soattin M, Simoni F, Maresca L, Zagatti R, et al. Lung ultrasound during hemodialysis: The role in the assessment of volume status. Int Urol Nephrol. 2014;46(1):169-74.
24. Jambrik Z, Monti S, Coppola V, Agricola E, Mottola G, Miniati M, et al. Usefulness of ultrasound lung comets as a nonradiologic sign of extravascular lung water. Am J Cardiol. 2004;93(10):1265-70.
25. Shaldon S. Dietary salt restriction and drug-free treatment of hypertension in ESRD patients: A largely abandoned therapy. Nephrol Dial Transplant. 2002 Jul;17(7):1163-5.
26. Charra B, Chazot C, Jean G, Hurot JM, Vanel T, Terrat JC, et al. Long 3 x 8 hr dialysis: A three-decade summary. J Nephrol. 2003 Nov-Dec;16 Suppl 7:S64-9.

71
27. Charra B. Fluid balance, dry weight, and blood pressure in dialysis. Hemodialysis International. 2007;11(1):21-31.
28. Charra B, Chazot C. The neglect of sodium restriction in dialysis patients: A short review. Hemodialysis International. 2003;7(4):342-7.
29. Telini LSR, de Carvalho Beduschi G, Caramori JCT, Castro JH, Martin LC, Barretti P. Effect of dietary sodium restriction on body water, blood pressure, and inflammation in hemodialysis patients: A prospective randomized controlled study. Int Urol Nephrol. 2014;46(1):91-7.
30. Tomson CR. Advising dialysis patients to restrict fluid intake without restricting sodium intake is not based on evidence and is a waste of time. Nephrol Dial Transplant. 2001 Aug;16(8):1538-42.
31. Fishbane S, Natke E, Maesaka JK. Role of volume overload in dialysis-refractory hypertension. American journal of kidney diseases. 1996;28(2):257-61.
32. Özkahya M, Töz H, Ünsal A, Özerkan F, Asci G, Gürgün C, et al. Treatment of hypertension in dialysis patients by ultrafiltration: Role of cardiac dilatation and time factor. American journal of kidney diseases. 1999;34(2):218-21.
33. Culleton BF, Walsh M, Klarenbach SW, Mortis G, Scott-Douglas N, Quinn RR, et al. Effect of frequent nocturnal hemodialysis vs conventional hemodialysis on left ventricular mass and quality of life: A randomized controlled trial. JAMA. 2007;298(11):1291-9.
34. London GM. THE CLINICAL EPIDEMIOLOGY OF CARDIOVASCULAR DISEASES IN CHRONIC KIDNEY DISEASE: Cardiovascular disease in chronic renal failure: Pathophysiologic aspects. Seminars in dialysis; Wiley Online Library; 2003.
35. Charra B, Calemard E, Ruffet M, Chazot C, Terrat JC, Vanel T, et al. Survival as an index of adequacy of dialysis. Kidney Int. 1992 May;41(5):1286-91.
36. Sulowicz W, Radziszewski A. Dialysis induced hypotension--a serious clinical problem in renal replacement therapy. Med Pregl. 2007;60 Suppl 2:14-20.
37. Raja RM. Sodium profiling in elderly haemodialysis patients. Nephrol Dial Transplant. 1996;11 Suppl 8:42-5.
38. MEIRA FS, POLI DE FIGUEIREDO, Carlos E, FIGUEIREDO AE. Influence of sodium profile in preventing complications during hemodialysis. Hemodialysis International. 2007;11(s3):S29-32.
39. van der Sande FM, Kooman JP, Leunissen KM. Intradialytic hypotension--new concepts on an old problem. Nephrol Dial Transplant. 2000 Nov;15(11):1746-8.

72
40. Daugirdas JT. Pathophysiology of dialysis hypotension: An update. American journal of kidney diseases. 2001;38(4):S11-7.
41. Maeda K, Fujita Y, Shinzato T, Morita H, Kobayakawa H, Takai I. Mechanism of dialysis-induced hypotension. ASAIO Journal. 1989;35(3):245-6.
42. Cheuk A, Tang C, Chan H. Sodium ramping reduces hypotension and symptoms during haemodialysis. Hong Kong Med J. 2006;12(1):10-4.
43. Hamzi AM, Asseraji M, Hassani K, Alayoud A, Abdellali B, Zajjari Y, et al. Applying sodium profile with or without ultrafiltration profile failed to show beneficial effects on the incidence of intra-dialytic hypotension in susceptible hemodilaysis patients. Arab journal of nephrology and transplantation. 2012;5(3):129-34.
44. Petitclerc T, Trombert JC, Coevoet B, Jacobs C. Electrolyte modelling: Sodium. is dialysate sodium profiling actually useful? Nephrol Dial Transplant. 1996;11 Suppl 2:35-8.
45. Locatelli F, Covic A, Chazot C, Leunissen K, Luno J, Yaqoob M. Optimal composition of the dialysate, with emphasis on its influence on blood pressure. Nephrol Dial Transplant. 2004 Apr;19(4):785-96.
46. O'Lone EL, Visser A, Finney H, Fan SL. Clinical significance of multi-frequency bioimpedance spectroscopy in peritoneal dialysis patients: Independent predictor of patient survival. Nephrol Dial Transplant. 2014 Jul;29(7):1430-7.
47. Passauer J, Petrov H, Schleser A, Leicht J, Pucalka K. Evaluation of clinical dry weight assessment in haemodialysis patients using bioimpedance spectroscopy: A cross-sectional study. Nephrol Dial Transplant. 2010 Feb;25(2):545-51.
48. Kuhlmann MK, Zhu F, Seibert E, Levin NW. Bioimpedance, dry weight and blood pressure control: New methods and consequences. Curr Opin Nephrol Hypertens. 2005;14(6):543-9.
49. Katzarski KS, Charra B, Luik AJ, Nisell J, Divino Filho JC, Leypoldt JK, et al. Fluid state and blood pressure control in patients treated with long and short haemodialysis. Nephrol Dial Transplant. 1999 Feb;14(2):369-75.
50. Ozkahya M, Ok E, Toz H, Asci G, Duman S, Basci A, et al. Long-term survival rates in haemodialysis patients treated with strict volume control. Nephrol Dial Transplant. 2006 Dec;21(12):3506-13.
51. Mamat R, Kong NC, Ba’in A, Shah SA, Cader R, Wong V, et al. Assessment of body fluid status in hemodialysis patients using the body composition monitor measurement technique. J Clin Nurs. 2012;21(19pt20):2879-85.
52. Kooman JP, van der Sande FM, Leunissen KM. Sodium, blood pressure and cardiovascular pathology: Is it all volaemia? Nephrol Dial Transplant. 2004 May;19(5):1046-9.

73
53. Sinha AD. Why assistive technology is needed for probing of dry weight. Blood Purif. 2011;31(1-3):197-202.
54. Hecking M, Karaboyas A, Antlanger M, Saran R, Wizemann V, Chazot C, et al. Significance of interdialytic weight gain versus chronic volume overload: Consensus opinion. Am J Nephrol. 2013;38(1):78-90.
55. Basso F, Milan Manani S, Cruz DN, Teixeira C, Brendolan A, Nalesso F, et al. Comparison and reproducibility of techniques for fluid status assessment in chronic hemodialysis patients. Cardiorenal Med. 2013 Jul;3(2):104-12.
56. Piccoli A. Estimation of fluid volumes in hemodialysis patients: Comparing bioimpedance with isotopic and dilution methods. Kidney Int. 2014;85(4):738-41.
57. Wizemann V, Wabel P, Chamney P, Zaluska W, Moissl U, Rode C, et al. The mortality risk of overhydration in haemodialysis patients. Nephrol Dial Transplant. 2009 May;24(5):1574-9.
58. Charra B, Bergstrom J, Scribner BH. Blood pressure control in dialysis patients: Importance of the lag phenomenon. American journal of kidney diseases. 1998;32(5):720-4.
59. Moissl UM, Wabel P, Chamney PW, Bosaeus I, Levin NW, Bosy-Westphal A, et al. Body fluid volume determination via body composition spectroscopy in health and disease. Physiol Meas. 2006;27(9):921.
60. Sulowicz W, Radziszewski A. Pathogenesis and treatment of dialysis hypotension. Kidney Int. 2006;70:S36-9.
61. Voroneanu L, Cusai C, Hogas S, Ardeleanu S, Onofriescu M, Nistor I, et al. The relationship between chronic volume overload and elevated blood pressure in hemodialysis patients: Use of bioimpedance provides a different perspective from echocardiography and biomarker methodologies. Int Urol Nephrol. 2010;42(3):789-97.
62. Machek P, Jirka T, Moissl U, Chamney P, Wabel P. Guided optimization of fluid status in haemodialysis patients. Nephrol Dial Transplant. 2010 Feb;25(2):538-44.
63. McIntyre CW. Haemodialysis-induced myocardial stunning in chronic kidney disease - a new aspect of cardiovascular disease. Blood Purif. 2010;29(2):105-10.
64. London GM, Pannier B, Guerin AP, Blacher J, Marchais SJ, Darne B, et al. Alterations of left ventricular hypertrophy in and survival of patients receiving hemodialysis: Follow-up of an interventional study. Journal of the American Society of Nephrology. 2001;12(12):2759-67.
65. Leypoldt JK, Cheung AK, Delmez JA, Gassman JJ, Levin NW, Lewis JAB, et al. Relationship between volume status and blood pressure during chronic hemodialysis. Kidney Int. 2002;61(1):266-75.

74
66. Wabel P, Moissl U, Chamney P, Jirka T, Machek P, Ponce P, et al. Towards improved cardiovascular management: The necessity of combining blood pressure and fluid overload. Nephrol Dial Transplant. 2008 Sep;23(9):2965-71.
67. Van Buren PN, Kim C, Toto RD, Inrig JK. The prevalence of persistent intradialytic hypertension in a hemodialysis population with extended follow-up. Int J Artif Organs. 2012 Dec;35(12):1031-8.
68. Agarwal R, Light RP. Intradialytic hypertension is a marker of volume excess. Nephrol Dial Transplant. 2010 Oct;25(10):3355-61.
69. Inrig JK, Patel UD, Toto RD, Szczech LA. Association of blood pressure increases during hemodialysis with 2-year mortality in incident hemodialysis patients: A secondary analysis of the dialysis morbidity and mortality wave 2 study. American Journal of Kidney Diseases. 2009;54(5):881-90.
70. Henderson LW. Symptomatic hypotension during hemodialysis. Kidney Int. 1980;17(5):571-6.
71. Agarwal R, Andersen MJ, Pratt JH. On the importance of pedal edema in hemodialysis patients. Clin J Am Soc Nephrol. 2008 Jan;3(1):153-8.
72. Vujičić B, Mikolašević I, Rački S, Orlić L, Ljutić D, Bubić I. BCM–Body composition monitor: A new tool for the assessment of volume-dependent hypertension in patients on maintenance haemodialysis. Coll Antropol. 2013;37(3):815-9.
73. Koc M, Toprak A, Tezcan H, Bihorac A, Akoglu E, Ozener IC. Uncontrolled hypertension due to volume overload contributes to higher left ventricular mass index in CAPD patients. Nephrol Dial Transplant. 2002 Sep;17(9):1661-6.
74. Van Biesen W, Williams JD, Covic AC, Fan S, Claes K, Lichodziejewska-Niemierko M, et al. Fluid status in peritoneal dialysis patients: The european body composition monitoring (EuroBCM) study cohort. PLoS One. 2011;6(2):e17148.
75. Davies SJ, Davenport A. The role of bioimpedance and biomarkers in helping to aid clinical decision-making of volume assessments in dialysis patients. Kidney Int. 2014;86(3):489-96.
76. Flythe JE, Brunelli SM. The risks of high ultrafiltration rate in chronic hemodialysis: Implications for patient care. Seminars in dialysis; Wiley Online Library; 2011.
77. Stiller S, Bonnie‐Schorn E, Grassmann A, Uhlenbusch‐Körwer I, Mann H. A critical review of sodium profiling for hemodialysis. Seminars in dialysis; Wiley Online Library; 2001.
78. Rubinger D, Backenroth R, Pollak A, Sapoznikov D. Blood pressure and heart rate variability in patients on conventional or sodium-profiling hemodialysis. Ren Fail. 2008;30(3):277-86.

75
79. Mann H, Stiller S. Urea, sodium, and water changes in profiling dialysis. Nephrol Dial Transplant. 1996;11 Suppl 8:10-5.
80. Lambie SH, Taal MW, Fluck RJ, McIntyre CW. Online conductivity monitoring: Validation and usefulness in a clinical trial of reduced dialysate conductivity. ASAIO journal. 2005;51(1):70-6.
81. Pizzarelli F, Dattolo P, Piacenti M, Morales MA, Cerrai T, Maggiore Q. Non-invasive monitoring of hemodynamic parameters during hemodialysis. Int J Artif Organs. 1995 Sep;18(9):499-503.
82. Bayya A, Rubinger D, Linton DM, Sviri S. Evaluation of intradialytic hypotension using impedance cardiography. Int Urol Nephrol. 2011;43(3):855-64.
83. Owen PJ, Priestman WS, Sigrist MK, Lambie SH, John SG, Chesterton LJ, et al. Myocardial contractile function and intradialytic hypotension. Hemodialysis international. 2009;13(3):293-300.
84. Chesterton LJ, Selby NM, Burton JO, Fialova J, Chan C, McIntyre CW. Categorization of the hemodynamic response to hemodialysis: The importance of baroreflex sensitivity. Hemodialysis International. 2010;14(1):18-28.
85. Kersh ES, Kronfield SJ, Unger A, Popper RW, Cantor S, Cohn K. Autonomic insufficiency in uremia as a cause of hemodialysis-induced hypotension. N Engl J Med. 1974;290(12):650-3.
86. Brummelhuis WJ, van Geest RJ, van Schelven LJ, Boer WH. Sodium profiling, but not cool dialysate, increases the absolute plasma refill rate during hemodialysis. ASAIO J. 2009 Nov-Dec;55(6):575-80.
87. Schroeder KL, Sallustio JE, Ross EA. Continuous haematocrit monitoring during intradialytic hypotension: Precipitous decline in plasma refill rates. Nephrol Dial Transplant. 2004 Mar;19(3):652-6.
88. De Vries JP, Donker AJ, De Vries PM. Prevention of hypovolemia-induced hypotension during hemodialysis by means of an optical reflection method. Int J Artif Organs. 1994 Apr;17(4):209-14.
89. Steuer RR, Leypoldt JK, Cheung AK, Harris DH, Conis JM. Hematocrit as an indicator of blood volume and a predictor of intradialytic morbid events. Asaio Journal. 1994;40(3):M691-6.
90. Passlick-Deetjen J, Baldamus C, Ries W, Tsobanelis T, Schafer R, Koomuns H, et al. Changes in blood volume and blood pressure: An indicator for symptomatic hypotension. J Am Soc Nephrol A. 1999;1507:298A.

76
91. de Vries PM, Olthof CG, Solf A, Schuenemann B, Oe PL, Quellhorst E, et al. Fluid balance during haemodialysis and haemofiltration: The effect of dialysate sodium and a variable ultrafiltration rate. Nephrol Dial Transplant. 1991;6(4):257-63.
92. Sarkar SR, Wystrychowski G, Zhu F, Usvyat LA, Kotanko P, Levin NW. Fluid dynamics during hemodialysis in relationship to sodium gradient between dialysate and plasma. ASAIO J. 2007 May-Jun;53(3):339-42.
93. Fleming SJ, Wilkinson JS, Greenwood RN, Aldridge C, Baker LRI, Cattell WR. Effect of dialysate composition on intercompartmental fluid shift. Kidney Int. 1987;32(267):73.
94. Stiller S, Mann H. The donnan effect in artificial kidney therapy. Life Support Syst. 1986 Oct-Dec;4(4):305-18.
95. Iitake K, Kimura T, Matsui K, Ota K, Shoji M, Inoue M, et al. Effect of haemodialysis on plasma ADH levels, plasma renin activity and plasma aldosterone levels in patients with end-stage renal disease. Acta Endocrinol (Copenh). 1985 Oct;110(2):207-13.
96. Fasanella d'Amore T, Wauters JP, Waeber B, Nussberger J, Brunner HR. Response of plasma vasopressin to changes in extracellular volume and/or plasma osmolality in patients on maintenance hemodialysis. Clin Nephrol. 1985 Jun;23(6):299-302.
97. Hegbrant J, Thysell H, Mårtensson L, Ekman R, Boberg U. Changes in plasma levels of vasoactive peptides during standard bicarbonate hemodialysis. Nephron. 1993;63(3):303-8.
98. Horký K, Śrámková J, Lachmanova J, Tomáśek R, Dvořáková J. Plasma concentration of antidiuretic hormone in patients with chronic renal insufficiency on maintenance dialysis. Hormone and Metabolic Research. 1979;11(03):241-6.
99. Papadoliopoulou-Diamandopoulou N, Papagalanis N, Gavras I, Gavras H. Vasopressin in end-stage renal disease: Relationship to salt, catecholamines and renin activity. Clin Exp Hypertens. 1987;9(7):1197-208.
100. Lindberg J, Copley J, Melton K, Wade C, Abrams J, Goode D. Lysine vasopressin in the treatment of refractory hemodialysis-induced hypotension. Am J Nephrol. 1990;10(4):269-75.
101. ROBERTSON GL, ATHAR S. The interaction of blood osmolality and blood volume in regulating plasma vasopressin in man. The Journal of Clinical Endocrinology & Metabolism. 1976;42(4):613-20.
102. Dunn FL, Brennan TJ, Nelson AE, Robertson GL. The role of blood osmolality and volume in regulating vasopressin secretion in the rat. J Clin Invest. 1973 Dec;52(12):3212-9.
103. Gavras H, Ribeiro AB, Kohlmann O, Saragoca M, Mulinari RA, Ramos O, et al. Effects of a specific inhibitor of the vascular action of vasopressin in humans. Hypertension. 1984 Mar-Apr;6(2 Pt 2):I156-60.

77
104. Bakris G, Bursztyn M, Gavras I, Bresnahan M, Gavras H. Role of vasopressin in essential hypertension: Racial differences. J Hypertens. 1997;15(5):545-50.
105. Rosansky SJ, Rhinehart R, Shade R. Effect of osmolar changes on plasma arginine vasopressin (PAVP) in dialysis patients. Clin Nephrol. 1991 Apr;35(4):158-64.
106. Thompson AM, Oliver JA. Endogenous and exogenous vasopressin during hemodialysis. Seminars in dialysis; Wiley Online Library; 2009.
107. Phillips PA, Rolls BJ, Ledingham JG, Forsling ML, Morton JJ. Osmotic thirst and vasopressin release in humans: A double-blind crossover study. Am J Physiol. 1985 Jun;248(6 Pt 2):R645-50.
108. Wirth JB, Folstein MF. Thirst and weight gain during maintenance hemodialysis. Psychosomatics. 1982;23(11):1125-34.
109. Sang GLS, Kovithavongs C, Ulan R, Kjellstrand CM. Sodium ramping in hemodialysis: A study of beneficial and adverse effects. American journal of kidney diseases. 1997;29(5):669-77.
110. Daugirdas J, Al-Kudsi R, Norusis M. A double-blind evaluation of sodium gradient hemodialysis. Am J Nephrol. 1985;5(3):163-8.
111. Sadowski RH, Allred EN, Jabs K. Sodium modeling ameliorates intradialytic and interdialytic symptoms in young hemodialysis patients. J Am Soc Nephrol. 1993 Nov;4(5):1192-8.
112. PARSONS DS, YUILL E, LLAPITAN M, HARRIS DC. Sodium modelling and profiled ultrafiltration in conventional haemodialysis. Nephrology. 1997;3(2):177-82.
113. Zerbe RL, Miller JZ, Robertson GL. The reproducibility and heritability of individual differences in osmoregulatory function in normal human subjects. J Lab Clin Med. 1991 Jan;117(1):51-9.
114. Oberleithner H, Riethmuller C, Schillers H, MacGregor GA, de Wardener HE, Hausberg M. Plasma sodium stiffens vascular endothelium and reduces nitric oxide release. Proc Natl Acad Sci U S A. 2007 Oct 9;104(41):16281-6.
115. Dickinson KM, Clifton PM, Keogh JB. Endothelial function is impaired after a high-salt meal in healthy subjects. Am J Clin Nutr. 2011 Mar;93(3):500-5.
116. Suckling RJ, Swift PA, He FJ, Markandu ND, MacGregor GA. Altering plasma sodium concentration rapidly changes blood pressure during haemodialysis. Nephrol Dial Transplant. 2013 Aug;28(8):2181-6.

78
117. Davenport A, Cox C, Thuraisingham R, PanThames Renal Audit Group. The importance of dialysate sodium concentration in determining interdialytic weight gains in chronic hemodialysis patients: The PanThames renal audit. Int J Artif Organs. 2008 May;31(5):411-7.
118. Farmer C, Donohoe P, Dallyn P, Cox J, Kingswood J, Goldsmith D. Low‐sodium haemodialysis without fluid removal improves blood pressure control in chronic haemodialysis patients. Nephrology. 2000;5(4):237-41.
119. Krautzig S, Janssen U, Koch KM, Granolleras C, Shaldon S. Dietary salt restriction and reduction of dialysate sodium to control hypertension in maintenance haemodialysis patients. Nephrol Dial Transplant. 1998 Mar;13(3):552-3.
120. Davenport A. Audit of the effect of dialysate sodium concentration on inter-dialytic weight gains and blood pressure control in chronic haemodialysis patients. Nephron Clin Pract. 2006;104(3):c120-5.
121. Flanigan MJ. Opinion: How should dialysis fluid be individualized for the chronic hemodialysis patient? Seminars in dialysis; Wiley Online Library; 2008.
122. Suckling RJ, He FJ, Markandu ND, MacGregor GA. Dietary salt influences postprandial plasma sodium concentration and systolic blood pressure. Kidney Int. 2011;81(4):407-11.
123. Komiya I, Yamada T, Takasu N, Asawa T, Akamine H, Yagi N, et al. An abnormal sodium metabolism in japanese patients with essential hypertension, judged by serum sodium distribution, renal function and the renin-aldosterone system. J Hypertens. 1997;15(1):65-72.
124. Bulpitt C, Shipley M, Semmence A. Blood pressure and plasma sodium and potassium. Clin Sci. 1981;61(Suppl 7):85s-7s.
125. Zhou YL, Liu HL, Duan XF, Yao Y, Sun Y, Liu Q. Impact of sodium and ultrafiltration profiling on haemodialysis-related hypotension. Nephrol Dial Transplant. 2006 Nov;21(11):3231-7.
126. Coli L, Ursino M, Donati G, Cianciolo G, Soverini ML, Baraldi O, et al. Clinical application of sodium profiling in the treatment of intradialytic hypotension. Int J Artif Organs. 2003 Aug;26(8):715-22.
127. Coli L, La Manna G, Dalmastri V, De Pascalis A, Pace G, Santese G, et al. Evidence of profiled hemodialysis efficacy in the treatment of intradialytic hypotension. Int J Artif Organs. 1998 Jul;21(7):398-402.
128. Fleming SJ, Wilkinson JS, Aldridge C, Greenwood RN, Muggleston SD, Baker LR, et al. Dialysis-induced change in erythrocyte volume: Effect on change in blood volume calculated from packed cell volume. Clin Nephrol. 1988 Feb;29(2):63-8.

79
129. Kim MJ, Song J, Kim G, Lim H, Lee S. Optimization of dialysate sodium in sodium profiling haemodialysis. Nephrology (Carlton). 2003 Oct;8 Suppl:S16-22.
130. Levin A, Goldstein MB. The benefits and side effects of ramped hypertonic sodium dialysis. J Am Soc Nephrol. 1996 Feb;7(2):242-6.
131. Colì L, Bonomini M, La Manna G, Dalmastri V, Ursino M, Ivanovich P, et al. Clinical use of profiled hemodialysis. Artif Organs. 1998;22(9):724-30.
132. Movilli E, Camerini C, Viola BF, Bossini N, Strada A, Maiorca R. Blood volume changes during three different profiles of dialysate sodium variation with similar intradialytic sodium balances in chronic hemodialyzed patients. American journal of kidney diseases. 1997;30(1):58-63.
133. Flanigan MJ, Khairullah QT, Lim VS. Dialysate sodium delivery can alter chronic blood pressure management. American journal of kidney diseases. 1997;29(3):383-91.
134. Song JH, Park GH, Lee SY, Lee SW, Lee SW, Kim MJ. Effect of sodium balance and the combination of ultrafiltration profile during sodium profiling hemodialysis on the maintenance of the quality of dialysis and sodium and fluid balances. J Am Soc Nephrol. 2005 Jan;16(1):237-46.
135. Iselin H, Tsinalis D, Brunner FP. Sodium balance-neutral sodium profiling does not improve dialysis tolerance. Swiss medical weekly. 2001;131(43/44):635-9.
136. Meira FS, Figueiredo AE, Zemiarcki J, Pacheco J, Poli‐de‐Figueiredo CE, d'Avila DO. Two variable sodium profiles and adverse effects during hemodialysis: A randomized crossover study. Therapeutic Apheresis and Dialysis. 2010;14(3):328-33.
137. Al-Hilali N, Al-Humoud H, Ninan V, Nampoory M, Ali J, Johny K. Profiled hemodialysis reduces intradialytic symptoms. Transplantation proceedings; Elsevier; 2004.
138. De Paula FM, Peixoto AJ, Pinto LV, Dorigo D, Patricio PJ, Santos SF. Clinical consequences of an individualized dialysate sodium prescription in hemodialysis patients. Kidney Int. 2004;66(3):1232-8.
139. Oliver MJ, Edwards LJ, Churchill DN. Impact of sodium and ultrafiltration profiling on hemodialysis-related symptoms. J Am Soc Nephrol. 2001 Jan;12(1):151-6.
140. Dominic SC, Ramachandran S, Somiah S, Mani K, Dominic SS. Quenching the thirst in dialysis patients. Nephron. 1996;73(4):597-600.
141. ACCHIARDO SR, HAYDEN AJ. Is na modeling necessary in high flux dialysis? ASAIO Journal. 1991;37(3):M135-7.

80
142. de Vries PM, Kouw PM, Olthof CG, Solf A, Schuenemann B, Oe LP, et al. The influence of dialysate sodium and variable ultrafiltration on fluid balance during hemodialysis. ASAIO Trans. 1990 Oct-Dec;36(4):821-4.
143. Hecking M, Kainz A, Horl WH, Herkner H, Sunder-Plassmann G. Sodium setpoint and sodium gradient: Influence on plasma sodium change and weight gain. Am J Nephrol. 2011;33(1):39-48.
144. Lindley EJ. Reducing sodium intake in hemodialysis patients. Semin Dial. 2009 May-Jun;22(3):260-3.
145. Thein H, Haloob I, Marshall MR. Associations of a facility level decrease in dialysate sodium concentration with blood pressure and interdialytic weight gain. Nephrol Dial Transplant. 2007 Sep;22(9):2630-9.
146. Keen ML, Gotch FA. The association of the sodium "setpoint" to interdialytic weight gain and blood pressure in hemodialysis patients. Int J Artif Organs. 2007 Nov;30(11):971-9.
147. Charra B, Chazot C, Jean G, Hurot JM, Terrat JC, Vanel T, et al. Role of sodium in dialysis. Minerva Urol Nefrol. 2004 Sep;56(3):205-13.
148. Santos SF, Peixoto AJ. Revisiting the dialysate sodium prescription as a tool for better blood pressure and interdialytic weight gain management in hemodialysis patients. Clin J Am Soc Nephrol. 2008 Mar;3(2):522-30.
149. Van Stone JC. Individualization of the dialysate prescription in chronic hemodialysis. Dialysis & transplantation. 1994;23(11):624-35.
150. Henrich WL, Woodard TD, McPhaul Jr JJ. The chronic efficacy and safety of high sodium dialysate: Double-blind, crossover study. American Journal of Kidney Diseases. 1982;2(3):349-53.
151. Bonomini V, Coli L, Scolari M. Profiling dialysis: A new approach to dialysis intolerance. Nephron. 1997;75(1):1-6.
152. Ebel H, Laage C, Keuchel M, Dittmar A, Saure B, Ehlenz K, et al. Impact of profile haemodialysis on intra-/extracellular fluid shifts and the release of vasoactive hormones in elderly patients on regular dialysis treatment. Nephron. 1997;75(3):264-71.
153. Ronco C, Brendolan A, Milan M, Rodeghiero MP, Zanella M, La Greca G. Impact of biofeedback-induced cardiovascular stability on hemodialysis tolerance and efficiency. Kidney Int. 2000;58(2):800-8.
154. Santoro A, Mancini E, Paolini F, Cavicchioli G, Bosetto A, Zucchelli P. Blood volume regulation during hemodialysis. American journal of kidney diseases. 1998;32(5):739-48.

81
155. Chen J, Gul A, Sarnak MJ. UNRESOLVED ISSUES IN DIALYSIS: Management of intradialytic hypertension: The ongoing challenge. Seminars in dialysis; Wiley Online Library; 2006.
156. Amerling R, Cu GA, Dubrow A, Levin NW, Osheroff RJ. Complications during hemodialysis. Clinical dialysis. 1995;3:235-67.
157. Cirit M, Akcicek F, Terzioglu E, Soydas C, Ok E, Ozbasli CF, et al. 'Paradoxical' rise in blood pressure during ultrafiltration in dialysis patients. Nephrol Dial Transplant. 1995;10(8):1417-20.
158. Foley RN, Parfrey PS, Sarnak MJ. Epidemiology of cardiovascular disease in chronic renal disease. J Am Soc Nephrol. 1998 Dec;9(12 Suppl):S16-23.
159. Bos WJW, Bruin S, van Olden RW, Keur I, Wesseling KH, Westerhof N, et al. Cardiac and hemodynamic effects of hemodialysis and ultrafiltration. American journal of kidney diseases. 2000;35(5):819-26.
160. Braunwald E, Rutherford JD. Reversible ischemic left ventricular dysfunction: Evidence for the “hibernating myocardium”. J Am Coll Cardiol. 1986;8(6):1467-70.
161. Burton JO, Jefferies HJ, Selby NM, McIntyre CW. Hemodialysis-induced cardiac injury: Determinants and associated outcomes. Clin J Am Soc Nephrol. 2009 May;4(5):914-20.
162. McIntyre CW. Effects of hemodialysis on cardiac function. Kidney Int. 2009;76(4):371-5.


![Effects of intradialytic aerobic exercise on hemodialysis patients: … · 2019. 6. 21. · 13, 25, 28, 31–34, 39, 40] using the Borg Rating of Per-ceived Exertion Scale, set between](https://static.fdocuments.net/doc/165x107/60fe5591311ed740b65ee1ba/effects-of-intradialytic-aerobic-exercise-on-hemodialysis-patients-2019-6-21.jpg)

![Intradialytic hypotension [투석 중 저혈압]](https://static.fdocuments.net/doc/165x107/558406e7d8b42a6a148b4edc/intradialytic-hypotension--5584b8e435e7e.jpg)