Fluid Phase Equilibria - Yale School of Engineering ... Pub/JinandFiroozabadiFPE2014.pdf · Fluid...
11
Fluid Phase Equilibria 382 (2014) 10–20 Contents lists available at ScienceDirect Fluid Phase Equilibria journal h om epage: www.elsevier.com/locate/fluid Effect of water on methane and carbon dioxide sorption in clay minerals by Monte Carlo simulations Zhehui Jin a , Abbas Firoozabadi a,b,∗ a Reservoir Engineering Research Institute, Palo Alto, CA, USA b Yale University, New Haven, CT, USA a r t i c l e i n f o Article history: Received 4 April 2014 Received in revised form 23 July 2014 Accepted 24 July 2014 Available online 2 August 2014 Keywords: Sorption in clay Shale media Nanopores a b s t r a c t Shale is mainly composed of: (1) inorganic, and (2) organic materials. As an important constituent of inorganic matter, clay minerals may affect gas-in-place of shale permeable media. Clay minerals are hydrophilic. Hydrophilicity may affect pore space saturation with water in shale media. In this work, we investigate the effect of water on methane and CO 2 sorption in clay minerals by using grand canonical Monte Carlo simulations. Our investigation reveals that water may significantly reduce methane and CO 2 sorption in clay nanopores. In small pores (1 nm), water and CO 2 , and water and methane adsorbed in the same layer. In large pores (>2 nm), water molecules adsorb on the first layer, and CO 2 and methane form a weak second layer adsorption. CO 2 unlike methane both in pure and low water content conditions may form multi-layer adsorption at high pressure. Multilayer adsorption results in significant increase of sorption with pressure. Langmuir adsorption model cannot be used for such descriptions. Our study on sorption of CO 2 and water mixtures in clay minerals shows that with a small amount of water in the domain outside the nanopores, CO 2 sorption is significantly reduced. In larger pores (>2 nm), gas molecules mainly accumulate in the middle of the pores. © 2014 Elsevier B.V. All rights reserved. 1. Introduction Shale is composed of two distinct materials: organic and inor- ganic. The organic materials are mainly composed of kerogen, which is a mixture of organic chemical compounds. Organic matter in shale increases porosity [1] and the porosity of kerogen can be as high as 50% of the total porosity [2]. A study [3] suggests that gas sorption and dissolution in organic materials may significantly contribute to gas-in-place in shale gas reservoirs. In some organic- rich shale reservoirs, there is a strong correlation between methane sorption to the total organic content (TOC) [3–5]. Thermally mature kerogen may have larger micropore volume than that of immature kerogen resulting in higher ratio of gas sorption capacity [1]. In addition to organic matter, clay minerals may provide addi- tional sorption capacity due to high internal surface area [6]. A few studies have reported that the clay mineral composition and its microporous structure may increase gas sorption capacity of organic-rich shales [7–9]. There are indications that clay miner- als affect sorption in clay-rich shales [3,7,10–13]; clay minerals have micropore-to-mesopore structures which provide additional ∗ Corresponding author. Tel.: +1 650 326 9259. E-mail address: [email protected] (A. Firoozabadi). surface areas for gas sorption depending on the pore structures and clay chemical compositions [3]. Experimental and compu- tational works [7,14] have shown that gas sorption in clay minerals can be comparable to shale rocks. Clays are gener- ally made of large particles formed by stacks of sheets [15]. They are hydrophilic and moisture may occupy the surface sites. Some shale gas reservoirs are water-saturated [16]. Preloaded water in clay-rich shales significantly reduces gas sorption [3] and even in the organic-rich shales, gas sorption capacity can be greatly reduced because of the moisture [17]. While kerogen is generally hydrophobic, clay minerals are hydrophilic; water can be easily adsorbed onto clay mineral surfaces reducing the total gas sorp- tion capacity of shale. Experimental work [7] in clay minerals show that sorption capacity under moisture-equilibrated condition is substantially lower than that under the dry conditions. There are extensive experimental and computational works [18–28] on the effect of water on gas sorption in porous media, such as coals. The methane sorption capacity of moisture-equilibrated coals is sub- stantially lower than the dry samples [20,29]. The adsorption of water is related to the hydrophilic sites from the oxygen-containing functional groups with a reduction of the available pore volume for gas sorption [27]. There are very limited studies on the effect of moisture on gas sorption in clay minerals and the underlying http://dx.doi.org/10.1016/j.fluid.2014.07.035 0378-3812/© 2014 Elsevier B.V. All rights reserved.
Transcript of Fluid Phase Equilibria - Yale School of Engineering ... Pub/JinandFiroozabadiFPE2014.pdf · Fluid...

Em
Za
b
a
ARRAA
KSSN
1
gwiagcrskk
tfioah
h0
Fluid Phase Equilibria 382 (2014) 10–20
Contents lists available at ScienceDirect
Fluid Phase Equilibria
journa l h om epage: www.elsev ier .com/ locate / f lu id
ffect of water on methane and carbon dioxide sorption in clayinerals by Monte Carlo simulations
hehui Jina, Abbas Firoozabadia,b,∗
Reservoir Engineering Research Institute, Palo Alto, CA, USAYale University, New Haven, CT, USA
r t i c l e i n f o
rticle history:eceived 4 April 2014eceived in revised form 23 July 2014ccepted 24 July 2014vailable online 2 August 2014
eywords:orption in clayhale media
a b s t r a c t
Shale is mainly composed of: (1) inorganic, and (2) organic materials. As an important constituent ofinorganic matter, clay minerals may affect gas-in-place of shale permeable media. Clay minerals arehydrophilic. Hydrophilicity may affect pore space saturation with water in shale media. In this work, weinvestigate the effect of water on methane and CO2 sorption in clay minerals by using grand canonicalMonte Carlo simulations. Our investigation reveals that water may significantly reduce methane and CO2
sorption in clay nanopores. In small pores (1 nm), water and CO2, and water and methane adsorbed inthe same layer. In large pores (>2 nm), water molecules adsorb on the first layer, and CO2 and methaneform a weak second layer adsorption. CO2 unlike methane both in pure and low water content conditions
anopores may form multi-layer adsorption at high pressure. Multilayer adsorption results in significant increaseof sorption with pressure. Langmuir adsorption model cannot be used for such descriptions. Our studyon sorption of CO2 and water mixtures in clay minerals shows that with a small amount of water inthe domain outside the nanopores, CO2 sorption is significantly reduced. In larger pores (>2 nm), gasmolecules mainly accumulate in the middle of the pores.
© 2014 Elsevier B.V. All rights reserved.
. Introduction
Shale is composed of two distinct materials: organic and inor-anic. The organic materials are mainly composed of kerogen,hich is a mixture of organic chemical compounds. Organic matter
n shale increases porosity [1] and the porosity of kerogen can bes high as 50% of the total porosity [2]. A study [3] suggests thatas sorption and dissolution in organic materials may significantlyontribute to gas-in-place in shale gas reservoirs. In some organic-ich shale reservoirs, there is a strong correlation between methaneorption to the total organic content (TOC) [3–5]. Thermally matureerogen may have larger micropore volume than that of immatureerogen resulting in higher ratio of gas sorption capacity [1].
In addition to organic matter, clay minerals may provide addi-ional sorption capacity due to high internal surface area [6]. Aew studies have reported that the clay mineral composition andts microporous structure may increase gas sorption capacity of
rganic-rich shales [7–9]. There are indications that clay miner-ls affect sorption in clay-rich shales [3,7,10–13]; clay mineralsave micropore-to-mesopore structures which provide additional∗ Corresponding author. Tel.: +1 650 326 9259.E-mail address: [email protected] (A. Firoozabadi).
ttp://dx.doi.org/10.1016/j.fluid.2014.07.035378-3812/© 2014 Elsevier B.V. All rights reserved.
surface areas for gas sorption depending on the pore structuresand clay chemical compositions [3]. Experimental and compu-tational works [7,14] have shown that gas sorption in clayminerals can be comparable to shale rocks. Clays are gener-ally made of large particles formed by stacks of sheets [15].They are hydrophilic and moisture may occupy the surfacesites.
Some shale gas reservoirs are water-saturated [16]. Preloadedwater in clay-rich shales significantly reduces gas sorption [3] andeven in the organic-rich shales, gas sorption capacity can be greatlyreduced because of the moisture [17]. While kerogen is generallyhydrophobic, clay minerals are hydrophilic; water can be easilyadsorbed onto clay mineral surfaces reducing the total gas sorp-tion capacity of shale. Experimental work [7] in clay minerals showthat sorption capacity under moisture-equilibrated condition issubstantially lower than that under the dry conditions. There areextensive experimental and computational works [18–28] on theeffect of water on gas sorption in porous media, such as coals. Themethane sorption capacity of moisture-equilibrated coals is sub-stantially lower than the dry samples [20,29]. The adsorption of
water is related to the hydrophilic sites from the oxygen-containingfunctional groups with a reduction of the available pore volumefor gas sorption [27]. There are very limited studies on the effectof moisture on gas sorption in clay minerals and the underlying
hase Equilibria 382 (2014) 10–20 11
mssrt
rwsnaf[tcohtmmabotccmaiatmTtc
oMieipofiiMeaT[uatmcotum
2movt
Table 1Atomic positions and effective charges in the unit cell.
Atom x (nm) y (nm) z (nm) q (e)
O 0.264 0.0 0.328 −0.8O 0.132 0.228 0.328 −0.8O 0.396 0.228 0.328 −0.8O(OH) 0.0 0.0 0.106 −1.7175H(OH) 0.08815 0.0 0.1434 0.7175Si 0.264 0.152 0.273 1.2Si 0.0 0.305 0.273 1.2O 0.264 0.152 0.106 −1.0O 0.0 0.305 0.106 −1.0Al 0.44 0.152 0.0 3.0Al 0.44 −0.152 0.0 3.0O 0.0 0.457 0.328 −0.8O 0.396 0.685 0.328 −0.8O 0.132 0.685 0.328 −0.8O(OH) 0.264 0.457 0.106 −1.7175H(OH) 0.35215 0.457 0.1434 0.7175Si 0.0 0.609 0.273 1.2Si 0.264 0.762 0.273 1.2O 0.0 0.609 0.106 −1.0O 0.264 0.762 0.106 −1.0Al 0.704 0.609 0.0 3.0Al 0.704 0.305 0.0 3.0O 0.088 0.914 −0.328 −0.8O 0.22 0.686 −0.328 −0.8O −0.044 0.686 −0.328 −0.8O(OH) 0.352 0.914 −0.106 −1.7175H(OH) 0.26385 0.914 −0.1434 0.7175Si 0.088 0.762 −0.273 1.2Si 0.352 0.609 −0.273 1.2O 0.088 0.762 −0.106 −1.0O 0.352 0.609 −0.106 −1.0O 0.352 0.457 −0.328 −0.8O −0.044 0.229 −0.328 −0.8O 0.22 0.229 −0.328 −0.8O(OH) 0.088 0.457 −0.106 −1.7175H(OH) −0.00015 0.457 −0.1434 0.7175Si 0.352 0.305 −0.273 1.2Si 0.088 0.152 −0.273 1.2
Z. Jin, A. Firoozabadi / Fluid P
echanisms. In contrast to coals, water association with clayurfaces is even stronger due to various partial/full charges ofurface atoms. Additionally, some clay minerals, such as montmo-illonite clay, have an cation-exchange ability to further enhancehe hydrophilicity [30].
Molecular simulations [14,31,32] have been conducted inelation to gas sorption in dry clay minerals. In a recentork, we have applied grand canonical Monte Carlo (GCMC)
imulations to investigate methane and CO2 sorption in clayanopores [14]. Due to the chemical heterogeneity, the structuralnd thermodynamic properties in clays are significantly differentrom that in conventional carbonaceous materials [14]. Coasne et al.18] used the GCMC simulations to study the effect of water on sorp-ion of methane and carbon dioxide in the slit-pore like nanoporousarbons. They preloaded water in carbon nanopores; the amountf water stayed constant in the process of gas sorption due to theigh free energy barrier to desorb preadsorbed water and foundhat water greatly reduces gas sorption capacity, especially for
ethane. Coasne et al. [19] also investigated the effect of water onethane and carbon dioxide sorption in disordered porous carbons
nd observed a higher decrease in the sorption of methane than car-on dioxide. In both studies, the authors explained higher reductionf methane adsorption because of stronger interaction of CO2–H2Ohan methane–H2O interaction. Very recently, Zhang et al. [33] usedomputer simulations to study methane sorption in dry and moistoals. They reported that methane sorption capacity decreases asoisture content increases. In contrast to carbonaceous materi-
ls, computational studies on the effect of water on gas sorptionn clay minerals are limited. Botan et al. [34] used Monte Carlond molecular dynamics simulations to study the structural andhermodynamic properties of carbon dioxide in hydrated sodium
ontmorillonite. The effect of water was not included in their work.o best of our knowledge, no computational and theoretical inves-igations have been made on the effect of water on gas sorption inlay minerals.
In this work, we use GCMC simulations to investigate the effectf water on methane and CO2 sorption in clay-like slit pores.ethane is the main constituent of natural gases. Carbon dioxide
s often present in the subsurface. Similar to gas sorption mod-ling in carbonaceous materials, we assume that the inter-porenteractions are negligible and gas adsorbs in nanometer slit-likeores. The solid surface in our work has a structure and chargef the montmorillonite clay consisting of two tetrahedral sheetsused to an octahedral sheet [35]. Montmorillonite clay has a largenternal surface area, and shows a strong cation-exchange capac-ty [7]. It is one of major constituents of clay minerals in shale [3].
ontmorillonite clay consists of negatively charged silicate lay-rs with Si atoms replaced by Al atoms in the tetrahedral sheetnd Al atoms replaced by Mg atoms in the octahedral sheet [30].he negative charges are compensated by interlayer counterions36]. We use a full atomistic pore structure by duplicating thenit cell of montmorillonite clay proposed by Skipper et al. [37]nd sodium ions as the interlayer counterions. By incorporatinghese features, we believe that our GCMC can provide funda-
ental understandings of the effect of water on gas sorption inlay minerals. This work is continuation of our previous workn gas sorption in dry clay minerals [14]. By combining thesewo works, we believe insight is provided into the fundamentalnderstanding of gas sorption in clay and the effect of water (oroisture).The remainder of this paper is organized as follows. In Section
, we introduce the molecular simulation methods and define the
olecular models we use. In Section 3, we investigate the effectf water on methane and CO2 sorption in clay-like slit pores ofarious sizes and bulk densities of the gas molecules, as well ashe preloaded water in the pores. We also study CO2-H2O mixture
O 0.352 0.305 −0.106 −1.0O 0.088 0.152 −0.106 −1.0
sorption in clay nanopores of different sizes. In Section 4, we sum-marize the key conclusions and discuss implications.
2. Simulation method
2.1. Molecular model
We use a fixed solid surface of montmorilloniteclay as a 2:1 clay mineral with the unit cell formulaNa0.75(Si7.75Al0.25)(Al3.5Mg0.5)O20(OH)4[30]. The simulationcell contains two 32-clay unit cells resulting in a clay patch of4.224 × 3.656 nm with a thickness of 0.656 nm separated by afixed distance to represent a clay nanopore. The positions andcharges of the sites in the unit cell of the clay are shown in Table 1[37]. These positions and charges [37] have been widely used insimulations of water sorption in clay and validated by comparingto experimental data [30,38,39]. The unit cell is replicated to formthe clay sheet we use in the simulations. Each of our clay sheetshas 16 isomorphous replacements of trivalent Al atoms by divalentMg atoms in the octahedral sheet, 8 isomorphous replacements oftetravalent Si atoms by trivalent Al atoms in the tetrahedral sheet,and 24 compensating monovalent sodium ions in the interlayerregion [30]. In our simulation, the sheets are considered as rigidmolecules; no bending potential is considered for clay sheets. The
two clay sheets form a slit-like nanopore structure and sodiumions, water and gas molecules are distributed within the pore.Methane, carbon dioxide and water molecules are simulatedby using the TraPPE [40], EPM2 [41] and SPC-E [42] model,
12 Z. Jin, A. Firoozabadi / Fluid Phase Equilibria 382 (2014) 10–20
Table 2LJ parameters of methane, CO2, sodium ion and atoms of clay.
atom ε (K) � (nm) q (e)
MethaneCH4 148.0 0.373 0Carbon dioxideC 28.129 0.2757 0.6512O 80.507 0.3033 −0.3256ClayH 0 0O 78.18 0.3166Si 47.803 0.3951Al 32.707 0.4112Mg 32.707 0.4112Sodium ionNa+ 62.90 0.2801 1.0
rwCp
u
imLcitMcLo1fTdttciwi
2
pcLitts
dtaapnnm
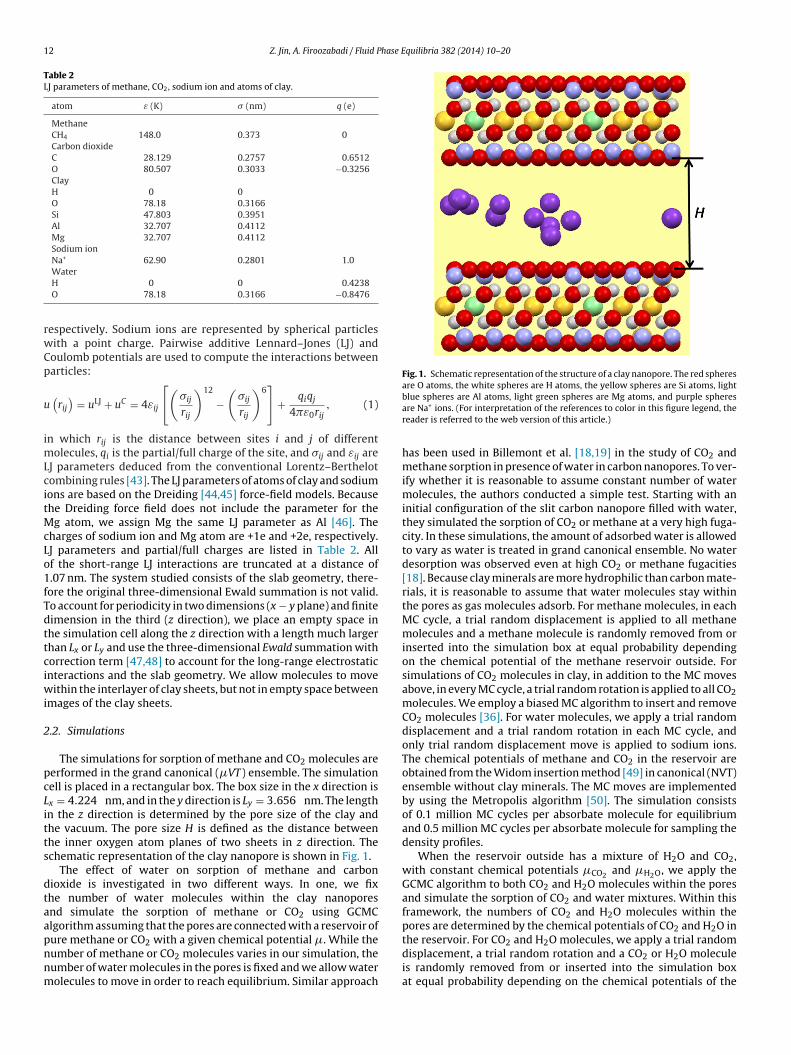
Fig. 1. Schematic representation of the structure of a clay nanopore. The red spheresare O atoms, the white spheres are H atoms, the yellow spheres are Si atoms, light
WaterH 0 0 0.4238O 78.18 0.3166 −0.8476
espectively. Sodium ions are represented by spherical particlesith a point charge. Pairwise additive Lennard–Jones (LJ) andoulomb potentials are used to compute the interactions betweenarticles:
(rij
)= uLJ + uC = 4εij
[(�ij
rij
)12
−(
�ij
rij
)6]
+ qiqj
4�ε0rij, (1)
n which rij is the distance between sites i and j of differentolecules, qi is the partial/full charge of the site, and �ij and εij are
J parameters deduced from the conventional Lorentz–Berthelotombining rules [43]. The LJ parameters of atoms of clay and sodiumons are based on the Dreiding [44,45] force-field models. Becausehe Dreiding force field does not include the parameter for the
g atom, we assign Mg the same LJ parameter as Al [46]. Theharges of sodium ion and Mg atom are +1e and +2e, respectively.J parameters and partial/full charges are listed in Table 2. Allf the short-range LJ interactions are truncated at a distance of.07 nm. The system studied consists of the slab geometry, there-ore the original three-dimensional Ewald summation is not valid.o account for periodicity in two dimensions (x − y plane) and finiteimension in the third (z direction), we place an empty space inhe simulation cell along the z direction with a length much largerhan Lx or Ly and use the three-dimensional Ewald summation withorrection term [47,48] to account for the long-range electrostaticnteractions and the slab geometry. We allow molecules to move
ithin the interlayer of clay sheets, but not in empty space betweenmages of the clay sheets.
.2. Simulations
The simulations for sorption of methane and CO2 molecules areerformed in the grand canonical (�VT) ensemble. The simulationell is placed in a rectangular box. The box size in the x direction isx = 4.224 nm, and in the y direction is Ly = 3.656 nm. The lengthn the z direction is determined by the pore size of the clay andhe vacuum. The pore size H is defined as the distance betweenhe inner oxygen atom planes of two sheets in z direction. Thechematic representation of the clay nanopore is shown in Fig. 1.
The effect of water on sorption of methane and carbonioxide is investigated in two different ways. In one, we fixhe number of water molecules within the clay nanoporesnd simulate the sorption of methane or CO2 using GCMClgorithm assuming that the pores are connected with a reservoir of
ure methane or CO2 with a given chemical potential �. While theumber of methane or CO2 molecules varies in our simulation, theumber of water molecules in the pores is fixed and we allow waterolecules to move in order to reach equilibrium. Similar approachblue spheres are Al atoms, light green spheres are Mg atoms, and purple spheresare Na+ ions. (For interpretation of the references to color in this figure legend, thereader is referred to the web version of this article.)
has been used in Billemont et al. [18,19] in the study of CO2 andmethane sorption in presence of water in carbon nanopores. To ver-ify whether it is reasonable to assume constant number of watermolecules, the authors conducted a simple test. Starting with aninitial configuration of the slit carbon nanopore filled with water,they simulated the sorption of CO2 or methane at a very high fuga-city. In these simulations, the amount of adsorbed water is allowedto vary as water is treated in grand canonical ensemble. No waterdesorption was observed even at high CO2 or methane fugacities[18]. Because clay minerals are more hydrophilic than carbon mate-rials, it is reasonable to assume that water molecules stay withinthe pores as gas molecules adsorb. For methane molecules, in eachMC cycle, a trial random displacement is applied to all methanemolecules and a methane molecule is randomly removed from orinserted into the simulation box at equal probability dependingon the chemical potential of the methane reservoir outside. Forsimulations of CO2 molecules in clay, in addition to the MC movesabove, in every MC cycle, a trial random rotation is applied to all CO2molecules. We employ a biased MC algorithm to insert and removeCO2 molecules [36]. For water molecules, we apply a trial randomdisplacement and a trial random rotation in each MC cycle, andonly trial random displacement move is applied to sodium ions.The chemical potentials of methane and CO2 in the reservoir areobtained from the Widom insertion method [49] in canonical (NVT)ensemble without clay minerals. The MC moves are implementedby using the Metropolis algorithm [50]. The simulation consistsof 0.1 million MC cycles per absorbate molecule for equilibriumand 0.5 million MC cycles per absorbate molecule for sampling thedensity profiles.
When the reservoir outside has a mixture of H2O and CO2,with constant chemical potentials �CO2 and �H2O, we apply theGCMC algorithm to both CO2 and H2O molecules within the poresand simulate the sorption of CO2 and water mixtures. Within thisframework, the numbers of CO2 and H2O molecules within thepores are determined by the chemical potentials of CO2 and H2O in
the reservoir. For CO2 and H2O molecules, we apply a trial randomdisplacement, a trial random rotation and a CO2 or H2O moleculeis randomly removed from or inserted into the simulation boxat equal probability depending on the chemical potentials of the
Z. Jin, A. Firoozabadi / Fluid Phase Equilibria 382 (2014) 10–20 13
Fig. 2. The effect of water on sorption isotherms of methane in clay nanoporeswith pore size H = 1 nm. The black, red, green, and blue lines represent methanesorption without water, with average water density of 0.4 g/cm3, with average waterdit
CrTaummp
3
3
apA2
H�
�
wst
�
wa
dWimaar
Fig. 3. The effect of water on sorption isotherms of CO2 in clay nanopores with poresize H = 1 nm. The black, red, green, and blue lines represent methane sorptionwithout water, with average water density of 0.4 g/cm3, with average water densityof 0.6 g/cm3, and with average water density of 0.8 g/cm3, respectively. (For inter-
ensity of 0.6 g/cm3, and with average water density of 0.8 g/cm3, respectively. (Fornterpretation of the references to color in this figure legend, the reader is referredo the web version of this article.)
O2 and H2O mixture in the reservoir outside. A biased MC algo-ithm [36] is used to insert and remove CO2 or H2O molecules.he chemical potentials of CO2 and H2O mixture in the reservoirre obtained from Ref. [34]. The MC moves are implemented bysing the Metropolis algorithm [50]. The simulation consists of 0.1illion MC cycles per absorbate molecule for equilibrium and 0.5illion MC cycles per absorbate molecule for sampling the density
rofiles.
. Results and discussions
.1. Gas sorption with preloaded water molecules
We present the effect of water on sorption isotherm of methanend CO2 in clay nanopores and density distribution for differentore sizes and pressures with varying amount of preloaded water.ll of the simulations are performed at system temperature of T =98.15 K.
The effect of water on sorption isotherms of methane in pore size = 1 nm is presented in Fig. 2. The average gas weight densityave in clay nanopores is given as
ave = 1H
H∫0
� (z) dz, (2)
here � (z) is the weight density at distance z from one of the clayurface sheets. The average water density in the pore �ave
H2O is relatedo the number of water molecules NH2O in the pores:
aveH2O = NH2O × MH2O
H × A × NA, (3)
here A is the surface area of slit-pore, NA is the Avogadro numbernd MH2O is the water molar weight.
As seen in Fig. 2 in pore size H = 1 nm, methane sorptionecreases significantly as the average water density increases.ater molecule has a strong dipole moment, while methane
s charge neutral. In a previous work [14], we have shown that
ethane sorption in dry clay nanopores is dominated by surfacedsorption. Water molecules have strong affinity to clay surfacetoms reducing methane adsorption. At a water content cor-esponding to �ave
H2O = 0.4 g/cm3, methane sorption reduces 3
pretation of the references to color in this figure legend, the reader is referred to theweb version of this article.)
times at a high pressure (P = 60 bar). At a high water contentcorresponding to �ave
H2O = 0.8 g/cm3, methane sorption innanopores becomes negligible. In a small pore, as pressureincreases, methane sorption reaches a plateau in both dry and wetclay pores. As we will see later, methane molecules are adsorbedin the same layer as water due to the wall interactions from thetwo sides.
The effect of water on sorption isotherms of CO2 in claynanopores in pore size H = 1 nm is presented in Fig. 3. Similarto methane sorption, water substantially reduces CO2 sorption. Ina dry condition, due to the cation exchange, CO2 sorption capac-ity is high [14]. However, as more water molecules are attractedto the clay surface, the contribution from CO2 surface adsorption isgreatly reduced. Although CO2 has a quadruple moment, the dipolemoment of water molecule makes it having stronger affinity thanCO2 to the clay surface. With water, because water molecules arestrongly adsorbed onto the clay surfaces, CO2 adsorption layer issubstantially reduced as we show later. Charged atoms on the claysurfaces significantly increase CO2 sorption and surface adsorptionis the main contribution in a dry clay nanopore [14]. As a result, insmall pores (1 nm), reduction in CO2 sorption in clay nanopore ismore significant than that of methane. In contrast to clay miner-als, the reduction in methane sorption is greater than that of CO2in presence of water in carbon nanopores [18]. This is probablybecause there are no charged atoms on carbon surface [18] andCO2 sorption is less pronounced. A significant difference betweenFigs. 2 and 3 is the pronounced sorption of CO2 at low pressure at allconditions, which is mainly because the cation exchange of mont-morillonite provides additional charged molecules (sodium ions)to greatly enhance CO2–clay interaction.
Fig. 4 presents the effect of water on sorption isotherms ofmethane in clay nanopores in pore size H = 4 nm. Note that theeffect of pressure is very different in Figs. 2 and 4. But similar toa small pore (H = 1 nm), water greatly reduces methane sorp-tion. In contrast to Fig. 2, methane sorption increases with bulkpressures in both dry and wet nanopores because in large pores,methane molecules can accumulate in the middle of the pores.However, at high water content (�ave
H2O = 0.8 g/cm3), the increasein sorption with pressure is small because water not only adsorbs
on surfaces but also occupies the space in the middle of pores. Theeffect of water on sorption isotherms of CO2 in clay nanopores ina pore of size H = 4 nm is presented in Fig. 5. This plot shows
14 Z. Jin, A. Firoozabadi / Fluid Phase E
tddarp
homditpmCph
iopattsl
Fig. 4. The same as Fig. 2, but for H = 4 nm.
hat the sorption cannot be described by Langmuir isotherm forry and low density water preload condition. In dry condition,ue to strong CO2–surface interaction, CO2 may have a multi-layerdsorption and sorption increases with pressure. In general, watereduces CO2 sorption. However, when P ≤ 40 bar, sorption is com-arable for �ave
H2O = 0.4 g/cm3 and �aveH2O = 0.6 g/cm3 and slightly
igher sorption is observed at �aveH2O = 0.6 g/cm3. The presence
f water results in gas mainly in the middle of the pores. Withoderate water amount, the effect of water on the gas in the mid-
le of the pores is not significant at low pressure. As pressurencreases, CO2 sorption is higher with less water. At low water con-ent (�ave
H2O = 0.4 g/cm3), CO2 sorption gradually increases withressure, because with small amount of water, CO2 still can have aulti-layer adsorption. At high water content (�ave
H2O = 0.8 g/cm3),O2 sorption is greatly reduced and quickly reaches a plateau asressure increases. Large amount of water in the middle of the poresampers CO2 sorption.
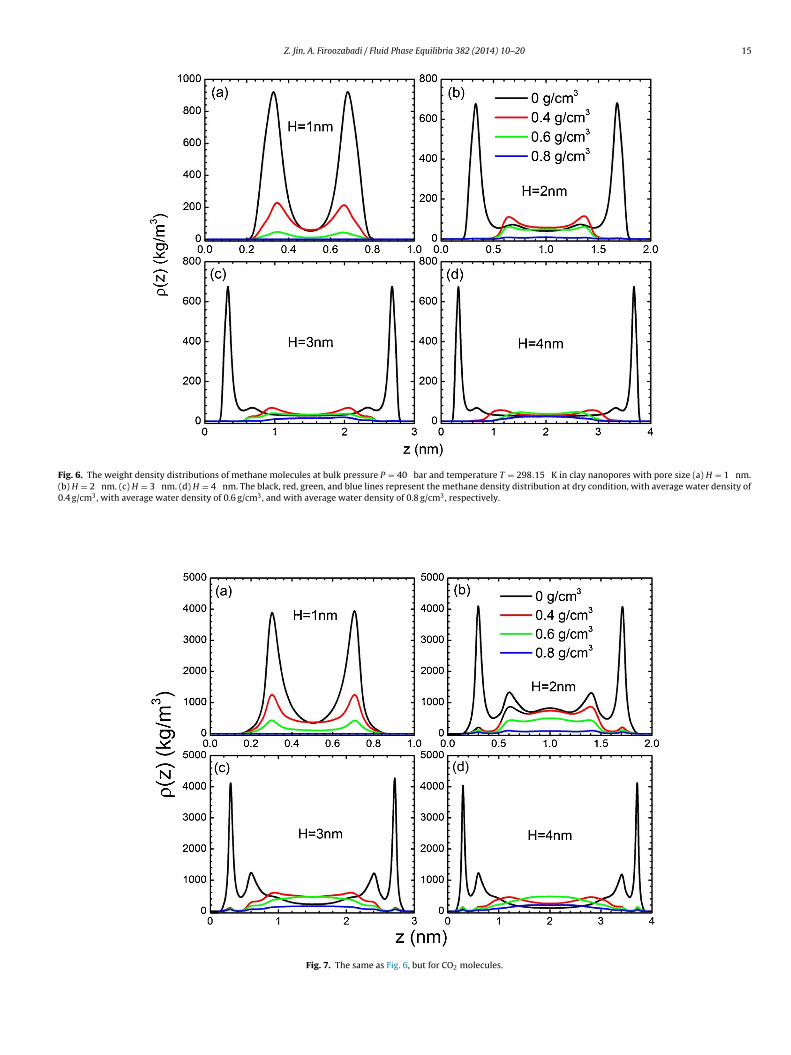
To better understand the effect of water on the structural behav-or of gas sorption, we present the weight density distributionsf methane molecules at bulk pressure P = 40 bar in differentore sizes in Fig. 6. In small pores (H = 1 nm), methane moleculesdsorb onto the clay surface regardless of the water content, but
he strength of adsorption layer decreases as water increases. Ashe pore size increases, methane molecules do not adsorb onto theame layer as water molecules but they form a second adsorbedayer (Fig. 6b). Methane molecules can also be seen in the middleFig. 5. The same as Fig. 4, but for CO2.
quilibria 382 (2014) 10–20
of the pores. In all pore sizes, water molecules are adsorbed ontothe clay surfaces due to the charge of clay atoms. Because ofweak short-range methane–clay interactions, methane forms aweak adsorption layer next to water adsorption layer. In largerpores (H≥3 nm), for moderate water densities (�ave
H2O = 0.4 g/cm3
and �aveH2O = 0.6 g/cm3), the methane density distribution in the
middle of the pore slightly exceeds the bulk limit. In the middleof the pores, water and methane may form a certain structuredue to water–methane interactions. Previous works have shownthat methane sorption in clay minerals are mainly due to surfaceadsorption [7,14]. Water molecules form a strong adsorption layerpreventing the formation of methane adsorption layer onto thesurface. As a result, methane sorption is greatly reduced in claynanopores.
The effect of water on weight density distributions of CO2molecules at bulk pressure P = 40 bar in different pore sizes is pre-sented in Fig. 7. In general, CO2 density profile is similar to methanebut the adsorption layer is stronger. In small pores (H = 1 nm), CO2molecules are adsorbed onto the clay surface. But because watermolecules predominantly adsorb on the surface, CO2 sorption isgreatly reduced. In larger pores (H≥2 nm), CO2 molecules are notseen in the first adsorbed layer; they form a second weak adsorptionlayer. CO2 molecules also accumulate in the middle of the pores.For small amount of water (�ave
H2O = 0.4 g/cm3), due to the strongCO2–H2O interactions, CO2 density distribution in the middle of thepores is higher than that without water. Comparing to methane, theelectrostatic interaction between CO2 and H2O is strong and canpartially compensate the loss of CO2 sorption due to water. How-ever, if water density is high (�ave
H2O = 0.8 g/cm3), because waterwould essentially fill up the pores, the CO2 molecules in the middleof the pores becomes less significant.
The weight density distributions of H2O molecules at bulk pres-sure P = 40 bar are shown in Fig. 8 for the system of Fig. 7. Notethat in all the plots the location of the main adsorbed layer staysthe same irrespective of water content. In small pores (H = 1 nm),water molecules are adsorbed onto the clay surfaces because ofthe charges of clay atoms. As a result, CO2 adsorption layer isgreatly diminished. As pore size increases, water molecules arefirst adsorbed onto the clay surfaces and once the adsorption layeris packed, they fill the middle of the pores. For moderate watercontent (�ave
H2O = 0.4 g/cm3 and �aveH2O = 0.6 g/cm3), the accumu-
lation of water molecules in the middle of the pores are not strong,thus CO2 molecules can fill the space. However, when the watercontent is high (�ave
H2O = 0.8 g/cm3), water molecules fill the mid-dle of the pores and as a result, CO2 content is greatly reduced.In larger pores (H≥2 nm), because water molecules dominate thesurface adsorption layer, adsorption layer of CO2 on the clay sur-faces is not observed.
Next we study the effect of water on weight density distributionof methane at high pressure of P = 100 bar in different pore sizespresented in Fig. 9. In small pores (H = 1 nm), the methane densitydistributions resemble that at the lower pressure of P = 40 bar.The density distribution of the adsorbed layer is higher than thelarger pores due to the effect of the two walls. As pore size increases,methane molecules start to accumulate in the middle of the pores.In H = 2 nm, at water average density of �ave
H2O = 0.4 g/cm3, thefirst peak of methane density distribution is higher than the secondpeak of methane density distribution in the dry condition due tothe methane–H2O interactions. However, as water average densityincreases, the first peak in methane density distribution is lowerthan the second peak of pure methane. In larger pores (H≥3 nm),the methane density distribution in the middle of pores approaches
bulk limit except for water average density of �aveH2O = 0.8 g/cm3.The weight density distributions of CO2 molecules at bulk pres-sure P = 100 bar in different size pores are presented in Fig. 10.
Z. Jin, A. Firoozabadi / Fluid Phase Equilibria 382 (2014) 10–20 15
Fig. 6. The weight density distributions of methane molecules at bulk pressure P = 40 bar and temperature T = 298.15 K in clay nanopores with pore size (a) H = 1 nm.(b) H = 2 nm. (c) H = 3 nm. (d) H = 4 nm. The black, red, green, and blue lines represent the methane density distribution at dry condition, with average water density of0.4 g/cm3, with average water density of 0.6 g/cm3, and with average water density of 0.8 g/cm3, respectively.
Fig. 7. The same as Fig. 6, but for CO2 molecules.

16 Z. Jin, A. Firoozabadi / Fluid Phase Equilibria 382 (2014) 10–20
Fig. 8. The weight density distributions of water molecules in the CO2–preloaded water system at CO2 bulk pressure P = 40 bar and temperature T = 298.15 K in claynanopores with pore size (a) H = 1 nm. (b) H = 2 nm. (c) H = 3 nm. (d) H = 4 nm. The red, green, and blue lines represent the water density distribution with averagewater density of 0.4 g/cm3, 0.6 g/cm3, and 0.8 g/cm3, respectively. (For interpretation of the references to color in this figure legend, the reader is referred to the web versionof this article.)
Fig. 9. The weight density distributions of methane molecules at bulk pressure P = 100 bar and temperature T = 298.15 K in clay nanopores with pore size (a) H = 1 nm.(b) H = 2 nm. (c) H = 3 nm. (d) H = 4 nm. The black, red, green, and blue lines represent the methane density distribution at dry condition, and average water density of0.4 g/cm3, 0.6 g/cm3, and 0.8 g/cm3, respectively. (For interpretation of the references to color in this figure legend, the reader is referred to the web version of this article.)

Z. Jin, A. Firoozabadi / Fluid Phase Equilibria 382 (2014) 10–20 17
ig. 9, b
Imrtldi
acadtMcpabli(t(tmmim
pFtlw
Fig. 10. The same as F
n this condition, CO2 is in liquid state. In dry condition, CO2 formsulti-layer adsorption. But in the presence of water, because water
educes accessible pore volume of CO2, in all pore sizes, CO2 sorp-ion is greatly reduced. Thus, only when water average density isow (�ave
H2O = 0.4 g/cm3), the CO2 density distribution in the mid-le of the pores reaches bulk limit in large pores. As water density
ncreases, the density of liquid phase CO2 in the pores decreases.The snapshots of MC simulations for configurations of methane
nd CO2 molecules in the pores corresponding to Figs. 9 and 10an be seen in Figs. 11 and 12, respectively. For methane moleculess depicted in Fig. 11, in a small pore (H = 1 nm) with low waterensity (�ave
H2O = 0.4 g/cm3), water molecules are adsorbed ontohe clay surface because of the negatively charged clay sheets.
ethane molecules are also adsorbed to the clay surface due toorrelations between the two walls and small pore spaces. In largerores (H = 4 nm) with the same water density, water moleculesre adsorbed on the clay surface, while methane molecules can onlye seen in the middle of the pores. Beyond the water adsorption
ayer, we observe methane adsorption layer due to water–methanenteractions. In a small pore (H = 1 nm) with high water density�ave
H2O = 0.8 g/cm3), because water molecules essentially fill uphe pore, there is no space for methane molecules. In larger poresH = 4 nm) with the same water density, water molecules coverhe clay surfaces and greatly reduce the accessible pore volume for
ethane molecules. As a result, only a small number of methaneolecules are observed in middle of the pore. Because methane
s hydrophobic, methane molecules do not spread within waterolecules but accumulate together.In the preloaded water for the water–CO2 systems, in a small
ore (H = 1 nm) with low water density (�aveH2O = 0.4 g/cm3),
ig. 12 shows that both water and CO2 molecules are adsorbed ontohe clay surfaces, while water molecules dominate the adsorptionayer. In larger pores (H = 4 nm) with the same water density,
ater molecules are adsorbed onto the clay surfaces while CO2
ut for CO2 molecules.
molecules are in the middle of the pore. In a small pore (H = 1 nm)with high water density (�ave
H2O = 0.8 g/cm3), water moleculesoccupy the pore and there is no room for CO2 molecules. In largerpores (H = 4 nm) with the same water density, CO2 molecules areobserved in the middle of the pore. Similar to methane molecules,CO2 molecules accumulate together.
3.2. CO2 sorption from mixtures of CO2 and H2O in the reservoir
We present the density distribution of water and CO2 moleculesin different pore sizes by fixing composition in the exterior reser-voir. The computations are based on the chemical potentials in aCO2-rich phase with CO2 mole fraction xCO2 = 0.994 in the exte-rior reservoir from Ref. [34]. All of the simulations are performedat temperature of T = 348.15 K.
The weight density distributions of CO2 and water moleculesin the nanopores at bulk pressure P = 125 bar in different poresizes are presented in Fig. 13. For comparison, we also show thedensity distribution of pure CO2 molecules at the same pressureand temperature. In the small pore (H = 1 nm), even though thewater content in reservoir outside is less than 1%, the water adsorp-tion layer dominates and there is a weak CO2 adsorption layer. Theposition of the peak CO2 density distribution of the water and CO2mixture is the same as pure CO2, but CO2 adsorption is greatlydiminished. As the pore size increases, water molecules are mainlyadsorbed onto the clay surfaces and a weak CO2 adsorption layerforms close to surface. Because water molecules are only adsorbedon the surface, CO2 forms an adsorption layer next to the wateradsorption layer and CO2 in the middle of the pores resembles thatof pure CO2. As a result, the second peak in CO2 density distribution
is stronger than the first peak. Due to strong water–clay inter-actions, water molecules mainly adsorbed onto the clay surfacesresulting in much less CO2 sorption. On the other hand, CO2 sorp-tion in clay nanopores in a dry condition is mainly due to surface
18 Z. Jin, A. Firoozabadi / Fluid Phase Equilibria 382 (2014) 10–20
Fig. 11. The snapshot of methane and water molecules for methane pressure P = 100 bar in a clay nanopore of (a) H = 1 nm and average water density of 0.4 g/cm3. (b)H = 4 nm and average water density of 0.4 g/cm3. (c) H = 1 nm and average water density of 0.8 g/cm3. (d) H = 4 nm and average water density of 0.8 g/cm3. The grayspheres are C1, the red and light gray spheres are O and H atoms of water molecules, respectively, and light blue spheres are Na+. In all of figures, the structure of clay isomitted. (For interpretation of the references to color in this figure legend, the reader is referred to the web version of this article.)
Fig. 12. The snapshot of CO2 and water molecules at CO2 pressure P = 100 bar in a clay nanopore of (a) H = 1 nm and average water density of 0.4 g/cm3. (b) H = 4 nmand average water density of 0.4 g/cm3. (c) H = 1 nm and average water density of 0.8 g/cm3. (d) H = 4 nm and average water density of 0.8 g/cm3. The gray spheres are Catoms of CO2 molecule, the red spheres are O atoms of water and CO2 molecules, the light gray spheres are H atoms of water molecules, and light blue spheres are Na+. In allof figures, the structure of clay is omitted. (For interpretation of the references to color in this figure legend, the reader is referred to the web version of this article.)

Z. Jin, A. Firoozabadi / Fluid Phase Equilibria 382 (2014) 10–20 19
Fig. 13. The weight density distributions of CO2 and water molecules for reservoir of CO2 mole fraction xCO2 = 0.994 at bulk pressure P = 125 bar and temperatureT = 348.15 K in clay nanopores of (a) H = 1 nm. (b) H = 2 nm. (c) H = 3 nm. (d) H = 4 nm. The black, red, and blue lines represent the pure CO2 density distributionat the same pressure and temperature without water, the CO2 density distribution of CO2–water mixtures, and the water density distribution of CO2–water mixtures,r reader
ars
4
nmdsdoattnta
atbstm
oots
espectively. (For interpretation of the references to color in this figure legend, the
dsorption [14]. Overall, even with little amount of water in theeservoir outside the nanopore, CO2 sorption in clay minerals areignificantly reduced.
. Conclusions
Our investigation reveals that methane and CO2 sorption in clayanopores are greatly reduced by water. This is because waterolecules cover the clay surfaces forming water adsorption layer
ue to the hydrophilic clay surfaces. In a previous study we havehown that surface adsorption is stronger in CO2 than methane inry conditions [14]. Water has a significant effect on adsorptionf CO2 and methane. When the pore size is 1 nm, water and CO2,nd water and methane adsorb in the same layer. In pores largerhan 1 nm, that is, in pores of 2, 3, and 4 nm, water adsorbs ontohe first layer, and CO2 and methane form a second weaker layerext the water adsorbed layer. The CO2 adsorbed layer is strongerhan the methane adsorbed layer. CO2 and methane molecules alsoccumulate in the middle of larger pores as pressure increases.
Water greatly reduces the CO2 sorption in clay nanopores, event very low water concentration in the exterior reservoir (mole frac-ion less than 0.01). We observe a strong water adsorption layerut a weak CO2 adsorption layer onto the clay surfaces. As the poreize increases, a second peak in CO2 density distribution forms dueo CO2–water interactions and CO2 molecules accumulate in the
iddle of pores.We also observe the formation of a strong second adsorbed layer
f CO2 both in pure dry and low water content conditions. The sec-nd layer becomes stronger with increasing pressure. As a result ofhe second layer, Langmuir adsorption model cannot describe CO2orption.
[
[
is referred to the web version of this article.)
Acknowledgement
This work was supported by member companies of the ReservoirEngineering Research Institute. Their support is greatly appreci-ated.
References
[1] T. Zhang, G.S. Ellis, S.C. Ruppel, K. Milliken, R. Yang, Effect of organic-mattertype and thermal maturity on methane adsorption in shale-gas systems, Org.Geochem. 47 (2012) 120–131.
[2] C.H. Sondergeld, R.J. Ambrose, C.S. Rai, J. Moncrieff, Micro-structural Studies ofGas Shales, Society of Petroleum Engineers, Pittsburgh, Pennsylvania, 2010, pp.131771.
[3] D.J.K. Ross, R. Marc Bustin, The importance of shale composition and pore struc-ture upon gas storage potential of shale gas reservoirs, Mar. Pet. Geol. 26 (2009)916–927.
[4] D.J.K. Ross, R.M. Bustin, Characterizing the shale gas resource potential ofDevonian–Mississippian strata in the Western Canada sedimentary basin:application of an integrated formation evaluation, AAPG Bull. 92 (2008) 87–125.
[5] P. Weniger, W. Kalkreuth, A. Busch, B.M. Krooss, High-pressure methane andcarbon dioxide sorption on coal and shale samples from the Paraná Basin, Brazil,Int. J. Coal Geol. 84 (2010) 190–205.
[6] M. Gasparik, P. Bertier, Y. Gensterblum, A. Ghanizadeh, B.M. Krooss, R. Littke,Geological controls on the methane storage capacity in organic-rich shales, Int.J. Coal Geol. 123 (2014) 34–51.
[7] L. Ji, T. Zhang, K.L. Milliken, J. Qu, X. Zhang, Experimental investigation of maincontrols to methane adsorption in clay-rich rocks, Appl. Geochem. 27 (2012)2533–2545.
[8] R. Aringhieri, Nanoporosity characteristics of some natural clay minerals andsoils, Clays Clay Miner. 52 (2004) 700–704.
[9] C.-C. Wang, L.-C. Juang, C.-K. Lee, T.-C. Hsu, J.-F. Lee, H.-P. Chao, Effects ofexchanged surfactant cations on the pore structure and adsorption character-
istics of montmorillonite, J. Colloid Interface Sci. 280 (2004) 27–35.10] P.D. Schettler Jr., C.R. Parmely, Contributions to total storage capacity in devo-nian shales, in: SPE, J, SPE 23422, 1991.
11] X.-C. Lu, F.-C. Li, A.T. Watson, Adsorption studies of natural gas storage in devo-nian shales, in: SPE Formation Evaluation, SPE 26632, 1995.
2 hase E
[
[
[
[
[[
[
[
[
[
[
[
[
[
[
[
[
[
[
[
[
[
[
[
[
[
[
[
[
[
[
[
[
[
[
[
[
0 Z. Jin, A. Firoozabadi / Fluid P
12] A. Busch, S. Alles, Y. Gensterblum, D. Prinz, D.N. Dewhurst, M.D. Raven, H. Stan-jek, B.M. Krooss, Carbon dioxide storage potential of shales, Int. J. GreenhouseGas Control 2 (2008) 297–308.
13] M. Gasparik, A. Ghanizadeh, P. Bertier, Y. Gensterblum, S. Bouw, B.M.Krooss, High-pressure methane sorption isotherms of black shales from TheNetherlands, Energy Fuels 26 (2012) 4995–5004.
14] Z. Jin, A. Firoozabadi, Methane and carbon dioxide adsorption in clay-like slitpores by Monte Carlo simulations, Fluid Phase Equilib. 360 (2013) 456–465.
15] V. Marry, P. Turq, T. Cartailler, D. Levesque, Microscopic simulation of structureand dynamics of water and counterions in a monohydrated montmorillonite,J. Chem. Phys. 117 (2002) 3454–3463.
16] C.D. Jenkins, Coalbed- and shale-gas reservoirs, J. Pet. Technol. 60 (2008) 92–99.17] M. Gasparik, A. Ghanizadeh, Y. Gensterblum, B.M. Krooss, R. Littke, The methane
storage capacity of black shales, in: 3rd EAGE Shale Wrokshop, 2012.18] P. Billemont, B. Coasne, G. De Weireld, An experimental and molecular simu-
lation study of the adsorption of carbon dioxide and methane in nanoporouscarbons in the presence of water, Langmuir 27 (2010) 1015–1024.
19] P. Billemont, B. Coasne, G. De Weireld, Adsorption of carbon dioxide, methane,and their mixtures in porous carbons: effect of surface chemistry, water con-tent, and pore disorder, Langmuir 29 (2013) 3328–3338.
20] A. Busch, Y. Gensterblum, B.M. Krooss, Methane and CO2 sorption and desorp-tion measurements on dry Argonne premium coals: pure components andmixtures, Int. J. Coal Geol. 55 (2003) 205–224.
21] S. Ottiger, R. Pini, G. Storti, M. Mazzotti, Measuring and modeling the com-petitive adsorption of CO2, CH4, and N2 on a dry coal, Langmuir 24 (2008)9531–9540.
22] S. Ottiger, R. Pini, G. Storti, M. Mazzotti, Competitive adsorption equilibria ofCO2 and CH4 on a dry coal, Adsorption 14 (2008) 539–556.
23] S.A. Mohammad, K.A.M. Gasem, Modeling the competitive adsorption of CO2
and water at high pressures on wet coals, Energy Fuels 26 (2011) 557–568.24] S. Day, R. Sakurovs, S. Weir, Supercritical gas sorption on moist coals, Int. J. Coal
Geol. 74 (2008) 203–214.25] Y. Sun, Y. Wang, Y. Zhang, Y. Zhou, L. Zhou, CO2 sorption in activated carbon in
the presence of water, Chem. Phys. Lett. 437 (2007) 14–16.26] Y. Sun, Q. Xue, Y. Zhou, L. Zhou, Sorption equilibria of CO2/CH4 mixture on
activated carbon in presence of water, J. Colloid Interface Sci. 322 (2008) 22–26.27] M. Svábová, Z. Weishauptová, O. Pribyl, The effect of moisture on the sorption
process of CO2 on coal, Fuel 92 (2012) 187–196.28] Y. Wang, Y. Zhou, C. Liu, L. Zhou, Comparative studies of CO2 and CH4 sorption
on activated carbon in presence of water, Colloids Surf., A: Physicochem. Eng.Aspects 322 (2008) 14–18.
29] A. Hildenbrand, B.M. Krooss, A. Busch, R. Gaschnitz, Evolution of methane sorp-tion capacity of coal seams as a function of burial history—a case study fromthe Campine Basin, NE Belgium, Int. J. Coal Geol. 66 (2006) 179–203.
30] M. Chavez-Paez, K.V. Workum, L.d. Pablo, J.J.d. Pablo, Monte Carlo simula-
tions of Wyoming sodium montmorillonite hydrates, J. Chem. Phys. 114 (2001)1405–1413.31] R.T. Cygan, V.N. Romanov, E.M. Myshakin, Molecular simulation of carbon diox-ide capture by montmorillonite using an accurate and flexible force field, J. Phys.Chem. C 116 (2012) 13079–13091.
[
[
quilibria 382 (2014) 10–20
32] X. Yang, C. Zhang, Structure and diffusion behavior of dense carbon dioxide fluidin clay-like slit pores by molecular dynamics simulation, Chem. Phys. Lett. 407(2005) 427–432.
33] J. Zhang, M.B. Clennell, D. Dewhurst, K. Liu, Combined Monte Carlo and molec-ular dynamics simulation of methane adsorption on dry and moist coal, Fuel122 (2014) 186–197.
34] A. Botan, B. Rotenberg, V. Marry, P. Turq, B. Noetinger, Carbon dioxide inmontmorillonite clay hydrates: thermodynamics, structure, and transport frommolecular simulation, J. Phys. Chem. C 114 (2010) 14962–14969.
35] G. Sposito, N.T. Skipper, R. Sutton, S.-h. Park, A.K. Soper, J.A. Greathouse, Sur-face geochemistry of the clay minerals, Proc. Nat. Acad. Sci. U.S.A. 96 (1999)3358–3364.
36] E.J.M. Hensen, T.J. Tambach, A. Bliek, B. Smit, Adsorption isotherms of water inLi-, Na-, and K-montmorillonite by molecular simulation, J. Chem. Phys. 115(2001) 3322–3329.
37] N.T. Skipper, F.-R. Chou Chang, G. Sposito, Monte Carlo simulation of inter-layer molecular structure in swelling clay minerals. 1. Methodology, Clays ClayMiner. 43 (1995) 285–293.
38] F.-R.C. Chang, N.T. Skipper, G. Sposito, Monte Carlo and molecular dynam-ics simulations of interfacial structure in lithium-montmorillonite hydrates,Langmuir 13 (1997) 2074–2082.
39] F.-R.C. Chang, N.T. Skipper, G. Sposito, Computer simulation of interlayermolecular structure in sodium montmorillonite hydrates, Langmuir 11 (1995)2734–2741.
40] M.G. Martin, J.I. Siepmann, Transferable potentials for phase equilibria. 1.United-atom description of n-alkanes, J. Phys. Chem. B 102 (1998) 2569–2577.
41] J.G. Harris, K.H. Yung, Carbon Dioxide’s liquid–vapor coexistence curve andcritical properties as predicted by a simple molecular model, J. Phys. Chem. 99(1995) 12021–12024.
42] H.J.C. Berendsen, J.R. Grigera, T.P. Straatsma, The missing term in effective pairpotentials, J. Phys. Chem. 91 (1987) 6269–6271.
43] D. Frankel, B. Smit, Understanding Molecular Simulation: From Algorithms toApplications, Academic Press, London, 2002.
44] K.S. Smirnov, D. Bougeard, A molecular dynamics study of structure and short-time dynamics of water in kaolinite, J. Phys. Chem. B 103 (1999) 5266–5273.
45] S.L. Mayo, B.D. Olafson, W.A. Goddard, DREIDING: a generic force field formolecular simulations, J. Phys. Chem. 94 (1990) 8897–8909.
46] Q.H. Zeng, A.B. Yu, G.Q. Lu, R.K. Standish, Molecular dynamics simulation oforganic–inorganic nanocomposites: layering behavior and interlayer structureof organoclays, Chem. Mater. 15 (2003) 4732–4738.
47] I.-C. Yeh, M.L. Berkowitz, Ewald summation for systems with slab geometry, J.Chem. Phys. 111 (1999) 3155–3162.
48] P.S. Crozier, R.L. Rowley, E. Spohr, D. Henderson, Comparison of charged sheetsand corrected 3D Ewald calculations of long-range forces in slab geometry elec-trolyte systems with solvent molecules, J. Chem. Phys. 112 (2000) 9253–9257.
49] B. Widom, Some topics in the theory of fluids, J. Chem. Phys. 39 (1963)2808–2812.
50] N. Metropolis, A.W. Rosenbluth, M.N. Rosenbluth, A.H. Teller, E. Teller, Equa-tion of state calculations by fast computing machines, J. Chem. Phys. 21 (1953)1087–1092.