Flu Outreach Campaign - Department of Public Healthpublichealth.lacounty.gov/chs/Docs/2015-2016 Flu...
119
Flu Outreach Campaign 2015-2016 Service Planning Areas 1-8 Angela Austin, RN, MSN, MPH, Flu Outreach Coordinator Leila Family, PhD Shelly Hsu, MPH Jeremy Huang, BA Stephanie Hunter, AS Sandra Kelly Zahra Mobasher, MS Sona Oksuzyan, PhD, MD, MPH, Lead Analyst Jennifer Cloud, MPH Nirvi Shah, MPH, Data Coordinator Lisa V. Smith, MS, DrPH Douglas M. Frye, MD, MPH 11/2016
Transcript of Flu Outreach Campaign - Department of Public Healthpublichealth.lacounty.gov/chs/Docs/2015-2016 Flu...

Flu Outreach Campaign2015-2016
Service Planning Areas 1-8
Angela Austin, RN, MSN, MPH, Flu Outreach Coordinator
Leila Family, PhD
Shelly Hsu, MPH
Jeremy Huang, BA
Stephanie Hunter, AS
Sandra Kelly
Zahra Mobasher, MS
Sona Oksuzyan, PhD, MD, MPH, Lead Analyst
Jennifer Cloud, MPH
Nirvi Shah, MPH, Data Coordinator
Lisa V. Smith, MS, DrPH
Douglas M. Frye, MD, MPH
11/2016

Table of Contents
Page
Acknowledgements i
Introduction 1
Methods 1
Key Findings 4
What We Learned 9
Limitations 9
Table 1. Characteristics of vaccinated flu patients (n=16,905), by Health Center Managing
the Outreach, 2015‐2016 Flu Outreach Campaign. (Preliminary Data) 11
Table 2. Characteristics of vaccinated flu patients (n=16,905), by Service Planning Area
(SPA), 2015‐2016 Flu Outreach Campaign. (Preliminary Data) 15
Table 3. Characteristics of vaccinated flu patients (n=16,905), by Insurance Type,
2015‐2016 Flu Outreach Campaign. (Preliminary Data) 17
Table 3a. Characteristics of vaccinated flu patients (n=4,313) with private insurance by
types of insurance, 2015‐2016 Flu Outreach Campaign. (Preliminary Data) 19
Table 3b. Characteristics of vaccinated flu patients (n=11,574) without private insurance
by types of insurance, 2015‐2016 Flu Outreach Campaign. (Preliminary Data) 21
Table 4. Number of flu outreaches by target population and Service Planning Area,
September 11, 2014‐February 3, 2015. (Preliminary Data) 23
Figure 1. Number of outreaches and average number of patients per outreach,
by Service Planning Area, 2015‐2016 Flu Outreach Campaign. (Preliminary Data) 24
Figure 2. Percent of patients vaccinated by venue for the 2015‐2016 Flu Outreach
Campaign. (Preliminary Data) 25
Figure 3. Number of patients vaccinated at flu outreach sites in Service Planning Area 1
(Antelope Valley) by venue (n=6), 2015‐2016 Flu Outreach Campaign 26
Figure 4. Number of patients vaccinated at flu outreach sites in Service Planning Area 2
(San Fernando) by venue (n=19), 2015‐2016 Flu Outreach Campaign 27
Figure 5. Number of patients vaccinated at flu outreach sites in Service Planning Area 3
(San Gabriel) by venue (n=30), 2015‐2016 Flu Outreach Campaign 28
Figure 6. Number of patients vaccinated at flu outreach sites in Service Planning Area 4
(Metro LA) by venue (n=26), 2015‐2016 Flu Outreach Campaign 29

Figure 7. Number of patients vaccinated at flu outreach sites in Service Planning Area 5
(West) by venue (n=11), 2015‐2016 Flu Outreach Campaign 30
Figure 8. Number of patients vaccinated at flu outreach sites in Service Planning Area 6
(South) by venue (n=29), 2015‐2016 Flu Outreach Campaign 31
Figure 9. Number of patients vaccinated at flu outreach sites in Service Planning Area 7
(East) by venue (n=14), 2015‐2016 Flu Outreach Campaign 32
Figure 10. Number of patients vaccinated at flu outreach sites in Service Planning Area 8
(South Bay) by venue (n=11), 2015‐2016 Flu Outreach Campaign 33
Figure 11. Number of Asian clients (n=6,148) vaccinated at flu outreach sites by venue type, 2015‐2016 Flu Outreach Campaign. (Preliminary data) 34
Figure 12. Number of Black/African American clients (n=742) vaccinated at flu
outreach sites by venue type, 2015‐2016 Flu Outreach Campaign. (Preliminary data) 35
Figure 13. Number of Hispanic/Latino clients (n=6,409) vaccinated at flu outreach sites by venue type, 2015‐2016 Flu Outreach Campaign. (Preliminary data) 36
Figure 14. Number of White/Non‐Hispanic clients (n=2,578) vaccinated at flu outreach sites by venue type, 2015‐2016 Flu Outreach Campaign. (Preliminary data) 37
Figure 15. Number of Native Hawaiian/Pacific Islander clients (n=97) vaccinated at flu outreach sites by venue type, 2015‐2016 Flu Outreach Campaign. (Preliminary data) 38
Figure 16. Number of American Indian/Alaskan Native clients (n=55) vaccinated at flu outreach sites by venue type, 2015‐2016 Flu Outreach Campaign. (Preliminary data) 39
Figure 17. Number of clients under age 5 (n=321) vaccinated at flu outreach sites by venue type, 2015‐2016 Flu Outreach Campaign. (Preliminary data) 40
Figure 18. Number of 5‐17 years old clients (n=2,023) vaccinated at flu outreach sites
by venue type, 2015‐2016 Flu Outreach Campaign. (Preliminary data) 41
Figure 19. Number of 18‐24 years old clients (n=1,081) vaccinated at flu outreach sites by venue type, 2015‐2016 Flu Outreach Campaign. (Preliminary data) 42
Figure 20. Number of 25‐34 years old clients (n=1,494) vaccinated at flu outreach sites by venue type, 2015‐2016 Flu Outreach Campaign. (Preliminary data) 43
Figure 20. Number of 35‐44 years old clients (n=2,393) vaccinated at flu outreach sites by venue type, 2015‐2016 Flu Outreach Campaign. (Preliminary data) 44
Figure 22. Number of 45‐54 years old clients (n=2,792) vaccinated at flu outreach sites by venue type, 2015‐2016 Flu Outreach Campaign. (Preliminary data) 45
Figure 23. Number of 55‐64 years old clients (n=3,583) vaccinated at flu outreach sites by venue type, 2015‐2016 Flu Outreach Campaign. (Preliminary data) 46

Figure 24. Number of 65‐74 years old clients (n=1,914) vaccinated at flu outreach sites by venue type, 2015‐2016 Flu Outreach Campaign. (Preliminary data) 47
Figure 25. Number of clients 75 years old or older (n=1,304) vaccinated at flu outreach sites by venue type, 2015‐2016 Flu Outreach Campaign. (Preliminary data) 48
Figure 26. Number of patients by zipcode (n=15,531), 2015‐2016 Flu Outreach
Campaign. (Preliminary Data) 49
Figure 27. Number of patients by Service Planning Area (SPA) (n=16,905), 2015‐2016 Flu
Outreach Campaign. (Preliminary Data) 50
Figure 28. Number of patients by Supervisorial District (SD) (n=16,905), 2015‐2016 Flu
Outreach Campaign. (Preliminary Data) 51
Figure 29. Number of patients by zipcode for SPA 1 (n=672), 2015‐2016 Flu Outreach
Campaign. (Preliminary Data) 52
Figure 30. Number of patients by zipcode for SPA 2 (n=2,132), 2015‐2016 Flu Outreach
Campaign. (Preliminary Data) 53
Figure 31. Number of patients by zipcode for SPA 3 (n=3,290), 2015‐2016 Flu Outreach
Campaign. (Preliminary Data) 54
Figure 32. Number of patients by zipcode for SPA 4 (n=2,697), 2015‐2016 Flu Outreach
Campaign, October. (Preliminary Data) 55
Figure 33. Number of patients by zipcode for SPA 5 (n=1,226), 2015‐2016 Flu Outreach
Campaign. (Preliminary Data) 56
Figure 34. Number of patients by zipcode for SPA 6 (n=3,020), 2015‐2016 Flu Outreach
Campaign. (Preliminary Data) 57
Figure 35. Number of patients by zipcode for SPA 7 (n=1,511), 2015‐2016 Flu Outreach
Campaign. (Preliminary Data) 58
Figure 36. Number of patients by zipcode for SPA 8 (n=983), 2015‐2016 Flu Outreach
Campaign. (Preliminary Data) 59
Figure 37. Clients vaccinated at Flu Outreach clinics, 2013‐2014, 2014‐2015 and
2015‐2016, by gender, Flu Outreach Campaign. (Preliminary data) 60
Figure 38. Clients vaccinated at Flu Outreach clinics, 2013‐2014, 2014‐2015 and
2015‐2016, by age group, Flu Outreach Campaign. (Preliminary data) 61
Figure 39. Clients vaccinated at Flu Outreach clinics, 2013‐2014, 2014‐2015 and
2015‐2016, by race/ethnicity, Flu Outreach Campaign. (Preliminary data) 62
Figure 40. Clients vaccinated at Flu Outreach clinics, 2013‐2014, 2014‐2015 and
2015‐2016, by Service Planning Area, Flu Outreach Campaign. (Preliminary data) 63

Figure 41. Clients vaccinated at Flu Outreach clinics, 2013‐2014, 2014‐2015 and
2015‐2016, by health insurance status, Flu Outreach Campaign. (Preliminary data) 64
Figure 42. Clients vaccinated at Flu Outreach clinics, 2013‐2014, 2014‐2015 and
2015‐2016, by venue type, Flu Outreach Campaign. (Preliminary data) 65
Figure 43. Uninsured clients vaccinated at Flu Outreach clinics, 2013‐2014, 2014‐2015
and 2015‐2016, by gender, Flu Outreach Campaign. (Preliminary data) 66
Figure 44. Uninsured clients vaccinated at Flu Outreach clinics, 2013‐2014, 2014‐2015
and 2015‐2016, by age group, Flu Outreach Campaign. (Preliminary data) 67
Figure 45. Number of uninsured clients vaccinated at Flu Outreach clinics, 2013‐2014,
2014‐2015 and 2015‐2016, by age group, Flu Outreach Campaign. (Preliminary data) 68
Figure 46. Uninsured clients vaccinated at Flu Outreach clinics, 2013‐2014, 2014‐2015
and 2015‐2016, by race/ethnicity, Flu Outreach Campaign. (Preliminary data) 69
Figure 47. Uninsured clients vaccinated at Flu Outreach clinics, 2013‐2014, 2014‐2015
and 2015‐2016, by Service Planning Area, Flu Outreach Campaign. (Preliminary data) 70
Figure 48. Uninsured clients vaccinated at Flu Outreach clinics, 2013‐2014, 2014‐2015
and 2015‐2016, by venue type, Flu Outreach Campaign. (Preliminary data) 71
Figure 49. Insurance status of clients vaccinated at Flu Outreach clinics, 2013‐2014,
2014‐2015 and 2015‐2016, by race/ethnicity in Service Planning Area 1
(Antelope Valley), Flu Outreach Campaign. (Preliminary data)* 72
Figure 50. Insurance status of clients vaccinated at Flu Outreach clinics, 2013‐2014,
2014‐2015 and 2015‐2016, by race/ethnicity in Service Planning Area 2
(San Fernando), Flu Outreach Campaign. (Preliminary data)* 73
Figure 51. Insurance status of clients vaccinated at Flu Outreach clinics, 2013‐2014,
2014‐2015 and 2015‐2016, by race/ethnicity in Service Planning Area 3
(San Gabriel), Flu Outreach Campaign. (Preliminary data)* 74
Figure 52. Insurance status of clients vaccinated at Flu Outreach clinics, 2013‐2014,
2014‐2015 and 2015‐2016, by race/ethnicity in Service Planning Area 4
(Metro LA), Flu Outreach Campaign. (Preliminary data)* 75
Figure 53. Insurance status of clients vaccinated at Flu Outreach clinics, 2013‐2014,
2014‐2015 and 2015‐2016, by race/ethnicity in Service Planning Area 5
(West LA), Flu Outreach Campaign. (Preliminary data)* 76
Figure 54. Insurance status of clients vaccinated at Flu Outreach clinics, 2013‐2014,
2014‐2015 and 2015‐2016, by race/ethnicity in Service Planning Area 6
(South LA), Flu Outreach Campaign. (Preliminary data)* 77

Figure 55. Insurance status of clients vaccinated at Flu Outreach clinics, 2013‐2014,
2014‐2015 and 2015‐2016, by race/ethnicity in Service Planning Area 7
(East LA), Flu Outreach Campaign. (Preliminary data)* 78
Figure 56. Insurance status of clients vaccinated at Flu Outreach clinics, 2013‐2014,
2014‐2015 and 2015‐2016, by race/ethnicity in Service Planning Area 8
(South Bay), Flu Outreach Campaign. (Preliminary data)* 79
Attachment
A1. 2015‐2016 Flu Vaccination Consent Forms 80
A2. Flu schedule template 84
A3. Flu Vaccination Inventory Log screenshot 85
A4. Cover Sheet 86
A5. CHS Influenza Form Procedures 87
A6. Codebook 90
A7. Coded Intake Form (English) 93
A8. Database screenshot 94
A9. Data Entry Protocol 95
A10. Data Entry Completion Log 98
A11. Vaccine Accountability: Table A1 99
Table A2 107
Table A3 109
A12. Table A1. Frequency counts for insurance categories for Tables 3, 3a and 3b,
2015‐2016 Flu Outreach Campaign. (Preliminary Data) 110

i
Acknowledgements CHS Administration Deborah Davenport (Director), Gema Morales‐Meyer (Deputy Director), Angela Austin (CHS Flu Outreach Coordinator) Area Health Officers Frank Alvarez (SPA 1&2), Jan King (SPA 5&6), Cristin Mondy (SPA 3&4), Silvia Prieto (SPA 7&8) Nurse Managers Angela Lozano (SPA 1&2), Leticia Kouchak (SPA 3), Rachael Lee (SPA 4), Mei Lien Chu (SPA 5&6), Lanet Balmir (SPA 5&6), Barbara Smith (SPA 7), Deloyce Warren (SPA 8) Service Planning Area 1 Terri Andal, Teri Austin, Martha Collins, Shameeka Correia‐Fill, Rogelio T Cruz, Christa Davison, Carolyn Essex, Maria Estrada, Tori L Frozina, Diane Gaines, Teresa Lynch, Ditas Joy Reyes, Charlotte Slater‐Lunsford, Shari Weary Service Planning Area 2 Jenik Ayrapetyan, Mario Baguiao, Shiarron Baker, Delmy Balette, Youghaper Bornazyan, Fabiola Bulux, Naty S Bustos, Maria N Cruley, Ovsanna Dermenjyan, Joysworth Eyitayo, Mary Jo Farrell, Ana Garcia, Julie Garcia, Wendy Gilman, Sandra Gomez, Dolores Hirsch, Mary Hwang, Maria Lieberman, Lourdes Luna, Angela Millan, Jesus R Murillo, Christine Ortiz, Alex M Pizano, Ana Ramirez, Grace Samson, Carol Van, Victoria S Victoria, Rose Visaya, Patricia Zamudio‐Ruiz Service Planning Area 3 Aurora Acain‐Lee, Monica Ai, Lovelyn Anyanwu, Veronica Caballero, Jane Chen, Paula Deng, Thi Duong, Reeza Epino, Ramiro Flores, Lydia Giron, Mercy Holguin, Kelly Ivie, Eileen James, Marie Kreimann, Marlene Kwok‐Pun, Jie Li, Ramona Lucas, Pia Magente, Virginia B Manalo, Ana Manriquez, Patty Matthew, Jean Marie Mitchell, Cam Nguyen, Evelyn s Ocampo, Ha Pham, Tristan Pham, Maria Poon, Guadalupe Santos, Theresa Tam, Anh Trinh, Carmen Ulloa‐huicochea Service Planning Area 4 Patricia Alexander, Lorena Ayala, Michael Barragan, Daniel Bellosillo, Young Cha, Sherri Chen, Geraldine Chima, Michelle Chung, Anne Coppin, Michelle Crutchfield, Marilou Dimayuga, Elizabeth Gaston Arana, Rosalba Gutierrez, Stephanie Hernandez, Lizette Jauregui Ramirez, Maria Jimenez, LaVenia Johnson, Elaine Jung, Joon Kang, Sue Kim, Heidi H Lee, Hyejoo Lee, Ana Lopez, Maria Lopez, Melany Manalo, Paula Marin, Christine Martinez, Proscovia Nambata, Abiola Orkeh, Okin Park, Debbie Poon, Veronica Rosales‐Herrera, Jan Soriano, Carol Stone, Samuel Tan, Quang Tran, Fariba Yengejeh Service Planning Area 5 Marie Daniel, Amber Griffin, Olivia Gutierrez, Liliyan Honarchian, Elizabeth Kane, Jennifer Kilburn, Jessica Levenstein, Helen Obih, Tracy Sokolow

ii
Service Planning Area 6 Olaitan Akinwumi, Gloria Anigbo, Doreen Beaupierre, Deanna Bressler‐Montgomery, Vanria Butler, Adrianna Fregosa, Laura A Gazdziak, Maribel Guzman, Aracely Herrera, Lonnie Hinton, Kathy Iverson, Nadiya Juma, Emily Mombay, Charisse Montgomery, Beatriz Navarro, Patience Nkemere, Nellie Nunez, Dorothy Obiora, Maureen Ogbo, Ada Okpoko, Shamika Ossey, Evelyn Price, Kelly Ramirez, Magdalena Reyes, Lizzeth Romero, Carmen Rubalcava, Sharon Sylvers Service Planning Area 7 Maureen T Bradley, Maria Camacho, Stella Carrion, Martha Chehadi, Mi Hae Fishman, Aprel Gabriel Johnson, Teresa Gallegos, Margilane Hernandez, Lynn Hnynh, Joylyn Jones Wint, Lori Ko, Olubunmi Levy, Yaling Li, Heidi Lopez, Anh Ly, Virginia Martinez, Lynn Nottingham, Maria Ochoa, Brenda Quintero‐Orihuela, Cynthia Ray, Alberto Rivadeneyra, Ray Samonte, Diana Sosa, Brian Wu Service Planning Area 8 Daniel Evans, Marie Gambon, Tanya Gumby, Nicole Henderson, Aurelia Hopkins, Barbara Lee, Roberto Luna, Rosa Nash, Nguyet Nguyen, Rhonda Williams, Lauren Willis, Diane Wilson Immunization Program Michelle Parra (Director), Melanie Barr, Wendi Cate, Willie Watts‐Troutman, Dulmini Wilson Community Health Services Data Entry and Data Management Team Shelly Hsu, Zahra Mobasher, Sona Oksuzyan, Nirvi Shah Division of Chronic Diseases and Injury Prevention Mirna Ponce‐Jewell Office of Health Assessment and Epidemiology Douglas Frye (OHAE Interim Director), Yajun Du, Sandra Kelly, Sun Lee, Margaret Shih (Former Director), Michelle Walker Office of Health Assessment and Epidemiology Data Entry and Data Management Team Jeremy Huang, Stephanie Hunter, Sandra Kelly, Leila Family, Jennifer Piron, Brad Du, Christine Benjamin, Lisa V. Smith

1
Flu Outreach Campaign 2015‐2016 Report Introduction Every year, the Los Angeles County (LAC) Department of Public Health (DPH) partners with community‐based organizations across the County, such as churches and senior centers, to offer influenza (flu) vaccine at no charge for individuals who either do not have health insurance or do not have access to no‐cost flu vaccinations through their regular healthcare provider. From October 2015 through April 2016, DPH administered 16,905 vaccinations at 147 outreach clinics in SPAs (Service Planning Areas) 1‐8. Community Health Services (CHS) collaborated with the Immunization Program and the Office of Health Assessment and Epidemiology (OHAE) to complete this considerable task, utilizing 427 vaccinators, 26 flu coordinators, and 10 data entry staff.
Methods Outreach Planning The influenza virus can adversely affect certain populations more than others. For this reason, it is of the utmost importance that at‐risk groups be encouraged to receive the influenza vaccination. These groups include: pregnant women; children over 6 months of age; adults 50 years of age or older; persons who are immunocompromised due to a disease or medical condition; persons who have chronic medical conditions (such as heart disease, diabetes or who are overweight or obese); persons who work or live in a nursing home or long‐term care facility; healthcare and day care workers. Flu prevention for these groups is a public health priority. To this end, the CHS flu coordinators specifically selected community venues for the 2015‐2016 flu season to target these high‐risk groups – including schools, churches, civic and community centers, cold weather shelters, homeless shelters, health fairs, libraries and skilled nursing facilities. Outreach Tracking In June 2015, the Flu Vaccination Consent Form (see Attachment A1) was developed. All questions from the previous flu season’s consent form were retained, with the exception of one, regarding agreement with the California Immunization Registry (CAIR) disclosure statement, and another, regarding eligibility for the Vaccines for Children (VFC) program. Additionally, two questions were added to 2015‐2016 form including one for age (in years or months) and a fill‐in response category for other types of health insurance. After the Consent Form was prepared, the twelve health centers in the eight Service Planning Areas participating in the outreach clinics developed schedules (see Attachment A2) with the following information:
Date of outreach
Outreach start and end times
Outreach, school, or POD designation

2
Venue Type: community or civic center, health fair, library, outreach, school, senior center, shelter
Target population (children, seniors, homeless, immunocompromised adults, etc.)
Name of outreach venue
Address of outreach venue
Supervisorial district of outreach venue
Doses administered in previous year (if the venue hosted an outreach the previous year)
Number of doses requested Outreach information from the schedules was compiled in the Flu Vaccination Inventory Log (Attachment A3) by data entry staff. This log had multiple intended uses, including documenting the receipt of cover sheets, documenting the receipt of outreach batches, assigning batches for data entry and summing the number of forms received and entered. The 2015‐2016 Cover Sheet remained unchanged from Flu Outreach 2014‐2015 campaign (Attachment A4). At the end of each outreach session, consent forms were collected and, the number of vaccines administered was recorded on the Cover Sheet, which was reviewed by the nurse‐in‐charge according to protocols in the Flu Form Procedures (Attachment A5). The completed Cover Sheet was then faxed or e‐mailed to data entry staff within three business days of the outreach. Once received by the data entry staff, information from the Cover Sheet was used to update the Vaccination Inventory Log and to update the codebook (Attachment A6) with any new vaccinator initials or vaccine lot numbers. Signed consent forms were hand‐delivered by CHS staff to OHAE staff for data entry. Upon arrival at OHAE, date of receipt and name of the staff member delivering the forms were recorded in the Vaccine Inventory Log. Batches were stored in a locked cabinet in OHAE by date. Weekly Flu Update Every week, the Flu Vaccine Inventory Log was e‐mailed to the CHS Flu Coordinator with the most recent status of all the flu outreaches, highlighting which Cover Sheets and batches were received. Beginning in December 2015, a summary of the data entry was included in the email with the following information:
Total number of outreach batches received
Number of outreaches entered
Percentage of outreaches entered
Number of forms entered
Percentage of forms entered
Number of forms not entered
Percentage of forms not entered
Reasons forms were not entered

3
Data Entry
In preparation for data entry, a codebook (Attachment A6), coded intake forms (Attachment A7) and password‐protected single‐user Microsoft Access databases (Attachment A8) were developed by data entry staff. The codebook was updated weekly as needed with new lot numbers, vaccinator initials and outreach site numbers from the Cover Sheets. A data entry protocol (Attachment A9) was also developed with instructions for handling the consent forms and completing data entry. Once batches were received in OHAE, data entry assignments were made. Data entry staff received Data Entry Completion Logs (Attachment A10) to record their completed assignments and any problems encountered during data entry. Upon completion of data entry, the Completion Log was submitted and the Flu Vaccine Inventory Log was updated with the number of forms entered and the data entry completion date. Bi‐Monthly Flu Vaccine Update As data entry progressed, three preliminary Flu Vaccine Accountability spreadsheets were emailed twice a month to the CDC Public Health Advisor (Attachment 11: Tables A1‐A3). Table A2 includes the number of doses given by age group (6 months‐2 years, 3‐6 years, 7‐18 years, 19‐49 years, 50‐64 years, and 65 years and over) and lot number for each date the health center hosted an outreach. Table A3 shows the number of doses given by age group and lot number for each health center, without stratifying by the date the vaccination was administered. Table A4 displays the number of doses given by age group for each lot number. Twenty‐one records with missing date of birth and/or age and one record with an age of less than 6 months old were excluded from analysis. The final sample for analysis consisted of 16,905 clients. Data Cleaning Rigorous data cleaning techniques were used to check for possible errors in data entry. Password‐protected Microsoft Access databases were imported via a secured network drive into SAS 9.4 software; a SAS program was created using the codebook and Cover Sheets as a reference. After completing data entry batches, data entry staff received data cleaning sheets to double‐check possible entry errors against the original flu forms. Further data cleaning ensured that patient responses were consistent with other related fields. Due to a high percentage of missing information on gender, analysts used first names to partially impute gender to improve data quality. In addition, routine checks were performed to make sure that the information on the cover sheets (such as vaccinators and lot numbers) correctly reflected the hardcopies, and in turn, the database. If any inconsistencies were found, a CHS Epidemiology Analyst and the nurse‐in‐charge at the outreach site assisted in rectifying the cover sheets.

4
Key Findings Participation DPH conducted flu outreaches from October 15, 2015 to April 7, 2016. During this time, 16,905 persons received the influenza vaccine. Clients completed a consent form, self‐reporting their current or permanent address, city and their ZIP code of residence. Most participants were located throughout Los Angeles County and attended outreaches close to their residence. Characteristics Profile (Table 1) Gender: Overall, more females than males received the influenza vaccine at the DPH outreaches (59% versus 41%, respectively). This was also true when looking at the gender distribution for outreaches by the managing health center, with Curtis Tucker Health Center having the highest percentage of females (63%) and Hollywood Wilshire (51%) the lowest. Age group: Persons receiving the flu vaccine ranged in age from 6 months to 101 years old (mean = 46, SD = 21; data not shown). Many clients were in the targeted older age groups – age 55‐64 years (21%) or 65+ (19%) – and an additional 14% were children between 6 months and 17 years of age. Outreach events run by Pacoima Health Center had the highest percentage of children (33%), whereas Curtis Tucker outreach events had the highest percentage of persons age 65 years or older (37%). According to the consent forms received, one child less than 6 months of age was vaccinated and was excluded from analyses. Race/Ethnicity: Overall, Hispanic and Asian clients accounted for the largest proportions of clients receiving influenza vaccines (38% and 36%, respectively), followed by Whites at 15%. Only 4% of persons receiving the flu vaccine at outreach sites identified as Black or African American. However, race/ethnicity representation varied by health center‐operated outreach site. Asian clients accounted for the majority of persons receiving flu vaccine at Hollywood Wilshire (77%), Monrovia (67%), Simms Mann Burke (57%), Central (55%) and Pomona (52%) health centers. In contrast, Hispanic clients represented the majority of persons at outreaches for North Hollywood (73%), Martin Luther King Jr. Center for Public Health (64%), Pacoima (58%) and Whittier (58%). Language of the Survey: Overall, most clients who received the influenza vaccination opted to fill out the consent form in English (65%), while 22% of clients used the Spanish form, 10% used the Korean form, and 3% the Chinese form. Distribution of consent form languages varied across managing health centers. Insurance Status: Many outreach clients, 31%, indicated they were uninsured, while 26% indicated that they had private insurance. Insurance status varied across managing health centers. Outreach events managed by Martin Luther King, Jr. Center for Public Health had the highest percentage of uninsured clients (41%), while those managed by Curtis Tucker health center had the lowest (18%).

5
Vaccine Type: The vast majority of vaccine administered was inactivated (98%) with live attenuated vaccine covering only 2%. Live attenuated flu vaccine was used in Martin Luther King, Jr. Center for Public Health, Antelope Valley, Central, Curtis Tucker and Simms Mann Burke outreaches with the highest proportion utilized in Antelope Valley (7%). All other health centers utilized the inactivated vaccine only. Manufacturer: The majority of vaccines administered were from the manufacturer Sanofi‐Pasteur (74%), followed by Novartis (23%), Glaxo Smith Kline (2%), and MedImmune (2%). Site of Injection: At DPH health center‐managed influenza outreaches, the majority of clients received the vaccination in their left deltoid (79%). The remainder received the vaccine in the right deltoid (18%), intranasally (2%), in the left thigh (1%) or the right thigh (<1%).
Service Planning Areas (Table 2) Gender: The gender distribution of vaccine recipients was similar across Service Planning Areas. Approximately 59% of all clients were female and 41% male. SPA 8 had the highest percentage of females (63%) and SPA 4 had the lowest (54%). Age group: The age distribution of clients varied greatly by SPA. SPA 1 vaccinated the largest proportion of 6‐month to 17‐year‐old clients (28%, 201/710), while SPA 8 vaccinated the largest proportion of persons aged 65 years and older (36%, 366/1,011). Race/Ethnicity: Asians represented the majority of clients in SPA 3, SPA 4 and SPA 5 (56%, 63% and 57%, respectively); SPA 6 vaccinated the largest proportion of African Americans (11%) compared to other SPAs. Hispanics represented the majority of clients in SPA 2 (57%), SPA 6 (64%) and SPA 7 (58%). The highest proportion of whites was vaccinated in SPA 8 (36%). Native Hawaiians/Pacific Islanders and American Indians/Alaskan Natives accounted for 1% or less of clients that received the flu vaccination at DPH outreaches. Language of the Survey: Survey languages varied greatly throughout the county: SPA 8 utilized the largest proportion of English surveys (89%); SPA 6 utilized the largest proportion of Spanish surveys (47%); SPA 3 utilized the largest proportion of Chinese surveys (11%); and SPAs 4 and 5 utilized the largest proportion of Korean surveys (34% and 30%, respectively). Insurance Status: SPA 8 had the largest proportion of Medicare recipients (22%), while SPA 1 had the largest proportion of Medicaid recipients (35%). The largest proportion of privately insured individuals that were vaccinated was in SPA 8 (34%) followed by SPA 3 (32%). In contrast, SPA 6 had the largest proportion of uninsured clients (41%), followed by SPA 5 (38%). SPA 4 had the largest proportion of respondents who did not know their insurance status (5%).

6
Vaccine Type: Most of the vaccine utilized during the flu outreach campaign for the 2015‐2016 season was inactivated (98%). SPAs 2, 3, and 7 administered only inactivated vaccine; SPA 1 and SPA 6 administered the largest proportion of live vaccine (7% and 6%, respectively). Manufacturer: Most of the flu vaccine utilized during the outreaches was manufactured by Sanofi‐Pasteur (74%). SPA 8 administered the largest proportion of Sanofi‐Pasteur vaccine (95%), while SPA 5 administered the largest proportion of Novartis vaccine (98%) and SPA 1 administered the largest proportion of MedImmune vaccine (7%). The largest proportion of Glaxo Smith Kline vaccine was administered by SPA 6 (9%). Characteristics by insurance type (Table 3) The Department of Public Health vaccinated 16,905 clients, about a third of which were uninsured (n=5,210; 31%). Slightly over a quarter of clients had private insurance (n=4,313; 26%) and slightly less than a quarter had Medicaid (n=3,833; 23%). Gender: When stratifying by gender, Medicaid had the highest proportion of females (61%) and Medicare had the highest proportion of males (45%). However, overall it appears that females and males follow similar patterns of health insurance coverage, but additional analyses would be necessary to confirm this. Age: The vast majority of clients who had Medicare (82%) were 65 or older, although they comprised only 19% of the total sample. Twenty percent of those using Medicaid were 5‐17 years old, even though the sample had only 12% persons of that age group. Clients aged 35‐54 comprised 31% of the sample, but 41% of them did not have any health insurance. Clients aged 55‐64 years (21% in the total sample) accounted for the largest proportion of those using other types of insurances (29%), private insurance (23%), and of those who did not have health insurance (24%). Race/Ethnicity: Asian clients constituted 45% of those who were privately insured despite only 36% of the sample identifying as Asian. Clients who utilized Medicaid were largely Hispanic (49% versus 38% of the sample), followed by Asians (30% versus 36% of the sample). While whites made up only 15% of the sample, they accounted for the largest percentage of those who had Medicare (36%). The majority of the uninsured or who did not know their insurance status were Hispanic/Latino (51% and 44%, respectively). Language of the Survey: Overall, English speakers made up the majority of respondents (65%), a higher percentage of those with private insurance and on Medicare (83% and 82%, respectively). Spanish surveys were used by 22% of respondents, however, over a third of uninsured clients were Spanish‐speakers (36%). Manufacturer: The Sanofi‐Pasteur vaccine was the most frequently utilized vaccine for all insurance types, including 78% of Medicare clients, 78% of Medicaid clients, 74% of clients with private insurance, and 71% of clients with no health insurance.

7
Insurance types (Tables 3a and 3b) Tables 3a and 3b displays characteristics of people with and without private insurance, stratified by co‐insurance options (clients were able to choose more than one insurance type for the survey). Twenty six percent of clients (n=4,313) reported having private insurance (private only or some combination of private insurance and Medicare, Medicaid and/or other insurance). Of the 16,905 clients vaccinated, 68% were without private insurance – that is they did not know their insurance status, were uninsured, or had some combination of Medicare, Medicaid and/or other insurance; n=11,574). Of those without private insurance, 45% did not any type of insurance (n=5,210). (Note: In Table 3a the category for private insurance plus Medicare and Medicaid overlaps with categories for private insurance plus Medicare or private insurance plus Medicaid, while in Table 3b there is no overlap. More detailed frequency counts for insurance categories and their cross‐tabulations are presented in Attachment Table A4.) Target Populations (Table 4) Outreach efforts were implemented to reach certain high‐risk populations to ensure that they were receiving the vaccine. Specifically, outreach efforts targeted children (1%), seniors (8%), and homeless (16%). The remaining outreach efforts had multiple targeted populations. In fact, 61% of outreaches were targeted to all specified groups. Number of outreach events (Figure 1) Overall, the Department of Public Health offered 147 flu outreach events throughout Los Angeles County. On average, DPH vaccinated 115 clients per event. All Los Angeles County Service Planning Areas participated in this flu outreach campaign. SPAs 3 and 6 managed the most events (n=30 each). The largest average number of clients per outreach was seen in SPA 3, with approximately 127 clients per event. Percent of clients vaccinated by venue (Figure 2) Clients were vaccinated at a variety of venues throughout Los Angeles County. The highest percentage of clients was vaccinated at churches (37%; n=6,212), followed by community centers (12%; n=2,029), libraries (11%; n=1,916) and senior centers (11%; n=1,888). Number of clients vaccinated by venue and by SPA (Figures 3‐10) As stated above, many clients were vaccinated at church venues. Antelope Valley (SPA 1), San Gabriel Valley (SPA 3), Metro (SPA 4), West (SPA 5) and South (SPA 6) had the highest number of clients vaccinated at their church‐based outreach sites, with the highest number in SPA 3 (n=1,691). The venue location type with the highest number of clients vaccinated at San Fernando Valley (SPA 2) and South Bay (SPA 8) outreach sites was community centers (n=466

8
and n=409, respectively). Senior centers were the venue location that reached the most clients at East L.A. (SPA 7) outreach sites (n=620). Number of clients vaccinated by venue and by race group (Figures 11‐16) Church venues were the most popular locations for Asian, Black/African American, Hispanic/Latino, and Native Hawaiian/Pacific Islander clients to receive the flu vaccination. The highest number of White/Non‐Hispanic clients was vaccinated at senior centers (n=593), followed by libraries (n=497) and community centers (n=459). Venues that reached the highest numbers of American Indians/Native Alaskans clients were senior centers (n=12), followed by homeless shelters (n=10), community centers (n=8), and libraries (n=8). Number of clients vaccinated by venue and by age group (Figures 17‐25) When stratifying by age groups, almost all age groupings had the highest number of clients vaccinated at church outreaches. The exceptions to this are the 75 years and older group, which was more frequently vaccinated at senior centers (n=488), and young adults in 18‐24 years old age group, which were vaccinated more frequently at schools (n=403). Maps (Figures 26‐36) Flu outreach sites were operated throughout Los Angeles County. A majority of persons receiving the flu vaccine were located in ZIP codes that were close to one of the outreach locations (Figure 26). SPA 3 (San Gabriel), SPA 4 (Metro LA) and SPA 6 (South) had the most Los Angeles County residents vaccinated (Figure 27). When analyzing by Supervisorial District, districts 1 and 2 had the highest number of persons vaccinated (Figure 28). Though most clients were located near the outreach sites, many clients resided in a ZIP code that was not close to the outreach that they attended (Figures 29‐36). Characteristics of clients vaccinated at flu outreach clinics during three years of flu outreach campaigns 2013‐2014, 2014‐2015 and 2015‐2016 (Figures 37‐42) Although the number of persons vaccinated during flu outreach campaigns decreased in 2015‐2016 (n=16,905) compared to the two previous years (n=20,607 in 2013‐2014 and n=20,953 in 2014‐2015), the distribution of many socio‐demographic factors of clients did not vary over time. The distribution of gender did not change over three years of flu outreach campaigns (59% females and 41% males for all three flu seasons). The client’s age group distribution over the three flu campaigns also remained fairly steady with the highest percentage of those vaccinated being aged 55‐64 years old (ranging from 21% to 23%). Little variation was also seen over the three flu campaigns regarding race, with Hispanics/Latinos (ranging from 39% to 41%) and Asians (ranging from 33% to 37%) constituting the majority of clients. Overall, the distribution of clients by SPA did not vary, with the highest percentage vaccinated in SPA 3 (21‐24%), followed by SPA 6 (18‐20%).

9
There were some differences in the health insurance status of clients over the three years of data. The percentage of uninsured clients decreased over three years (from 39% in 2013‐2014 to 35% in 2014‐2015 and 31% in 2015‐2016). In contrast, the percentage of clients with private health insurance increased (from 20% in 2013‐2014 to 27% in 2014‐2015 and 26% in 2015‐2016). Although venue types where clients were vaccinated changed slightly over time, the highest percentage of clients was consistently vaccinated at churches, followed by outreach (random locations, e.g. parks, service centers, theaters, where flu outreach took place) (23%) in 2013‐2014 and by community centers in 2014‐2015 and 2015‐2016 (16% and 12%, respectively). Percentage of uninsured clients vaccinated at flu outreach clinics in 2013‐2014, 2014‐2015 and 2015‐2016, by gender, age group, race/ethnicity, SPA, insurance status and venue type (Figure 43‐48) The distribution of gender among uninsured clients did not vary over three years of flu outreach campaigns (60‐62% females, 38‐40% males). The distribution of clients by age group also did not change notably over time, with the exception of the 55‐64 year age group, which constituted 33% of all uninsured clients in 2013‐2014, but only 24% and 23% in 2014‐2015 and 2015‐2016, respectively. In all three flu outreach campaigns the highest percentage of uninsured clients was Hispanics/Latinos (52‐56%) followed by Asians (31‐37%). The distribution of uninsured clients by SPA did not vary considerably over three years with the highest percentage of uninsured being vaccinated in SPA 6 (23‐25%), followed by SPA 4 (17‐21%). In all three years of flu outreach campaigns, the highest percentage of uninsured clients was vaccinated at churches (38‐45%). Health insurance status of clients vaccinated at flu outreach clinics in 2013‐2014, 2014‐2015 and 2015‐2016, by race/ethnicity and by SPA (Figure 49‐56) Although health insurance status varied by race/ethnicity in all three years of flu outreach campaigns and by Service Planning Areas, the highest percentage of uninsured was consistently Hispanic/Latino clients with some exceptions: Asians in SPA 5 (2014‐2015), Native Hawaiian/Pacific Islanders in SPA 2 (2015‐2016) and Americans Indians/Alaskan Natives (AI/AN) in SPAs 1‐6 and 8 (2013‐2014). Note: an extremely small number of Native Hawaiian/Pacific Islanders and Americans Indians/Alaskan Natives determined the higher percentage of uninsured; for example, in SPA 8 just one uninsured of AI/AN origin made 100% (2013‐2014 flu outreach).

10
Limitations Results from the Influenza Outreach Campaign are subject to several limitations. First, results may be subject to recall bias because analysis relied on self‐reported data. The patient filled out the first half of the Vaccine Consent Form, including socio‐demographic characteristics, while the nursing staff completed the vaccine information in the second half. This process may lead to some misclassification and cause some measures to be under‐ or over‐reported. Missing data is also a pervasive problem with assessment surveys. Checking for completed forms before the patient leaves the flu outreach is essential to maintaining the integrity of the data and its usefulness. Lastly, the results of this survey may not be generalizable to the general population because data was collected from specific outreach sites in Los Angeles County – they were not chosen in a random fashion. It is important to note that this is a not a longitudinal study and the results should not be interpreted or be used in such a manner.
What We Learned One of the goals of the DPH‐operated annual flu campaigns is to vaccinate the uninsured. This flu season was no exception, with over 5,000 vaccinated clients (31%) reporting that they had no health insurance. It is also important to note that over 10,000 people with private and public (Medicare and Medicaid) insurance received a flu shot. These results demonstrate that these free flu clinics serve both as a “safety net” for the uninsured and as a preferred provider for some who are insured. This report highlighted efforts to immunize targeted populations such as children, seniors, homeless and immunocompromised adults and outreaches were conducted in a variety of venues to reach these groups. We learned that it is important to offer the consent form in multiple languages as only 65% of clients completed the English consent form.
Finally, the success of this flu campaign can be attributed to the tremendous work of the hundreds of staff members and volunteers who completed a massive task of tracking and entering approximately 17,000 outreach forms.

Table1.Characteristicsofvaccinated
fluclients(n=16,905)byHealthCen
terManagingtheOutreach,20152016FluOutreach
Cam
paign
(Prelim
inaryData).
Characteristics1
,2n
%n
%n
%n
%n
%n
%n
%
Number
ofOutreaches
147
100
64
20
14
11
73
26
430
20
Total
16,905
100
710
100
1,876
100
1,011
100
376
100
1,074
100
3,253
100
Gender
Male
6,863
41
289
41
826
44
367
36
152
40
522
49
1,243
38
Female
9,923
59
421
59
1,043
56
640
63
223
59
548
51
1,983
61
Age
(Years)
Under
5321
227
426
15
<15
124
245
1
517
2,023
12
174
25
172
940
439
10
103
10
409
13
1824
1,081
626
4160
932
38
258
5356
11
2534
1,494
970
10
183
10
59
627
789
8401
12
3544
2,393
14
98
14
350
19
97
10
38
10
142
13
510
16
4554
2,792
17
98
14
325
17
149
15
58
15
181
17
650
20
5564
3,583
21
118
17
443
24
263
26
72
19
290
27
547
17
6574
1,914
11
60
8155
8188
19
72
19
128
12
222
7
75yearsandolder
1,304
839
562
3178
18
57
15
59
5113
3
Race/Ethnicity
Asian
6,148
36
74
10
1,032
55
278
28
95
25
830
77
339
10
Black/African
American
742
441
6137
730
36
212
1359
11
Hispanic/Latino
6,409
38
345
49
516
28
256
25
72
19
80
72,098
64
White/NonHispanic
2,578
15
186
26
99
5364
36
170
45
110
10
223
7
NativeHaw
aiian/PacificIslander
97
16
113
113
11
<18
15
<1
American
Indian/Alaskan
Native
55
<14
18
02
03
11
<16
<1
Mixed
/Multiethnic
250
111
221
116
210
2.66
19
251
2
Other
206
119
310
124
213
35
<127
1
LanguageofSurvey
English
10,961
65
553
78
1,066
57
901
89
354
94
541
50
1,723
53
Spanish
3,727
22
157
22
240
13
110
11
15
442
41,529
47
Chinese
478
351
32
11
< 1
Korean
1,739
10
519
28
51
491
46
AntelopeValley
Central
CurtisTu
cker
Glendale
Hollywood
Wilshire
MLK
Jr.
CenterforPublic
Health
Health
CenterMan
agingtheOutreach
Total
CommunityHealthServices
/Epidem
iology
Unit/313N.FigueroaSt,R
oom
117,LosAngeles,CA/zm
[email protected]/07.11.16
11

Table1.Characteristicsofvaccinated
fluclients(n=16,905)byHealthCen
terManagingtheOutreach,20152016FluOutreach
Cam
paign
(Prelim
inaryData).
Characteristics1
,2n
%n
%n
%n
%n
%n
%n
%
Number
ofOutreaches
147
100
64
20
14
11
73
26
430
20
Total
16,905
100
710
100
1,876
100
1,011
100
376
100
1,074
100
3,253
100
AntelopeValley
Central
CurtisTu
cker
Glendale
Hollywood
Wilshire
MLK
Jr.
CenterforPublic
Health
Health
CenterMan
agingtheOutreach
Total
Insurance
Status
Med
icare
1,830
11
51
799
5222
22
84
22
80
7172
5
Med
icaid/M
ediCal
3,833
23
249
35
434
23
170
17
73
19
228
21
733
23
Private
insurance
4,313
26
172
24
456
24
346
34
96
26
278
26
640
20
Uninsured
5,210
31
166
23
665
35
181
18
87
23
373
35
1,333
41
Don'tKnow
633
417
2106
628
312
339
4136
4
Other
341
215
228
124
214
442
432
1
Pregnan
t36
<110
11
<11
<18
<1
VaccineType
Inactivated
16,645
98
662
93
1,871
100
998
99
376
100
1,074
100
3,060
94
Live
260
248
75
<113
1193
6
Man
ufacturer
SanofiPasteur
12,541
74
652
92
1,665
89
962
95
358
95
1,066
99
2,154
66
Novartis
3,809
23
10
1206
11
36
418
58
1611
19
Med
Immune
260
248
75
<113
1193
6
Glaxo
SmithKline
295
2295
9
Site
ofInjection
Leftdeltoid
13,161
79
479
67
1,549
83
757
75
337
90
906
84
1,885
58
Rightdeltoid
3,073
18
173
24
281
15
115
11
33
9160
15
1,135
35
Leftthigh
214
110
124
1118
12
21
61
7<1
Rightthigh
47
<13
<14
<11
<12
<18
<1
Intranasal
260
248
75
<113
1193
61Missingvalues
notshown.
2Numbersandpercentagesmay
exceed
100%dueto
multipleresponsesand/orrounding.
CommunityHealthServices
/Epidem
iology
Unit/313N.FigueroaSt,R
oom
117,LosAngeles,CA/zm
[email protected]/07.11.16
12

Table1.Characteristicsofvaccinated
fluclients(n=16,905)byHealthCen
terManagingtheOutreach,20152016FluOutreach
Cam
paign
(Prelim
inaryData).
Characteristics1
,2n
%
Number
ofOutreaches
147
100
Total
16,905
100
Gender
Male
6,863
41
Female
9,923
59
Age
(Years)
Under
5321
2
517
2,023
12
1824
1,081
6
2534
1,494
9
3544
2,393
14
4554
2,792
17
5564
3,583
21
6574
1,914
11
75yearsandolder
1,304
8
Race/Ethnicity
Asian
6,148
36
Black/African
American
742
4
Hispanic/Latino
6,409
38
White/NonHispanic
2,578
15
NativeHaw
aiian/PacificIslander
97
1
American
Indian/Alaskan
Native
55
<1
Mixed
/Multiethnic
250
1
Other
206
1
LanguageofSurvey
English
10,961
65
Spanish
3,727
22
Chinese
478
3
Korean
1,739
10
Total
n%
n%
n%
n%
n%
n%
10
77
59
620
14
11
714
10
1,002
100
877
100
992
100
2,814
100
1,335
100
1,585
100
417
42
343
39
409
41
1,109
39
575
43
611
39
571
57
534
61
581
59
1,664
59
750
56
965
61
15
226
341
452
229
226
2
106
11
169
19
286
29
243
9148
11
134
8
31
375
945
5188
732
270
4
69
7108
12
90
9216
874
6108
7
130
13
166
19
159
16
319
11
198
15
186
12
171
17
132
15
136
14
428
15
208
16
256
16
244
24
140
16
141
14
613
22
322
24
390
25
117
12
46
556
6450
16
176
13
242
15
119
12
15
236
4305
11
148
11
173
11
676
67
117
13
145
15
1,470
52
762
57
330
21
71
10
110
163
250
417
1
209
21
637
73
573
58
628
22
81
6914
58
76
865
7171
17
510
18
364
27
240
15
61
4<1
1<1
17
15
<118
1
1<1
1<1
81
10
<13
<18
1
51
91
32
330
127
219
1
4<1
10
120
233
117
124
2
749
75
397
45
618
62
2,008
71
875
66
1,176
74
81
8480
55
374
38
232
860
4407
26
172
17
252
9
322
11
400
30
2<1
Whittier
North
Hollywood
Pacoim
aMonrovia
Health
CenterMan
agingtheOutreach
Pomona
SimmsMan
n
Burke
CommunityHealthServices
/Epidem
iology
Unit/313N.FigueroaSt,R
oom
117,LosAngeles,CA/zm
[email protected]/07.11.16
13
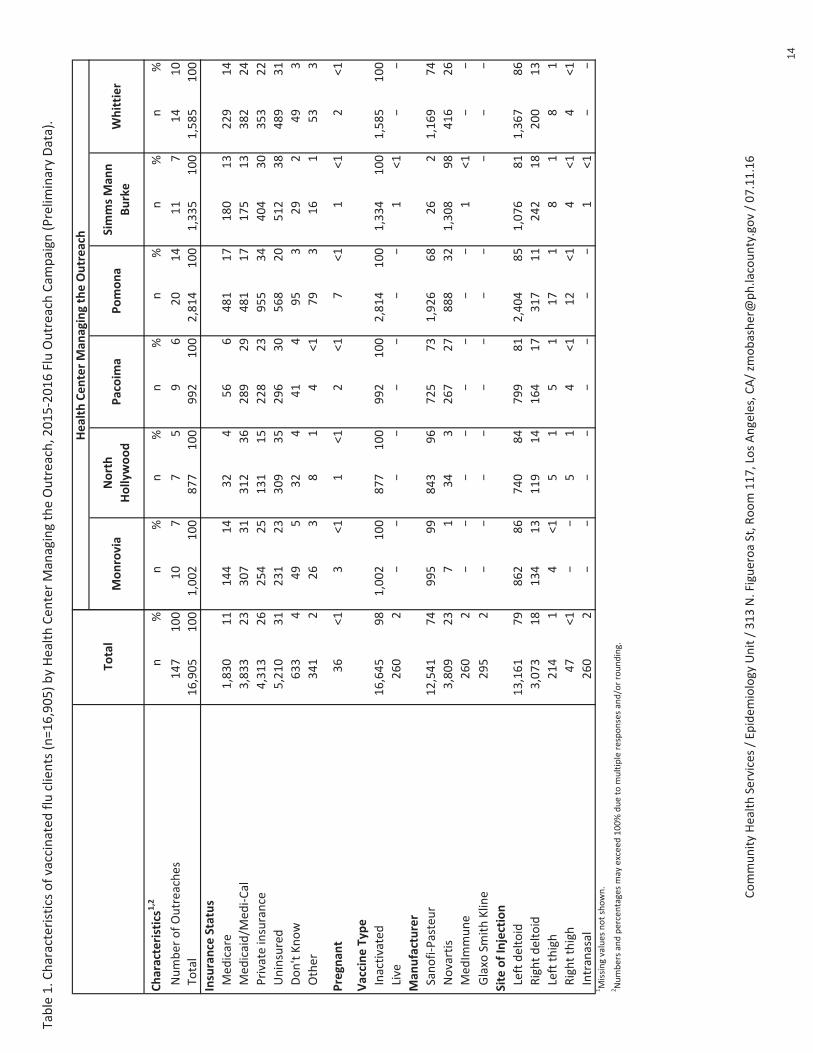
Table1.Characteristicsofvaccinated
fluclients(n=16,905)byHealthCen
terManagingtheOutreach,20152016FluOutreach
Cam
paign
(Prelim
inaryData).
Characteristics1
,2n
%
Number
ofOutreaches
147
100
Total
16,905
100
Total
Insurance
Status
Med
icare
1,830
11
Med
icaid/M
ediCal
3,833
23
Private
insurance
4,313
26
Uninsured
5,210
31
Don'tKnow
633
4
Other
341
2
Pregnan
t36
<1
VaccineType
Inactivated
16,645
98
Live
260
2
Man
ufacturer
SanofiPasteur
12,541
74
Novartis
3,809
23
Med
Immune
260
2
Glaxo
SmithKline
295
2
Site
ofInjection
Leftdeltoid
13,161
79
Rightdeltoid
3,073
18
Leftthigh
214
1
Rightthigh
47
<1
Intranasal
260
21 M
issingvalues
notshown.
2 Numbersandpercentagesmay
exceed
100%dueto
multipleresponsesand/orrounding.
n%
n%
n%
n%
n%
n%
10
77
59
620
14
11
714
10
1,002
100
877
100
992
100
2,814
100
1,335
100
1,585
100
Whittier
North
Hollywood
Pacoim
aMonrovia
Health
CenterMan
agingtheOutreach
Pomona
SimmsMan
n
Burke
144
14
32
456
6481
17
180
13
229
14
307
31
312
36
289
29
481
17
175
13
382
24
254
25
131
15
228
23
955
34
404
30
353
22
231
23
309
35
296
30
568
20
512
38
489
31
49
532
441
495
329
249
3
26
38
14
<179
316
153
3
3<1
1<1
2<1
7<1
1<1
2<1
1,002
100
877
100
992
100
2,814
100
1,334
100
1,585
100
1<1
995
99
843
96
725
73
1,926
68
26
21,169
74
71
34
3267
27
888
32
1,308
98
416
26
1<1
862
86
740
84
799
81
2,404
85
1,076
81
1,367
86
134
13
119
14
164
17
317
11
242
18
200
13
4<1
51
51
17
18
18
1
51
4<1
12
<14
<14
<1
1<1
CommunityHealthServices
/Epidem
iology
Unit/313N.FigueroaSt,R
oom
117,LosAngeles,CA/zm
[email protected]/07.11.16
14

Table2.Characteristicsofvaccinated
fluclients(n=16,905)byServicePlanningArea(SPA),20152016FluOutreach
Cam
paign
(Prelim
inaryData).
n%
n%
n%
n%
n%
n%
n%
n%
n%
NumberofOutreaches
147
100
64
19
13
30
20
26
18
11
730
20
14
10
11
7
Total
16,905
100
710
1002,245
1003,816
1002,950
100
1,335
1003,253
1001,585
1001,011
100
Gender
Male
6,863
41
289
41
904
40
1,526
40
1,348
46
575
431,243
38
611
39
367
36
Female
9,923
59
421
591,338
602,235
591,591
54
750
561,983
61
965
61
640
63
Age
(Years)
Under
5321
227
472
367
250
229
245
126
25
<1
517
2,023
12
174
25
494
22
349
9275
9148
11
409
13
134
840
4
1824
1,081
626
4128
6219
6218
732
2356
11
70
432
3
2534
1,494
970
10
225
10
285
7272
974
6401
12
108
759
6
3544
2,393
14
98
14
363
16
449
12
492
17
198
15
510
16
186
12
97
10
4554
2,792
17
98
14
326
15
599
16
506
17
208
16
650
20
256
16
149
15
5564
3,583
21
118
17
353
16
857
22
733
25
322
24
547
17
390
25
263
26
6574
1,914
11
60
8176
8567
15
283
10
176
13
222
7242
15
188
19
75yearsandolder
1,304
839
5108
5424
11
121
4148
11
113
3173
11
178
18
Race/Ethnicity
Asian
6,148
36
74
10
357
162,146
561,862
63
762
57
339
10
330
21
278
28
Black/African
American
742
441
626
170
2149
550
4359
11
17
130
3
Hispanic/Latino
6,409
38
345
491,282
57
837
22
596
20
81
62,098
64
914
58
256
25
White/NonHispanic
2,578
15
186
26
406
18
586
15
209
7364
27
223
7240
15
364
36
NativeHaw
aiian/PacificIslander
97
16
16
<123
121
15
<15
<118
113
1
American
Indian/Alaskan
Native
55
<14
112
111
<19
<13
<16
<18
12
<1
Mixed
/Multiethnic
250
111
251
235
140
127
251
219
116
2
Other
206
119
343
237
115
117
127
124
224
2
LanguageofSurvey
English
10,961
65
553
781,369
612,757
721,607
54
875
66
1723
531,176
74
901
89
Spanish
3,727
22
157
22
869
39
313
8282
10
60
41529
47
407
26
110
11
Chinese
478
32
<1424
11
51
21
<1
Korean
1,739
10
5<1
322
81,010
34
400
30
2<1
SPA3
SanGab
riel
SPA4
Metro
Characteristics1
,2SPA5
West
SPA6
South
SPA7
East
SPA8
South
Bay
Total
ServicePlanningAreas
SPA1
Antelope
Valley
SPA2
San
Fernan
do
CommunityHealthServices
/Epidem
iology
Unit/313NFigueroaSt,R
oom
117,LosAngeles,CA/[email protected]
15

Table2.Characteristicsofvaccinated
fluclients(n=16,905)byServicePlanningArea(SPA),20152016FluOutreach
Cam
paign
(Prelim
inaryData).
n%
n%
n%
n%
n%
n%
n%
n%
n%
SPA3
SanGab
riel
SPA4
Metro
Characteristics1
,2SPA5
West
SPA6
South
SPA7
East
SPA8
South
Bay
Total
ServicePlanningAreas
SPA1
Antelope
Valley
SPA2
San
Fernan
do
Insurance
Status
Med
icare
1,830
11
51
7172
8625
16
179
6180
13
172
5229
14
222
22
Med
icaid/M
ediCal
3,833
23
249
35
674
30
788
21
662
22
175
13
733
23
382
24
170
17
Private
4,313
26
172
24
455
201,209
32
734
25
404
30
640
20
353
22
346
34
Uninsured
5,210
31
166
23
692
31
799
211,038
35
512
381,333
41
489
31
181
18
Don'tKnow
633
417
285
4144
4145
529
2136
449
328
3
Other
341
215
226
1105
370
216
132
153
324
2
Pregnan
t
Yes
36
<14
<110
<111
<11
<18
<12
<1
VaccineType
Inactivated
16,645
98
662
932,245
1003,816
1002,945
100
1,334
1003,060
941,585
100
998
99
Live
260
248
75
<11
<1193
613
1
Man
ufacturer
SanofiPasteur
12,541
74
652
921,926
862,921
772,731
93
26
22,154
661,169
74
962
95
Novartis
3,809
23
10
1319
14
895
23
214
71,308
98
611
19
416
26
36
4
Med
Immune
260
248
75
<11
<1193
613
1
Glaxo
SmithKline
295
2295
9
Site
ofInjection
Leftdeltoid
13,161
78
479
671,876
843,266
862,455
83
1,076
811,885
581,367
86
757
75
Rightdeltoid
3,073
18
173
24
316
14
451
12
441
15
242
181,135
35
200
13
115
11
Leftthigh
214
110
112
121
130
18
17
<18
1118
12
Rightthigh
47
<110
<112
<15
<14
<18
<14
<14
<1
Intranasal
260
248
75
<11
<1193
613
11Missingvalues
notshown.
2Numbersandpercentagesmay
exceed
100%dueto
multipleresponsesand/orrounding.
CommunityHealthServices
/Epidem
iology
Unit/313NFigueroaSt,R
oom
117,LosAngeles,CA/[email protected]
16

Table3.Characteristicsofvaccinated
fluclients(n=16,905)byInsurance
Type,20152016FluOutreach
Cam
paign.(Prelim
inaryData)
n%
n%
n%
n%
n%
n%
n%
Total
16,905
100
1,830
11
3,833
23
4,313
26
5,210
31
633
4341
2
Gender
Male
6,863
41
827
45
1,479
39
1,799
42
2,086
40
272
43
134
39
Female
9,923
59
989
54
2,320
61
2,495
58
3,082
59
357
56
205
60
Age
(Years)
Under
5321
25
<1155
478
248
19
14
1
517
2,023
12
40
2779
20
489
11
466
988
14
16
5
1824
1,081
621
1238
6413
10
242
5117
18
17
5
2534
1,494
926
1338
9412
10
548
11
67
11
26
8
3544
2,393
14
40
2439
11
625
14
1,061
20
81
13
24
7
4554
2,792
17
73
4515
13
780
18
1,095
21
92
15
48
14
5564
3,583
21
133
7760
20
1,004
23
1,225
24
127
20
98
29
6574
1,914
11
826
45
357
9290
7383
729
548
14
75yearsandolder
1,304
8666
36
252
7222
5142
323
460
18
Race/Ethnicity
Asian
6,148
36
573
31
1,150
30
1,936
45
1,875
36
250
39
128
38
Black/African
American
742
480
4236
6182
4144
327
413
4
Hispanic/Latino
6,409
38
405
22
1,870
49
814
19
2,648
51
277
44
86
25
White/NonHispanic
2,578
15
660
36
371
10
1,096
25
287
641
689
26
NativeHaw
aiian/PacificIslander
97
114
117
<143
117
<13
<13
1
American
Indian/Alaskan
Native
55
<110
120
110
<113
<13
<1
Mixed
/Multiethnic
250
113
162
2112
340
112
27
2
Other
206
129
236
152
159
19
15
1
LanguageofSurvey
English
10,961
65
1,503
82
2,368
62
3,565
83
2,421
46
391
62
259
76
Spanish
3,727
22
167
91,055
28
238
61,874
36
154
24
34
10
Chinese
478
375
4149
485
2131
313
27
2
Korean
1,739
10
85
5261
7425
10
784
15
75
12
41
12
Characteristics1
,2To
tal
Other
Insurance
TypeofInsurance
Medicare
Medicaid
Private
NotInsured
DoesNot
Know
CommunityHealthServices
/Epidem
iology
Unit/313NFigueroaSt,R
oom
117,LosAngeles,CA/[email protected]
17

Table3.Characteristicsofvaccinated
fluclients(n=16,905)byInsurance
Type,20152016FluOutreach
Cam
paign.(Prelim
inaryData)
n%
n%
n%
n%
n%
n%
n%
Characteristics1
,2To
tal
Other
Insurance
TypeofInsurance
Medicare
Medicaid
Private
NotInsured
DoesNot
Know
Pregnan
t
Yes
36
<11
<112
<112
<15
<11
<1
VaccineType
Inactivated
16,645
98
1,824
100
3,774
98
4,298
100
5,077
97
613
97
341
100
Live
260
26
<159
215
<1133
320
3
Man
ufacturer
SanofiPasteur
12,541
74
1,425
78
2,994
78
3,209
74
3,675
71
501
79
272
80
Novartis
3,809
23
389
21
712
19
1,040
24
1,278
25
99
16
65
19
Med
Immune
260
26
<159
215
<1124
220
3
Glaxo
SmithKline
295
210
168
249
1133
313
24
1
Site
ofinjection
Leftdeltoid
13,161
78
1,485
81
2,944
77
3,501
81
3,939
76
463
73
277
81
Rightdeltoid
3,073
18
291
16
722
19
665
15
1,062
20
131
21
61
18
Leftthigh
214
129
248
180
237
110
21
<1
Rightthigh
47
<11
<120
113
<17
<12
<12
1
Intranasal
260
26
<159
215
<1133
320
31Missingvalues
notshown.
2Numbersandpercentagesmay
exceed
100%dueto
multipleresponsesand/orrounding.
CommunityHealthServices
/Epidem
iology
Unit/313NFigueroaSt,R
oom
117,LosAngeles,CA/[email protected]
18

Table 3a. Characteristics of vaccinated flu clients with private insurance (n=4,313) by types of insurance, 2015 2016 Flu
Outreach Campaign. (Preliminary Data).
Characteristics n % n % n % n % n % n %
Total1, 2 4,313 100 4,214 100 1 100 84 100 13 100 3 100
Gender
Male 1,799 42 1,764 42 1 100 28 33 7 54 1 33
Female 2,495 58 2,432 58 56 67 5 38 2 67
Age (Years)Under 5 78 2 77 2 1 85 17 489 11 487 12 2 15 1 3318 24 413 10 411 10 1 825 34 412 10 411 10 1 835 44 625 14 624 15 1 845 54 780 18 779 18 1 155 64 1,004 23 999 24 2 1 4 3165 74 290 7 241 6 1 100 47 56 2 15 1 3375 years and older 222 5 185 4 35 42 1 8 1 33
Race/Ethnicity
Asian 1,936 45 1,912 45 18 21 6 46
Black/African American 182 4 178 4 1 100 4 5 1 8
Hispanic/Latino 814 19 800 19 12 14 1 8 1 33
White/Non Hispanic 1,096 25 1,043 25 48 57 3 23 2 67
Native Hawaiian/Pacific Islander 43 1 42 1 1 1
American Indian/Alaskan Native 10 <1 9 <1 1 8
Mixed/Multiethnic 112 3 111 3 1 8
Other 52 1 51 1 1 1
Language of Survey
English 3,565 83 3,469 82 1 100 83 99 11 85 3 100
Spanish 238 6 238 6
Chinese 85 2 84 2 1 1
Korean 425 10 423 10 2 15
Pregnant
Yes 12 <1 12 <1
No 4,299 100 4,200 100 1 100 84 100 13 100 3 100
Type of vaccine
Inactivated 4,298 100 4,199 100 1 100 84 100 13 100 3 100
Live 15 <1 15 <1
ManufacturerSanofi Pasteur 3,209 74 3,133 74 1 100 67 80 8 62 2 67Novartis 1,040 24 1,017 24 17 20 5 38 1 33MedImmune 15 <1 15 <1Glaxo Smith Kline 49 1 49 1
Plus other
With private insurance
Total Private only
Plus
Medicare &
Medicaid
Plus
Medicare
Plus
Medicaid
Community Health Services / Epidemiology Unit / 313 N Figueroa St, Room 117, Los Angeles, CA 90012 /[email protected]

Table 3a. Characteristics of vaccinated flu clients with private insurance (n=4,313) by types of insurance, 2015 2016 Flu
Outreach Campaign. (Preliminary Data).
Characteristics n % n % n % n % n % n %
Plus other
With private insurance
Total Private only
Plus
Medicare &
Medicaid
Plus
Medicare
Plus
Medicaid
Site of injection
Left deltoid 3,501 81 3,424 81 65 77 9 69 3 100
Right deltoid 665 15 649 15 13 15 3 23
Left thigh 80 2 74 2 1 100 6 7 1 8
Right thigh 13 <1 13 <1
Intranasal 15 <1 15 <11Missing values not shown.
2Numbers and percentages may exceed 100% due to multiple responses and/or rounding.
Community Health Services / Epidemiology Unit / 313 N Figueroa St, Room 117, Los Angeles, CA 90012 /[email protected]

Table3b.Characteristicsofvaccinated
fluclientswithoutprivate
insurance
(n=11,574)bytypes
ofinsurance,20152016FluOutreach
Cam
paign.(Prelim
inaryData).
n%
n%
n%
n%
n%
n%
n%
n%
n%
Total1,2
11,574
100
1,575
14
3,665
32
153
118
<12
<1318
35,210
45
633
5
Gender
Male
4,682
40
719
46
1,401
38
71
46
950
150
124
39
2,086
40
272
43
Female
6,803
59
847
54
2,237
61
77
50
950
150
193
61
3,082
59
357
56
Age
(Years)
Under
5220
25
<1154
44
148
19
1517
1,387
12
40
3777
21
16
5466
988
14
1824
633
521
1237
616
5242
5117
18
2534
1,001
923
1334
93
226
8548
11
67
11
3544
1,639
14
35
2433
12
53
24
81,061
20
81
13
4554
1,814
16
64
4507
14
85
48
15
1,095
21
92
15
5564
2,328
20
122
8746
20
10
798
31
1,225
24
127
20
6574
1,525
13
712
45
297
857
37
10
56
150
36
11
383
729
575yearsandolder
1,027
9553
35
180
570
46
844
150
50
16
142
323
4
Race/Ethnicity
Asian
3,885
34
489
31
1,079
29
64
42
211
150
125
39
1,875
36
250
39
Black/African
American
489
470
4229
66
413
4144
327
4
Hispanic/Latino
5,214
45
336
21
1,816
50
52
34
528
150
79
25
2,648
51
277
44
White/NonHispanic
1,359
12
587
37
343
925
16
11
61
76
24
287
641
6
NativeHaw
aiian/Pacific
53
<113
117
<13
117
<13
<1
American
Indian/Alaskan
44
<19
118
<11
113
<13
<1
Mixed
/Multiethnic
132
112
160
21
17
240
112
2
Other
134
125
233
13
25
259
19
1
LanguageofSurvey
English
6,739
58
1,316
84
2,269
62
86
56
18
100
2100
236
74
2,421
46
391
62
S panish
3,249
28
132
81,020
28
35
23
34
11
1,874
36
154
24
Chinese
348
348
3123
326
17
72
131
313
2
Korean
1,238
11
79
5253
76
441
13
784
15
75
12
Medicare&
Medicaid
Medicare
&other
Characteristics
Withoutprivate
insurance
Uninsured
Doesnot
know
Medicaid
&other
Otheronly
Total
Medicare
only
Medicaid
only
CommunityHealthServices
/Epidem
iology
Unit/313NFigueroaSt,R
oom
117,LosAngeles,CA90012/[email protected]
21

Table3b.Characteristicsofvaccinated
fluclientswithoutprivate
insurance
(n=11,574)bytypes
ofinsurance,20152016FluOutreach
Cam
paign.(Prelim
inaryData).
n%
n%
n%
n%
n%
n%
n%
n%
n%
Medicare&
Medicaid
Medicare
&other
Characteristics
Withoutprivate
insurance
Uninsured
Doesnot
know
Medicaid
&other
Otheronly
Total
Medicare
only
Medicaid
only
Pregnan
t
Yes
19
<11
<112
<15
<11
<1
No
11,518
100
1,572
100
3,642
99
153
100
18
100
2100
316
99
5,184
100
631
100
Typeofvaccine
Inactivated
11,356
98
1,569
100
3,606
98
153
100
18
100
2100
318
100
5,077
97
613
97
Live
218
26
<159
2133
320
3
Man
ufacturer
SanofiPasteur
8,639
75
1,209
77
2,851
78
133
87
16
89
2100
252
79
3,675
71
501
79
Novartis
2,499
22
351
22
688
19
19
12
211
62
20
1,278
25
99
16
Med
Immune
218
26
<159
2133
320
3
Glaxo
SmithKline
218
29
167
21
14
1124
213
2
Site
ofinjection
Leftdeltoid
8,893
77
1,284
82
2,811
77
122
80
14
78
2100
258
81
3,939
76
463
73
Rightdeltoid
2,219
19
246
16
691
19
28
18
422
57
18
1,062
20
131
21
Leftthigh
118
123
147
11
<137
110
2
Rightthigh
32
<11
<120
12
17
<12
<1
Intranasal
218
26
<159
2133
320
31Missingvalues
notshown.
2Numbersandpercentagesmay
exceed
100%dueto
multipleresponsesand/orrounding.
CommunityHealthServices
/Epidem
iology
Unit/313NFigueroaSt,R
oom
117,LosAngeles,CA90012/[email protected]
22

Table4.N
umber
offluoutreaches
conducted
from
10/15/154/7/16,bytarget
population,ineach
ServicePlanningArea(Prelim
inaryData).
TargetPopulations1
,2n
%n
%n
%n
%n
%n
%n
%n
%n
%
Number
ofOutreaches
147
100
6100
18
100
31
100
26
100
11
100
30
100
14
100
11
100
All
89
61
583
12
67
14
45
14
54
436
22
73
964
982
Children
21
211
Children&Im
muneCompromised
Adults
11
19
Children,Sen
iors&Im
muneCompromised
Adults
10
71
66
19
14
19
19
Homeless
23
16
117
211
723
519
436
310
17
Homeless&
ImmuneCompromised
Adults
96
519
413
Seniors
12
81
64
13
218
13
429
Seniors
&Im
muneCompromised
Adults
11
14
1Percentagesmay
exceed
100%dueto
rounding.
2Target
populationsaredefined
byCHSadministration.
SPA4
Metro
SPA5
West
Total
SPA6
South
SPA7
East
SPA8
South
Bay
ServicePlanningAreas
SPA1
Antelope
SPA2San
Fernan
do
SPA3San
Gab
riel
CommunityHealthServices
/Epidem
iology
Unit/313NFigueroaSt,R
oom
127,LosAngeles,CA/[email protected]
23

CommunityHealthService/Epidem
iology
Unit/313N.FigueroaSt,R
oom
127,LosAngeles,CA/[email protected]
Figure
1.N
umberofoutreachesan
daverage
numberofclientsperoutreach,b
yServicePlanningArea(SPA),20152016Flu
OutreachCam
paign.(Prelim
inaryData)
6
19
30
26
11
30
14
11
147
118
118
127
113
121
108
113
92
115
0
20
40
60
80
100
120
140
160
SPA1
SPA2
SPA3
SPA4
SPA5
SPA6
SPA7
SPA8
Total
NumberofoutreachesandtheaveragenumberofpatientsperoutreachbySPA
Number
ofoutreaches
Average
number
ofpatientsper
outreach
ServicePlanningArea(SPA)
24

Com
mun
ity H
eal
th S
ervi
ces
/ 31
3 N
. F
igue
roa
St.
Roo
m 1
17 /
Los
Ang
eles
, C
A 9
0012
/ s
oksu
zyan
@ph
.laco
unty.g
ov
Figure
2.P
ercentofclientsvaccinatedbyvenuetypeforthe20152016FluVaccinationCam
paign.(Prelim
inaryData)
<1%
37%
1%
<1%
12%
8%
2%
1%
11%
<1%
6%
9%
11%
0%
5%
10%
15%
20%
25%
30%
35%
40%
Charter
School
(n=39)
Church
(n=6,212)CivicCen
ter
(n=225)
Cold
Weather
Shelter
(n=42)
Community
Cen
ter
(n=2,029)
HealthFair
(1,403)
Homeless
Shelter
(n=396)
Homless
Shelter
(n=89)
Library
(n=1,916)
Other
(n=8)
Outreach
(n=1,089)
School
(n=1,569)
Senior
Cen
ter
(n=1,888)
Percentofclients
Venue
25

Com
mun
ity H
eal
th S
ervi
ces
/ 31
3 N
. F
igue
roa
St.
Roo
m 1
17 /
Los
Ang
eles
, C
A 9
0012
/ n
sha
h@p
h.la
coun
ty.g
ov,
soks
uzya
n@
ph.la
coun
ty.g
ov
Figure
3.N
umberofclientsvaccinatedat
fluoutreachsitesinServicePlanningArea1(AntelopeValley)byvenuetype(n=6),
20152016FluOutreachCam
paign.(Prelim
inarydata)
386
30
112
182
147.0
0
50
100
150
200
250
300
350
400
450
Church(n=3)
CivicCenter(n=1)
ColdWeather
Shelter
(n=1)
Library
(n=1)
Numberofclients
Venue(numberofoutreaches)
26

Com
mun
ity H
eal
th S
ervi
ces
/ 31
3 N
. F
igue
roa
St.
Roo
m 1
17 /
Los
Ang
eles
, C
A 9
0012
/ n
sha
h@p
h.la
coun
ty.g
ov,
soks
uzya
n@
ph.la
coun
ty.g
ov
Figure
4.N
umberofclientsvaccinatedat
fluoutreachsitesinServicePlanningArea2(San
Fernan
do)byvenuetype(n=19),2015
2016FluOutreachCam
paign.(Prelim
inarydata)
120
225
466
36
450
462
352
134
288.5
0
50
100
150
200
250
300
350
400
450
500
Church
(n=2)
CivicCen
ter
(n=1)
Community
Cen
ter
(n=3)
Homeless
Shelter
(n=3)
Library
(n=5)
Outreach
(n=2)
School
(n=2)
SeniorCen
ter
(n=1)
Numberofclients
Venue(numberofoutreaches)
27

Com
mun
ity H
eal
th S
ervi
ces
/ 31
3 N
. F
igue
roa
St.
Roo
m 1
17 /
Los
Ang
eles
, C
A 9
0012
/ n
sha
h@p
h.la
coun
ty.g
ov,
soks
uzya
n@
ph.la
coun
ty.g
ov
Figure
5.N
umberofclientsvaccinatedat
fluoutreachsitesinServicePlanningArea3(San
Gab
riel)byvenuetype(n=30),2015
2016FluOutreachCam
paign.(Prelim
inarydata)
1,691
658
68
329
294
776
493.5
0
200
400
600
800
1000
1200
1400
1600
1800
Church
(n=8)
CommunityCen
ter
(n=6)
HomelessShelter
(n=5)
Library
(n=3)
School
(n=1)
SeniorCen
ter
(n=7)
Numberofclients
Venue(numberofoutreaches)
28

Com
mun
ity H
eal
th S
ervi
ces
/ 31
3 N
. F
igue
roa
St.
Roo
m 1
17 /
Los
Ang
eles
, C
A 9
0012
/ n
sha
h@p
h.la
coun
ty.g
ov,
soks
uzya
n@
ph.la
coun
ty.g
ov
Figure
6.N
umberofclientsvaccinatedat
fluoutreachsitesinServicePlanningArea4(M
etroLA
)byvenuetype(n=26),20152016
FluOutreachCam
paign.(Prelim
inarydata)
1,595
236
278
323
309
104
105
278.0
0
200
400
600
800
1000
1200
1400
1600
1800
Church
(n=6)
CommunityCen
ter
(n=2)
HomelessShelter
(n=10)
Library
(n=4)
Outreach
(n=2)
School
(n=1)
SeniorCen
ter
(n=1)
Numberofclients
Venue(numberofoutreaches)
29

Com
mun
ity H
eal
th S
ervi
ces
/ 31
3 N
. F
igue
roa
St.
Roo
m 1
17 /
Los
Ang
eles
, C
A 9
0012
/ n
sha
h@p
h.la
coun
ty.g
ov,
soks
uzya
n@
ph.la
coun
ty.g
ov
Figure
7.N
umberofclientsvaccinatedat
fluoutreachsitesinServicePlanningArea5(W
est)byvenuetype(n=11),20152016Flu
OutreachCam
paign.(Prelim
inarydata)
825
137
67
145
8
153
141.0
0
100
200
300
400
500
600
700
800
900
Church
(n=2)
CommunityCen
ter
(n=1)
HomelessShelter
(n=3)
Library
(n=2)
Other
(n=1)
SeniorCen
ter
(n=2)
Numberofclients
Venue(numberofoutreaches)
30

Com
mun
ity H
eal
th S
ervi
ces
/ 31
3 N
. F
igue
roa
St.
Roo
m 1
17 /
Los
Ang
eles
, C
A 9
0012
/ n
sha
h@p
h.la
coun
ty.g
ov,
soks
uzya
n@
ph.la
coun
ty.g
ov
Figure
8.N
umberofclientsvaccinatedat
fluoutreachsitesinServicePlanningArea6(South)byvenuetype(n=29),20152016Flu
OutreachCam
paign.(Prelim
inarydata)
1,161
123
1,036
36
60
169
529
100
123.0
0
200
400
600
800
1,000
1,200
1,400
Church
(n=10)
Community
Cen
ter
(n=1)
HealthFair
(n=8)
Homeless
Shelter
(n=3)
Library
(n=2)
Outreach
(n=1)
School
(n=2)
SeniorCen
ter
(n=2)
Numberofclients
Venue(numberofoutreaches)
31

Com
mun
ity H
eal
th S
ervi
ces
/ 31
3 N
. F
igue
roa
St.
Roo
m 1
17 /
Los
Ang
eles
, C
A 9
0012
/ n
sha
h@p
h.la
coun
ty.g
ov,
soks
uzya
n@
ph.la
coun
ty.g
ov
Figure
9.N
umberofclientsvaccinatedat
fluoutreachsitesinServicePlanningArea7(East)byvenuetype(n=14),20152016Flu
OutreachCam
paign.(Prelim
inarydata)
434
12
370
149
620
370.0
0
100
200
300
400
500
600
700
Church
(n=3)
ColdWeather
Shelter
(n=1)
Library
(n=4)
Outreach
(n=2)
SeniorCen
ter
(n=4)
Numberofclients
Venue(numberofoutreaches)
32
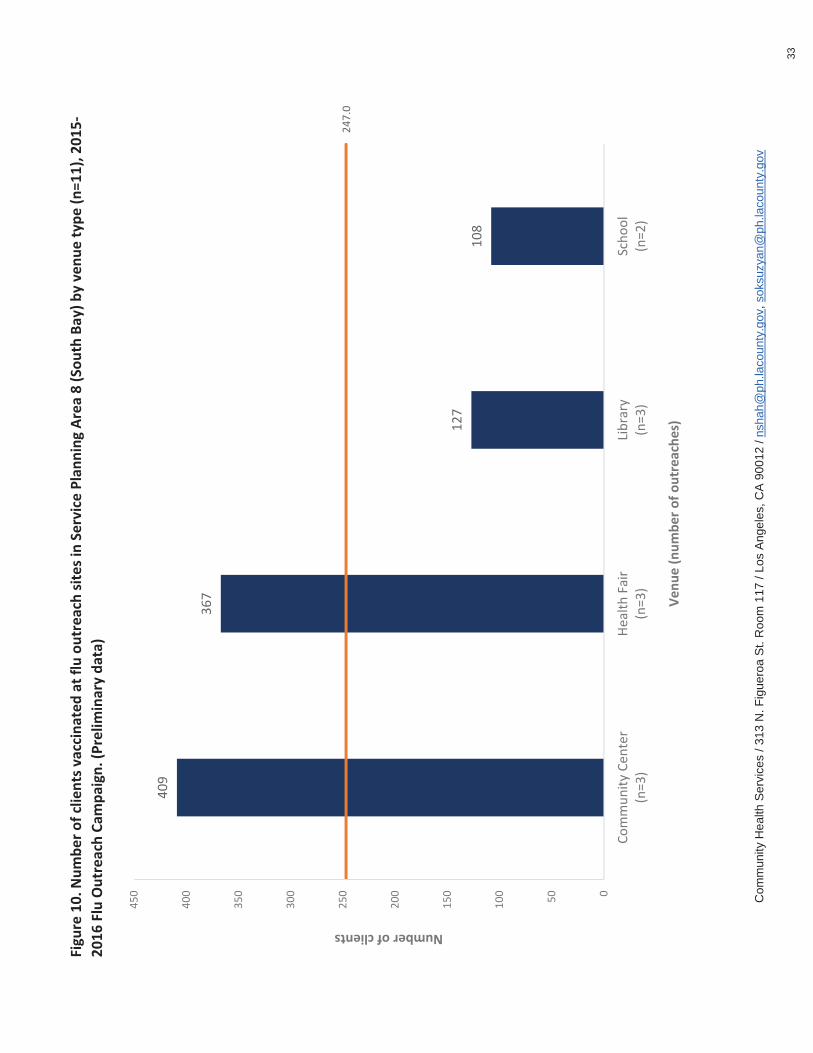
Com
mun
ity H
eal
th S
ervi
ces
/ 31
3 N
. F
igue
roa
St.
Roo
m 1
17 /
Los
Ang
eles
, C
A 9
0012
/ n
sha
h@p
h.la
coun
ty.g
ov,
soks
uzya
n@
ph.la
coun
ty.g
ov
Figure
10.N
umberofclientsvaccinatedat
fluoutreachsitesinServicePlanningArea8(South
Bay)byvenuetype(n=11),2015
2016FluOutreachCam
paign.(Prelim
inarydata)
409
367
127
108
247.0
0
50
100
150
200
250
300
350
400
450
CommunityCen
ter
(n=3)
HealthFair
(n=3)
Library
(n=3)
School
(n=2)
Numberofclients
Venue(numberofoutreaches)
33

Com
mun
ity H
eal
th S
ervi
ces
/ 31
3 N
. F
igue
roa
St.
Roo
m 1
17 /
Los
Ang
eles
, C
A 9
0012
/ s
oksu
zyan
@ph
.laco
unty.g
ov
Figure
11.N
umberofAsian
clients(n=6,148)vaccinatedat
fluoutreachsitesbyvenuetype,20152016FluOutreachCam
paign.
(Prelim
inarydata)
0
3,679
79
2
676
146
17
469
090
381
609
0
500
1000
1500
2000
2500
3000
3500
4000
CharterSchool
Church
CivicCen
ter
ColdWeather
Shelter
Community
Cen
ter
HealthFair
Homeless
Shelter
Library
Other
Outreach
School
SeniorCen
ter
Numberofclients
Ven
ue
34

Com
mun
ity H
eal
th S
ervi
ces
/ 31
3 N
. F
igue
roa
St.
Roo
m 1
17 /
Los
Ang
eles
, C
A 9
0012
/ s
oksu
zyan
@ph
.laco
unty.g
ov
Figure
12.N
umberofBlack/A
frican
Americanclients(n=742)vaccinatedat
fluoutreachsitesbyvenuetype,
20152016FluOutreachCam
paign.(Prelim
inarydata)
0
194
28
38
113
147
68
1
104
28
39
0
50
100
150
200
250
Charter
School
Church
CivicCenter
Cold
Weather
Shelter
Community
Cen
ter
HealthFair
Homeless
Shelter
Library
Other
Outreach
School
Senior
Cen
ter
Numberofclients
Ven
ue
35

Com
mun
ity H
eal
th S
ervi
ces
/ 31
3 N
. F
igue
roa
St.
Roo
m 1
17 /
Los
Ang
eles
, C
A 9
0012
/ s
oksu
zyan
@ph
.laco
unty.g
ov
Figure
13.N
umberofHispan
ic/Latinoclients(n=6,409)vaccinatedat
fluoutreachsitesbyvenuetype,20152016FluOutreachCam
paign.
(Prelim
inarydata)
33
1,751
42
16
747
834
177
728
2
765
789
525
0
200
400
600
800
1,000
1,200
1,400
1,600
1,800
2,000
Charter
School
Church
CivicCenter
Cold
Weather
Shelter
Community
Cen
ter
HealthFair
Homeless
Shelter
Library
Other
Outreach
School
Senior
Cen
ter
Numberofclients
Ven
ue
36

Com
mun
ity H
eal
th S
ervi
ces
/ 31
3 N
. F
igue
roa
St.
Roo
m 1
17 /
Los
Ang
eles
, C
A 9
0012
/ s
oksu
zyan
@ph
.laco
unty.g
ov
Figure
14.N
umberofWhite/N
onHispan
icclients(n=2,578)vaccinatedat
fluoutreachsitesbyvenuetype,20152016FluOutreach
Cam
paign.(Prelim
inarydata)
3
323
80
13
459
188
82
497
1
64
275
593
0
100
200
300
400
500
600
700
Charter
School
Church
CivicCenter
Cold
Weather
Shelter
Community
Cen
ter
HealthFair
Homeless
Shelter
Library
Other
Outreach
School
Senior
Cen
ter
Numberofclients
Ven
ue
37

Com
mun
ity H
eal
th S
ervi
ces
/ 31
3 N
. F
igue
roa
St.
Roo
m 1
17 /
Los
Ang
eles
, C
A 9
0012
/ s
oksu
zyan
@ph
.laco
unty.g
ov
Figure
15.N
umberofNativeHaw
aiian/PacificIslanderclients(n=97)vaccinatedat
fluoutreachsitesbyvenuetype,
20152016FluOutreachCam
paign.(Prelim
inarydata)
0
39
10
13
4
2
10
0
5
7
16
05
10
15
20
25
30
35
40
45
Charter
School
Church
CivicCenter
Cold
Weather
Shelter
Community
Cen
ter
HealthFair
Homeless
Shelter
Library
Other
Outreach
School
Senior
Cen
ter
Nubmerofclients
Ven
ue
38
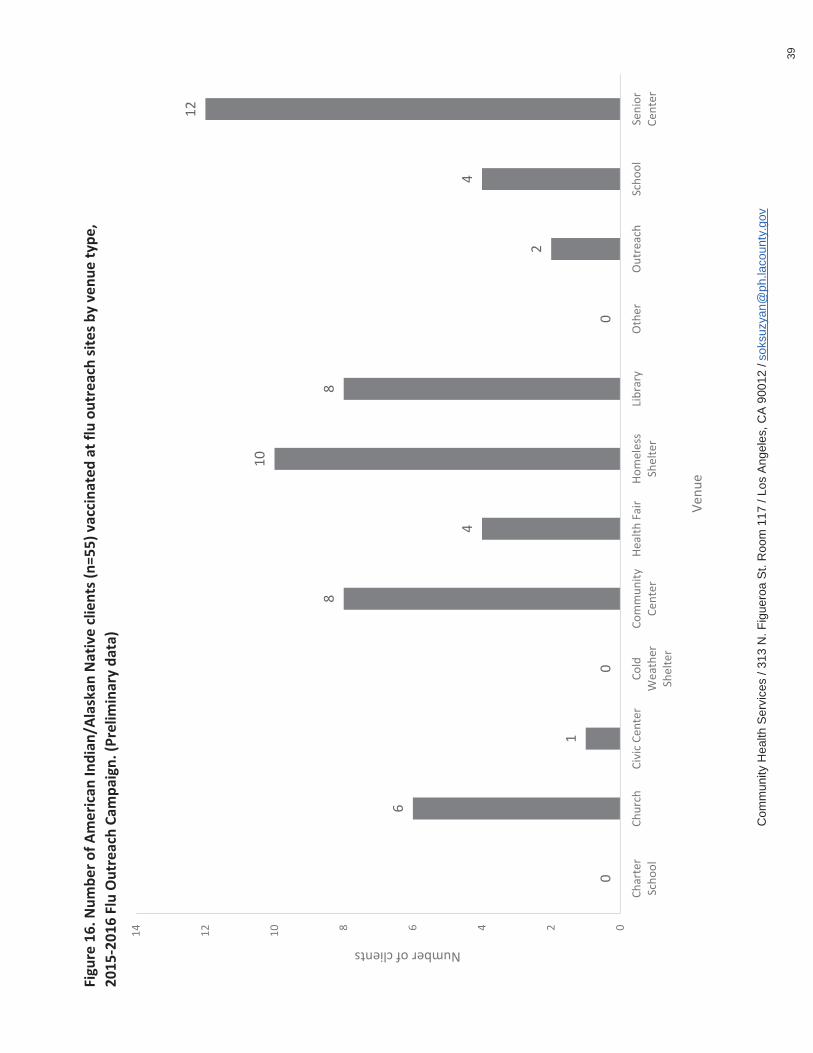
Com
mun
ity H
eal
th S
ervi
ces
/ 31
3 N
. F
igue
roa
St.
Roo
m 1
17 /
Los
Ang
eles
, C
A 9
0012
/ s
oksu
zyan
@ph
.laco
unty.g
ov
Figure
16.N
umberofAmericanIndian/A
laskan
Nativeclients(n=55)vaccinatedat
fluoutreachsitesbyvenuetype,
20152016FluOutreachCam
paign.(Prelim
inarydata)
0
6
1
0
8
4
10
8
0
2
4
12
02468
10
12
14
Charter
School
Church
CivicCenter
Cold
Weather
Shelter
Community
Cen
ter
HealthFair
Homeless
Shelter
Library
Other
Outreach
School
Senior
Cen
ter
Numberofclients
Ven
ue
39

Com
mun
ity H
eal
th S
ervi
ces
/ 31
3 N
. F
igue
roa
St.
Roo
m 1
17 /
Los
Ang
eles
, C
A 9
0012
/ s
oksu
zyan
@ph
.laco
unty.g
ov
Figure
17.N
umberofclientsunderage5(n=321)vaccinatedat
fluoutreachsitesbyvenuetype,20152016FluOutreachCam
paign.
(Prelim
inarydata)
1
132
50
40
19
1
56
0
19
38
10
0
20
40
60
80
100
120
140
Charter
School
Church
CivicCen
ter
Cold
Weather
Shelter
Community
Cen
ter
HealthFair
Homeless
Shelter
Library
Other
Outreach
School
Senior
Cen
ter
Numberofpatients
Ven
ue
40

Com
mun
ity H
eal
th S
ervi
ces
/ 31
3 N
. F
igue
roa
St.
Roo
m 1
17 /
Los
Ang
eles
, C
A 9
0012
/ s
oksu
zyan
@ph
.laco
unty.g
ov
Figure
18.N
umberof517yearsoldclients(n=2,023)vaccinatedat
fluoutreachsitesbyvenuetype,20152016FluOutreach
Cam
paign.(Prelim
inarydata)
16
972
39
0
148
89
6
281
0
119
323
30
0
200
400
600
800
1,000
1,200
Charter
School
Church
CivicCenter
Cold
Weather
Shelter
Community
Cen
ter
HealthFair
Homeless
Shelter
Library
Other
Outreach
School
Senior
Cen
ter
Numberofpatients
Ven
ue
41

Com
mun
ity H
eal
th S
ervi
ces
/ 31
3 N
. F
igue
roa
St.
Roo
m 1
17 /
Los
Ang
eles
, C
A 9
0012
/ s
oksu
zyan
@ph
.laco
unty.g
ov
Figure
19.N
umberof1824yearsoldclients(n=1,081)vaccinatedat
fluoutreachsitesbyvenuetype,20152016FluOutreach
Cam
paign.(Prelim
inarydata)
1
290
71
55
75
24
90
1
94
403
40
0
50
100
150
200
250
300
350
400
450
Charter
School
Church
CivicCenter
Cold
Weather
Shelter
Community
Cen
ter
HealthFair
Homeless
Shelter
Library
Other
Outreach
School
Senior
Cen
ter
Numberofpatients
Ven
ue
42

Com
mun
ity H
eal
th S
ervi
ces
/ 31
3 N
. F
igue
roa
St.
Roo
m 1
17 /
Los
Ang
eles
, C
A 9
0012
/ s
oksu
zyan
@ph
.laco
unty.g
ov
Figure
20.N
umberof2534yearsoldclients(n=1,494)vaccinatedat
fluoutreachsitesbyvenuetype,20152016FluOutreach
Cam
paign.(Prelim
inarydata)
7
450
19
11
147
188
50
216
1
106
238
61
0
50
100
150
200
250
300
350
400
450
500
Charter
School
Church
CivicCenter
Cold
Weather
Shelter
Community
Cen
ter
HealthFair
Homeless
Shelter
Library
Other
Outreach
School
Senior
Cen
ter
Numberofpatients
Ven
ue
43

Com
mun
ity H
eal
th S
ervi
ces
/ 31
3 N
. F
igue
roa
St.
Roo
m 1
17 /
Los
Ang
eles
, C
A 9
0012
/ s
oksu
zyan
@ph
.laco
unty.g
ov
Figure
21.N
umberof3544yearsoldclients(n=2,393)vaccinatedat
fluoutreachsitesbyvenuetype,20152016FluOutreach
Cam
paign.(Prelim
inarydata)
8
937
29
2
218
256
109
299
2
190
235
108
0
100
200
300
400
500
600
700
800
900
1,000
Charter
School
Church
CivicCenter
Cold
Weather
Shelter
Community
Cen
ter
HealthFair
Homeless
Shelter
Library
Other
Outreach
School
Senior
Cen
ter
Nubmerofpatients
Ven
ue
44

Com
mun
ity H
eal
th S
ervi
ces
/ 31
3 N
. F
igue
roa
St.
Roo
m 1
17 /
Los
Ang
eles
, C
A 9
0012
/ s
oksu
zyan
@ph
.laco
unty.g
ov
Figure
22.N
umberof4554yearsoldclients(n=2,792)vaccinatedat
fluoutreachsitesbyvenuetype,20152016FluOutreach
Cam
paign.(Prelim
inarydata)
4
1,152
44
17
272
282
128
336
1
215
165
176
0
200
400
600
800
1,000
1,200
1,400
Charter
School
Church
CivicCenter
Cold
Weather
Shelter
Community
Cen
ter
HealthFair
Homeless
Shelter
Library
Other
Outreach
School
Senior
Cen
ter
Numberofpatients
Ven
ue
45

Com
mun
ity H
eal
th S
ervi
ces
/ 31
3 N
. F
igue
roa
St.
Roo
m 1
17 /
Los
Ang
eles
, C
A 9
0012
/ s
oksu
zyan
@ph
.laco
unty.g
ov
Figure
23.N
umberof5564yearsoldclients(n=3,583)vaccinatedat
fluoutreachsitesbyvenuetype,20142015FluOutreach
Cam
paign.(Prelim
inarydata)
1
1,383
46
10
498
283
128
408
3
231
109
483
0
200
400
600
800
1,000
1,200
1,400
1,600
Charter
School
Church
CivicCenter
Cold
Weather
Shelter
Community
Cen
ter
HealthFair
Homeless
Shelter
Library
Other
Outreach
School
Senior
Cen
ter
Numberofpatients
Ven
ue
46
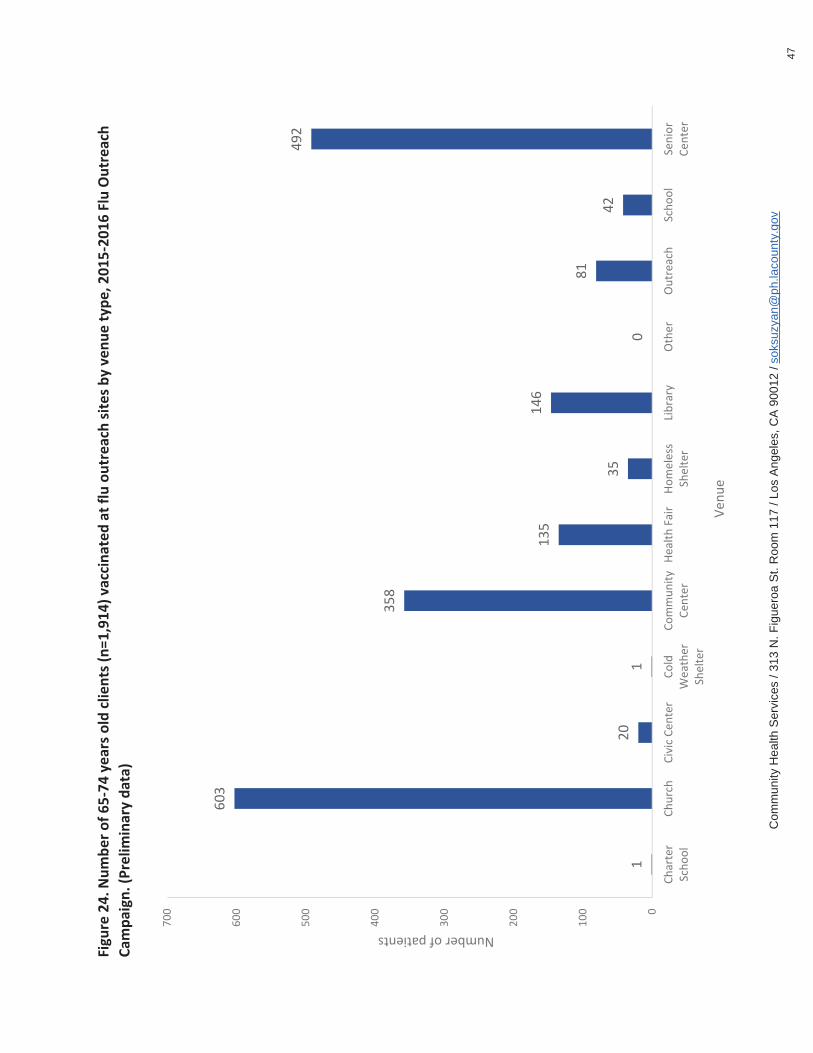
Com
mun
ity H
eal
th S
ervi
ces
/ 31
3 N
. F
igue
roa
St.
Roo
m 1
17 /
Los
Ang
eles
, C
A 9
0012
/ s
oksu
zyan
@ph
.laco
unty.g
ov
Figure
24.N
umberof6574yearsoldclients(n=1,914)vaccinatedat
fluoutreachsitesbyvenuetype,20152016FluOutreach
Cam
paign.(Prelim
inarydata)
1
603
20
1
358
135
35
146
0
81
42
492
0
100
200
300
400
500
600
700
Charter
School
Church
CivicCenter
Cold
Weather
Shelter
Community
Cen
ter
HealthFair
Homeless
Shelter
Library
Other
Outreach
School
Senior
Cen
ter
Numberofpatients
Ven
ue
47

Com
mun
ity H
eal
th S
ervi
ces
/ 31
3 N
. F
igue
roa
St.
Roo
m 1
17 /
Los
Ang
eles
, C
A 9
0012
/ s
oksu
zyan
@ph
.laco
unty.g
ov
Figure
25.N
umberofclients75yearsoldorolder(n=1,304)vaccinatedat
fluoutreachsitesbyvenuetype,20152016FluOutreach
Cam
paign.(Prelim
inarydata)
0
293
16
0
293
76
4
84
0
34
16
488
0
100
200
300
400
500
600
Charter
School
Church
CivicCenter
Cold
Weather
Shelter
Community
Cen
ter
HealthFair
Homeless
Shelter
Library
Other
Outreach
School
Senior
Cen
ter
Numberofpatients
Ven
ue
48

Ant
elop
eVa
lley
San
Fern
ando
San
Gab
riel
Met
ro
Wes
t
Sout
h
East
Sout
hB
ay
KER
N C
OU
NTY
OR
AN
GE
CO
UN
TY
RIV
ERSI
DE
CO
UN
TY
SAN
BER
NA
RD
INO
CO
UN
TY
VEN
TUR
AC
OU
NTY
PAC
IFIC
OC
EAN
-0
1020
5M
iles
Figu
re 2
6. N
umbe
r of
clie
nts
by z
ip c
ode
(n=1
5,53
1*),
2015
-201
6 Fl
u O
utre
ach
Cam
paig
n. (P
relim
inar
y D
ata)
Co
mm
un
ity H
ea
lth S
erv
ice
s /
Ep
ide
mio
log
y U
nits
/ 3
13
N F
igu
ero
a S
t, R
m 1
17
, Lo
s A
ng
ele
s, C
A /
sh
su@
ph
.laco
un
ty.g
ov
/ 0
8.0
8.1
6
Not
e: E
xclu
des
mis
sing
zip
code
s (n
=41
1),
hom
eles
s (n
=41
) an
d no
n-re
side
ntal
and
/or
inva
lid z
ipco
des
outs
ide
of L
os A
ngel
es C
oun
ty (
n=92
2)
1 -
32
33
- 8
1
82
- 1
64
16
5 -
33
2
No
Re
spo
nde
nts
Ou
trea
ch S
ites
(n=
147
)
Num
ber o
f Clie
nts
by Z
ip C
ode
(Nat
ural
Bre
aks)
49
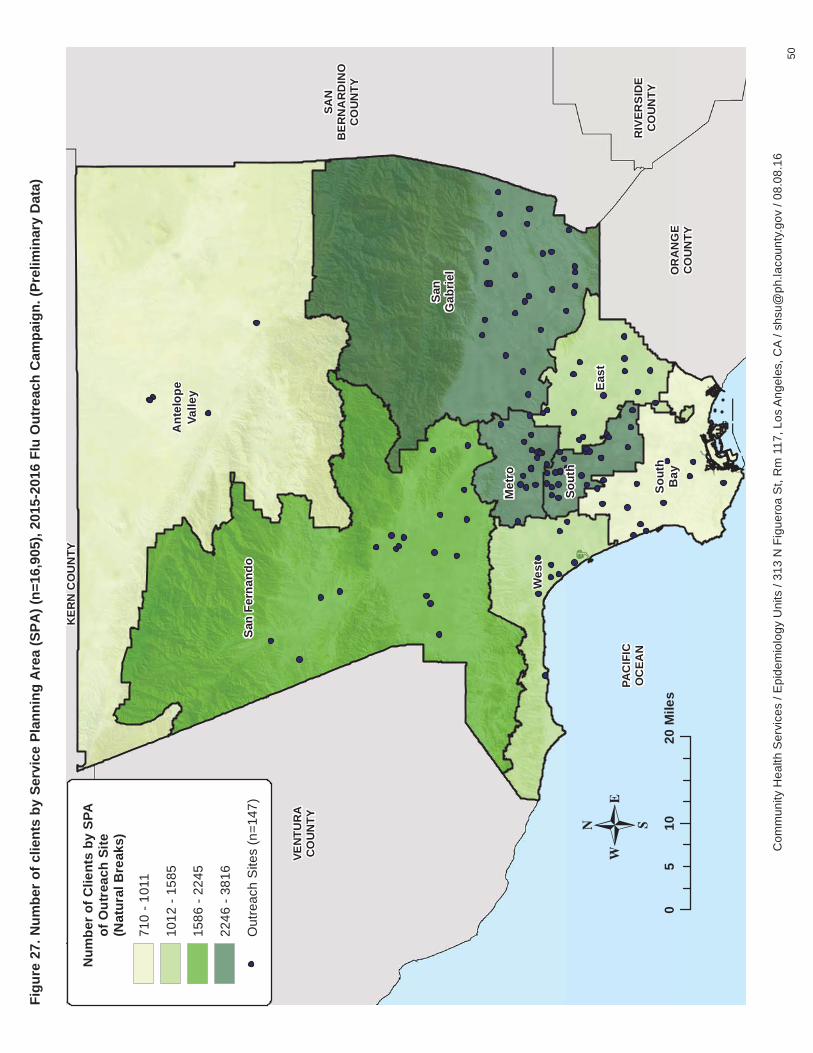
Ant
elop
eVa
lley
San
Fern
ando
San
Gab
riel
Met
ro
Wes
t
Sout
h
East
Sout
hB
ay
KER
N C
OU
NTY
OR
AN
GE
CO
UN
TY
RIV
ERSI
DE
CO
UN
TY
SAN
BER
NA
RD
INO
CO
UN
TY
VEN
TUR
AC
OU
NTY
PAC
IFIC
OC
EAN
-0
1020
5M
iles
Figu
re 2
7. N
umbe
r of c
lient
s by
Ser
vice
Pla
nnin
g A
rea
(SPA
) (n=
16,9
05),
2015
-201
6 Fl
u O
utre
ach
Cam
paig
n. (P
relim
inar
y D
ata)
Co
mm
un
ity H
ea
lth S
erv
ice
s /
Ep
ide
mio
log
y U
nits
/ 3
13
N F
igu
ero
a S
t, R
m 1
17
, Lo
s A
ng
ele
s, C
A /
sh
su@
ph
.laco
un
ty.g
ov
/ 0
8.0
8.1
6
Num
ber o
f Clie
nts
by S
PAof
Out
reac
h Si
te(N
atur
al B
reak
s)
71
0 -
10
11
10
12
- 1
58
5
15
86
- 2
24
5
22
46
- 3
81
6
Ou
tre
ach
Site
s (n
=1
47
)
50

KER
N C
OU
NTY
OR
AN
GE
CO
UN
TY
RIV
ERSI
DE
CO
UN
TY
SAN
BER
NA
RD
INO
CO
UN
TY
VEN
TUR
AC
OU
NTY
PAC
IFIC
OC
EAN
4
2
1
3
5
-0
1020
5M
iles
Figu
re 2
8. N
umbe
r of c
lient
s by
Sup
ervi
soria
l Dis
tric
t (n=
16,9
05),
2015
-201
6 Fl
u O
utre
ach
Cam
paig
n. (P
relim
inar
y D
ata)
Co
mm
un
ity H
ea
lth S
erv
ice
s /
Ep
ide
mio
log
y U
nits
/ 3
13
N F
igu
ero
a S
t, R
m 1
17
, Lo
s A
ng
ele
s, C
A /
sh
su@
ph
.laco
un
ty.g
ov
/ 0
8.1
6.1
6
Num
ber o
f Clie
nts
by S
uper
viso
rial
Dis
tric
t of O
utre
ach
Site
(Nat
ural
Bre
aks)
20
04
20
05
- 2
23
0
22
31
- 2
92
9
29
30
- 5
00
1
Ou
tre
ach
Site
s (n
=1
47
)
51

Ant
elop
eVa
lley
San
Fern
ando
San
Gab
riel
Met
ro
Wes
t
Sout
h
East
Sout
hB
ay
KER
N C
OU
NTY
OR
AN
GE
CO
UN
TY
RIV
ERSI
DE
CO
UN
TY
SAN
BER
NA
RD
INO
CO
UN
TY
VEN
TUR
AC
OU
NTY
PAC
IFIC
OC
EAN
-0
1020
5M
iles
Figu
re 2
9. N
umbe
r of c
lient
s in
SPA
1 O
utre
ache
s (n
=672
*), 2
015-
2016
Flu
Out
reac
h C
ampa
ign.
(Pre
limin
ary
Dat
a)
Co
mm
un
ity H
ea
lth S
erv
ice
s /
Ep
ide
mio
log
y U
nits
/ 3
13
N F
igu
ero
a S
t, R
m 1
17
, Lo
s A
ng
ele
s, C
A /
sh
su@
ph
.laco
un
ty.g
ov
/ 0
8.1
6.1
6
Num
ber o
f Clie
nts
in S
PA 1
Out
reac
h Lo
catio
ns(N
atur
al B
reak
s)
1 -
11
12
- 5
9
60
- 1
04
10
5 -
13
9
Ou
tre
ach
Site
s (n
=6
)
Not
e: E
xclu
des
mis
sing
zip
code
s (n
=12
), a
nd n
on-r
esid
entia
l and
/or
inva
lid z
ipco
des
outs
ide
of L
os A
ngel
es C
ount
y (n
=26
).
52

Ant
elop
eVa
lley
San
Fern
ando
San
Gab
riel
Met
ro
Wes
t
Sout
h
East
Sout
hB
ay
KER
N C
OU
NTY
OR
AN
GE
CO
UN
TY
RIV
ERSI
DE
CO
UN
TY
SAN
BER
NA
RD
INO
CO
UN
TY
VEN
TUR
AC
OU
NTY
PAC
IFIC
OC
EAN
-0
1020
5M
iles
Figu
re
. Num
ber
of c
lient
s in
SPA
2 O
utre
ache
s (n
=2,1
32*)
, 201
5-20
16 F
lu O
utre
ach
Cam
paig
n. (P
relim
inar
y D
ata)
Co
mm
un
ity H
ea
lth S
erv
ice
s /
Ep
ide
mio
log
y U
nits
/ 3
13
N F
igu
ero
a S
t, R
m 1
17
, Lo
s A
ng
ele
s, C
A /
sh
su@
ph
.laco
un
ty.g
ov
/ 0
8.1
6.1
6
Num
ber o
f Clie
nts
in S
PA 2
Out
reac
h Lo
catio
ns(N
atur
al B
reak
s)
1 -
10
11 -
30
31
- 7
3
74
- 1
85
Ou
tre
ach
Site
s (n
=1
9)
Not
e: E
xclu
des
mis
sing
zip
code
s (n
=45
), h
omel
ess
(n=
15),
and
non
-res
iden
tial a
nd/o
r in
valid
zip
code
s ou
tsid
e of
Los
Ang
eles
Cou
nty
(n=
53).
53

Ant
elop
eVa
lley
San
Fern
ando
San
Gab
riel
Met
ro
Wes
t
Sout
h
East
Sout
hB
ay
KER
N C
OU
NTY
OR
AN
GE
CO
UN
TY
RIV
ERSI
DE
CO
UN
TY
SAN
BER
NA
RD
INO
CO
UN
TY
VEN
TUR
AC
OU
NTY
PAC
IFIC
OC
EAN
-0
1020
5M
iles
Figu
re
. Num
ber
of c
lient
s in
SPA
3 O
utre
ache
s (n
=3,2
90*)
, 201
5-20
16 F
lu O
utre
ach
Cam
paig
n. (P
relim
inar
y D
ata)
Co
mm
un
ity H
ea
lth S
erv
ice
s /
Ep
ide
mio
log
y U
nits
/ 3
13
N F
igu
ero
a S
t, R
m 1
17
, Lo
s A
ng
ele
s, C
A /
sh
su@
ph
.laco
un
ty.g
ov
/ 0
8.1
6.1
6
Num
ber o
f Clie
nts
in S
PA 3
Out
reac
h Lo
catio
ns(N
atur
al B
reak
s)
1 -
18
19
- 6
3
64
- 1
39
14
0 -
32
8
Ou
tre
ach
Site
s (n
=3
0)
Not
e: E
xclu
des
mis
sing
zip
code
s (n
=11
7),
hom
eles
s (n
=2)
, an
d no
n-re
side
ntia
l and
/or
inva
lid z
ipco
des
outs
ide
of L
os A
ngel
es C
ount
y (n
=40
7).
54
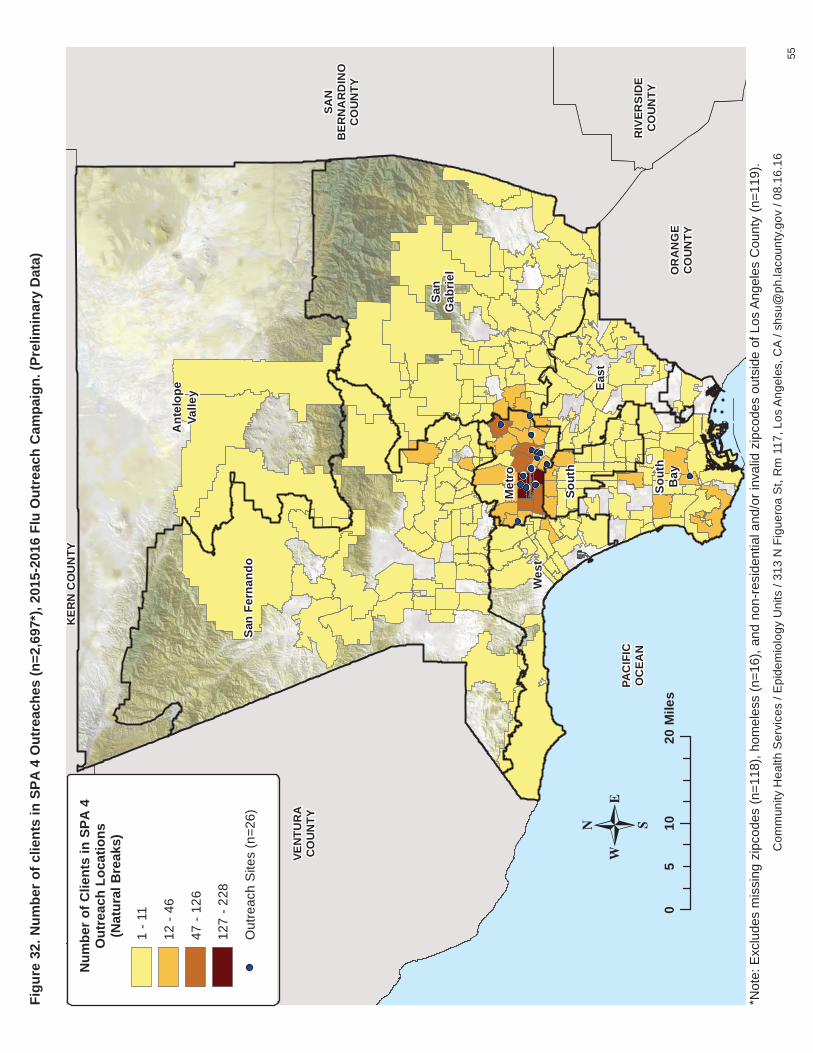
Ant
elop
eVa
lley
San
Fern
ando
San
Gab
riel
Met
ro
Wes
t
Sout
h
East
Sout
hB
ay
KER
N C
OU
NTY
OR
AN
GE
CO
UN
TY
RIV
ERSI
DE
CO
UN
TY
SAN
BER
NA
RD
INO
CO
UN
TY
VEN
TUR
AC
OU
NTY
PAC
IFIC
OC
EAN
-0
1020
5M
iles
Figu
re 3
2. N
umbe
r of c
lient
s in
SPA
4 O
utre
ache
s (n
=2,6
97*)
, 201
5-20
16 F
lu O
utre
ach
Cam
paig
n. (P
relim
inar
y D
ata)
Co
mm
un
ity H
ea
lth S
erv
ice
s /
Ep
ide
mio
log
y U
nits
/ 3
13
N F
igu
ero
a S
t, R
m 1
17
, Lo
s A
ng
ele
s, C
A /
sh
su@
ph
.laco
un
ty.g
ov
/ 0
8.1
6.1
6
Num
ber o
f Clie
nts
in S
PA 4
Out
reac
h Lo
catio
ns(N
atur
al B
reak
s)
1 -
11
12
- 4
6
47
- 1
26
12
7 -
22
8
Ou
tre
ach
Site
s (n
=2
6)
Not
e: E
xclu
des
mis
sing
zip
code
s (n
=11
8),
hom
eles
s (n
=16
), a
nd n
on-r
esid
entia
l and
/or
inva
lid z
ipco
des
outs
ide
of L
os A
ngel
es C
ount
y (n
=11
9).
55

Ant
elop
eVa
lley
San
Fern
ando
San
Gab
riel
Met
ro
Wes
t
Sout
h
East
Sout
hB
ay
KER
N C
OU
NTY
OR
AN
GE
CO
UN
TY
RIV
ERSI
DE
CO
UN
TY
SAN
BER
NA
RD
INO
CO
UN
TY
VEN
TUR
AC
OU
NTY
PAC
IFIC
OC
EAN
-0
1020
5M
iles
Figu
re 3
3. N
umbe
r of c
lient
s in
SPA
5 O
utre
ache
s (n
=1,2
26*)
, 201
5-20
16 F
lu O
utre
ach
Cam
paig
n. (P
relim
inar
y D
ata)
Co
mm
un
ity H
ea
lth S
erv
ice
s /
Ep
ide
mio
log
y U
nits
/ 3
13
N F
igu
ero
a S
t, R
m 1
17
, Lo
s A
ng
ele
s, C
A /
sh
su@
ph
.laco
un
ty.g
ov
/ 0
8.1
6.1
6
Num
ber o
f Clie
nts
in S
PA 5
Out
reac
h Lo
catio
ns(N
atur
al B
reak
s)
1 -
7
8 -
20
21
- 4
0
41
- 9
0
Ou
tre
ach
Site
s (n
=11
)
Not
e: E
xclu
des
mis
sing
zip
code
s (n
=31
), h
omel
ess
(n=
3),
and
non-
resi
dent
ial a
nd/o
r in
valid
zip
code
s ou
tsid
e of
Los
Ang
eles
Cou
nty
(n=
75).
56

Ant
elop
eVa
lley
San
Fern
ando
San
Gab
riel
Met
ro
Wes
t
Sout
h
East
Sout
hB
ay
KER
N C
OU
NTY
OR
AN
GE
CO
UN
TY
RIV
ERSI
DE
CO
UN
TY
SAN
BER
NA
RD
INO
CO
UN
TY
VEN
TUR
AC
OU
NTY
PAC
IFIC
OC
EAN
-0
1020
5M
iles
Figu
re 3
4. N
umbe
r of c
lient
s in
SPA
6 O
utre
ache
s (n
=302
0*),
2015
-201
6 Fl
u O
utre
ach
Cam
paig
n. (P
relim
inar
y D
ata)
Co
mm
un
ity H
ea
lth S
erv
ice
s /
Ep
ide
mio
log
y U
nits
/ 3
13
N F
igu
ero
a S
t, R
m 1
17
, Lo
s A
ng
ele
s, C
A /
sh
su@
ph
.laco
un
ty.g
ov
/ 0
8.1
7.1
6
Num
ber o
f Clie
nts
in S
PA 6
Out
reac
h Lo
catio
ns(N
atur
al B
reak
s)
1 -
22
23
- 7
9
80
- 1
46
14
7 -
27
1
Ou
tre
ach
Site
s (n
=3
0)
Not
e: E
xclu
des
mis
sing
zip
code
s (n
=59
), h
omel
ess
(n=
5),
and
non-
resi
dent
ial a
nd/o
r in
valid
zip
code
s ou
tsid
e of
Los
Ang
eles
Cou
nty
(n=
169)
.
57

Ant
elop
eVa
lley
San
Fern
ando
San
Gab
riel
Met
ro
Wes
t
Sout
h
East
Sout
hB
ay
KER
N C
OU
NTY
OR
AN
GE
CO
UN
TY
RIV
ERSI
DE
CO
UN
TY
SAN
BER
NA
RD
INO
CO
UN
TY
VEN
TUR
AC
OU
NTY
PAC
IFIC
OC
EAN
-0
1020
5M
iles
Figu
re 3
5. N
umbe
r of c
lient
s in
SPA
7 O
utre
ache
s (n
=1,5
11*)
, 201
5-20
16 F
lu O
utre
ach
Cam
paig
n. (P
relim
inar
y D
ata)
Co
mm
un
ity H
ea
lth S
erv
ice
s /
Ep
ide
mio
log
y U
nits
/ 3
13
N F
igu
ero
a S
t, R
m 1
17
, Lo
s A
ng
ele
s, C
A /
sh
su@
ph
.laco
un
ty.g
ov
/ 0
8.1
7.1
6
Num
ber o
f Clie
nts
in S
PA 7
Out
reac
h Lo
catio
ns(N
atur
al B
reak
s)
1 -
17
18
- 4
6
47
- 1
00
10
1 -
27
1
Ou
tre
ach
Site
s (n
=1
4)
Not
e: E
xclu
des
mis
sing
zip
code
s (n
=21
), a
nd n
on-r
esid
entia
l and
/or
inva
lid z
ipco
des
outs
ide
of L
os A
ngel
es C
ount
y (n
=53
).
58

Ant
elop
eVa
lley
San
Fern
ando
San
Gab
riel
Met
ro
Wes
t
Sout
h
East
Sout
hB
ay
KER
N C
OU
NTY
OR
AN
GE
CO
UN
TY
RIV
ERSI
DE
CO
UN
TY
SAN
BER
NA
RD
INO
CO
UN
TY
VEN
TUR
AC
OU
NTY
PAC
IFIC
OC
EAN
-0
1020
5M
iles
Figu
re 3
6. N
umbe
r of c
lient
s in
SPA
8 O
utre
ache
s (n
=983
*), 2
015-
2016
Flu
Out
reac
h C
ampa
ign.
(Pre
limin
ary
Dat
a)
Co
mm
un
ity H
ea
lth S
erv
ice
s /
Ep
ide
mio
log
y U
nits
/ 3
13
N F
igu
ero
a S
t, R
m 1
17
, Lo
s A
ng
ele
s, C
A /
sh
su@
ph
.laco
un
ty.g
ov
/ 0
8.1
7.1
6
Num
ber o
f Clie
nts
in S
PA 8
Out
reac
h Lo
catio
ns(N
atur
al B
reak
s )
1 -
8
9 -
23
24
- 6
0
61
- 1
27
Ou
tre
ach
Site
s (n
=11
)
Not
e: E
xclu
des
mis
sing
zip
code
s (n
=8)
, an
d no
n-re
side
ntia
l and
/or
inva
lid z
ipco
des
outs
ide
of L
os A
ngel
es C
ount
y (n
=20
).
59

Com
mun
ity H
ealth
Ser
vice
s / 3
13 N
. Fig
uero
a S
t., R
oom
117
/ Lo
s A
ngel
es, C
A 9
0012
/ so
ksuz
yan@
ph.la
coun
ty.g
ov
Figure
37.C
lientsvaccinatedat
FluOutreachclinicsbygender,20132014,20142015an
d20152016,respectively.FluOutreachCam
paign.
(Prelim
inarydata)
Male
41%
Female
59%
20132014
(n=20,433)
Male
41%
Female
59% 20142015
(n=20,183)
Male
41%
Female
59% 20152016
(n=16,786)
60

Com
mun
ity H
ealth
Ser
vice
s / 3
13 N
. Fig
uero
a S
t., R
oom
117
/ Lo
s A
ngel
es, C
A 9
0012
/ s
oksu
zyan
@ph
.laco
unty.g
ov
Figure
38.C
lientsvaccinatedat
FluOutreachclinicsbyagegroup,20132014,20142015an
d20152016,respectively.FluOutreachCam
paign
(Prelim
inarydata)
*Percentagesmay
nottotalto100%dueto
roundingandmissingvalues
2%
13%
6%
8%
13%
17%
23%
10%
8%
2%
14%
5%
8%
14%
17%
22%
10%
7%
2%
12%
6%
9%
14%
17%
21%
11%
8%
0%
5%
10%
15%
20%
25%
<5
517
18
24
25
34
35
44
45
54
55
64
65
74
75+
<5
517
18
24
25
34
35
44
45
54
55
64
65
74
75+
<5
517
18
24
25
34
35
44
45
54
55
64
65
74
75+
20132014
(20,513)
20142015
(20,953)
20152016
(16,905)
Percentageofclients*
Year
(Numberofclients)
61

Com
mun
ity H
ealth
Ser
vice
s / 3
13 N
. Fig
uero
a S
t., R
oom
117
/ Lo
s A
ngel
es, C
A 9
0012
/ s
oksu
zyan
@ph
.laco
unty.g
ov
Figure
39.C
lientsvaccinatedat
FluOutreachclinicsbyrace/ethnicity,20132014,20142015an
d20152016,respectively.FluOutreach
Cam
paign
(Prelim
inarydata)
*Percentagesmay
nottotalto100%dueto
roundingandmissingvalues
33%
5%
41%
17%
<1%
<1%
2%
1%
36%
5%
39%
15%
<1%
<1%
2%
1%
37%
5%
39%
16%
1%
<1%
2%
1%
0%
5%
10%
15%
20%
25%
30%
35%
40%
45%
Asian
Black
Hispanic
White
NH/PI
AI/AN
Multiethnic
Other
Asian
Black
Hispanic
White
NH/PI
AI/AN
Multiethnic
Other
Asian
Black
Hispanic
White
NH/PI
AI/AN
Multiethnic
Other
20132014
(20,441)
20142015
(20,771)
20152016
(16,485)
Percentageofclients*
Race/Ethnicity
(Numberofclients)
62

Com
mun
ity H
ealth
Ser
vice
s / 3
13 N
. Fig
uero
a S
t., R
oom
117
/ Lo
s A
ngel
es, C
A 9
0012
/ s
oksu
zyan
@ph
.laco
unty.g
ov
Figure
40.C
lientsvaccinatedat
FluOutreachclinicsbyServicePlanningArea,20132014,20142015an
d20152016,respectively.FluOutreach
Cam
paign
(Prelim
inarydata)
*Percentagesmay
nottotalto100%dueto
roundingandmissingvalues
4%
16%
21%
18%
7%
20%
6%
8%
4%
14%
24%
15%
8%
18%
10%
7%
4%
13%
23%
17%
8%
19%
9%
6%
0%
5%
10%
15%
20%
25%
30%
12
34
56
78
12
34
56
78
12
34
56
78
20132014
(20,607)
20142015
(20,952)
20152016
(16,905)
Percentageofclients*
ServicePlanningArea
(Numberofclients)
63

Com
mun
ity H
ealth
Ser
vice
s / 3
13 N
. Fig
uero
a S
t., R
oom
117
/ Lo
s A
ngel
es, C
A 9
0012
/ s
oksu
zyan
@ph
.laco
unty.g
ov
Figure
41.C
lientsvaccinatedat
FluOutreachclinicsbyhealth
insurance
status*,20132014,20142015an
d20152016,respectively.Flu
OutreachCam
paign
(Prelim
inarydata)*
*CoveredCaliforniabegan
onJanuary2014
**Percentagesmay
nottotalto100%dueto
rounding,multipleresponsesandmissingvalues
13%
5%
20%
39%
3%
<1%
15%
9%
27%
35%
6%
<1%
11%
23%
26%
31%
4%
2%
0%
5%
10%
15%
20%
25%
30%
35%
40%
45%
Medicare
Medicaid
Private
Uninsured
Don'tKnow
Other
Medicare
Medicaid
Private
Uninsured
Don'tKnow
Other
Medicare
Medicaid
Private
Uninsured
Don'tKnow
Other
20132014
(16,712)
20142015
(19,322)
20152016
(16,160)
Percentageofclients**
Insurance
Status**
(Numberofclients)
64

Com
mun
ity H
ealth
Ser
vice
s / 3
13 N
. Fig
uero
a S
t., R
oom
117
/ Lo
s A
ngel
es, C
A 9
0012
/ s
oksu
zyan
@ph
.laco
unty.g
ov
Figure
42.C
lientsvaccinatedat
FluOutreachclinicsbyvenuetype,20132014,20142015an
d20152016,respectively.FluOutreachCam
paign
(Prelim
inarydata)
*Percentagesmay
nottotalto100%dueto
roundingandmissingvalues
34%
12%
1%
2%
23%
12%
16%
36%
1%
16%
7%
2%
10%
1%
7%
8%
12%
37%
1%
12%
8%
3%
11%
<1%
6%
10%
11%
0%
5%
10%
15%
20%
25%
30%
35%
40%
Church
CommunityCenter
HealthFair
HomelessShelter
Outreach
School
SeniorCenter
Church
CivicCenter
CommunityCenter
HealthFair
HomelessShelter
Library
Other
Outreach
School
SeniorCenter
Church
CivicCenter
CommunityCenter
HealthFair
HomelessShelter
Library
Other
Outreach
School
SeniorCenter
20132014
(20,607)
20142015
(20,952)
20152016
(16,905)
Percentageofclients*
VenueType
(Numberofclients)
65

Com
mun
ity H
ealth
Ser
vice
s / 3
13 N
. Fig
uero
a S
t., R
oom
117
/ Lo
s A
ngel
es, C
A 9
0012
/ so
ksuz
yan@
ph.la
coun
ty.g
ov
Figure
43.U
ninsuredclientsvaccinatedat
FluOutreachclinicsbygender,20132014,20142015an
d20152016,respectively(numberof
clientsinparenthesis).FluOutreachCam
paign
(Prelim
inarydata)
Male
38%
Female
62%
20132014
Uninsuredclientsbygender
(7,967)
Male
39%
Female
61%
20142015
Uninsuredclientsbygender
(7,081)
Male
40%
Female
60%
20152016
Uninsuredclientsbygender
(5,168)
66

Com
mun
ity H
ealth
Ser
vice
s / 3
13 N
. Fig
uero
a S
t., R
oom
117
/ Lo
s A
ngel
es, C
A 9
0012
/ s
oksu
zyan
@ph
.laco
unty.g
ov
Figure
44.U
ninsuredclientsvaccinatedat
FluOutreachclinicsbyagegroup,20132014,20142015an
d20152016,respectively(numberof
clientsinparenthesis).FluOutreachCam
paign
(Prelim
inarydata)*
*Percentagesmay
nottotalto100%dueto
roundingandmissingvalues
1824
yrs
5%
2534yrs
11%
3544yrs
20%
4554yrs
24%
5564yrs
33%
6574
yrs
5%
75+
yrs
2%
Age
group
20132014
(8,009)
<5yrs
1% 517yrs
9%
1824
yrs
5%
2534yrs
11%
3544yrs
21%
4554yrs
21%
5564yrs
24%
6574
yrs
6%
75+
yrs
2%
Age
group
20142015
(7,371)
<5yrs
1% 5
17yrs
9%
1824
yrs
5%
2534yrs
11%
3544yrs
20%
4554yrs
21%
5564yrs
2%
6574
yrs
7%
75+
yrs
3%
Age
group
20152016
(5,210)
67

Com
mun
ity H
ealth
Ser
vice
s / 3
13 N
. Fig
uero
a S
t., R
oom
117
/ Lo
s A
ngel
es, C
A 9
0012
/ s
oksu
zyan
@ph
.laco
unty.g
ov
Figure
45.N
umberofuninsuredclientsvaccinatedat
FluOutreachclinicsbyagegroup,20132014,20142015an
d20152016,respectively.Flu
OutreachCam
paign
(Prelim
inarydata)
*Percentagesmay
nottotalto100%dueto
roundingandmissingvalues
5%
11%
20%
24%
33%
5%
2%
1%
9%
5%
11%
21%
21%
24%
6%
2%
1%
9%
5%
11%
20%
21%
24%
7%
3%
0%
5%
10%
15%
20%
25%
30%
35%
18
24yrs
25
34yrs
35
44yrs
45
54yrs
55
64yrs
65
74yrs
75+
yrs
<5yrs
517
yrs
18
24yrs
25
34yrs
35
44yrs
45
54yrs
55
64yrs
65
74yrs
75+
yrs
<5yrs
517
yrs
18
24yrs
25
34yrs
35
44yrs
45
54yrs
55
64yrs
65
74yrs
75+
yrs
20132014
(8,009)
20142015
(7,371)
20152016
(5,210)
Percentageofclients*
Age
group
(Numberofclients)
68

Com
mun
ity H
ealth
Ser
vice
s / 3
13 N
. Fig
uero
a S
t., R
oom
117
/ Lo
s A
ngel
es, C
A 9
0012
/ s
oksu
zyan
@ph
.laco
unty.g
ov
Figure
46.U
ninsuredclientsvaccinatedat
FluOutreachclinicsbyrace/ethnicity,20132014,20142015an
d20152016,respectively.Flu
OutreachCam
paign
(Prelim
inarydata)
*Percentagesmay
nottotalto100%dueto
roundingandmissingvalues
37%
3%
52%
6%
<1%
1%
1%
<1%
31%
4%
56%
7%
<1%
<1%
1%
1%
32%
4%
52%
9%
<1%
<1%
1%
1%
0%
10%
20%
30%
40%
50%
60%
Asian
Black
Hispanic
White
NH/PI
AI/AN
Multiethnic
Other
Asian
Black
Hispanic
White
NH/PI
AI/AN
Multiethnic
Other
Asian
Black
Hispanic
White
NH/PI
AI/AN
Multiethnic
Other
20132014
(5,083)
20142015
(7,332)
20152016
(8,006)
Percentageofclients*
Race/Ethnicity
(Numberofclients)
69

Com
mun
ity H
ealth
Ser
vice
s / 3
13 N
. Fig
uero
a S
t., R
oom
117
/ Lo
s A
ngel
es, C
A 9
0012
/ s
oksu
zyan
@ph
.laco
unty.g
ov
Figure
47.U
ninsuredclientsvaccinatedat
FluOutreachclinicsbyServicePlanningArea,20132014,20142015an
d20152016,respectively.
FluOutreachCam
paign
(Prelim
inarydata)
*Percentagesmay
nottotalto100%dueto
roundingandmissingvalues
3%
16%
18%
21%
6%
23%
7%
7%
4%
16%
17%
17%
5%
24%
12%
5%
3%
13%
15%
20%
10%
25%
9%
3%
0%
5%
10%
15%
20%
25%
30%
12
34
56
78
12
34
56
78
12
34
56
78
20132014
(8,044)
20142015
(7,371)
20152016
(5,210)
Percentageofclients*
ServicePlanningArea
(Numberofclients)
70

Com
mun
ity H
ealth
Ser
vice
s / 3
13 N
. Fig
uero
a S
t., R
oom
117
/ Lo
s A
ngel
es, C
A 9
0012
/ s
oksu
zyan
@ph
.laco
unty.g
ov
Figure
48.U
ninsuredclientsvaccinatedat
FluOutreachclinicsbyvenuetype,20132014,20142015an
d20152016,respectively.FluOutreach
Cam
paign
(Prelim
inarydata)
*Percentagesmay
nottotalto100%dueto
roundingandmissingvalues
38%
10%
2%
2%
26%
8%
15%
40%
2%
11%
10%
2%
12%
1%
8%
6%
8%
45%
1%
9%
11%
3%
12%
<1%
7%
6%
5%
0%
5%
10%
15%
20%
25%
30%
35%
40%
45%
50%
Church
CommunityCenter
HealthFair
HomelessShelter
Outreach
School
SeniorCenter
Church
CivicCenter
CommunityCenter
HealthFair
HomelessShelter
Library
Other
Outreach
School
SeniorCenter
Church
CivicCenter
CommunityCenter
HealthFair
HomelessShelter
Library
Other
Outreach
School
SeniorCenter
20132014
(8044)
20142015
(7,371)
20152016
(5,210)
Percentageofclients*
VenueType
(Numberofclients)
71

Com
mun
ity H
ealth
Ser
vice
s / 3
13 N
. Fig
uero
a S
t., R
oom
117
/ Lo
s A
ngel
es, C
A 9
0012
/ s
oksu
zyan
@ph
.laco
unty.g
ov
Figure
49.Insurance
status*
ofclientsvaccinatedat
FluOutreachclinicsinServicePlanningArea1(AntelopeValley)byrace/ethnicity,2013
2014,20142015an
d20152016,respectively.FluOutreachCam
paign.(Prelim
inarydata)
*CoveredCaliforniabegan
onJanuary1,2014.
**Percentagesmay
nottotalto100%dueto
rounding,multipleresponsesandmissingvalues
Note:AI/AN=American
Indian/Alaskan
Native,NH/PI=
NativeHaw
aiian/PacificaIslander
10%
10%
8%
16%
40%
100%
9%12%
22%
11%
19%
13%
40%
4%
4%5%
3%
15%
25%
16%
7%
14%
9%
11%
20%
12%
20%
18%
16%
25%
40%
13%
23%
32%
43%
27%
33%
45%
37%
28%22%
10%
30%
25%
21%
28%
9%
41%
25%
80%
28%
46%
39%
12%
35%
33%
50%
36%26%
2%
1%
5%
2%
4%2%
1%
3%
33%
30%
24%
31%
19%
20%
100%
19%
32%
17%
43%
20%
38%
20%
34%
16%
22%
30%
17%
25%
9%
21%
0%
20%
40%
60%
80%
100%
120%
Asian
Black
Hispanic
White
Other
NH/PI
AI/AN
Multiethnic
Asian
Black
Hispanic
White
Other
NH/PI
AI/AN
Multiethnic
Asian
Black
Hispanic
White
Other
NH/PI
AI/AN
Multiethnic
201320142014201520152016
Percentage
ofclients**
Insurancestatus*byRace/Ethnicity
Med
icare
Med
icaid
Private
Other
Uninsured
72

Com
mun
ity H
ealth
Ser
vice
s / 3
13 N
. Fig
uero
a S
t., R
oom
117
/ Lo
s A
ngel
es, C
A 9
0012
/ so
ksuz
yan@
ph.la
coun
ty.g
ov
Figure
50.Insurance
status*
ofclientsvaccinatedat
FluOutreachclinicsinServicePlanningArea2(San
Fernan
do)byrace/ethnicity,2013
2014,20142015an
d20152016,respectively.FluOutreachCam
paign.(Prelim
inarydata)
*CoveredCaliforniabegan
onJanuary1,2014.
**Percentagesmay
nottotalto100%dueto
rounding,multipleresponsesandmissingvalues
Note:AI/AN=American
Indian/Alaskan
Native,NH/PI=
NativeHaw
aiian/PacificaIslander
22%
16%
5%
22%
31%
31%
6%11%
12%
8%
20%
7%8%
6%12%
5%
18%
17%
8%
4%7%
5%
13%
6%
5%
6%
23%
13%3%
10%
24%
14%
9%
25%
33%
6%
18%
31%
38%
20%
33%
33%
16%
12%
21%
14%
9%
36%
25%
38%
25%
14%
27%
27%
10%
38%
27%
67%
29%
35%
15%
12%
34%
17%
25%
33%
16%
0%
0%
0%
2%
0%
0%
0%
1%
0%
3%
2%
5%
35%
25%
47%
26%
43%
31%
63%
18%
39%
33%
45%
27%
36%
33%
33%
31%
26%
27%37%
16%
33%
50%
33%
42%
0%
20%
40%
60%
80%
100%
120%
Asian
Black
Hispanic
White
Other
NH/PI
AI/AN
Multiethnic
Asian
Black
Hispanic
White
Other
NH/PI
AI/AN
Multiethnic
Asian
Black
Hispanic
White
Other
NH/PI
AI/AN
Multiethnic
201320142014201520152016
Percentage
ofclients**
insurancestatus*byRace/Ethnicity
Med
icare
Med
icaid
Private
Other
Uninsured
73

Com
mun
ity H
ealth
Ser
vice
s / 3
13 N
. Fig
uero
a S
t., R
oom
117
/ Lo
s A
ngel
es, C
A 9
0012
/ s
oksu
zyan
@ph
.laco
unty.g
ov
Figure
51.Insurance
status*
ofclientsvaccinatedat
FluOutreachclinicsinServicePlanningArea3(San
Gab
riel)byrace/ethnicity,20132014,
20142015and20152016,respectively.FluOutreachCam
paign.(Prelim
inarydata)
*CoveredCaliforniabegan
onJanuary1,2014.
**Percentagesmay
nottotalto100%dueto
rounding,multipleresponsesandmissingvalues
Note:AI/AN=American
Indian/Alaskan
Native,NH/PI=
NativeHaw
aiian/PacificaIslander
12%16%
18%
34%
22%
4%
11%
12%15%19%
18%
34%
27%
23%
17%
9%12%19%
13%
36%
22%
18%
9%
19%
5%
5%
6%
3%
2%
6%
10%
9%
7%
4%
11%
10%
8%
7%
22%
26%
25%
11%
22%
36%
14%
22% 27%
31%
19%
36%
24%
57%
22%14%
36%32%
25%
48%
29%
52%
33%
34%
35%
27%
20%
40%
43%
36%
49%19%
0%
0%
2%1%
2%
4%
3%
4%
6%
3% 36%
21%42%
16%
27%
26%
44%
15%
26%
15%36%
11%
20%
16%
17%
10%
21%
19%
31%
9%
9%
9%
14%
27%
0%
20%
40%
60%
80%
100%
120%
Asian
Black
Hispanic
White
Other
NH/PI
AI/AN
Multiethnic
Asian
Black
Hispanic
White
Other
NH/PI
AI/AN
Multiethnic
Asian
Black
Hispanic
White
Other
NH/PI
AI/AN
Multiethnic
201320142014201520152016
Percentage
ofclients**
Insurancestatus*byRace/Ethnicity
Med
icare
Med
icaid
Private
Other
Uninsured
74

Com
mun
ity H
ealth
Ser
vice
s / 3
13 N
. Fig
uero
a S
t., R
oom
117
/ Lo
s A
ngel
es, C
A 9
0012
/ s
oksu
zyan
@ph
.laco
unty.g
ov
Figure
52.Insurance
status*
ofclientsvaccinatedat
FluOutreachclinicsinServicePlanningArea4(M
etroLA
)byrace/ethnicity,20132014,
20142015and20152016,respectively.FluOutreachCam
paign.(Prelim
inarydata)
*CoveredCaliforniabegan
onJanuary1,2014.
**Percentagesmay
nottotalto100%dueto
rounding,multipleresponsesandmissingvalues
Note:AI/AN=American
Indian/Alaskan
Native,NH/PI=
NativeHaw
aiian/PacificaIslander
8%13%
7%12%14%
10%
4%
12%
33%
9%12%
14%
9%
8%
6%9%
4%
9%
14%
11%
5%7%
5%
19%
5%
6%
29%
4%
9%
19%
12%9%
29%
9%
50%
13%19%
45%
29%
21%
19%
33%
35%
13%
17%
13%
10%
36%
21%
45%
17%
28%
22%
13%
49%
21%
27%26%
26%
15%
13%
45%
62%
11%
55%
13%
0%
0%
1%
10%
2%
0%
0%
2%
3%
2%
1%
5%
3%
46%
43%
54%
31%
43%
25%
75%
19%
39%
22%
51%
24%
21%
18%
38%
38%
15%
42%
17%
10%
33%
3%
40%
0%
20%
40%
60%
80%
100%
120%
Asian
Black
Hispanic
White
Other
NH/PI
AI/AN
Multiethnic
Asian
Black
Hispanic
White
Other
NH/PI
AI/AN
Multiethnic
Asian
Black
Hispanic
White
Other
NH/PI
AI/AN
Multiethnic
201320142014201520152016
Percentage
ofclients**
Insurancestatus*byRace/Ethnicity
Med
icare
Med
icaid
Private
Other
Uninsured
75

Com
mun
ity H
ealth
Ser
vice
s / 3
13 N
. Fig
uero
a S
t., R
oom
117
/ Lo
s A
ngel
es, C
A 9
0012
/ s
oksu
zyan
@ph
.laco
unty.g
ov
Figure
53.Insurance
status*
ofclientsvaccinatedat
FluOutreachclinicsinServicePlanningArea5(W
estLA
)byrace/ethnicity,20132014,
20142015and20152016,respectively.FluOutreachCam
paign.(Prelim
inarydata)
*CoveredCaliforniabegan
onJanuary1,2014.
**Percentagesmay
nottotalto100%dueto
rounding,multipleresponsesandmissingvalues
Note:AI/AN=American
Indian/Alaskan
Native,NH/PI=
NativeHaw
aiian/PacificaIslander
12%19%
15%
42%
33%
20%
14%
15%
30%
7%
38%
33%
50%
13%
5%10%
10%
34%
33%
11%18%
3%
6%
5%
2%
7%
4%
9%
2%
6%
7%
10%
30%
27%
13%
20%
67%
22%
6%
23%
15%
13%
36%
33%
60%
50%
39%
16%
20%
41%
20%
100%
50%
27%
25%
26%
23%
41%
80%
44%
47%
1%
1%
3%
37%42%
51%
17%
20%
20%
100%
29%
21%
19%
45%
14%
33%
20%
56%
24%
31%
9%
15%
24%
0%
20%
40%
60%
80%
100%
120%
140%
Asian
Black
Hispanic
White
Other
NH/PI
AI/AN
Multiethnic
Asian
Black
Hispanic
White
Other
NH/PI
AI/AN
Multiethnic
Asian
Black
Hispanic
White
Other
NH/PI
AI/AN
Multiethnic
201320142014201520152016
Percentage
ofclients**
Insurancestatus*byRace/Ethnicity
Med
icare
Med
icaid
Private
Other
Uninsured
76

Com
mun
ity H
ealth
Ser
vice
s / 3
13 N
. Fig
uero
a S
t., R
oom
117
/ Lo
s A
ngel
es, C
A 9
0012
/ s
oksu
zyan
@ph
.laco
unty.g
ov
Figure
54.Insurance
status*
ofclientsvaccinatedat
FluOutreachclinicsinServicePlanningArea6(South
LA)byrace/ethnicity,20132014,
20142015and20152016,respectively.FluOutreachCam
paign.(Prelim
inarydata)
*CoveredCaliforniabegan
onJanuary1,2014.
**Percentagesmay
nottotalto100%dueto
rounding,multipleresponsesandmissingvalues
Note:AI/AN=American
Indian/Alaskan
Native,NH/PI=
NativeHaw
aiian/PacificaIslander
21%
15%
5%5%
13%18%
6%
23%
18%
5%8%
19%
20%
14%
11%16%
9%
3%5%
17%
2%
7%
1%
7%
4%
3%
3%33%
4%
3%
9%
5%
7%
5%
29%
14%
10%29%
25%
9%
50%
27%22%
42%
19%
8%
54%
23%
27%
35%
47%
27%
7%
63%
38%
20%
40%
54%
26%
8%
70%
60%
49%
26%
1%
0%
0%
1%
0%
1%
1%
1%
2%
4%
4%
19%
36%
52%
18%
36%27%
67%
28%
17%
29%
61%
15%
14%
20%
43%
25%
14%
20%
53%
8%
40%
12%
26%
0%
20%
40%
60%
80%
100%
120%
Asian
Black
Hispanic
White
Other
NH/PI
AI/AN
Multiethnic
Asian
Black
Hispanic
White
Other
NH/PI
AI/AN
Multiethnic
Asian
Black
Hispanic
White
Other
NH/PI
AI/AN
Multiethnic
201320142014201520152016
Percentage
ofclients**
Insurancestatus*byRace/Ethnicity
Med
icare
Med
icaid
Private
Other
Uninsured
77

Com
mun
ity H
ealth
Ser
vice
s / 3
13 N
. Fig
uero
a S
t., R
oom
117
/ Lo
s A
ngel
es, C
A 9
0012
/ s
oksu
zyan
@ph
.laco
unty.g
ov
Figure
55.Insurance
status*
ofclientsvaccinatedat
FluOutreachclinicsinServicePlanningArea7(EastLA
)byrace/ethnicity,20132014,
20142015and20152016,respectively.FluOutreachCam
paign.(Prelim
inarydata)
*CoveredCaliforniabegan
onJanuary1,2014.
**Percentagesmay
nottotalto100%dueto
rounding,multipleresponsesandmissingvalues
Note:AI/AN=American
Indian/Alaskan
Native,NH/PI=
NativeHaw
aiian/PacificaIslander
10%13%
10%
30%
25%
11%14%18%
13%
32%
21%
14%
11%
9%
8%
18%
12%
31%
11%
38%
11%17%
2%
13%
5%
2%
10%
11%5%
9%
8%
21%
5%11%
9%
26%
18%
27%
14%
6%
38%
26%17%
25%
21%
11%
32%
14%
20%
25%
22%
34%
45%
18%
43%42%
55%
22%37%
22%24%
17%
40%
33%
42%
33%
1%
4%
0%
0%
0%
0%
2%
12%
3%
5%
5%
4%
42%
42%
56%
30%
29%
40%
50%
33%
36%
27%
52%
18%
16%
27%
44%
26%
32%
24%
36%
10%
33%
25%11%
21%
0%
20%
40%
60%
80%
100%
120%
Asian
Black
Hispanic
White
Other
NH/PI
AI/AN
Multiethnic
Asian
Black
Hispanic
White
Other
NH/PI
AI/AN
Multiethnic
Asian
Black
Hispanic
White
Other
NH/PI
AI/AN
Multiethnic
201320142014201520152016
Percentage
ofclients**
Insurancestatus*byRace/Ethnicity
Med
icare
Med
icaid
Private
Other
Uninsured
78

Com
mun
ity H
ealth
Ser
vice
s /
313
N.
Fig
uero
a S
t., R
oom
117
/ L
os A
ngel
es,
CA
900
12 /
sok
suzy
an@
ph.la
coun
ty.g
ov
Figure
56.Insurance
status*
ofclientsvaccinatedat
FluOutreachclinicsinServicePlanningArea8(South
Bay)byrace/ethnicity,20132014,
20142015and20152016,respectively.FluOutreachCam
paign.(Prelim
inarydata)
*CoveredCaliforniabegan
onJanuary1,2014.
**Percentagesmay
nottotalto100%dueto
rounding,multipleresponsesandmissingvalues
Note:AI/AN=American
Indian/Alaskan
Native,NH/PI=
NativeHaw
aiian/PacificaIslander
26%
38%
15%
30%33%
29%
4%
28%33%
15%
31%
38%
47%
14%
21%
20%
9%
32%
23%
25%
7%
5%
3%
2%
2%
7%
6%
11%
2%
10%
7%
14%
19%
23%
25%
9%
15%
50%
31%
13%
30%
25%
12%
48%
38%
29%
39%
39%
28%
14%
50%
38%
33%
14%
45%
36%
40%
14%
46%
31%
44%
33%
0%
0%
0%
0%
3%
1%
3%
8%
32%29%
50%
18%
25%
50%
100%
24%
20%
25%
49%
14%
24%
20%
18%
13%10%
38%
9%
23%
25%
21%
0%
20%
40%
60%
80%
100%
120%
Asian
Black
Hispanic
White
Other
NH/PI
AI/AN
Multiethnic
Asian
Black
Hispanic
White
Other
NH/PI
AI/AN
Multiethnic
Asian
Black
Hispanic
White
Other
NH/PI
AI/AN
Multiethnic
201320142014201520152016
Percentage
ofclients**
Insurancestatus*byRace/Ethnicity
Med
icare
Med
icaid
Private
Other
Uninsured 79

Last Name First Name MI
Home Address (House Number and Street Name) Apt Number
City Zip Code Gender
Patient's Mother's First Name Only Date of Birth (example 05/22/1982)
Area Code Phone Number Age Infant (Months)- -
Race/Ethnicity (Choose One) Asian Black/African American Hispanic/Latino White
Native Hawiian/Pacific Islander American Indian/Alaskan Native Multi-Race Other
What type of health insurance do you have? None Private (ex. Anthem Blue Cross, Kaiser Permanente)
Medi-Cal/Medicaid Medicare I don't know Other insurance : ______________________________
1. Do you have a fever or are you sick today? Yes No
2. Are you pregnant or do you think you may be pregnant? Yes No
3. Have you had a serious reaction to flu vaccine requiring medical help? Yes No
STOP - DO NOT WRITE BELOW THIS LINE SCREENER INITIALS4. Do you have a severe allergy to eggs? [If YES, See Allergy Guidelines] Yes No
5. Do you have an allergy to thimerosal? Yes No
6. Do you have an allergy to latex? [Do not use Novartis single-dose syringes] Yes No
7. Have you received any of these vaccines in the last 4 weeks? [MMR, Varicella, LAIV, Shingles] Yes No
8. Do you have any of the following conditions? [If YES, administer IIV ONLY] Yes No
9. Have you ever had Guillain-Barré Syndrome (GBS)? Yes No
10. Have you taken any antiviral medication in the last 48 hours? [Contraindicated for LAIV] Yes No
If the vaccination is for a child, ask these questions: [If YES to either, adminster IIV ONLY]
11. If child is <5 years, have they been diagnosed with with wheezing in the last 12 months? Yes No N/A
12. Is the child taking long term medicine therapy containing ASPIRIN? Yes No N/A
Manufacturer and Lot Number Flu Vaccine VIS (IIV) 08/07/2015
INACTIVATED (Flu Shot - IIV)Manufacturer GSK NOV SP
Lot #Manufacturer and Lot Number Flu Vaccine VIS (LAIV) 08/07/2015
LIVE (Nasal Spray - LAIV) REMINDER LAIV Is Only For Healthy Clients 2 Thru 49 Years of Age Who Are NOT PregnantManufacturer MI
Lot #(example 10/20/2015) PLEASE PRINT CLEARLY
Date Administered (MM/DD/YYYY) Admin Initials:
English
0.50mL
0.20mL Site
0.25mL RDLD
LT RT
Nurse Instructor Signature: Language Interpreter Signature:
MaleFemale
I CONSENT TO THE VACCINATION PROVIDED If under 18 years of age, PRINT name of parent or legal guardian
(Heart, Lung, Kidney or Liver Disease; Asthma; Cancer; Metabolic disease (i.e. diabetes); Blood Disorders (i.e. leukemia, lymphoma, sickle cell disease) Immune System Disorder (i.e. HIV/AIDS, steroid therapy)
Site
Dosage
DosageDose
Dose
1
1
2
2 Intranasal
Flu Vaccination Consent Form 2015 - 2016
8
A1

Apellido Primer Nombre
Domicilio de Casa (número de casa y nombre de calle)
Ciudad Código postal Género
Solamente el primer nombre de la mama del paciente Fecha de nacimiento (ejemplo 05/22/1982)
Número de teléfono Edad Bebé (meses)- -
Raza/Origen étnico (elige uno): Asiático Negro / Afroamericano Hispano / Latino Blanco
Nativo de Hawái / Isleño del Pacifico Indio Americano / Nativo de Alaska Multiracial Otro
¿Qué tipo de seguro de salud tiene usted? Ninguno Privada (ej. Anthem Blue Cross, Kaiser Permanente)
Medi-Cal/Medicaid Medicare No sé
1. ¿Tiene fiebre o está enfermo hoy? Si No
2. ¿Está embarazada o piensa que puede estar embarazada? Si No
3. ¿Ha tenido una reacción grave a la vacuna contra la gripe que requiere ayuda médica? Si No
STOP - DO NOT WRITE BELOW THIS LINE SCREENER INITIALS4. Do you have a severe allergy to eggs? [If YES, See Allergy Guidelines] Yes No
5. Do you have an allergy to thimerosal? Yes No
6. Do you have an allergy to latex? [Do not use Novartis single-dose syringes] Yes No
7. Have you received any of these vaccines in the last 4 weeks? [MMR, Varicella, LAIV, Shingles] Yes No
8. Do you have any of the following conditions? [If YES, administer IIV ONLY] Yes No
9. Have you ever had Guillain-Barré Syndrome (GBS)? Yes No
10. Have you taken any antiviral medication in the last 48 hours? [Contraindicated for LAIV] Yes No
If the vaccination is for a child, ask these questions: [If YES to either, adminster IIV ONLY]
11. If child is <5 years, have they been diagnosed with with wheezing in the last 12 months? Yes No N/A
12. Is the child taking long term medicine therapy containing ASPIRIN? Yes No N/A
Manufacturer and Lot Number Flu Vaccine VIS (IIV) 08/07/2015
INACTIVATED (Flu Shot - IIV)Manufacturer GSK NOV SP
Lot #Manufacturer and Lot Number Flu Vaccine VIS (LAIV) 08/07/2015
LIVE (Nasal Spray - LAIV) REMINDER LAIV Is Only For Healthy Clients 2 Thru 49 Years of Age Who Are NOT PregnantManufacturer MI
Lot #(example 10/20/2015) PLEASE PRINT CLEARLY
Date Administered (MM/DD/YYYY) Admin Initials:
Spanish
Inicial
DOY MI CONSENTIMIENTO PARA LA VACUNA.
Firma
Si es menor de 18 años de edad, escriba el nombre del padre o del guardián legal en letra de molde.
Número de apartamento
Otro seguro: _________________________________
Nurse Instructor Signature: Language Interpreter Signature:
MasculinoFemenino
(Heart, Lung, Kidney or Liver Disease; Asthma; Cancer; Metabolic disease (i.e. diabetes); Blood Disorders (i.e. leukemia, lymphoma, sickle cell disease) Immune System Disorder (i.e. HIV/AIDS, steroid therapy)
Site
Dosage
DosageDose
Dose
1
1
2
2 Intranasal
0.50mL
0.20mL Site
0.25mL RDLD
LT RT
Flu Vaccination Consent Form 2015 - 2016
8

( ) ( )
/ / ( 1982 5 22 )
- -
/ ( ) / /
/ /
( : Anthem , Kaiser Permanente)
(Medicare) : ___________________________________
STOP - DO NOT WRITE BELOW THIS LINE SCREENER INITIALS4. Do you have a severe allergy to eggs? [If YES, See Allergy Guidelines] Yes No
5. Do you have an allergy to thimerosal? Yes No
6. Do you have an allergy to latex? [Do not use Novartis single-dose syringes] Yes No
7. Have you received any of these vaccines in the last 4 weeks? [MMR, Varicella, LAIV, Shingles] Yes No
8. Do you have any of the following conditions? [If YES, administer IIV ONLY] Yes No
9. Have you ever had Guillain-Barré Syndrome (GBS)? Yes No
10. Have you taken any antiviral medication in the last 48 hours? [Contraindicated for LAIV] Yes No
If the vaccination is for a child, ask these questions: [If YES to either, adminster IIV ONLY]
11. If child is <5 years, have they been diagnosed with with wheezing in the last 12 months? Yes No N/A
12. Is the child taking long term medicine therapy containing ASPIRIN? Yes No N/A
Manufacturer and Lot Number Flu Vaccine VIS (IIV) 08/07/2015
INACTIVATED (Flu Shot - IIV)Manufacturer GSK NOV SP
Lot #Manufacturer and Lot Number Flu Vaccine VIS (LAIV) 08/07/2015
LIVE (Nasal Spray - LAIV) REMINDER LAIV Is Only For Healthy Clients 2 Thru 49 Years of Age Who Are NOT Pregnant
Manufacturer MI
Lot #(example 10/20/2015) PLEASE PRINT CLEARLY
Date Administered (MM/DD/YYYY) / / Admin Initials:
Chinese
LD
LT RT
Dosage
Dosage0.50mL
0.20mL Site
0.25mL RD
Intranasal
1. ?
3. ?
(Medi-Cal/Medicaid)
Language Interpreter Signature:
(Heart, Lung, Kidney or Liver Disease; Asthma; Cancer; Metabolic disease (i.e. diabetes); Blood Disorders (i.e. leukemia, lymphoma, sickle cell disease) Immune System Disorder (i.e. HIV/AIDS, steroid therapy)
Site
2. ?
Dose
Dose
1
1
2
2
Nurse Instructor Signature:
2015 - 2016 Flu Vaccination Consent Form)
8

( )
( ) ( : / / )
- -
/ ( ): / /
/ /
? ( : , )
/ ______________________________
1. ?
2. ?
3. ?
STOP - DO NOT WRITE BELOW THIS LINE SCREENER INITIALS4. Do you have a severe allergy to eggs? [If YES, See Allergy Guidelines] Yes No
5. Do you have an allergy to thimerosal? Yes No
6. Do you have an allergy to latex? [Do not use Novartis single-dose syringes] Yes No
7. Have you received any of these vaccines in the last 4 weeks? [MMR, Varicella, LAIV, Shingles] Yes No
8. Do you have any of the following conditions? [If YES, administer IIV ONLY] Yes No
9. Have you ever had Guillain-Barré Syndrome (GBS)? Yes No
10. Have you taken any antiviral medication in the last 48 hours? [Contraindicated for LAIV] Yes No
If the vaccination is for a child, ask these questions: [If YES to either, adminster IIV ONLY]
11. If child is <5 years, have they been diagnosed with with wheezing in the last 12 months? Yes No N/A
12. Is the child taking long term medicine therapy containing ASPIRIN? Yes No N/A
Manufacturer and Lot Number Flu Vaccine VIS (IIV) 08/07/2015
INACTIVATED (Flu Shot - IIV)Manufacturer GSK NOV SP
Lot #Manufacturer and Lot Number Flu Vaccine VIS (LAIV) 08/07/2015
LIVE (Nasal Spray - LAIV) REMINDER LAIV Is Only For Healthy Clients 2 Thru 49 Years of Age Who Are NOT PregnantManufacturer MI
Lot #(example 10/20/2015) PLEASE PRINT CLEARLY
Date Administered (MM/DD/YYYY) Admin Initials:
Korean
2
( )
:
Nurse Instructor Signature: Language Interpreter Signature:
DosageDose 1 Intranasal0.20mL Site
18 ,
(Heart, Lung, Kidney or Liver Disease; Asthma; Cancer; Metabolic disease (i.e. diabetes); Blood Disorders (i.e. leukemia, lymphoma, sickle cell disease) Immune System Disorder (i.e. HIV/AIDS, steroid therapy)
SiteDosageDose 1 20.50mL
0.25mL RDLD
LT RT
Flu Vaccination Consent Form 2015 - 2016
8

Dat
e em
aile
d:
TO
:
FRO
M:
Publ
ic H
ealth
Cen
ter
& S
PA
Flu
Coo
rdin
ator
's N
ame,
Titl
e, a
nd d
irec
t Tel
epho
ne N
umbe
r
SUB
JEC
T:
2014
-201
5 SE
ASO
NA
L IN
FLU
EN
ZA
OU
TR
EA
CH
CL
INIC
SC
HE
DU
LE
Dat
e of
Clin
ic
Sess
ion
Ven
ue T
ype
Tar
get P
opul
atio
n C
linic
Ses
sion
Nam
e
Dat
e(M
M/D
D/Y
YY
Y)
Star
t Tim
e (#
:##)
Star
t Tim
e A
M o
r PM
End
Tim
e(#
:##)
End
Tim
e
A
M
or P
MO
utre
ach,
Sch
ool,
Shel
ter
etc
Chi
ldre
n, S
enio
rs, H
omel
ess,
or Im
mun
e C
ompr
omis
ed A
dults
Site
Nam
eSt
reet
Add
ress
(
DO
NO
T u
se a
ny
peri
ods)
City
Z
ip C
ode
Supe
rvis
oria
lD
istr
ict
Num
ber
of
dose
sad
min
iste
red
in th
e 20
13-
2014
seas
on
Num
ber
of
dose
sre
ques
ted
this
se
ason
10/2
4/20
110
:30
AM5:
30PM
Out
reac
hC
hild
ren
HIS
Sen
ior C
ente
rSA
MPL
E33
3333
S M
ain
Blvd
Lo
s Ang
eles
9000
04
325
325
Flu
Sche
dule
Tem
plat
e (S
AM
PLE
)
Jane
Doe
, RN
,
TIM
E o
f Clin
ic S
essi
onA
ddre
ss o
f Clin
ic S
essi
onV
acci
ne D
oses
Beg
inni
ng In
-Hou
se F
lu C
linic
Dat
e:N
ame
of D
istr
ict:
DIR
EC
TIO
NS:
Ple
ase
use
a se
para
te li
ne/r
ow to
add
clin
ic se
ssio
ns fo
r the
sam
e da
te a
nd si
te.
Ple
ase
do n
ot p
rint
out
spre
adsh
eet a
nd c
ompl
ete
by h
and.
All
info
rmat
ion
mus
t be
ente
red
in th
is sp
read
shee
t.
SPA
#:
Cou
nty
of L
os A
ngel
es -
Dep
artm
ent o
f Pub
lic H
ealth
w
ww
.pub
liche
alth
.laco
unty
.gov
/ip
2
8

Clin
icSession
Date
Venue
TargetPopulation
City
StartTime
EndTime
SupDist
Health
Center
Site
Number
SPA
No.o
fPeople
Vaccinated
(coversheet)
No.o
fForm
s
Enteredby
DataEn
tryTech
DataEn
try
Complete
Date
10/21/2015
School
All
Littlerock
9:00AM
12:00PM
5AV
101
1182
182
12/22/2015
10/30/2015
School
All
LosAngeles
9:00AM
1:00PM
2PH
614
6120
121
1/11/2016
10/28/2015
CharterSchool
All
LosAngeles
8:00AM
12:00PM
2PH
612
639
39
1/28/2016
11/1/2015
Church
All
Lancaster
12:00PM
2:30PM
5AV
102
153
53
1/11/2016
10/22/2015
Outreach
Children,Sen
iors,
Immune
Compromised
Adults
LosAngeles
8:00AM
12:00PM
2CE
402
4227
227
12/29/2015
10/23/2015
HealthFair
All
Red
ondoBeach
11:00AM
2:00PM
4CT
801
8167
167
1/19/2016
10/22/2015
SeniorCen
ter
Children,Sen
iors,
Immune
Compromised
Adults
Azusa
9:00AM
11:30AM
1MO
301
396
96
12/22/2015
1/11/2016
SeniorCen
ter
Children,Sen
iors,
Immune
Compromised
Adults
Glendora
9:00AM
12:00PM
1MO
308
31
13/11/2016
11/18/2015
ColdWeather
Shelter
Homeless
BellG
arden
s5:30PM
7:30PM
1WH
714
712
12
1/29/2016
(20152016Influen
zaCam
paign
DataEntryCompletionLogs
sentto
theattentionofNirviShah
andShellyHsu)
20152016FluVaccinationFax/Em
ailLogforServicePlanningAreas
18(6/15/16)
[(new
*)=site
notonoriginaloutreach
list]
Datelog+scanned
CompletionLogwereem
ailedto
Dulm
iniW
ilsonat
theIm
munizationProgram
:_____/______/______
Epidem
iology
Unit/313N.FigueroaStreet,R
oom
127/LA
CA90012/[email protected]/Page1of17
8
A3

Cover Sheet for CHS Flu Outreach Clinics, 201 -201
Los Angeles County Department of Public Health Community Health Service Division (9/201 ) Page 1
Return this Cover Sheet to the Office of Health Assessment & Epidemiology within 3 BUSINESS DAYS after each outreach ends
Email to, [email protected] or FAX to (213) 250-2594.
All outreach staff must write in their own name, print initials, and flu form initials (i.e., initials as they appear on the flu forms)
Cover Sheet Submitted by:
Date / / First Name: Last Name:
Phone# ( _) - Email @ph.lacounty.gov
PLEASE PRINT NEATLY Outreach Date: Number of People Vaccinated: #
Clinic Site Name:
Clinic Site Address:
DPH Public Health Center Conducting Outreach Clinic: SPA Conducting Outreach:
Vaccine Information* (See manufacturer abbreviations below)
Manufacturer: Manufacturer: Manufacturer: Manufacturer:
Lot #: Lot #: Lot #: Lot #:
*SP-Sanofi Pasteur, MI-MedImmune, NOV-Novartis, GSK-GlaxoSmithKline
Please Print Name (Example: Susan R. Smith, RN)
Check if you served in any of the following roles at this outreach clinic
Printed Initials (Ex: SRS)
Flu Form Initials (Ex: Srs)
1. Vaccinator Screener Volunteer
2. Vaccinator Screener Volunteer
3. Vaccinator Screener Volunteer
4. Vaccinator Screener Volunteer
5. Vaccinator Screener Volunteer
6. Vaccinator Screener Volunteer
7. Vaccinator Screener Volunteer
8. Vaccinator Screener Volunteer
9. Vaccinator Screener Volunteer
10. Vaccinator Screener Volunteer
11. Vaccinator Screener Volunteer
12. Vaccinator Screener Volunteer
4
8

CHS Influenza Procedures
2015 – 2016 CHS Influenza Form Procedures
Purpose: To have a procedure in place to ensure that the influenza (flu) consent forms
and cover sheets, are accurately completed, and promptly transported to the Office of
Health Assessment and Epidemiology (OHAE) for data entry purposes. Outreach clinics
are defined as any flu clinic conducted outside of the Department of Public Health (DPH)
in house immunization clinic.
Influenza Outreach Forms
The following forms shall be provided to patients receiving an influenza vaccination:
Vaccine Information Sheet2015-2016 Influenza Consent Form
During the outreach
The nurse in-charge of the outreach clinic must review and complete the CHS InfluenzaCoversheet. Indicate if each participant is a vaccinator or screener.Each person participating in the outreach should sign his/her own name and initials onthe Coversheet.
o Initials should be signed the same was as they are signed on the Flu VaccinationForm 2015-2016.
All flu doses administered at outreach clinics conducted by CHS staff will utilize the FluVaccination Form 2015 -2016.
Screeners must review each vaccination form to ensure the following fields arecomplete, accurate, and legible:
o Last Nameo First Nameo Date of Birtho Zip Codeo Phone Numbero Gendero Mother’s First Nameo Race/ethnicityo Pregnancy Statuso Type of flu vaccine administered (LAIV or TIV)o Manufacturero Lot Numbero Site of Administrationo Staff Initialso Date of Administrationo Vaccine for Children (VFC) eligibility questions
5
8

CHS Influenza Procedures
2015 – 2016 CHS Influenza Form Procedures
o Insurance Coverage
After the outreach: The nurse in-charge must review and complete the Cover Sheet for CHS Flu OutreachClinics, 2015-2016 and attach to the vaccination consent forms. All of the information onthe cover sheet must be completed.
Check to make sure all of the names and initials of the screeners and vaccinators arelisted on the Cover Sheet for CHS Flu Outreach Clinics, 2015-2016.
Sort the “2015-2016 Flu Vaccination Consent Forms” by the vaccinator’s initials. Forexample, all forms signed by Susan R. Smith with the initials SRS should be paperclipped together.
Review the vaccination forms for completeness. Correct forms missing the followinginformation:
o Type of vaccineo Lot numbers should match those listed on the cover sheeto Date vaccine administered
CHS Flu Outreach Cover Sheets
After the outreach clinic:
Within 3 business days of the flu outreach, the flu coordinator (or designee) shall fax oremail the CHS Flu Outreach Cover Sheets to the OHAE. Faxed forms should be sent to:213-250-2594. Forms sent via email should be sent to the attention of Nirvi Shah, EpiAnalyst at: [email protected].
The flu coordinator (or designee) shall ensure all consent forms are properly batchedwith the CHS Flu Outreach cover sheet on top and delivered to the OHAE on theMonday following the outreach. Forms should be delivered to:
- Office of Health Assessment and Epidemiology 313 N. Figueroa St. Room #127 Los Angeles, CA 90012 *Sign in with Jeremy Huang
8

CHS Influenza Procedures
2015 – 2016 CHS Influenza Form Procedures
Once all forms are entered, the OAHE will send all batched forms to CHSAdministration, to the attention of Angela Austin, CHS Flu Coordinator.
The CHS Flu Coordinator will work with the Area Nurse Managers to ensure that thesebatched forms are returned to the appropriate health center.

Pos
Varia
ble
Nam
eVa
riabl
e La
bel
Type
Cod
ed V
alue
sD
ata
Entr
y G
uide
lines
1sd
ist
Sup
ervi
soria
l Dis
tric
t of t
he O
utre
ach
Num
eric
1 =
Sup
ervi
soria
l Dis
tric
t 1
2 =
Sup
ervi
soria
l Dis
tric
t 2
3 =
Sup
ervi
soria
l Dis
tric
t 3
4 =
Sup
ervi
soria
l Dis
tric
t 4
5 =
Sup
ervi
soria
l Dis
tric
t 5
2sp
aN
umer
ic1
= S
PA
1
2 =
SP
A 2
3 =
SP
A 3
4 =
SP
A 4
5 =
SP
A 5
6 =
SP
A 6
7 =
SP
A 7
8 =
SP
A 8
3ce
nter
Hea
lth C
ente
r m
anag
ing
the
Out
reac
hC
hara
cter
AV
= A
ntel
ope
Val
ley
CE
= C
entr
al
CT
= C
urtis
Tuc
ker
GL
= G
lend
ale
HW
= H
olly
woo
d W
ilshi
re
MO
= M
onro
via
NH
= N
orth
Hol
lyw
ood
PA
= P
acoi
ma
PH
= C
ente
r fo
r P
ublic
Hea
lth (
MLK
)
PO
= P
omon
a
SM
= S
imm
s M
ann
Bur
ke
WH
= W
hitti
er
4ou
tsite
Site
Num
ber
of th
e O
utre
ach
Num
eric
from
101
to 8
11N
/A
5id
Pat
ient
's ID
form
Num
eric
N/A
ID a
uto-
gene
rate
d fr
om th
e ac
cess
dat
abas
e
6la
ngLa
ngua
ge o
f the
form
Num
eric
1 =
Eng
lish
2 =
Spa
nish
3 =
Chi
nese
4 =
Kor
ean
7pt
_lna
me
Pat
ient
's la
st n
ame
Cha
ract
erN
/A
8pt
_fna
me
Pat
ient
's fi
rst n
ame
Cha
ract
erN
/A
9pt
_mna
me
Pat
ient
's m
iddl
e in
itial
Cha
ract
erN
/A
10ci
tyP
atie
nt's
city
of r
esid
ence
Cha
ract
erN
/AIf
city
is le
ft bl
ank,
type
mis
sing
.
11zi
pcod
eP
atie
nt's
zip
cod
e of
res
iden
ceN
umer
icN
/A
N/A
If m
iddl
e in
itial
is le
ft bl
ank,
leav
e bl
ank.
If fir
st n
ame
is le
ft bl
ank,
leav
e bl
ank.
If la
st n
ame
is le
ft bl
ank,
leav
e bl
ank.
N/A
If pa
tient
wro
te h
omel
ess,
ent
er '8
8888
'; If
id
il
ftbl
kt
'999
99'
Cre
ated
9.2
1.20
15 /
Upd
ated
1.1
4.20
16C
omm
unity
Hea
lth S
ervi
ces/
Epid
emio
logy
Uni
t
Cod
eboo
k fo
r Flu
Vac
cina
tion
2015
-201
6
SP
A b
y H
ealth
Cen
ter
that
is m
anag
ing
the
Out
reac
h
N/A
Com
mun
ity H
ealth
Ser
vice
s / 3
13 N
. Fig
uero
a S
tree
t, R
oom
127
/ Lo
s A
ngel
es, C
A 9
0012
/ C
reat
ed 0
9.22
.15
/ nsh
ah@
ph.la
coun
ty.g
ov /
Pag
e 1
of 3
9
A6

Pos
Varia
ble
Nam
eVa
riabl
e La
bel
Type
Cod
ed V
alue
sD
ata
Entr
y G
uide
lines
8888
8 =
Hom
eles
s99
999
= M
issi
ng
12se
xP
atie
nt's
gen
der
Num
eric
1 =
Mal
e
2 =
Fem
ale
9 =
Mis
sing
13bi
rth_
mom
_fna
me
Mot
her's
firs
t nam
eC
hara
cter
N/A
If m
othe
r's fi
rst n
ame
is b
lank
, lea
ve b
lank
. If f
irst
and
last
nam
e ar
e w
ritte
n, o
nly
ente
r fir
st n
ame.
14ph
one
Pat
ient
's p
hone
num
ber
Cha
ract
erN
/AIf
phon
e nu
mbe
r is
mis
sing
, lea
ve b
lank
.
15do
bP
atie
nt's
dat
e of
birt
hD
ate
MM
/DD
/YY
YY
If da
te o
f birt
h is
mis
sing
, lea
ve b
lank
.
16ag
eP
atie
nt's
age
Num
eric
999
= M
issi
ngIf
age
is m
issi
ng, e
nter
'999
'. F
ield
is in
tend
ed fo
r pa
tient
s ag
ed 1
yea
r or
old
er.
17m
onth
sIn
fant
age
Num
eric
99 =
Mis
sing
If ag
e is
mis
sing
, ent
er '9
9'. F
ield
is in
tend
ed fo
r pa
tient
s ag
ed le
ss th
an 1
yea
r.
18ra
ceP
atie
nt's
rac
e/et
hnic
ityN
umer
ic1
= A
sian
2 =
Bla
ck/A
fric
an A
mer
ican
3 =
His
pani
c/La
tino
4 =
Whi
te
5 =
Nat
ive
Haw
aiia
n/P
acifi
c Is
land
er
6 =
Am
eric
an In
dian
/Ala
skan
Nat
ive
7 =
Mul
ti-ra
ce
8 =
Oth
er
9 =
Mis
sing
19no
neP
atie
nt h
as n
o in
sura
nce
Num
eric
1 =
Yes
2 =
No
20pr
ivat
eP
atie
nt h
as p
rivat
e in
sura
nce
Num
eric
1 =
Yes
2 =
No
21m
edic
aid
Pat
ient
has
Med
i-Cal
/med
icai
dN
umer
ic1
= Y
es
2 =
No
22m
edic
are
Pat
ient
has
med
icar
eN
umer
ic1
= Y
es
2 =
No
23dk
Pat
ient
doe
s no
t kno
w in
sura
nce
stat
usN
umer
ic1
= Y
es
2 =
No
24ot
her
Pat
ient
has
oth
er in
sura
nce
Num
eric
1 =
Yes
2 =
No
25ot
her_
spS
peci
fy o
ther
insu
ranc
eC
hara
cter
N/A
26in
sure
_mis
sP
atie
nt's
insu
ranc
e st
atus
is m
issi
ngN
umer
ic1
= Y
es
2 =
No
27ris
kP
atie
nt is
pre
gnan
t or
thin
ks th
ey m
ay b
e pr
egna
ntN
umer
ic1
= Y
esIf
unm
arke
d, e
nter
'9'.
2 =
No
9 =
Mis
sing
28va
c_co
deT
ype
of v
acci
neN
umer
ic1
= In
activ
ated
2 =
Liv
e
zipc
ode
isle
ftbl
ank,
ent
er'9
9999
'.
Ent
er th
e ty
pe o
f ins
uran
ce p
atie
nt w
rote
on
the
cons
ent f
orm
, as
is.
If H
ispa
nic
is s
elec
ted
in a
dditi
on to
ano
ther
rac
e,
ente
r '3
'.If
two
or m
ore
race
s ar
e se
lect
ed (
and
His
pani
c is
no
t one
of t
he s
elec
tions
), e
nter
'8'.
If th
e ra
ce fi
eld
is le
ft bl
ank,
sel
ect '
9'.
If al
l ins
uran
ce s
tatu
s va
riabl
es a
re le
ft bl
ank,
ch
oose
'1'.
If pa
tient
has
writ
ten
in a
type
of i
nsur
ance
on
the
cons
ent f
orm
, ent
er '1
'.
If ge
nder
is le
ft bl
ank,
ent
er '9
'.
Com
mun
ity H
ealth
Ser
vice
s / 3
13 N
. Fig
uero
a S
tree
t, R
oom
127
/ Lo
s A
ngel
es, C
A 9
0012
/ C
reat
ed 0
9.22
.15
/ nsh
ah@
ph.la
coun
ty.g
ov /
Pag
e 2
of 3
9

Pos
Varia
ble
Nam
eVa
riabl
e La
bel
Type
Cod
ed V
alue
sD
ata
Entr
y G
uide
lines
29m
anu
Man
ufac
ture
rN
umer
ic1
= G
laxo
Sm
ith K
line
(GS
K)
2 =
Nov
artis
(N
OV
)
3 =
San
ofi P
aste
ur (
SP
)
4 =
Med
imm
une
(MI)
9 =
Mis
sing
30lo
t_nu
mLo
t Num
ber
Num
eric
1 =
151
5701
(N
OV
)If
lot n
umbe
r is
left
blan
k, e
nter
'999
'.
2 =
151
6501
(N
OV
)
3 =
157
805
(NO
V)
4 =
157
55P
(N
OV
)
5 =
158
003
(NO
V)
6 =
UI4
50A
D (
SP
)
7 =
UI4
50A
E (
SP
)
8 =
U53
19D
A (
SP
)
9 =
UI4
31A
E (
SP
)
10 =
FJ2
159
(MI)
11 =
397
A7
(GS
K)
12 =
FL2
016
(MI)
13 =
151
6601
(N
OV
)
999
= M
issi
ng
31va
c_do
seD
ose
1 or
2N
umer
ic1
= D
ose
1
2 =
Dos
e 2
9 =
Mis
sing
32do
seD
osag
eN
umer
ic1
= 0
.25m
L
2 =
0.5
0mL
3 =
0.2
0mL
9 =
Mis
sing
33bs
ite_c
ode
Site
of i
njec
tion
Num
eric
1 =
Lef
t del
toid
(LD
)
2 =
Rig
ht d
elto
id (
RD
)
3 =
Lef
t thi
gh (
LT)
4 =
Rig
ht th
igh
(RT
)
5 =
Intr
anas
al
9 =
Mis
sing
34va
c_da
teD
ate
adm
inis
tere
dD
ate
MM
/DD
/YY
YY
35in
j_by
Vac
cina
tor
Num
eric
from
1 to
427
If in
j_by
is le
ft bl
ank,
ent
er '9
99'
888
= N
ursi
ng s
tude
nt (
NS
)
999
= M
issi
ng
36da
teen
tD
ate
form
ent
ered
into
Acc
ess
data
base
Dat
eM
M/D
D/Y
YY
Y
37en
tby
Initi
als
of p
erso
n co
mpl
etin
g da
ta e
ntry
Cha
ract
er
if do
sage
is le
ft bl
ank,
ent
er '9
'.
If bs
ite_c
ode
is le
ft bl
ank,
ent
er '9
'.
If un
mar
ked,
ent
er '9
'.
If un
mar
ked,
ent
er '9
'.
Com
mun
ity H
ealth
Ser
vice
s / 3
13 N
. Fig
uero
a S
tree
t, R
oom
127
/ Lo
s A
ngel
es, C
A 9
0012
/ C
reat
ed 0
9.22
.15
/ nsh
ah@
ph.la
coun
ty.g
ov /
Pag
e 3
of 3
9

Last Name First Name MI
Home Address (House Number and Street Name) Apt Number
City Zip Code Gender
Patient's Mother's First Name Only Date of Birth (example 05/22/1982)
Area Code Phone Number Age Infant (Months)- -
Race/Ethnicity (Choose One) Asian Black/African American Hispanic/Latino White
Native Hawiian/Pacific Islander American Indian/Alaskan Native Multi-Race Other
What type of health insurance do you have? None Private (ex. Anthem Blue Cross, Kaiser Permanente)
Medi-Cal/Medicaid Medicare I don't know Other insurance : ______________________________
1. Do you have a fever or are you sick today? Yes No
2. Are you pregnant or do you think you may be pregnant? Yes No
3. Have you had a serious reaction to flu vaccine requiring medical help? Yes No
STOP - DO NOT WRITE BELOW THIS LINE SCREENER INITIALS4. Do you have a severe allergy to eggs? [If YES, See Allergy Guidelines] Yes No
5. Do you have an allergy to thimerosal? Yes No
6. Do you have an allergy to latex? [Do not use Novartis single-dose syringes] Yes No
7. Have you received any of these vaccines in the last 4 weeks? [MMR, Varicella, LAIV, Shingles] Yes No
8. Do you have any of the following conditions? [If YES, administer IIV ONLY] Yes No
9. Have you ever had Guillain-Barré Syndrome (GBS)? Yes No
10. Have you taken any antiviral medication in the last 48 hours? [Contraindicated for LAIV] Yes No
If the vaccination is for a child, ask these questions: [If YES to either, adminster IIV ONLY]
11. If child is <5 years, have they been diagnosed with with wheezing in the last 12 months? Yes No N/A
12. Is the child taking long term medicine therapy containing ASPIRIN? Yes No N/A
Manufacturer and Lot Number Flu Vaccine VIS (IIV) 08/07/2015
INACTIVATED (Flu Shot - IIV)Manufacturer GSK NOV SP
Lot #Manufacturer and Lot Number Flu Vaccine VIS (LAIV) 08/07/2015
LIVE (Nasal Spray - LAIV) REMINDER LAIV Is Only For Healthy Clients 2 Thru 49 Years of Age Who Are NOT PregnantManufacturer MI
Lot #(example 10/20/2015) PLEASE PRINT CLEARLY
Date Administered (MM/DD/YYYY) Admin Initials:
English
0.50mL
0.20mL Site
0.25mL RDLD
LT RT
Nurse Instructor Signature: Language Interpreter Signature:
MaleFemale
I CONSENT TO THE VACCINATION PROVIDED If under 18 years of age, PRINT name of parent or legal guardian
(Heart, Lung, Kidney or Liver Disease; Asthma; Cancer; Metabolic disease (i.e. diabetes); Blood Disorders (i.e. leukemia, lymphoma, sickle cell disease) Immune System Disorder (i.e. HIV/AIDS, steroid therapy)
Site
Dosage
DosageDose
Dose
1
1
2
2 Intranasal
Flu Vaccination Consent Form 2015 - 20167
9
pt_lname pt_fname pt_mname
city zipcodesex
phone
birth_mom_fname dob
race
medicareprivate
dk
none
insure_missother other_sp
$entby
age months
manu
manu
vac dose dose bsite_code
vac dose dose
vac_date inj_by
bsite_code
lot_num
lot_num
vac_code
vac_code
risk
medicaid
dateent
lang

8
9

Community Health Services / Epidemiology Unit / October 2014 /Page 1 of 3
201 201 CHS Flu Campaign Data Entry Protocol
Please use this protocol and the codebook to guide you through entering Flu VaccinationConsent Forms into your Access Database.If you have questions about data entry, you may contact or .
Community Health Services Contacts:
Angela Austin241 N Figueroa St. Room 306
Phone: 213 250 8519Email: [email protected]
Shelly Hsu313 N Figueroa St. Room 117
Phone: 213 240 7785Email: [email protected]
Nirvi Shah313 N Figueroa St. Room 117
Phone: 213 240 8429Email: [email protected]
313 N Figueroa St. Room 117Phone: 213 989 7042Email: @ph.lacounty.gov
313 N Figueroa St. Room 117Phone: 213 240 8088Email: @ph.lacounty.gov
Office of Health Assessment Contact:
Lisa V. Smith313 N Figueroa St. Room 127
Phone: 323 231 7640Email: [email protected]
Receiving Your Data Entry Assignment
CHS will deliver forms to Nirvi Shah weekly. Once these batches are recorded, you willreceive an email stating which of your batches are available. Once you receive the Data EntryCompletion Log from Nirvi, you may pick up your batch from the locked cabinet in Room127.
Receiving Your Batch
1) After obtaining the batch, record the date you received the forms on the Data EntryCompletion Log.
2) Check that the outreach date on the Cover Sheet matches the Date Administered field on theforms.
Sorting and Counting the Forms1) Sort the Flu Vaccination Consent Forms by the vaccinator’s initials (group all the forms with
the same vaccinator together).
2) Match the vaccinator’s initials on the forms to the initials on the Cover Sheet. If thevaccinator’s initials are on the form, but missing from the Cover Sheet, scan and email theconsent form (bottom half only) and the cover sheet to Nirvi Shah. Do not enter the formuntil a response from Nirvi Shah is received. Nirvi Shah will forward to Angela or NurseManager. Please wait for response from Nirvi, and wait for the updated codebook toproceed with data entry.
9
9

Community Health Services / Epidemiology Unit / October 2014 /Page 2 of 3
3) If there are duplicate forms/carbon copies, do not enter the duplicate. Count the duplicateform as one of the forms received, and document the number of duplicate forms received inthe “Problems Encountered” section of the completion log.
4) Count the number of Vaccination Consent Forms and record that number on the Data EntryCompletion Log.
The Database
The Access databases will be stored on the shared drive chs epi (H Drive). A file folder withyour name will house all databases assigned to you. You will receive a separate email withthe password for the databases.
Begin Data Entry
Double check the name of the database against the Cover Sheet in your batch.
When navigating through the database, use the Tab key to quickly move between fields. All
text entered will appear as uppercase.
Enter the information as best as you can read it on the Flu Vaccination Consent Form.
Enter exactly what is documented on the form.
Do not fill in missing information or write on the forms in any way.
Refer to the codebook for all additional data entry instructions.
If you are in the middle of a batch at the end of your shift:In Room 117, lock the batch in your desk drawer.In Room 127, return the forms to the cabinet or Nirvi Shah in Room 117.
9

Community Health Services / Epidemiology Unit / October 2014 /Page 3 of 3
What to do after a batch is entered
1) Complete the Data Entry Completion Log, including documenting any problems.
2) Email to notify her that data entry is complete.
3) Scan and send a copy of the Data Entry Completion Log to Nirvi and .
4) Return the forms to the cabinet or Nirvi.
9

Community Health Services / Epidemiology Unit / 313 N. Figueroa St. Room 127 / Los Angeles, CA 90012 / September 201
201 201 Flu Campaign Data Entry Completion Log
Outreach Site Name:
Outreach Site Number:
Outreach Date/Date Administered:
Number of People Vaccinated:
Data Entry Staff Name:
Date Forms Received:_____ /_____ /_______
Number of Forms Received:
_____________
Date Forms Returned:_____ /_____ /_______
Number of Forms Entered:
_____________
Name of Person Forms Returned to: __________________________________________
Database Name:
Problems Encountered:
0
9

TableA1.Influen
zaVaccineAccountability
(n=16,905)for20152016Influen
zaOutreaches
byHealthCen
ter,DateAdministered,LotNumber,andDosesGiven
byPatient'sAge
(Prelim
inarydata).1
,2
Health
Center
DateAdministered
LotNumber
DosesGivento
6
monthsto
2
Years
DosesGivento
3
Yearsto
6Years
DosesGivento
7
Yearsto
18Years
DosesGivento
19Yearsto
49
Years
DosesGivento
50Yearsto
64
Years
DosesGivento
65Yearsan
d
Older
Total
AntelopeValley
10/21/2015
157805(NOV)
00
01
00
1
UI450AE(SP)
016
62
55
25
14
172
U5319DA(SP)
71
00
00
8
UI431AE(SP)
00
10
00
1
11/01/2015
UI450AE(SP)
00
14
17
16
653
11/08/2015
157805(NOV)
00
01
01
2
UI450AE(SP)
02
28
41
34
32
137
11/15/2015
157805(NOV)
00
01
11
3
UI450AE(SP)
011
37
62
51
30
191
11/20/2015
157805(NOV)
00
00
31
4
UI450AE(SP)
01
10
14
32
13
70
U5319DA(SP)
20
00
00
2
FL2016(M
I)0
79
20
00
36
12/02/2015
UI450AE(SP)
00
05
12
118
FL2016(M
I)0
00
12
00
12
Central
10/21/2015
157805(NOV)
00
06
00
6
UI450AE(SP)
01
68
44
40
99
10/22/2015
157805(NOV)
01
02
10
4
UI450AE(SP)
03
7117
69
25
221
U5319DA(SP)
20
00
00
2
11/01/2015
157805(NOV)
01
13
00
5
UI450AE(SP)
114
87
204
144
45
495
U5319DA(SP)
30
10
00
4
11/04/2015
157805(NOV)
00
01
10
2
UI450AE(SP)
00
153
47
8109
11/07/2015
UI450AE(SP)
01
16
49
33
34
133
U5319DA(SP)
10
00
00
1
11/08/2015
1515701(NOV)
00
543
25
679
157805(NOV)
00
11
00
2
UI450AE(SP)
012
32
130
126
28
328
U5319DA(SP)
40
00
00
4
11/10/2015
UI450AE(SP)
00
013
23
14
50
11/12/2015
1515701(NOV)
00
027
28
257
11/13/2015
UI450AE(SP)
00
012
81
21
11/25/2015
UI450AE(SP)
01
136
38
884
FL2016(M
I)0
03
20
05
01/08/2016
UI450AE(SP)
00
03
01
4
01/22/2016
UI450AE(SP)
00
09
12
12
02/03/2016
1515701(NOV)
00
219
00
21
158003(NOV)
00
28
00
10
UI450AE(SP)
00
464
50
73
02/12/2016
UI450AE(SP)
00
05
20
7
CommunityHealthServices
/313N.FigueroaSt
Rm
117,LosAngelesCA90012/[email protected]/6.15.16/Page1of8
A11

TableA
.Influen
zaVaccineAccountability
(n=16,905)for20152016Influen
zaOutreaches
byHealthCen
ter,DateAdministered,LotNumber,andDosesGiven
byPatient'sAge
(Prelim
inarydata).1
,2
Health
Center
DateAdministered
LotNumber
DosesGivento
6
monthsto
2
Years
DosesGivento
3
Yearsto
6Years
DosesGivento
7
Yearsto
18Years
DosesGivento
19Yearsto
49
Years
DosesGivento
50Yearsto
64
Years
DosesGivento
65Yearsan
d
Older
Total
Central
02/26/2016
UI450AE(SP)
00
04
40
8
03/11/2016
UI450AE(SP)
00
04
33
10
03/25/2016
1516601(NOV)
00
014
60
20
CurtisTu
cker
10/23/2015
157805(NOV)
00
01
03
4
UI450AE(SP)
01
325
65
69
163
10/24/2015
UI450AE(SP)
00
833
44
40
125
10/26/2015
UI450AE(SP)
00
014
43
63
120
10/28/2015
UI450AE(SP)
00
129
38
66
134
11/02/2015
UI450AE(SP)
00
026
62
64
152
U5319DA(SP)
21
00
00
3
11/04/2015
UI450AE(SP)
00
11
17
10
139
11/10/2015
UI450AD(SP)
00
01
00
1
UI450AE(SP)
01
525
25
662
11/13/2015
UI450AE(SP)
00
011
22
42
75
12/02/2015
UI450AE(SP)
00
316
10
130
12/03/2015
UI450AE(SP)
01
321
25
757
U5319DA(SP)
10
00
00
1
03/05/2016
1515701(NOV)
00
516
74
32
FL2016(M
I)0
04
81
013
Glendale
11/04/2015
UI450AD(SP)
00
010
32
92
134
11/07/2015
157805(NOV)
00
01
00
1
UI450AD(SP)
47
34
74
68
36
223
U5319DA(SP)
10
00
00
1
04/07/2016
157805(NOV)
00
012
41
17
HollywoodWilshire
10/22/2015
157805(NOV)
00
01
20
3
UI450AD(SP)
00
226
102
66
196
UI450AE(SP)
00
00
10
1
U5319DA(SP)
10
00
00
1
10/25/2015
UI450AD(SP)
09
47
122
148
61
387
UI450AE(SP)
00
01
00
1
U5319DA(SP)
20
00
00
2
10/27/2015
UI450AD(SP)
00
114
14
130
11/07/2015
157805(NOV)
00
02
30
5
UI450AD(SP)
08
562
34
15
124
U5319DA(SP)
40
00
00
4
11/15/2015
UI450AD(SP)
012
42
101
86
42
283
U5319DA(SP)
20
00
00
2
12/02/2015
UI450AE(SP)
00
020
13
235
Monrovia
10/22/2015
UI450AE(SP)
00
022
29
45
96
10/24/2015
157805(NOV)
00
01
00
1
UI450AE(SP)
016
71
148
120
31
386
U5319DA(SP)
20
00
00
2
Missing
00
01
00
1
CommunityHealthServices
/313N.FigueroaSt
Rm
117,LosAngelesCA90012/[email protected]/6.15.16/Page2of8
10

TableA
.Influen
zaVaccineAccountability
(n=16,905)for20152016Influen
zaOutreaches
byHealthCen
ter,DateAdministered,LotNumber,andDosesGiven
byPatient'sAge
(Prelim
inarydata).1
,2
Health
Center
DateAdministered
LotNumber
DosesGivento
6
monthsto
2
Years
DosesGivento
3
Yearsto
6Years
DosesGivento
7
Yearsto
18Years
DosesGivento
19Yearsto
49
Years
DosesGivento
50Yearsto
64
Years
DosesGivento
65Yearsan
d
Older
Total
Monrovia
10/26/2015
UI450AE(SP)
00
353
66
58
180
11/12/2015
157805(NOV)
00
02
00
2
UI450AE(SP)
00
315
56
75
149
11/14/2015
UI450AE(SP)
15
19
37
23
691
12/03/2015
157805(NOV)
00
03
10
4
UI450AE(SP)
01
218
24
16
61
U5319DA(SP)
10
00
00
1
01/05/2016
UI450AE(SP)
00
04
31
8
01/11/2016
UI450AE(SP)
00
00
01
1
01/21/2016
UI450AE(SP)
00
01
42
7
01/27/2016
UI450AE(SP)
00
09
21
12
NorthHollywood
10/29/2015
157805(NOV)
00
313
80
24
UI450AE(SP)
014
50
151
75
18
308
U5319DA(SP)
10
00
00
1
UI431AE(SP)
00
10
00
1
11/03/2015
157805(NOV)
00
01
00
1
UI450AD(SP)
07
11
17
31
39
UI450AE(SP)
05
22
36
10
174
11/04/2015
157805(NOV)
00
24
30
9
UI450AD(SP)
00
01
10
2
UI450AE(SP)
00
240
19
15
76
U5319DA(SP)
20
00
00
2
11/07/2015
UI450AD(SP)
418
62
111
52
9256
U5319DA(SP)
40
00
00
4
11/09/2015
UI450AD(SP)
00
027
36
17
80
Pacoim
a10/21/2015
157805(NOV)
00
02
11
4
UI450AD(SP)
010
37
39
37
10
133
U5319DA(SP)
20
00
00
2
10/27/2015
157805(NOV)
00
01
00
1
UI450AD(SP)
321
84
84
29
13
234
U5319DA(SP)
30
00
00
3
10/28/2015
157805(NOV)
01
01
00
2
UI450AD(SP)
315
40
77
19
7161
U5319DA(SP)
30
00
00
3
Missing
01
00
00
1
11/06/2015
1515701(NOV)
011
26
34
37
21
129
157805(NOV)
00
01
10
2
UI450AD(SP)
04
16
14
64
44
11/07/2015
157805(NOV)
01
24
10
8
UI450AD(SP)
02
20
39
32
27
120
11/10/2015
1515701(NOV)
00
021
16
239
157805(NOV)
00
01
00
1
CommunityHealthServices
/313N.FigueroaSt
Rm
117,LosAngelesCA90012/[email protected]/6.15.16/Page3of8
10

TableA
.Influen
zaVaccineAccountability
(n=16,905)for20152016Influen
zaOutreaches
byHealthCen
ter,DateAdministered,LotNumber,andDosesGiven
byPatient'sAge
(Prelim
inarydata).1
,2
Health
Center
DateAdministered
LotNumber
DosesGivento
6
monthsto
2
Years
DosesGivento
3
Yearsto
6Years
DosesGivento
7
Yearsto
18Years
DosesGivento
19Yearsto
49
Years
DosesGivento
50Yearsto
64
Years
DosesGivento
65Yearsan
d
Older
Total
Pacoim
a11/14/2015
1515701(NOV)
03
13
19
13
856
157805(NOV)
01
12
10
5
158003(NOV)
00
10
00
1
UI450AD(SP)
02
63
31
15
UI450AE(SP)
01
32
20
8
U5319DA(SP)
10
00
00
1
12/14/2015
1515701(NOV)
00
04
60
10
157805(NOV)
00
01
00
1
12/16/2015
1515701(NOV)
00
03
30
6
157805(NOV)
00
01
10
2
MartinLutherKing,Jr.
CenterforPublic
Health
10/15/2015
UI450AE(SP)
00
01
00
1
UI431AE(SP)
00
366
64
13
146
FJ2159(M
I)0
13
21
10
26
397A7(GSK)
00
118
13
436
10/16/2015
157805(NOV)
00
015
12
532
U5319DA(SP)
10
00
00
1
UI431AE(SP)
00
116
16
740
FJ2159(M
I)0
23
24
00
29
397A7(GSK)
00
034
25
362
10/17/2015
1515701(NOV)
00
10
00
1
157805(NOV)
00
027
30
562
UI450AD(SP)
01
038
28
370
U5319DA(SP)
30
00
00
3
UI431AE(SP)
00
08
10
220
FJ2159(M
I)0
55
54
10
65
397A7(GSK)
01
862
86
11
168
10/18/2015
157805(NOV)
02
658
36
6108
UI450AD(SP)
00
03
40
7
U5319DA(SP)
11
00
00
2
UI431AE(SP)
00
016
13
130
FJ2159(M
I)0
19
48
10
59
397A7(GSK)
00
00
10
1
10/21/2015
157805(NOV)
00
00
23
5
UI431AE(SP)
00
04
11
55
70
10/22/2015
157805(NOV)
00
11
00
2
U5319DA(SP)
00
01
00
1
UI431AE(SP)
00
115
30
19
Missing
00
01
00
1
10/24/2015
UI450AD(SP)
03
12
51
15
889
CommunityHealthServices
/313N.FigueroaSt
Rm
117,LosAngelesCA90012/[email protected]/6.15.16/Page4of8
10

TableA
.Influen
zaVaccineAccountability
(n=16,905)for20152016Influen
zaOutreaches
byHealthCen
ter,DateAdministered,LotNumber,andDosesGiven
byPatient'sAge
(Prelim
inarydata).1
,2
Health
Center
DateAdministered
LotNumber
DosesGivento
6
monthsto
2
Years
DosesGivento
3
Yearsto
6Years
DosesGivento
7
Yearsto
18Years
DosesGivento
19Yearsto
49
Years
DosesGivento
50Yearsto
64
Years
DosesGivento
65Yearsan
d
Older
Total
MartinLutherKing,Jr.
CenterforPublic
Health
10/25/2015
157805(NOV)
01
15
14
28
13
71
UI450AD(SP)
14
56
122
148
56
387
UI450AE(SP)
00
00
20
2
U5319DA(SP)
20
00
00
2
397A7(GSK)
00
03
10
4
10/27/2015
157805(NOV)
00
00
01
1
UI450AD(SP)
00
03
912
24
10/28/2015
UI450AD(SP)
02
15
20
11
39
10/29/2015
UI450AD(SP)
04
418
92
37
10/30/2015
UI450AD(SP)
02
98
19
01
120
397A7(GSK)
00
10
00
1
10/31/2015
157805(NOV)
00
03
00
3
UI450AD(SP)
06
815
64
39
U5319DA(SP)
20
00
00
2
11/01/2015
UI450AD(SP)
07
27
75
53
32
194
397A7(GSK)
00
00
10
1
11/03/2015
157805(NOV)
00
310
21
16
UI450AD(SP)
10
46
298
34
13
392
11/04/2015
UI450AD(SP)
03
656
43
11
119
U5319DA(SP)
20
00
00
2
397A7(GSK)
00
02
00
2
11/08/2015
157805(NOV)
01
814
72
32
UI450AD(SP)
15
25
41
37
21
130
U5319DA(SP)
40
00
00
4
UI431AE(SP)
00
411
62
23
397A7(GSK)
01
45
12
13
11/12/2015
157805(NOV)
03
16
30
13
UI450AD(SP)
00
145
64
56
11/15/2015
157805(NOV)
03
21
45
40
9118
UI450AD(SP)
02
623
10
647
U5319DA(SP)
10
00
00
1
397A7(GSK)
00
14
11
7
11/21/2015
157805(NOV)
00
37
70
17
158003(NOV)
01
56
20
14
UI450AD(SP)
00
521
30
29
11/29/2015
157805(NOV)
00
01
13
5
158003(NOV)
01
210
410
27
FL2016(M
I)0
11
20
04
12/12/2015
157805(NOV)
02
539
50
51
U5319DA(SP)
20
00
00
2
FL2016(M
I)1
36
00
010
12/16/2015
1515701(NOV)
00
07
80
15
CommunityHealthServices
/313N.FigueroaSt
Rm
117,LosAngelesCA90012/[email protected]/6.15.16/Page5of8
10
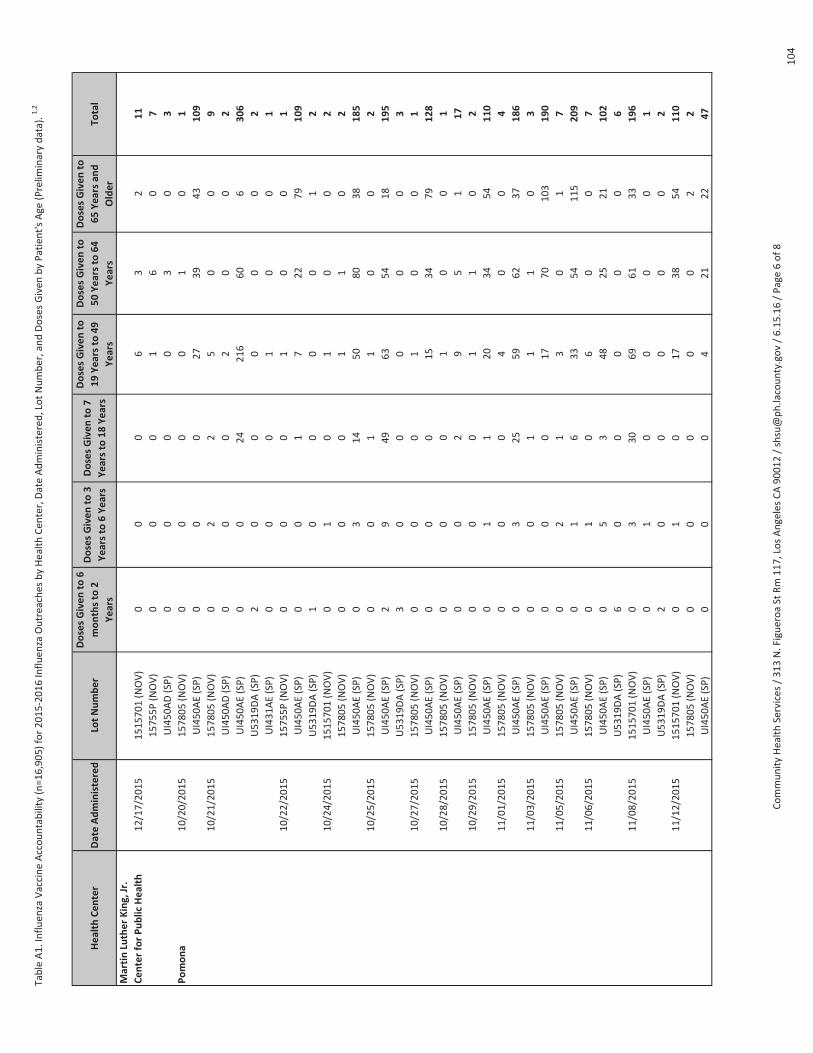
TableA
.Influen
zaVaccineAccountability
(n=16,905)for20152016Influen
zaOutreaches
byHealthCen
ter,DateAdministered,LotNumber,andDosesGiven
byPatient'sAge
(Prelim
inarydata).1
,2
Health
Center
DateAdministered
LotNumber
DosesGivento
6
monthsto
2
Years
DosesGivento
3
Yearsto
6Years
DosesGivento
7
Yearsto
18Years
DosesGivento
19Yearsto
49
Years
DosesGivento
50Yearsto
64
Years
DosesGivento
65Yearsan
d
Older
Total
MartinLutherKing,Jr.
CenterforPublic
Health
12/17/2015
1515701(NOV)
00
06
32
11
15755P(NOV)
00
01
60
7
UI450AD(SP)
00
00
30
3
Pomona
10/20/2015
157805(NOV)
00
00
10
1
UI450AE(SP)
00
027
39
43
109
10/21/2015
157805(NOV)
02
25
00
9
UI450AD(SP)
00
02
00
2
UI450AE(SP)
00
24
216
60
6306
U5319DA(SP)
20
00
00
2
UI431AE(SP)
00
01
00
1
10/22/2015
15755P(NOV)
00
01
00
1
UI450AE(SP)
00
17
22
79
109
U5319DA(SP)
10
00
01
2
10/24/2015
1515701(NOV)
01
01
00
2
157805(NOV)
00
01
10
2
UI450AE(SP)
03
14
50
80
38
185
10/25/2015
157805(NOV)
00
11
00
2
UI450AE(SP)
29
49
63
54
18
195
U5319DA(SP)
30
00
00
3
10/27/2015
157805(NOV)
00
01
00
1
UI450AE(SP)
00
015
34
79
128
10/28/2015
157805(NOV)
00
01
00
1
UI450AE(SP)
00
29
51
17
10/29/2015
157805(NOV)
00
01
10
2
UI450AE(SP)
01
120
34
54
110
11/01/2015
157805(NOV)
00
04
00
4
UI450AE(SP)
03
25
59
62
37
186
11/03/2015
157805(NOV)
00
11
10
3
UI450AE(SP)
00
017
70
103
190
11/05/2015
157805(NOV)
02
13
01
7
UI450AE(SP)
01
633
54
115
209
11/06/2015
157805(NOV)
01
06
00
7
UI450AE(SP)
05
348
25
21
102
U5319DA(SP)
60
00
00
6
11/08/2015
1515701(NOV)
03
30
69
61
33
196
UI450AE(SP)
01
00
00
1
U5319DA(SP)
20
00
00
2
11/12/2015
1515701(NOV)
01
017
38
54
110
157805(NOV)
00
00
02
2
UI450AE(SP)
00
04
21
22
47
CommunityHealthServices
/313N.FigueroaSt
Rm
117,LosAngelesCA90012/[email protected]/6.15.16/Page6of8
10

TableA
.Influen
zaVaccineAccountability
(n=16,905)for20152016Influen
zaOutreaches
byHealthCen
ter,DateAdministered,LotNumber,andDosesGiven
byPatient'sAge
(Prelim
inarydata).1
,2
Health
Center
DateAdministered
LotNumber
DosesGivento
6
monthsto
2
Years
DosesGivento
3
Yearsto
6Years
DosesGivento
7
Yearsto
18Years
DosesGivento
19Yearsto
49
Years
DosesGivento
50Yearsto
64
Years
DosesGivento
65Yearsan
d
Older
Total
Pomona
11/14/2015
1515701(NOV)
03
25
51
30
11
120
157805(NOV)
01
02
10
4
UI450AE(SP)
01
00
00
1
U5319DA(SP)
30
00
00
3
11/15/2015
1515701(NOV)
111
69
133
141
37
392
UI450AE(SP)
03
00
00
3
U5319DA(SP)
50
00
00
5
12/09/2015
1515701(NOV)
00
01
10
2
157805(NOV)
00
05
30
8
12/10/2015
157805(NOV)
00
01
30
4
UI450AE(SP)
00
02
00
2
12/16/2015
157805(NOV)
00
02
60
8
SimmsMan
nBurke
10/22/2015
157805(NOV)
00
021
37
55
113
UI431AE(SP)
01
01
01
3
10/24/2015
157805(NOV)
12
722
42
23
97
10/28/2015
157805(NOV)
00
029
41
69
139
UI450AD(SP)
00
01
40
5
UI450AE(SP)
00
01
00
1
10/29/2015
157805(NOV)
00
032
16
149
11/01/2015
1516501(NOV)
00
02
12
5
157805(NOV)
027
113
219
231
98
688
UI450AD(SP)
17
01
00
9
U5319DA(SP)
70
00
00
7
11/04/2015
157805(NOV)
00
126
14
12
53
11/07/2015
157805(NOV)
02
622
15
247
U5319DA(SP)
10
00
00
1
11/12/2015
157805(NOV)
01
26
31
60
100
12/17/2015
158003(NOV)
00
011
51
17
FL2016(M
I)0
00
10
01
Whittier
10/21/2015
157805(NOV)
00
00
01
1
UI450AE(SP)
01
252
61
95
211
U5319DA(SP)
30
00
00
3
10/24/2015
UI450AE(SP)
04
14
30
37
12
97
10/25/2015
UI450AE(SP)
01
14
50
40
11
116
10/27/2015
UI450AE(SP)
01
35
27
37
73
10/28/2015
157805(NOV)
00
01
00
1
UI450AE(SP)
22
964
83
96
256
U5319DA(SP)
20
00
00
2
UI431AE(SP)
00
00
01
1
11/01/2015
UI450AE(SP)
16
24
49
57
29
166
U5319DA(SP)
10
00
00
1
CommunityHealthServices
/313N.FigueroaSt
Rm
117,LosAngelesCA90012/[email protected]/6.15.16/Page7of8
10

TableA
.Influen
zaVaccineAccountability
(n=16,905)for20152016Influen
zaOutreaches
byHealthCen
ter,DateAdministered,LotNumber,andDosesGiven
byPatient'sAge
(Prelim
inarydata).1
,2
Health
Center
DateAdministered
LotNumber
DosesGivento
6
monthsto
2
Years
DosesGivento
3
Yearsto
6Years
DosesGivento
7
Yearsto
18Years
DosesGivento
19Yearsto
49
Years
DosesGivento
50Yearsto
64
Years
DosesGivento
65Yearsan
d
Older
Total
Whittier
11/03/2015
1516501(NOV)
00
233
63
67
165
U5319DA(SP)
10
00
00
1
11/04/2015
157805(NOV)
00
03
00
3
UI450AE(SP)
12
637
31
582
U5319DA(SP)
11
00
00
2
11/10/2015
UI450AE(SP)
13
15
32
33
892
11/12/2015
1516501(NOV)
01
018
99
37
11/14/2015
1516501(NOV)
02
16
29
10
865
157805(NOV)
00
01
00
1
UI450AE(SP)
01
217
14
11
45
U5319DA(SP)
10
00
00
1
11/15/2015
1516501(NOV)
01
20
44
46
20
131
UI450AE(SP)
00
16
85
20
11/18/2015
1516501(NOV)
00
03
90
12
Total
138
438
1,946
6,106
5,059
3,218
16,905
Total(%)
0.82
312
36
30
19
100
1CompletedDataEntryas
of4/22/2016andprelim
inarydatacleaning6/15/2016(n=16,905).Thetotalenteredshouldbe16,905.Theflulogwillbecorrectedafterdatacleaning.
2Excludes
22recordswithmissingageand1record
withlessthan
sixmonthsofage.
CommunityHealthServices
/313N.FigueroaSt
Rm
117,LosAngelesCA90012/[email protected]/6.15.16/Page8of8
10

TableA
.Influen
zaVaccineAccountability
(n=16,905)for20152016Influen
zaOutreaches
byHealthCen
ter,LotNumber,andDosesGiven
byPatient'sAge
(Prelim
inarydata).1
,2
Health
Center
LotNumber
DosesGivento
6
monthsto
2Years
DosesGivento
3
Yearsto
6Years
DosesGivento
7
Yearsto
18Years
DosesGivento
19
Yearsto
49Years
DosesGivento
50
Yearsto
64Years
DosesGivento
65
Yearsan
dOlder
Total
AntelopeValley
157805(NOV)
00
03
43
10
UI450AE(SP)
030
151
194
170
96
641
U5319DA(SP)
91
00
00
10
UI431AE(SP)
00
10
00
1
FL2016(M
I)0
79
32
00
48
Central
1515701(NOV)
00
789
53
8157
157805(NOV)
02
213
20
19
158003(NOV)
00
28
00
10
UI450AE(SP)
132
154
711
547
209
1,654
U5319DA(SP)
10
01
00
011
FL2016(M
I)0
03
20
05
1516601(NOV)
00
014
60
20
CurtisTu
cker
1515701(NOV)
00
516
74
32
157805(NOV)
00
01
03
4
UI450AD(SP)
00
01
00
1
UI450AE(SP)
03
34
217
344
359
957
U5319DA(SP)
31
00
00
4
FL2016(M
I)0
04
81
013
Glendale
157805(NOV)
00
013
41
18
UI450AD(SP)
47
34
84
100
128
357
U5319DA(SP)
10
00
00
1
HollywoodWilshire
157805(NOV)
00
03
50
8
UI450AD(SP)
029
97
325
384
185
1,020
UI450AE(SP)
00
021
14
237
U5319DA(SP)
90
00
00
9
Monrovia
157805(NOV)
00
06
10
7
UI450AE(SP)
122
98
307
327
236
991
U5319DA(SP)
30
00
00
3
Missing
00
01
00
1
NorthHollywood
157805(NOV)
00
518
11
034
UI450AD(SP)
425
73
156
92
27
377
UI450AE(SP)
019
74
227
104
34
458
U5319DA(SP)
70
00
00
7
UI431AE(SP)
00
10
00
1
Pacoim
a1515701(NOV)
014
39
81
75
31
240
157805(NOV)
03
314
51
26
158003(NOV)
00
10
00
1
UI450AD(SP)
654
203
256
126
62
707
UI450AE(SP)
01
32
20
8
U5319DA(SP)
90
00
00
9
Missing
01
00
00
1
CommunityHealthServices
/313N.FigueroaSt
Rm
117,LosAngelesCA90012/[email protected]/6.15.16/Page1of2
10

TableA
.Influen
zaVaccineAccountability
(n=16,905)for20152016Influen
zaOutreaches
byHealthCen
ter,LotNumber,andDosesGiven
byPatient'sAge
(Prelim
inarydata).1
,2
Health
Center
LotNumber
DosesGivento
6
monthsto
2Years
DosesGivento
3
Yearsto
6Years
DosesGivento
7
Yearsto
18Years
DosesGivento
19
Yearsto
49Years
DosesGivento
50
Yearsto
64Years
DosesGivento
65
Yearsan
dOlder
Total
MartinLutherKing,Jr.C
enterfor
Public
Health
1515701(NOV)
00
113
11
227
157805(NOV)
012
63
240
173
48
536
15755P(NOV)
00
01
60
7
158003(NOV)
02
716
610
41
UI450AD(SP)
339
309
848
409
174
1,782
UI450AE(SP)
00
01
20
3
U5319DA(SP)
18
10
10
020
UI431AE(SP)
00
9136
123
80
348
FJ2159(M
I)0
920
147
30
179
397A7(GSK)
02
15
128
129
21
295
FL2016(M
I)1
47
20
014
Missing
00
01
00
1
Pomona
1515701(NOV)
119
124
272
271
135
822
157805(NOV)
06
534
17
365
15755P(NOV)
00
01
00
1
UI450AD(SP)
00
02
00
2
UI450AE(SP)
227
125
570
560
616
1,900
U5319DA(SP)
22
00
00
123
UI431AE(SP)
00
01
00
1
SimmsMan
nBurke
1516501(NOV)
00
02
12
5
157805(NOV)
132
129
377
427
320
1,286
158003(NOV)
00
011
51
17
UI450AD(SP)
17
02
40
14
UI450AE(SP)
00
01
00
1
U5319DA(SP)
80
00
00
8
UI431AE(SP)
01
01
01
3
FL2016(M
I)0
00
10
01
Whittier
1516501(NOV)
04
38
127
137
104
410
157805(NOV)
00
05
01
6
UI450AE(SP)
521
90
342
391
309
1,158
U5319DA(SP)
91
00
00
10
UI431AE(SP)
00
00
01
1
Total
138
438
1,946
6,106
5,059
3,218
16,905
Total(%)
0.82
312
36
30
19
100
1CompletedDataEntryas
of4/22/2016andprelim
inarydatacleaning6/15/2016(n=16,905).Thetotalenteredshouldbe16,905.Theflulogwillbecorrectedafterdatacleaning.
2Excludes
22recordswithmissingageand1record
withlessthan
sixmonthsofage.
CommunityHealthServices
/313N.FigueroaSt
Rm
117,LosAngelesCA90012/[email protected]/6.15.16/Page2of2
10

TableA3.Influen
zaVaccineAccountability
(n=16,905)for20152016Influen
zaOutreaches
byLotNumber
andDosesGiven
byPatient'sAge
(Prelim
inarydata).1
,2
LotNumber
DosesGivento
6
monthsto
2Years
DosesGivento
3
Yearsto
6Years
DosesGivento
7
Yearsto
18Years
DosesGivento
19
Yearsto
49Years
DosesGivento
50
Yearsto
64Years
DosesGivento
65
Yearsan
dOlder
Total
1515701(NOV)
133
176
471
417
180
1,278
1516501(NOV)
04
38
129
138
106
415
157805(NOV)
155
207
727
649
380
2,019
15755P(NOV)
00
02
60
8
158003(NOV)
02
10
35
11
11
69
UI450AD(SP)
18
161
716
1674
1115
576
4,260
UI450AE(SP)
9155
729
2593
2461
1861
7,808
U5319DA(SP)
108
41
10
1115
UI431AE(SP)
01
11
138
123
82
355
FJ2159(M
I)0
920
147
30
179
397A7(GSK
)0
215
128
129
21
295
FL2016(M
I)1
11
23
45
10
81
1516601(NOV)
00
014
60
20
Missing
01
02
00
3
Total
138
438
1,94
66,
106
5,05
93,
218
16,9
05To
tal(%)
0.82
312
3630
1910
01CompletedDataEntryas
of4/22/2016andprelim
inarydatacleaning6/15/2016(n=16,905).Thetotalenteredshouldbe16,905.Theflulogwillbecorrectedafterdatacleaning.
2Excludes
22recordswithmissingageand1record
withlessthan
sixmonthsofage.
CommunityHealthServices
/313N.FigueroaSt
Rm
117,LosAngelesCA90012/[email protected]/6.15.16/Page1of1
1

TableA
.Frequen
cycountsforinsurance
categories
forTables3,3aand3b,20152016FluOutreach
Cam
paign.(Prelim
inaryData)
Grand
total1
Total
Private
only
Plus
Medicare
&
Medicaid
Plus
Medicare
Plus
Medicaid
Plus
Other
Total
Medicare
only
Medicaid
only
Medicare
&
Medicaid
Medicare
&Other
Medicaid
&Other
Other
only
Unin
sured
Does
not
know
Medicare
1830
84
01
83
10
1746
1575
0153
18
00
00
Medicaid
3833
13
01
112
03820
03665
153
02
00
0
Private
4313
4313
4214
184
13
30
00
00
00
00
Notinsured
5210
00
00
00
5210
00
00
00
5210
0
Donotkn
ow
633
00
00
00
633
00
00
00
0633
Other
341
30
00
03
338
00
018
2318
00
WithPrivate
insurance
Withoutprivate
insurance
1Missingvalues
notshown
2Cellswithoverlap
arehighlightedinred
CommunityHealthServices
/Epidem
iology
Unit/313NFigueroaSt,R
oom
117,LosAngeles,CA90012/[email protected]

/