FLOWERS FOODS ANNUAL REVIEW17/media/Files/F/Flowers-Foods...Business: The second-largest producer...
140
FLOWERS FOODS ANNUAL REVIEW 17 Without a doubt, fiscal 2017 was one of the most transformave years in Flowers Foods’ 99 years of operaon. Through a comprehensive, strategic plan named “Project Centennial,” we took acon to transform Flowers Foods into a lean, consumer-focused food company able to drive profitable growth and top-er shareholder return. With a fresh perspecve, our team set new strategic goals and priories designed to remove complexity and cost from our business and restructure our company to grow our highest-potenal brands. In 2017, adjusted earnings per share was $0.89*, in line with our guidance. Driven by strong growth of Dave’s Killer Bread, we saw our sales increase, excluding the divesture of our Iowa mix business. We also generated strong cash flow during the year that supported dividend per share growth of 7.2%. Addionally, strong cash flow generaon allowed Flowers to reduce debt obligaons by 13.1%, which will further strengthen our ability to drive greater shareholder returns in the future. A fundamental change made in 2017 was replacing our regional business model with a leaner, more efficient, and centralized company structure. This included bringing on new team members with significant consumer packaged goods experience, while reducing our workforce through a voluntary separaon incenve program and other iniaves. Our new structure should be fully in place by early 2019, but we are already seeing benefits. Across the company, we have new teams working together in new ways, more efficiently and effecvely. Ulmately, this will help us win in the marketplace. In manufacturing, we worked to improve producvity and lower producon costs. As a result, we increased efficiencies and decreased waste. We also began the rollout of a connuous improvement program at our bakeries to find more efficient ways to operate, and we closed two less efficient bakeries. On the sales side, we offered new support for our independent distributor partners to help them grow their businesses, and began to expand the distribuon of our fresh products in the Midwest through new retail partnerships. We also simplified what we bring to the market, creang a product assortment that beer defines our brands and focuses on our strongest sellers. At the same me, our brand and markeng teams began developing a mul-year product innovaon pipeline grounded in a deep understanding of emerging consumer trends. These teams are creang revitalized markeng plans to drive the growth of Nature’s Own, Dave’s Killer Bread, Wonder, Tastykake, and other high-potenal brands. These efforts, along with acquision opportunies being explored by our new strategy and ventures team, are focusing on products and companies with clear points of difference and consumer appeal. To further fuel our growth efforts, we implemented spending guidelines and policies to control costs in all areas of our business. I am pleased to report that, in 2017, we realized gross savings associated with these iniaves of approximately $32.0 million. We believe Flowers Foods is well posioned as we execute on our 2018 objecves to accelerate profitable sales growth and drive down costs. For fiscal 2018, we ancipate sales to be flat to up 1.6%, and adjusted earnings per share* (excluding Project Centennial-related costs of approximately $8.0 million to $10.0 million) in the rage of $1.04 to $1.16. We see our top line growth being driven primarily by incremental volumes from Dave’s Killer Bread and by brand growth iniaves that will come to market this year. We expect overall earnings to grow as a result of improved sales, a lower tax rate, and addional Project Centennial gross savings of approximately $38.0 million to $48.0 million. Input cost inflaon of approximately $40.0 million is ancipated to be offset by pricing acons and producvity iniaves. We believe Flowers Foods has significant, long-term, above-category growth potenal. We serve a market valued at more than $30.0 billion where we have opportunity to grow share in underdeveloped product segments, such as dinner rolls and breakfast items. In 2017, we introduced new products in these segments under Dave’s Killer Bread and Nature’s Own and successfully gained share in both. We also are well posioned to grow in geographies where our brands are underpenetrated and in categories adjacent to our product porolio through new product introducons and strategic acquisions. These growth opportunies give us confidence in our long-term goals to achieve topline growth of 2% to 4% per year, realize EBITDA (earnings before interest, taxes, depreciaon, and amorzaon) margins in the range of 13% to 14%, and deliver compounded earnings per share growth of 8% or more by 2021. The acons we took in 2017 will help drive shareholder value over the long term. I want to thank Flowers team members across the company for their hard work and for keeping laser-focused on our goals as we move through 2018. I am incredibly proud of how our team executed the changes that took place in 2017 while connuing to provide our consumers and customers with excellent service and quality products. With the enthusiasm and professionalism of the Flowers team, and the guidance of our board of directors, I am confident we can achieve great things in the future. Thank you for your investment in Flowers Foods. Allen L. Shiver President and CEO * See non-GAAP reconciliaons on the following pages. Fellow shareholders:
Transcript of FLOWERS FOODS ANNUAL REVIEW17/media/Files/F/Flowers-Foods...Business: The second-largest producer...

1
FLOWERS FOODSANNUAL REVIEW17
Without a doubt, fiscal 2017 was one of the most transformative years in Flowers Foods’ 99 years of operation.Through a comprehensive, strategic plan named “Project Centennial,” we took action to transform Flowers Foods into a lean, consumer-focused food company able to drive profitable growth and top-tier shareholder return. With a fresh perspective, our team set new strategic goals and priorities designed to remove complexity and cost from our business and restructure our company to grow our highest-potential brands.In 2017, adjusted earnings per share was $0.89*, in line with our guidance. Driven by strong growth of Dave’s Killer Bread, we saw our sales increase, excluding the divestiture of our Iowa mix business. We also generated strong cash flow during the year that supported dividend per share growth of 7.2%. Additionally, strong cash flow generation allowed Flowers to reduce debt obligations by 13.1%, which will further strengthen our ability to drive greater shareholder returns in the future.A fundamental change made in 2017 was replacing our regional business model with a leaner, more efficient, and centralized company structure. This included bringing on new team members with significant consumer packaged goods experience, while reducing our workforce through a voluntary separation incentive program and other initiatives. Our new structure should be fully in place by early 2019, but we are already seeing benefits. Across the company, we have new teams working together in new ways, more efficiently and effectively. Ultimately, this will help us win in the marketplace. In manufacturing, we worked to improve productivity and lower production costs. As a result, we increased efficiencies and decreased waste. We also began the rollout of a continuous improvement program at our bakeries to find more efficient ways to operate, and we closed two less efficient bakeries. On the sales side, we offered new support for our independent distributor partners to help them grow their businesses, and began to expand the distribution of our fresh products in the Midwest through new retail partnerships.We also simplified what we bring to the market, creating a product assortment that better defines our brands and focuses on our strongest sellers. At the same time, our brand and marketing teams began developing a multi-year product innovation pipeline grounded in a deep understanding of emerging consumer trends. These teams are creating revitalized marketing plans to drive the growth of Nature’s Own, Dave’s Killer Bread, Wonder, Tastykake, and other high-potential brands. These efforts, along with acquisition opportunities being explored by our new strategy and ventures team, are focusing on products and companies with clear points of difference and consumer appeal.To further fuel our growth efforts, we implemented spending guidelines and policies to control costs in all areas of our business. I am pleased
to report that, in 2017, we realized gross savings associated with these initiatives of approximately $32.0 million.We believe Flowers Foods is well positioned as we execute on our 2018 objectives to accelerate profitable sales growth and drive down costs. For fiscal 2018, we anticipate sales to be flat to up 1.6%, and adjusted earnings per share* (excluding Project Centennial-related costs of approximately $8.0 million to $10.0 million) in the rage of $1.04 to $1.16. We see our top line growth being driven primarily by incremental volumes from Dave’s Killer Bread and by brand growth initiatives that will come to market this year. We expect overall earnings to grow as a result of improved sales, a lower tax rate, and additional Project Centennial gross savings of approximately $38.0 million to $48.0 million. Input cost inflation of approximately $40.0 million is anticipated to be offset by pricing actions and productivity initiatives.We believe Flowers Foods has significant, long-term, above-category growth potential. We serve a market valued at more than $30.0 billion where we have opportunity to grow share in underdeveloped product segments, such as dinner rolls and breakfast items. In 2017, we introduced new products in these segments under Dave’s Killer Bread and Nature’s Own and successfully gained share in both. We also are well positioned to grow in geographies where our brands are underpenetrated and in categories adjacent to our product portfolio through new product introductions and strategic acquisitions.These growth opportunities give us confidence in our long-term goals to achieve topline growth of 2% to 4% per year, realize EBITDA (earnings before interest, taxes, depreciation, and amortization) margins in the range of 13% to 14%, and deliver compounded earnings per share growth of 8% or more by 2021.The actions we took in 2017 will help drive shareholder value over the long term. I want to thank Flowers team members across the company for their hard work and for keeping laser-focused on our goals as we move through 2018. I am incredibly proud of how our team executed the changes that took place in 2017 while continuing to provide our consumers and customers with excellent service and quality products. With the enthusiasm and professionalism of the Flowers team, and the guidance of our board of directors, I am confident we can achieve great things in the future.Thank you for your investment in Flowers Foods.
Allen L. Shiver President and CEO
* See non-GAAP reconciliations on the following pages.
Fellow shareholders:

2
OUR VISIONAs America’s premier baker, we craft foods that make people smile. We are driven by a passion to boldly grow our business through inspiring leadership, team-work, and creativity.
OUR VALUESA passion for baking and our commitment to integrity, service, quality and creativity guide all our efforts.
FINANCIAL HIGHLIGHTS (in thousands, except per share data)
For fiscal year 2017 2016 % change
SalesNet incomeAdjusted net income* Net income per diluted common shareAdjusted net income per diluted common share*Cash dividends per common share
*Excluding items affecting comparability. See reconciliations of these non-GAAP financial measures in the following pages.
Business: The second-largest producer and marketer of packaged bakery foods in the U.S.
Bakeries: 47 efficient bakeries in 18 states
Employees: Approximately 9,800
Products: Breads, buns, rolls, snack cakes, tortillas
Top brands: Nature’s Own, Dave’s Killer Bread, Tastykake, Cobblestone Bread Co., Mrs. Freshley’s, and Wonder
Market: Retail and foodservice. Fresh bakery foods to more than 85% of the U.S. population through a network of independent distributors; frozen bakery items and snack cakes to customers’ warehouses nationwide.
INVESTOR FACTS
COMPANY STRENGTHS• Strong brands and a team committed to transforming the company
• Clear objectives to grow sales, expand margins, and deliver shareholder value
• Executing today on initiatives to reinvigorate the core business, obtain fuel for growth, and improve financial performance
• Implementing an operating model to deliver sustainable, long-term growth
OUR MISSIONWe bring smiles with delicious foods and trusted brands.
OUR PRIORITIESFour priorities are the foundation for our business strategy:
Reinvigorate core business Align brands to consumers, invest in brand growth and innovation, support distributor partners
Capitalize on product adjacencies Build leading foodservice position, grow in-store bakery, seek opportunities in healthy snacking
Reduce costs to fuel growth Simplify and streamline operating model, better leverage national footprint
Invest in capabilities and growth Enhance financial planning and analysis capabilities, redesign performance management system
By focusing on these priorities, we intend to grow sales and margins, better manage capital, and deliver long-term value to our shareholders.
Fresh/DSD Frozen/Warehouse
47 BAKERIES & FRESH/FROZEN DISTRIBUTION
$3,926,885$163,776$194,678
$0.78$0.93
$0.625
<0.2>%<8.3>%<3.8>%<9.0>%<4.3>%
7.2%
$3,920,733$150,120$187,220
$0.71$0.89$0.67

3
65% Branded retail
14% Store-
branded retail
21% Restaurant/
institutional/other
39% Foodservice
25% Branded
retail
2% Other
18% Store-
branded retail
13% Vending
3% Contract production
FY 2017 SNAPSHOTDISTRIBUTION
85% Direct store delivery (DSD)
15%Direct to
customers’ warehouses
SALES CHANNELS
31% Mass
merchandiser/discount
5% Convenience store
4% Other2
23% Foodservice
37% Supermarket/drug
17% Fresh snack cakes
7% Frozen breads, rolls
76% Fresh breads, buns, rolls, and tortillas
<1% Mixes1
PRODUCT MIX
1Mix business sold Jan. 2017. 2Thrift stores, vending. All chart data should not be used for historical comparisons since some business has shifted between segments and because of changes in geographic definition. IRI Flowers Custom Database Total MultiOutlet – 52 weeks ending 12/31/17
IRI Flowers Custom Database Total US MultiOutlet – 52 weeks ending 12/31/17. Flowers Private Label Sales SDW. Chart data should not be used for historical comparison because of changes in geographic definition.
BRAND SHARE, TOTAL U.S.Breads, Buns, Rolls
4.2% Flowers store brand
5.8% Pepperidge Farm
BRAND STRENGTH
24.1%Independent/specialty bakers
30.2%BBU/Sara Lee
20.4% Other bakers’store brands
15.4% Flowers branded
CATEGORY STRENGTH | $28.4 billion retail sales* | $7.6 billion foodservice sales**
*IRI Custom Database – 52 weeks ending 12/31/17
**Technomic FY2017
***IRI Database – 52 weeks ending 12/31/17
****Willard Bishop Super Study Feb. 2018 Safeway/Ahold/Weis
• Across the grocery store segment, fresh bread and rolls is the fourth-largest category, in dollars, behind carbonated beverages, beer/ale/alcoholic cider, and salty snacks.***
• Bread is the No. 1 grocery category in weekly true profits.****
• 98.6% of households buy fresh packaged bread.***
America’s best-selling bread. Nature’s Own fresh breads and buns have no artificial preservatives, colors, or flavors and no high fructose corn syrup.
Cobblestone Bread Co. bakes specialty breads and rolls crafted with care, with little extras – like corn dusting, toasted onion, and sesame seeds.
The #1 organic bread brand in the U.S., Dave’s Killer Bread is powerfully different. Packed with protein, fiber, and whole grains with no artificial anything. Non-GMO and certified organic – it will rock your world.
Tastykake – one taste and you’ll know why it’s been a favorite of many for more than 100 years.
Putting a smile on people’s faces for nearly 20 years, Mrs. Freshley’s wide array of sweet treats are available in vending machines, convenience stores, and other retail outlets nationwide.
Hot dog, hamburger, or sandwich, Wonder Bread is the way to go. Instill a little wonder in whatever you’re eating next!
Numbers should not be used for historical comparison because of change in IRI data.
WAREHOUSE DELIVERY — 15% OF SALES
• Fresh snack cakes, frozen breads and rolls• $602.2 million in sales for FY17• National distribution• Direct to customers’ warehouses by frozen
and non-frozen contract carriers1Segment charts should not be used for historical comparisons since some business has been shifted between segments.
DIRECT STORE DELIVERY (DSD) — 85% OF SALES
OPERATING SEGMENTS/DISTRIBUTION
• Fresh breads, buns, rolls, snack cakes, tortillas• $3.3 billion in sales for FY17• Access to more than 85% of U.S. population• Fresh bakery foods delivered daily• Approximately 5,600 territories served by motivated independent
distributor partners. Learn more: flowersfoods.com/IDprogram.
DSD SALES BY CATEGORY1
Approx. % of FY17 salesWAREHOUSE SALES BY CATEGORY1
Approx. % of FY17 sales

4
3-YEAR PERFORMANCE
* See non-GAAP reconciliations
RECONCILIATION OF INCOME TAX EXPENSE (in thousands) For Fiscal Year 2017 2016 2015
Income tax expense (benefit) Tax impact of:
Asset impairments Pension settlement loss Legal settlement Manufacturing facility closure costs Acquisition-related costs Loss on extinguishment of debt Gain on divestiture Restructuring and related impairment charges Project Centennial consulting costs Lease terminations Multi-employer pension plan withdrawal costs Impact of tax reform Windfall tax benefit from stock option exercises
Adjusted income tax expense
SALES (in millions)
NET INCOME (in millions)
ADJUSTED NET INCOME * (in millions)
ADJUSTED EBITDA * (in millions)
MARKET CAPITALIZATION AT YEAR-END (in billions)
$4.0652017
2016
2015
$4.162
$4.562
$3,921
$3,927
$3,779
2017
2016
2015
$187
$195
$197
2017
2016
2015
2017
2016
2015
$150
$164
$189
$450
$453
$441
2017
2016
2015
COMPONENTS OF ADJUSTED EBITDA*
1 Includes direct labor & indirect manufacturing expenses2 Includes selling & administrative expenses
22.7%Shipping +
distribution
11.5%Adjusted
EBITDA28.7%
Ingredients + packaging
14.6%All Other 2
22.5%Conversion 1
% of FY17 Sales
RECONCILIATION OF NET INCOME TO ADJUSTED NET INCOME(in thousands) For Fiscal Year 2017 2016 2015
Net incomeAsset impairments/(gain on divestiture)Manufacturing facility closure costsPension settlement lossAcquisition-related costsLegal settlementLoss on extinguishment of debtLease terminationsProject Centennial closing costsRestructuring and related impairment chargesMulti-employer pension plan withdrawal costsEffect of tax reformWindfall tax benefit from stock option exercises
Adjusted net income
RECONCILIATION OF NET INCOME TO ADJUSTED EBITDA AND ADJUSTED EBITDA MARGIN(in thousands) For Fiscal Year 2017 2016 2015
Net incomeIncome tax expense (benefit)Interest expense, netDepreciation and amortizationManufacturing facility closure costsAsset impairments/(gain on divestiture)Acquisition-related costsPension settlement lossLegal settlementsRestructuring and related impairment chargesProject Centennial consulting costsMulti-employer pension plan withdrawal costsLease terminations
Adjusted EBITDA
$189,191$2,438
$473—
$4,608————————
$196,710
$163,776$15,299
—$4,087
—$6,458$1,168
—$3,890
————
$194,678
$150,120($17,758)
—$2,859
—$3,676
—$347
$22,943$64,040$11,235
($48,160)($2,082)
$187,220
$189,191$103,840
$4,848$132,175
$736$3,771$6,187
——————
$440,748
$163,776$85,761$14,353
$140,869—
$24,877—
$6,646$10,500
—$6,324
——
$453,106
$150,120($827)
$13,619$146,719
—($28,875)
—$4,649$5,978
$104,130$37,306$18,268($1,279)
$449,808
$103,840
$1,333 ——
$263$1,579
————————
$107,015
$85,761
$9,578$2,559$4,042
——
$732——
$2,434————
$105,106
($827)
—$1,790$2,302
———
($11,117)$40,090$14,363
$218$7,033
$48,160$2,082
$104,094

5
DIVIDENDS PER SHARE 2003 - 2017
$0.70
$0.60
$0.50
$0.40
$0.30
$0.20
$0.10
2003 2004 2005 2006 2007 2008 2009 2010 2011 2012 2013 2014 2015 2016 2017
SUSTAINABLE EFFORTSSustainability makes our company stronger, increasing profitability and enhancing shareholder value over the long term. Flowers is committed to applying sustainability principles to all aspects of our business. Working with team members, business partners, suppliers, and customers, we strive to prevent waste of water, packaging, energy, and other natural resources.
Ongoing initiatives include: Reducing energy consumption and manufacturing greenhouse gas (GHG) emissions to mitigate climate change, conserving water to limit the impact on the communities where we operate, recycling and reducing waste whenever possible, working with suppliers to provide sustainable packaging, and reducing the overall carbon footprint of our products.
Highlights during the year:
• We participated in the CDP Water, Supply Chain, and Forest Programs.
• Nine bakeries converted to LED lighting, significantly lowering electricity consumption and costs.
• We conducted air leak audits at 30 bakeries and achieved a 47% reduction in air leaks.
• We launched a company-wide program to reuse wooden pallets across all bakeries.
Review our sustainability reports at flowersfoods.com.
COMMUNITY COMMITMENTWe strive to be a good neighbor in the communities where our team members live and where we operate bakeries. This means providing competitive jobs and advancement opportunities that help support those communities. It also means giving back through charitable donations and volunteerism. We focus our efforts on three areas:
IMPROVING THE LIVES OF CHILDREN Through monetary donations and volunteer efforts by team members, Flowers Foods and its subsidiaries support a variety of charities and organizations dedicated to improving the lives of children.
FEEDING THE HUNGRY Our bakeries donate bread and other bakery foods to Feeding America, and we also support independent local food banks, soup kitchens, and groups that provide meals and food to the needy. In 2017, we donated a total of $14.0 million in bakery foods toward this effort.* Flowers Foods is a Feeding America Leadership Partner.
RECRUITING U.S. MILITARY VETERANS When we hire veterans, we honor them—and all veterans—for their service to our country. We currently have more than 800 U.S. veterans** as active employees.
*Total value of product donations in wholesale dollars **A veteran is any individual who has served honorably on active duty in the Armed Forces of the United States.

6
SHAREHOLDER INFORMATIONANNUAL SHAREHOLDERS MEETING Flowers Foods’ Annual Shareholders Meeting will be held at 11:00 a.m. EDST on Thursday, May 24, 2018, at the Thomasville Municipal Auditorium in Thomasville, Ga. Pre-registration will be posted on flowersfoods.com.
FINANCIAL DOCUMENTS & WEBCASTS Investors can find financial documents, notices of events, and archived webcasts on flowersfoods.com. To receive a printed copy of Flowers Foods’ 2017 Form 10-K filed with the Securities and Exchange Commission, please contact Shareholder Relations.
SHAREHOLDER SERVICES As the transfer agent for Flowers Foods, Computershare offers direct registration of securities, dividend reinvestment, direct stock purchase, ACH deposit of dividends, stock certificate replacement, address changes, and assistance with stock transfers. Call Computershare toll free at 800.568.3476; write to Computershare at P.O. Box 505005, Louisville, KY 40233-5005; or register your shareholder account for on-line access by entering a login and password on their secure site at https://www-us.computershare.com/investor.
INVESTOR RELATIONS J. T. RieckVice President, IR & [email protected]
CORPORATE OFFICE1919 Flowers CircleThomasville, GA 31757229.226.9110flowersfoods.com
SHAREHOLDER RELATIONSLisa HayManager, Shareholder [email protected]
MEDIA Paul BaltzerVice President, Communications [email protected]
For Fiscal Year 2017 2016
Net income per diluted common shareAsset impairment (unrelated to restructuring) and facility closing costsPension settlement Legal settlements/lease terminations/extinguishment lossProject Centennial consulting costsGain on divestitureRestructuring and related impairment chargesMulti-employer pension plan withdrawal costsImpact of tax reformWindfall tax benefit from stock option exercises
Adjusted net income per diluted common share
(Certain amounts may not compute due to rounding)
RECONCILIATION OF EARNINGS PER SHARE – FULL YEAR FY 2018 GUIDANCE
Range Estimate
Net income per diluted common share $1.00 to $1.11Costs associated with Project Centennial $0.04 to $0.05 Adjusted net income per diluted common share $1.04 to $1.16
RECONCILIATION OF NET INCOME PER DILUTED COMMON SHARE TO ADJUSTED NET INCOME PER DILUTED COMMON SHARE
$0.78$0.07$0.02$0.04$0.02
—————
$0.93
$0.71—
$0.01$0.02$0.11
($0.09)$0.30$0.05
($0.23)($0.01)
$0.89

UNITED STATESSECURITIES AND EXCHANGE COMMISSION
Washington, D.C. 20549
FORM 10-K
(Mark One)☒☒ ANNUAL REPORT PURSUANT TO SECTION 13 OR 15(d) OF THE SECURITIES EXCHANGE ACT OF 1934
For the fiscal year ended December 30, 2017OR
☐☐ TRANSITION REPORT PURSUANT TO SECTION 13 OR 15(d) OF THE SECURITIES EXCHANGE ACT OF 1934For the transition period from to
Commission file number 1-16247
FLOWERS FOODS, INC.(Exact name of registrant as specified in its charter)
Georgia 58-2582379(State or other jurisdiction of
incorporation or organization)(IRS Employer
Identification No.)
1919 Flowers CircleThomasville, Georgia 31757
(Address of principal executive offices) (Zip Code)
Registrant’s telephone number, including area code:(229) 226-9110
Securities registered pursuant to Section 12(b) of the Act:
Title of Each Class
Name of Each Exchange
on Which Registered Common Stock, $0.01 par value New York Stock Exchange
Securities registered pursuant to Section 12(g) of the Act:None
Indicate by check mark if the registrant is a well-known seasoned issuer, as defined in Rule 405 of the Securities Act. Yes ☒ No ☐Indicate by check mark if the registrant is not required to file reports pursuant to Section 13 or Section 15(d) of the Act. Yes ☐ No ☒Indicate by check mark whether the registrant (1) has filed all reports required to be filed by Section 13 or 15(d) of the Securities Exchange Act of 1934 during the preceding 12 months (or for such
shorter period that the registrant was required to file such reports), and (2) has been subject to such filing requirements for the past 90 days. Yes ☒ No ☐Indicate by check mark whether the registrant has submitted electronically and posted on its corporate Web site, if any, every Interactive Data File required to be submitted and posted pursuant to
Rule 405 of Regulation S-T (§ 232.405 of this chapter) during the preceding 12 months (or for such shorter period that the registrant was required to submit and post such files). Yes ☒ No ☐Indicate by check mark if disclosure of delinquent filers pursuant to Item 405 of Regulation S-K (§ 232.405 of this chapter) is not contained herein, and will not be contained, to the best of registrant’s
knowledge, in definitive proxy or information statements incorporated by reference in Part III of this Form 10-K or any amendment to this Form 10-K. ☐Indicate by check mark whether the registrant is a large accelerated filer, an accelerated filer, a non-accelerated filer, smaller reporting company, or an emerging growth company. See the definitions of
“large accelerated filer,” “accelerated filer,” “smaller reporting company,” and “emerging growth company” in Rule 12b-2 of the Exchange Act.Large accelerated filer ☒ Accelerated filer ☐
Non-accelerated filer ☐ (Do not check if a smaller reporting company) Smaller reporting company ☐
Emerging growth company ☐
If an emerging growth company, indicate by check mark if the registrant has elected not to use the extended transition period for complying with any new or revised financial accounting standardsprovided pursuant to Section 13(a) of the Exchange Act. ☐
Indicate by check mark whether the registrant is a shell company (as defined in Rule 12b-2 of the Exchange Act). Yes ☐ No ☒Based on the closing sales price on the New York Stock Exchange on July 15, 2017 the aggregate market value of the voting and non-voting common stock held by non-affiliates of the registrant was
$3,472,632,171.On February 15, 2018, the number of shares outstanding of the registrant’s Common Stock, $0.01 par value, was 210,609,122.
DOCUMENTS INCORPORATED BY REFERENCEPortions of the registrant’s Proxy Statement for the 2018 Annual Meeting of Shareholders to be held May 24, 2018, which is expected to be filed with the Securities and Exchange Commission on or
about April 2, 2018, have been incorporated by reference into Part III, Items 10, 11, 12, 13 and 14 of this Annual Report on Form 10-K.

FORM 10-K REPORT
TABLE OF CONTENTS Page PART I
Item 1. Business 4Item 1A. Risk Factors 13Item 1B. Unresolved Staff Comments 19Item 2. Properties 19Item 3. Legal Proceedings 20Item 4. Mine Safety Disclosures 20
PART II
Item 5. Market for the Registrant’s Common Equity, Related Stockholder Matters and Issuer Purchases of Equity Securities 20Item 6. Selected Financial Data 23Item 7. Management’s Discussion and Analysis of Financial Condition and Results of Operations 24Item 7A. Quantitative and Qualitative Disclosures About Market Risk 50Item 8. Financial Statements and Supplementary Data 50Item 9. Changes in and Disagreements with Accountants on Accounting and Financial Disclosure 50Item 9A. Controls and Procedures 51Item 9B. Other Information 51
PART III
Item 10. Directors, Executive Officers and Corporate Governance 52Item 11. Executive Compensation 52Item 12. Security Ownership of Certain Beneficial Owners and Management and Related Stockholder Matters 52Item 13. Certain Relationships and Related Transactions, and Director Independence 52Item 14. Principal Accounting Fees and Services 52
PART IV
Item 15. Exhibits and Financial Statement Schedules 53Item 16. Form 10-K Summary 57
Signatures 58
1
Forward-Looking Statements
Statements contained in this filing and certain other written or oral statements made from time to time by Flowers Foods, Inc. (the “company”, “FlowersFoods”, “Flowers”, “us”, “we”, or “our”) and its representatives that are not historical facts are forward-looking statements as defined in the Private SecuritiesLitigation Reform Act of 1995. Forward-looking statements relate to current expectations regarding our future financial condition and results of operations and areoften identified by the use of words and phrases such as “anticipate,” “believe,” “continue,” “could,” “estimate,” “expect,” “intend,” “may,” “plan,” “predict,”“project,” “should,” “will,” “would,” “is likely to,” “is expected to” or “will continue,” or the negative of these terms or other comparable terminology. Theseforward-looking statements are based upon assumptions we believe are reasonable.
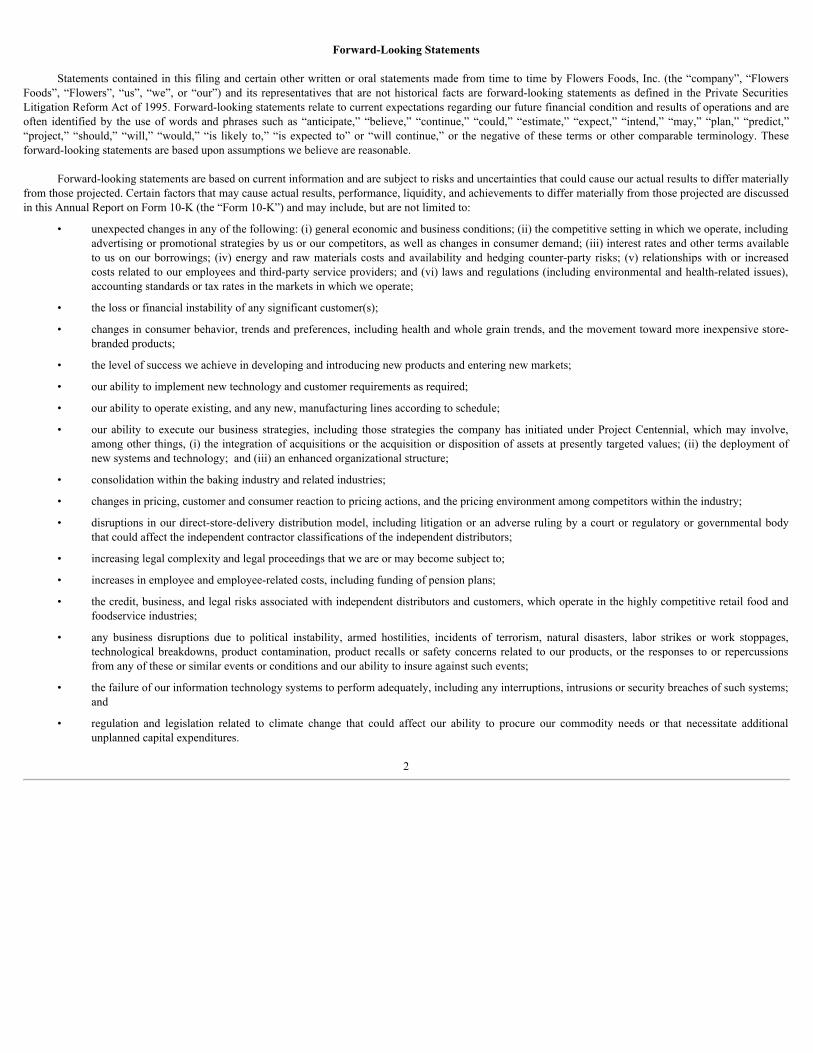
Forward-looking statements are based on current information and are subject to risks and uncertainties that could cause our actual results to differ materiallyfrom those projected. Certain factors that may cause actual results, performance, liquidity, and achievements to differ materially from those projected are discussedin this Annual Report on Form 10-K (the “Form 10-K”) and may include, but are not limited to:
• unexpected changes in any of the following: (i) general economic and business conditions; (ii) the competitive setting in which we operate, includingadvertising or promotional strategies by us or our competitors, as well as changes in consumer demand; (iii) interest rates and other terms availableto us on our borrowings; (iv) energy and raw materials costs and availability and hedging counter-party risks; (v) relationships with or increasedcosts related to our employees and third-party service providers; and (vi) laws and regulations (including environmental and health-related issues),accounting standards or tax rates in the markets in which we operate;
• the loss or financial instability of any significant customer(s);
• changes in consumer behavior, trends and preferences, including health and whole grain trends, and the movement toward more inexpensive store-branded products;
• the level of success we achieve in developing and introducing new products and entering new markets;
• our ability to implement new technology and customer requirements as required;
• our ability to operate existing, and any new, manufacturing lines according to schedule;
• our ability to execute our business strategies, including those strategies the company has initiated under Project Centennial, which may involve,among other things, (i) the integration of acquisitions or the acquisition or disposition of assets at presently targeted values; (ii) the deployment ofnew systems and technology; and (iii) an enhanced organizational structure;
• consolidation within the baking industry and related industries;
• changes in pricing, customer and consumer reaction to pricing actions, and the pricing environment among competitors within the industry;
• disruptions in our direct-store-delivery distribution model, including litigation or an adverse ruling by a court or regulatory or governmental bodythat could affect the independent contractor classifications of the independent distributors;
• increasing legal complexity and legal proceedings that we are or may become subject to;
• increases in employee and employee-related costs, including funding of pension plans;
• the credit, business, and legal risks associated with independent distributors and customers, which operate in the highly competitive retail food andfoodservice industries;
• any business disruptions due to political instability, armed hostilities, incidents of terrorism, natural disasters, labor strikes or work stoppages,technological breakdowns, product contamination, product recalls or safety concerns related to our products, or the responses to or repercussionsfrom any of these or similar events or conditions and our ability to insure against such events;
• the failure of our information technology systems to perform adequately, including any interruptions, intrusions or security breaches of such systems;and
• regulation and legislation related to climate change that could affect our ability to procure our commodity needs or that necessitate additionalunplanned capital expenditures.
2

The foregoing list of important factors does not include all such factors, nor necessarily present them in order of importance. In addition, you should consultother disclosures made by the company (such as in our other filings with the Securities and Exch ange Commission (“SEC”) or in company press releases) for otherfactors that may cause actual results to differ materially from those projected by the company. Refer to Part I, Item 1A., Risk Factors , of this Form 10-K foradditional information regarding factors that could affect the company’s results of operations, financial condition and liquidity.
We caution you not to place undue reliance on forward-looking statements, as they speak only as of the date made and are inherently uncertain. Thecompany undertakes no obligation to publicly revise or update such statements, except as required by law. You are advised, however, to consult any further publicdisclosures by the company (such as in our filings with the SEC or in company press releases) on related subjects.
We own or have rights to trademarks or trade names that we use in connection with the operation of our business, including our corporate names, logos andwebsite names. In addition, we own or have the rights to copyrights, trade secrets and other proprietary rights that protect the content of our products and theformulations for such products. Solely for convenience, some of the trademarks, trade names and copyrights referred to in this Form 10-K are listed without the © ,® and ™ symbols, but we will assert, to the fullest extent under applicable law, our rights to our trademarks, trade names and copyrights.
3

PART I
Item 1. Business
The Company
Flowers Foods, Inc. (references to “we,” “our,” “us,” the “company,” “Flowers” or “Flowers Foods” ) was founded in 1919 as a Georgia corporation whentwo brothers — William Howard and Joseph Hampton Flowers — opened Flowers Baking Company in Thomasville, Georgia. Flowers’ operating strategy from thebeginning was to invest in efficient and technologically advanced bakeries, offer excellent baked foods, build strong brands, provide extraordinary service tocustomers, offer a workplace that fosters a team spirit, develop innovations to improve the business, and grow through strategic acquisitions.
Flowers is focused on opportunities for growth within the baked foods category and seeks to have its products available wherever bakery foods are sold orconsumed — whether in homes, supermarkets, convenience stores, restaurants, fast food outlets, institutions, or vending machines. The company produces a widerange of breads, buns, rolls, snack cakes, and tortillas.
Project Centennial
In June 2016, the company launched Project Centennial, an enterprise-wide business and operational review to evaluate opportunities to streamline ouroperations, drive efficiencies, and invest in strategic capabilities that we believe will strengthen our competitive position and drive profitable revenue growth.Based upon the results of this review, Flowers has begun executing on four primary strategic initiatives:
• reinvigorate the core business – invest in the growth and innovation of our core brands, streamline our brand and product portfolio, improve tradepromotion management, and strengthen our partnership with distributors so they can grow their businesses;
• capitalize on product adjacencies – greater focus on growing segments of the bakery category, such as foodservice, in-store bakery, impulse items,and healthy snacking;
• reduce costs to fuel growth – reduce complexity and better leverage scale to lower costs; and
• develop leading capabilities – invest in capabilities to become a more centralized and analytics-focused company.
The company implemented a plan to transition to these primary strategies beginning in fiscal 2017, with the transition intended to be completed by fiscal2021. By executing on Project Centennial, the company expects to deliver on its stated long-term goals of sales growth in the range of 2% to 4% and EBITDAmargins in the range of 12% to 14%. The company defines EBITDA as earnings from continuing operations before interest, income taxes, depreciation andamortization.
Flowers' priorities for fiscal 2018 are to simplify and streamline our brand assortment, provide additional tools to distributors to enable them to grow theirbusinesses, reduce costs of purchased goods and services, and put in place a more efficient operating model for a national branded food company.
In fiscal 2019 and beyond, Flowers expects to fully realize the benefits of a lower-cost operating model, stronger brand architecture, and increased strategicinvestments. These benefits are expected to drive sales growth in the range of 3% to 4% and EBITDA margins in the range of 13% to 14%.
As of the end of fiscal 2017, the company made progress in key Project Centennial initiatives, including the following accomplishments:
• completed initial survey across consumer preferences in 2016, with an additional survey performed in June 2017 to understand shopping habits andingredient preferences, brand positioning, packing and innovation concepts, and conjoint analysis of product attributes and pricing;
• began executing on strategies to reinvigorate core brands with strong consumer appeal through marketing investments and innovation;
• formulated a strategy and began to identify specific opportunities to diversify our brand portfolio into attractive adjacent categories;
• streamlined our brand assortment in key retail categories;
4

• developed a specific set of strategies to enhance our relationships with our dist ributor partners and reduce stales, which we began to take action inthe first quarter of 2018;
• utilized a third-party distribution platform to expand distribution of products in the Midwest and Northeast;
• completed continuous improvement pilot programs at eight bakeries that validated opportunities for efficiency savings across our manufacturingnetwork, which we will continue to roll out in fiscal 2018;
• made continued progress toward reaching the company’s 2018 gross run-rate savings goal of $70-$80 million, relative to fiscal 2016, including thereduction in purchased goods and services spend by at least $45 million;
• closed a Warehouse Segment snack cake plant in Winston-Salem, North Carolina and shifted production to other existing facilities;
• began to analyze data and formulate plans to further optimize the company’s existing manufacturing and logistics network;
• completed a voluntary separation incentive plan and other workforce reductions and began transitioning to the company’s new organizationalstructure, as more fully discussed below; and
• hired a Chief Marketing Officer.
In the second quarter of fiscal 2017, the company announced an enhanced organizational structure designed to emphasize brand growth and innovation inline with a national branded food company, drive enhanced accountability, reduce costs, strengthen long-term strategy and provide greater focus on the strategicinitiatives under Project Centennial. The company made substantial progress transitioning to the new structure over the third and fourth quarters of fiscal 2017 andcontinues to target full implementation to be completed early in fiscal 2019. Prior to that time, the company will continue to manage the business and reportsegment information based on our current segments, the DSD Segment and the Warehouse Segment.
The new organizational structure establishes two business units (“BU”), Fresh Packaged Bread and Snacking/Specialty, and realigns key leadership roles.The new structure also provides for centralized marketing, sales, supply chain, shared-services/administrative, and corporate strategy functions. We continue toexplore additional opportunities to streamline our core operations. Although we anticipate consulting fees in fiscal 2018 of approximately $8.0 million to $10.0million, we cannot estimate the non-consulting costs expected to be incurred related to these initiatives.
Segments
We currently manage our business by product delivery method. Our two operating segments reflect our two distinct methods of delivering products to themarket:
Direct-Store-Delivery Segment (the “DSD Segment”)
• Produces fresh breads, buns, rolls, tortillas and snack cakes sold primarily by a network of independent distributors to retail and foodservicecustomers in the following areas of the U.S.: East, South, Southwest, West Coast, and select markets in the Midwest, Nevada, and Colorado.
• Has a 39-bakery network with a highly developed reciprocal baking system (where bakeries can produce for its market and that of other bakerieswithin the direct-store-delivery (“DSD” network), which results in long and efficient production runs.
• Major DSD Segment brands include Nature’s Own, Wonder, Cobblestone Bread Company, Tastykake and Dave’s Killer Bread .
Warehouse Delivery Segment (the “Warehouse Segment”)
• Produces fresh snack cakes and frozen breads and rolls.
• Delivers its products fresh or frozen to customers’ warehouses nationwide via contract carriers.
• Major brands include Mrs. Freshley’s, Alpine Valley Bread, and European Bakers.
5
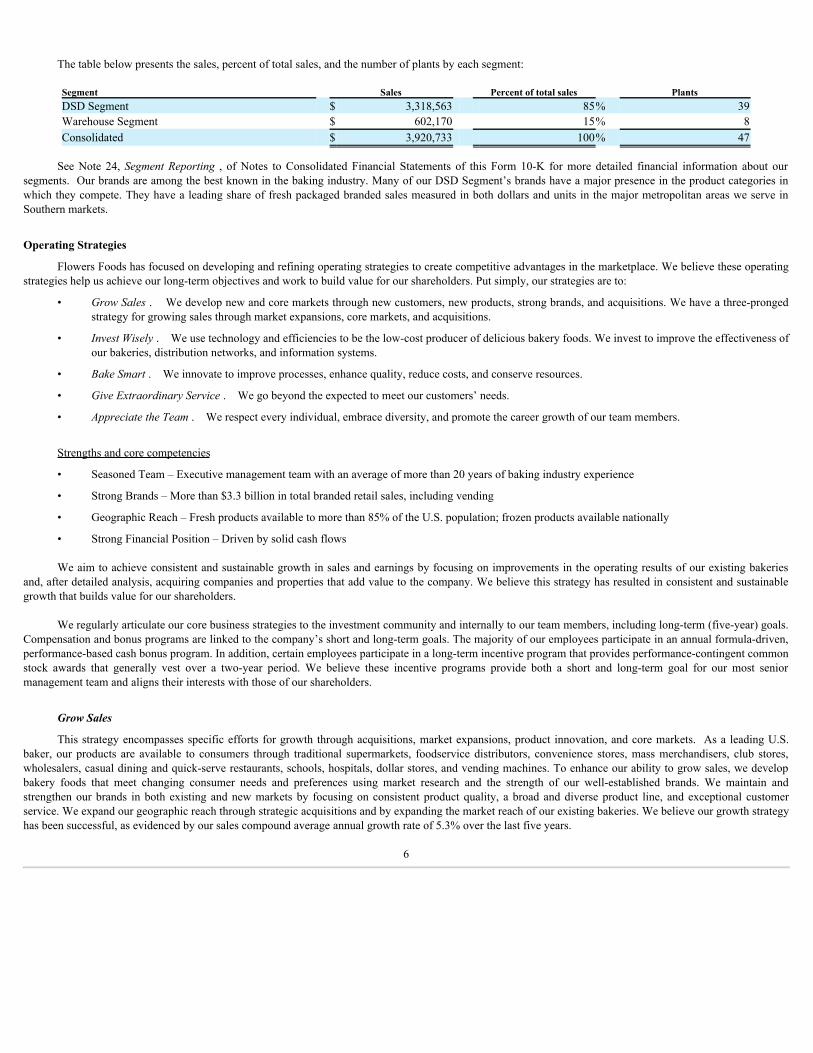
The table below presents the sales, percent of total sales, and the number of plants by each segment:
Segment Sales Percent of total sales PlantsDSD Segment $ 3,318,563 85% 39Warehouse Segment $ 602,170 15% 8Consolidated $ 3,920,733 100% 47
See Note 24, Segment Reporting , of Notes to Consolidated Financial Statements of this Form 10-K for more detailed financial information about oursegments. Our brands are among the best known in the baking industry. Many of our DSD Segment’s brands have a major presence in the product categories inwhich they compete. They have a leading share of fresh packaged branded sales measured in both dollars and units in the major metropolitan areas we serve inSouthern markets.
Operating Strategies
Flowers Foods has focused on developing and refining operating strategies to create competitive advantages in the marketplace. We believe these operatingstrategies help us achieve our long-term objectives and work to build value for our shareholders. Put simply, our strategies are to:
• Grow Sales . We develop new and core markets through new customers, new products, strong brands, and acquisitions. We have a three-prongedstrategy for growing sales through market expansions, core markets, and acquisitions.
• Invest Wisely . We use technology and efficiencies to be the low-cost producer of delicious bakery foods. We invest to improve the effectiveness ofour bakeries, distribution networks, and information systems.
• Bake Smart . We innovate to improve processes, enhance quality, reduce costs, and conserve resources.
• Give Extraordinary Service . We go beyond the expected to meet our customers’ needs.
• Appreciate the Team . We respect every individual, embrace diversity, and promote the career growth of our team members.
Strengths and core competencies
• Seasoned Team – Executive management team with an average of more than 20 years of baking industry experience
• Strong Brands – More than $3.3 billion in total branded retail sales, including vending
• Geographic Reach – Fresh products available to more than 85% of the U.S. population; frozen products available nationally
• Strong Financial Position – Driven by solid cash flows
We aim to achieve consistent and sustainable growth in sales and earnings by focusing on improvements in the operating results of our existing bakeriesand, after detailed analysis, acquiring companies and properties that add value to the company. We believe this strategy has resulted in consistent and sustainablegrowth that builds value for our shareholders.
We regularly articulate our core business strategies to the investment community and internally to our team members, including long-term (five-year) goals.Compensation and bonus programs are linked to the company’s short and long-term goals. The majority of our employees participate in an annual formula-driven,performance-based cash bonus program. In addition, certain employees participate in a long-term incentive program that provides performance-contingent commonstock awards that generally vest over a two-year period. We believe these incentive programs provide both a short and long-term goal for our most seniormanagement team and aligns their interests with those of our shareholders.
Grow Sales
This strategy encompasses specific efforts for growth through acquisitions, market expansions, product innovation, and core markets. As a leading U.S.baker, our products are available to consumers through traditional supermarkets, foodservice distributors, convenience stores, mass merchandisers, club stores,wholesalers, casual dining and quick-serve restaurants, schools, hospitals, dollar stores, and vending machines. To enhance our ability to grow sales, we developbakery foods that meet changing consumer needs and preferences using market research and the strength of our well-established brands. We maintain andstrengthen our brands in both existing and new markets by focusing on consistent product quality, a broad and diverse product line, and exceptional customerservice. We expand our geographic reach through strategic acquisitions and by expanding the market reach of our existing bakeries. We believe our growth strategyhas been successful, as evidenced by our sales compound average annual growth rate of 5.3% over the last five years.
6

Acquisitions
Acquisitions have been an important component of our growth strategy. Since our initial public offering in 1968, we have made more than 100 acquisitions.Since 2003, we have completed 16 acquisitions that, in the aggregate, added approximately $2.0 billion in annual revenue. Our primary acquisition targets havehistorically been independent/regional baking companies in areas of the country where our fresh products have not had access to those markets. See Note 10,Acquisitions , of Notes to Consolidated Financial Statements of this Form 10-K for more details of each of the acquisitions described below.
Dave’s Killer Bread acquisition (2015)
On September 12, 2015, the company completed the acquisition of Dave’s Killer Bread (“DKB”), the nation’s best-selling organic bread. The DKBacquisition not only gave us the top organic bread brand in the country, it also gave our DSD Segment access to the Pacific Northwest market.
Alpine Valley Bread acquisition (2015)
On October 13, 2015, the company completed the acquisition of Alpine Valley Bread Company (“Alpine”), a family-owned producer of certified organicand all natural breads in the U.S. The acquisition expanded our penetration into the fast growing organic market and provided additional organic productioncapacity.
Core Markets
Core markets are those served by our DSD Segment for more than five years. These are markets where our brands are established. Our primary growthstrategy for core markets is product innovation. We strive to develop innovative, new products for both retail and foodservice customers that will drive excitementand consumers to our brands and products. In addition, in conjunction with the independent distributors, we focus on continually building relationships with bothnew and potential retail and foodservice customers, which helps grow sales.
Expansion Markets
Expansion markets are defined as new DSD Segment markets entered within the last five fiscal years. In 2011, we announced a DSD market expansion goalto serve a geographical area reaching at least 75% of the U.S. population by 2016. At the end of fiscal 2016, we had exceeded that goal and currently serve morethan 85% of the U.S. population.
Our market expansion efforts are driven by our bakery subsidiaries. They accomplish this by reaching out to new and existing retail and foodservicecustomers in the new territory and expanding the DSD model by creating new territories and new independent distributor partnerships.
Invest Wisely and Bake Smart
Throughout our history, we have devoted significant resources to automate our bakeries and improve our distribution capabilities. We believe theseinvestments have made us one of the most efficient, low-cost producers of packaged bakery products in the United States. We believe our capital investments yieldvaluable long-term benefits, such as more consistent product quality and greater production volume at a lower cost per unit.
From 2013 through 2017, we invested $450.7 million in capital projects. We believe our annual capital investments have given us a competitive edge andwe are committed to maintaining that advantage by investing in new technologies and improved processes.
We have established a reciprocal baking system that allows us to shift production among our DSD Segment bakeries. Because of this system, we have theflexibility to meet changing market needs, can respond effectively to hurricanes and other wide-spread natural disasters, and be a low-cost producer and marketer ofa full line of bakery products both regionally and nationally. For efficient movement of products from bakery to market, we use company-owned and leasedwarehouses and distribution centers.
7

We believe our company also invests wisely and bakes smart by:
• Engaging in research and development to create new products, improve the quality of existing products, and improve production processes andtechniques.
• Developing and evaluating new processing techniques for both current and proposed product lines.
• Improving the efficiency and accuracy of our shipping logistics. We have been installing a paperless, user-directed automated shipping system at ourbakeries that uses barcode labels, displays, and door scanners. The system streamlines the finished goods product flow, provides for greateraccountability of finished goods received and shipped, improves order fulfillment, and minimizes shortage costs. At the end of fiscal 2017, we hadinstalled this automated shipping system in approximately 87% of our bakeries.
Give Extraordinary Service
When it comes to our retail and foodservice partnerships, our strategy is simple: Go beyond the expected. Our bakery, sales, and corporate national accountteams forge strong business relationships built on providing the best quality products at the best price when and where our customers need them. Focusing onextraordinary service helps grow sales in both core and new markets. Also critical to this strategy within our DSD Segment is the professionalism and serviceprovided by the independent distributors who provide daily customer service and build strong retail and foodservice relationships.
Appreciate the Team
We strive to treat all our team members and associates with respect and dignity and work to maintain good relationships and open communication. We arecommitted to equal employment opportunities and operating our facilities under all federal and state employment laws and regulations. In addition, our subsidiariesprovide:
• fair and equitable compensation and a balanced program of benefits;
• working conditions that promote employees’ health and safety;
• training opportunities that encourage professional development; and
• ways for team members to discuss concerns through an open door policy, peer review program, and anonymous toll-free hotline.
We employ approximately 9,800 people. Approximately 1,160 of these employees are covered by collective bargaining agreements.
Brands & Products
The company reports sales (consolidated and by segment) as branded retail, store branded retail, or non-retail and other. The non-retail and other categoryincludes foodservice, restaurant, institutional, vending, thrift stores, and contract manufacturing. The table below presents our major brands and the geographiclocations in the U.S. in which our products are available:
Brand Availability
Nature's Own, Wonder, Cobblestone Bread Co., Dave ʼ s Killer Bread East, South, Southwest, West Coast, and select markets in the Midwest, Nevada,and Colorado
Tastykake Northeast, South, Southern Midwest, Southwest, and select markets in CaliforniaWhitewheat, Betsy Ross, Butterkrust, Captain John Derst's, Home Pride,Dandee, Aunt Hattie ʼ s, Bunny, Butternut, Country Kitchen, EvangelineMaid, Holsum, Merita, Sunbeam, Natural Grains, and Sara Lee (California)
Available in select regional markets across the country
Alpine Valley Breads Nationally, in select marketsBarowsky ʼ s Organics New EnglandMrs. Freshley ʼ s Nationally, in select marketsMi Casa Nationally, in select marketsFrestillas Regionally, in select markets
8

Brand Highlights
• Nature’s Own, including Whitewheat, is the best-selling loaf bread in the U.S., and its compound annual growth rate in retail sales since 2000 hasbeen 8.3%. The Nature’s Own sales, at retail, were $1.0 billion for fiscal 2017.
• Nature’s Own Honey Wheat is the number one selling fresh packaged bread Universal Product Code (“UPC”) in the U.S. Nature’s Own had three ofthe top six UPC’s in the Fresh Packaged Bread category during our fiscal 2017 (source: IRI Total US MultiOutlet ).
Our Warehouse Segment markets a line of specialty and organic breads and rolls, including the Alpine Valley Bread brand, for retail and foodservicecustomers. It also produces proprietary breads, buns, and rolls for specific foodservice customers. This segment’s snack cakes are sold under the Mrs. Freshley’sand store brands. Warehouse Segment products are fresh and frozen and distributed nationally through retail, foodservice and vending customer warehouses.
The table below presents our sales by product mix for fiscal 2017 on a consolidated basis (internal sales data warehouse – “SDW”):
The table below presents our sales by channel for fiscal 2017 on a consolidated basis (internal sales data warehouse – “SDW”):
9

Marketing
We support our key brands with an advertising and marketing effort that reaches out to consumers through electronic and in-store coupons, social media(such as Facebook and Twitter), digital media (including e-newsletters to consumers), websites (our brand sites and third-party sites), event and sports marketing,on-package promotional offers and sweepstakes, and print advertising. When appropriate, we may join other sponsors with promotional tie-ins. We often focus ourmarketing efforts on specific products and holidays, such as hamburger and hot dog bun sales during Memorial Day, the Fourth of July, and Labor Day, and snackcakes for specific seasons.
Customers
Our top 10 customers in fiscal 2017 accounted for 48.5% of sales. During fiscal 2017, our largest customer, Walmart/Sam’s Club, represented 20% of thecompany’s sales. The loss of, or a material negative change in our relationship with, Walmart/Sam’s Club or any other major customer could have a materialadverse effect on our business. Walmart/Sam’s Club was the only customer to account for 10.0% or more of our sales during fiscal years 2017, 2016 and 2015.
Fresh baked foods’ customers include mass merchandisers, supermarkets and other retailers, restaurants, quick-serve chains, food wholesalers, institutions,dollar stores, and vending companies. We also sell returned and surplus product through a system of discount bakery stores. The company currently operates 292such stores, and reported sales of $75.4 million during fiscal 2017 from these outlets.
Our Warehouse Segment supplies national and regional restaurants, institutions and foodservice distributors, and retail in-store bakeries with breads androlls. It also sells packaged bakery products to wholesale distributors for ultimate sale to a wide variety of food outlets. It sells packaged snack cakes primarily tocustomers who distribute the product nationwide through multiple channels of distribution, including mass merchandisers, supermarkets, vending outlets andconvenience stores. In certain circumstances, we enter into co-packing arrangements with retail customers or other food companies, some of which are competitors.
Distribution
Distributing fresh bakery foods through a DSD model is a complex process. It involves determining appropriate order levels and delivering products frombakeries to independent distributors for sale and direct delivery to customer stores. The independent distributors are responsible for ordering products, stockingshelves, maintaining special displays, and developing and maintaining good customer relations to ensure adequate inventory and removing unsold goods.
The company has sold the majority of the distribution rights for these territories to independent distributors under long-term financing arrangements.Independent distributors, highly motivated by financial incentives from their distribution rights ownership, strive to increase sales by offering outstanding serviceand merchandising. Independent distributors have the opportunity to benefit directly from the enhanced value of their distribution rights resulting from higherbranded sales volume.
Our DSD model is comprised of three types of territories. Independent distributors who own the rights to distribute certain brands of our fresh packagedbakery foods in defined geographic markets. Company-owned and operated territories with the distribution rights that are classified as available for sale andcompany owned and operated territories with the distribution rights that are classified as held and used. The table below presents the approximate number ofterritories used by the company on December 30, 2017:
Type of territory Number ofterritories
Independent distributor distribution rights 5,593 Company owned classified as available for sale 374 Company owned classified as held and used 105 Total territories 6,072
10

The company has developed proprietary software on the hand-held computers that independent distributors use for ordering, sales transactions, and tomanage their businesses. The company provides these hand-held computers to the independent distributors and charges them an administrative fee for their use andother administrative services . This fee is recognized as a reduction to the company’s selling, distribution and administrative expense s . Our proprietary softwarepermits distributors to track and communicate inventory data to bakeries and to calculate re commended order levels based on historical sales data and recenttrends. These orders are electronically transmitted to the appropriate bakery on a nightly basis. We believe this system assists us in minimizing returns of unsoldgoods. The fees collected for each of the last three fiscal years were as follows (amounts in thousands):
Year Fees collected Fiscal 2017 $ 6,965 Fiscal 2016 $ 6,544 Fiscal 2015 $ 6,790
In addition to hand-held computers, we maintain an information technology (“IT”) platform that allows us to track sales, product returns, and profitabilityby selling location, bakery, day, and other criteria. The system provides us with daily, on-line access to sales and gross margin reports, allowing us to make promptoperational adjustments when appropriate. It also permits us to better forecast sales and improve distributors’ in-store product ordering by customer. This ITplatform is integral to our hand-held computers.
We also use scan-based trading technology (referred to as “pay by scan” or “PBS”) to track and monitor sales and inventories more effectively. PBS allowsthe independent distributors to bypass the often lengthy product check-in at retail stores, which gives them more time to service customers and merchandiseproducts. PBS also benefits retailers, who only pay suppliers for what they actually sell, or what is scanned at checkout. During the last three fiscal years, PBS saleswere as follows (amounts in thousands):
Year PBS sales Fiscal 2017 $ 1,390,974 Fiscal 2016 $ 1,273,660 Fiscal 2015 $ 1,245,422
Our Warehouse Segment distributes a portion of our packaged bakery snack products from a central distribution facility located near our Crossville,Tennessee snack cake bakery. We believe this centralized distribution method allows us to achieve both production and distribution efficiencies. Products comingfrom different bakeries are then cross-docked and shipped directly to customers’ warehouses nationwide. Our frozen bread and roll products are shipped to variousoutside freezer facilities for distribution to our customers.
Intellectual Property
We own a number of trademarks, trade names, patents, and licenses. The company also sells products under franchised and licensed trademarks and tradenames that we do not own ( Sunbeam , Bunny , and Sara Lee – only in California – among others). We consider all of our trademarks and trade names important toour business since we use them to build strong brand awareness and consumer loyalty.
Raw Materials
Our primary baking ingredients are flour, sweeteners, shortening, and water. We also use paper products, such as corrugated cardboard, films and plastics topackage our bakery foods. We strive to maintain diversified sources for all of our baking ingredients and packaging products. In addition, we are dependent onnatural gas or propane as fuel for firing our ovens.
Commodities, such as our baking ingredients, periodically experience price fluctuations. The cost of these inputs may fluctuate widely due to governmentpolicy and regulation, weather conditions, domestic and international demand, or other unforeseen circumstances. We enter into forward purchase agreements andother derivative financial instruments in an effort to manage the impact of such volatility in raw material prices, but some organic and specialty ingredients do notoffer the same hedging opportunities to reduce the impact of price volatility. Any decrease in the supply available under these agreements and instruments couldincrease the effective price of these raw materials to us and significantly impact our earnings.
11

Regulations
As a producer and marketer of food items, our operations are subject to regulation by various federal governmental agencies, including the U.S. Food andDrug Administration, the U.S. Department of Agriculture, the U.S. Federal Trade Commission, the U.S. Environmental Protection Agency, the U.S. Department ofCommerce, and the U.S. Department of Labor (the “DOL”). We also are subject to the regulations of various state agencies, with respect to production processes,product quality, packaging, labeling, storage, distribution, labor, and local regulations regarding the licensing of bakeries and the enforcement of state standards andfacility inspections. Under various statutes and regulations, these federal and state agencies prescribe requirements and establish standards for quality, purity, andlabeling. Failure to comply with one or more regulatory requirements could result in a variety of sanctions, including monetary fines or compulsory withdrawal ofproducts from store shelves. On August 9, 2016, the DOL notified the company that it was scheduled for a compliance review under the Fair Labor StandardsAct. The company is cooperating with the DOL.
Advertising of our businesses is subject to regulation by the Federal Trade Commission, and we are subject to certain health and safety regulations,including those issued under the Occupational Safety and Health Act.
The cost of compliance with such laws and regulations has not had a material adverse effect on the company’s business. We believe that we are currently inmaterial compliance with all applicable federal, state and local laws and regulations.
Our operations, like those of similar businesses, are subject to various federal, state and local laws and regulations with respect to environmental matters,including air and water quality and underground fuel storage tanks, as well as other regulations intended to protect public health and the environment. Thecompany is not a party to any material proceedings arising under these laws and regulations. We believe compliance with existing environmental laws andregulations will not materially affect the Consolidated Financial Statements or the competitive position of the company. The company is currently in substantialcompliance with all material environmental laws and regulations affecting the company and its properties.
Competitive Overview
The U.S. market for fresh and frozen bakery products is estimated at $36 billion at retail. This category is intensely competitive and has experiencedsignificant change in the last several years. From a national standpoint, Flowers Foods is currently the second largest company in the U.S. fresh baking industrybased on market share as presented in the following chart:
The current competitive landscape for breads and rolls in the U.S. baking industry now consists of Bimbo Bakeries USA, Flowers Foods, and CampbellSoup Company (Pepperidge Farm) along with smaller independent regional bakers, local bakeries, and retailer-owned bakeries.
There are a number of smaller regional bakers in the U.S. Some of these do not enjoy the competitive advantages of larger operations, including greaterbrand awareness and economies of scale in purchasing, distribution, production, information technology, advertising and marketing. However, size alone is notsufficient to ensure success in our industry. The company faces significant competition from regional and independent bakeries in certain geographic areas.
12

Competition in the baking industry continues to be driven by a number of factors. These include the ability to serve consolidated retail and foodservicecustomers, generational changes in family-owned businesses, and competitors’ promot ional efforts on branded bread and store brands. Competition typically isbased on product availability, product quality, brand loyalty, price, effective promotions, and the ability to target changing consumer preferences. Customer service,including frequ ent deliver ies to keep store shelves well-stocked, is also a competitive factor.
The company also faces competition from store brands that are produced either by us or our competitors. Store brands (also known as “private label”) havebeen offered by food retailers for decades. With the growth of mass merchandisers like Walmart and the ongoing consolidation of regional supermarkets into largeroperations, store brands have become a significant competitor to the company in those areas where the company does not have the contract to produce the storebrand. In general, the store brand share of retail fresh packaged bread in the U.S. accounts for approximately 24% of the dollar sales and approximately 34% of unitsales and has steadily declined over the past five years.
Other Available Information
Throughout this Form 10-K, we incorporate by reference information from parts of other documents filed with the SEC. The SEC allows us to discloseimportant information by referring to it in this manner, and you should review this information in addition to the information contained in this report.
Our annual report on Form 10-K, quarterly reports on Form 10-Q, current reports on Form 8-K, and proxy statement for the annual shareholders’ meeting,as well as any amendments to those reports, are available free of charge through our website as soon as reasonably practicable after we file them with the SEC. Youcan learn more about us by reviewing our SEC filings in the Investor Center on our website at www.flowersfoods.com.
The SEC also maintains a website at www.sec.gov that contains reports, proxy statements and other information about SEC registrants, including thecompany. You may also obtain these materials at the SEC’s Public Reference Room at 100 F Street, N.E., Washington, D.C. 20549. You can obtain information onthe operation of the Public Reference Room by calling the SEC at 1-800-SEC-0330. Except as otherwise expressly set forth herein, the information contained onour website is neither included nor incorporated by reference herein.
The following corporate governance documents may be obtained free of charge through our website in the “Corporate Governance” section of the “InvestorCenter” tab (unless otherwise specified) or by sending a written request to Flowers Foods, Inc., 1919 Flowers Circle, Thomasville, GA 31757, Attention: InvestorRelations.
• Board Committees
• Code of Business Conduct and Ethics
• Flowers Foods Employee Code of Conduct
• Disclosure Policy
• Corporate Governance Guidelines
• Stock Ownership Guidelines
• Audit Committee Charter
• Compensation Committee Charter
• Finance Committee Charter
• Nominating/Corporate Governance Committee Charter
• Flowers Foods Supplier Code of Conduct (This document is on our website in the “Company Info” tab)
Item 1A. Risk Factors
You should carefully consider the risks described below, together with all of the other information included in this report, in considering our business andprospects. The risks and uncertainties described below are not the only ones facing us. These risk factors are not listed in any order of significance. Additionalrisks and uncertainties not presently known to us, or that we currently deem insignificant, may also impair our business operations. The occurrence of any of thefollowing risks could harm our business, financial condition, liquidity or results of operations.
13

Economic conditions may negatively impact demand for our products, which could adversely impact our sales and operating profit.
The willingness of our customers and consumers to purchase our products may depend in part on economic conditions. Continuing or worsening economicchallenges could have a negative impact on our business. Economic uncertainty may increase pressure to reduce the prices of some of our products, limit our abilityto increase or maintain prices, and reduce sales of higher margin products or shift our product mix to low-margin products. In addition, changes in tax or interestrates, whether due to recession, financial and credit market disruptions or other reasons, could negatively impact us. If any of these events occurs, or if economicconditions become unfavorable, our sales and profitability could be adversely affected.
Increases in costs and/or shortages of raw materials, fuels and utilities could adversely impact our profitability.
Commodities, such as flour, sweeteners, shortening and water, which are used in our bakery products, are subject to price fluctuations. The cost of theseinputs may fluctuate widely due to foreign and domestic government policies and regulations, weather conditions, domestic and international demand, or otherunforeseen circumstances. Any substantial change in the prices or availability of raw materials may have an adverse impact on our profitability. We enter intoforward purchase agreements and other derivative financial instruments from time to time to manage the impact of such volatility in raw materials prices; however,these strategies may not be adequate to overcome increases in market prices or availability. Our failure to enter into hedging or fixed price arrangements or anydecrease in the availability or increase in the cost of these agreements and instruments could increase the price of these raw materials and significantly affect ourearnings.
In addition, we are dependent upon natural gas or propane for firing ovens. The independent distributors and third-party transportation companies aredependent upon gasoline and diesel for their vehicles. The cost of fuel may fluctuate widely due to economic and political conditions, government policy andregulation, war, or other unforeseen circumstances. Substantial future increases in prices for, or shortages of, these fuels could have a material adverse effect on ourprofitability, financial condition or results of operations. There can be no assurance that we can cover these potential cost increases through future pricing actions.Also, as a result of these pricing actions, consumers could purchase less or move from purchasing high-margin products to lower-margin products.
Competition could adversely impact revenues and profitability.
The United States bakery industry is highly competitive. Our principal competitors in these categories all have substantial financial, marketing, and otherresources. In most product categories, we compete not only with other widely advertised branded products, but also with store branded products that are generallysold at lower prices. Competition is based on product availability, product quality, price, effective promotions, and the ability to target changing consumerpreferences. We experience price pressure from time to time due to competitors’ promotional activity and other pricing efforts. This pricing pressure is particularlystrong during adverse economic periods. Increased competition could result in reduced sales, margins, profits and market share.
A disruption in the operation of our DSD distribution system could negatively affect our results of operations, financial condition and cash flows.
We believe that our DSD distribution system is a significant competitive advantage. A material negative change in our relationship with the independentdistributors, litigation or one or more adverse rulings by courts or regulatory or governmental bodies regarding our independent distributorship model, includingactions or decisions that could affect the independent contractor classifications of the independent distributors, or an adverse judgment against the company foractions taken by the independent distributors, could materially and negatively affect our financial condition, results of operations and cash flows.
The costs of maintaining and enhancing the value and awareness of our brands are increasing, which could have an adverse impact on our revenues andprofitability.
We rely on the success of our well-recognized brand names and we intend to maintain our strong brand recognition by continuing to devote resources toadvertising, marketing and other brand building efforts. Brand value could diminish significantly due to several factors, including consumer perception that wehave acted in an irresponsible manner, adverse publicity about our products (whether or not valid), our failure to maintain the quality of our products, the failure ofour products to deliver consistently positive consumer experiences, or the products becoming unavailable to consumers. Our marketing investments may not provesuccessful in maintaining or increasing our market share. If we are not able to successfully maintain our brand recognition, our revenues and profitability could beadversely affected.
14

We rely on several large customers for a significant portion of sales and the loss of one of our large customers could adversely affect our business, financialcondition or results of operations.
We have several large customers that account for a significant portion of sales, and the loss of one of our large customers could adversely affect ourfinancial condition and results of operations. Our top ten customers accounted for 48.5% of sales during fiscal 2017. Our largest customer, Walmart/Sam’s Club,accounted for 20% of sales during this period. These customers do not typically enter long-term sales contracts, and instead make purchase decisions based on acombination of price, product quality, consumer demand, and customer service performance. At any time, they may use more of their shelf space, including spacecurrently used for our products, for store branded products or for products from other suppliers. Additionally, our customers may face financial or other difficultiesthat may impact their operations and their purchases from us. Disputes with significant suppliers could also adversely affect our ability to supply products to ourcustomers. If our sales to one or more of these customers are reduced, this reduction may adversely affect our business, financial condition or results of operations.
Our inability to execute our business strategy could adversely affect our business.
We employ various operating strategies to maintain our position as one of the nation’s leading producers and marketers of bakery products available tocustomers through multiple channels of distribution. In particular, we have initiated under Project Centennial, among other things, (i) the integration ofacquisitions or the acquisition or disposition of assets at presently targeted values, (ii) the deployment of new systems and technology, and (iii) an enhancedorganizational structure. If we are unsuccessful in implementing or executing Project Centennial or one or more of our business strategies, our business could beadversely affected.
Inability to anticipate or respond to changes in consumer preferences may result in decreased demand for our products, which could have an adverse impact onour future growth and operating results.
Our success depends in part on our ability to respond to current market trends and to anticipate the tastes and dietary habits of consumers, includingconcerns of consumers regarding health and wellness, obesity, product attributes, and ingredients. Introduction of new products and product extensions requiressignificant development and marketing investment. If our products fail to meet consumer preferences, or we fail to introduce new and improved products on atimely basis, then the return on that investment will be less than anticipated and our strategy to grow sales and profits with investments in marketing and innovationwill be less successful. If we fail to anticipate, identify, or react to changes in consumer preferences, or if we fail to introduce new and improved products on atimely basis, we could experience reduced demand for our products, which could in turn cause our operating results to suffer.
We may be adversely impacted by the failure to successfully execute acquisitions and divestitures and integrate acquired operations.
From time to time, the company undertakes acquisitions or divestitures. The success of any acquisition or divestiture depends on the company’s ability toidentify opportunities that help us meet our strategic objectives, consummate a transaction on favorable contractual terms, and achieve expected returns and otherfinancial benefits.
Acquisitions, including future acquisitions and acquisitions completed in the last several years, require us to efficiently integrate the acquired business orbusinesses, which involves a significant degree of difficulty, including the following:
• integrating the operations and business cultures of the acquired businesses while carrying on the ongoing operations of the businesses we operatedprior to the acquisitions;
• managing a significantly larger company than before consummation of the acquisitions;
• the possibility of faulty assumptions underlying our expectations regarding the prospects of the acquired businesses;
• coordinating a greater number of diverse businesses and businesses located in a greater number of geographic locations;
• attracting and retaining the necessary personnel associated with the acquisitions;
• creating uniform standards, controls, procedures, policies and information systems and controlling the costs associated with such matters; and
• expectations about the performance of acquired trademarks and brands and the fair value of such trademarks and brands.
Divestitures have operational risks that may include impairment charges. Divestitures also present unique financial and operational risks, including divertingmanagement attention from the existing core business, separating personnel and financial data and other systems, and adversely affecting existing businessrelationships with suppliers and customers.
15

In situations where acquisitions or divestitures are not successfully implemented or completed, or the expected benefits of such acquisitions or divestituresare not otherwise realized, the company’s business or financial resul ts could be negatively impacted.
We are subject to increasing legal complexity and could be party to litigation that may adversely affect our business.
Increasing legal complexity may continue to affect our operations and results in material ways. We are or could be subject to legal proceedings that mayadversely affect our business, including class actions, administrative proceedings, government investigations, securities laws, employment and personal injuryclaims, disputes with current or former suppliers, claims by current or former distributors, and intellectual property claims (including claims that we infringedanother party’s trademarks, copyrights, or patents). Inconsistent standards imposed by governmental authorities can adversely affect our business and increase ourexposure to litigation. Litigation involving our independent distributor model and the independent contractor classification of the independent distributors, as wellas litigation related to disclosure made by us in connection therewith, if determined adversely, could increase costs, negatively impact our business prospects andthe business prospects of our distributors and subject us to incremental liability for their actions. We are also subject to the legal and compliance risks associatedwith privacy, data collection, protection and management, in particular as it relates to information we collect when we provide products to customers.
Future product recalls or safety concerns could adversely impact our results of operations.
We may be required to recall certain of our products should they be mislabeled, contaminated, spoiled, tampered with or damaged. We may becomeinvolved in lawsuits and legal proceedings alleging that the consumption of any of our products causes or caused injury, illness or death. A product recall or anadverse result in any such litigation could have a material adverse effect on our operating and financial results, depending on the costs of the recall, the destructionof product inventory, contractual and other claims made by customers that we supply, competitive reaction and consumer attitudes. Even if a product liability,consumer fraud or other claim is unsuccessful or without merit, the negative publicity surrounding such assertions regarding our products could adversely affect ourreputation and brand image. We also could be adversely affected if our customers or consumers in our principal markets lose confidence in the safety and quality ofour products.
Consolidation in the retail and foodservice industries could adversely affect our sales and profitability.
If our retail and foodservice customers continue to grow larger due to consolidation in their respective industries, they may demand lower pricing andincreased promotional programs. Meeting these demands could adversely affect our sales and profitability.
Our large customers may impose requirements on us that may adversely affect our results of operations.
From time to time, our large customers may re-evaluate or refine their business practices and impose new or revised requirements on us, the distributors,and the customers’ other suppliers. The growth of large mass merchandisers, supercenters and dollar stores, together with changes in consumer shopping patterns,have produced large, sophisticated customers with increased buying power and negotiating strength. Current trends among retailers and foodservice customersinclude fostering high levels of competition among suppliers, demanding new products or increased promotional programs, requiring suppliers to maintain orreduce product prices, reducing shelf space for our products, and requiring product delivery with shorter lead times. These business changes may involve inventorypractices, logistics, or other aspects of the customer-supplier relationship. Compliance with requirements imposed by large customers may be costly and may havean adverse effect on our margins and profitability. However, if we fail to meet a large customer’s demands, we could lose that customer’s business, which alsocould adversely affect our results of operations.
Increases in employee and employee-related costs could have adverse effects on our profitability.
Pension, health care, and workers’ compensation costs are increasing and will likely continue to do so. Any substantial increase in pension, health care orworkers’ compensation costs may have an adverse impact on our profitability. The company records pension costs and the liabilities related to its benefit plansbased on actuarial valuations, which include key assumptions determined by management. Material changes in pension costs may occur in the future due tochanges in these assumptions. Future annual amounts could be impacted by various factors, such as changes in the number of plan participants, changes in thediscount rate, changes in the expected long-term rate of return, changes in the level of contributions to the plan, and other factors. In addition, legislation orregulations involving labor and employment and employee benefit plans (including employee health care benefits and costs) may impact our operational results.
16

We have risks related to our pension plans, which could impact the company’s liquidity.
The company has noncontributory defined benefit pension plans covering certain employees maintained under the Employee Retirement Income SecurityAct of 1974 (“ERISA”). The funding obligations for our pension plans are impacted by the performance of the financial markets, including the performance of ourcommon stock, which comprised approximately 11.5% of all the pension plan assets as of December 30, 2017.
If the financial markets do not provide the long-term returns that are expected, the likelihood of the company being required to make larger contributionswill increase, which could impact our liquidity. The equity markets can be, and recently have been, very volatile, and therefore our estimate of future contributionrequirements can change dramatically in relatively short periods of time. Similarly, changes in interest rates can impact our contribution requirements. In a lowinterest rate environment, the likelihood of larger required contributions increases. Adverse developments in any of these areas could adversely affect our financialcondition, liquidity or results of operations.
Disruption in our supply chain or distribution capabilities from political instability, armed hostilities, incidents of terrorism, natural disasters, weather or laborstrikes could have an adverse effect on our business, financial condition and results of operations.
Our ability to make, move and sell products is critical to our success. Damage or disruption to our manufacturing or distribution capabilities, or themanufacturing or distribution capabilities of our suppliers due to weather, natural disaster, fire or explosion, terrorism, pandemics, labor strikes or work stoppages,or adverse outcomes in litigation involving our independent distributor model, could impair our ability to make, move or sell our products. Moreover, terroristactivity, armed conflict, political instability or natural disasters that may occur within or outside the U.S. may disrupt manufacturing, labor, and other businessoperations. Failure to take adequate steps to mitigate the likelihood or potential impact of such events, or to effectively manage such events if they occur, couldadversely affect our business, financial conditions and results of operations.
We may be adversely impacted if our information technology systems fail to perform adequately, including with respect to cybersecurity issues.
The efficient operation of our business depends on our information technology systems. We rely on our information technology systems to effectivelymanage our business data, communications, supply chain, order entry and fulfillment, and other business processes. The failure of our information technologysystems (including those provided to us by third parties) to perform as we anticipate could disrupt our business and could result in billing, collecting and orderingerrors, processing inefficiencies, and the loss of sales and customers, causing our business and results of operations to suffer.
In addition, our information technology systems may be vulnerable to damage or interruption from circumstances beyond our control, including fire, naturaldisasters, systems failures, security breaches or intrusions (including theft of customer, consumer or other confidential data), and viruses. If we are unable toprevent physical and electronic break-ins, cyber-attacks and other information security breaches, we may suffer financial and reputational damage, be subject tolitigation or incur remediation costs or penalties because of the unauthorized disclosure of confidential information belonging to us or to our partners, customers,suppliers or employees.
Government regulation could adversely impact our results of operations and financial condition.
As a producer and marketer of food items, our production processes, product quality, packaging, labeling, storage, and distribution are subject to regulationby various federal, state and local government entities and agencies. In addition, the marketing and labeling of food products has come under increased scrutiny inrecent years, and the food industry has been subject to an increasing number of legal proceedings and claims relating to alleged false or deceptive marketing andlabeling under federal, state or local laws or regulations. Uncertainty regarding labeling standards has led to customer confusions and legal challenges.
Compliance with federal, state and local laws and regulations is costly and time consuming. Failure to comply with, or violations of, applicable laws and theregulatory requirements of one or more of these entities and agencies could subject us to civil remedies, including fines, injunctions, recalls or seizures, as well aspotential criminal sanctions, any of which could result in increased operating costs and adversely affect our results of operations and financial condition. Legalproceedings or claims related to our marketing could damage our reputation and/or adversely affect our business or financial results.
Executive Offices
The address and telephone number of our principal executive offices are 1919 Flowers Circle, Thomasville, Georgia 31757, (229) 226-9110.
17

Executive Officers of Flowers Foods
The following table sets forth certain information regarding the persons who currently serve as the executive officers of Flowers Foods. Our Board ofDirectors (the “Board”) elects our Executive Chairman of the Board for a one-year term. The Board of Directors has granted the Executive Chairman of the Boardthe authority to appoint the executive officers to hold office until they resign or are removed.
EXECUTIVE OFFICERS Name, Age and Office Business Experience
Allen L. ShiverAge 62President andChief Executive Officer
Mr. Shiver has been president and chief executive officer of Flowers Foods since May 2013. He was electedpresident in 2010, and previously served as executive vice president and chief marketing officer from 2008 to 2009.Mr. Shiver served as president and chief operating officer of Flowers Foods Specialty Group from 2003 until 2008and as president and chief operating officer of Flowers Snack from 2002 to 2003. Prior to those appointments, Mr.Shiver served as a bakery president, regional vice president, and executive vice president of operations. He joinedthe company in 1978.
R. Steve KinseyAge 57Chief Financial Officer and ChiefAdministrative Officer
Mr. Kinsey was named chief financial officer and chief administrative officer in May 2017. Previously, Mr. Kinseyserved as executive vice president and chief financial officer from 2008 until 2017, and as senior vice president andchief financial officer from 2007 to 2008. Prior to those appointments, Mr. Kinsey served as vice president andcorporate controller from 2003 until 2007, and as controller from 2002 until 2003. He served as director of tax from1998 until 2002 at Flowers Foods and Flowers Industries. At Flowers Industries, Mr. Kinsey also served as taxmanager from 1994 until 1998, and as tax associate from 1989 until 1994. He joined the company in 1989.
Bradley K. AlexanderAge 59President Fresh Packaged Bread BusinessUnit
Mr. Alexander was named president of the Fresh Packaged Bread Business Unit in May 2017. Mr. Alexanderserved previously as executive vice president and chief operating officer of Flowers Foods beginning in 2014 andas president of Flowers Bakeries from 2008 to 2014. He also served as a regional vice president of FlowersBakeries, and in various sales, marketing and operational positions, including bakery president and senior vicepresident of sales and marketing, since joining the company in 1981.
Stephen R. AveraAge 61Chief Legal Counsel
Mr. Avera was named chief legal counsel in May 2017. He previously served as executive vice president, secretaryand general counsel from 2008 until 2017. From 2004 to 2008, Mr. Avera served as senior vice president, secretaryand general counsel, and from 2002 until 2004, he served as secretary and general counsel. Mr. Avera also servedas vice president and general counsel of Flowers Bakeries from 1998 to 2002, and as associate general counsel andassistant general counsel of Flowers Industries from 1986, when he joined the company, to 1998.
D. Keith WheelerAge 54Chief Sales Officer
Mr. Wheeler was named chief sales officer in May 2017. Prior to this appointment, Mr. Wheeler served aspresident of Flowers Bakeries from 2014 until 2017. Mr. Wheeler was senior vice president of Flowers Foods’West Coast Region from 2012 until 2014, and before that, he served in various leadership and operationalpositions, including bakery president and region controller. He joined the company in 1988.
Robert L. Benton, Jr.Age 60Chief Supply Chain Officer
Mr. Benton was named chief supply chain officer in May 2017. He had been senior vice president and chiefmanufacturing officer since 2015. Mr. Benton served as senior vice president of manufacturing and operationssupport from 2011 until 2015, as vice president of manufacturing from 2001 until 2011, and as director ofmanufacturing at Flowers Foods and Flowers Industries from 1993 until 2001. At Flowers Industries, Mr. Bentonheld various manufacturing, engineering and operational management positions, from when he joined the companyin 1980 through 1993.
Karyl H. LauderAge 61Senior Vice President andChief Accounting Officer
Ms. Lauder has been senior vice president and chief accounting officer of Flowers Foods since 2008. Ms. Lauderserved as vice president and chief accounting officer from 2007 until 2008 and as vice president and operationscontroller from 2003 to 2007. Prior to those appointments, Ms. Lauder served as a division controller for FlowersBakeries Group from 1997 to 2003, as a regional controller for Flowers Bakeries, and in several other accountingand supervisory positions since 1978, when she joined the company.
18

Name, Age and Office Business Experience
A.Ryals McMullianAge 48Chief Strategy Officer
Mr. McMullian was named chief strategy officer in May 2017. Mr. McMullian served as vice president of mergersand acquisitions and deputy general counsel from 2015 until 2017. Mr. McMullian served as vice president andassociate general counsel from 2011 until 2015 and as associate general counsel from 2003, when he joined thecompany, until 2011.
Debo MukherjeeAge 50Chief Marketing Officer
Mr. Mukherjee joined Flowers as the chief marketing officer in October 2017. Mr. Mukherjee has 25 years ofexperience in confection, food, health, and nutrition consumer businesses, most recently as founder and owner ofIntacta Consulting Group, LLC. Prior to launching Intacta, Mr. Mukherjee served as CEO of Redco Foods, Inc., asubsidiary of Teekanne GmbH, the largest herbal and flavored tea company in Europe, from 2011 to 2015. He alsoheld marketing roles at Mars Inc., Unilever, H.J. Heinz Co. and The Hershey Company.
David M. RoachAge 48President, Snacking/Specialty BusinessUnit
Mr. Roach was named president of the Snacking/Specialty Business Unit in May 2017. Prior to this appointment,Mr. Roach served as senior vice president of organics from 2015 until 2017, and as senior vice president of theCentral Region from 2010 until 2015. Mr. Roach was president of Flowers Baking Co. of Villa Rica from 2007 to2010 and served in various sales and supervisory positions since joining the company in 1992.
Tonja TaylorAge 58Chief Human Resources Officer
Ms. Taylor was named chief human resources officer in May 2017. Ms. Taylor served as senior vice president ofhuman resources from 2013 until 2017 and as vice president of human resources from 2008 until 2013. Ms. Taylorjoined the company in 1999 as change management coordinator for a key information technology initiative.Beginning in 2000, she served in a variety of human resources positions, including manager of organizationaldevelopment, director of organizational development, and managing director of Human Resources.
Item 1B. Unresolved Staff Comments.
None
Item 2. Properties
The company currently operates 47 bakeries, of which 45 are owned and two are leased. We believe our properties are in good condition, well maintained,and sufficient for our present operations. During fiscal 2017, DSD Segment facilities, taken as a whole, operated moderately above capacity and WarehouseSegment facilities operated moderately below capacity. Our production plant locations are:
DSD SegmentState City State CityAlabama Birmingham Louisiana New OrleansAlabama Opelika Maine Lewiston (2 locations)Alabama Tuscaloosa Nevada HendersonArizona Phoenix North Carolina GoldsboroArizona Tolleson North Carolina JamestownArkansas Batesville North Carolina NewtonCalifornia Modesto (Leased) Oregon MilwaukieFlorida Bradenton Pennsylvania OxfordFlorida Jacksonville Pennsylvania Philadelphia (Leased)Florida Lakeland Tennessee KnoxvilleFlorida Miami Texas DentonGeorgia Atlanta Texas El PasoGeorgia Savannah Texas Houston (2 locations)Georgia Thomasville Texas San AntonioGeorgia Villa Rica Texas TylerKansas Lenexa Vermont BrattleboroKentucky Bardstown Virginia LynchburgLouisiana Baton Rouge Virginia NorfolkLouisiana Lafayette
19

Warehouse SegmentState City State CityAlabama Montgomery Georgia TuckerArizona Mesa Kentucky LondonArkansas Texarkana Tennessee ClevelandGeorgia Suwanee Tennessee Crossville
In Thomasville, Georgia, the company leases properties that house shared services functions and our information technology group, and owns severalproperties for our corporate offices.
Item 3. Legal Proceedings
For a description of all material pending legal proceedings, See Note 23, Commitments and Contingencies , of Notes to Consolidated Financial Statementsof this Form 10-K.
Item 4. Mine Safety Disclosures
Not Applicable
PART II
Item 5. Market for the Registrant’s Common Equity, Related Stockholder Matters and Issuer Purchases of Equity Securities
Market Information
Shares of the company’s common stock are quoted on the New York Stock Exchange (the “NYSE”) under the symbol “FLO.” The following table sets forthquarterly dividend information and the high and low sales prices of the company’s common stock on the NYSE as reported in published sources.
Fiscal 2017 Fiscal 2016 Market Price Dividend Market Price Dividend
Quarter High Low High Low First $ 21.00 $ 18.65 $ 0.1600 $ 22.08 $ 15.64 $ 0.1450 Second $ 20.10 $ 16.88 $ 0.1700 $ 19.80 $ 17.39 $ 0.1600 Third $ 18.93 $ 16.80 $ 0.1700 $ 19.62 $ 14.35 $ 0.1600 Fourth $ 20.42 $ 17.71 $ 0.1700 $ 20.10 $ 14.74 $ 0.1600
Holders
As of February 15, 2018, there were approximately 3,552 holders of record of the company’s common stock.
Dividends
The payment of dividends is subject to the discretion of the Board. The Board bases its decisions regarding dividends on, among other things, generalbusiness conditions, our financial results, contractual, legal and regulatory restrictions regarding dividend payments and any other factors the Board may considerrelevant.
20

Securities Authorized for Issuance Under Equity Compensation Plans
The following chart sets forth the amounts of securities authorized for issuance under the company’s compensation plans as of December 30, 2017 (amountsin thousands, except per share data).
Plan Category
Number of Securities tobe Issued Upon
Exercise of OutstandingOptions, Warrants and
Rights
Weighted AverageExercise Price of
Outstanding Options,Warrants and Rights
Number of Securities RemainingAvailable for Future Issuance Under
Equity Compensation Plans(Excluding Securities Reflected in
Column(a)) (a) (b) (c)
Equity compensation plans approved by security holders 73 $ 10.87 5,764,236 Equity compensation plans not approved by security holders — — — Total 73 $ 10.87 5,764,236
Under the company’s 2014 Omnibus Equity and Incentive Compensation Plan (the “Omnibus Plan”), the Board is authorized to grant a variety of stock-
based awards, including stock options, restricted stock and deferred stock, to its directors and certain of its employees. The number of securities set forth in column(c) above reflects securities available for issuance as stock options, restricted stock and deferred stock under the company’s compensation plans. The number ofshares originally available under the Omnibus Plan is 8,000,000 shares. The Omnibus Plan replaced the Flowers Foods’ 2001 Equity and Performance IncentivePlan, as amended and restated as of April 1, 2009 (“EPIP”), the Stock Appreciation Rights Plan, and the Annual Executive Bonus Plan. As a result, no additionalshares will be issued under the EPIP. See Note 18, Stock-Based Compensation, of Notes to Consolidated Financial Statements of this Form 10-K for additionalinformation on equity compensation plans.
Purchases of Equity Securities by the Issuer
The company did not purchase any shares of its common stock during the fourth quarter of fiscal 2017.
21

Stock Performance Graph
The chart below is a comparison of the cumulative total return (assuming the reinvestment of all dividends paid) of our common stock, Standard & Poor’s500 Index, Standard & Poor’s 500 Packaged Foods and Meats Index, and Standard & Poor’s MidCap 400 Index for the period December 29, 2012 throughDecember 30, 2017, the last day of our 2017 fiscal year.
December 29,
2012 December 28,
2013 January 3,
2015 January 2,
2016 December 31,
2016 December 30,
2017 FLOWERS FOODS INC 100.00 142.47 130.99 150.88 145.64 145.92 S&P 500 INDEX 100.00 134.12 153.05 155.19 173.76 211.69 S&P 500 PACKAGED FOODS & MEAT INDEX 100.00 131.61 147.66 173.31 189.14 191.70 S&P MIDCAP 400 INDEX 100.00 135.01 148.81 145.68 175.89 204.47
Companies in the S&P 500 Index, the S&P 500 Packaged Foods and Meats Index, and the S&P MidCap 400 Index are weighted by market capitalization
and indexed to $100 at December 29, 2012. Flowers Foods’ share price is also indexed to $100 at December 29, 2012. These prices have been adjusted for stocksplits.
22

Item 6. Selected Financial Data
The selected consolidated historical financial data presented below as of and for the fiscal years 2017, 2016, 2015, 2014, and 2013 have been derived fromthe audited Consolidated Financial Statements of the company. The results of operations presented below are not necessarily indicative of results that may beexpected for any future period and should be read in conjunction with Management’s Discussion and Analysis of Financial Condition and Results of Operations,and our Consolidated Financial Statements and the accompanying Notes to Consolidated Financial Statements included in this Form 10-K (amounts in thousands,except per share data).
For Fiscal Year Fiscal 2017 Fiscal 2016 Fiscal 2015 Fiscal 2014 Fiscal 2013 52 Weeks 52 Weeks 52 Weeks 53 Weeks 52 Weeks
Statement of Income Data: Sales $ 3,920,733 $ 3,926,885 $ 3,778,505 $ 3,748,973 $ 3,732,616 Net income $ 150,120 $ 163,776 $ 189,191 $ 175,739 $ 230,894 Net income attributable to Flowers Foods, Inc. common shareholders per basic share $ 0.72 $ 0.79 $ 0.90 $ 0.84 $ 1.11 Net income attributable to Flowers Foods, Inc. common shareholders per diluted share $ 0.71 $ 0.78 $ 0.89 $ 0.82 $ 1.09 Cash dividends per common share $ 0.6700 $ 0.6250 $ 0.5675 $ 0.4850 $ 0.4440 Balance Sheet Data: Total assets $ 2,659,724 $ 2,761,068 $ 2,844,051 $ 2,408,974 $ 2,504,014 Long-term debt and capital lease obligations $ 820,141 $ 946,667 $ 930,022 $ 724,459 $ 887,740
Notes to the Selected Financial Data table for additional context
1. Fiscal 2017 includes the impact of restructuring and related impairment charges of $104.1 million, $28.9 million gain on divestiture, $18.3 million ofmulti-employer pension plan withdrawal costs, $6.0 million of legal settlements, and a $4.6 million pension plan settlement loss which affectcomparability. During fiscal 2017, the company recognized a $48.2 million net tax benefit as a result of the Act. Additional information on the taximpacts of the Act is presented in Note 22, Income Taxes , of Notes to Consolidated Financial Statements of this Form 10-K.
2. Fiscal 2016 includes the impact of a $6.6 million pension settlement loss, $24.9 million of impairment charges, $10.5 million of legal settlements(including $0.3 million of related tax liabilities) which affect comparability, the issuance of our $400.0 million senior notes due 2026, and $1.9million of debt issuance costs recognized as interest expense (for a loss on extinguishment of debt) at the time we paid off $367.5 million ofoutstanding indebtedness under two of our term loans.
3. Fiscal 2015 includes the results of DKB and Alpine as of and from the date of each acquisition. See Note 10, Acquisitions , of Notes to ConsolidatedFinancial Statements of this Form 10-K for details of these acquisitions.
4. During the fourth quarter of fiscal 2014, we revised net sales. Historically, certain immaterial discounts had been recorded as an expense to selling,distribution and administrative costs. These discounts are now recorded as contra revenue. These revisions were made for all periods presented in thefiscal 2014 Form 10-K.
5. Fiscal 2014 includes the impact of a $15.4 million pension settlement loss.
6. Fiscal 2013 includes the recording of a bargain purchase gain of $50.1 million at the time of the Sara Lee California acquisition.
23

Item 7. Management’s Discussion and Analysis of Financial Condition and Resu lts of Operations
The following discussion should be read in conjunction with Item 1., Business, and the Consolidated Financial Statements and accompanying Notes toConsolidated Financial Statements included in this Form 10-K. The following information contains forward-looking statements which involve certain risks anduncertainties. See Forward-Looking Statements at the beginning of this Form 10-K.
Management’s Discussion and Analysis of Financial Condition and Results of Operations (“MD&A”) is segregated into four sections, including:
• Executive overview — provides a summary of our operating performance and cash flows, industry trends, and our strategic initiatives.
• Critical accounting estimates — describes the accounting areas where management makes critical estimates to report our financial condition andresults of operations.
• Results of operations — an analysis of the company’s consolidated results of operations for the two comparative periods presented in theConsolidated Financial Statements.
• Liquidity, capital resources and financial position — an analysis of cash flow, contractual obligations, and certain other matters affecting thecompany’s financial position.
MATTERS AFFECTING COMPARABILITY
Detailed below are matters affecting comparability as well as other significant events that will provide additional context while reading this discussion:
Fiscal 2017 Fiscal 2016 Fiscal 2015 Footnote 52 weeks 52 weeks 52 weeks Disclosure (Amounts in thousands)
Project Centennial consulting costs $ 37,306 $ 6,324 — Note 5Gain on divestiture (28,875) — — Note 6Restructuring and related impairment charges 104,130 — — Note 5Impairment of assets — 24,877 3,771 Notes 8, 9Facility closure costs — — 736 Pension plan settlement losses 4,649 6,646 — Note 21Multi-employer pension plan withdrawal costs 18,268 — — Note 21Acquisition-related costs — — 6,187 Note 10Legal settlements and related tax liabilities 5,978 10,500 — Note 23Lease termination costs 565 — — Loss on extinguishment of debt — 1,900 — Note 14 $ 142,021 $ 50,247 $ 10,694
In fiscal 2017, we recognized an income tax benefit of $48.2 million related to the estimated benefit of the Act, which partially offset the net expenseamount of the pre-tax items detailed above.
Project Centennial consulting costs. During the second quarter of fiscal 2016, we partnered with a globally recognized consulting firm and launchedProject Centennial, an enterprise-wide business and operational review. As of the end of fiscal 2016, we had completed the diagnostic phase and entered theimplementation phase of the project. Key initiatives of the project are outlined in Item 1., Business, of this Form 10-K. Consulting costs associated with theproject in fiscal 2017 and 2016 were $37.3 million and $6.3 million, respectively. We anticipate consulting costs to be in the range of $8.0 million to $10.0 millionin fiscal 2018. These costs were and will continue to be reflected in the selling, distribution and administrative expenses line item of the Consolidated Statementsof Income.
Gain on divestiture of the non-core mix manufacturing business. On January 14, 2017, we completed the sale of our non-core mix manufacturing businesslocated in Cedar Rapids, Iowa and received proceeds, net of a working capital adjustment, of $41.2 million and recognized a gain of $28.9 million in our fiscal2017 results of operations. The mix manufacturing business was previously included in our Warehouse Segment.
24

Restructuring and related impairment charges associated with Project Centennial. The following table details charges recorded by segment in fiscal 2017
(amounts in thousands):
DSD Warehouse Unallocated Segment Segment Corporate Total (Amounts in thousands)
Employee termination benefits and other cash charges $ 24,914 $ 5,633 $ 3,982 $ 34,529 Property, plant and equipment impairments — 3,354 — 3,354 Trademark impairments 55,112 11,135 — 66,247 $ 80,026 $ 20,122 $ 3,982 $ 104,130
Employee termination benefits and other cash charges recorded in fiscal 2017 included the VSIP, severance related to other reorganizational initiatives,
severance related to the plant closure, and relocation costs due to the ongoing company reorganization. The VSIP was made available to certain employees whomet the VSIP’s age, length-of-service, and business function criteria. Approximately 325 employees elected to participate in the VSIP and they accrued enhancedseparation benefits totaling $29.7 million. We paid $4.6 million of these benefits in fiscal 2017 and the remainder has been or will be paid in the first quarter offiscal 2018. Other reorganizational initiatives we completed during the fourth quarter of fiscal 2017 resulted in severance charges of $2.0 million. Additionally, onAugust 9, 2017, the company announced the closure of a Warehouse Segment snack cake plant in Winston-Salem, North Carolina as part of its supply chainoptimization initiative under Project Centennial . The facility closed in November of fiscal 2017 and a portion of the production was transitioned to otherfacilities. Closure costs included the recognition of impairments related to property, plant and equipment of $3.4 million and severance costs of $1.0 million. Weincurred additional reorganization costs, primarily relocation costs, of $1.9 million during fiscal 2017 and anticipate incurring an additional $4.0 million to $5.0million in fiscal 2018. We substantially completed the brand rationalization study in the third quarter of fiscal 2017, which resulted in impairment charges forcertain trademarks that we either no longer intend to use or plan to use on a more limited basis.
Impairment of assets. The table below details asset impairments recorded in 2016 and 2015, all of which related to assets of the DSD Segment. In fiscal
2016, we recorded asset impairment charges for certain trademarks acquired in the Lepage and Acquired Hostess Bread Assets acquisitions, primarily resultingfrom a brand rationalization study we began in fiscal 2016 as part of Project Centennial. This study was substantially completed in the third quarter of fiscal2017. We also recorded impairments on certain assets held for sale, which were subsequently sold for proceeds of $7.4 million. Asset impairment chargesrecorded in fiscal 2015 related to assets held for sale and a production line that we no longer intended to use.
Fiscal 2016 Fiscal 2015 52 weeks 52 weeks
Property, plant and equipment impairments $ 9,877 $ 3,771 Trademark impairments 15,000 — $ 24,877 $ 3,771
Issuance of $400.0 million of senior notes and payoff of existing term loans. On September 28, 2016, we issued $400.0 million of ten year senior notes (the
“2026 notes”) which bear interest at 3.50% per annum. Proceeds from the 2026 notes were used to repay debt currently outstanding under our existing term loanfacilities and for general corporate purposes, including repayment of a portion of our accounts receivable securitization facility (“the facility”). Debt issuance costsof $1.9 million associated with the term loan facilities were recorded as interest expense in our fiscal 2016 results of operations. See Note 14 , Debt, Lease andOther Commitments , of Notes to Consolidated Financial Statements of this Form 10-K for additional information.
Pension plan settlement losses. At the beginning of fiscal 2016, the company began offering retired and terminated vested pension plan participants not yetreceiving their benefit payments the option to elect to receive their benefit as a single lump sum payment. Settlement charges of $4.6 million and $6.6 million forfiscal 2017 and fiscal 2016, respectively, were triggered as a result of lump sum distributions paid in each fiscal year. Settlement charges will be recorded in fiscal2018 due to the level of lump sum payments that have occurred in early fiscal 2018.
Multi-employer pension plan withdrawal costs (“MEPP” costs). On August 18, 2017, the union participants of the Bakery and Confectionary Union andIndustry International Pension Fund (the “Fund”) at our Lakeland, Florida plant voted to withdraw from the Fund in the most recent collective bargainingagreement. This resulted in the recognition of an $18.3 million pension plan withdrawal liability, including transition payments, in the DSD Segment. Thetransition payments were made on November 3, 2017, and we anticipate the withdrawal liability to be paid in fiscal 2018.
25

Legal settlements. In fiscal 2017, we reached agreements to settle distributor-related litigation in the aggregate amount of $6.0 million, including attorney’sfees. Of this amount, $0.25 million was paid in fi scal 2017 and the remainder is expected to be paid in fiscal 2018. In fiscal 2016, we reached agreements to settledistributor-related litigation in the aggregate amount of $10.5 million, including attorney’s fees and related tax liabilities, all of which was paid in fiscal 2017. Allof these settlements were recorded in our DSD Segment’s selling, distribution and administrative expenses in our Consolidated Statements of Income.
Income tax benefit related to the impact of the Tax Cuts and Jobs Act of 2017. In the fourth quarter of fiscal 2017, we recognized an income tax benefit of$48.2 million related to the estimated benefit of the Act which was enacted on December 22, 2017. The benefit primarily resulted from the revaluation of thecompany’s net deferred tax liability as of a result of the decrease in the corporate tax rate.
Nationwide launch of Dave’s Killer Bread brand. At the beginning of the second quarter of fiscal 2016, we began the national rollout of our organic, non-GMO DKB brand on our DSD network and had completed the rollout as of the end of fiscal 2016. Sales of the DKB brand, including sales from the nationwidelaunch, were included in acquisition sales until the first anniversary of the acquisition on September 12, 2016. After this date, these sales were and will continue tobe included in core or expansion markets (defined as markets we entered in the last five years) as determined by the market in which they are sold.
Alpine Valley Bread Company acquisition. On October 13, 2015, we completed the acquisition of Alpine, a family-owned producer of certified organic andall-natural breads located in Mesa, Arizona, for $121.9 million in cash and stock. Alpine is included in our Warehouse Segment. The acquisition expanded ourpenetration into the organic market and provides additional organic production capacity. We funded the cash portion of the purchase price for the Alpineacquisition with our existing credit facilities and also issued 12,602 shares of our common stock to fund the equity portion of the purchase price.
Dave’s Killer Bread acquisition . On September 12, 2015, we completed the acquisition of DKB for total cash payments of $282.1 million inclusive ofpayments for certain tax benefits. We believe the acquisition strengthened our position as the second-largest baker in the U.S. by giving us greater access to thefast growing organic bread category and expanding our geographic reach into the Pacific Northwest. DKB operates one production facility in Milwaukie, Oregonand is included in our DSD Segment. We funded the purchase price of the DKB acquisition with cash on hand and borrowings from our existing credit facilities.
Reporting Periods. The company operates on a 52-53 week fiscal year ending the Saturday nearest December 31. Fiscal 2017, 2016 and 2015 consisted of52 weeks. Fiscal 2018 will consist of 52 weeks.
EXECUTIVE OVERVIEW
We are the second largest producer and marketer of packaged bakery foods in the U.S. with fiscal 2017 sales of $3.9 billion. We operate in the highlycompetitive fresh bakery market and our product offerings include fresh breads, buns, rolls, snack cakes and tortillas, as well as frozen breads and rolls. Ourbusiness is currently managed based on delivery method of our products and we have two segments: DSD Segment and Warehouse Segment. We operate 47plants in 18 states that produce a wide range of breads, buns, rolls, snack cakes, and tortillas. See Item 1., Business, of this Form 10-K for information regardingour segments, customers and brands, business strategies, strengths and core competencies, and competition and risks.
Summary of Operating Results, Cash Flows and Financial Condition:
Sales in fiscal 2017 decreased 0.2% as compared to fiscal 2016 primarily as a result of the divestiture of the mix manufacturing business in January 2017and softness in the fresh bakery category, partially offset by significant sales growth for our branded organic products. Sales increased 3.9% in fiscal 2016 due tothe DKB and Alpine acquisitions, both of which were completed in the second half of fiscal 2015, and the nationwide launch of the DKB brand in our DSDmarkets in fiscal 2016.
Net income decreased 8.3% in fiscal 2017 as compared to fiscal 2016 primarily due to the restructuring and related impairment charges, the MEPP costs andincremental Project Centennial consulting costs, partially offset by the income tax benefit recognized from passage of the Act, the current year gain on divestitureand the prior year asset impairment charges. Net income in fiscal 2016 decreased 13.4% as compared to fiscal 2015 primarily due to higher asset impairmentcharges, and increased legal costs attributable to ongoing and additional litigation, including distributor lawsuits, and related legal settlements. Additionally,increased consulting costs and pension settlement losses incurred in fiscal 2016 negatively impacted net income, partially offset by acquisition-related costsincurred in fiscal 2015.
26

In fiscal 2017, we generated net cash flows from operations of $297.4 million and invested $75.2 million in capital expenditures. We reduced our totalindebtedness $124.0 millio n, and extended the maturity dates of the facility and the credit facility to September 28, 2019 and November 29, 2022,respectively. We paid $141.0 million in dividends to our shareholders in fiscal 2017. In fiscal 2016, we generated net cash flows from operations of $356.6million and invested $101.7 million in capital expenditures. We converted certain of our variable rate, shorter-term debt arrangements to significantly longer-term,fixed rate debt with the issuance of the 2026 notes and the payoff o f our term loans, and reduced our total indebtedness $55.6 million. Additionally, in fiscal 2016,we repurchased 6.9 million shares of our common stock for $126.3 million and paid $131.1 million in dividends to our shareholders.
Industry Trends
The chart below details the sales change in dollars and units of the Fresh Packaged Breads category for the years 2015, 2016 and 2017:
• We hold a 15.4 dollar share of the Fresh Packaged Breads category. ( Source: Flowers Custom Database – IRI Total US MultiOutlet + ConvenienceStore for calendar year 2017 ending 12/31/17)
• We hold an 8.1 dollar share of the Commercial Cake category. ( Source: Flowers Custom Database – IRI Total US MultiOutlet + Convenience Storefor calendar year 2017 ending 12/31/17)
• We expect stable consumer demand for fresh baked bakery foods.
• The Fresh Packaged Breads category is highly competitive.
• We anticipate our growth will be driven by our organic bread brands, partially offset by softer demand for some of our other product offerings.
CRITICAL ACCOUNTING ESTIMATES
The company’s discussion and analysis of its results of operations and financial condition are based upon the Consolidated Financial Statements of thecompany, which have been prepared in accordance with generally accepted accounting principles in the United States (“GAAP”). The preparation of these financialstatements requires the company to make estimates and assumptions that affect the reported amounts of assets, liabilities, revenues and expenses, and relateddisclosure of contingent assets and liabilities at the date of the financial statements and the reported amounts of the revenues, expenses, and cash flows during thereporting period. On an ongoing basis, the company evaluates its estimates, including those related to customer programs and incentives, bad debts, raw materials,inventories, long-lived assets, intangible assets, income taxes, restructuring, pensions and other post-retirement benefits, and contingencies and litigation. Thecompany bases its estimates on historical experience and on various other assumptions that are believed to be reasonable under the circumstances, the results ofwhich form the basis for making judgments about the carrying values of assets and liabilities that are not readily apparent from other sources. Actual results maydiffer from these estimates.
27

The selection and disclosure of the company’s critical accounting estimates have been discussed with the company’s audit committee. Note 2, Summary ofSignificant Accounting Policies, of Notes to Consolidated Financial Statements of this Form 10-K includes a summary of the significant accounting policies andmethods used in the preparation of the Consolidated Financial Statements. The following table lists, in no particular o rder of importance, areas of criticalassumptions and estimates used in the preparation of the Consolidated Financial Statements. Additional detail can be found in the following notes:
Critical Accounting Estimate Note Revenue recognition — Derivative financial instruments 11 Long-lived assets — Goodwill and other intangible assets 9 Self-insurance reserves 23 Income tax expense (benefit) and accruals 22 Postretirement plans 21 Stock-based compensation 18 Commitments and contingencies 23
Revenue Recognition. The company recognizes revenue from the sale of its products when title and risk of loss pass to the customer or consumer. The
company records both direct and estimated reductions to gross revenue for customer programs and incentive offerings at the time the incentive is offered or at thetime of revenue recognition for the underlying transaction that results in progress by the customer towards earning the incentive. These allowances include pricepromotion discounts, coupons, customer rebates, cooperative advertising, and product returns. Price promotion discount expense is recorded as a reduction to grosssales when the discounted product is sold to the customer. Although we do not expect it to be material, see Note 3, Recent Accounting Pronouncements , of Notesto Consolidated Financial Statements of this Form 10-K for information regarding the FASB’s revenue recognition guidance issued in May 2014, which is effectivefor the company beginning in fiscal 2018.
Derivative Financial Instruments. The company’s cost of primary raw materials is highly correlated to certain commodities markets. Commodities, such
as our baking ingredients, experience price fluctuations. If actual market conditions become significantly different than those anticipated, raw material prices couldincrease significantly, adversely affecting our results of operations. We enter into forward purchase agreements and other derivative financial instrumentsqualifying for hedge accounting to manage the impact of volatility in raw material prices. The company measures the fair value of its derivative portfolio using fairvalue as the price that would be received to sell an asset or paid to transfer a liability in the principal market for that asset or liability. When quoted market pricesfor identical assets or liabilities are not available, the company bases fair value on internally developed models that use current market observable inputs, such asexchange-quoted futures prices and yield curves. See Note 3, Recent Accounting Pronouncements , of Notes to Consolidated Financial Statements of this Form 10-K for information regarding the FASB’s hedge accounting guidance issued in August 2017, which the company plans to early adopt in the first quarter of fiscal2018.
Valuation of Long-Lived Assets, Goodwill and Other Intangible Assets. The company records an impairment charge to property, plant and equipment,goodwill and intangible assets in accordance with applicable accounting standards when, based on certain indicators of impairment, it believes such assets haveexperienced a decline in value that is other than temporary. Future adverse changes in market conditions or poor operating results of these underlying assets couldresult in losses or an inability to recover the carrying value of the asset that may not be reflected in the asset’s current carrying value, thereby possibly requiringimpairment charges in the future. Impairment charges recorded in fiscal 2017, 2016 and 2015 are discussed above in the “Matters Affecting Comparability”section.
The company evaluates the recoverability of the carrying value of its goodwill on an annual basis or at a time when events occur that indicate the carryingvalue of the goodwill may be impaired using a two-step process. We have elected not to perform the qualitative approach. The first step of this evaluation isperformed by calculating the fair value of the business segment, or reporting unit, with which the goodwill is associated. Our reporting units are at the segmentlevel. Each segment consists of several components. These components are aggregated by their respective delivery method into the Warehouse Segment and DSDSegment. These segments rely on reciprocal baking among their components, cross-selling their products/brands within the segment, and utilizing the samedelivery method. Marketing, research and development and capital projects are measured at the segment level. We believe these factors support our reporting unitclassifications. This fair value is compared to the carrying value of the reporting unit, and if less than the carrying value, the goodwill is evaluated for potentialimpairment under step two. Under step two of this calculation, goodwill is measured for potential impairment by comparing the implied fair value of the reportingunit’s goodwill, determined in the same manner as a business combination, with the carrying amount of the goodwill.
28

Our annual evaluation of goodwill impairment requires management judgment and the use of estimates and assumptions to determine the fai r value of ourreporting units. Fair value is estimated using standard valuation methodologies incorporating market participant considerations and management’s assumptions onrevenue, revenue growth rates, operating margins, discount rates, and EBITDA (def ined as earnings before interest, taxes, depreciation and amortization). Ourestimates can significantly affect the outcome of the test. We perform the fair value assessment using the income and market approach. We use this data tocomplete a separate fair value analysis for each reporting unit. Changes in our forecasted operating results and other assumptions could materially affect theseestimates. This test is performed in the fourth quarter of each fiscal year unless circumstances require this analysis to be completed sooner. The income approach istested using a sensitivity analysis to changes in the discount rate and yield a sufficient buffer to significant variances in our estimates. The estimated fair values ofour reporting units exceeded our carryi ng values in excess of $400 million in each reporting unit in fiscal 2017. Based on management’s evaluation, no impairmentcharges relating to goodwill were recorded for the fiscal years 2017, 2016 or 2015.
In connection with acquisitions, the company has acquired trademarks, customer lists, and non-compete agreements, a portion of which are amortizable. Thecompany evaluates these assets whenever events or changes in circumstances indicate that the carrying amount of the asset may not be recoverable. Theundiscounted future cash flows of each intangible asset are compared to the carrying amount, and if less than the carrying value, the intangible asset is writtendown to the extent the carrying amount exceeds the fair value. The fair value is computed using the same approach described above for goodwill and includes thesame risks and estimates. The fair value of the trademarks could be less than our carrying value if any of our four material assumptions in our fair value analysis:(a) weighted average cost of capital; (b) long-term sales growth rates; (c) forecasted operating margins; and (d) market multiples do not meet our expectations,thereby requiring us to record an asset impairment. We use the multi-period excess earnings and relief from royalty methods to value these intangibles. The methodused for impairment testing purposes is consistent with the valuation method employed at acquisition of the intangible asset. Impairment charges recorded in fiscal2017 related to amortizable intangible assets totaled $47.7 million and are discussed above in the “Matters Affecting Comparability” section. There were noimpairment charges related to amortizable intangible assets for fiscal years 2016 or 2015.
As of December 30, 2017, the company also owns $206.6 million of trademarks acquired in acquisitions that are indefinite-lived intangible assets notsubject to amortization. The company evaluates the recoverability by comparing the fair value to the carrying value of these intangible assets on an annual basis orat a time when events occur that indicate the carrying value may be impaired. In addition, the assets are evaluated to determine whether events and circumstancescontinue to support an indefinite life. The fair value is compared to the carrying value of the intangible asset, and if less than the carrying value, the intangible assetis written down to fair value. There are certain inherent risks included in our expectations about the performance of acquired trademarks and brands. If we areunable to implement our growth strategies for these acquired intangible assets as expected, it could adversely impact the carrying value of the brands. The fair valueof the trademarks could be less than our carrying value if any of our four material assumptions in our fair value analysis: (a) weighted average cost of capital;(b) long-term sales growth rates; (c) forecasted operating margins; and (d) market multiples do not meet our expectations, thereby requiring us to record an assetimpairment. As discussed above, during fiscal years 2017 and 2016, we recorded asset impairment charges of $18.5 million and $15.0 million, respectively, oncertain indefinite-lived trademarks and determined these trademarks no longer are deemed to have an indefinite life. During fiscal 2015, in conjunction with theDKB and Alpine acquisitions, we determined that the Barowsky’s trademark acquired in the Lepage acquisition would be used on a more regional basis as anorganic brand rather than distributed nationally, and therefore, this intangible asset was deemed to have a finite life and was assigned a life of 35 years.
Self-Insurance Reserves. We are self-insured for various levels of general liability, auto liability, workers’ compensation, and employee medical anddental coverage. Insurance reserves are calculated on an undiscounted basis and are based on actual claim data and estimates of incurred but not reported claimsdeveloped utilizing historical claim trends. Projected settlements and incurred but not reported claims are estimated based on pending claims and historical trendsand data. Though the company does not expect them to do so, actual settlements and claims could differ materially from those estimated. Material differences inactual settlements and claims could have an adverse effect on our financial condition and results of operations.
Income Tax Expense (Benefit) and Accruals. The annual tax rate is based on our income, statutory tax rates, and tax planning opportunities available to usin the various jurisdictions in which we operate. Changes in statutory rates and tax laws in jurisdictions in which we operate may have a material effect on theannual tax rate. The effect of these changes, if any, would be recognized as a discrete item upon enactment.
Deferred income taxes arise from temporary differences between the tax and financial statement recognition of revenues and expenses. Deferred tax assetsand liabilities are measured based on the enacted tax rates that will apply in the years in which the temporary differences are expected to be recovered or paid. Assuch, in December 2017, the company revalued its deferred tax assets and liabilities as a result of passage of the Act. Additional information on the tax impacts ofthe Act is presented in Note 22, Income Taxes , of Notes to Consolidated Financial Statements of this Form 10-K.
29

Our income tax expense, deferred tax assets and liabilities, and reserve for uncertain tax benefits reflect our best assessment of future taxes to be paid in thejurisdictions in which we operate. The company records a valuation allowance to reduce its def erred tax assets if we believe it is more likely than not that some orall of the deferred assets will not be realized. While the company considers future taxable income and ongoing prudent and feasible tax strategies in assessing theneed for a valuation allowance, if these estimates and assumptions change in the future, the company may be required to adjust its valuation allowance, whichcould result in a charge to, or an increase in, income in the period such determination is made.
Periodically, we face audits from federal and state tax authorities, which can result in challenges regarding the timing and amount of income or deductions.We provide reserves for potential exposures when we consider it more likely than not that a taxing authority may take a sustainable position on a matter contrary toour position. We evaluate these reserves on a quarterly basis to ensure that they have been appropriately adjusted for events, including audit settlements that mayimpact the ultimate payment of such potential exposures. While the ultimate outcome of audits cannot be predicted with certainty, we do not currently believe thatcurrent or future audits will have a material adverse effect on our consolidated financial condition or results of operations. The company is no longer subject tofederal examination for years prior to fiscal 2015.
Postretirement Plans. The company records pension costs and benefit obligations related to its defined benefit plans based on actuarial valuations. Thesevaluations reflect key assumptions determined by management, including the discount rate, expected long-term rate of return on plan assets and mortality. Materialchanges in pension costs and in benefit obligations may occur in the future due to experience that is different than assumed and changes in these assumptions.
Effective January 1, 2006, the company curtailed its largest defined benefit plan (“Plan No. 1”) that covered the majority of its workforce. Benefits underthis plan are frozen, and no future benefits will accrue under this plan. In addition to Plan No. 1, the company sponsors an ongoing defined benefit pension plan forunion employees (“Plan No. 2”) and a frozen nonqualified plan covering former Tasty executives.
On January 1, 2016, the company began providing retired and terminated vested pension plan participants who have not yet started their payments theoption to receive their benefit as a single lump sum payment. Participants can elect this option when they retire or when they leave the company. This changesupports our long-term pension risk management strategy. Lump sum payments made in 2017 and 2016 triggered settlement charges as detailed in the table below(amounts in thousands). Based on known activity in 2018, primarily related to the VSIP, the company expects to record settlement charges beginning in the firstquarter of fiscal 2018. The company recorded pension income on our qualified defined benefit plans and nonqualified plan in fiscal 2017, 2016 and 2015 asdetailed in the table below (amounts in thousands). We expect pension income of approximately $1.7 million on our qualified defined benefit plans andnonqualified plan for fiscal 2018 excluding any potential settlement losses.
Fiscal 2017 Fiscal 2016 Fiscal 2015 52 weeks 52 weeks 52 weeks
Pension income $ (5,320) $ (4,451) $ (5,788)Pension plan settlement losses 4,649 6,646 — Net pension cost (income) $ (671) $ 2,195 $ (5,788)
In 2016, we refined the method used to estimate service cost and interest cost components of net periodic benefit costs. Historically, we estimated the
service cost and interest cost components using a single weighted average discount rate derived from the yield curve used to measure the benefit obligation at thebeginning of the period. Currently, we use a spot rate approach to estimate these components of benefit cost by applying the specific spot rates along the yieldcurve to the relevant projected cash flows, as we believe this provides a better estimate of service and interest costs. We considered this a change in estimate andaccordingly, accounted for it on a prospective basis beginning in 2016. This change does not affect the measurement of our total benefit obligation.
On December 31, 2017, the company adopted a de-risking investment strategy for its pension assets. As the funded status of the plans increases, over timethe targeted allocation to return seeking assets will be reduced and the targeted allocation to fixed-income assets will be increased to better manage the company’spension liability and reduce funded status volatility. Based on the funded status of the plans as of December 31, 2017, the asset allocation for the Flowers Foods’pension plans has been adjusted to 35% equity securities, 35% fixed-income securities, 25% other diversifying strategies (including absolute return funds andhedged equity funds), and 5% short-term investments and cash. For the details of our pension plan assets, see Note 21, Postretirement Plans , of Notes toConsolidated Financial Statements of this Form 10-K.
In developing the expected long-term rate of return on plan assets at each measurement date, the company considers the plan assets’ historical actual returns,targeted asset allocations, and the anticipated future economic environment and long-term performance of the individual asset classes, based on the company’sinvestment strategy. While appropriate consideration is given to recent and historical investment performance, the assumption represents management’s bestestimate of the long-term prospective
30

return. Further, pension costs do not include an explicit expense assumption, and therefore the return on assets rate reflects the long-term expected return, net ofexpenses. Based on these factors, the long-term rate of return assumption for the plans was set at 8.0% for fiscal 2017 and 6.4% for fi scal 2018. The change inassumption from fiscal 2017 to fiscal 2018 was the result of the change in the asset allocation referenced above. The de-risking investment strategy may result inadditional changes in 2018 as the company explores the option of m aking additional contributions.
The company utilizes the Society of Actuaries’ (“SOA”) published mortality tables and improvement scales in developing their best estimates of mortality.In October 2014, the SOA published final reports on their “standard” mortality table (“RP-2014”) and mortality improvement scale (“MP-2014”). In 2017, theSOA published a revised mortality improvement scale (“MP-2017”). Based on an evaluation of the information released in 2017, the company updated themortality assumptions for purposes of measuring pension benefit obligations at year-end 2017. The company will continue to use the standard mortality tables andmortality improvement scale with adjustments to the base table as applicable: 30% adjustment for Plan No. 1, based on experience within the plan, blue collaradjustment for Plan No. 2 and no adjustment for the nonqualified plan.
The company determines the fair value of substantially all of its plans’ assets utilizing market quotes rather than developing “smoothed” values, “marketrelated” values, or other modeling techniques. Plan asset gains or losses in a given year are included with other actuarial gains and losses due to remeasurement ofthe plans’ projected benefit obligations (“PBO”). If the total unrecognized gain or loss exceeds 10% of the larger of (i) the PBO or (ii) the market value of planassets, the excess of the total unrecognized gain or loss is amortized over the expected average future lifetime of participants in the frozen pension plans. Priorservice cost or credit, which represents the effect on plan liabilities due to plan amendments, is amortized over the average remaining service period of activecovered employees. The total unrecognized loss and prior service cost in accumulated other comprehensive income (“AOCI”) as of December 30, 2017 for thepension plans the company sponsors is $131.4 million. Amortization of this unrecognized loss and prior service cost during fiscal 2018 is expected to beapproximately $6.4 million. To the extent that this unrecognized loss and prior service cost is subsequently recognized, the loss will increase the company’spension costs in the future.
A sensitivity analysis of fiscal 2017 pension costs on a pre-tax basis and year-end benefit obligations for our qualified plans is presented in the table below(amounts in thousands) to changes in the discount rate and expected long-term rate of return on plan assets (“EROA”):
Percentage increase (decrease) 0.25%
Discount Rate (0.25%)
Discount Rate 0.25%EROA
(0.25%)EROA
Estimated change in FY 2017 pension costs $ (249) $ 255 $ (799) $ 799 Estimated change in FY 2017 year-end benefit obligations $ (11,052) $ 11,616 N/A N/A
In January of fiscal 2018, the company made a $10.0 million contribution to our qualified pension plans, and expects to pay $0.3 million in nonqualified
pension benefits from corporate assets during fiscal 2018.
Stock-based compensation. Stock-based compensation expense for all share-based payment awards granted is determined based on the grant date fairvalue. The company recognizes these compensation costs net of an estimated forfeiture rate, and recognizes compensation cost only for those shares expected tovest on a straight-line basis over the requisite service period of the award, which is generally the vesting term of the share-based payment award.
We grant performance stock awards that separately have a market and performance condition. The expense computed for the total shareholder return shares(“TSR”) is fixed and recognized on a straight-line basis over the vesting period. The expense computed for the return on invested capital (“ROIC”) shares canchange depending on the attainment of performance condition goals. The expense for the ROIC shares can be within a range of 0% to 125% of the target. There is apossibility that this expense component will change in subsequent quarters depending on how the company performs relative to the ROIC target. The payouts forthe TSR and ROIC shares to be issued in fiscal 2018 (on the 2016 awards) are estimated to be 12.5% and 70%, respectively. See Note 18, Stock-BasedCompensation , of Notes to Consolidated Financial Statements of this Form 10-K for additional information.
Commitments and contingencies. The company and its subsidiaries from time to time are parties to, or targets of, lawsuits, claims, investigations andproceedings, including personal injury, commercial, contract, environmental, antitrust, product liability, health and safety and employment matters, includinglawsuits related to the independent distributors, which are being handled and defended in the ordinary course of business. Loss contingencies are recorded at thetime it is probable an asset is impaired or a liability has been incurred and the amount can be reasonably estimated. For litigation claims, the company considersthe degree of probability of an unfavorable outcome and the ability to make a reasonable estimate of the loss. Losses are recorded in selling, distribution andadministrative expense in the Consolidated Statements of Income.
31

RESULTS OF OPERATIONS
The company’s results of operations, expressed as a percentage of sales, are set forth below for fiscal 2017 and 2016 (by segment):
Percentage of Sales Increase (Decrease) Fiscal 2017 Fiscal 2016 Fiscal 2017 Fiscal 2016 Dollars % 52 weeks 52 weeks 52 weeks 52 weeks (Amounts in thousands, except percentages)
Sales DSD Segment $ 3,318,563 $ 3,284,177 84.6 83.6 $ 34,386 1.0 Warehouse Segment 602,170 642,708 15.4 16.4 (40,538) (6.3)
Total $ 3,920,733 $ 3,926,885 100.0 100.0 $ (6,152) (0.2)Materials, supplies, labor and other production costs (exclusive of depreciation and amortization shown separately below) DSD Segment (1) $ 1,577,824 $ 1,569,861 47.5 47.8 $ 7,963 0.5 Warehouse Segment (1) 431,239 456,506 71.6 71.0 (25,267) (5.5)
Total $ 2,009,063 $ 2,026,367 51.2 51.6 $ (17,304) (0.9)Selling, distribution and administrative expenses DSD Segment (1) $ 1,313,291 $ 1,308,935 39.6 39.9 $ 4,356 0.3 Warehouse Segment (1) 104,304 107,599 17.3 16.7 (3,295) (3.1)Corporate (2) 86,272 47,702 — — 38,570 80.9
Total $ 1,503,867 $ 1,464,236 38.4 37.3 $ 39,631 2.7 Gain on divestiture Warehouse Segment (1) $ 28,875 $ — 4.8 — $ 28,875 NM
Total $ 28,875 $ — 0.7 — $ 28,875 NM Multi-employer pension plan withdrawal costs DSD Segment (1) $ 18,268 $ — 0.6 — $ 18,268 NM
Total $ 18,268 $ — 0.5 — $ 18,268 NM Pension plan settlement loss Corporate (2) $ 4,649 $ 6,646 — — $ (1,997) NM
Total $ 4,649 $ 6,646 0.1 0.2 $ (1,997) NM Restructuring and related impairment charges DSD Segment (1) $ 80,026 $ — 2.4 — $ 80,026 NM Warehouse Segment (1) 20,122 — 3.3 — 20,122 NM Corporate (2) 3,982 — — — 3,982 NM
Total $ 104,130 $ — 2.7 — $ 104,130 NM Impairment of assets DSD Segment (1) $ — $ 24,877 0.0 0.8 $ (24,877) NM
Total $ — $ 24,877 0.0 0.6 $ (24,877) NM Depreciation and amortization DSD Segment (1) $ 126,485 $ 120,009 3.8 3.7 $ 6,476 5.4 Warehouse Segment (1) 20,642 20,138 3.4 3.1 504 2.5 Corporate (2) (408) 722 — — (1,130) NM
Total $ 146,719 $ 140,869 3.7 3.6 $ 5,850 4.2 Income from operations DSD Segment (1) $ 202,669 $ 260,495 6.1 7.9 $ (57,826) (22.2)Warehouse Segment (1) 54,738 58,465 9.1 9.1 (3,727) (6.4)Corporate (2) (94,495) (55,070) — — (39,425) (71.6)
Total $ 162,912 $ 263,890 4.2 6.7 $ (100,978) (38.3)Interest expense, net $ 13,619 $ 14,353 0.3 0.4 $ (734) (5.1)Income tax expense (benefit) $ (827) $ 85,761 (0.0) 2.2 $ (86,588) (101.0)Net income $ 150,120 $ 163,776 3.8 4.2 $ (13,656) (8.3)Comprehensive income $ 148,844 $ 177,293 3.8 4.5 $ (28,449) (16.0)
1. As a percentage of revenue within the reporting segment.2. The corporate segment has no revenues.
32

NM – the computation is not meaningful
Percentages may not add due to rounding.
The company’s results of operations, expressed as a percentage of sales, are set forth below for fiscal 2016 and 2015 (by segment):
Percentage of Sales Increase (Decrease) Fiscal 2016 Fiscal 2015 Fiscal 2016 Fiscal 2015 Dollars % 52 weeks 52 weeks 52 weeks 52 weeks (Amounts in thousands, except percentages)
Sales DSD Segment $ 3,284,177 $ 3,179,348 83.6 84.1 $ 104,829 3.3 Warehouse Segment 642,708 599,157 16.4 15.9 43,551 7.3
Total $ 3,926,885 $ 3,778,505 100.0 100.0 $ 148,380 3.9 Materials, supplies, labor and other production costs (exclusive of depreciation and amortization shown separately below) DSD Segment (1) $ 1,569,861 $ 1,532,738 47.8 48.2 $ 37,123 2.4 Warehouse Segment (1) 456,506 430,415 71.0 71.8 26,091 6.1
Total $ 2,026,367 $ 1,963,153 51.6 52.0 $ 63,214 3.2 Selling, distribution and administrative expenses DSD Segment (1) $ 1,308,935 $ 1,224,677 39.9 38.5 $ 84,258 6.9 Warehouse Segment (1) 107,599 96,742 16.7 16.1 10,857 11.2 Corporate (2) 47,702 60,108 — — (12,406) (20.6)
Total $ 1,464,236 $ 1,381,527 37.3 36.6 $ 82,709 6.0 Pension plan settlement loss Corporate (2) $ 6,646 $ — — — $ 6,646 NM
Total $ 6,646 $ — 0.2 — $ 6,646 NM Impairment of assets DSD Segment (1) $ 24,877 $ 3,771 0.8 0.1 $ 21,106 NM
Total $ 24,877 $ 3,771 0.6 0.1 $ 21,106 NM Depreciation and amortization DSD Segment (1) $ 120,009 $ 115,801 3.7 3.6 $ 4,208 3.6 Warehouse Segment (1) 20,138 16,734 3.1 2.8 3,404 20.3 Corporate (2) 722 (360) — — 1,082 NM
Total $ 140,869 $ 132,175 3.6 3.5 $ 8,694 6.6 Income from operations DSD Segment (1) $ 260,495 $ 302,361 7.9 9.5 $ (41,866) (13.8)Warehouse Segment (1) 58,465 55,266 9.1 9.2 3,199 5.8 Corporate (2) (55,070) (59,748) — — 4,678 7.8
Total $ 263,890 $ 297,879 6.7 7.9 $ (33,989) (11.4)Interest expense, net $ 14,353 $ 4,848 0.4 0.1 $ 9,505 196.1 Income tax expense $ 85,761 $ 103,840 2.2 2.7 $ (18,079) (17.4)Net income $ 163,776 $ 189,191 4.2 5.0 $ (25,415) (13.4)Comprehensive income $ 177,293 $ 190,411 4.5 5.0 $ (13,118) (6.9)
1. As a percentage of revenue within the reporting segment.2. The corporate segment has no revenues.
NM – the computation is not meaningful
Percentages may not add due to rounding.
33

Consolidated and Segment Results - Fiscal 2017 compared to Fiscal 2016
Sales
Consolidated
Fiscal 2017 Fiscal 2016 52 weeks 52 weeks $ % $ % % Change
(Amounts inthousands)
(Amounts inthousands)
Branded retail $ 2,299,931 58.7 $ 2,283,526 58.2 0.7 Store branded retail 582,454 14.9 582,280 14.8 — Non-retail and other 1,038,348 26.4 1,061,079 27.0 (2.1)
Total $ 3,920,733 100.0 $ 3,926,885 100.0 (0.2)
The change in sales was attributable to the following:
Percentage point change in sales attributed to: Favorable
(Unfavorable) Pricing/mix 0.6 Volume (0.2)Divestiture (0.6)Total percentage change in sales (0.2)
The divestiture of the mix manufacturing business combined with softness in the fresh bakery category and a competitive marketplace resulted in the overall
sales decline, mostly offset by significant sales growth for our DKB branded organic products. Sales of DKB branded products grew due to volume and priceincreases as well as the introduction of DKB branded breakfast items in the second quarter of fiscal 2017. Branded retail sales increased mainly due to significantgrowth in branded organic products, partially offset by volume declines in other branded retail products, most significantly branded cake, branded buns and rolls,and branded soft variety bread. Non-retail and other sales, which include contract manufacturing, vending and foodservice, decreased largely due to the impact ofthe mix manufacturing business divestiture as well as decreased sales for contract manufacturing and bakery outlet stores, partially offset by increases in vendingsales.
DSD Segment
Fiscal 2017 Fiscal 2016 52 weeks 52 weeks $ % $ % % Change
(Amounts inthousands)
(Amounts inthousands)
Branded retail $ 2,149,966 64.8 $ 2,114,142 64.4 1.7 Store branded retail 470,941 14.2 464,456 14.1 1.4 Non-retail and other 697,656 21.0 705,579 21.5 (1.1)Total $ 3,318,563 100.0 $ 3,284,177 100.0 1.0
The change in sales was attributable to the following:
Percentage point change in sales attributed to: Favorable
(Unfavorable) Pricing/mix 1.3 Volume (0.3)Total percentage change in sales 1.0
Branded retail sales increased due to significant sales growth of the DKB brand since its national rollout in our DSD markets at the beginning of the second
quarter of fiscal 2016 and, to a lesser extent, the introduction of DKB branded breakfast items in the second half of fiscal 2017. Declines in other branded items,most notably buns and rolls, soft variety bread and cake, partially offset the increase in branded retail sales. Increased sales of store branded buns and rolls mostlyresulted in the increase in store branded retail sales. Lower foodservice and bakery outlet store sales primarily resulted in the decrease in non-retail and other sales.
34

Warehouse Segment
Fiscal 2017 Fiscal 2016 52 weeks 52 weeks $ % $ % % Change
(Amounts inthousands)
(Amounts inthousands)
Branded retail $ 149,965 24.9 $ 169,384 26.4 (11.5)Store branded retail 111,513 18.5 117,824 18.3 (5.4)Non-retail and other 340,692 56.6 355,500 55.3 (4.2)Total $ 602,170 100.0 $ 642,708 100.0 (6.3)
The change in sales was attributable to the following:
Percentage point change in sales attributed to: Favorable
(Unfavorable) Pricing/mix (3.3)Volume — Divestiture (3.0)Total percentage change in sales (6.3)
The impact of our mix manufacturing business divestiture, sales declines for warehouse-delivered branded organic breads, and lower snack cake sales
resulted in the sales decrease. The sales related to the mix manufacturing business were included in the non-retail and other category. The significant decline inbranded retail sales was mostly due to volume declines for warehouse-delivered branded organic bread and, to a lesser extent, branded cake. The WarehouseSegment’s Mesa, Arizona plant significantly increased production of DKB organic breads for the DSD Segment during the second quarter of fiscal 2016 and thistrend has continued. These intercompany sales are not included in the Warehouse Segment’s sales above. Volume declines mostly resulted in the decrease inbranded retail cake. Store branded retail sales decreased mainly due to volume decreases in store branded cake. The decrease in non-retail and other sales waslargely due to the mix manufacturing business divestiture and to a much lesser extent lost contract manufacturing business, partially offset by volume gains infoodservice and vending sales.
Materials, Supplies, Labor, and Other Production Costs (exclusive of depreciation and amortization shown separately; as a percent of sales)
Consolidated
Line item component Fiscal 2017% of sales
Fiscal 2016% of sales
Change as a% of sales
Ingredients 24.4 24.5 (0.1)Workforce-related costs 14.6 14.5 0.1 Packaging 4.3 4.4 (0.1)Utilities 1.4 1.5 (0.1)Other 6.5 6.7 (0.2)Total 51.2 51.6 (0.4)
Overall, costs were lower as percent of sales mainly due to a reduction in outside purchases of products and improvements in manufacturing efficiency. As
of the beginning of fiscal 2017, we had completed the transition from purchasing certain DKB bread products from co-manufacturers to producing these itemsourselves due to the added production capacity provided by our Tuscaloosa, Alabama and Mesa, Arizona plants. Also, in the prior year, we incurred $2.2 millionof start-up costs related to converting the Tuscaloosa plant to an all-organic plant. This decrease in outside product purchases is reflected in the other line item inthe table above.
Commodities, such as our baking ingredients, periodically experience price fluctuations. The cost of these inputs may fluctuate widely due to governmentpolicy and regulation, weather conditions, domestic and international demand, or other unforeseen circumstances. We enter into forward purchase agreements andother derivative financial instruments in an effort to manage the impact of such volatility in raw material prices. Any decrease in the availability of theseagreements could increase the effective price of these raw materials to us and significantly affect our earnings. We currently anticipate a significant increase iningredient costs in fiscal 2018 relative to fiscal 2017 primarily resulting from a rise in flour prices.
35

DSD Segment
Line item component Fiscal 2017% of sales
Fiscal 2016% of sales
Change as a% of sales
Ingredients 21.7 21.7 — Workforce-related costs 12.7 12.6 0.1 Packaging 3.0 3.1 (0.1)Utilities 1.3 1.4 (0.1)Other 8.8 9.0 (0.2)Total 47.5 47.8 (0.3)
During the prior fiscal year, a portion of the DKB products were produced by co-manufacturers due to capacity constraints, but in the current fiscal year,
most of these products were produced in two plants in the DSD Segment and the Mesa, Arizona plant in the Warehouse Segment. The other line item reflects thisdecrease in outside purchases of product, somewhat offset by increased intercompany purchases of product from the Warehouse Segment. Additionally, in theprior year, we incurred $2.2 million of start-up costs related to converting the Tuscaloosa, Alabama plant to an all-organic plant.
Warehouse Segment
Line item component Fiscal 2017% of sales
Fiscal 2016% of sales
Change as a% of sales
Ingredients 39.7 39.0 0.7 Workforce-related costs 25.2 23.9 1.3 Packaging 11.7 11.0 0.7 Utilities 1.7 1.7 — Other (6.7) (4.6) (2.1)Total 71.6 71.0 0.6
Ingredient costs were higher as a percent of sales due to increased intercompany sales of organic products to the DSD Segment (ingredient costs with no
associated sales) combined with decreased outside purchases of product (sales with no associated ingredient costs), partially offset by the impact of the mixmanufacturing business divestiture. Workforce-related and packaging costs were also higher as a percent of sales due to increased intercompany sales of product tothe DSD Segment (costs with no associated sales) and significant sales declines. The other line item in the table above mostly reflects the increase in intercompanysales of product to the DSD Segment, largely the DKB organic products, and the decrease in outside purchases of product.
Selling, Distribution and Administrative Expenses (as a percent of sales)
Consolidated
Line item component Fiscal 2017% of sales
Fiscal 2016% of sales
Change as a% of sales
Workforce-related costs 17.4 17.7 (0.3)Distributor distribution fees 13.5 12.7 0.8 Other 7.5 6.9 0.6 Total 38.4 37.3 1.1
The increase in distributor distribution fees as a percent of sales mostly resulted from converting territories from company-operated to independent
distributors, and the national rollout of the DKB brand in our DSD markets at the beginning of the second quarter of fiscal 2016. The DKB products were soldprimarily by warehouse delivery prior to the national rollout. Workforce-related costs were lower due to transitioning to independent distributors, somewhat offsetby higher employee incentive costs. As discussed in the “Matters Affecting Comparability” section above, consulting costs associated with Project Centennialwere $31.0 million higher in the current year as compared to the prior year and are reflected in the other line item in the table above. Cost savings programs thatwe have implemented and the benefit recognized related to the early lease terminations, as discussed in the DSD Segment below, partially offset the overallincrease in selling, distribution and administrative expenses.
36

DSD Segment
Line item component Fiscal 2017% of sales
Fiscal 2016% of sales
Change as a% of sales
Workforce-related costs 17.3 17.8 (0.5)Distributor distribution fees 15.9 15.1 0.8 Other 6.4 7.0 (0.6)Total 39.6 39.9 (0.3)
In the current year, distributor distribution fees were higher as a percentage of sales due to a larger portion of our sales being sold through independent
distributors as we converted territories from company-owned to independent distributors. Additionally, the national rollout of the DKB brand in our DSD marketsat the beginning of the second quarter of fiscal 2016 contributed to the increase year over year. The DKB products were sold mostly by warehouse delivery prior tothe national rollout. The transition to independent distributors resulted in decreased workforce-related costs, somewhat offset by higher employee incentivecosts. The decrease in the other line item as a percentage of sales in the table above resulted from the implementation of cost savings programs and the immediaterecognition of deferred credits, net of lease termination costs, associated with the early termination of certain leases. Additionally, legal costs and relatedsettlements were lower in the current year as compared to the prior year; see Note 23, Commitments and Contingencies , of Notes to Consolidated FinancialStatements of this Form 10-K for additional information.
Warehouse Segment
Line item component Fiscal 2017% of sales
Fiscal 2016% of sales
Change as a% of sales
Workforce-related costs 8.0 7.9 0.1 Freezer storage/rent 2.2 2.0 0.2 Distribution costs (includes freight and shipping and hauling) 1.9 2.1 (0.2)Other 5.2 4.7 0.5 Total 17.3 16.7 0.6
Selling, distribution and administrative expenses increased as a percent of sales primarily from significantly lower sales which spread the costs over a
smaller sales base and higher bad debt expense in the current year. Lower distribution costs due to the divestiture of the mix manufacturing business, anddecreased marketing costs partially offset the overall increase.
Gain on Divestiture, MEPP Costs, Pension Plan Settlement Loss, Restructuring and Related Impairment Charges and Impairment of Assets
Refer to the discussion in the “Matters Affecting Comparability” section above regarding these items.
Depreciation and Amortization Expense
Depreciation expense increased primarily due to the accelerated depreciation of certain leasehold improvements in conjunction with the early leaseterminations as well as the retirement of certain right to use assets, all in the DSD Segment. Amortization expense was higher due to commencing amortization ofcertain trademarks of the DSD Segment in the current fiscal year which had previously been deemed indefinite-lived intangible assets.
The Warehouse Segment’s depreciation and amortization expense increase in dollars and as a percent of sales was mostly due to higher depreciationexpenses on lower sales.
Income from Operations
Operating income (loss)
Favorable(Unfavorable)
Percentage Change as
a % of Sales DSD Segment (22.2) (1.8)Warehouse Segment (6.4) — Unallocated corporate (71.6) NA Consolidated (38.3) (2.5)
NA Not applicable as the corporate segment has no revenues.
37

The significant decrease in the DSD Segment’s operating income as a percent of sales was primarily driven by $80.0 million of restructuring and relatedimpairment charges and $18.3 million of MEPP costs, partially offset by sales growth from positive prici ng/mix, a reduction in outside purchases of product andlegal costs and settlements, and the prior year asset impairment charge of $24.9 million. The Warehouse Segment’s operating income as a percent of sales wasrelatively unchanged year over year; the g ain on divestiture of the mix manufacturing business of $28.9 million in the current fiscal year was offset by $20.1million of restructuring and related impairment charges and sales declines in the current year. The unfavorable change in unallocated corp orate expenses wasprimarily due to consulting costs associated with Project Centennial increasing $31.0 million compared to the prior year, restructuring charges incurred in thecurrent year of $4.0 million and higher employee incentive and legal costs in the current year, partially offset by a $2.0 million decrease in pension plan settlementlosses in the current year.
Net Interest Expense
Net interest expense was relatively unchanged compared to the same period in the prior year. Higher average interest rates on debt outstanding due toconverting certain variable rate debt to longer-term, fixed rate debt with the issuance of the 2026 notes in the third quarter of fiscal 2016 were mostly offset bylower average amounts outstanding under the company’s debt arrangements in the current fiscal year compared to the prior year and the $1.9 million loss on earlyextinguishment recorded in the prior year.
Income Tax Expense (Benefit)
The effective tax rate for fiscal 2017 and fiscal 2016 was -0.6% and 34.4%, respectively. The effective tax rate for fiscal 2017 includes an estimated taxbenefit of $48.2 million due to the Act, which was enacted on December 22, 2017. The revaluation of the company’s net deferred tax liability from 35% to thenewly enacted U.S. corporate income tax rate of 21% primarily resulted in the decrease in the effective rate. Other favorable discrete items, including a netwindfall on stock compensation of $1.0 million, also contributed to the lower rate. Other than tax reform, the most significant differences in the effective rate andthe statutory rate were the benefit from Section 199 qualifying domestic production activities deduction and state income tax expense.
The company recognized a provisional reduction to current tax expense of approximately $8.3 million attributable to pension contributions and bonusdepreciation on certain assets placed into service during 2017. A provisional income tax expense of $0.7 million for the corresponding impact on the 2017 domesticmanufacturing deduction was also recognized. These provisional adjustments resulted in a decrease in income taxes payable of $7.6 million. The income tax effectsfor these positions require further analysis, and the ultimate impact may differ from these provisional amounts due to this analysis, changes to estimates, additionalregulatory guidance that may be issued by federal or state jurisdictions, changes in interpretations and assumptions the company has made, and actions thecompany may take because of tax reform. This analysis is expected to be completed in the second half of 2018.
During the first quarter of fiscal 2018, we anticipate a tax shortfall ranging from $2.1 million to $2.3 million to be recognized in income tax expense in theConsolidated Financial Statements upon the vesting of our performance-based share-based payment awards.
Comprehensive Income
The decrease in comprehensive income year over year resulted primarily from the decline in net income and net changes in the fair value of derivatives of$14.6 million.
Consolidated and Segment Results - Fiscal 2016 compared to Fiscal 2015
Sales
Consolidated
Fiscal 2016 Fiscal 2015 52 weeks 52 weeks $ % $ % % Change
(Amounts inthousands)
(Amounts inthousands)
Branded retail $ 2,283,526 58.2 $ 2,151,514 56.9 6.1 Store branded retail 582,280 14.8 571,827 15.1 1.8 Non-retail and other 1,061,079 27.0 1,055,164 28.0 0.6
Total $ 3,926,885 100.0 $ 3,778,505 100.0 3.9
38

The change in sales was attributable to the following:
Percentage point change in sales attributed to: Favorable
(Unfavorable) Pricing/mix (0.3)Volume 0.2 Acquisitions (until cycled the acquisition date) 4.0 Total percentage change in sales 3.9
The overall sales increase resulted primarily from increased sales due to the DKB and Alpine acquisitions. Declines in pricing/mix were mostly in the non-
retail and other category, partially offset by positive pricing/mix in the branded retail category. Branded retail sales increased due to the contribution from the DKBand Alpine acquisitions, the national rollout of the DKB brand, sales growth in our expansion markets (defined as new markets we entered into in the last fiveyears) and positive pricing/mix. Partially offsetting the increase was softer sales for other branded retail products, most significantly branded soft variety bread,due to softness in the packaged bread category and reductions in the company’s promotional activities in the first half of fiscal 2016. Increases in sales of storebranded variety bread, cake and buns and rolls resulted in the increase in the store branded retail category. The modest increase in non-retail and other sales, whichinclude contract manufacturing, vending and foodservice, was primarily due to volume increases in foodservice and vending, mostly offset by decreases inpricing/mix.
DSD Segment
Fiscal 2016 Fiscal 2015 52 weeks 52 weeks $ % $ % % Change
(Amounts inthousands)
(Amounts inthousands)
Branded retail $ 2,114,142 64.4 $ 2,011,433 63.3 5.1 Store branded retail 464,456 14.1 457,467 14.4 1.5 Non-retail and other 705,579 21.5 710,448 22.3 (0.7)Total $ 3,284,177 100.0 $ 3,179,348 100.0 3.3
The change in sales was attributable to the following:
Percentage point change in sales attributed to: Favorable
(Unfavorable) Pricing/mix 0.7 Volume (1.0)Acquisition (until cycled the acquisition date) 3.6 Total percentage change in sales 3.3
Sales from the DKB acquisition drove the overall sales increase in the DSD Segment, partially offset by softer volume for other products due to the
company’s reduced promotional activity in the first half of fiscal 2016 and overall softness in the packaged bread category. Branded retail sales increased due tothe contribution from the DKB acquisition, the national rollout of the DKB brand, sales growth in our expansion markets and positive pricing/mix. Softer volumefor other branded retail products, with the largest decline in branded soft variety bread, partially offset the increase. The increase in store branded retail sales wasdue primarily to volume increases in store branded variety bread and buns and rolls. The modest decrease in non-retail and other sales, which include contractmanufacturing, vending and foodservice, was primarily due to volume declines.
39

Warehouse Segment
Fiscal 2016 Fiscal 2015 52 weeks 52 weeks $ % $ % % Change
(Amounts inthousands)
(Amounts inthousands)
Branded retail $ 169,384 26.4 $ 140,081 23.4 20.9 Store branded retail 117,824 18.3 114,360 19.1 3.0 Non-retail and other 355,500 55.3 344,716 57.5 3.1 Total $ 642,708 100.0 $ 599,157 100.0 7.3
The change in sales was attributable to the following:
Percentage point change in sales attributed to: Favorable
(Unfavorable) Pricing/mix (2.5)Volume 3.9 Acquisition (until cycled the acquisition date) 5.9 Total percentage change in sales 7.3
The Warehouse Segment’s sales increased significantly due to sales from the Alpine acquisition and to a lesser extent, volume growth in the non-retail and
other category, partially offset by negative pricing/mix. Pricing/mix declined largely due to lower foodservice pricing. Branded retail sales increased due to theAlpine acquisition and less significantly to growth in bakery deli sales, partially offset by declines in branded cake. Increases in sales of store branded cake drovethe increase in the store branded retail category. The increase in non-retail and other sales, which include contract manufacturing, vending and foodservice, wasmainly due to growth in foodservice sales, due to new foodservice products for certain of our customers, and in vending, partially offset by negative pricing/mix.
Materials, Supplies, Labor, and Other Production Costs (exclusive of depreciation and amortization shown separately; as a percent of sales)
Consolidated
Line item component Fiscal 2016% of sales
Fiscal 2015% of sales
Change as a% of sales
Ingredients 24.5 25.3 (0.8)Workforce-related costs 14.5 14.1 0.4 Packaging 4.4 4.7 (0.3)Utilities 1.5 1.6 (0.1)Other 6.7 6.3 0.4 Total 51.6 52.0 (0.4)
Ingredient costs were lower as a percent of sales mainly due to lower prices for non-organic flour, oils and eggs and increased outside purchases of product
(sales with no associated ingredient costs), partially offset by increases in sweetener prices and increased purchases of higher priced organic ingredients due to theDKB and Alpine acquisitions. Outside purchases of products are included in the other line item above and the increase largely relates to purchases of certain DKBproducts from co-manufacturers due to capacity constraints and to a lesser extent outside purchases for other products. As of the end of fiscal 2016, outsidepurchases of product had decreased considerably because of the additional organic production capacity provided by the Alpine plant and the Tuscaloosa, Alabamaplant, which began producing organic bread at the beginning of the second quarter of fiscal 2016. The increase in workforce-related costs as a percent of sales wasmainly due to wage increases on softer non-acquisition related sales and costs associated with the organic plant conversion, partially offset by increases in outsidepurchases of product (sales with no associated workforce-related costs). Lower packaging costs as a percent of sales mainly resulted from lower resin andpaperboard prices and a shift in mix from cake to bread items.
40

Commodities, such as our baking ingredients, periodically experience price fluctuations. The cost of these inputs may fluctuate widely due to government policy and regulation, weather conditions, domestic and international demand, or other unforeseen circumstances. We enter into forward purchase agreements andother derivative financial instruments in an effort to manage the impact of such volatility in raw material prices. Any decrease in the availability of theseagreements and instruments could increase the effective price of these raw materials to us and significantly affect our earnings.
DSD Segment
Line item component Fiscal 2016% of sales
Fiscal 2015% of sales
Change as a% of sales
Ingredients 21.7 22.7 (1.0)Workforce-related costs 12.6 12.3 0.3 Packaging 3.1 3.3 (0.2)Utilities 1.4 1.5 (0.1)Other 9.0 8.4 0.6 Total 47.8 48.2 (0.4)
The decrease in ingredient costs as a percent of sales for the DSD Segment was attributable to lower pricing on non-organic flour, oils and eggs, and
increases in purchases of product from the Warehouse Segment and from co-manufacturers due to capacity constraints (sales with no associated ingredient costs),partially offset by higher sweetener prices. The increase in the other line item reflects these product purchases, largely for certain DKB products. As discussedabove, by the end of fiscal 2016, outside purchases for the DKB products had declined significantly due to the added production capacity provided by ourTuscaloosa, Alabama plant and the Alpine plant in the Warehouse Segment. Wage increases on lower non-acquisition related sales and costs related to convertingthe Tuscaloosa, Alabama plant to an organic facility, drove the increase in workforce-related costs as a percent of sales, partially offset by increased outside andintercompany purchases of product (sales with no associated workforce-related costs).
Warehouse Segment
Line item component Fiscal 2016% of sales
Fiscal 2015% of sales
Change as a% of sales
Ingredients 39.0 38.8 0.2 Workforce-related costs 23.9 23.7 0.2 Packaging 11.0 11.6 (0.6)Utilities 1.7 1.8 (0.1)Other (4.6) (4.1) (0.5)Total 71.0 71.8 (0.8)
The Warehouse Segment’s increase in ingredient costs as a percent of sales was mostly due to increased purchases of higher priced organic ingredients due
to the DKB and Alpine acquisitions, price increases for sweeteners and increased sales of product to the DSD Segment (ingredient costs with no associatedsales). Partially offsetting the increase was lower prices for non-organic flour, eggs and oil and increases in outside purchases of product (sales with no associatedingredient costs). Packaging costs decreased as a percent of sales primarily due to significantly lower packaging costs for Alpine products relative to theWarehouse Segment as a whole and lower paperboard prices. The other line item reflects the increased intercompany sales of product to the DSD Segment, largelythe DKB products, somewhat offset by the increase in outside purchases of product.
Selling, Distribution and Administrative Expenses (as a percent of sales)
Consolidated
Line item component Fiscal 2016% of sales
Fiscal 2015% of sales
Change as a% of sales
Workforce-related costs 17.7 17.1 0.6 Distributor distribution fees 12.7 13.4 (0.7)Other 6.9 6.1 0.8 Total 37.3 36.6 0.7
41

Workforce-related costs increased as a percent of sales primarily due to a smaller portion of sales being sold via independent distributors in fiscal 2016 as
compared to fiscal 2015, partially offset by lower employee incentive costs. The distributor distribution fees decrease correlates to the increase in workforce-related costs. Significantly higher legal and consulting costs as well as increased marketing for the DKB and Alpine brands caused the increase in the other line item component, partially offset by acquisition-related costs of $6.2 million incurred in fiscal 2015. Legal costs increased primarily due to the ongoing andadditional distributor lawsuits, and two legal settlements totaling $10.25 million recorded in the fiscal 2016. See Note 23, Commitments and Contingencies , ofNotes to Consolidated Financial Statements of this Form 10-K for additional information. As discussed in the “Matters Affecting Comparability” section above,consulting costs associated with Project Centennial were $6.3 million in fiscal 2016.
DSD Segment
Line item component Fiscal 2016% of sales
Fiscal 2015% of sales
Change as a% of sales
Workforce-related costs 17.8 17.1 0.7 Distributor distribution fees 15.1 15.9 (0.8)Other 7.0 5.5 1.5 Total 39.9 38.5 1.4
The increase in workforce-related costs as a percentage of sales was due to a smaller portion of sales being sold via independent distributors in fiscal 2016
as compared to fiscal 2015 resulting in the decrease in distributor distribution fees as a percent of sales. The increase in workforce-related costs was somewhatoffset by lower employee incentive costs. The increase in the other line item as a percentage of sales was primarily a result of significantly higher legal costsrelated to the distributor lawsuits and $10.25 million of legal settlements discussed above, and increased corporate overhead charges to the DSD Segment.
Warehouse Segment
Line item component Fiscal 2016% of sales
Fiscal 2015% of sales
Change as a% of sales
Workforce-related costs 7.9 7.9 — Freezer storage/rent 2.0 2.1 (0.1)Distribution costs (includes freight and shipping and hauling) 2.1 2.1 — Other 4.7 4.0 0.7 Total 16.7 16.1 0.6
Higher marketing costs as a percent of sales drove the increase in the other line item, mainly attributable to promotional spending for the Alpine brand, as
well as increased corporate overhead charges to the Warehouse Segment.
Pension Plan Settlement Loss
We recorded settlement charges of $6.6 million during fiscal 2016 related to our pension risk mitigation plan. Refer to the Pension plan settlement lossesdiscussion in the “Matters Affecting Comparability” section above for additional details.
Impairment of Assets
We recorded impairment of assets of $24.9 million and $3.8 million during fiscal years 2016 and 2015, respectively, related to assets in the DSDSegment. Refer to the Impairment of assets discussion in the “Matters Affecting Comparability” section above for additional details.
Depreciation and Amortization Expense
On a consolidated basis, depreciation and amortization expense increased in dollars and as a percent of sales due primarily to amortizing the DKB (includedin the DSD Segment) and Alpine (included in the Warehouse Segment) intangible assets which were acquired in the third and fourth quarter of fiscal 2015,respectively.
The DSD Segment’s depreciation and amortization expense increased in dollars primarily due to the amortization of the acquired DKB intangible assets,partially offset by lower depreciation expense.
42

The Warehouse Segment’s depreciation and amortization expense increase in dollars and as a percent of sales was most ly due to amortization of theacquired Alpine intangible assets.
Income from Operations
Operating income (loss)
Favorable(Unfavorable)
Percentage Change as
a % of Sales DSD Segment (13.8) (1.6)Warehouse Segment 5.8 (0.1)Unallocated corporate 7.8 NA Consolidated (11.4) (1.2)
NA Not applicable as the corporate segment has no revenues.
The unfavorable decrease in the DSD Segment’s income from operations was largely attributable to the higher asset impairment charges, increased legalcosts and related settlements, and higher corporate overhead charges in fiscal 2016 as compared to fiscal 2015. The Warehouse Segment’s operating income wasrelatively consistent with the prior year as a percent of sales. The favorable change in unallocated corporate expenses was mostly due to increased overhead chargesto the segments in fiscal 2016 and $6.2 million of acquisition-related costs incurred in fiscal 2015, partially offset by pension plan settlement losses of $6.6 millionand Project Centennial consulting costs both incurred in fiscal 2016. In fiscal 2015, unanticipated legal costs were not allocated to the segments, but instead wereabsorbed at the corporate level.
Net Interest Expense
The increase in net interest expense resulted from higher average amounts outstanding under the company’s debt arrangements during the current fiscal yearand to a lesser extent decreased interest income in fiscal 2016 due to lower average distributor notes receivable outstanding during the current fiscalyear. Additionally, we expensed $1.9 million of debt issuance costs associated with our existing term loans that were paid off prior to maturity with the proceedsfrom the issuance of the 2026 notes.
Income Taxes
The effective tax rate for fiscal 2016 and fiscal 2015 was 34.4% and 35.4%, respectively. The decrease in the rate was primarily related to an increase in theSection 199 qualifying production activities benefit. The most significant differences in the effective rate and the statutory rate were additions for state incometaxes and the benefit for Section 199 qualifying production activities deduction.
Comprehensive Income
The decrease in comprehensive income resulted from a decrease in net income year over year, partially offset by changes in the fair value of derivativeinstruments.
LIQUIDITY, CAPITAL RESOURCES AND FINANCIAL POSITION
Strategy
We believe our ability to consistently generate cash flows from operating activities to meet our liquidity needs is one of our key financial strengths and wedo not anticipate significant risks to these cash flows in the foreseeable future. Additionally, we strive to maintain a conservative financial position aiming toachieve this through prudent debt reduction and share repurchase programs. We believe having a conservative financial position allows us flexibility to makeinvestments and acquisitions and is a strategic competitive advantage. Currently, our liquidity needs arise primarily from working capital requirements, capitalexpenditures, pension contributions and obligated debt repayments. We believe we currently have access to available funds and financing sources to meet our shortand long-term capital requirements. The company’s strategy for use of its excess cash flows includes:
• implementing our strategies under Project Centennial;
• paying dividends to our shareholders;
• maintaining a conservative financial position;
• making strategic acquisitions;
43

• repurchasing shares of our common stock; and
• making discretionary contributions to our qualified pension plans.
The company leases certain property and equipment under various operating and capital lease arrangements. Most of the operating leases provide thecompany with the option, after the initial lease term, either to purchase the property at the then fair value or renew the lease at the then fair value. The capital leasesprovide the company with the option to purchase the property at a fixed price at the end of the lease term. The company believes the use of leases as a financingalternative places the company in a more favorable position to fulfill its long-term strategy for the use of its cash flow. See Note 14, Debt, Lease and OtherCommitments , of Notes to Consolidated Financial Statements of this Form 10-K for detailed financial information regarding the company’s lease arrangements.
Key items impacting our liquidity, capital resources and financial position in fiscal 2017 and 2016:
Fiscal 2017:
• We generated $297.4 million of net cash from operating activities.
• Divested the non-core mix manufacturing business and received proceeds of $41.2 million.
• We incurred Project Centennial implementation costs, including restructuring cash charges of $34.5 million and non-restructuring consulting costs of$37.3 million.
• We reduced our total debt outstanding $124.0 million.
• We invested in our plants through capital expenditures of $75.2 million (DSD Segment of $64.3 million and Warehouse Segment of $6.9 million).
• We paid dividends to our shareholders of $141.0 million.
• We continued our pension de-risking strategy by offering pension plan participants who have not yet started receiving their payments, the option toreceive their benefits as a single lump sum payment.
Fiscal 2016:
• We generated $356.6 million of net cash from operating activities.
• We issued $400.0 million of the 2026 notes that mature on October 1, 2026.
• We repaid the 2016 and 2013 term loans prior to maturity with proceeds from the 2026 notes.
• We reduced our total debt outstanding $55.6 million.
• We repurchased 6.9 million shares of our common stock for $126.3 million (including shares repurchased under the ASR).
• We invested in our plants through capital expenditures of $101.7 million (DSD Segment of $61.7 million and Warehouse Segment of $16.8 million).
• We paid dividends to our shareholders of $131.1 million.
• We continued our pension de-risking strategy by offering pension plan participants who have not yet started receiving their payments, the option toreceive their benefits as a single lump sum payment.
44

Liquidity Discussion
Flowers Foods’ cash and cash equivalents were $5.1 million at December 30, 2017, $6.4 million at December 31, 2016 and $14.4 million at January 2,2016. The cash and cash equivalents were derived from the activities presented in the table below (amounts in thousands):
Cash flow component Fiscal 2017 Fiscal 2016 Fiscal 2015 Cash flows provided by operating activities $ 297,389 $ 356,562 $ 335,674 Cash disbursed for investing activities (35,395) (76,714) (469,815)Cash provided by (disbursed for) financing activities (263,275) (287,816) 140,996 Total change in cash $ (1,281) $ (7,968) $ 6,855
Cash Flows Provided by Operating Activities. Net cash provided by operating activities included the following items for non-cash adjustments to net
income (amounts in thousands):
Fiscal 2017 Fiscal 2016 Fiscal 2015 Depreciation and amortization $ 146,719 $ 140,869 $ 132,175 Gain on divestiture (28,875) — — Restructuring and related impairment charges 69,601 — — Stock-based compensation 16,093 18,761 15,692 Impairment of assets — 24,877 3,771 Deferred income taxes (61,306) (14,457) 18,293 Pension and postretirement plans (benefit) expense (including settlement losses) (897) 2,238 (5,878)Other non-cash 1,776 9,890 17,431 Net non-cash adjustment to net income $ 143,111 $ 182,178 $ 181,484
• The changes in depreciation and amortization were primarily due to accelerated depreciation of certain leasehold improvements and right to useassets, and amortization of certain trademarks that had previously been indefinite-lived intangible assets.
• Refer to the Restructuring and related impairment charges associated with Project Centennial and the Impairment of assets discussions in the“Matters Affecting Comparability” section above regarding these items.
• For fiscal 2017, deferred income taxes changed due to revaluing the net deferred tax liability due to tax reform and changes in temporary differencesyear over year. For fiscal 2016 and fiscal 2015, the changes resulted from changes in temporary differences year over year.
• Changes in pension and postretirement plan (benefit) expense were primarily due to settlement losses of $4.6 million and $6.6 million in fiscal 2017and 2016, respectively. There were no settlement losses recorded in fiscal 2015.
• Other non-cash items include non-cash interest expense for the amortization of debt discounts and deferred financing costs and gains or losses on thesale of assets.
Net cash for working capital requirements and pension contributions included the following items (amounts in thousands):
Fiscal 2017 Fiscal 2016 Fiscal 2015 Changes in accounts receivable, net $ (11,762) $ (7,888) $ (16,873)Changes in inventories, net (7,801) (1,526) (9,717)Changes in hedging activities, net (15,727) 13,592 (12,818)Changes in other assets (12,557) (3,441) (4,660)Changes in accounts payable 10,840 (519) 14,563 Changes in other accrued liabilities 42,770 11,390 4,504 Qualified pension plan contributions (1,605) (1,000) (10,000)Net changes in working capital and pension contributions $ 4,158 $ 10,608 $ (35,001)
45

• Hedging activities change from market movements that affect the fair value and required collateral of positions and the timing and recognition ofdeferred gains or losses. These changes will occur as part of our hedging program . The change in other assets for fiscal 2017 was primarily due tochanges in income tax receivables.
• During fiscal 2017, we made a voluntary contribution to our defined benefit pension plans of $1.6 million and in January of fiscal 2018 we made a$10.0 million contribution to these plans. We also expect to pay $0.3 million in nonqualified pension benefits from corporate assets in the remainderof fiscal 2018. The company believes its cash flow and balance sheet will allow it to fund future pension needs without adversely affecting thebusiness strategy of the company.
• Changes in employee compensation accruals (including restructuring-related employee termination benefits), accrued MEPP costs, and legal accrualsresulted in the change in other accrued liabilities. In fiscal 2017, we paid $9.0 million of restructuring-related cash charges and in fiscal 2018, $25.5million of restructuring-related cash charges has been or will be paid. Additionally, we anticipate making payments of approximately $29.4 million,including our share of employment taxes, in performance-based cash awards under our bonus plan in the first quarter of fiscal 2018. During fiscal2017 and 2016, the company paid $17.3 million and $25.6 million, respectively, including our share of employment taxes, in performance-basedcash awards under the company’s bonus plan. An additional $0.4 million was paid during fiscal 2017 and 2016, respectively, for our share ofemployment taxes on the vesting of the performance-contingent restricted stock awards in each respective year.
Cash Flows Disbursed for Investing Activities. The table below presents net cash disbursed for investing activities for fiscal 2017, 2016 and 2015(amounts in thousands):
Fiscal 2017 Fiscal 2016 Fiscal 2015 Purchase of property, plant, and equipment $ (75,232) $ (101,727) $ (90,773)Repurchase of independent distributor territories (6,460) (8,871) (14,338)Principal payments from notes receivable 24,875 22,272 23,023 Cash issued for notes receivable (25,566) (8,577) (7,962)Acquisition of businesses, net of cash acquired — — (390,221)Proceeds from divestiture 41,230 — — Proceeds from sale of property, plant and equipment 3,935 17,667 14,324 Acquisition of intangible assets — — (5,000)Other 1,823 2,522 1,132 Net cash disbursed for investing activities $ (35,395) $ (76,714) $ (469,815)
• Capital expenditures by segment were as follows:
Segment Fiscal 2017 Fiscal 2016 Fiscal 2015 DSD Segment $ 64,317 $ 61,669 $ 72,148 Warehouse Segment $ 6,933 $ 16,792 $ 9,596
The company currently estimates capital expenditures of approximately $95.0 million to $105.0 million on a consolidated basis during fiscal 2018.
• We received proceeds, net of a working capital adjustment, of $41.2 million from the divestiture of our Cedar Rapids, Iowa mix manufacturingbusiness in the first quarter of fiscal 2017.
• Cash payments for the DKB acquisition of $282.1 million in the third quarter of fiscal 2015 and for the Alpine acquisition of $109.3 million in thefourth quarter of fiscal 2015 were funded from cash on hand and drawdowns from our existing credit facilities. Additionally, we acquired the RomanMeal trademark for $5.0 million in the first quarter of fiscal 2015.
• Proceeds from the sale of property, plant and equipment in fiscal 2016 and 2015 were primarily related to the sale of certain idle plants, depots andequipment acquired in the Acquired Hostess Bread Assets acquisition as well as other closed plants.
46

Cash Flows Provided by (Disbursed for) Financing Activities. The table below presents net cash provided by (disbursed for) financing activities for fiscal2017, 2016 and 2015 (amounts in thousands):
Fiscal 2017 Fiscal 2016 Fiscal 2015 Dividends paid, including dividends on share-based payment awards $ (140,982) $ (131,073) $ (120,442)Exercise of stock options 19,313 27,631 19,617 Payments for financing fees (729) (4,380) (646)Stock repurchases, including accelerated stock repurchases (2,671) (126,300) (6,858)Change in bank overdrafts (14,206) 1,914 2,325 Net debt and capital lease obligation changes (124,000) (55,608) 247,000 Net cash provided by (disbursed for) financing activities $ (263,275) $ (287,816) $ 140,996
• Our dividend payout rate increased 7.2% from fiscal 2016 to fiscal 2017 and 10.1% from fiscal 2015 to fiscal 2016. While there are no requirements
to increase the dividend payout we have shown a recent historical trend to do so. Should this continue in the future we will have additional cashneeds to meet these expected dividend payouts.
• As of December 30, 2017, there were nonqualified stock option grants of 0.1 million shares that were exercisable. These have a remainingcontractual life of approximately 0.11 years and a weighted average exercise price of $10.87 per share. At this time, it is expected that these shareswill be exercised before the contractual term expires and such exercises may provide an increase to the cash provided by financing activities.
• Stock repurchase decisions are made based on our stock price, our belief of relative value, and our cash projections at any given time. In fiscal 2016,we repurchased 6.9 million shares of our common stock, of which 6.5 million were repurchased under the ASR program. See Note 17, Stockholders’Equity , of Notes to Consolidated Financial Statements of this Form 10-K for additional information.
• Net debt obligations increased in fiscal 2015 primarily due to funding the DKB and Alpine acquisitions, net of repayments we made during the year.
Capital Structure
Long-term debt and capital lease obligations were as follows at December 30, 2017 and December 31, 2016. For a detailed description of our debt andcapital lease obligations and information regarding our credit ratings, distributor arrangements, deferred compensation, and guarantees and indemnificationobligations, see Note 14, Debt, Lease and Other Commitments , of Notes to Consolidated Financial Statements of this Form 10-K: Interest Rate at Final Balance at Fixed or December 30, 2017 Maturity December 30, 2017 December 31, 2016 Variable Rate (Amounts in thousands) 2026 senior notes 3.50% 2026 $ 394,978 $ 394,406 Fixed Rate2022 senior notes 4.38% 2022 397,941 397,458 Fixed RateUnsecured credit facility 4.60% 2022 — 24,000 Variable RateAccounts receivable securitization 2.41% 2019 — 95,000 Variable RateCapital lease obligations 3.50% 2025 27,150 30,427 Other notes payable 2.10% 2020 12,167 16,866 832,236 958,157 Current maturities of long-term debt and capital lease obligations 12,095 11,490 Long-term debt and capital lease obligations $ 820,141 $ 946,667
47
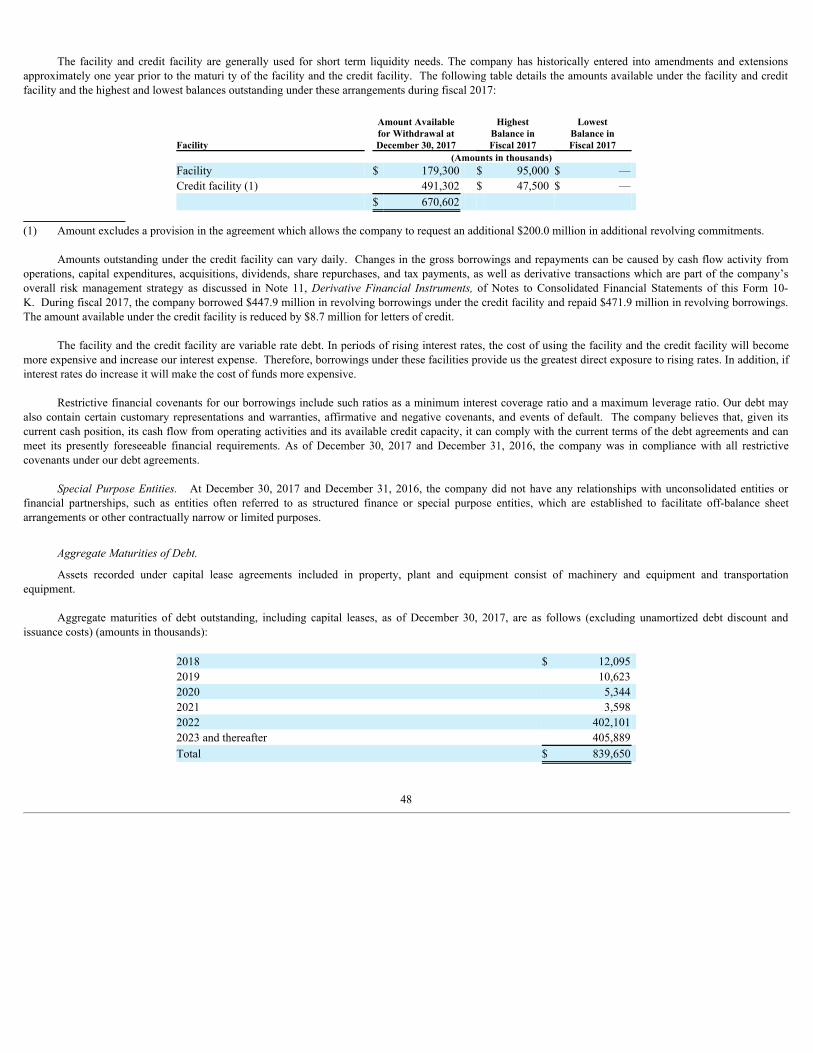
The facility and credit facility are generally used for short term liquidity needs. The company has historically entered into amendments and extensionsapproximately one year prior to the maturi ty of the facility and the credit facility. The following table details the amounts available under the facility and creditfacility and the highest and lowest balances outstanding under these arrangements during fiscal 2017:
Amount Available Highest Lowest for Withdrawal at Balance in Balance in Facility December 30, 2017 Fiscal 2017 Fiscal 2017 (Amounts in thousands) Facility $ 179,300 $ 95,000 $ — Credit facility (1) 491,302 $ 47,500 $ — $ 670,602
(1) Amount excludes a provision in the agreement which allows the company to request an additional $200.0 million in additional revolving commitments.
Amounts outstanding under the credit facility can vary daily. Changes in the gross borrowings and repayments can be caused by cash flow activity fromoperations, capital expenditures, acquisitions, dividends, share repurchases, and tax payments, as well as derivative transactions which are part of the company’soverall risk management strategy as discussed in Note 11, Derivative Financial Instruments, of Notes to Consolidated Financial Statements of this Form 10-K. During fiscal 2017, the company borrowed $447.9 million in revolving borrowings under the credit facility and repaid $471.9 million in revolving borrowings.The amount available under the credit facility is reduced by $8.7 million for letters of credit.
The facility and the credit facility are variable rate debt. In periods of rising interest rates, the cost of using the facility and the credit facility will becomemore expensive and increase our interest expense. Therefore, borrowings under these facilities provide us the greatest direct exposure to rising rates. In addition, ifinterest rates do increase it will make the cost of funds more expensive.
Restrictive financial covenants for our borrowings include such ratios as a minimum interest coverage ratio and a maximum leverage ratio. Our debt mayalso contain certain customary representations and warranties, affirmative and negative covenants, and events of default. The company believes that, given itscurrent cash position, its cash flow from operating activities and its available credit capacity, it can comply with the current terms of the debt agreements and canmeet its presently foreseeable financial requirements. As of December 30, 2017 and December 31, 2016, the company was in compliance with all restrictivecovenants under our debt agreements.
Special Purpose Entities. At December 30, 2017 and December 31, 2016, the company did not have any relationships with unconsolidated entities orfinancial partnerships, such as entities often referred to as structured finance or special purpose entities, which are established to facilitate off-balance sheetarrangements or other contractually narrow or limited purposes.
Aggregate Maturities of Debt.
Assets recorded under capital lease agreements included in property, plant and equipment consist of machinery and equipment and transportationequipment.
Aggregate maturities of debt outstanding, including capital leases, as of December 30, 2017, are as follows (excluding unamortized debt discount andissuance costs) (amounts in thousands):
2018 $ 12,095 2019 10,623 2020 5,344 2021 3,598 2022 402,101 2023 and thereafter 405,889 Total $ 839,650
48
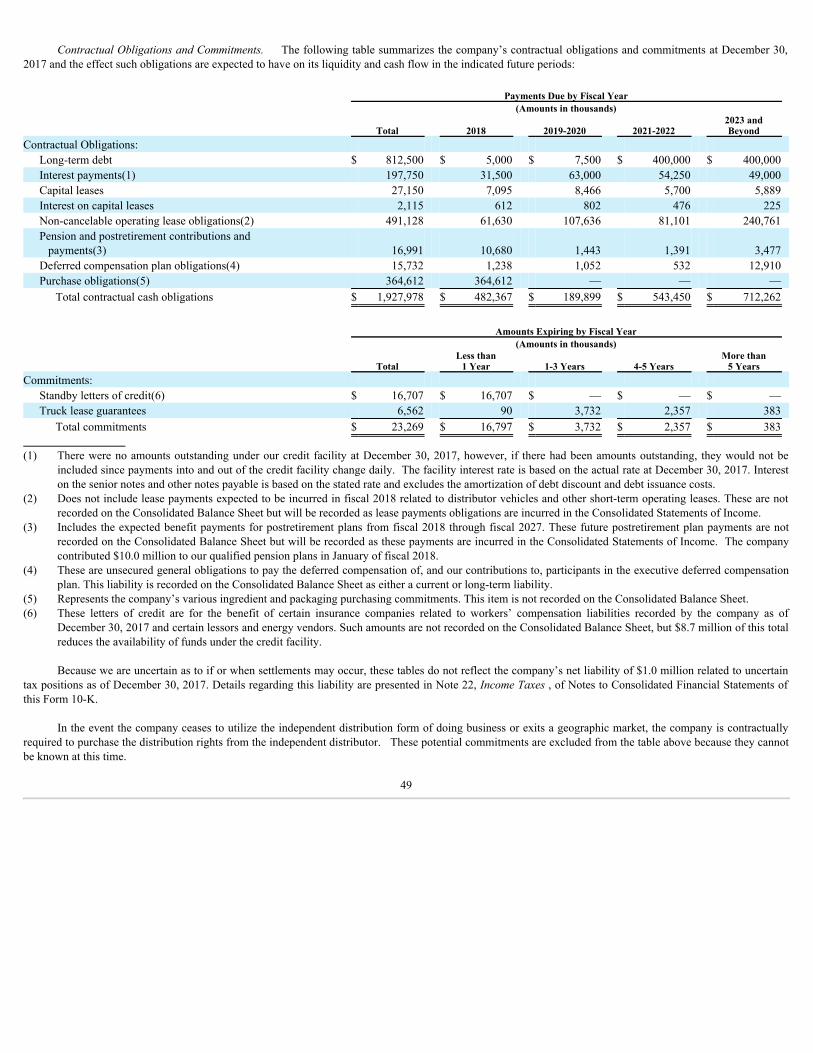
Contractual Obligations and Commitments. The following table summarizes the company’s contractual obligations and commitments at December 30,
2017 and the effect such obligations are expected to have on its liquidity and cash flow in the indicated future periods:
Payments Due by Fiscal Year (Amounts in thousands)
Total 2018 2019-2020 2021-2022 2023 andBeyond
Contractual Obligations: Long-term debt $ 812,500 $ 5,000 $ 7,500 $ 400,000 $ 400,000 Interest payments(1) 197,750 31,500 63,000 54,250 49,000 Capital leases 27,150 7,095 8,466 5,700 5,889 Interest on capital leases 2,115 612 802 476 225 Non-cancelable operating lease obligations(2) 491,128 61,630 107,636 81,101 240,761 Pension and postretirement contributions and payments(3) 16,991 10,680 1,443 1,391 3,477 Deferred compensation plan obligations(4) 15,732 1,238 1,052 532 12,910 Purchase obligations(5) 364,612 364,612 — — —
Total contractual cash obligations $ 1,927,978 $ 482,367 $ 189,899 $ 543,450 $ 712,262
Amounts Expiring by Fiscal Year (Amounts in thousands)
Total Less than
1 Year 1-3 Years 4-5 Years More than
5 Years Commitments:
Standby letters of credit(6) $ 16,707 $ 16,707 $ — $ — $ — Truck lease guarantees 6,562 90 3,732 2,357 383
Total commitments $ 23,269 $ 16,797 $ 3,732 $ 2,357 $ 383
(1) There were no amounts outstanding under our credit facility at December 30, 2017, however, if there had been amounts outstanding, they would not beincluded since payments into and out of the credit facility change daily. The facility interest rate is based on the actual rate at December 30, 2017. Intereston the senior notes and other notes payable is based on the stated rate and excludes the amortization of debt discount and debt issuance costs.
(2) Does not include lease payments expected to be incurred in fiscal 2018 related to distributor vehicles and other short-term operating leases. These are notrecorded on the Consolidated Balance Sheet but will be recorded as lease payments obligations are incurred in the Consolidated Statements of Income.
(3) Includes the expected benefit payments for postretirement plans from fiscal 2018 through fiscal 2027. These future postretirement plan payments are notrecorded on the Consolidated Balance Sheet but will be recorded as these payments are incurred in the Consolidated Statements of Income. The companycontributed $10.0 million to our qualified pension plans in January of fiscal 2018.
(4) These are unsecured general obligations to pay the deferred compensation of, and our contributions to, participants in the executive deferred compensationplan. This liability is recorded on the Consolidated Balance Sheet as either a current or long-term liability.
(5) Represents the company’s various ingredient and packaging purchasing commitments. This item is not recorded on the Consolidated Balance Sheet.(6) These letters of credit are for the benefit of certain insurance companies related to workers’ compensation liabilities recorded by the company as of
December 30, 2017 and certain lessors and energy vendors. Such amounts are not recorded on the Consolidated Balance Sheet, but $8.7 million of this totalreduces the availability of funds under the credit facility.
Because we are uncertain as to if or when settlements may occur, these tables do not reflect the company’s net liability of $1.0 million related to uncertaintax positions as of December 30, 2017. Details regarding this liability are presented in Note 22, Income Taxes , of Notes to Consolidated Financial Statements ofthis Form 10-K.
In the event the company ceases to utilize the independent distribution form of doing business or exits a geographic market, the company is contractuallyrequired to purchase the distribution rights from the independent distributor. These potential commitments are excluded from the table above because they cannotbe known at this time.
49

Total stockholders’ equity was as follows at December 30, 2017 and December 31, 2016:
Balance at December 30, 2017 December 31, 2016 (Amounts in thousands) Total stockholders' equity $ 1,250,677 $ 1,210,080
Stock Repurchase Plan. The Board has approved a plan that currently authorizes share repurchases of up to 74.6 million shares of the company’s common
stock. At the close of the company’s fourth quarter on December 30, 2017, 6.6 million shares remained under the existing authorization. Under the plan, thecompany may repurchase its common stock in open market or privately negotiated transactions or under an accelerated repurchase program at such times and atsuch prices as determined to be in the company’s best interest. These purchases may be commenced or suspended without prior notice depending on then-existingbusiness or market conditions and other factors. During fiscal 2017, 0.1 million shares, at a cost of $2.7 million, of the company’s common stock were repurchasedunder the plan and during fiscal 2016, 6.9 million shares at a cost of $126.3 million were repurchased under the plan, including 6.5 million of share repurchasesunder an ASR agreement with Deutsche Bank AG. From the inception of the plan through December 30, 2017, 67.9 million shares, at a cost of $633.1 million,have been repurchased. There were no repurchases of the company’s common stock during the fourth quarter of fiscal 2017.
New Accounting Pronouncements Not Yet Adopted
See Note 3, Recent Accounting Pronouncements, of Notes to Consolidated Financial Statements of this Form 10-K regarding this information. Item 7A. Quantitative and Qualitative Disclosures About Market Risk
The company uses derivative financial instruments as part of an overall strategy to manage market risk. The company uses forwards, futures, swaps, andoption contracts to hedge existing or future exposure to changes in interest rates and commodity prices. The company does not enter into these derivative financialinstruments for trading or speculative purposes. If actual market conditions are less favorable than those anticipated, interest rates and commodity prices couldincrease significantly, adversely affecting our interest costs and the margins from the sale of our products.
Commodity Price Risk
The company enters into commodity forward, futures, option, and swap contracts for wheat and, to a lesser extent, other commodities in an effort to providea predictable and consistent commodity price and thereby reduce the impact of market volatility in its raw material and packaging prices. As of December 30, 2017,the company’s hedge portfolio contained commodity derivatives with a fair value of $(10.6) million. Of this fair value, $(10.6) million is based on quoted marketprices. Approximately $(10.0) million relates to instruments that will be utilized in fiscal 2018. The remaining $(0.6) million will be primarily utilized in fiscal2019.
A sensitivity analysis has been prepared to quantify the company’s potential exposure to commodity price risk with respect to its derivative portfolio. Basedon the company’s derivative portfolio as of December 30, 2017, a hypothetical ten percent change in commodity prices would increase or decrease the fair value ofthe derivative portfolio by $14.1 million. The analysis disregards changes in the exposures inherent in the underlying hedged items; however, the company expectsthat any increase or decrease in the fair value of the portfolio would be substantially offset by increases or decreases in raw material and packaging prices.
Item 8. Financial Statements and Supplementary Data
Refer to the Index to Consolidated Financial Statements and the Financial Statement Schedule for the required information.
Item 9. Changes in and Disagreements with Accountants on Accounting and Financial Disclosure
None.
50

Item 9A. Control s and Procedures
Management’s Evaluation of Disclosure Controls and Procedures:
We have established and maintain a system of disclosure controls and procedures that are designed to ensure that material information relating to thecompany, which is required to be timely disclosed by us in reports that we file or submit under the Securities Exchange Act of 1934 (“Exchange Act”), isaccumulated and communicated to management in a timely fashion and is recorded, processed, summarized and reported within the time periods specified by theSEC’s rules and forms. An evaluation of the effectiveness of the design and operation of our disclosure controls and procedures (as defined in Rule 13a-15(e) underthe Exchange Act) was performed as of the end of the period covered by this annual report. This evaluation was performed under the supervision and with theparticipation of management, including our CEO, Chief Financial Officer (“CFO”), and Chief Accounting Officer (“CAO”).
Based upon that evaluation, our CEO, CFO, and CAO have concluded that these disclosure controls and procedures were effective as of the end of theperiod covered by this annual report.
Management’s Report on Internal Control Over Financial Reporting:
Our management is responsible for establishing and maintaining adequate internal control over financial reporting, as such term is defined in Rule 13a-15(f)under the Exchange Act. Under the supervision and with the participation of our management, including our CEO, CFO, and CAO, we conducted an evaluation ofthe effectiveness of our internal control over financial reporting based on the framework in “Internal Control — Integrated Framework (2013)” issued by theCommittee of Sponsoring Organizations of the Treadway Commission. Based on our evaluation our management concluded that our internal control over financialreporting was effective as of December 30, 2017.
The effectiveness of our internal control over financial reporting as of December 30, 2017 has been audited by PricewaterhouseCoopers LLP, anindependent registered public accounting firm, as stated in its report which is included herein.
Changes in Internal Control Over Financial Reporting:
There were no changes in our internal control over financial reporting that occurred during our last fiscal quarter that have materially affected, or arereasonably likely to materially affect, our internal control over financial reporting.
Item 9B. Other Information
None.
51

PART III
Item 10. Directors, Executive Officers and Corporate Governance
The information required by this item with respect to directors of the company is incorporated herein by reference to the information set forth under thecaptions “Proposal I — Election of Directors”, “Directors and Corporate Governance”, “Corporate Governance — The Board of Directors and Committees of theBoard of Directors”, “Corporate Governance — Relationships Among Certain Directors”, “Audit Committee Report” and “Section 16(a) Beneficial OwnershipReporting Compliance” in the company’s definitive proxy statement for the 2018 Annual Meeting of Shareholders expected to be filed with the SEC in April (the“proxy”). The information required by this item with respect to executive officers of the company is set forth in Part I of this Form 10-K.
We have adopted the Flowers Foods, Inc. Code of Business Conduct and Ethics for Officers and Members of the Board of Directors (the “Code of BusinessConduct and Ethics”), which applies to all of our directors and executive officers. The Code of Business Conduct and Ethics is publicly available on our website atwww.flowersfoods.com in the “Corporate Governance” section of the “Investor Center” tab. If we make any substantive amendments to our Code of BusinessConduct and Ethics or we grant any waiver, including any implicit waiver, from a provision of the Code of Business Conduct and Ethics, that applies to any of ourdirectors or executive officers, including our principal executive officer, principal financial officer or principal accounting officer, we intend to disclose the natureof the amendment or waiver on our website at the same location. Alternatively, we may elect to disclose the amendment or waiver in a current report on Form 8-Kfiled with the SEC.
Our President and CEO certified to the NYSE on June 23, 2017 pursuant to Section 303A.12 of the NYSE’s listing standards, that he was not aware of anyviolation by Flowers Foods of the NYSE’s corporate governance listing standards as of that date.
Item 11. Executive Compensation
The information required by this item is incorporated herein by reference to the information set forth under the caption “Executive Compensation” in theproxy.
Item 12. Security Ownership of Certain Beneficial Owners and Management and Related Stockholder Matters
See Item 5 of this Form 10-K for information regarding Securities Authorized for Issuance under Equity Compensation Plans. The remaining informationrequired by this item is incorporated herein by reference to the information set forth under the caption “Security Ownership of Certain Beneficial Owners andManagement” in the proxy.
Item 13. Certain Relationships and Related Transactions, and Director Independence
The information required by this item is incorporated herein by reference to the information set forth under the caption “CorporateGovernance — Determination of Independence” and “Transactions with Management and Others” in the proxy.
Item 14. Principal Accounting Fees and Services
The information required by this item is incorporated herein by reference to the information set forth under the caption “Fiscal 2017 and Fiscal 2016 AuditFirm Fee Summary” in the proxy.
52

PART IV
Item 15. Exhibits and Financial Statement Schedules
(a) List of documents filed as part of this report.
1. Financial Statements of the Registrant
Report of Independent Registered Public Accounting Firm.
Consolidated Balance Sheets at December 30, 2017 and December 31, 2016.
Consolidated Statements of Income for Fiscal 2017, Fiscal 2016, and Fiscal 2015.
Consolidated Statements of Comprehensive Income for Fiscal 2017, Fiscal 2016, and Fiscal 2015.
Consolidated Statements of Changes in Stockholders’ Equity for Fiscal 2017, Fiscal 2016, and Fiscal 2015.
Consolidated Statements of Cash Flows for Fiscal 2017, Fiscal 2016, and Fiscal 2015.
Notes to Consolidated Financial Statements.
2. Exhibits. The following documents are filed as exhibits hereto:
53

EXHIBIT INDEX
Exhibit Name of Exhibit
No
2.1 — Distribution Agreement, dated as of October 26, 2000, by and between Flowers Industries, Inc. and Flowers Foods, Inc. (Incorporated byreference to Exhibit 2.1 to Flowers Foods’ Registration Statement on Form 10, dated December 1, 2000, File No. 1-16247).
2.2 — Amendment No. 1 to Distribution Agreement, dated as of March 12, 2001, by and between Flowers Industries, Inc. and Flowers Foods, Inc.(Incorporated by reference to Exhibit 2.2 to Flowers Foods’ Annual Report on Form 10-K, dated March 30, 2001, File No. 1-16247).
2.3 — Acquisition Agreement, dated as of May 31, 2012, by and among Flowers Foods, Inc., Lobsterco I, LLC, Lepage Bakeries, Inc., RAL, Inc.,Bakeast Company, Bakeast Holdings, Inc., and the equityholders named therein (Incorporated by reference to Exhibit 2.1 to Flowers Foods’Current Report on Form 8-K, dated June 1, 2012, File No. 1-16247).
2.4 — Agreement and Plan of Merger, dated as of May 31, 2012, by and among Flowers Foods, Inc., Lobsterco II, LLC, Aarow Leasing, Inc., TheEverest Company, Incorporated and the shareholders named therein (Incorporated by reference to Exhibit 2.2 to Flowers Foods’ CurrentReport on Form 8-K, dated June 1, 2012, File No. 1-16247).
2.5 — Asset Purchase Agreement, dated as of January 11, 2013, by and among Hostess Brands, Inc., Interstate Brands Corporation, IBC SalesCorporation, Flowers Foods, Inc. and FBC Georgia, LLC (Incorporated by reference to Exhibit 2.1 to Flowers Foods’ Current Report onForm 8-K, dated January 14, 2013, File No. 1-16247).
2.6 **
Stock Purchase Agreement, dated as of August 12, 2015, by and among AVB, Inc., Goode Seed Holdings, LLC, Goode Seed Co-Invest,LLC, Glenn Dahl, trustee of the Glenn Dahl Family Trust, U/A/D November 28, 2012, David J. Dahl, trustee of the David Dahl FamilyTrust, U/A/D May 1, 2012, Shobi L. Dahl, trustee of the Shobi Dahl Family Trust, U/A/D, December 16, 2011, Flowers Bakeries, LLC,Flowers Foods, Inc., and Goode Seed Holdings, LLC, as shareholders’ representative (Incorporated by reference to Exhibit 2.6 to FlowersFoods' Quarterly Report on Form 10-Q, dated November 12, 2015, File No. 1-16247).
3.1 — Restated Articles of Incorporation of Flowers Foods, Inc., as amended through June 5, 2015 (Incorporated by reference to Exhibit 3.1 toFlowers Foods’ Current Report on Form 8-K, dated June 10, 2015, File No. 1-16247).
3.2 — Amended and Restated Bylaws of Flowers Foods, Inc., as amended through June 5, 2015 (Incorporated by reference to Exhibit 3.2 toFlowers Foods’ Current Report on Form 8-K, dated June 10, 2015, File No. 1-16247).
4.1 — Form of Share Certificate of Common Stock of Flowers Foods, Inc. (Incorporated by reference to Exhibit 4.1 to Flowers Foods’ AnnualReport on Form 10-K, dated February 29, 2012, File No. 1-16247).
4.2 — Indenture, dated as of April 3, 2012, by and between Flowers Foods, Inc. and Wells Fargo Bank, National Association, as trustee(Incorporated by reference to Exhibit 4.1 to Flowers Foods’ Current Report on Form 8-K, dated April 3, 2012, File No. 1-16247).
4.3 — Officer’s Certificate pursuant to Section 2.02 of the Indenture (Incorporated by reference to Exhibit 4.2 to Flowers Foods’ Current Reporton Form 8-K, dated April 3, 2012, File No. 1-16247).
4.4 — Form of 4.375% Senior Notes due 2022 (Incorporated by reference to Exhibit 4.3 to Flowers Foods’ Current Report on Form 8-K, datedApril 3, 2012, File No. 1-16247).
4.5 — Flowers Foods, Inc. 401(k) Retirement Savings Plan, as amended through December 17, 2013 (Incorporated by reference to Exhibit 4.1 toFlowers Foods’ Registration Statement on Form S-8, dated May 21, 2014, File No. 333-196125).
4.6 — Officer’s Certificate pursuant to Section 2.02 of the Indenture (Incorporated by reference to Exhibit 4.2 to Flowers Foods’ Current Reporton Form 8-K, dated September 28, 2016, File No. 1-16247).
4.7 — Form of 3.500% Senior Notes due 2026 (Incorporated by reference to Exhibit 4.3 to Flowers Foods’ Current Report on Form 8-K, datedSeptember 28, 2016, File No. 1-16247).
10.1 —
Amended and Restated Credit Agreement, dated as of May 20, 2011, by and among, Flowers Foods, Inc., the Lenders party thereto fromtime to time, Cooperative Centrale Raiffeisen-Boerenleenbank B.A., “Rabobank Nederland”, New York Branch, Branch Banking and TrustCompany, and Regions Bank, as co-documentation agents, Bank of America, N.A., as syndication agent, and Deutsche Bank AG New YorkBranch, as administrative agent (Incorporated by reference to Exhibit 10.1 to Flowers Foods’ Current Report on Form 8-K, dated May 26,2011, File No. 1-16247).
10.2 — First Amendment to Amended and Restated Credit Agreement, dated as of November 16, 2012, by and among Flowers Foods, Inc., theLenders party thereto and Deutsche Bank AG, New York Branch, as administrative agent, swingline lender and issuing lender (Incorporatedby reference to Exhibit 10.1 to Flowers Foods’ Current Report on Form 8-K, dated November 21, 2012, File No. 1-16247).
54

Exhibit Name of Exhibit
No
10.3 — Second Amendment to Amended and Restated Credit Agreement, dated as of April 5, 2013, by and among Flowers Foods, Inc., the Lendersparty thereto and Deutsche Bank AG New York Branch, as administrative agent, swingline lender and issuing lender (Incorporated byreference to Exhibit 10.3 to Flowers Foods’ Current Report on Form 8-K, dated April 10, 2013, File No. 1-16247).
10.4 — Third Amendment to Amended and Restated Credit Agreement, dated as of February 14, 2014, by and among Flowers Foods, Inc., theLenders party thereto and Deutsche Bank AG New York Branch, as administrative agent, swingline lender and issuing lender (Incorporatedby reference to Exhibit 10.2 to Flowers Foods’ Current Report on Form 8-K, dated February 18, 2014, File No. 1-16247).
10.5 — Fourth Amendment to Amended and Restated Credit Agreement, dated as of April 21, 2015, by and among Flowers Foods, Inc., theLenders party thereto and Deutsche Bank AG New York Branch, as administrative agent, the swingline lender and issuing lender(Incorporated by reference to Exhibit 10.5 to Flowers Foods' Quarterly Report on Form 10-Q, dated May 28, 2015, File No. 1-16247).
10.6 — Fifth Amendment to Amended and Restated Credit Agreement, dated as of April 19, 2016, among Flowers Foods, Inc., the Lenders partythereto and Deutsche Bank AG New York Branch, as administrative agent, the swingline lender and issuing lender (Incorporated byreference to Exhibit 10.3 to Flowers Foods' Current Report on Form 8-K, dated April 22, 2016, File No. 1-16247).
10.7 — Sixth Amendment to Amended and Restated Credit Agreement, dated as of November 29, 2017, among Flowers Foods, Inc., the Lendersparty thereto and Deutsche Bank AG New York Branch, as administrative agent, the swingline lender and issuing lender (Incorporated byreference to Exhibit 10.1 to Flowers Foods' Current Report on Form 8-K, dated November 30, 2017, File No. 1-16247).
10.8 —
Credit Agreement, dated as of April 5, 2013, by and among Flowers Foods, Inc., the Lenders party thereto from time to time, BranchBanking and Trust Company, Coöperatieve Centrale Raiffeisen-Boerenleenbank B.A., “Rabobank Nederland”, New York Branch, andRegions Bank, as co-documentation agents, Bank of America, N.A., as syndication agent, and Deutsche Bank AG New York Branch, asadministrative agent (Incorporated by reference to Exhibit 10.1 to Flowers Foods’ Current Report on Form 8-K, dated April 10, 2013, FileNo. 1-16247).
10.9 — First Amendment to Credit Agreement, dated as of February 14, 2014, by and among Flowers Foods, Inc., the lenders party thereto andDeutsche Bank AG New York Branch, as administrative agent (Incorporated by reference to Exhibit 10.1 to Flowers Foods’ Current Reporton Form 8-K, dated February 18, 2014, File No. 1-16247).
10.10 — Second Amendment to Credit Agreement, dated as of April 19, 2016, among Flowers Foods, Inc., the lenders party thereto and DeutscheBank AG New York Branch, as administrative agent (Incorporated by reference to Exhibit 10.2 to Flowers Foods' Current Report on Form8-K, dated April 22, 2016, File No. 1-16247).
10.11 —
Receivables Loan, Security and Servicing Agreement, dated as of July 17, 2013, by and among Flowers Finance II, LLC, Flowers Foods,Inc., Nieuw Amsterdam Receivables Corporation, Coöperatieve Centrale Raiffeisen-Boerenleenbank B.A., “Rabobank Nederland,” NewYork Branch, as facility agent and as a committed lender, certain financial institutions party thereto from time to time, and CoöperatieveCentrale Raiffeisen-Boerenleenbank B.A., “Rabobank Nederland”, New York Branch, as administrative agent (Incorporated by referenceto Exhibit 10.1 to Flowers Foods’ Current Report on Form 8-K, dated July 22, 2013, File No. 1-16247).
10.12 —
First Amendment to Receivables Loan, Security and Servicing Agreement, dated as of August 7, 2014, by and among Flowers Finance II,LLC, Flowers Foods, Inc., Nieuw Amsterdam Receivables Corporation, Coöperatieve Centrale Raiffeisen-Boerenleenbank B.A.,“Rabobank Nederland,” New York Branch, as facility agent and as a committed lender, and Coöperatieve Centrale Raiffeisen-Boerenleenbank B.A., “Rabobank Nederland”, New York Branch, as administrative agent (Incorporated by reference to Exhibit 10.1 toFlowers Foods’ Current Report on Form 8-K, dated August 12, 2014, File No. 1-16247).
10.13 —
Second Amendment to Receivables Loan, Security and Servicing Agreement, dated as of December 17, 2014, by and among FlowersFinance II, LLC, Flowers Foods, Inc., Nieuw Amsterdam Receivables Corporation, Coöperatieve Centrale Raiffeisen-Boerenleenbank B.A.,“Rabobank,” New York Branch, as facility agent and as a committed lender, and Coöperatieve Centrale Raiffeisen-Boerenleenbank B.A.,“Rabobank”, New York Branch, as administrative agent (Incorporated by reference to Exhibit 10.9 to Flowers Foods’ Annual Report onForm 10-K, dated February 25, 2015, File No. 1-16247).
10.14 —
Third Amendment and Waiver to Receivables Loan, Security and Servicing Agreement, dated as of August 20, 2015, by and amongFlowers Finance II, LLC, Flowers Foods, Inc., Nieuw Amsterdam Receivables Corporation B.V., Coöperatieve Centrale Raiffeisen-Boerenleenbank B.A., “Rabobank”, New York Branch, as facility agent and as a committed lender, PNC Bank, National Association, asfacility agent and as a committed lender, and Coöperatieve Centrale Raiffeisen-Boerenleenbank B.A., “Rabobank,” New York Branch, asadministrative agent (Incorporated by reference to Exhibit 10.11 to Flowers Foods' Quarterly Report on Form 10-Q, dated November 12,2015, File No. 1-16247).
55

Exhibit Name of Exhibit
No
10.15 —
Fourth Amendment to Receivables Loan, Security and Servicing Agreement, dated as of September 30, 2016, by and among FlowersFinance II, LLC, Flowers Foods, Inc., Nieuw Amsterdam Receivables Corporation B.V., Coöperatieve Rabobank U.A., as facility agent andas a committed lender, PNC Bank, National Association, as facility agent and as a committed lender, and Coöperatieve Rabobank U.A.,New York Branch, as administrative agent (Incorporated by reference to Exhibit 10.1 to Flowers Foods' Current Report on Form 8-K, datedOctober 3, 2016, File No. 1-16247).
10.16 —
Fifth Amendment to Receivables Loan, Security and Servicing Agreement, dated as of September 28, 2017, among Flowers Finance II,LLC, Flowers Foods, Inc., Nieuw Amsterdam Receivables Corporation B.V., Coöperatieve Rabobank U.A., as facility agent and as acommitted lender, PNC Bank, National Association, as facility agent and as a committed lender, and Coöperatieve Rabobank U.A., NewYork Branch, as administrative agent (Incorporated by reference to Exhibit 10.1 to Flowers Foods’ Quarterly Report on Form 10-Q, datedNovember 8, 2017, File No. 1-16247).
10.17 —
Credit Agreement, dated as of April 19, 2016, among Flowers Foods, Inc., the Lenders party thereto from time to time, Deutsche BankSecurities Inc., as lead arranger and bookrunner, Bank of America, N.A., Branch Banking and Trust Company, Coöperatieve RabobankU.A., New York Branch, PNC Bank, National Association and Wells Fargo Bank, National Association, as co-documentation agents,Deutsche Bank Securities Inc., as syndication agent, and Deutsche Bank AG New York Branch, as administrative agent (Incorporated byreference to Exhibit 10.1 to Flowers Foods' Current Report on Form 8-K, dated April 22, 2016, File No. 1-16247).
10.18 + — Flowers Foods, Inc. Retirement Plan No. 1, as amended and restated effective as of March 26, 2001 (Incorporated by reference to Exhibit10.3 to Flowers Foods’ Annual Report on Form 10-K, dated March 30, 2001, File No. 1-16247).
10.19 + — Flowers Foods, Inc. 2001 Equity and Performance Incentive Plan, as amended and restated effective as of April 1, 2009 (Incorporated byreference to Annex A to Flowers Foods’ Proxy Statement on Schedule 14A, dated April 24, 2009, File No. 1-16247).
10.20 + — Flowers Foods, Inc. Stock Appreciation Rights Plan (Incorporated by reference to Exhibit 10.8 to Flowers Foods’ Annual Report on Form10-K, dated March 29, 2002, File No. 1-16247).
10.21 + — Flowers Foods, Inc. Annual Executive Bonus Plan (Incorporated by reference to Annex B to Flowers Foods’ Proxy Statement on Schedule14A, dated April 24, 2009, File No. 1-16247).
10.22 + — Flowers Foods, Inc. 2014 Omnibus Equity and Incentive Compensation Plan (Incorporated by reference to Exhibit 10.1 to Flowers Foods’Current Report on Form 8-K, dated May 27, 2014, File No. 1-16247).
10.23 + — Flowers Foods, Inc. Supplemental Executive Retirement Plan (Incorporated by reference to Exhibit 10.10 to Flowers Foods’ Annual Reporton Form 10-K, dated March 29, 2002, File No. 1-16247).
10.24 + — Form of Indemnification Agreement, by and between Flowers Foods, Inc., certain executive officers and the directors of Flowers Foods,Inc. (Incorporated by reference to Exhibit 10.14 to Flowers Foods’ Annual Report on Form 10-K, dated March 28, 2003, File No. 1-16247).
10.25 + — Flowers Foods, Inc. 2005 Executive Deferred Compensation Plan, effective as of January 1, 2005 (Incorporated by reference to Exhibit 4.7of Flowers Foods’ Registration Statement on Form S-8, dated December 29, 2008, File No. 333-156471).
10.26 + — Ninth Amendment to the Flowers Foods, Inc. Retirement Plan No. 1, dated as of November 7, 2005 (Incorporated by reference to Exhibit10.15 to Flowers Foods’ Quarterly Report on Form 10-Q, dated November 17, 2005, File No. 1-16247).
10.27 + — Flowers Foods, Inc. Change of Control Plan, effective as of February 23, 2012 (Incorporated by reference to Exhibit 10.1 to Flowers Foods’Current Report on Form 8-K, dated February 29, 2012, File No. 1-16247).
10.28 + — Form of 2013 Performance Shares Agreement, by and between Flowers Foods, Inc. and a certain executive officer of Flowers Foods, Inc.(Incorporated by reference to Exhibit 10.17 to Flowers Foods’ Annual Report on Form 10-K, dated February 20, 2013, File No. 1-16247).
10.30 + — Form of 2013 Restricted Stock Agreement, by and between Flowers Foods, Inc. and certain executive officers of Flowers Foods,Inc. (Incorporated by reference to Exhibit 10.25 to Flowers Foods' Annual Report on Form 10-K, dated February 23, 2017, File No. 1-16247).
10.29 + — Form of 2016 Performance Stock Agreement, by and between Flowers Foods, Inc. and certain executive officers of Flowers Foods, Inc.(Incorporated by reference to Exhibit 10.25 to Flowers Foods’ Annual Report on Form 10-K, dated February 24, 2016, File No. 1-16247).
10.30 + — Form of 2017 Performance Stock Agreement, by and between Flowers Foods, Inc. and certain executive officers of Flowers Foods,Inc. (Incorporated by reference to Exhibit 10.28 to Flowers Foods' Annual Report on Form 10-K, dated February 23, 2017, File No. 1-16247).
12 * — Computation of Ratio of Earnings to Fixed Charges
56

Exhibit Name of Exhibit
No 21 * — Subsidiaries of Flowers Foods, Inc.23 * — Consent of Independent Registered Public Accounting Firm, PricewaterhouseCoopers LLP31.1 * — Certification of Chief Executive Officer pursuant to Section 302 of the Sarbanes-Oxley Act of 2002.31.2 * — Certification of Chief Financial Officer pursuant to Section 302 of the Sarbanes-Oxley Act of 2002.31.3 * — Certification of Chief Accounting Officer pursuant to Section 302 of the Sarbanes-Oxley Act of 2002.
32 * — Certification Pursuant to 18 U.S.C. Section 1350, as Adopted Pursuant to Section 906 of the Sarbanes-Oxley Act of 2002, by Allen L.Shiver, Chief Executive Officer, R. Steve Kinsey, Chief Financial Officer and Karyl H. Lauder, Chief Accounting Officer for the QuarterEnded December 30, 2017.
101.INS * — XBRL Instance Document.101.SCH * — XBRL Taxonomy Extension Schema Linkbase.101.CAL * — XBRL Taxonomy Extension Calculation Linkbase.101.DEF * — XBRL Taxonomy Extension Definition Linkbase.101.LAB * — XBRL Taxonomy Extension Label Linkbase.101.PRE * — XBRL Taxonomy Extension Presentation Linkbase.
* Filed herewith** Portions of this exhibit have been omitted and filed separately with the Securities and Exchange Commission as part of an application for confidential
treatment pursuant to Rule 24b-2 promulgated under the Securities Exchange Act of 1934, which application has been granted. Schedules to this exhibithave been omitted pursuant to Item 601(b)(2) of Regulation S-K and will be furnished supplementally to the Securities and Exchange Commission uponrequest.
+ Management contract or compensatory plan or arrangement
Item 16. Form 10-K Summary
The company has elected not to provide summary information.
57

SIGNAT URES
Pursuant to the requirements of Section 13 or 15(d) of the Securities Exchange Act of 1934, Flowers Foods, Inc. has duly caused this Form 10-K to besigned on its behalf by the undersigned, thereunto duly authorized on this 21st day of February, 2018.
FLOWERS FOODS, INC.
/s/ ALLEN L. SHIVERAllen L. ShiverPresident and
Chief Executive Officer
/s/ R. STEVE KINSEYR. Steve Kinsey
Chief Financial Officer andChief Administrative Officer
/s/ KARYL H. LAUDERKaryl H. Lauder
Senior Vice President and Chief Accounting Officer
58

Pursuant to the requirements of the Securities Exchange Act of 1934, this Form 10-K has been signed below by the following persons on behalf of Flowers
Foods, Inc. and in the capacities and on the dates indicated.
Signature Title Date
/s/ ALLEN L. SHIVER President and ChiefExecutive Officer and Director February 21, 2018
Allen L. Shiver
/s/ R. STEVE KINSEY Chief Financial Officer and Chief Administrative Officer February 21, 2018
R. Steve Kinsey
/s/ KARYL H. LAUDER Senior Vice President and ChiefAccounting Officer February 21, 2018
Karyl H. Lauder
/s/ GEORGE E. DEESE Chairman February 21, 2018
George E. Deese
/s/ RHONDA O. GASS Director February 21, 2018
Rhonda O. Gass
/s/ BENJAMIN H. GRISWOLD, IV Director February 21, 2018
Benjamin H. Griswold, IV
/s/ MARGARET G. LEWIS Director February 21, 2018
Margaret G. Lewis
/s/ AMOS R. MCMULLIAN Director February 21, 2018
Amos R. McMullian
/s/ J.V. SHIELDS, JR. Director February 21, 2018
J.V. Shields, Jr.
/s/ DAVID V. SINGER Director February 21, 2018
David V. Singer
/s/ JAMES T. SPEAR Director February 21, 2018
James T. Spear
/s/ MELVIN T. STITH, PH.D. Director February 21, 2018
Melvin T. Stith, Ph.D.
/s/ C. MARTIN WOOD III Director February 21, 2018
C. Martin Wood III
59

FLOWERS FOODS, INC. AND SUBSIDIARIES
INDEX TO CONSOLIDATED FINANCIAL STATEMENTS PageReport of Independent Registered Public Accounting Firm F-2Consolidated Balance Sheets at December 30, 2017 and December 31, 2016 F-4Consolidated Statements of Income for Fiscal 2017, Fiscal 2016, and Fiscal 2015 F-5Consolidated Statements of Comprehensive Income for Fiscal 2017, Fiscal 2016, and Fiscal 2015 F-6Consolidated Statements of Changes in Stockholders’ Equity for Fiscal 2017, Fiscal 2016, and Fiscal 2015 F-7Consolidated Statements of Cash Flows for Fiscal 2017, Fiscal 2016, and Fiscal 2015 F-8Notes to Consolidated Financial Statements F-9
F-1

Report of Independent Regist ered Public Accounting Firm
To the Board of Directors and Stockholders of Flowers Foods, Inc.
Opinions on the Financial Statements and Internal Control over Financial Reporting
We have audited the accompanying consolidated balance sheets of Flowers Foods, Inc. and its subsidiaries as of December 30, 2017 and December 31, 2016 , andthe related consolidated statements of income, comprehensive income, changes in stockholders’ equity and cash flows for each of the three years in the periodended December 30, 2017, including the related notes (collectively referred to as the “consolidated financial statements”). We also have audited the Company'sinternal control over financial reporting as of December 30, 2017, based on criteria established in Internal Control - Integrated Framework (2013) issued by theCommittee of Sponsoring Organizations of the Treadway Commission (COSO). In our opinion, the consolidated financial statements referred to above present fairly, in all material respects, the financial position of the Company as of December30, 2017 and December 31, 2016 , and the results of their operations and their cash flows for each of the three years in the period ended December 30, 2017 inconformity with accounting principles generally accepted in the United States of America. Also in our opinion, the Company maintained, in all material respects,effective internal control over financial reporting as of December 30, 2017, based on criteria established in Internal Control - Integrated Framework (2013) issuedby the COSO.
Basis for Opinions
The Company's management is responsible for these consolidated financial statements, for maintaining effective internal control over financial reporting, and for itsassessment of the effectiveness of internal control over financial reporting , included in Management’s Report on Internal Control over Financial Reportingappearing under Item 9A . Our responsibility is to express opinions on the Company’s consolidated financial statements and on the Company's internal controlover financial reporting based on our audits. We are a public accounting firm registered with the Public Company Accounting Oversight Board (United States)("PCAOB") and are required to be independent with respect to the Company in accordance with the U.S. federal securities laws and the applicable rules andregulations of the Securities and Exchange Commission and the PCAOB. We conducted our audits i n accordance with the standards of the PCAOB. Those standards require that we plan and perform the audits to obtain reasonableassurance about whether the consolidated financial statements are free of material misstatement, whether due to error or fraud, and whether effective internalcontrol over financial reporting was maintained in all material respects. Our audits of the consolidated financial statements included performing procedures to assess the risks of material misstatement of the consolidated financialstatements, whether due to error or fraud, and performing procedures that respond to those risks. Such procedures included examining, on a test basis, evidenceregarding the amounts and disclosures in the consolidated financial statements. Our audits also included evaluating the accounting principles used and significantestimates made by management, as well as evaluating the overall presentation of the consolidated financial statements. Our audit of internal control over financialreporting included obtaining an understanding of internal control over financial reporting, assessing the risk that a material weakness exists, and testing andevaluating the design and operating effectiveness of internal control based on the assessed risk. Our audits also included performing such other procedures as weconsidered necessary in the circumstances. We believe that our audits provide a reasonable basis for our opinions.
Definition and Limitations of Internal Control over Financial Reporting
A company’s internal control over financial reporting is a process designed to provide reasonable assurance regarding the reliability of financial reporting and thepreparation of financial statements for external purposes in accordance with generally accepted accounting principles. A company’s internal control over financialreporting includes those policies and procedures that (i) pertain to the maintenance of records that, in reasonable detail, accurately and fairly reflect the transactionsand dispositions of the assets of the company; (ii) provide reasonable assurance that transactions are recorded as necessary to permit preparation of financialstatements in accordance with generally accepted accounting principles, and that receipts and expenditures of the company are being made only in accordance withauthorizations of management and directors of the company; and (iii) provide reasonable assurance regarding prevention or timely detection of unauthorizedacquisition, use, or disposition of the company’s assets that could have a material effect on the financial statements.
F-2

Because of its inherent limitations, internal control over financial reporting may not prevent or detect misstatements. Also, projections of any evaluation ofeffectiveness to future periods are subject to the risk that controls may become inadequate because of changes in conditions, or that the degree of compliance withthe policie s or procedures may deteriorate.
/s/PricewaterhouseCoopers LLPAtlanta, GeorgiaFebruary 21, 2018 We have served as the Company’s auditor since at least 1969. We have not determined the specific year we began serving as auditor of the Company.
F-3

FLOWERS FOODS, INC. AND SUBSIDIARIES
CONSOLIDATED BALANCE SHEETS
December 30, 2017 December 31, 2016
(Amounts in thousands,
except share data) ASSETS
Current Assets: Cash and cash equivalents $ 5,129 $ 6,410 Accounts and notes receivable, net of allowances of $3,154 and $1,703, respectively 280,050 271,913 Inventories:
Raw materials 41,710 41,830 Packaging materials 19,638 20,354 Finished goods 49,697 48,698
111,045 110,882 Spare parts and supplies 61,330 59,509 Other 49,637 28,128
Total current assets 507,191 476,842 Property, Plant and Equipment:
Land 90,303 89,674 Buildings 462,657 458,200 Machinery and equipment 1,155,485 1,147,861 Furniture, fixtures and transportation equipment 176,515 158,188 Construction in progress 22,019 37,564
1,906,979 1,891,487 Less: accumulated depreciation (1,174,953) (1,110,461)
732,026 781,026 Notes Receivable from Independent Distributor Partners 187,737 154,924 Assets Held for Sale 15,323 36,976 Other Assets 10,228 9,758 Goodwill 464,777 465,578 Other Intangible Assets, net 742,442 835,964
Total Assets $ 2,659,724 $ 2,761,068 LIABILITIES AND STOCKHOLDERS’ EQUITY
Current Liabilities: Current maturities of long-term debt and capital lease obligations $ 12,095 $ 11,490 Accounts payable 181,388 173,102 Other accrued liabilities 200,468 156,032
Total current liabilities 393,951 340,624 Long-Term Debt:
Total long-term debt and capital lease obligations 820,141 946,667 Other Liabilities:
Post-retirement/post-employment obligations 60,107 69,601 Deferred taxes 82,976 145,854 Other long-term liabilities 51,872 48,242
Total other long-term liabilities 194,955 263,697 Commitments and Contingencies Stockholders’ Equity:
Preferred stock — $100 stated par value, 200,000 authorized and none issued — — Preferred stock — $.01 stated par value, 800,000 authorized and none issued — — Common stock — $.01 stated par value and $.001 current par value; 500,000,000 authorized shares; 228,729,585 issued shares 199 199 Treasury stock — 18,203,381 and 20,306,784 shares, respectively (235,493) (261,812)Capital in excess of par value 650,872 644,456 Retained earnings 919,658 910,520 Accumulated other comprehensive loss (84,559) (83,283)Total stockholders’ equity 1,250,677 1,210,080 Total Liabilities and Stockholders’ Equity $ 2,659,724 $ 2,761,068
See Accompanying Notes to Consolidated Financial Statements
F-4

FLOWERS FOODS, INC. AND SUBSIDIARIESCONSOLIDATED STATEMENTS OF INCOME
Fiscal 2017 Fiscal 2016 Fiscal 2015 52 weeks 52 weeks 52 weeks (Amounts in thousands, except per share data)
Sales $ 3,920,733 $ 3,926,885 $ 3,778,505 Materials, supplies, labor and other production costs (exclusive of depreciation and amortization shown separately below) 2,009,063 2,026,367 1,963,153 Selling, distribution and administrative expenses 1,503,867 1,464,236 1,381,527 Depreciation and amortization 146,719 140,869 132,175 Restructuring and related impairment charges 104,130 — — Gain on divestiture (28,875) — — Pension plan settlement loss 4,649 6,646 — Multi-employer pension plan withdrawal costs 18,268 — — Impairment of assets — 24,877 3,771 Income from operations 162,912 263,890 297,879 Interest expense 36,557 34,905 26,815 Interest income (22,938) (20,552) (21,967)Income before income taxes 149,293 249,537 293,031 Income tax expense (benefit) (827) 85,761 103,840 Net income $ 150,120 $ 163,776 $ 189,191 Net Income Per Common Share: Basic:
Net income per common share $ 0.72 $ 0.79 $ 0.90 Weighted average shares outstanding 209,573 208,511 210,793
Diluted: Net income per common share $ 0.71 $ 0.78 $ 0.89 Weighted average shares outstanding 210,435 210,354 213,356
Cash dividends paid per common share $ 0.6700 $ 0.6250 $ 0.5675
See Accompanying Notes to Consolidated Financial Statements
F-5

FLOWERS FOODS, INC. AND SUBSIDIARIES
CONSOLIDATED STATEMENTS OF COMPREHENSIVE INCOME
Fiscal 2017 Fiscal 2016 Fiscal 2015 52 weeks 52 weeks 52 weeks (Amounts in thousands, except per share data)
Net income $ 150,120 $ 163,776 $ 189,191 Other comprehensive income, net of tax:
Pension and postretirement plans: Settlement loss 3,072 4,087 — Net loss for the period (2,637) (4,013) (2,537)Amortization of prior service credit included in net income 108 108 (164)Amortization of actuarial loss included in net income 3,603 4,206 2,703
Pension and postretirement plans, net of tax 4,146 4,388 2 Derivative instruments:
Net change in fair value of derivatives (6,789) 5,730 (4,195)Loss reclassified to net income 1,367 3,399 5,413
Derivative instruments, net of tax (5,422) 9,129 1,218 Other comprehensive income (loss), net of tax (1,276) 13,517 1,220 Comprehensive income $ 148,844 $ 177,293 $ 190,411
See Accompanying Notes to Consolidated Financial Statements
F-6

FLOWERS FOODS, INC. AND SUBSIDIARIES
CONSOLIDATED STATEMENTS OF CHANGES IN STOCKHOLDERS’ EQUITY
Common Stock Capital Accumulated
Other Treasury Stock
Number of
Shares Issued Par Value in Excess
of Par Value RetainedEarnings
ComprehensiveLoss
Number ofShares Cost Total
(Amounts in thousands, except share data) Balances at January 3, 2015 228,729,585 $ 199 $ 613,859 $ 809,068 $ (98,020) (19,382,272) $ (202,062) $ 1,123,044 Net income 189,191 189,191 Derivative instruments, net of tax 1,218 1,218 Pension and postretirement plans, net of tax 2 2 Shares issued for acquisition 7,493 481,540 5,109 12,602 Stock repurchases (318,399) (6,858) (6,858)Exercise of stock options 137 1,838,083 19,480 19,617 Issuance of deferred stock awards (591) 55,713 591 — Amortization of share-based compensation awards 15,574 15,574 Income tax benefits related to share-based payments 9,134 9,134 Performance-contingent restricted stock awards issued (Note18) (8,899) 853,206 8,899 — Issuance of deferred compensation (206) 8,992 206 — Dividends paid on vested performance-contingent restrictedstock and deferred share awards (879) (879)Dividends paid — $0.5675 per common share (119,563) (119,563)Balances at January 2, 2016 228,729,585 $ 199 $ 636,501 $ 877,817 $ (96,800) $ (16,463,137) $ (174,635) $ 1,243,082 Net income 163,776 163,776 Derivative instruments, net of tax 9,129 9,129 Pension and postretirement plans, net of tax 4,388 4,388 Stock repurchases (1,125) (6,892,322) (125,175) (126,300)Exercise of stock options (4,323) 2,506,255 31,954 27,631 Issuance of deferred stock awards (1,411) 111,868 1,411 — Amortization of share-based compensation awards 18,772 18,772 Income tax benefits related to share-based payments 675 675 Performance-contingent restricted stock awards issued (Note18) (4,519) 424,787 4,519 — Issuance of deferred compensation (114) 5,765 114 — Dividends paid on vested performance-contingent restrictedstock and deferred share awards (583) (583)Dividends paid — $0.6250 per common share (130,490) (130,490)Balances at December 31, 2016 228,729,585 $ 199 $ 644,456 $ 910,520 $ (83,283) (20,306,784) $ (261,812) $ 1,210,080 Net income 150,120 150,120 Derivative instruments, net of tax (5,422) (5,422)Pension and postretirement plans, net of tax 4,146 4,146 Stock repurchases (140,135) (2,671) (2,671)Exercise of stock options (3,610) 1,773,336 22,923 19,313 Issuance of deferred stock awards (1,789) 138,354 1,789 — Amortization of share-based compensation awards 16,093 16,093 Performance-contingent restricted stock awards issued (Note18) (4,240) 328,947 4,240 — Issuance of deferred compensation (38) 2,901 38 — Dividends paid on vested performance-contingent restrictedstock and deferred share awards (553) (553)Dividends paid — $.6700 per common share (140,429) (140,429)Balances at December 30, 2017 228,729,585 $ 199 $ 650,872 $ 919,658 $ (84,559) (18,203,381) $ (235,493) $ 1,250,677
See Accompanying Notes to Consolidated Financial Statements
F-7

FLOWERS FOODS, INC. AND SUBSIDIARIES
CONSOLIDATED STATEMENTS OF CASH FLOWS
Fiscal 2017 Fiscal 2016 Fiscal 2015 52 weeks 52 weeks 52 weeks (Amounts in thousands)
Cash flows provided by (disbursed for) operating activities: Net income $ 150,120 $ 163,776 $ 189,191 Adjustments to reconcile net income to net cash provided by operating activities:
Restructuring and related impairment charges 69,601 — — Gain on divestiture (28,875) — — Depreciation and amortization 146,719 140,869 132,175 Impairment of assets — 24,877 3,771 Stock-based compensation 16,093 18,761 15,692 Loss reclassified from accumulated other comprehensive income to net income 2,080 5,307 8,551 Deferred income taxes (61,306) (14,457) 18,293 Provision for inventory obsolescence 1,684 1,324 776 Allowances for accounts receivable 4,215 3,365 2,395 Pension and postretirement plans (benefit) expense (897) 2,238 (5,878)Other (6,203) (106) 5,709
Qualified pension plan contributions (1,605) (1,000) (10,000)Changes in operating assets and liabilities, net of acquisitions and disposals:
Accounts receivable, net (11,762) (7,888) (16,873)Inventories, net (7,801) (1,526) (9,717)Hedging activities, net (15,727) 13,592 (12,818)Other assets (12,557) (3,441) (4,660)Accounts payable 10,840 (519) 14,563 Other accrued liabilities 42,770 11,390 4,504
Net cash provided by operating activities 297,389 356,562 335,674 Cash flows provided by (disbursed for) investing activities:
Purchases of property, plant and equipment (75,232) (101,727) (90,773)Repurchase of independent distributor territories (6,460) (8,871) (14,338)Cash paid at issuance of notes receivable (25,566) (8,577) (7,962)Principal payments from notes receivable 24,875 22,272 23,023 Acquisition of businesses, net of cash acquired — — (390,221)Proceeds from sale of mix plant 41,230 — — Proceeds from sales of property, plant and equipment 3,935 17,667 14,324 Acquisition of intangible assets — — (5,000)Other investing activities 1,823 2,522 1,132
Net cash disbursed for investing activities (35,395) (76,714) (469,815)Cash flows provided by (disbursed for) financing activities:
Dividends paid, including dividends on share-based payment awards (140,982) (131,073) (120,442)Exercise of stock options 19,313 27,631 19,617 Payments for debt issuance costs (729) (4,380) (646)Stock repurchases (2,671) (126,300) (6,858)Change in bank overdrafts (14,206) 1,914 2,325 Proceeds from debt borrowings 611,900 2,090,492 1,064,600 Debt and capital lease obligation payments (735,900) (2,146,100) (817,600)
Net cash (disbursed for) provided by financing activities (263,275) (287,816) 140,996 Net (decrease) increase in cash and cash equivalents (1,281) (7,968) 6,855 Cash and cash equivalents at beginning of period 6,410 14,378 7,523 Cash and cash equivalents at end of period $ 5,129 $ 6,410 $ 14,378
Schedule of non cash investing and financing activities: Issuance of executive deferred compensation plan common stock $ 38 $ 114 $ 206 Capital and right-to-use lease obligations $ 3,337 $ 15,622 $ 2,298 Issuance of notes receivable on new distribution territories, net $ 60,594 $ 23,352 $ 15,739 Distributor routes sold with deferred gains, net $ 9,707 $ 5,213 $ 166 Shares issued for the Alpine acquisition $ — $ — $ 12,602 Increase in property, plant and equipment from financing $ — $ 4,855 $ — Purchase of property, plant and equipment included in accounts payable $ 2,991 $ 5,203 $ 3,637
Supplemental disclosures of cash flow information: Cash paid during the period for:
Interest $ 34,196 $ 26,897 $ 24,112 Income taxes paid, net of refunds of $236, $12,212 and $7,587, respectively $ 71,996 $ 84,108 $ 80,062
See Accompanying Notes to Consolidated Financial Statements
F-8

FLOWERS FOODS, INC. AND SUBSIDIARIES
NOTES TO CONSOLIDATED FINANCIAL STATEMENTS Note 1. Basis of Presentation
General. The accompanying Consolidated Financial Statements of Flowers Foods, Inc. (the “company”, “Flowers Foods”, “Flowers”, “us”, “we”, or“our”) have been prepared by the company’s management in accordance with generally accepted accounting principles in the United States of America (“GAAP”).
Flowers Foods is one of the largest producers and marketers of bakery products in the United States. The company currently consists of two businesssegments: direct-store-delivery (“DSD Segment”) and warehouse delivery (“Warehouse Segment”). The DSD Segment focuses on the production and marketing ofbakery products throughout the East, South, Southwest, California, and select markets in the Midwest, Pacific Northwest, Nevada, and Colorado. The WarehouseSegment produces snack cakes, breads and rolls that are shipped both fresh and frozen to national retail, foodservice, vending, and co-pack customers through theirwarehouse channels.
On August 10, 2016, we announced the launch of Project Centennial, a comprehensive business and operational review. We are evaluating opportunities toenhance revenue growth, streamline operations, improve efficiencies, and make investments that strengthen our competitive position and improve margins over thelong term. We began Project Centennial with an evaluation of our brands, product mix, and organizational structure. We then developed strategic priorities tohelp us capitalize on retail and consumer changes. On May 3, 2017, the company announced an enhanced organizational structure designed to provide greaterfocus on the company’s strategic objectives, emphasize brand growth and innovation in line with a national branded food company, drive enhanced accountability,reduce costs, and strengthen long-term strategy. The new organizational structure establishes two business units (“BUs”), Fresh Bakery and Specialty/Snacking,and realigns key leadership roles. The new structure also provides for centralized marketing, sales, supply chain, shared-services/administrative, and corporatestrategy functions, each with clearly defined roles and responsibilities. The company intends to transition to the new structure over the next several months withfull implementation expected to be completed early in fiscal 2019. Management will continue to review financial information for the DSD Segment andWarehouse Segment until the new organizational structure is fully implemented. See Note 5, Restructuring Activities , for additional details about ProjectCentennial. Note 2. Summary of Significant Accounting Policies
Basis of Consolidation . The Consolidated Financial Statements include the accounts of the company and its wholly-owned subsidiaries. Intercompanytransactions and balances are eliminated in consolidation.
Use of Estimates . The preparation of financial statements in conformity with accounting principles generally accepted in the United States of Americarequires management to make estimates and assumptions that affect the reported amounts of assets and liabilities and disclosure of contingent assets and liabilitiesat the date of the financial statements and the reported amounts of revenues and expenses during the reporting period. Actual results could differ from thoseestimates.
Fiscal Year End . The company operates on a 52-53 week fiscal year ending the Saturday nearest December 31. Fiscal 2017, Fiscal 2016, and Fiscal 2015consisted of 52 weeks. Fiscal 2018 will consist of 52 weeks.
Revenue Recognition . The company recognizes revenue from the sale of product when title and risk of loss pass to the customer. The company recordsboth direct and estimated reductions to gross revenue for customer programs and incentive offerings at the time the incentive is offered or at the time of revenuerecognition for the underlying transaction that results in progress by the customer towards earning the incentive. These allowances include price promotiondiscounts, coupons, customer rebates, cooperative advertising, and product returns. Price promotion discount expense is recorded as a reduction to gross sales whenthe discounted product is sold to the customer.
Scan-based trading technology allows the retailer to take ownership of our goods when the consumer purchases the goods rather than at the time they aredelivered to the retailer. Consequently, revenue on these sales is not recognized until the product is purchased by the consumer. This technology is referred to aspay-by-scan (“PBS”). In fiscal years 2017, 2016, and 2015, the company recorded $1.4 billion, $1.3 billion, and $1.2 billion, respectively, in sales through PBS.
Revenue on PBS sales is recognized when the product is purchased by the end consumer because that is when title and risk of loss is transferred. Non-PBSsales are recognized when the product is delivered to the customer since that is when title and risk of loss is transferred.
F-9

The company’s production facilities deliver products to independent distributor partners (“IDP” or “IDPs”), who sell and deliver those products to outlets ofretail accounts that are within the IDPs’ defined geographic territory. PBS is utilized primarily in certain national and regional retail accounts (“PBS Outlet”).Generally, revenue is not recogniz ed by the company upon delivery of our products by the company to the IDP or upon delivery of our products by the IDP to aPBS Outlet, but when our products are purchased by the end consumer. Product inventory in the PBS Outlet is reflected as inventory on the company’s balancesheet. The balance of PBS inventory at December 30, 2017 and December 31, 2016 was $7.9 million and $7.6 million, respectively.
The IDP performs a physical inventory of products at each PBS Outlet weekly and reports the results to the company. The inventory data submitted by theIDP for each PBS Outlet is compared with the product delivery data. Product delivered to a PBS Outlet that is not recorded in the inventory data has beenpurchased by the consumer/customer of the PBS Outlet and is recorded as sales revenue by the company.
Cash and Cash Equivalents . The company considers deposits in banks, certificates of deposits, and short-term investments with original maturities ofthree months or less to be cash and cash equivalents.
Accounts and Notes Receivable . Accounts receivable consists of trade receivables, current portions of distributor notes receivable, and miscellaneousreceivables. The company maintains allowances for doubtful accounts for estimated losses resulting from the inability of its customers to make required paymentsfor trade receivables, IDP notes receivable, and miscellaneous receivables. Bad debts are charged to this reserve after all attempts to collect the balance areexhausted. If the financial condition of the company’s customers were to deteriorate, resulting in an impairment of their ability to make payments, additionalallowances may be required. In determining the past due or delinquent status of a customer, the aged trial balance is reviewed on a weekly basis by salesmanagement and generally any accounts older than seven weeks are considered delinquent. Activity in the allowance for doubtful accounts is as follows (amountsin thousands):
BeginningBalance
Charged toExpense
Write-Offsand Other
EndingBalance
Fiscal 2017 $ 1,703 $ 4,215 $ 2,764 $ 3,154 Fiscal 2016 $ 1,341 $ 3,365 $ 3,003 $ 1,703 Fiscal 2015 $ 2,723 $ 2,395 $ 3,777 $ 1,341
The amounts charged to expense for bad debts in the table above are reported as adjustments to reconcile net income to net cash provided by operating
activities in the Consolidated Statements of Cash Flows. The write-offs and other column represents the amounts that are actually used to reduce the gross accountsand notes receivable at the time the balance due from the customer is written-off. Walmart/Sam’s Club is our only customer with a balance greater than 10% ofoutstanding trade receivables. Their percentage of trade receivables was 23.6% and 18.8%, on a consolidated basis, as of December 30, 2017 and December 31,2016, respectively. No other customer accounted for greater than 10% of the company’s outstanding receivables.
Concentration of Credit Risk . The company performs periodic credit evaluations and grants credit to customers, who are primarily in the grocery andfoodservice markets, and generally does not require collateral. Our top 10 customers in fiscal years 2017, 2016 and 2015 accounted for 48.5%, 46.8% and 43.5% ofsales, respectively. Our largest customer, Walmart/Sam’s Club, weighted percent of sales for fiscal years 2017, 2016 and 2015 was as follows:
Percent of Sales
DSD
Segment Warehouse
Segment Total Fiscal 2017 17.6% 2.4% 20.0%Fiscal 2016 17.0% 2.6% 19.6%Fiscal 2015 16.7% 2.6% 19.3%
Walmart/Sam’s Club is the only customer to account for greater than 10% of the company’s sales.
Inventories . Inventories at December 30, 2017 and December 31, 2016 are valued at net realizable value. Costs for raw materials and packaging are
recorded at moving average cost. Finished goods inventories are valued at average costs.
The company will write down inventory to net realizable value for estimated unmarketable inventory equal to the difference between the cost of theinventory and the estimated net realizable value for situations when the inventory is impaired by damage, deterioration, or obsolescence.
F-10

Activity in the inventory reserve allowanc e is as follows (amounts in thousands):
BeginningBalance
Charged toExpense
Write-Offs andOther
EndingBalance
Fiscal 2017 $ 1,090 $ 1,684 $ 2,101 $ 673 Fiscal 2016 $ 238 $ 1,324 $ 472 $ 1,090 Fiscal 2015 $ 159 $ 776 $ 697 $ 238
The amounts charged to expense for inventory loss in the table above are reported as adjustments to reconcile net income to net cash provided by operating
activities in the Consolidated Statements of Cash Flows. The write-offs and other column represents the amounts that are actually used to reduce gross inventories.
Shipping Costs . Shipping costs are included in the selling, distribution and administrative line item of the Consolidated Statements of Income. For fiscalyears 2017, 2016, and 2015, shipping costs were $888.1 million, $855.1 million, and $852.3 million, respectively, including the costs paid to IDPs.
Spare Parts and Supplies . The company maintains inventories of spare parts and supplies, which are used for repairs and maintenance of its machineryand equipment. These spare parts and supplies allow the company to react quickly in the event of a mechanical breakdown. These parts are valued using themoving average method and are expensed as the part is used. Periodic physical inventories of the parts are performed, and the value of the parts is adjusted for anyobsolescence or difference from the physical inventory count.
Assets Held for Sale . Though under no obligation to do so, the company repurchases distribution rights from and sells distribution rights to IDPs from timeto time. At the time the company purchases distribution rights from an IDP, the fair value purchase price of the distribution right is recorded as “Assets Held forSale”. Upon the sale of the distribution rights to a new IDP, the new distributor franchisee/owner may choose how he/she desires to finance the purchase of thebusiness. If the new distributor chooses to use optional financing via a company-related entity, a note receivable of up to ten years is recorded for the financedamount with a corresponding credit to assets held for sale to relieve the carrying amount of the territory. Any difference between the selling price of the businessand the distribution rights’ carrying value, if any, is recorded as a gain or a loss in selling, distribution and administrative expenses because the company considersthe IDP activity a cost of distribution. This gain is recognized over the term of the outstanding notes receivable as payments are received from the IDP. Ininstances where a distribution right is sold for less than its carrying value, a loss is recorded at the date of sale and any impairment of a distribution right held forsale is recorded at such time when the impairment occurs. The deferred gains were $34.7 million and $28.3 million at December 30, 2017 and December 31, 2016,respectively, and are recorded in other short and long-term liabilities on the Consolidated Balance Sheet. The company recorded net gains of $3.3 million duringfiscal 2017, $3.1 million during fiscal 2016, and $4.1 million during fiscal 2015 related to the sale of distribution rights as a component of selling, distribution andadministrative expenses.
Property, Plant and Equipment and Depreciation . Property, plant and equipment is stated at cost. Depreciation expense is computed using the straight-line method over the estimated useful lives of the depreciable assets. Certain equipment held under capital leases of $42.8 million and $44.2 million at December30, 2017 and December 31, 2016, respectively, is classified as property, plant and equipment and the related obligations are recorded as liabilities. Depreciation ofassets held under capital leases is included in depreciation and amortization expense. Total accumulated depreciation for assets held under capital leases was$15.7 million and $13.7 million at December 30, 2017 and December 31, 2016, respectively.
The table below presents the range of estimated useful lives by property, plant and equipment class.
Useful life term (years)Asset Class Low HighBuildings 10 40Machinery and equipment 3 25Furniture, fixtures and transportation equipment 3 15
Property under capital leases and leasehold improvements are amortized over the shorter of the lease term or the estimated useful life of the leased property.
F-11

Depreciation expense for fiscal years 2017, 2016, and 2015 was as follows (amounts in thousands) :
Depreciation
expense Fiscal 2017 $ 119,445 Fiscal 2016 $ 116,367 Fiscal 2015 $ 116,772
The company had no capitalized interest during fiscal 2017, 2016, and 2015. The cost of maintenance and repairs is charged to expense as incurred. Upon
disposal or retirement, the cost and accumulated depreciation of assets are eliminated from the respective accounts. Any gain or loss is reflected in the company’sincome from operations and is included in adjustments to reconcile net income to net cash provided by operating activities in the Consolidated Statements of CashFlows.
Segments . The company’s segments are currently separated primarily by the different delivery methods each segment uses for their respective productdeliveries. The DSD Segment’s products are delivered fresh to customers through a network of IDPs who are incentivized to grow sales and to build equity in theirdistributorships. The Warehouse Segment ships fresh and frozen products to customers’ warehouses nationwide. Our bakeries fall into either the DSD Segment orWarehouse Segment depending on the primary method of delivery used to sell that bakery’s products. The bakeries within each segment produce products that aresold externally and internally. Internal sales are to bakeries within the producing bakery’s segment or to the other segment. Sales between bakeries are transferredat standard cost.
Impairment of Long-Lived Held and Used Assets . The company determines whether there has been an impairment of long-lived held and used assetswhen indicators of potential impairment are present. We consider historical performance and future estimated results in our evaluation of impairment. In the eventthat facts and circumstances indicate that the cost of any long-lived held and used assets may be impaired, an evaluation of recoverability would be performed. If anevaluation is required, the estimated future gross, undiscounted cash flows associated with the asset would be compared to the asset’s carrying amount to determineif a write-down to market value is required.
Future adverse changes in market conditions or poor operating results of underlying long-lived held and used assets could result in losses or an inability torecover the carrying value of the long-lived held and used assets that may not be reflected in the assets’ current carrying values, thereby possibly requiring animpairment charge in the future.
In fiscal 2017, we recorded asset impairment charges of $3.4 million for the closure of a Warehouse Segment snack cake plant in Winston-Salem, NorthCarolina. The closure was related to Project Centennial and is recorded in the restructuring and related impairment charges line item in our ConsolidatedStatements of Income. See Note 5, Restructuring Activities , for details.
In fiscal 2016, we recorded asset impairment charges totaling $9.9 million at the time certain idle assets were reclassified as held for sale. We recorded animpairment charge of $1.5 million when we closed a production line at one of our bakeries on equipment we no longer intend to use in fiscal 2015. See Note 8,Assets Held for Sale , for impairments related to assets classified as held for sale. These impairments are recorded in the impairment of assets line item in ourConsolidated Statements of Income.
Impairment of Other Intangible Assets . The company accounts for other intangible assets recognized in a purchase business combination at fair value.These intangible assets can be either finite or indefinite-lived depending on the facts and circumstances at acquisition.
Finite-lived intangible assets are reviewed for impairment when facts and circumstances indicate that the cost of any finite-lived intangible asset may beimpaired. This recoverability test is based on an undiscounted cash flows expected to result from the company’s use and eventual disposition of the asset. If thesecash flows are sufficient to recover the carrying value over the useful life there is no impairment. Amortization of finite-lived intangible assets occurs over theirestimated useful lives. The amortization periods, at origination, range from two years to forty years for these assets. The attribution methods we primarily use arethe sum-of-the-year digits for customer relationships and straight-line for other intangible assets. These finite-lived intangible assets generally include trademarks,customer relationships, non-compete agreements, distributor relationships, and supply agreements.
Identifiable intangible assets that are determined to have an indefinite useful economic life are not amortized. Indefinite-lived intangible assets are tested forimpairment, at least annually, using a one-step fair value based approach or when certain indicators of potential impairment are present. We have elected not toperform the qualitative approach. We also reassess the indefinite-lived classification to determine if it is appropriate to reclassify these assets as finite-lived assetsthat will require amortization. We consider historical performance and future estimated results in our evaluation of impairment. If facts and circumstances indicatethat the cost of any indefinite-lived intangible assets may be impaired, an evaluation of the fair value of the asset is compared to its carrying amount. If the carryingamount exceeds the fair value, an impairment charge is recorded for the difference.
F-12

We use the multi-period excess earnings and relief from royalty methods to value these indefinite-lived intangible assets. Fair value is estimated using thefuture gross, discounted cash flows associated with the a sset using the following four material assumptions: (a) discount rate; (b) long-term sales growth rates;(c) forecasted operating margins (not applicable to the relief from royalty method); and (d) market multiples. The method used for impairment testing p urposes isconsistent with the valuation method employed at acquisition of the intangible asset. These indefinite-lived intangible assets are trademarks acquired in a purchasebusiness combination.
During fiscal 2017, the company recorded impairment charges of $66.2 million for certain trademarks impacted by the brand rationalization study that wasperformed in conjunction with Project Centennial. See Note 5, Restructuring Activities , for details on these impairments. Impairments relating to restructuringcharges are recorded in the restructuring and related impairment charges line item in our Consolidated Statements of Income. During fiscal 2016, the companyrecorded an impairment charge of $15.0 million on certain trademarks the company no longer intends to grow nationally. These brands will continue to beproduced and sold in their respective markets. This impairment was recorded in the impairment of assets line item of our Consolidated Statements of Income.
The company evaluates useful lives for finite-lived intangible assets to determine if facts or circumstances arise that may impact the estimates of useful livesassigned and the remaining amortization duration. Indefinite-lived intangible assets that are determined to have a finite useful life are tested for impairment as anindefinite-lived intangible asset prior to commencing amortization. We determined the impaired assets should be reclassified from indefinite-lived to finite-livedwith an attribution period covering our estimate of the assets’ useful life. These intangible assets were assigned a useful life ranging from thirty years to fortyyears.
Future adverse changes in market conditions or poor operating results of underlying intangible assets could result in losses or an inability to recover thecarrying value of the intangible assets that may not be reflected in the assets’ current carrying values, thereby possibly requiring an impairment charge in thefuture. There were no impairment charges related to other intangible assets during fiscal years 2015. See Note 9, Goodwill and Other Intangible Assets , foradditional disclosure.
Goodwill . The company accounts for goodwill in a purchase business combination as the excess of the cost over the fair value of net assets acquired.Goodwill is allocated to the DSD Segment and Warehouse Segment based on the segment assignment at the time of the acquisition. The segment was determinedby the acquisition’s delivery method. The company tests goodwill for impairment on an annual basis (or an interim basis if a triggering event occurs that indicatesthe fair value of a reporting unit may be below its carrying value) using a two-step method. This analysis is performed for both of our segments. Goodwill isrecorded at the segment level primarily because of reciprocal baking arrangements for plants within each segment. We have elected not to perform the qualitativeapproach. The company conducts this review during the fourth quarter of each fiscal year absent any triggering events. We use the following four materialassumptions in our fair value analysis: (a) weighted average cost of capital; (b) long-term sales growth rates; (c) forecasted operating margins; and (d) marketmultiples. No impairment resulted from the annual review performed in fiscal years 2017, 2016, or 2015. See Note 9, Goodwill and Other Intangible Assets , foradditional disclosure.
Derivative Financial Instruments . The company enters into commodity derivatives, designated as cash flow hedges of existing or future exposure tochanges in commodity prices. The company’s primary raw materials are flour, sweeteners, shortening, and water, along with pulp, paper, and petroleum-basedpackaging products. The company uses natural gas as fuel for firing ovens. The company also periodically enters into interest rate derivatives to hedge exposure tochanges in interest rates. The company measures the fair value of its derivative portfolio using the fair value as the price that would be received to sell an asset orpaid to transfer a liability in the principal market for that asset or liability. When quoted market prices for identical assets or liabilities are not available, thecompany bases fair value upon internally developed models that use current market observable inputs, such as exchange-quoted futures prices and yieldcurves. None of our hedge positions are for trading purposes.
The effective portion of changes in fair value for these derivatives is recorded each period in accumulated other comprehensive income (loss) (“AOCI”),and any ineffective portion of the change in fair value is recorded to current period earnings in selling, distribution and administrative expenses. All of ourcommodity derivatives at December 30, 2017 qualified for hedge accounting. During fiscal years 2017, 2016, and 2015 there was no material income or expenserecorded due to ineffectiveness in current earnings due to changes in the fair value of our commodity hedges. The company recognized $0.1 million ofineffectiveness in the selling, distribution and administrative expenses line item of our Consolidated Statements of Income during fiscal year 2016 at the settlementof a treasury lock for an interest rate hedge. See Note 11, Derivative Financial Instruments , for additional disclosure.
The company routinely transfers amounts from AOCI to earnings as transactions for which cash flow hedges were held occur and impact earnings.Significant situations which do not routinely occur that could cause transfers from AOCI to earnings are as follows: (i) an event that causes a hedge to be suddenlyineffective and significant enough that hedge accounting must be discontinued or (ii) cancellation of a forecasted transaction for which a derivative was held as ahedge or a significant and material reduction in volume used of a hedged ingredient such that the company is overhedged and must discontinue hedge accounting.During fiscal 2017, 2016, and 2015 there were no discontinued hedge positions.
F-13

The impact to earnings is included in our materials, supplies, labor and other p roduction costs (exclusive of depreciation and amortization shownseparately) line item. Changes in the fair value of the asset or liability are recorded as either a current or long-term asset or liability depending on the underlyingfair value. Amounts re classified to earnings for the commodity cash flow hedges are presented as an adjustment to reconcile net income to net cash provided byoperating activities on the Consolidated Statements of Cash Flows. See Note 11, Derivative Financial Instruments , for a dditional disclosure.
Treasury Stock . The company records acquisitions of its common stock for treasury at cost. Differences between the proceeds for reissuances of treasurystock and average cost are credited or charged to capital in excess of par value to the extent of prior credits and thereafter to retained earnings. See Note 17,Stockholders’ Equity , for additional disclosure.
Advertising and Marketing Costs . Advertising and marketing costs are expensed the first time the advertising takes place. Advertising and marketingcosts were $33.8 million, $33.9 million, and $23.5 million for fiscal years 2017, 2016, and 2015, respectively. Advertising and marketing costs are recorded in theselling, distribution and administrative expense line item in our Consolidated Statements of Income.
Stock-Based Compensation . Stock-based compensation expense for all share-based payment awards granted is determined based on the grant date fairvalue. The company recognizes compensation costs only for those shares expected to vest on a straight-line basis over the requisite service period of the award,which is generally the vesting term of the share-based payment award. The shares issued for exercises and at vesting of the awards are issued from treasury stock.Forfeitures are recognized as they occur. See Note 18, Stock-Based Compensation , for additional disclosure. Stock-based compensation expense is included inselling, distribution and administrative expense in the Consolidated Statements of Income.
Software Development Costs . The company expenses internal and external software development costs incurred in the preliminary project stage, and,thereafter, capitalizes costs incurred in developing or obtaining internally used software. Certain costs, such as maintenance and training, are expensed as incurred.Capitalized costs are amortized over a period of three to eight years and are subject to impairment evaluation. An impairment could be triggered if the companydetermines that the underlying software under review will no longer be used. The net balance of capitalized software development costs included in plant, propertyand equipment was $30.5 million and $23.4 million at December 30, 2017 and December 31, 2016, respectively. Amortization expense of capitalized softwaredevelopment costs, which is included in depreciation and amortization expense in the Consolidated Statements of Income, was $4.1 million, $3.3 million, and$3.5 million in fiscal years 2017, 2016, and 2015, respectively.
Income Taxes . The company accounts for income taxes using the asset and liability method and recognizes deferred tax assets and liabilities for theexpected future tax consequences of events that have been included in the financial statements. Under this method, deferred tax assets and liabilities are determinedbased on the temporary differences between the financial statement and tax basis of assets and liabilities using enacted tax rates in effect for the year in which thedifferences are expected to reverse. The effect of a change in tax rates on deferred tax assets and liabilities is recognized in income as a discrete item in the periodthat includes the enactment date.
On December 22, 2017, the President of the United States signed into law the Tax Cuts and Jobs Act (the “Act”). The legislation significantly changes theU.S. tax law including a reduction to the corporate income tax rate from a maximum of 35% to a flat 21% rate, effective January 1, 2018. The SEC staff issuedStaff Accounting Bulletin No. 118 (SAB 118) to address the application of U.S. GAAP in situations when a registrant does not have the necessary informationavailable, prepared, or analyzed, in reasonable detail to complete the accounting for certain income tax effects of the Act. The company has recognized theprovisional tax impacts related to the revaluation of deferred tax assets and liabilities and included these amounts in its consolidated financial statements for theyear ended December 30, 2017. The ultimate impact may differ from these provisional amounts due to additional analysis and changes to estimates, additionalregulatory guidance that may be issued, changes in interpretations and assumptions the company has made, and actions the company may take because of taxreform. The accounting is expected to be complete in the second half of 2018.
The company records a valuation allowance to reduce its deferred tax assets to the amount that is more likely than not to be realized. The company hasconsidered carryback, future taxable income, and prudent and feasible tax planning strategies in assessing the need for the valuation allowance. In the event thecompany were to determine that it would be more likely than not able to realize its deferred tax assets in the future in excess of its net recorded amount, anadjustment to the valuation allowance would increase income in the period such a determination was made. Likewise, should the company determine that it wouldnot more likely than not be able to realize all or part of its net deferred tax asset in the future, an adjustment to the valuation allowance would decrease income inthe period such determination was made.
F-14

The company recognizes a tax benefit from an uncertain tax position when it is more likely than not that the position will be sustained upon examination,including resolution of any related appeals or litigation process. Interest related to unrecognized tax benefits is recorded within the interest expense line in theaccompanying Consolidated Statements of Income. See Note 22, Income Taxe s , for additional disclosure.
The deductions column in the table below presents the amounts reduced in the deferred tax asset valuation allowance that were recorded to, and included aspart of, deferred tax expense. The additions column represents amounts that increased the allowance.
Activity in the deferred tax asset valuation allowance is as follows (amounts in thousands):
Beginning Balance Deductions Additions Ending Balance Fiscal 2017 $ 18 $ — $ 93 $ 111 Fiscal 2016 $ 18 $ — $ — $ 18 Fiscal 2015 $ 2,534 $ 2,516 $ — $ 18
Self-Insurance Reserves . The company is self-insured for various levels of general liability, auto liability, workers’ compensation, and employee medical
and dental coverage. Insurance reserves are calculated on an undiscounted basis based on actual claim data and estimates of incurred but not reported claimsdeveloped utilizing historical claim trends. Projected settlements of incurred but not reported claims are estimated based on pending claims and historical trendsand data. Though the company does not expect them to do so, actual settlements and claims could differ materially from those estimated. Material differences inactual settlements and claims could have an adverse effect on our results of operations and financial condition.
Loss Contingencies . Loss contingencies are recorded at the time it is probable an asset is impaired or a liability has been incurred and the amount can bereasonably estimated. For litigation claims the company considers the degree of probability of an unfavorable outcome and the ability to make a reasonableestimate of the loss. Losses are recorded in selling, distribution, and administrative expense in our Consolidated Statements of Income.
Net Income Per Common Share . Basic net income per share is computed by dividing net income by the weighted average common shares outstanding forthe period. Diluted net income per share is computed by dividing net income by the weighted average common and common equivalent shares outstanding for theperiod. Common stock equivalents consist of the incremental shares associated with the company’s stock compensation plans, as determined under the treasurystock method. The performance contingent restricted stock awards do not contain a non-forfeitable right to dividend equivalents and are included in thecomputation for diluted net income per share. Fully vested shares which have a deferral period extending beyond the vesting date are included in the computationfor basic net income per share. See Note 20, Earnings Per Share , for additional disclosure.
Variable Interest Entities . The incorporated IDPs in the DSD Segment are not voting interest entities since the company has no direct interest in eachentity; however, they qualify as variable interest entities (“VIEs”). The IDPs who are formed as sole proprietorships are excluded from the VIE accounting analysisbecause sole proprietorships are not within scope for determination of VIE status. The company typically finances the incorporated IDP and also enters into acontract with the incorporated IDP to supply product at a discount for distribution in the IDPs’ territory. The combination of the company’s loans to theincorporated IDP and the ongoing supply arrangements with the incorporated IDP provides a level of protection to the equity owners of the various distributorshipsthat would not otherwise be available. However, the company is not considered to be the primary beneficiary of the VIEs. See Note 15, Variable Interest Entities ,for additional disclosure of these VIEs.
The company also maintains a transportation agreement with an entity that transports a significant portion of the company’s fresh bakery products from thecompany’s production facilities to outlying distribution centers. The company represents a significant portion of the entity’s revenue. This entity qualifies as a VIE,but the company has determined it is not the primary beneficiary of the VIE. See Note 15, Variable Interest Entities , for additional disclosure of these VIEs.
Pension/OPEB Obligations . The company records net periodic benefit costs and obligations related to its three defined benefit pension and two otherpost-employment benefit (“OPEB”) plans based on actuarial valuations. These valuations reflect key assumptions determined by management, including thediscount rate and expected long-term rate of return on plan assets. The expected long-term rate of return assumption considers the asset mix of the plans’ portfolios,past performance of these assets, the anticipated future economic environment, long-term performance of individual asset classes, and other factors. Materialchanges in benefit costs and obligations may occur in the future due to experience different than assumed and changes in these assumptions. Future benefitobligations and annual benefit costs could be impacted by changes in the discount rate, changes in the expected long-term rate of return, changes in the level ofcontributions to the plans’, and other factors. The company has elected to measure plan assets and obligations using the month-end that is closest to our fiscal yearend. The measurement date will be December 31 st each year. Effective January 1, 2006, the company curtailed its largest defined benefit pension plan thatcovered the majority of its workforce. Benefits under this plan were frozen, and no future benefits will accrue under this plan. The company still maintains asmaller unfrozen pension plan for certain eligible unionized employees.
F-15

The company determines the fair value of substantially all its plans’ assets utilizing market quotes rather than developing “smoothed” values, “marketrelated” values, or other modeling tech niques. Plan asset gains or losses in a given year are included with other actuarial gains and losses due to re-measurement ofthe plans’ projected benefit obligations (“PBO”). If the total unrecognized gain or loss exceeds 10% of the larger of (i) the PBO or (ii) the market value of planassets, the excess of the total unrecognized gain, or loss is amortized over the expected average future lifetime of participants in the frozen pension plans. Thecompany uses a calendar year end for the measurement date s ince the plans are based on a calendar year and because it approximates the company’s fiscal yearend. See Note 21, Postretirement Plans , for additional disclosure.
Pension Plan Assets . Effective January 1, 2014, the Finance Committee (“committee”) of the Board of Directors delegated its fiduciary and otherresponsibilities with respect to the plans to the newly established Investment Committee. The Investment Committee, which consists of certain members ofmanagement, establishes investment guidelines and strategies and regularly monitors the performance of the plans’ assets. The Investment Committee isresponsible for executing these strategies and investing the pension assets in accordance with ERISA and fiduciary standards. The investment objective of thepension plans is to preserve the plans’ capital and maximize investment earnings within acceptable levels of risk and volatility. The Investment Committee meetson a regular basis with its investment advisors to review the performance of the plans’ assets. Based upon performance and other measures and recommendationsfrom its investment advisors, the Investment Committee rebalances the plans’ assets to the targeted allocation when considered appropriate.
Fair Value of Financial Instruments . On September 28, 2016, the company issued $400.0 million of senior notes (the “2026 notes”). On April 3, 2012,the company issued $400.0 million of senior notes (the “2022 notes”). These notes are recorded in our financial statements at carrying value, net of debt discountand issuance costs. The debt discount and issuance costs are being amortized over the ten year term of the note to interest expense. In addition and for disclosurepurposes, the fair value of the notes is estimated using yields obtained from independent pricing sources for similar types of borrowing arrangements and isconsidered a Level 2 valuation. Additional details are included in Note 16, Fair Value of Financial Instruments .
Research and Development Costs . The company recorded research and development costs of $2.4 million, $3.0 million, and $3.3 million for fiscal years2017, 2016, and 2015, respectively. These costs are recorded as selling, distribution and administrative expenses in our Consolidated Statements of Income.
Other Comprehensive Income . The company reports comprehensive income in two separate but consecutive financial statements. See Note 19,Accumulated Other Comprehensive Income (Loss) , for additional required disclosures. Note 3. Recent Accounting Pronouncements
Recently adopted accounting pronouncements
In July 2015, the Financial Accounting Standards Board (“FASB”) issued guidance that entities should measure inventory at the lower of cost and netrealizable value. Net realizable value is the estimated selling prices in the ordinary course of business, less reasonably predictable costs of completion, disposal, andtransportation. The company adopted this guidance as of January 1, 2017 (the first day of our fiscal 2017) and the guidance was applied on a prospectivebasis. The impact since adoption has been immaterial.
In March 2016, the FASB issued guidance to simplify several aspects of the accounting for employee share-based payment transactions including theaccounting for income taxes, forfeitures, and statutory tax withholding requirements, as well as classification in the statements of cash flows. The companyadopted this guidance as of January 1, 2017 (the first day of our fiscal 2017). A summary at adoption is presented below:
• Accounting for income taxes . The new guidance eliminates the additional paid-in capital pool concept and requires that excess tax benefits and taxdeficiencies be recorded in the income statement as a component of income tax expense when awards are settled. The recognition of excess taxbenefits and deficiencies in the income statement will be applied prospectively. The company adopted the presentation of excess tax benefits on thestatements of cash flows under the retrospective transition method. This is presented as a change from a financing activity to a reconciling cash flowitem for operating activities for fiscal 2016. The net impact during fiscal 2017 for all exercised and vested awards was a $1.1 million tax benefit.
• Accounting for share-based payment forfeitures . The new guidance permits entities to make a company-wide accounting policy election to eitherestimate forfeitures each period, as was required, or to account for forfeitures as they occur. The company’s forfeitures, before adoption, wereimmaterial and had been recorded as they occurred. At adoption, the company will continue to recognize forfeitures as they occur.
F-16

• Accounting for statutory tax withholding requirements . The new guidance permits companies to withhold an amount up to the employees’maximum individual tax rate in the relevant jurisdiction, without resulting in liability classification of the award. Beginning with the vesting of the2016 TSR and ROIC awards in February 2018, the company is withholding either the statut ory minimum or up to the employees’ maximumindividual tax rate depending on the employee’s election. Amendments related to the presentation of employee taxes paid on the statement of cashflows when the employer withholds shares to meet the minimum statu tory did not impact the company since we already reported cash flows inaccordance with the new guidance.
The table below presents the impact to the Consolidated Statements of Cash Flows at adoption (amounts in thousands):
Fiscal 2016 As reported Post-adoption*
CASH FLOWS PROVIDED BY (DISBURSED FOR) OPERATING ACTIVITIES:
Other $ (3,957) $ (106)Net cash provided by operating activities 346,044 356,562
CASH FLOWS PROVIDED BY (DISBURSED FOR) FINANCING ACTIVITIES:
Excess windfall tax benefit related to share-based payment awards 3,851 — Net cash disbursed for financing activities $ (283,965) $ (287,816)
Fiscal 2015 As reported Post-adoption*
CASH FLOWS PROVIDED BY (DISBURSED FOR) OPERATING ACTIVITIES:
Other $ (3,425) $ 5,709 Net cash provided by operating activities 318,301 335,674
CASH FLOWS PROVIDED BY (DISBURSED FOR) FINANCING ACTIVITIES:
Excess windfall tax benefit related to share-based payment awards 9,134 — Net cash disbursed for financing activities $ 150,130 $ 140,996
* The “Post-adoption” column in the tables above present the amounts inclusive of the revisions discussed in Note 4, Financial Statement Revisions .
See Note 18, Stock-Based Compensation , for details of our awards.
Accounting pronouncements not yet adopted
In May 2014, the FASB issued guidance for recognizing revenue in contracts with customers. This guidance requires entities to recognize revenue to depictthe transfer of promised goods or services to customers in an amount that reflects the consideration to which the entity expects to be entitled in exchange for thosegoods or services. There are five steps outlined in the guidance to achieve this core principle. This guidance was originally effective January 1, 2017, the first dayof our fiscal 2017. In July 2015, the FASB issued a deferral for one year, making the effective date December 31, 2017, the first day of our fiscal 2018. In March2016, the FASB amended the initial guidance to clarify the implementation guidance on principal versus agent considerations. In April 2016, the FASB amendedthe initial guidance to clarify the identification of performance conditions and the licensing implementation guidance. In May 2016, the FASB amended the initialguidance to update certain narrow scopes within the revenue recognition guidance. In December 2016, the FASB amended the initial guidance for technicalcorrections and improvements. Early application is permitted, but not before January 1, 2017. Entities will have the option to apply the final standardretrospectively or use a modified retrospective method, recognizing the cumulative effect of the standards in retained earnings at the date of initial application. Anentity will not restate prior periods if it uses the modified retrospective method, but will be required to disclose the amount by which each financial statement lineitem is affected in the current reporting period by the application of the standard as compared to the guidance in effect prior to the change, as well as reasons forsignificant changes. The company intends to report revenue under the updated standard in its first quarter filing of fiscal 2018. The company has selected themodified retrospective transition method.
F-17
The company has substantially completed its study on the impac t that implementing this standard will have on its financial statements, related disclosuresand our internal control over financial reporting as well as whether the effect will be material to our revenue. Based on the results of our study to date, the sta ndardwill not be material to our revenue at adoption. Changes will need to be made to our current internal control over financial reporting processes to ensure allcontracts are reviewed for each of the five revenue recognition steps. Additionally, the c ompany’s revenue disclosures will change in fiscal 2018 and beyond. Thenew disclosures will require more granularity into our sources of revenue, as well as the assumptions about recognition timing, and include our selection of certainpractical expedien ts and policy elections. We are developing draft disclosures to ensure all the requirements can be met with our current technologyplatforms. We do not believe our technology platforms require a material change. The study included how to account for PBS sales and estimated stale charges,whether revenue for a transaction involving a third party is reported net or gross, and the timing of income recognition on the sale of territories. These are notintended to be a complete inventory of the potentially i mpacted types of transactions. More impacted revenue sources may be discovered as we continue updatingour internal control over financial reporting processes and preparing the draft disclosures.
In February 2016, the FASB issued guidance that requires an entity to recognize lease liabilities and a right-of-use asset for virtually all leases (other thanthose that meet the definition of a short-term lease) on the balance sheet and to disclose key information about the entity’s leasing arrangements. This guidance iseffective for annual reporting periods beginning after December 15, 2018, including interim periods within those periods, with earlier adoption permitted. Thisguidance must be adopted using a modified retrospective approach for all leases existing at, or entered into after, the date of initial adoption, with an option to electto use certain transition relief. The company intends to adopt the updated standard in the first quarter of fiscal 2019. The company currently has significantoperating leases with our fiscal 2017 lease expense totaling $95.0 million. We have selected a new software platform to help us apply the new rules. Theabstraction process of our lease portfolio is anticipated to be complete in the second half of fiscal 2018. The company expects a material impact to our ConsolidatedFinancial Statements because of this guidance. The Consolidated Balance Sheet will reflect additional material assets and liabilities for these leases.
In August 2016, the FASB issued guidance on the classification of certain cash receipts and payments in the statements of cash flows. The guidance iseffective for fiscal years beginning after December 15, 2017, and interim periods within those years. Early adoption is permitted. The guidance must be appliedretrospectively to all periods presented but may be applied prospectively if retrospective application would be impracticable. The adoption of this new guidancewill not be material to our Consolidated Financial Statements.
In January 2017, the FASB issued guidance to clarify the definition of a business with the objective of adding guidance to assist entities with evaluatingwhether transactions should be accounted for as acquisitions (or disposals) of assets or businesses. This guidance is effective for annual reporting periodsbeginning after December 15, 2017, including interim periods within those period. Early application is allowed for transactions that have not been reported infinancial statements that have been issued or made available for issuance. This guidance shall be applied prospectively at adoption. This guidance will impact thecompany’s assessment of the acquisition of either an asset or a business in future transactions beginning in our fiscal 2018.
In January 2017, the FASB issued guidance to simplify the accounting for goodwill impairment. The guidance removed Step 2 of the goodwill impairmenttest, which requires a hypothetical purchase price allocation. A goodwill impairment will now be the amount by which a reporting unit’s carrying value exceeds itsfair value, not to exceed the carrying amount of goodwill. Companies will still have the option to perform a qualitative assessment to determine if a quantitativeimpairment test is necessary. This guidance will be applied prospectively. Companies are required to disclose the nature of and reason for the change inaccounting principle upon transition. That disclosure shall be provided in the first annual reporting period and in the interim period within the first annual reportingperiod when the company adopts this guidance. This change to the guidance is effective for fiscal years beginning after December 15, 2019. Early adoption ispermitted after January 1, 2017. The company is currently evaluating when this guidance will be adopted and the impact on our Consolidated Financial Statements.
F-18

In March 2017, the FASB issued guidance that requires all employers to separately present the service cost component from the other pension andpostretirement benefit cost components in the income statement. Service cost will now be presented with other employee compensation costs in operating incomeor capitalized in assets, as appropriate. The other components reported in the income statement will be reported separate from the ser vice cost and outside ofincome from operations. The amendments are effective for annual reporting periods beginning after December 15, 2017, including interim periods within thoseperiods. Early adoption was permitted as of the beginning of an annual re porting period for which financial statements were not issued or made available forissuance. However, early adoption is only allowed in the first interim period presented in a fiscal year; therefore, early adoption was only permitted in our firstquarter of fiscal 2017. The guidance is required to be applied on a retrospective basis for the presentation of the service cost component and the other componentsof net benefit cost, and on a prospective basis for the capitalization of only the service cost co mponent of net benefit cost. The company currently does notcapitalize our pension cost. This guidance will impact the company’s financial reporting. The company plans to adopt this standard in the first quarter of fiscal2018. Our plan costs (including defined benefit and post-retirement plans) for fiscal years 2017, 2016, and 2015 are presented in the table below (amounts inthousands):
Fiscal 2017 Fiscal 2016 Fiscal 2015 Service cost to be reported in operating income $ 1,011 $ 1,231 $ 1,271 Components to be reported outside of operating income (1,908) 1,008 (7,151)Total pension cost (income) $ (897) $ 2,239 $ (5,880)
In May 2017, the FASB issued guidance to provide clarity and reduce diversity in practice for changes to the terms and conditions of a share-based payment
award. This amendment provides guidance about which changes to the terms or conditions of a share-based payment award require an entity to apply modificationaccounting. The amendments to this guidance are effective for all entities for annual periods, and interim periods within those annual periods, beginning afterDecember 15, 2017. Early adoption is permitted, including adoption in any interim period, for reporting periods for which financial statements have not yet beenissued. The amendments shall be applied prospectively to an award modified on or after the adoption date. The company intends to adopt this guidance in our firstquarter of fiscal 2018. This guidance will impact any modified share-based payment awards beginning in our fiscal 2018.
In August 2017, the FASB issued guidance for hedge accounting. The new guidance will make more financial and nonfinancial hedging strategies eligiblefor hedge accounting. It also amends the presentation and disclosure requirements and changes how companies assess effectiveness. It is intended to more closelyalign hedge accounting with companies’ risk management strategies, simplify the application of hedge accounting, and increase transparency as to the scope andresults of hedging programs. The amendments in this guidance are effective for fiscal years beginning after December 15, 2018, and interim periods within thosefiscal years. Early application is permitted in any interim period after issuance of the guidance. All transition requirements and elections should be applied tohedging relationships existing on the date of adoption. The effect of the adoption should be reflected as of the beginning of the fiscal year of adoption. Theamended presentation and disclosure guidance are required prospectively. The guidance requires a modified retrospective transition method in which the companywill recognize the cumulative effect of the change on the opening balance of each affected component of equity in the statement of financial position as of the dateof adoption. While the company continues to assess all potential impacts of the standard, we currently expect adoption to have an immaterial impact on ourconsolidated financial statements. An entity may make certain transition elections upon adoption of the amendments. The company intends to early adopt thisguidance beginning in our first quarter of fiscal 2018.
In February 2018, the FASB issued guidance to allow a reclassification from AOCI to retained earnings for stranded tax effects resulting from theAct. Consequently, this guidance eliminates the stranded tax effects. This guidance is effective for all entities beginning after December 15, 2018, and interimperiods within those fiscal years. Early adoption is permitted, including within any interim period for which financial statements have not yet been issued. Thisguidance shall be applied either in the period of adoption or retrospectively to each period in which the effect of the change in the U.S. federal corporate income taxrate in the Act is recognized. This guidance will impact the company. The company is evaluating the impact and the timing of when to adopt this guidance.
We have reviewed other recently issued accounting pronouncements and concluded that they are either not applicable to our business or that no materialeffect is expected upon future adoption.
F-19

Note 4. Financial Statement Revisions
During 2017, the company identified an error in reporting the cash flow impacts of certain repurchases and sales of territories. Cash receipts and paymentsfor the repurchase and sale of territories and cash paid at the issuance of notes receivable were previously reported net when these transactions should have beendisaggregated. The company has evaluated the impact of this error and determined it is not material to previously issued annual and interim financialstatements. These corrections did not impact our previously reported Consolidated Balance Sheets, Consolidated Statements of Income, Consolidated Statementsof Comprehensive Income, and Consolidated Statements of Changes in Stockholders’ Equity.
The tables below present the revisions to the applicable Consolidated Statements of Cash Flows line item to correct the errors for all periods presented
(amounts in thousands):
Fiscal 2016
Impacted Consolidated Cash Flow Statement line item As Previously
Reported Revisions New
Guidance(1) As Revised Other reconciling items to net income $ (3,957) $ — $ 3,851 $ (106)Other assets $ (11,107) $ 7,666 $ — $ (3,441)Other accrued liabilities $ 12,389 $ (999) $ — $ 11,390 Net cash provided by operating activities $ 346,044 $ 6,667 $ 3,851 $ 356,562 Repurchase of independent distributor territories $ (10,350) $ 1,479 $ — $ (8,871)Cash paid at issuance of notes receivable $ — $ (8,577) $ — $ (8,577)Other investing activities $ 2,091 $ 431 $ — $ 2,522 Net cash disbursed for investing activities $ (70,047) $ (6,667) $ — $ (76,714)
Fiscal 2015
Impacted Consolidated Cash Flow Statement line item As Previously
Reported Revisions New
Guidance(1) As Revised Other reconciling items to net income $ (3,425) $ — $ 9,134 $ 5,709 Other assets $ (12,899) $ 8,239 $ — $ (4,660)Net cash provided by operating activities $ 318,301 $ 8,239 $ 9,134 $ 335,674 Repurchase of independent distributor territories $ (13,768) $ (570) $ — $ (14,338)Cash paid at issuance of notes receivable $ — $ (7,962) $ — $ (7,962)Other investing activities $ 839 $ 293 $ — $ 1,132 Net cash disbursed for investing activities $ (461,576) $ (8,239) $ — $ (469,815)
(1) The tables above include the impact of adopting new share-based payment guidance discussed in Note 3, Recent Accounting Pronouncements .
Note 5. Restructuring Activities
On August 10, 2016, we announced the launch of Project Centennial, a comprehensive business and operational review. We are evaluating opportunities toenhance revenue growth, streamline operations, improve efficiencies, and make investments that strengthen our competitive position and improve margins over thelong term. We began Project Centennial with an evaluation of our brands, product mix, and organizational structure. We then developed strategic priorities to helpus capitalize on retail and consumer changes. The primary objective is to improve margins and profitably grow the top-line over time. These priorities are asfollows:
Reduce costs to fuel growth . The company is focusing on reducing costs in our purchased goods and services initiative and our supply chain optimizationplan. Purchased goods and services operations will be centralized to create standardization, continuously improve, and develop consistent policies andspecifications. Supply chain optimization intends to reduce operational complexity and capitalize on scale. This initiative includes, and will continue to include,consulting and other third-party costs as we finalize the organizational structure. We incurred $37.3 million during fiscal 2017 and $6.3 million during fiscal 2016of these non-restructuring consulting costs.
Develop leading capabilities . Today, we report our financial results in either the DSD Segment or the Warehouse Segment. On May 3, 2017, the companyannounced an enhanced organizational structure designed to provide greater focus on the company’s strategic objectives, emphasize brand growth and innovationin line with a national branded food company, drive enhanced accountability, reduce costs, and strengthen long-term strategy. The new organizational structurewill establish two BUs, Fresh Bakery and Specialty/Snacking, and realign key leadership roles. The new structure also provides for centralized marketing, sales,supply chain, shared-services/administrative, and corporate strategy functions, each with clearly defined roles and responsibilities.
F-20

Th e company intends to transition to the new structure over the next several months with full implementation expected to be completed at the beginning of fiscal2019. We began relocating certain employees during the third quarter of fiscal 2017 as we transi tion to the enhanced organizational structure. Reorganizationcosts of $1.9 million for relocating employees were incurred during fiscal 2017 and are recorded in the restructuring and related impairment charges line item onthe Consolidated Statements of Income. We anticipate incurring additional reorganization costs as we continue implementing the enhanced organizationalstructure. The current DSD and warehouse segmentation will remain until the new structure is fully implemented.
On July 17, 2017, the company commenced a voluntary employee separation incentive plan (the “VSIP”). The VSIP was implemented as part of our effortto restructure, streamline operations, and better position the company for profitable growth. The VSIP election period closed on September 25, 2017 and resultedin approximately 325 employees accepting the offer. The separations began on September 7, 2017, and were substantially complete by the end of fiscal 2017. Werecorded an aggregate charge of $29.7 million in fiscal 2017. We paid $4.6 million of this amount during fiscal 2017, and the balance will be paid primarily duringthe first quarter of fiscal 2018. These charges consist primarily of employee severance and benefits-related costs and are recorded in the restructuring and relatedimpairment charges line item on our Consolidated Statements of Income.
Reinvigorate core business . This objective is to invest in our brands to align brands to consumers to maximize our return on investment. We expect toincur significant incremental marketing costs annually for brand development. These costs will not be considered restructuring and will be recognized asincurred. Project Centennial also included a brand rationalization study to identify high-potential and established brands to focus on innovation and cash flow,respectively. The study, which concluded in our third quarter of fiscal 2017, changed the outlook for several brands and resulted in the recognition of animpairment on certain of these finite-lived and indefinite-lived intangible trademark assets in our third quarter of fiscal 2017. The total intangible asset impairmentcharges, which are recorded in the restructuring and related impairment charges line item in our Consolidated Statements of Income, were $66.2 million. See Note9, Goodwill and Other Intangible Assets , for more information on these charges. Project Centennial is expected to be completed by our fiscal 2021.
On August 9, 2017, the company announced the closure of a Warehouse Segment snack cake plant in Winston-Salem, North Carolina. The bakery closed inNovember 2017. The closure costs were $4.4 million and consisted of $3.4 million for property, plant and equipment impairments and $1.0 million for employeetermination benefits. These amounts are recorded in the restructuring and related impairment charges line item on our Consolidated Statements of Income.
The company recognized $2.0 million in severance costs related to other reorganization initiatives. These costs are not related to the VSIP and were madepursuant to the company’s normal severance policies.
Capitalize on product adjacencies . This initiative will focus on growing share in underdeveloped markets. Adjacencies are geographic and productcategories that will allow us to leverage our competitive advantages. This can be done either organically with our high-potential brands or through strategicacquisitions. As of December 30, 2017, we cannot estimate how much this initiative will cost for restructuring.
See Note 24, Segment Reporting , for the allocation of restructuring charges to each of our segments. The table below presents the components of costsassociated with Project Centennial (amounts in thousands):
Fiscal 2017 Restructuring and related impairment charges:
Reorganization costs $ 1,925 VSIP 29,665 Impairment of assets 69,601 Employee termination benefits 2,939
Restructuring and related impairment charges (1) 104,130 Project Centennial implementation costs (2) 37,306 Total Project Centennial restructuring and implementation costs $ 141,436
(1) Presented on our Consolidated Statements of Income.(2) Costs are recorded in the selling, distribution, and administrative expenses line item of our Consolidated Statements of Income.
F-21

The table below presents the components of, and changes in, our restructuring accruals (amounts in thousands):
VSIP
Employeetermination benefits
(1) Impairment of
assets (2) Reorganization costs
(3) Total Liability balance at December 31, 2016 $ — $ — $ — $ — $ — Charges 29,665 2,939 69,601 1,925 104,130 Cash payments (4,643) (2,471) — (1,925) (9,039)Non-cash impairments — — (69,601) — (69,601)Liability balance (4) at December 30, 2017 $ 25,022 $ 468 $ — $ — $ 25,490
(1) Employee termination benefits not related to the VSIP.(2) Asset impairments are a non-cash expense recorded as a reduction to intangible assets and property, plant, and equipment. These transactions did not
impact the liability balance.(3) Reorganization costs include employee relocation expenses.(4) Recorded in the other accrued current liabilities line item of our Consolidated Balance Sheets.
Note 6. Divestiture
On January 14, 2017, the company completed the sale of a non-core mix manufacturing business located in Cedar Rapids, Iowa for $44.0 million, anamount reduced by a working capital adjustment of $2.8 million, resulting in net proceeds of $41.2 million. This resulted in a gain on sale of $28.9 million, whichwas recognized in the first quarter of fiscal 2017. The gain on the sale is presented on the Consolidated Statements of Income on the ‘Gain on divestiture’ lineitem. The mix manufacturing business was a small component of our Warehouse Segment and the disposal of this business does not represent a strategic shift inthe segment’s operations or financial results. The table below presents a computation of the gain on divestiture (amounts in thousands):
Cash consideration received $ 41,230 Recognized amounts of identifiable assets acquired and liabilities assumed by buyer: Property, plant, and equipment recorded as assets held for sale 3,824 Goodwill 801 Financial assets 7,730 Net derecognized amounts of identifiable assets sold 12,355 Gain on divestiture $ 28,875
Note 7. Notes Receivable from IDPs
The company provides direct financing to certain IDPs for the purchase of the IDPs’ distribution rights and records the notes receivable on the ConsolidatedBalance Sheets. The distribution rights are financed for up to ten years. During fiscal years 2017, 2016, and 2015 the following amounts were recorded as interestincome relating to these notes receivable (amounts in thousands):
Interest income Fiscal 2017 $ 22,938 Fiscal 2016 $ 20,552 Fiscal 2015 $ 21,967
The notes receivable are collateralized by the IDPs’ distribution rights. Additional details are included in Note 16, Fair Value of Financial Instruments .
Note 8. Assets Held for Sale
The company purchases distribution rights from and sells distribution rights to IDPs from time to time. The company repurchases distribution rights fromIDPs in circumstances when the company decides to exit a territory or, in some cases, when the distributor relationship with the company is terminated. In themajority of the Distributor Agreements, if the company decides to exit a territory or stop using the IDP model in a territory, the company is contractually requiredto purchase the distribution rights from the IDP. In the event an IDP terminates his or her relationship with the company, the company, although not legallyobligated, may
F-22

repurchase and operate those distribution rights as a company-owned territory. The IDPs may also sell their distribution rights to another person or entity.Distribution rights purchased fr om IDPs and operated as company-owned territories are recorded on the company’s Consolidated Balance Sheet in the line item“Assets Held for Sale” while the company actively seeks another IDP to purchase the distribution rights for the territory. Distribu tion rights held for sale andoperated by the company are sold to IDPs at fair market value pursuant to the terms of a Distributor Agreement. There are multiple versions of the DistributorAgreement in place at any given time and the terms of such Distribu tor Agreements vary.
The company sold certain plants and depots that it acquired in July 2013 from Hostess Brands, Inc., which initially included 20 closed plants and 36 depots(the “Acquired Hostess Bread Assets”). The Acquired Hostess Bread Assets were originally recorded as held and used in the purchase price allocation. Subsequentto the acquisition of the Acquired Hostess Bread Assets, we determined that some of the acquired plants and depots did not meet our long-term operating strategyand were sold. One depot from the Acquired Hostess Bread Assets remains unsold as of December 30, 2017. There are certain other properties not associated withthe Acquired Hostess Bread Assets that are also in the process of being sold. These assets are recorded on the Consolidated Balance Sheets in the line item “AssetsHeld for Sale” and are included in the “Other” line item in the summary table below.
During fiscal 2016, the company decided to sell the remainder of the Acquired Hostess Bread Assets not specifically reserved for future use. As a result, werecorded an impairment of $5.3 million for these plants, depots, and equipment and completed the sale in the fourth quarter of fiscal 2016. On December 31, 2016,there was a remaining depot that not been sold but was held for sale. This depot was not sold during fiscal 2017 and there is no change from fiscal 2016.
The table below presents the proceeds from the sale of the Acquired Hostess Bread Assets for fiscal years 2016 and 2015 (amounts in thousands):
Proceeds fromsale of Acquired
Hostess Bread Assets Fiscal 2016 $ 6,848 Fiscal 2015 $ 9,079
In addition to the impairments for the Acquired Hostess Bread Assets above, during the fourth quarter of our fiscal 2016, we recognized an impairment loss
of $4.6 million for the difference between the carrying value and fair value of other assets classified as held for sale.
Additional assets recorded in assets held for sale are for property, plant and equipment exclusive of the amounts disclosed as part of the Acquired HostessBread Assets and the disposal group discussed above. Also included in assets held for sale are property, plant and equipment of the Winston-Salem, North Carolinaplant. The carrying values of assets held for sale are not amortized and are evaluated for impairment as required. The table below presents the assets held for saleas of December 30, 2017 and December 31, 2016, respectively (amounts in thousands):
December 30, 2017 December 31, 2016 Distribution rights $ 13,584 $ 31,897 Acquired Hostess Bread Assets plants and depots 479 479 Other 1,260 4,600 Total assets held for sale $ 15,323 $ 36,976
Note 9. Goodwill and Other Intangible Assets
The table below summarizes our goodwill and other intangible assets at December 30, 2017 and December 31, 2016, respectively, each of which isexplained in additional detail below (amounts in thousands):
December 30, 2017 December 31, 2016 Goodwill $ 464,777 $ 465,578 Amortizable intangible assets, net of amortization 535,842 592,964 Indefinite-lived intangible assets 206,600 243,000 Total goodwill and other intangible assets $ 1,207,219 $ 1,301,542
F-23

The changes in the carrying amount of goodwill, by segment, during fiscal 2016 and fiscal 2017, are as follows (amounts in thousands):
DSD
Segment Warehouse
Segment Total Balance as of January 2, 2016 $ 424,408 $ 40,518 $ 464,926 Change in goodwill related to acquisitions 155 497 652 Balance as of December 31, 2016 $ 424,563 $ 41,015 $ 465,578 Change in goodwill related to divestiture — (801) (801)Balance as of December 30, 2017 $ 424,563 $ 40,214 $ 464,777
Changes in goodwill related to acquisitions during fiscal 2016 were from DKB in the DSD Segment and Alpine Valley Bread Company (“Alpine”) in the
Warehouse Segment. The changes to goodwill from December 31, 2016 to December 30, 2017 were a result of the divestiture discussed in Note 6, Divestiture. Goodwill was not impaired in fiscal years 2017, 2016, or 2015.
The table below presents the changes to goodwill by acquisition, for the original goodwill amount recorded at acquisition, from January 2, 2016 toDecember 31, 2016 (amounts in thousands):
DKB Alpine Total Working capital adjustments $ 60 $ 497 $ 557 Acquisition-related tax adjustments (315) — (315)Adjustment to property, plant and equipment 410 — 410 Change in goodwill during fiscal 2016 $ 155 $ 497 $ 652
As of December 30, 2017 and December 31, 2016, the company had the following amounts related to amortizable intangible assets (amounts in thousands):
December 30, 2017 December 31, 2016
Asset Cost AccumulatedAmortization Net Value Cost
AccumulatedAmortization Net Value
Trademarks $ 371,392 $ 34,716 $ 336,676 $ 402,327 $ 25,129 $ 377,198 Customer relationships 281,621 84,280 197,341 281,621 68,163 213,458 Non-compete agreements 4,874 4,874 — 4,874 4,666 208 Distributor relationships 4,123 2,298 1,825 4,123 2,023 2,100 Total $ 662,010 $ 126,168 $ 535,842 $ 692,945 $ 99,981 $ 592,964
As of December 30, 2017 and December 31, 2016, there was $206.6 million and $243.0 million, respectively, of indefinite-lived intangible trademark assets
separately identified from goodwill. These trademarks are classified as indefinite-lived because there is no foreseeable limit to the period over which the asset isexpected to contribute to our cash flows. They are well established brands with a long history and well defined markets. In addition, we are continuing to use thesebrands both in their original markets and throughout our expansion territories. We believe these factors support an indefinite-life assignment with an annualimpairment analysis to determine if the trademarks are realizing their expected economic benefits.
Fiscal 2017 restructuring and related impairment charges
During fiscal 2017, the company recognized intangible asset impairments of $66.2 million that are recorded in the restructuring and related impairmentcharges line item of our Consolidated Statements of Income. The company is currently undergoing an enterprise-wide business and operational review as discussedin Note 5, Restructuring Activities . The review included a brand rationalization study that impacted certain trademarks’ future use. The study was substantiallycompleted in the third quarter of fiscal 2017. The study concluded that our brands should be classified as either national or regional and brands that did not fit intothose categories were to be discontinued. National brands would have more marketing support than the de-emphasized remaining regional brands and in manycases would shift sales from regional brands as certain regional brand bread products are discontinued. As a result of these actions, a triggering event occurred andwe examined several trademarks for potential impairment. One of the trademarks was an indefinite-lived trademark asset and was tested by comparing the fairvalue of the brand to its carrying value. Three finite-lived trademark assets were tested using an undiscounted cash flow test. As a result of this test, the projectedcash flows for these brands did not exceed the carrying value. The second step of the test determined the fair value of the asset and the difference between the fairvalue and the carrying value was recorded as an impairment. The impairment charge also consisted of six brands that either are being discontinued or will havelimited future benefits to the company. These brands were fully impaired. All of these
F-24

impairments were attributed to regional brands. Following the impa irments, we evaluated the classification of the impaired indefinite-lived asset and determinedthat it should be reassigned as finite-lived with an estimated useful life of 30 years. The table below presents the restructuring impairment charges by segment forfiscal 2017 (amounts in thousands):
DSD Segment Warehouse Segment Total Indefinite-lived intangible assets $ 18,500 $ — $ 18,500 Finite-lived intangible assets 36,612 11,135 47,747 Restructuring impairment charges $ 55,112 $ 11,135 $ 66,247
Fiscal 2016 impairment charges
The company’s core markets were flat in fiscal 2016. As a result, we noticed that several of our brands were performing below expectations in the back halfof the year. This was caused primarily from our regional brands that were negatively impacted by our national brands and the flat market in general. Thediagnostic phase of the study was completed in our fourth quarter of fiscal 2016 and, at the time, impacted certain trademarks’ future revenue projections. Weincluded the potential impact of this study (for brands known to be impacted at the time of the test) in our expected results while performing our annual impairmenttest for all of our indefinite-lived intangible trademark assets. This led to a $15.0 million impairment charge of three indefinite-lived trademarks. Following thisimpairment, the company evaluated the indefinite-lived classification and determined that the three trademarks which were impaired should be reassigned as finite-lived assets with an estimated useful life of forty years each. We do not intend to discontinue using these trademarks; however, our expectation of limiting them toeach of their respective core markets impacts their growth potential. The carrying value of these three trademarks, before impairment, was $171.0 million. The fairvalue of these three trademarks was $156.0 million during our test. The difference between the carrying value and the fair value resulted in a $15.0 millionimpairment. The remaining indefinite-lived intangible trademark assets all had fair values in excess of their respective carrying values so no impairment wasrecognized.
Amortization expense
Amortization expense for fiscal years 2017, 2016, and 2015 was as follows (amounts in thousands):
Amortization
expense Fiscal 2017 $ 27,274 Fiscal 2016 $ 24,502 Fiscal 2015 $ 15,403
Estimated amortization of intangibles for fiscal 2018 and the next four years thereafter is as follows (amounts in thousands):
Fiscal year Amortization of
Intangibles 2018 $ 25,780 2019 $ 25,288 2020 $ 24,795 2021 $ 24,234 2022 $ 23,643
Note 10. Acquisitions
Alpine Valley Bread Company
On October 13, 2015, the company completed the acquisition of 100% of the outstanding common stock of Alpine, a leading organic bread baker, from itsshareholders for total consideration of $121.9 million inclusive of payments for certain tax benefits. We paid cash of $109.3 million and issued 12,602 shares ofour common stock to the sellers in a private placement. We believe the acquisition of Alpine strengthens our position as the second-largest baker in the U.S. bygiving us access to the fast growing organic bread category. The Alpine acquisition has been accounted for as a business combination and is included in ourWarehouse Segment. The results of Alpine’s operations are included in the company’s Consolidated Financial Statements beginning on October 14, 2015. The totalgoodwill recorded for this acquisition was $36.5 million and it is deductible for tax purposes.
F-25

During fiscal 2015, the company incurred $1.6 million of acquisition-related costs for Alpine. The acquisition-related costs for Alpine were recorded in theselling, distribution and administrative expense line item in our Consolidated Statements of Income. Alpine contributed $11.9 million in sales d uring fiscal2015. Alpine’s operating income since the acquisition was immaterial to our fiscal 2015 results of operations.
The following table summarizes the consideration paid for Alpine based on the fair value at the acquisition date (amounts in thousands):
Fair Value of consideration transferred: Cash consideration paid $ 109,340 Stock consideration paid 12,602 Total consideration paid 121,942 Recognized amounts of identifiable assets acquired and liabilities assumed: Property, plant, and equipment 15,614 Identifiable intangible assets 64,600 Financial assets 5,190 Net recognized amounts of identifiable assets acquired 85,404 Goodwill $ 36,538
A measurement period adjustment of $0.5 million related to working capital was recorded in our third quarter of fiscal 2016 and is reflected in the table
above. See Note 9, Goodwill and Other Intangible Assets , for the impact of this adjustment.
The following table presents the acquired intangible assets subject to amortization (amounts in thousands, except amortization periods):
Total
Weighted average
amortizationyears Attribution Method
Trademarks $ 20,900 40.0 Straight-lineCustomer relationships 43,700 25.0 Sum of year digits $ 64,600 29.9
The Alpine trademark was impaired as part of the study described in Note 9, Goodwill and Other Intangible Assets . Alpine operates a production facility in
Mesa, Arizona and has widespread distribution across the U.S. The primary reason for the acquisition was to purchase a brand of organic bakery products in theU.S. and to add organic production capacity.
The fair value of trade receivables was $4.8 million. The gross amount of the receivable was $4.8 million with an immaterial amount determined to beuncollectible. We did not acquire any other class of receivables as a result of the acquisition.
Dave’s Killer Bread
On September 12, 2015, the company completed the acquisition of 100% of the outstanding common stock of Dave’s Killer Bread (“DKB”), the nation’sbest-selling organic bread, from its shareholders for total cash payments of $282.1 million inclusive of payments for certain tax benefits. We believe theacquisition of DKB strengthens our position as the second-largest baker in the U.S. by giving us access to the fast growing organic bread category and expandingour geographic reach into the Pacific Northwest. The DKB acquisition has been accounted for as a business combination and is included in our DSD Segment. Theresults of DKB’s operations are included in the company’s Consolidated Financial Statements beginning on September 13, 2015. The total goodwill recorded forthis acquisition was $146.1 million and it is not deductible for tax purposes.
During fiscal 2015, the company incurred $4.6 million of acquisition-related costs for DKB. The acquisition-related costs for DKB are recorded in theselling, distribution and administrative expense line item in our Consolidated Statements of Income. DKB contributed $37.6 million in sales during fiscal2015. DKB’s operating income since the acquisition was immaterial to our fiscal 2015 results of operations.
F-26

The following table summari zes the consideration paid for DKB based on the fair value at the acquisition date (amounts in thousands):
Fair Value of consideration transferred: Cash consideration paid $ 282,115 Recognized amounts of identifiable assets acquired and liabilities assumed: Property, plant, and equipment 9,359 Identifiable intangible assets 176,300 Deferred income taxes (59,827)Financial assets 10,203 Net recognized amounts of identifiable assets acquired 136,035 Goodwill $ 146,080
Measurement period adjustments of $0.2 million related to working capital, tax adjustments, and property, plant and equipment were recorded in our third
quarter of fiscal 2016 and are reflected in the table above. See Note 7, Goodwill and Other Intangible Assets , for the impact of these adjustments.
The following table presents the acquired intangible assets subject to amortization (amounts in thousands, except amortization periods):
Total
Weighted average
amortizationyears Attribution Method
Trademarks $ 107,700 40.0 Straight-lineCustomer relationships 68,000 25.0 Sum of year digitsNon-compete agreements 600 2.0 Straight-line $ 176,300 34.1
DKB operates one production facility in Milwaukie, Oregon and has widespread distribution across the U.S. and Canada. The primary reason for the
acquisition was to purchase the leading brand of organic bakery products in the U.S.
The fair value of trade receivables was $14.2 million. The gross amount of the receivable was $14.4 million of which $0.2 million was determined to beuncollectible. We did not acquire any other class of receivables as a result of the acquisition.
Acquisition pro formas
We determined that the consolidated results of operations for the DKB and Alpine acquisitions are immaterial in the aggregate and the pro forma financialstatements are not required for fiscal 2015. Note 11. Derivative Financial Instruments
The company measures the fair value of its derivative portfolio by using the price that would be received to sell an asset or paid to transfer a liability in theprincipal market for that asset or liability. These measurements are classified into a hierarchy by the inputs used to perform the fair value calculation as follows:
Level 1: Fair value based on unadjusted quoted prices for identical assets or liabilities at the measurement date
Level 2: Modeled fair value with model inputs other than quoted prices included within Level 1 that are observable for the asset or liability, either directly orindirectly
Level 3: Modeled fair value with unobservable model inputs that are used to estimate the fair value of the asset or liability
F-27

Commodity Price Risk
The company enters into commodity derivatives, designated as cash-flow hedges of existing or future exposure to changes in commodity prices. Thecompany’s primary raw materials are flour, sweeteners, and shortening, along with pulp, paper, and petroleum-based packaging products. Natural gas, which isused as oven fuel, is also an important commodity used for production.
As of December 30, 2017, the company’s commodity hedge portfolio contained derivatives which are recorded in the following accounts with fair valuesmeasured as indicated (amounts in thousands):
Level 1 Level 2 Level 3 Total Assets:
Other current assets $ 259 $ — $ — $ 259 Other long-term assets 32 — — 32
Total $ 291 $ — $ — $ 291 Liabilities:
Other current liabilities $ (10,247) $ — $ — $ (10,247)Other long-term liabilities (639) — — (639)
Total (10,886) — — (10,886)Net Fair Value $ (10,595) $ — $ — $ (10,595)
As of December 31, 2016, the company’s commodity hedge portfolio contained derivatives which are recorded in the following accounts with fair values
measured as indicated (amounts in thousands):
Level 1 Level 2 Level 3 Total Assets:
Other current assets $ 1,576 $ — $ — $ 1,576 Other long-term assets 35 — — 35
Total $ 1,611 $ — $ — $ 1,611 Liabilities:
Other current liabilities $ (2,435) $ — $ — $ (2,435)Other long-term liabilities — — — —
Total (2,435) — — (2,435)Net Fair Value $ (824) $ — $ — $ (824)
The positions held in the portfolio are used to hedge economic exposure to changes in various raw materials and production input prices and effectively
fixes the price, or limits increases in prices, for a period of time extending into fiscal 2018. These instruments are designated as cash-flow hedges. See Note 2,Summary of Significant Accounting Policies , for the accounting treatment of these hedged transactions.
Interest Rate Risk
The company entered into treasury rate locks on August 5, 2016 and August 8, 2016 to fix the interest rate for the 2026 notes issued on September 28,2016. The derivative positions were closed when the debt was priced on September 23, 2016 with a cash settlement net receipt of $1.0 million that offset changesin the benchmark treasury rate between execution of the treasury rate locks and the debt pricing date. These rate locks were designated as a cash flowhedge. During fiscal 2016, the company recognized $0.1 million of ineffectiveness due to issuing the debt earlier than the settlement date of the treasurylocks. The ineffectiveness amount is reported as a selling, distribution, and administrative expense in our Consolidated Statements of Income.
The company entered into a treasury rate lock on March 28, 2012 to fix the interest rate for the 2022 notes issued on April 3, 2012. The derivative positionwas closed when the debt was priced on March 29, 2012 with a cash settlement that offset changes in the benchmark treasury rate between the execution of thetreasury rate lock and the debt pricing date. This treasury rate lock was designated as a cash flow hedge.
F-28

The following table outlines the company’s derivatives which were hedging th e risk of changes in forecasted interest payments on forecasted issuance oflong-term debt (amounts in thousands, before tax, and an asset is a positive value and a liability is a negative value):
Terminated Description Aggregate Notional
Amount Fair Value When
Terminated Fair Value Deferred in
AOCI (1) Ineffective Portion at
Termination April/2012 Treasury lock $ 500,000 $ (3,137) $ 2,510 $ 627
September/2016 Treasury lock $ 200,000 $ 1,298 $ (1,298) $ — September/2016 Treasury lock $ 150,000 $ (323) $ 215 $ 108
(1) The amount reported in AOCI will be reclassified to interest expense as interest payments are made on the related notes.
Derivative Assets and Liabilities
The company had the following derivative instruments recorded on the Consolidated Balance Sheet, all of which are utilized for the risk managementpurposes detailed above (amounts in thousands): Derivative Assets December 30, 2017 December 31, 2016 Derivatives Designated as Hedging Instruments Balance Sheet Location Fair Value Balance Sheet Location Fair Value Commodity contracts Other current assets $ 259 Other current assets $ 1,576 Commodity contracts Other long-term assets 32 Other long-term assets 35 Total $ 291 $ 1,611
Derivative Liabilities December 30, 2017 December 31, 2016 Derivatives Designated as Hedging Instruments Balance Sheet Location Fair Value Balance Sheet Location Fair Value Commodity contracts Other current liabilities $ 10,247 Other current liabilities $ 2,435 Commodity contracts Other long-term liabilities 639 Other long-term liabilities — Total $ 10,886 $ 2,435
Derivative Accumulated Other Comprehensive Income (“AOCI”) transactions
The company had the following derivative instruments for deferred gains and (losses) on closed contracts and the effective portion for changes in fair valuerecorded in AOCI (no amounts were excluded from the effectiveness test), all of which are utilized for the risk management purposes detailed above (amounts inthousands and net of tax):
Amount of Gain or (Loss) Recognized in OCI on Derivatives
(Effective Portion)(Net of tax) Derivatives in Cash Flow Hedging Relationships Fiscal 2017 Fiscal 2016 Fiscal 2015 Interest rate contracts $ — $ 666 $ — Commodity contracts (6,789) 5,064 (4,195)Total $ (6,789) $ 5,730 $ (4,195)
Amount of (Gain) or Loss Reclassifiedfrom Accumulated OCI into Income
(Effective Portion)(Net of tax) Location of (Gain) or Loss
Reclassified from AOCI into IncomeDerivatives in Cash Flow Hedging Relationships Fiscal 2017 Fiscal 2016 Fiscal 2015 (Effective Portion)Interest rate contracts $ 88 $ 135 $ 154 Interest expense (income)Commodity contracts 1,279 3,264 5,259 Production costs (1)Total $ 1,367 $ 3,399 $ 5,413
1. Included in Materials, supplies, labor and other production costs (exclusive of depreciation and amortization shown separately).
F-29

The balance in accumulated other comprehensive loss (income) related to commodity price risk and interest rate risk derivative transactions that are closedor will expire over the next three years are as follows (amounts in thousands and net of tax) at December 30, 2017:
Commodity PriceRisk Derivatives
Interest Rate RiskDerivatives Totals
Closed contracts $ 151 $ 75 $ 226 Expiring in 2018 5,933 — 5,933 Expiring in 2019 and beyond 324 — 324 Total $ 6,408 $ 75 $ 6,483
See Note 2, Summary of Significant Accounting Policies , for the accounting treatment of other comprehensive income for these hedged transactions.
Derivative transactions notional amounts
As of December 30, 2017, the company had entered into the following financial contracts to hedge commodity risks (amounts in thousands):
Derivatives in Cash Flow Hedging Relationships Notional amount Wheat contracts $ 123,242 Soybean oil contracts 15,697 Natural gas contracts 12,731
Total $ 151,670
The company’s derivative instruments contained no credit-risk-related contingent features at December 30, 2017. As of December 30, 2017, the company
had $16.3 million recorded in other current assets, and on December 31, 2016, the company had $3.0 million recorded in other current assets representing collateralfrom or with counterparties for hedged positions. Note 12. Other Current and Non-Current Assets
Other current assets consist of (amounts in thousands):
December 30, 2017 December 31, 2016 Prepaid assets $ 22,154 $ 20,902 Fair value of derivative instruments 259 1,576 Collateral to counterparties for derivative positions 16,324 3,039 Income taxes receivable 10,133 920 Other 767 1,691
Total $ 49,637 $ 28,128
Other non-current assets consist of (amounts in thousands):
December 30, 2017 December 31, 2016
Unamortized financing fees $ 1,787 $ 1,364 Investments 3,434 3,490 Notes receivable 2,464 2,747 Other 2,543 2,157
Total $ 10,228 $ 9,758
F-30
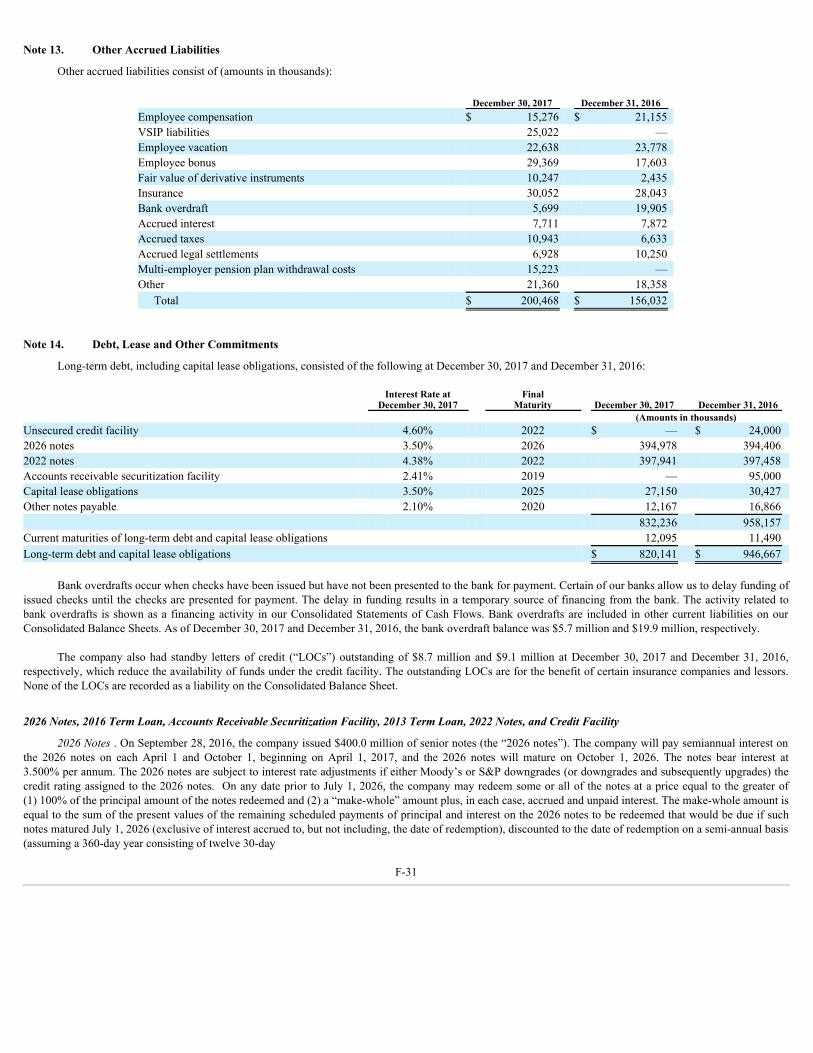
Note 13. Other Accrued Liabilities
Other accrued liabilities consist of (amounts in thousands):
December 30, 2017 December 31, 2016 Employee compensation $ 15,276 $ 21,155 VSIP liabilities 25,022 — Employee vacation 22,638 23,778 Employee bonus 29,369 17,603 Fair value of derivative instruments 10,247 2,435 Insurance 30,052 28,043 Bank overdraft 5,699 19,905 Accrued interest 7,711 7,872 Accrued taxes 10,943 6,633 Accrued legal settlements 6,928 10,250 Multi-employer pension plan withdrawal costs 15,223 — Other 21,360 18,358
Total $ 200,468 $ 156,032
Note 14. Debt, Lease and Other Commitments
Long-term debt, including capital lease obligations, consisted of the following at December 30, 2017 and December 31, 2016:
Interest Rate at
December 30, 2017 Final
Maturity December 30, 2017 December 31, 2016 (Amounts in thousands)
Unsecured credit facility 4.60% 2022 $ — $ 24,000 2026 notes 3.50% 2026 394,978 394,406 2022 notes 4.38% 2022 397,941 397,458 Accounts receivable securitization facility 2.41% 2019 — 95,000 Capital lease obligations 3.50% 2025 27,150 30,427 Other notes payable 2.10% 2020 12,167 16,866
832,236 958,157 Current maturities of long-term debt and capital lease obligations 12,095 11,490 Long-term debt and capital lease obligations $ 820,141 $ 946,667
Bank overdrafts occur when checks have been issued but have not been presented to the bank for payment. Certain of our banks allow us to delay funding of
issued checks until the checks are presented for payment. The delay in funding results in a temporary source of financing from the bank. The activity related tobank overdrafts is shown as a financing activity in our Consolidated Statements of Cash Flows. Bank overdrafts are included in other current liabilities on ourConsolidated Balance Sheets. As of December 30, 2017 and December 31, 2016, the bank overdraft balance was $5.7 million and $19.9 million, respectively.
The company also had standby letters of credit (“LOCs”) outstanding of $8.7 million and $9.1 million at December 30, 2017 and December 31, 2016,respectively, which reduce the availability of funds under the credit facility. The outstanding LOCs are for the benefit of certain insurance companies and lessors.None of the LOCs are recorded as a liability on the Consolidated Balance Sheet.
2026 Notes, 2016 Term Loan, Accounts Receivable Securitization Facility, 2013 Term Loan, 2022 Notes, and Credit Facility
2026 Notes . On September 28, 2016, the company issued $400.0 million of senior notes (the “2026 notes”). The company will pay semiannual interest onthe 2026 notes on each April 1 and October 1, beginning on April 1, 2017, and the 2026 notes will mature on October 1, 2026. The notes bear interest at3.500% per annum. The 2026 notes are subject to interest rate adjustments if either Moody’s or S&P downgrades (or downgrades and subsequently upgrades) thecredit rating assigned to the 2026 notes. On any date prior to July 1, 2026, the company may redeem some or all of the notes at a price equal to the greater of(1) 100% of the principal amount of the notes redeemed and (2) a “make-whole” amount plus, in each case, accrued and unpaid interest. The make-whole amount isequal to the sum of the present values of the remaining scheduled payments of principal and interest on the 2026 notes to be redeemed that would be due if suchnotes matured July 1, 2026 (exclusive of interest accrued to, but not including, the date of redemption), discounted to the date of redemption on a semi-annual basis(assuming a 360-day year consisting of twelve 30-day
F-31

months) a t the treasury rate (as defined in the indenture governing the notes), plus 30 basis points, plus in each case accrued and unpaid interest. At any time on orafter July 1, 2026, the company may redeem some or all of the 2026 notes at a price equal to 100% of the principal amount of the notes redeemed plus accrued andunpaid interest. If the company experiences a “change of control triggering event” (which involves a change of control of the company and related rating of thenotes below investment grade), it is required to offer to purchase the notes at a purchase price equal to 101% of the principal amount, plus accrued and unpaidinterest thereon unless the company exercised its option to redeem the notes in whole. The 2026 notes are also subject to custom ary restrictive covenants,including certain limitations on liens and sale and leaseback transactions.
The face value of the 2026 notes is $400.0 million. There was a debt discount representing the difference between the net proceeds, after expenses, receivedupon issuance of debt and the amount repayable at its maturity. The company also paid issuance costs (including underwriting fees and legal fees) on the 2026notes. Debt issuance costs and the debt discount are being amortized to interest expense over the term of the 2026 notes. As of December 30, 2017, the companywas in compliance with all restrictive covenants under the indenture governing the 2026 notes. The table below presents the debt discount, underwriting fees andthe legal and other fees for issuing the 2026 notes (amounts in thousands):
Total fees for 2026 notes Amount at Issuance Debt discount $ 2,108 Underwriting, legal, and other fees 3,634 Total fees $ 5,742
2016 Term Loan. We entered into an unsecured term facility (the “2016 term loan”) on April 19, 2016. The 2016 term loan provided for a five-year,syndicated, unsecured term loan pursuant to which we may incur term loan borrowings in a single draw up to an aggregate principal amount of $150.0 million. Theproceeds of the 2016 term loan borrowings were used to finance working capital and for general corporate purposes and to pay fees and expenses related to the2016 term loan. The company drew down the full amount of the 2016 term loan at execution. The company paid financing costs of $0.6 million in connection withthe 2016 term loan.
The 2016 term loan was paid off in full on September 28, 2016, at the time the company issued the 2026 notes. The payoff was accounted for as anextinguishment of debt with the loss on extinguishment recorded as interest expense. The extinguishment loss of $0.6 million was immediately recognized at thetime the 2016 term loan was paid off. The company has no further obligations under this agreement.
Accounts Receivable Securitization Facility . On July 17, 2013, the company entered into an accounts receivable securitization facility (the “facility”). Thecompany has amended the facility five times since inception. These amendments include provisions which (i) increased the revolving commitments under thefacility to $200.0 million from $150.0 million, (ii) added a leverage pricing grid, (iii) added an additional bank to the lending group, (iv) made certain otherconforming changes, and (v) extended the term, most recently one additional year to September 28, 2019. The amendment which added the additional bank wasaccounted for as an extinguishment of the debt. The remaining amendments were accounted for as modifications. The amendment in fiscal 2017 resulted in $0.1million in paid financing costs.
Under the facility, a wholly-owned, bankruptcy-remote subsidiary purchases, on an ongoing basis, substantially all trade receivables. As borrowings aremade under the facility, the subsidiary pledges the receivables as collateral. In the event of liquidation of the subsidiary, its creditors would be entitled to satisfytheir claims from the subsidiary’s pledged receivables prior to distributions of collections to the company. We include the subsidiary in our Consolidated FinancialStatements. The facility contains certain customary representations and warranties, affirmative and negative covenants, and events of default. As of December 30,2017, there was nothing outstanding under the facility compared to $95.0 million outstanding as of December 31, 2016. As of December 30, 2017 and December31, 2016, the company was in compliance with all restrictive covenants under the facility. On December 30, 2017, the company had $179.3 million available underits facility for working capital and general corporate purposes. Amounts available for withdrawal under the facility are determined as the lesser of the totalcommitments and a formula derived amount based on qualifying trade receivables.
Optional principal repayments may be made at any time without premium or penalty. Interest is due two days after our reporting periods end in arrears onthe outstanding borrowings and is computed as the cost of funds rate plus an applicable margin of 85 basis points. An unused fee of 30 basis points is applicable onthe unused commitment at each reporting period. The company paid financing costs of $0.8 million in connection with the facility at the time we entered into thefacility, which are being amortized over the life of the facility. The company paid $0.1 million in financing costs during fiscal 2017 for the fifth amendment.
F-32

2013 Term Loan. We entered into a senior unsecured delayed-draw term facility (the “2013 term loan”) on April 5, 2013 with a commitment of up to $300.0 million. The company drew down the full amount of the 2013 term loan on July 18, 2013. The 2013 term loan was paid off in full on September 28, 2016, atthe time the company issued the 2026 notes, and an extinguishment loss of $1.3 million was recog nized. The company has no further obligations under thisagreement. The payoff was accounted for as an extinguishment of debt with the loss on extinguishment recorded as interest expense.
2022 Notes. On April 3, 2012, the company issued $400.0 million of senior notes (the “2022 notes”). The company pays semiannual interest on the notes oneach April 1 and October 1, beginning on October 1, 2012, and the notes will mature on April 1, 2022. The notes bear interest at 4.375% per annum. On any dateprior to January 1, 2022, the company may redeem some or all of the notes at a price equal to the greater of (1) 100% of the principal amount of the notes redeemedand (2) a “make-whole” amount plus, in each case, accrued and unpaid interest. The make-whole amount is equal to the sum of the present values of the remainingscheduled payments of principal thereof (not including any interest accrued thereon to, but not including, the date of redemption), discounted to the date ofredemption on a semi-annual basis (assuming a 360-day year consisting of twelve 30-day months) at the treasury rate (as defined in the indenture governing thenotes), plus 35 basis points, plus in each case, unpaid interest accrued thereon to, but not including, the date of redemption. At any time on or after January 1, 2022,the company may redeem some or all of the notes at a price equal to 100% of the principal amount of the notes redeemed plus accrued and unpaid interest. If thecompany experiences a “change of control triggering event” (which involves a change of control of the company and related rating of the notes below investmentgrade), it is required to offer to purchase the notes at a purchase price equal to 101% of the principal amount, plus accrued and unpaid interest thereon unless thecompany exercised its option to redeem the notes in whole. The notes are also subject to customary restrictive covenants, including certain limitations on liens andsale and leaseback transactions.
The face value of the notes is $400.0 million and the current discount on the notes is $0.4 million. The company paid issuance costs (including underwritingfees and legal fees) for issuing the notes of $3.9 million. The issuance costs and the debt discount are being amortized to interest expense over the term of the notes.As of December 30, 2017 and December 31, 2016, the company was in compliance with all restrictive covenants under the indenture governing the notes.
Credit Facility. On November 29, 2017 the company entered into the sixth amendment to its amended and restated credit agreement, dated as ofOctober 24, 2003, with the lenders party thereto and Deutsche Bank AG New York Branch, as administrative agent, the swingline lender and issuing lender. Theamendment, among other things (i) extends the maturity date of the existing credit agreement to November 29, 2022; (ii) amends the applicable margin forrevolving loans maintained as (1) base rate loans and swingline loans to a range of 0.00% to 0.575% (from a range of 0.00% to 0.75% in the existing creditagreement) and (2) Eurodollar loans to a range of 0.575% to 1.575% (from a range of 0.70% to 1.75% in the existing credit agreement), in each case, based on theleverage ratio of the company and its subsidiaries; (iii) amends the applicable facility fee to a range of 0.05% to 0.30% (from a range of 0.05% to 0.50% in theexisting credit agreement), due quarterly on all commitments under the amended credit agreement, based on the leverage ratio of the company and its subsidiaries;and (iv) amends the maximum leverage ratio covenant to permit the company, at its option, in connection with certain acquisitions and investments and subject tothe terms and conditions provided in the amended credit agreement, to increase the maximum ratio permitted thereunder on one or more occasions to 4.00 to 1.00for a period of four consecutive fiscal quarters, including and/or immediately following the fiscal quarter in which such acquisitions or investments were completed(the “covenant holiday”), provided that each additional covenant holiday will not be available to the company until it has achieved and maintained a leverage ratioof at least 3.75 to 1.00 and has been complied with for at least two fiscal quarters.
The credit facility is a five-year, $500.0 million senior unsecured revolving loan facility. The credit facility contains a provision that permits Flowers torequest up to $200.0 million in additional revolving commitments, for a total of up to $700.0 million, subject to the satisfaction of certain conditions. Proceeds fromthe credit facility may be used for working capital and general corporate purposes, including capital expenditures, acquisition financing, refinancing ofindebtedness, dividends and share repurchases. The credit facility includes certain customary restrictions, which, among other things, require maintenance offinancial covenants and limit encumbrance of assets and creation of indebtedness. Restrictive financial covenants include such ratios as a minimum interestcoverage ratio and a maximum leverage ratio. The company believes that, given its current cash position, its cash flow from operating activities and its availablecredit capacity, it can comply with the current terms of the amended credit facility and can meet its presently foreseeable financial requirements. As of December30, 2017 and December 31, 2016, the company was in compliance with all restrictive covenants under the credit facility.
The company paid additional financing costs of $0.6 million in connection with the sixth amendment of the credit facility, which, in addition to theremaining balance in financing costs, is being amortized over the life of the credit facility. The company recognized an immaterial amount as interest expense forthe modification at the time of the sixth amendment.
F-33

Amounts outstanding under the credit facility vary daily. Changes in the gross borrowings and repayments can be caused by cash flow activity fromoperations, capital expenditures, acquisitions, dividends, share repurchases, and tax payments, as well as derivative transactions which are part of the company’soverall risk management strategy as discussed in Note 11, Derivative Financial Instruments . The table below presents the borrowings and repayments under thecredit facility durin g fiscal 2017:
Amount (thousands) Balance as of December 31, 2016 $ 24,000 Borrowings 447,900 Payments (471,900)Balance as of December 30, 2017 $ —
The table below presents the net amount available under the credit facility as of December 30, 2017:
Amount (thousands) Gross amount available $ 500,000 Outstanding — Letters of credit (8,698)Available for withdrawal $ 491,302
The table below presents the highest and lowest outstanding balance under the credit facility during fiscal 2017:
Amount (thousands) High balance $ 47,500 Low balance $ —
Aggregate debt maturities . Aggregate maturities of debt outstanding, including capital leases, as of December 30, 2017, are as follows (excludingunamortized debt discount and issuance costs) (amounts in thousands):
2018 $ 12,095 2019 10,623 2020 5,344 2021 3,598 2022 402,101 Thereafter 405,889 Total $ 839,650
Debt issuance costs and debt discount. In fiscal 2016, the company adopted guidance, as discussed in Note 3, Recent Accounting Pronouncements , that
requires debt issuances costs be presented in the balance sheet as a direct reduction from the carrying amount of the liability. The table below reconciles the debtissuance costs and debt discounts to the net carrying value of each of our debt obligations (excluding line-of-credit arrangements) at December 30, 2017(amounts inthousands):
Face Value Debt issuance costsand debt discount Net carrying value
2026 notes $ 400,000 $ 5,022 $ 394,978 2022 notes 400,000 2,059 397,941 Other notes payable 12,500 333 12,167 Total $ 812,500 $ 7,414 $ 805,086
The table below reconciles the debt issuance costs and debt discounts to the net carrying value of each of our debt obligations (excluding line-of-creditarrangements) at December 31, 2016 (amounts in thousands):
Face Value Debt issuance costsand debt discount Net carrying value
2026 notes $ 400,000 $ 5,594 $ 394,406 2022 notes 400,000 2,542 397,458 Other notes payable 17,500 634 16,866 Total $ 817,500 $ 8,770 $ 808,730
F-34

Leases
The company leases certain property and equipment under various operating and capital lease arrangements that expire over the next 18 years. The propertyleases include distribution facilities, thrift store locations, and two manufacturing facilities. The equipment leases include production, sales, distribution, and officeequipment. Initial lease terms range from two to 26 years. Many of the operating leases provide the company with the option, after the initial lease term, either topurchase the property at the then fair value or renew its lease at fair value rents for periods from one month to ten years. Rent escalations vary in these leases, fromno escalation over the initial lease term, to escalations linked to changes in economic variables such as the Consumer Price Index. Rental expense is recognized ona straight-line basis over the terms of the leases. The capital leases are primarily used for distribution vehicle financing and are discussed in Note 15, VariableInterest Entities , below. Future minimum lease payments under scheduled capital leases that have initial or remaining non-cancelable terms in excess of one yearare as follows (amounts in thousands):
Capital Leases 2018 $ 7,707 2019 6,075 2020 3,193 2021 3,873 2022 2,303 Thereafter 6,114
Total minimum payments 29,265 Amount representing interest 2,115 Obligations under capital leases 27,150 Obligations due within one year 7,095 Long-term obligations under capital leases $ 20,055
The table below presents the total future minimum lease payments under scheduled operating leases that have initial or remaining non-cancelable terms in
excess of one year (amounts in thousands):
Operating Leases 2018 $ 61,630 2019 56,349 2020 51,287 2021 43,443 2022 37,658 Thereafter 240,761
Total minimum payments $ 491,128
Rent expense for all operating leases was as follows (amounts in thousands):
Rent expense
Fiscal 2017 $ 95,014 Fiscal 2016 $ 97,357 Fiscal 2015 $ 87,864
Deferred Compensation
The Executive Deferred Compensation Plan (“EDCP”) consists of unsecured general obligations of the company to pay the deferred compensation of, andour contributions to, participants in the EDCP. The obligations will rank equally with our other unsecured and unsubordinated indebtedness payable from thecompany’s general assets.
F-35

The company’s directors and certain key memb ers of management are eligible to participate in the EDCP. Directors may elect to defer all or any portion oftheir annual retainer fee and meeting fees. Deferral elections by directors must be made prior to the beginning of each year and are thereafter ir revocable. Eligibleemployees may elect to defer up to 75% of their base salaries, and up to 100% of any cash bonuses and other compensation through December 31, 2015. EffectiveJanuary 1, 2016, employees may elect to defer up to 75% of their base salarie s, any cash bonuses, and other compensation. Deferral elections by eligibleexecutives must be made prior to the beginning of each year and are thereafter irrevocable during that year. The portion of the participant’s compensation that isdeferred depends on the participant’s election in effect with respect to his or her elective contributions under the EDCP.
The amounts outstanding at December 30, 2017 and December 31, 2016 were as follows (amounts in thousands):
December 30, 2017 December 31, 2016 Deferral elections outstanding $ 15,732 $ 14,883 Current portion of deferral elections 1,238 1,675 Long-term portion of deferral elections $ 14,494 $ 13,208
Guarantees and Indemnification Obligations
The company has provided various representations, warranties, and other standard indemnifications in various agreements with customers, suppliers, andother parties as well as in agreements to sell business assets or lease facilities. In general, these provisions indemnify the counterparty for matters such as breachesof representations and warranties, certain environmental conditions and tax matters, and, in the context of sales of business assets, any liabilities arising prior to theclosing of the transactions. Non-performance under a contract could trigger an obligation of the company. The ultimate effect on future financial results is notsubject to reasonable estimation because considerable uncertainty exists as to the final outcome of any potential claims.
No material guarantees or indemnifications have been entered into by the company through December 30, 2017. Note 15. Variable Interest Entities
Transportation agreement variable interest entity (the “VIE”) analysis
The company maintains a transportation agreement with an entity that transports a significant portion of the company’s fresh bakery products from thecompany’s production facilities to outlying distribution centers. The company represents a significant portion of the entity’s revenue. This entity qualifies as a VIE,but the company has determined it is not the primary beneficiary of the VIE because the company does not (i) have the ability to direct the significant activities ofthe VIE and (ii) provide any implicit or explicit guarantees or other financial support to the VIE for specific return or performance benchmarks. In addition, we donot provide, nor do we intend to provide, financial or other support to the entity.
The company has concluded that certain of the trucks and trailers the VIE uses for distributing our products from the manufacturing facilities to thedistribution centers qualify as right to use leases. As of December 30, 2017 and December 31, 2016, there was $27.2 million and $30.4 million, respectively, in netproperty, plant and equipment and capital lease obligations associated with the right to use leases.
Distribution rights agreement VIE analysis
The incorporated IDPs in the DSD Segment qualify as VIEs. The IDPs who are formed as sole proprietorships are excluded from the following VIEaccounting analysis and discussion.
Incorporated IDPs acquire distribution rights and enter into a contract with the company to sell the company’s products in the IDPs’ defined geographicterritory. The incorporated IDPs have the option to finance the acquisition of their distribution rights with the company. They can also pay cash or obtain externalfinancing at the time they acquire the distribution rights. The combination of the company’s loans to the incorporated IDPs and the ongoing distributorarrangements with the incorporated IDPs provide a level of funding to the equity owners of the various incorporated IDPs that would not otherwise be available. Asof December 30, 2017 and December 31, 2016, there was $137.9 million and $84.3 million, respectively, in gross distribution rights notes receivable outstandingfrom incorporated IDPs.
F-36

The company is not considered to be the primary beneficiary of the VIEs because the company does not (i) have the ability to direct the significant activitiesof the VIEs that would affect their ability to operate their respective businesses and (ii) provide any implicit or explicit guarantees or other financial support to theVIEs, other than the financing described above, for specific return or performance bench marks. The activities controlled by the incorporated IDPs that are deemedto most significantly impact the ultimate success of the incorporated IDP entities relate to those decisions inherent in operating the distribution business in theterritory, includi ng acquiring trucks and trailers, managing fuel costs, employee matters and other strategic decisions. In addition, we do not provide, nor do weintend to provide, financial or other support to the IDP. The IDPs are responsible for the operations of their respective territories.
The company’s maximum contractual exposure to loss for the incorporated IDP relates to the distributor rights note receivable for the portion of the territorythe incorporated IDPs financed at the time they acquired the distribution rights. The incorporated IDPs remit payment on their distributor rights note receivableeach week during the settlement process of their weekly activity. The company will operate a territory on behalf of an incorporated IDP in situations where theIDP has abandoned its distribution rights. Any remaining balance outstanding on the distribution rights notes receivable is relieved once the distribution rightshave been sold on the IDPs behalf. The company’s collateral from the territory distribution rights mitigates the potential losses. Note 16. Fair Value of Financial Instruments
The carrying value of cash and cash equivalents, accounts receivable, and short-term debt approximates fair value because of the short-term maturity of theinstruments. Notes receivable are entered into in connection with the purchase of distribution rights by IDPs. These notes receivable are recorded in theConsolidated Balance Sheet at carrying value, which represents the closest approximation of fair value. Fair value is defined as the price that would be received tosell an asset or paid to transfer a liability in an orderly transaction between market participants at the measurement date. As a result, the appropriate interest rate thatshould be used to estimate the fair value of the distribution rights notes is the prevailing market rate at which similar loans would be made to IDPs with similarcredit ratings and for the same maturities. However, the company financed approximately 4,000 and 3,600 IDPs’ distribution rights as of December 30, 2017 andDecember 31, 2016, respectively, all with varied financial histories and credit risks. Considering the diversity of credit risks among the IDPs, the company has nomethod to accurately determine a market interest rate to apply to the notes. The distribution rights are generally financed for up to ten years and the distributionrights notes are collateralized by the IDPs’ distribution rights. The company maintains a wholly-owned subsidiary to assist in financing the distribution rightspurchase activities if requested by new IDPs, using the distribution rights and certain associated assets as collateral. These notes receivable earn interest at a fixedrate.
At December 30, 2017 and December 31, 2016, respectively, the carrying value of the distribution rights notes receivable was as follows (amounts inthousands):
December 30, 2017 December 31, 2016 Distribution rights notes receivable $ 211,702 $ 175,984 Current portion recorded in accounts and notes receivable, net 23,965 21,060 Long-term portion of distribution rights notes receivable $ 187,737 $ 154,924
At December 30, 2017 and December 31, 2016, the company has evaluated the collectability of the distribution rights notes receivable and determined that areserve is not necessary. Payments on these notes are collected by the company weekly in conjunction with the IDP settlement process.
The fair value of the company’s variable rate debt at December 30, 2017 approximates the recorded value. The fair value of the company’s notes, asdiscussed in Note 14, Debt, Lease and Other Commitments , are estimated using yields obtained from independent pricing sources for similar types of borrowingarrangements and are considered a Level 2 valuation. The fair value of the notes are presented in the table below (amounts in thousands, except levelclassification):
Carrying Value Fair Value Level2026 notes $ 394,978 $ 395,648 22022 notes $ 397,941 $ 425,232 2
For fair value disclosure information about our derivative assets and liabilities see Note 11, Derivative Financial Instruments . For fair value disclosure
information about our pension plan net assets see Note 21, Postretirement Plans.
F-37

Note 17. Stockholders’ Equity
Flowers Foods’ articles of incorporation provide that its authorized capital consist of 500,000,000 shares of common stock having a par value of $0.01 pershare and 1,000,000 shares of preferred stock. The preferred stock of which (a) 200,000 shares have been designated by the Board of Directors as Series A JuniorParticipating Preferred Stock, having a par value per share of $100 and (b) 800,000 shares of preferred stock, having a par value per share of $0.01, have not beendesignated by the Board of Directors. No shares of preferred stock have been issued by Flowers Foods.
Common Stock
The holders of Flowers Foods common stock are entitled to one vote for each share held of record on all matters submitted to a vote of shareholders. Subjectto preferential rights of any issued and outstanding preferred stock, including the Series A Preferred Stock, holders of common stock are entitled to receive ratablysuch dividends, if any, as may be declared by the Board of Directors of the company out of funds legally available. In the event of a liquidation, dissolution, orwinding-up of the company, holders of common stock are entitled to share ratably in all assets of the company, if any, remaining after payment of liabilities and theliquidation preferences of any issued and outstanding preferred stock, including the Series A Preferred Stock. Holders of common stock have no preemptive rights,no cumulative voting rights, and no rights to convert their shares of common stock into any other securities of the company or any other person.
Preferred Stock
The Board of Directors has the authority to issue up to 1,000,000 shares of preferred stock in one or more series and to fix the designations, relative powers,preferences, rights, qualifications, limitations, and restrictions of all shares of each such series, including without limitation, dividend rates, conversion rights,voting rights, redemption and sinking fund provisions, liquidation preferences, and the number of shares constituting each such series, without any further vote oraction by the holders of our common stock. Although the Board of Directors does not presently intend to do so, it could issue shares of preferred stock, with rightsthat could adversely affect the voting power and other rights of holders of our common stock without obtaining the approval of our shareholders. In addition, theissuance of preferred shares could delay or prevent a change in control of the company without further action by our shareholders.
Stock Repurchase Plan
Our Board of Directors has approved a plan (on December 19, 2002) that currently authorizes share repurchases of up to 74.6 million shares of thecompany’s common stock. As of December 30, 2017, 6.6 million shares remained available for repurchase under the existing authorization. Under the plan, thecompany may repurchase its common stock in open market or privately negotiated transactions or under an accelerated repurchase program at such times and atsuch prices as determined to be in the company’s best interest.
The table below presents the shares repurchased under the Stock Repurchase Plan during our fiscal 2017 (amounts in thousands except shares purchased):
Fiscal 2017 Quarter Total Number
of Shares Purchased Total Cost of Shares
Purchased For the quarter ended April 22, 2017 112,085 $ 2,151 For the quarter ended July 15, 2017 28,050 $ 520 For the quarter ended October 7, 2017 — $ — For the quarter ended December 30, 2017 — $ —
Total 140,135 $ 2,671
As of December 30, 2017, 67.9 million shares at a cost of $633.1 million have been purchased since the inception of this plan.
Accelerated Share Repurchase Program
On March 16, 2016, the company announced that we entered into an accelerated share repurchase program (“ASR”) agreement to repurchase an aggregateof $120.0 million of the company’s common stock. Under the terms of the ASR, the company paid $120.0 million in cash and received an initial delivery of 5.6million shares immediately. The final number of shares repurchased was based on the daily volume-weighted average stock price over the life of the transaction,less a negotiated discount. During the second quarter of fiscal 2016, a total of 0.9 million shares were issued to the company at the time of final settlement. TheASR met all applicable criteria for equity classification and, therefore, was not accounted for as a derivative instrument. Shares repurchased under the ASR wereadded to our treasury shares. The company funded the ASR with borrowings on its credit facility and cash on hand.
F-38

Dividends
During fiscal years 2017, 2016, and 2015, the company paid the following dividends, excluding dividends on vested stock-based compensation awardsdiscussed in Note 18, Stock-Based Compensation , below (amounts in thousands except per share data):
Dividends paid Dividends paid
per share Fiscal 2017 $ 140,429 $ 0.6700 Fiscal 2016 $ 130,490 $ 0.6250 Fiscal 2015 $ 119,563 $ 0.5675
Note 18. Stock-Based Compensation
On March 5, 2014, our Board of Directors approved and adopted the 2014 Omnibus Equity and Incentive Compensation Plan (“Omnibus Plan”). TheOmnibus Plan was approved by our shareholders on May 21, 2014. The Omnibus Plan authorizes the compensation committee of the Board of Directors to provideequity-based compensation in the form of stock options, stock appreciation rights, restricted stock, restricted stock units, performance shares, performance units,dividend equivalents and other awards for the purpose of providing our officers, key employees, and non-employee directors’ incentives and rewards forperformance. The Omnibus Plan replaced the Flowers Foods’ 2001 Equity and Performance Incentive Plan, as amended and restated as of April 1, 2009 (“EPIP”),the Stock Appreciation Rights Plan, and the Annual Executive Bonus Plan. All outstanding equity awards that were made under the EPIP will continue to begoverned by the EPIP; however, all equity awards granted after May 21, 2014 are governed by the Omnibus Plan. No additional awards will be issued under theEPIP. Awards granted under the Omnibus Plan are limited to the authorized amount of 8,000,000 shares.
The EPIP authorized the compensation committee of the Board of Directors to make awards of options to purchase our common stock, restricted stock,performance stock and units and deferred stock. The company’s officers, key employees and non-employee directors (whose grants are generally approved by thefull Board of Directors) were eligible to receive awards under the EPIP. Over the life of the EPIP, the company issued options, restricted stock and deferred stock.
The following is a summary of stock options, restricted stock, and deferred stock outstanding under the plans described above. Information relating to thecompany’s stock appreciation rights, which were issued under a separate stock appreciation right plan, is also described below.
Stock Options
The company issued non-qualified stock options (“NQSOs”) during fiscal years 2011 and prior that have no additional service period remaining. Alloutstanding NQSOs have vested and are exercisable on December 30, 2017.
The stock option activity for fiscal years 2017, 2016, and 2015 pursuant to the EPIP is set forth below (amounts in thousands, except price data):
Fiscal 2017 Fiscal 2016 Fiscal 2015
Options
WeightedAverageExercise
Price Options
WeightedAverageExercise
Price Options
WeightedAverageExercise
Price Outstanding at beginning of year 1,846 $ 10.89 4,353 $ 10.97 6,191 $ 10.88 Exercised (1,773) $ 10.89 (2,507) $ 11.02 (1,838) $ 10.67 Outstanding at end of year 73 $ 10.87 1,846 $ 10.89 4,353 $ 10.97 Exercisable at end of year 73 1,846 4,353
As of December 30, 2017, options outstanding under the EPIP had an average exercise price of $10.87, a weighted average remaining contractual life of
0.11 years, and an aggregate intrinsic value of $0.6 million.
F-39

The cash received, the windfall tax benefits, and intrinsic value from stock option exercises for fiscal years 2017, 2016, and 2015 are set forth below(amounts in thousands):
Fiscal 2017 Fiscal 2016 Fiscal 2015 Cash received from option exercises $ 19,313 $ 27,631 $ 19,617 Cash tax windfall benefit, net $ 4,186 $ 3,746 $ 7,660 Intrinsic value of stock options exercised $ 14,994 $ 15,778 $ 24,590
Performance-Contingent Restricted Stock Awards
Performance-Contingent Total Shareholder Return Shares (“TSR Shares”)
Since 2012, certain key employees have been granted performance-contingent restricted stock under the EPIP and the Omnibus Plan in the form of TSRShares. The awards generally vest approximately two years from the date of grant (after the filing of the company’s Annual Report on Form 10-K), and the sharesbecome non-forfeitable if, and to the extent that, on that date the vesting conditions are satisfied. As a result of the delay (July as opposed to January) in the grant ofthe 2012 awards, the 2012 awards vested during the first quarter of 2014, 18 months from the grant date. Awards granted subsequent to the 2012 award (grantedduring the first quarters of their respective years) vest two years from the date of grant. The total shareholder return (“TSR”) is the percent change in the company’sstock price over the measurement period plus the dividends paid to shareholders. The performance payout is calculated at the end of each of the last four quarters(averaged) in the measurement period. Once the TSR is determined for the company (“Company TSR”), it is compared to the TSR of our food company peers(“Peer Group TSR”). The Company TSR compared to the Peer Group TSR will determine the payout as set forth below (the “TSR Modifier”):
Percentile
Payoutas % ofTarget
90th 200%70th 150%50th 100%30th 50%Below 30th 0%
For performance between the levels described above, the degree of vesting is interpolated on a linear basis. The table below presents the payout percentage
for each of the TSR awards:
Award Fiscal year
vested Payout (%)2013 award Fiscal 2015 882014 award Fiscal 2016 272015 award Fiscal 2017 0
The TSR shares vest immediately if the grantee dies or becomes disabled. However, if the grantee retires at age 65 (or age 55 with at least 10 years of
service with the company) or later, on the normal vesting date the grantee will receive a pro-rated number of shares based upon the retirement date and measured atthe actual performance for the entire performance period. In addition, if the company undergoes a change in control, the TSR shares will immediately vest at thetarget level, provided that if 12 months of the performance period have been completed, vesting will be determined based on Company TSR as of the date of thechange in control without application of four-quarter averaging. During the vesting period, the grantee has none of the rights of a shareholder. Dividends declaredduring the vesting period will accrue and will be paid at vesting on the shares that ultimately vest. The fair value estimate was determined using a Monte Carlosimulation model, which utilizes multiple input variables to estimate the probability of the company achieving the market condition discussed above. Inputs into themodel included the following for the company and comparator companies: (i) TSR from the beginning of the performance cycle through the measurement date;(ii) volatility; (iii) risk-free interest rates; and (iv) the correlation of the comparator companies’ TSR. The inputs are based on historical capital market data.
F-40

The following performance-contingent TSR Shares have been granted under the Omnibus Plan and h ave service period remaining (amounts in thousands,except price data):
Grant date January 1, 2017 January 3, 2016 Shares granted 426 401 Assumed vesting date 3/1/2019 2/21/2018 Fair value per share $ 23.31 $ 24.17
As of December 30, 2017, there was $5.6 million of total unrecognized compensation cost related to nonvested TSR Shares granted under the Omnibus
Plan. That cost is expected to be recognized over a weighted-average period of 1.07 years.
Performance-Contingent Return on Invested Capital Shares (“ROIC Shares”)
Since 2012, certain key employees have been granted performance-contingent restricted stock under the EPIP and the Omnibus Plan in the form of ROICShares. The awards generally vest approximately two years from the date of grant (after the filing of the company’s Annual Report on Form 10-K), and the sharesbecome non-forfeitable if, and to the extent that, on that date, the vesting conditions are satisfied. As a result of the delay (July as opposed to January) in the grantof the 2012 awards, the 2012 awards vested during the first quarter of 2014, 18 months from the grant date. Awards granted subsequent to the 2012 award (grantedduring the first quarters of their respective years) vest two years from the date of grant. Return on Invested Capital is calculated by dividing our profit, as defined,by the invested capital (“ROIC”). Generally, the performance condition requires the company’s average ROIC to exceed its average weighted cost of capital(“WACC”) by between 1.75 to 4.75 percentage points (the “ROI Target”) over the two fiscal year performance period. If the lowest ROI Target is not met, theawards are forfeited. The shares can be earned based on a range from 0% to 125% of target as defined below (the “ROIC Modifier”):
• 0% payout if ROIC exceeds WACC by less than 1.75 percentage points;
• ROIC above WACC by 1.75 percentage points pays 50% of ROI Target; or
• ROIC above WACC by 3.75 percentage points pays 100% of ROI Target; or
• ROIC above WACC by 4.75 percentage points pays 125% of ROI Target.
For performance between the levels described above, the degree of vesting is interpolated on a linear basis. The table below presents the payout percentagefor each of the ROIC awards:
Award Fiscal year
vested Payout (%)2013 award Fiscal 2015 1252014 award Fiscal 2016 962015 award Fiscal 2017 87
The ROIC Shares vest immediately if the grantee dies or becomes disabled. However, if the grantee retires at age 65 (or age 55 with at least 10 years of
service with the company) or later, on the normal vesting date the grantee will receive a pro-rated number of shares based upon the retirement date and actualperformance for the entire performance period. In addition, if the company undergoes a change in control, the ROIC Shares will immediately vest at the targetlevel. During the vesting period, the grantee has none of the rights of a shareholder. Dividends declared during the vesting period will accrue and will be paid atvesting on the shares that ultimately vest. The fair value of this type of award is equal to the stock price on the grant date. Since these awards have a performancecondition feature the expense associated with these awards may change depending on the expected ROI Target attained at each reporting period. The expected ROITarget for expense calculations at December 30, 2017 was 75% for the 2016 award and 100% for the 2017 award. The following performance-contingent ROICShares have been granted under the Omnibus Plan and have service period remaining (amounts in thousands, except price data):
Grant date January 1, 2017 January 3, 2016 Shares granted 426 401 Assumed vesting date 3/1/2019 2/21/2018 Fair value per share $ 19.97 $ 21.49
As of December 30, 2017, there was $4.7 million of total unrecognized compensation cost related to nonvested ROIC Shares granted under the EPIP. This
cost is expected to be recognized over a weighted-average period of 1.07 years.
F-41

Performance-Contingent Restricted Stock Summary
The table below presents the TSR Modifier share adjustment, ROIC Modifier share adjustment, accumulated dividends on vested shares, and the taxwindfall/shortfall at vesting of the performance-contingent restricted stock awards (amounts in thousands except for share data):
Award granted Fiscal year
vested
TSR Modifierincrease/(decrease)
shares
ROIC Modifierincrease/(decrease)
shares
Dividends atvesting
(thousands) Tax
windfall/(shortfall) Fair valueat vesting
2015 2017 (378,219) (49,272) $ 392 $ (3,103) $ 6,316 2014 2016 (248,872) (13,637) $ 441 $ (3,090) $ 7,173 2013 2015 (48,069) 100,090 $ 859 $ 1,430 $ 18,378
A summary of the status of all of the company’s nonvested shares for performance-contingent restricted stock (including the TSR Shares and the ROIC
Shares) for fiscal 2017, 2016 and 2015 is set forth below (amounts in thousands, except price data):
Fiscal 2017 Fiscal 2016 Fiscal 2015
Number of
Shares
WeightedAverage Fair
Value Number of
Shares
WeightedAverage Fair
Value Number of
Shares
WeightedAverage Fair
Value Balance at beginning of year 1,543 $ 21.53 1,349 $ 21.26 1,404 $ 19.09 Initial grant 855 $ 21.61 801 $ 22.83 829 $ 20.18 Supplemental grant for exceeding ROIC modifier — $ — — $ — 100 $ 14.37 Vested (329) $ 19.14 (312) $ 22.02 (853) $ 16.22 Grant reduction for not achieving the ROIC modifier (49) $ 19.14 (249) $ 23.97 — $ — Grant reduction for not achieving the TSR modifier (378) $ 21.21 (14) $ 21.47 (48) $ 17 Forfeitures (67) $ 21.08 (32) $ 23.60 (83) $ 20.99 Balance at end of year 1,575 $ 22.20 1,543 $ 21.53 1,349 $ 21.26
As of December 30, 2017, there was $10.3 million of total unrecognized compensation cost related to nonvested restricted stock granted under the EPIP.
This cost is expected to be recognized over a weighted-average period of 1.07 years.
Deferred and Restricted Stock
Non-employee directors may convert their annual board retainers into deferred stock equal in value to 100% of the cash payments directors would otherwisereceive and the vesting period is a one-year period to match the period of time that cash would have been received if no conversion existed. Accumulated dividendsare paid upon delivery of the shares. Non-employee directors received aggregate grants of 10,020 common shares for board retainer deferrals during fiscal 2017.
Non-employee directors also receive annual grants of deferred stock. This deferred stock vests over one year from the grant date. During fiscal 2017, non-employee directors were granted an aggregate of 77,220 shares of deferred stock pursuant to the Omnibus Plan. The deferred stock will be distributed to the granteeat a time designated by the grantee at the date of grant.
Compensation expense is recorded on deferred stock over the vesting period. During fiscal 2017, a total of 7,728 previously deferred shares were issuedafter the deferral period.
On May 31, 2013, the company’s Chief Executive Officer (“CEO”) received a time-based restricted stock award of approximately $1.3 million of restrictedstock pursuant to the EPIP. This award vested at 100% on the fourth anniversary of the date of grant. Dividends accrued on the award and were paid to the CEO onthe vesting date. There were 58,500 shares issued for this award at a fair value of $22.25 per share. This award vested at a price of $18.48 and the shares wereissued in our second quarter of fiscal 2017.
F-42

The deferred and restricted stock activity for fiscal years 2017, 2016, and 2015 is set forth below (amounts in thousands, except price data):
Fiscal 2017 Fiscal 2016 Fiscal 2015
Number of
Shares
WeightedAverage Fair
Value Number of
Shares
WeightedAverage Fair
Value Number of
Shares
WeightedAverage Fair
Value Nonvested shares at beginning of year 149 $ 20.39 126 $ 21.89 151 $ 21.06 Granted 87 $ 18.70 95 $ 19.30 70 $ 21.59 Vested (149) $ 20.39 (72) $ 21.59 (95) $ 20.28 Nonvested shares at end of year 87 $ 18.70 149 $ 20.39 126 $ 21.89 Vested and deferred shares at end of year 192 331 222
As of December 30, 2017, there was $0.6 million of total unrecognized compensation cost related to deferred and restricted stock awards. This cost is
expected to be recognized over a weighted-average period of 0.40 years. The intrinsic value of deferred stock awards that vested during fiscal 2017 was$2.8 million. There was an immaterial tax windfall on the exercise of deferred share awards during fiscal 2017.
Stock Appreciation Rights
Prior to 2007, the company allowed non-employee directors to convert their retainers and committee chair fees into rights. These rights vested after one yearand were exercisable over nine years. The company recorded compensation expense for these rights at a measurement date based on changes between the grantprice and an estimated fair value of the rights using the Black-Scholes option-pricing model. There are no remaining liabilities for these awards since the last awardwas exercised in fiscal 2016.
The rights activity for fiscal years 2016 and 2015 is set forth below (amounts in thousands, except price data):
Fiscal 2016 Fiscal 2015 Balance at beginning of year 14 29 Rights exercised (14) (15)Balance at end of year — 14 Weighted average — grant date fair value $ — $ 8.67
Share-Based Payments Compensation Expense Summary
The following table summarizes the company’s stock-based compensation expense, all of which was recognized in selling, distribution, and administrationexpense, for fiscal years 2017, 2016 and 2015 (amounts in thousands):
Fiscal 2017 Fiscal 2016 Fiscal 2015 Performance-contingent restricted stock awards $ 14,326 $ 16,611 $ 13,369 Deferred stock awards 1,767 2,161 2,205 Stock appreciation rights (income) expense — (11) 118 Total stock-based compensation expense $ 16,093 $ 18,761 $ 15,692
F-43

Note 19. Accumulated Other Comprehensive Income (Loss) (“AOCI”)
The company’s total comprehensive loss presently consists of net income, adjustments for our derivative financial instruments accounted for as cash flowhedges, and various pension and other postretirement benefit related items.
During fiscal years 2017, 2016, and 2015, reclassifications out of AOCI were as follows (amounts in thousands): Amount Reclassified from AOCI Affected Line Item in the StatementDetails about AOCI Components (Note 2) Fiscal 2017 Fiscal 2016 Fiscal 2015 Where Net Income is PresentedDerivative instruments: Interest rate contracts $ (142) $ (221) $ (250) Interest expenseCommodity contracts (2,080) (5,307) (8,551) Cost of sales, Note 3, belowTotal before tax $ (2,222) $ (5,528) $ (8,801) Total before taxTax benefit 855 2,129 3,388 Tax benefitTotal net of tax $ (1,367) $ (3,399) $ (5,413) Net of taxPension and postretirement plans: Prior-service credits $ (175) $ (175) $ 267 Note 1, belowSettlement loss (4,649) (6,646) — Note 1, belowActuarial losses (5,858) (6,840) (4,395) Note 1, belowTotal before tax $ (10,682) $ (13,661) $ (4,128) Total before taxTax benefit 3,899 5,260 1,589 Tax benefitTotal net of tax $ (6,783) $ (8,401) $ (2,539) Net of tax benefitTotal reclassifications from AOCI $ (8,150) $ (11,800) $ (7,952) Net of tax benefit
Note 1:These items are included in the computation of net periodic pension cost. See Note 21, Postretirement Plans , for additional information.
Note 2:Amounts in parentheses indicate debits to determine net income.
Note 3:Amounts are presented as an adjustment to reconcile net income to net cash provided by operating activities on the Consolidated Statements of Cash Flows.
During fiscal years 2017, 2016, and 2015, amounts recognized in AOCI, exclusive of reclassifications, were as follows (amounts in thousands): Amount of Gain (Loss) Recognized in AOCI AOCI component Fiscal 2017 Fiscal 2016 Fiscal 2015 Derivative instruments: Interest rate contracts $ — $ 1,083 $ — Commodity contracts (9,734) 8,233 (6,821)Total before tax $ (9,734) $ 9,316 $ (6,821)Tax benefit 2,945 (3,586) 2,626 Total net of tax $ (6,789) $ 5,730 $ (4,195)Pension and postretirement plans: Current year actuarial loss $ (4,307) $ (6,525) $ 2,075 Current year prior service cost — — (6,199)Total before tax $ (4,307) $ (6,525) $ (4,124)Tax benefit 1,670 2,512 1,587 Total net of tax $ (2,637) $ (4,013) $ (2,537)Total recognized in AOCI $ (9,426) $ 1,717 $ (6,732)
F-44

During fiscal 2017, changes to AOCI, net of income tax, by component were as follows (amounts in thousands):
Cash Flow Hedge
Items
Defined BenefitPension Plan
Items Total AOCI at December 31, 2016 $ (1,061) $ (82,222) $ (83,283)
Other comprehensive loss before reclassifications (6,789) (2,637) (9,426)Reclassified to earnings from accumulated other comprehensive loss 1,367 6,783 8,150
AOCI at December 30, 2017 $ (6,483) $ (78,076) $ (84,559)
During fiscal 2016, changes to AOCI, net of income tax, by component were as follows (amounts in thousands):
Cash Flow Hedge
Items
Defined BenefitPension Plan
Items Total AOCI at January 2, 2016 $ (10,190) $ (86,610) $ (96,800)
Other comprehensive income (loss) before reclassifications 5,730 (4,013) 1,717 Reclassified to earnings from accumulated other comprehensive loss 3,399 8,401 11,800
AOCI at December 31, 2016 $ (1,061) $ (82,222) $ (83,283)
Amounts reclassified out of AOCI to net income that relate to commodity contracts are presented as an adjustment to reconcile net income to net cashprovided by operating activities on the Consolidated Statements of Cash Flows. The following table presents the net of tax amount of the loss reclassified fromAOCI for our commodity contracts (amounts in thousands):
Fiscal 2017 Fiscal 2016 Fiscal 2015 Gross loss reclassified from AOCI into income $ 2,080 $ 5,307 $ 8,551 Tax benefit (801) (2,043) (3,292)Net of tax $ 1,279 $ 3,264 $ 5,259
Note 20. Earnings Per Share
The following is a reconciliation of net income and weighted average shares for calculating basic and diluted earnings per common share for fiscal years2017, 2016, and 2015 (amounts in thousands, except per share data):
Fiscal 2017 Fiscal 2016 Fiscal 2015 Net income $ 150,120 $ 163,776 $ 189,191 Basic Earnings Per Common Share: Basic weighted average shares outstanding per common share 209,573 208,511 210,793 Basic earnings per common share $ 0.72 $ 0.79 $ 0.90 Diluted Earnings Per Common Share: Basic weighted average shares outstanding per common share 209,573 208,511 210,793 Add: Shares of common stock assumed issued upon exercise of stock options, vesting of performance-contingent restricted stock and deferred stock 862 1,843 2,563
Diluted weighted average shares outstanding per common share 210,435 210,354 213,356 Diluted earnings per common share $ 0.71 $ 0.78 $ 0.89
There were 380,015 anti-dilutive shares during fiscal 2017. There were no anti-dilutive shares for fiscal years 2016 or 2015.
F-45

Note 21. Postretirement Plans
The following summarizes the company’s balance sheet related pension and other postretirement benefit plan accounts at December 30, 2017 and December31, 2016 (amounts in thousands):
December 30,
2017 December 31,
2016 Current benefit liability $ 935 $ 979 Noncurrent benefit liability $ 60,107 $ 69,601 Accumulated other comprehensive loss, net of tax $ 78,076 $ 82,222
The company amended our qualified defined benefit plans in October 2015 to allow retired and terminated vested pension plan participants not yet receiving
benefit payments the option to elect to receive their benefit as a single lump sum payment. This amendment was effective as of January 1, 2016. This changesupports our long-term pension risk management strategy.
Settlement accounting, which accelerates recognition of a plan’s unrecognized net gain or loss, is triggered if the total lump sums paid during a year exceedsthe sum of the plan’s service and interest cost. With no settlement charge recognized until the third quarter, the table below presents the recognized settlementcharges by quarter for fiscal years 2017 and 2016 (amounts in thousands):
Settlement loss by fiscal quarter Fiscal 2017 Fiscal 2016 Quarter 2 $ — $ 4,641 Quarter 3 3,030 1,832 Quarter 4 1,619 173 Total fiscal 2017 $ 4,649 $ 6,646
The company used a measurement date of December 31, 2017 for the defined benefit and postretirement benefit plans described below. The companyvoluntarily contributed $1.6 million to one of our qualified pension plans during fiscal 2017.
Pension Plans
The company has trusteed, noncontributory defined benefit pension plans covering certain current and former employees. Benefits under the company’slargest pension plan are frozen. The company continues to maintain an ongoing plan that covers a small number of certain union employees. The benefits in thisplan are based on years of service and the employee’s career earnings. The qualified plans are funded at amounts deductible for income tax purposes but not lessthan the minimum funding required by the Employee Retirement Income Security Act of 1974 (“ERISA”) and the Pension Protection Act of 2006 (“PPA”). Thecompany uses a calendar year end for the measurement date since the plans are based on a calendar year end and because it approximates the company’s fiscal yearend. As of December 31, 2017 and December 31, 2016, the assets of the qualified plans included certificates of deposit, marketable equity securities, mutual funds,corporate and government debt securities, other diversifying strategies and annuity contracts. The company expects pension income of approximately $1.7 millionfor fiscal 2018.
F-46

The net periodic pension cost (income) for the company’s pension plans includes the following components for fiscal years 2017, 2016 and 2015 (amountsin thous ands):
Fiscal 2017 Fiscal 2016 Fiscal 2015 Service cost $ 755 $ 830 $ 873 Interest cost 12,852 13,682 18,003 Expected return on plan assets (25,669) (26,644) (29,642)Settlement loss 4,649 6,646 — Amortization:
Prior service cost 387 387 — Actuarial loss 6,355 7,294 4,978
Net periodic pension cost (income) (671) 2,195 (5,788)Other changes in plan assets and benefit obligations recognized in other comprehensive income: Current year actuarial loss (gain) 4,119 8,879 (1,916)Current year prior service cost — — 6,199 Settlement loss (4,649) (6,646) — Amortization of prior service cost (387) (387) — Amortization of actuarial loss (6,355) (7,294) (4,978)Total recognized in other comprehensive (loss) income (7,272) (5,448) (695)Total recognized in net periodic benefit cost and other comprehensive loss $ (7,943) $ (3,253) $ (6,483)
Actual return on plan assets for fiscal years 2017, 2016, and 2015 was $42.1 million, $4.7 million, and $6.9 million, respectively.
F-47

Approximately $6.1 million will be amortized from accumulated other comprehensive income into net periodic benefit cost in fiscal 2018 relating to thecompany’s pension plans. The funded status and the amounts recognized in the Co nsolidated Balance Sheets for the company’s pension plans are as follows(amounts in thousands):
December 30, 2017 December 31, 2016 Change in benefit obligation:
Benefit obligation at beginning of year $ 398,595 $ 438,023 Service cost 755 830 Interest cost 12,852 13,682 Actuarial loss (gain) 20,526 (13,076)Benefits paid (24,408) (25,130)Settlements (14,368) (15,734)Benefit obligation at end of year $ 393,952 $ 398,595
Change in plan assets: Fair value of plan assets at beginning of year $ 335,663 $ 370,497 Actual return on plan assets 42,076 4,689 Employer contribution 1,891 1,341 Benefits paid (24,408) (25,130)Settlements (14,368) (15,734)Fair value of plan assets at end of year $ 340,854 $ 335,663
Funded status, end of year: Fair value of plan assets $ 340,854 $ 335,663 Benefit obligations (393,952) (398,595)Unfunded status and amount recognized at end of year $ (53,098) $ (62,932)
Amounts recognized in the balance sheet: Current liability (260) (291)Noncurrent liability (52,838) (62,641)Amount recognized at end of year $ (53,098) $ (62,932)
Amounts recognized in accumulated other comprehensive income: Net actuarial loss before taxes $ 126,002 $ 132,886 Prior service cost before taxes 5,426 5,813 Amount recognized at end of year $ 131,428 $ 138,699
Accumulated benefit obligation at end of year $ 392,057 $ 397,224
Assumptions used in accounting for the company’s pension plans at each of the respective fiscal years ending are as follows:
Fiscal 2017 Fiscal 2016 Fiscal 2015
Weighted average assumptions used to determine benefit obligations: Measurement date 12/31/2017 12/31/2016 12/31/2015 Discount rate 3.58% 4.00% 4.25%Rate of compensation increase 3.00% 3.00% 3.00%
Weighted average assumptions used to determine net periodic benefit (income)/cost:
Measurement date 1/1/2017 1/1/2016 1/1/2015 Discount rate 4.00% 4.25% 4.00%Expected return on plan assets 8.00% 8.00% 8.00%Rate of compensation increase 3.00% 3.00% 4.00%
F-48
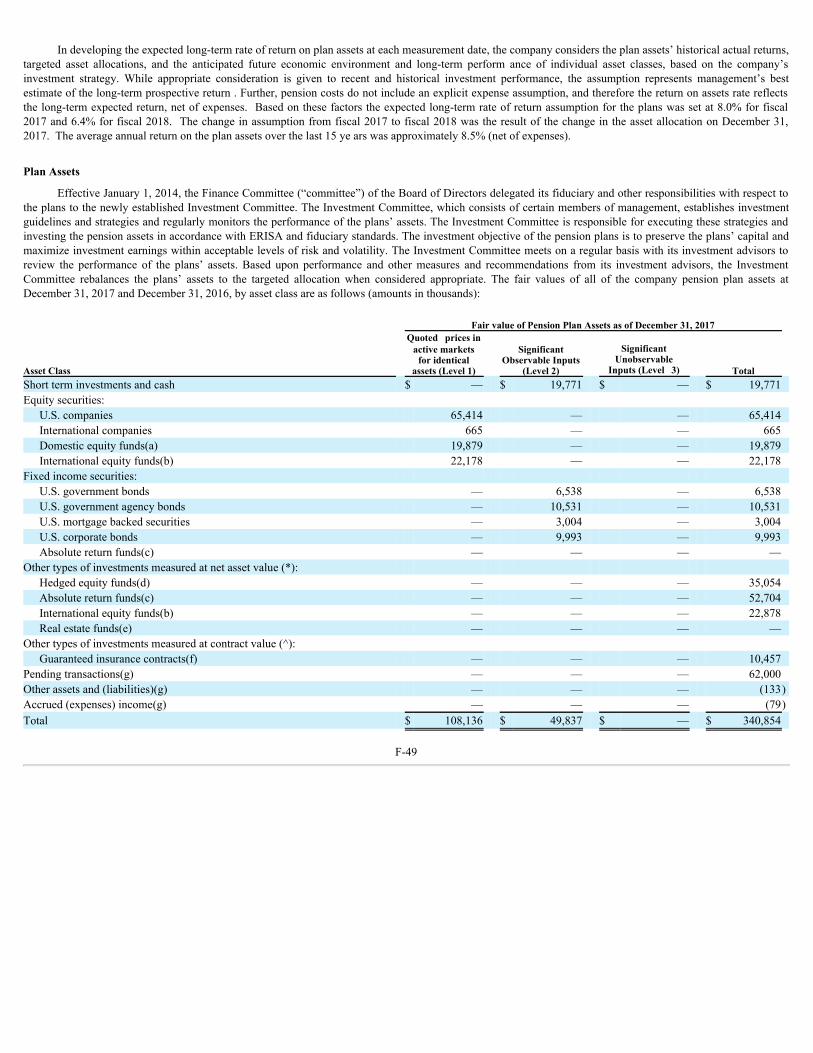
In developing the expected long-term rate of return on plan assets at each measurement date, the company considers the plan assets’ historical actual returns,
targeted asset allocations, and the anticipated future economic environment and long-term perform ance of individual asset classes, based on the company’sinvestment strategy. While appropriate consideration is given to recent and historical investment performance, the assumption represents management’s bestestimate of the long-term prospective return . Further, pension costs do not include an explicit expense assumption, and therefore the return on assets rate reflectsthe long-term expected return, net of expenses. Based on these factors the expected long-term rate of return assumption for the plans was set at 8.0% for fiscal2017 and 6.4% for fiscal 2018. The change in assumption from fiscal 2017 to fiscal 2018 was the result of the change in the asset allocation on December 31,2017. The average annual return on the plan assets over the last 15 ye ars was approximately 8.5% (net of expenses).
Plan Assets
Effective January 1, 2014, the Finance Committee (“committee”) of the Board of Directors delegated its fiduciary and other responsibilities with respect tothe plans to the newly established Investment Committee. The Investment Committee, which consists of certain members of management, establishes investmentguidelines and strategies and regularly monitors the performance of the plans’ assets. The Investment Committee is responsible for executing these strategies andinvesting the pension assets in accordance with ERISA and fiduciary standards. The investment objective of the pension plans is to preserve the plans’ capital andmaximize investment earnings within acceptable levels of risk and volatility. The Investment Committee meets on a regular basis with its investment advisors toreview the performance of the plans’ assets. Based upon performance and other measures and recommendations from its investment advisors, the InvestmentCommittee rebalances the plans’ assets to the targeted allocation when considered appropriate. The fair values of all of the company pension plan assets atDecember 31, 2017 and December 31, 2016, by asset class are as follows (amounts in thousands):
Fair value of Pension Plan Assets as of December 31, 2017
Asset Class
Quoted prices inactive markets
for identicalassets (Level 1)
SignificantObservable Inputs
(Level 2)
SignificantUnobservable
Inputs (Level 3) Total Short term investments and cash $ — $ 19,771 $ — $ 19,771 Equity securities:
U.S. companies 65,414 — — 65,414 International companies 665 — — 665 Domestic equity funds(a) 19,879 — — 19,879 International equity funds(b) 22,178 — — 22,178
Fixed income securities: U.S. government bonds — 6,538 — 6,538 U.S. government agency bonds — 10,531 — 10,531 U.S. mortgage backed securities — 3,004 — 3,004 U.S. corporate bonds — 9,993 — 9,993 Absolute return funds(c) — — — —
Other types of investments measured at net asset value (*): Hedged equity funds(d) — — — 35,054 Absolute return funds(c) — — — 52,704 International equity funds(b) — — — 22,878 Real estate funds(e) — — — —
Other types of investments measured at contract value (^): Guaranteed insurance contracts(f) — — — 10,457
Pending transactions(g) — — — 62,000 Other assets and (liabilities)(g) — — — (133)Accrued (expenses) income(g) — — — (79)Total $ 108,136 $ 49,837 $ — $ 340,854
F-49

Fair value of Pension Plan Assets as of December 31, 2016
Asset Class
Quoted prices inactive markets
for identicalassets (Level 1)
SignificantObservable Inputs
(Level 2)
SignificantUnobservable
Inputs (Level 3) Total Short term investments and cash $ — $ 4,712 $ — $ 4,712 Equity securities:
U.S. companies 88,427 — — 88,427 International companies 1,427 — — 1,427 Domestic equity funds(a) 47,916 — — 47,916 International equity funds(b) 22,914 — — 22,914
Fixed income securities: U.S. government bonds — 8,796 — 8,796 U.S. government agency bonds — 5,909 — 5,909 U.S. mortgage backed securities — 5,512 — 5,512 U.S. corporate bonds — 10,539 — 10,539 Absolute return funds(c) — — — —
Other types of investments measured at net asset value (*): Hedged equity funds(d) — — — 32,095 Absolute return funds(c) — — — 50,036 International equity funds(b) — — — 24,987 Real estate funds(e) — — — 17,296
Other types of investments measured at contract value (^): Guaranteed insurance contracts(f) — — — 10,124
Pending transactions 5,000 Other assets and (liabilities)(g) — — — 70 Accrued (expenses) income(g) — — — (97)Total $ 160,684 $ 35,468 $ — $ 335,663
(a) This class includes funds with the principal strategy to invest primarily in long positions in domestic equity securities.(b) This class includes funds with the principal strategy to invest primarily in long positions in international equity securities. This asset was reclassified from a
Level 2 to a Level 1 type for all periods. This asset was incorrectly presented as a Level 2.(c) This class invests primarily in absolute return strategy funds and are reported at NAV.(d) This class invests primarily in hedged equity funds.(e) This class includes funds that invest primarily in U.S. commercial real estate.(f) This class invests primarily guaranteed insurance contracts through various U.S. insurance companies.(g) This class includes accrued interest, dividends, and amounts receivable from asset sales and amounts payable for asset purchases. (*) Certain investments that are measured at fair value using the net asset value per share (or its equivalent) practical expedient have not been classified in the
fair value hierarchy.(^) Certain investments, which are fully-benefit responsive investment contracts, are measured at contract value and have not been classified in the fair value
hierarchy.
F-50

The company’s investment policy includes various guidelines and procedures designed to ensure the plan’s assets are invested in a manner necessary to
meet expected future benefits earned by participants. The investment guidelines consider a broad range of economic conditions. The plan asset allocation as of themeasurement dates December 31, 2017 and December 31, 2016, and target asset allocations for fiscal year 2017 are as follows:
Target
Allocation Percentage of Plan Assets at theMeasurement Date (As percent)
Asset Category 2018 2017 2016 Equity securities 15-45% 38.6 51.1 Fixed income securities 25-45% 27.1 9.3 Real estate — — 5.2 Other diversifying strategies(1) 0-40% 28.8 33.5 Short term investments and cash 0-10% 5.5 0.9
Total 100.0 100.0
(1) Includes absolute return funds, hedged equity funds, and guaranteed insurance contracts.
Equity securities include 2,030,363 shares and 2,030,363 shares of the company’s common stock in the amount of $39.2 million and $40.5 million (11.5%and 12.1% of total plan assets) as of December 31, 2017 and December 31, 2016, respectively.
The objectives of the target allocations are to maintain investment portfolios that diversify risk through prudent asset allocation parameters, achieve assetreturns that meet or exceed the plans’ actuarial assumptions, and achieve asset returns that are competitive with like institutions employing similar investmentstrategies.
Cash Flows
Company contributions to qualified and nonqualified plans are as follows (amounts in thousands):
Year Required Discretionary Total 2017 $ 286 $ 1,605 $ 1,891 2016 $ 341 $ 1,000 $ 1,341 2015 $ 436 $ 10,000 $ 10,436
All contributions are made in cash. The required contributions made during fiscal 2017 include $0.3 million in nonqualified pension benefits paid from
corporate assets. The discretionary contributions of $1.6 million made to qualified plans during fiscal 2017 were not required to be made by the minimum fundingrequirements of ERISA, but the company believed, due to its strong cash flow and financial position, this was an appropriate time at which to make the contributionin order to reduce the impact of future contributions. During fiscal 2018, the company expects to pay $0.3 million in nonqualified pension benefits from corporateassets. There are no expected contributions to the qualified pension plans required under ERISA and the PPA during fiscal 2018; however, the company made a$10.0 million discretionary contribution to Plan No. 1 in early fiscal 2018. These amounts represent estimates that are based on assumptions that are subject tochange.
F-51

Benefit Payments
The following are benefits paid under the plans (including settlements) during fiscal years 2017, 2016 and 2015 and expected to be paid from fiscal 2018through fiscal 2027. Estimated future payments include qualified pension benefits that will be paid from the plans’ assets (including potential payments for thelump sum option discussed above) and nonqualified pension benefits that will be paid from corporate assets (amounts in thousands):
Year Pension Benefits 2015 $ 25,014 2016 $ 40,864 *2017 $ 38,776 ^Estimated Future Payments: 2018 $ 35,458 2019 $ 34,025 2020 $ 32,945 2021 $ 32,023 2022 $ 31,040 2023 – 2027 $ 122,992
* Includes $15.7 million and $1.6 million from Plan No. 1 and Plan No. 2, respectively paid as lump sums. ^ Includes $14.4 million and $1.6 million from Plan No. 1 and Plan No. 2, respectively, paid as lump sums.
Postretirement Benefit Plans
The company sponsors postretirement benefit plans that provide health care and life insurance benefits to retirees who meet certain eligibility requirements.Generally, this includes employees with at least 10 years of service who have reached age 55 and participate in a Flowers retirement plan. Retiree medical coverageis provided for a period of three to five years, depending on the participant’s age and service at retirement. Participant premiums are determined using COBRApremium levels. Retiree life insurance benefits are offered to a closed group of retirees. The company also sponsors a medical, dental, and life insurance benefitsplan to a limited and closed group of participants.
The company delivers retiree medical and dental benefits for Medicare eligible retirees through a health-care reimbursement account. The company nolonger sponsors a medical plan for Medicare eligible retirees and does not file for a Medicare Part D subsidy.
The net periodic benefit (income) cost for the company’s postretirement benefit plans includes the following components for fiscal years 2017, 2016 and2015 (amounts in thousands):
Fiscal 2017 Fiscal 2016 Fiscal 2015 Service cost $ 256 $ 401 $ 398 Interest cost 227 309 360 Amortization:
Prior service credit (212) (212) (267)Actuarial gain (497) (454) (583)
Total net periodic benefit income (226) 44 (92)Other changes in plan assets and benefit obligations recognized in other comprehensive income: Current year actuarial (gain) loss* 188 (2,354) (159)Amortization of actuarial gain 497 454 583 Amortization of prior service credit 212 212 267 Total recognized in other comprehensive loss 897 (1,688) 691 Total recognized in net periodic benefit cost and other comprehensive (income) loss $ 671 $ (1,644) $ 599
* In 2015, includes (gain) loss related to (higher) lower than expected Medicare Part D subsidy receipts.
F-52

Approximately $(0.6) million will be amortized from accumulated other comprehensive income into net periodic benefit cost in fiscal year 2018 relating tothe company’s postretirement benefit plans.
The unfunded status and the amounts recognized in the Consolidated Balance Sheets for the company’s postretirement benefit plans are as follows (amountsin thousands):
December 30, 2017 December 31, 2016 Change in benefit obligation:
Benefit obligation at beginning of year $ 7,648 $ 10,133 Service cost 256 401 Interest cost 227 309 Participant contributions 330 284 Actuarial loss (gain) 188 (2,354)Benefits paid (706) (1,125)Benefit obligation at end of year $ 7,943 $ 7,648
Change in plan assets: Fair value of plan assets at beginning of year $ — $ — Employer contributions 376 841 Participant contributions 330 284 Benefits paid (706) (1,125)Fair value of plan assets at end of year $ — $ —
Funded status, end of year: Fair value of plan assets $ — $ — Benefit obligations (7,943) (7,648)Unfunded status and amount recognized at end of year $ (7,943) $ (7,648)
Amounts recognized in the balance sheet: Current liability $ (674) $ (688)Noncurrent liability (7,269) (6,960)Amount recognized at end of year $ (7,943) $ (7,648)
Amounts recognized in accumulated other comprehensive loss: Net actuarial gain before taxes $ (3,846) $ (4,531)Prior service credit before taxes (262) (474)Amounts recognized in accumulated other comprehensive loss $ (4,108) $ (5,005)
Assumptions used in accounting for the company’s postretirement benefit plans at each of the respective fiscal years ending are as follows:
Fiscal 2017 Fiscal 2016 Fiscal 2015
Weighted average assumptions used to determine benefit obligations: Measurement date 12/31/2017 12/31/2016 12/31/2015 Discount rate 3.36% 3.66% 3.83%
Health care cost trend rate used to determine benefit obligations: Initial rate 6.00% 6.50% 8.00%Ultimate rate 5.00% 5.00% 5.00%Year trend reaches the ultimate rate 2022 2023 2022
Weighted average assumptions used to determine net periodic cost: Measurement date 1/1/2017 1/1/2016 1/1/2015 Discount rate 3.66% 3.83% 3.50%
Health care cost trend rate used to determine net periodic cost: Initial rate 6.50% 8.00% 8.00%Ultimate rate 5.00% 5.00% 5.00%Year trend reaches the ultimate rate 2023 2022 2021
F-53

Assumed health care cost trend rates have a significant effect on the amounts reported for the health care plans. A one-percentage-point change in assumed
health care cost trend rates would have the following effects for fiscal years 2017, 2016, and 2015 (amounts in thousands):
One-Percentage-Point Decrease One-Percentage-Point Increase For the Year Ended For the Year Ended Fiscal 2017 Fiscal 2016 Fiscal 2015 Fiscal 2017 Fiscal 2016 Fiscal 2015
Effect on total of service and interest cost $ (47) $ (58) $ (65) $ 55 $ 67 $ 76 Effect on postretirement benefit obligation $ (473) $ (427) $ (554) $ 533 $ 480 $ 626
Cash Flows
Company contributions to postretirement plans are as follows (amounts in thousands):
Year Employer NetContribution
2015 $ 674 2016 $ 841 2017 $ 376 2018 (Expected) $ 680
The table above reflects only the company’s share of the benefit cost. Since the company no longer receives reimbursement for Medicare Part D subsidies,
the entire $0.7 million expected funding for postretirement benefit plans during 2018 will be required to pay for benefits. Contributions by participants topostretirement benefits were $0.3 million, $0.3 million, and $0.2 million for fiscal years 2017, 2016, and 2015, respectively.
Benefit Payments
The following are benefits paid by the company during fiscal years 2017, 2016 and 2015 and expected to be paid from fiscal 2018 through fiscal 2027. Allbenefits are expected to be paid from the company’s assets (amounts in thousands):
Postretirement
benefits
Year Employer gross
contribution 2015 $ 674 2016 $ 841 2017 $ 376 Estimated Future Payments: 2018 $ 680 2019 $ 735 2020 $ 708 2021 $ 699 2022 $ 692 2023 – 2027 $ 3,477
Multiemployer Plans
The company contributes to various multiemployer pension plans. Benefits provided under the multiemployer pension plans are generally based on years ofservice and employee age. Expense under these plans was $2.1 million for fiscal 2017, $2.2 million for fiscal 2016, and $2.1 million for fiscal 2015.
F-54
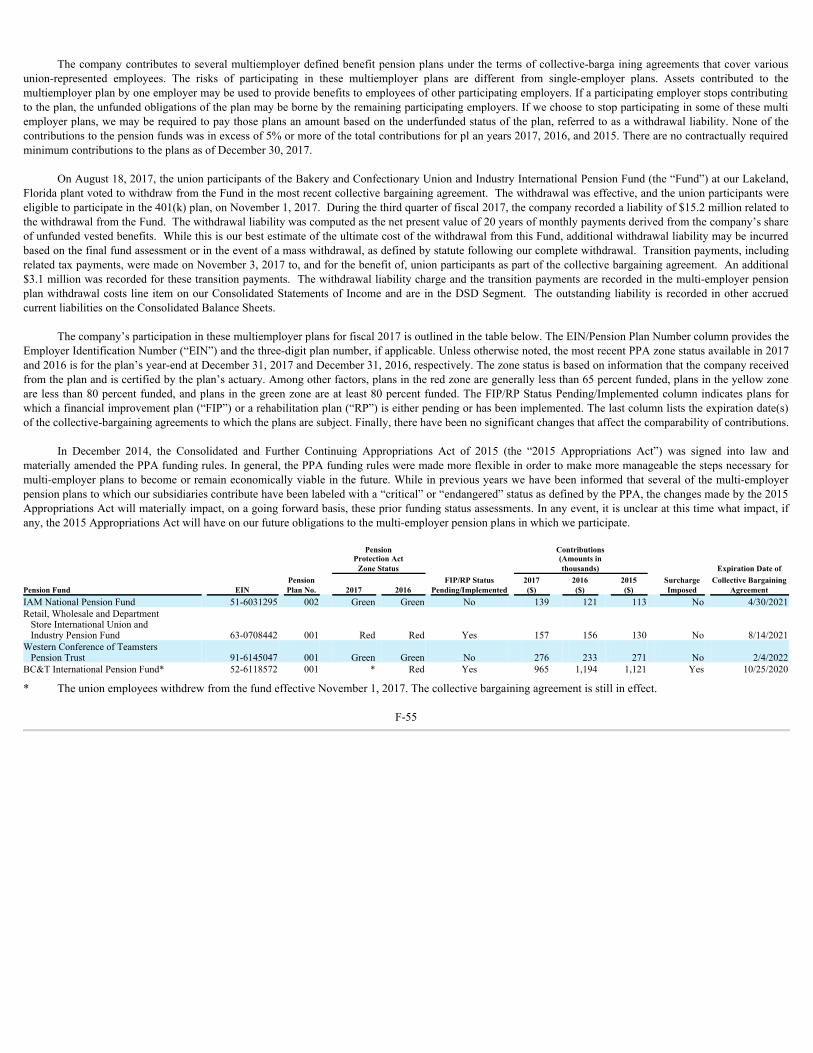
The company contributes to several multiemployer defined benefit pension plans under the terms of collective-barga ining agreements that cover variousunion-represented employees. The risks of participating in these multiemployer plans are different from single-employer plans. Assets contributed to themultiemployer plan by one employer may be used to provide benefits to employees of other participating employers. If a participating employer stops contributingto the plan, the unfunded obligations of the plan may be borne by the remaining participating employers. If we choose to stop participating in some of these multiemployer plans, we may be required to pay those plans an amount based on the underfunded status of the plan, referred to as a withdrawal liability. None of thecontributions to the pension funds was in excess of 5% or more of the total contributions for pl an years 2017, 2016, and 2015. There are no contractually requiredminimum contributions to the plans as of December 30, 2017.
On August 18, 2017, the union participants of the Bakery and Confectionary Union and Industry International Pension Fund (the “Fund”) at our Lakeland,Florida plant voted to withdraw from the Fund in the most recent collective bargaining agreement. The withdrawal was effective, and the union participants wereeligible to participate in the 401(k) plan, on November 1, 2017. During the third quarter of fiscal 2017, the company recorded a liability of $15.2 million related tothe withdrawal from the Fund. The withdrawal liability was computed as the net present value of 20 years of monthly payments derived from the company’s shareof unfunded vested benefits. While this is our best estimate of the ultimate cost of the withdrawal from this Fund, additional withdrawal liability may be incurredbased on the final fund assessment or in the event of a mass withdrawal, as defined by statute following our complete withdrawal. Transition payments, includingrelated tax payments, were made on November 3, 2017 to, and for the benefit of, union participants as part of the collective bargaining agreement. An additional$3.1 million was recorded for these transition payments. The withdrawal liability charge and the transition payments are recorded in the multi-employer pensionplan withdrawal costs line item on our Consolidated Statements of Income and are in the DSD Segment. The outstanding liability is recorded in other accruedcurrent liabilities on the Consolidated Balance Sheets.
The company’s participation in these multiemployer plans for fiscal 2017 is outlined in the table below. The EIN/Pension Plan Number column provides theEmployer Identification Number (“EIN”) and the three-digit plan number, if applicable. Unless otherwise noted, the most recent PPA zone status available in 2017and 2016 is for the plan’s year-end at December 31, 2017 and December 31, 2016, respectively. The zone status is based on information that the company receivedfrom the plan and is certified by the plan’s actuary. Among other factors, plans in the red zone are generally less than 65 percent funded, plans in the yellow zoneare less than 80 percent funded, and plans in the green zone are at least 80 percent funded. The FIP/RP Status Pending/Implemented column indicates plans forwhich a financial improvement plan (“FIP”) or a rehabilitation plan (“RP”) is either pending or has been implemented. The last column lists the expiration date(s)of the collective-bargaining agreements to which the plans are subject. Finally, there have been no significant changes that affect the comparability of contributions.
In December 2014, the Consolidated and Further Continuing Appropriations Act of 2015 (the “2015 Appropriations Act”) was signed into law andmaterially amended the PPA funding rules. In general, the PPA funding rules were made more flexible in order to make more manageable the steps necessary formulti-employer plans to become or remain economically viable in the future. While in previous years we have been informed that several of the multi-employerpension plans to which our subsidiaries contribute have been labeled with a “critical” or “endangered” status as defined by the PPA, the changes made by the 2015Appropriations Act will materially impact, on a going forward basis, these prior funding status assessments. In any event, it is unclear at this time what impact, ifany, the 2015 Appropriations Act will have on our future obligations to the multi-employer pension plans in which we participate.
Pension
Protection Act Contributions(Amounts in
Zone Status thousands) Expiration Date of Pension FIP/RP Status 2017 2016 2015 Surcharge Collective Bargaining
Pension Fund EIN Plan No. 2017 2016 Pending/Implemented ($) ($) ($) Imposed AgreementIAM National Pension Fund 51-6031295 002 Green Green No 139 121 113 No 4/30/2021Retail, Wholesale and Department Store International Union and Industry Pension Fund 63-0708442 001 Red Red Yes 157 156 130 No 8/14/2021Western Conference of Teamsters Pension Trust 91-6145047 001 Green Green No 276 233 271 No 2/4/2022BC&T International Pension Fund* 52-6118572 001 * Red Yes 965 1,194 1,121 Yes 10/25/2020
* The union employees withdrew from the fund effective November 1, 2017. The collective bargaining agreement is still in effect.
F-55

401(k) Retirement Savings Plans
The Flowers Foods 401(k) Retirement Savings Plan covers substantially all of the company’s employees who have completed certain service requirements.During fiscal years 2017, 2016, and 2015, the total cost and employer contributions were as follows (amounts in thousands):
Contributions by fiscal year
Definedcontribution
plans expense Fiscal 2017 $ 28,346 Fiscal 2016 $ 27,057 Fiscal 2015 $ 25,473
The company acquired DKB and Alpine during fiscal 2015, at the time of each acquisition we assumed sponsorship of a 401(k) savings plan. We mergedthese two plans into the Flowers Foods 401(k) Retirement Savings Plan during fiscal 2016 after receipt of final determination letters. Note 22. Income Taxes
On December 22, 2017, the President enacted the Act, which, beginning in fiscal 2018, will reduce our corporate statutory rate from 35% to 21%, repeal thedomestic manufacturing deduction, and increase certain permanent differences. As a result of the impacts of the Act, the SEC provided guidance that allows thecompany to record provisional amounts for those impacts, with the requirement that the accounting be completed in a period not to exceed one year from the dateof enactment. As such, the company’s financial results reflect the income tax effects of the Act for which the accounting is complete, and provisional amounts forthose specific income tax effects of the Act for which the accounting is incomplete, but a reasonable estimate could be determined.
Our estimate of the deferred tax benefit due to the revaluation of our net U.S. deferred tax liabilities is a provisional amount under the SEC’s guidance. Due
to the different federal income tax rates in effect for fiscal 2017 (35%) and fiscal 2018 (21%), timing differences that are estimated balances as of the date ofenactment and year-end will result in changes to our estimate of the deferred rate change when those estimates are finalized with the filing of the 2017 income taxreturn. Since many of the year-end deferred tax balances include estimates of events that have not yet occurred, such as payments expected to be made during 2018that are deductible on the 2017 tax return, these amounts are not certain and the impact of the tax rate change cannot be finalized .
During fiscal 2017, we recorded a $48.2 million provisional discrete tax benefit from revaluing our net U.S. deferred tax liabilities to reflect the new U.S.corporate tax rate. The company also recognized a provisional reduction to current tax expense of approximately $8.3 million attributable to pension contributionsand bonus depreciation on certain assets placed into service during fiscal 2017 offset with a corresponding income tax expense of $0.7 million for the impact on the2017 domestic manufacturing deduction. These provisional adjustments resulted in a decrease in income taxes payable of $7.6 million. The income tax effects forthese positions require further analysis, and the ultimate impact may differ from these provisional amounts due to this analysis, changes to estimates, additionalregulatory guidance that may be issued by federal or state jurisdictions, changes in interpretations and assumptions the company has made, and actions thecompany may take because of tax reform. This analysis is expected to be completed in the second half of fiscal 2018.
The company’s provision for income tax expense (benefit) consists of the following for fiscal years 2017, 2016 and 2015 (amounts in thousands):
Fiscal 2017 Fiscal 2016 Fiscal 2015 Current Taxes:
Federal $ 53,076 $ 86,235 $ 75,128 State 7,403 13,983 10,419
60,479 100,218 85,547 Deferred Taxes:
Federal (59,385) (11,656) 16,236 State (1,921) (2,801) 2,057
(61,306) (14,457) 18,293 Income tax expense (benefit) $ (827) $ 85,761 $ 103,840
F-56

Income tax expense (benefit) differs from the amount computed by applying the applicable U.S. federal income tax rate (35%) because of the effect of the
following items for fiscal years 2017, 2016, and 2015 (amounts in thousands):
Fiscal 2017 Fiscal 2016 Fiscal 2015 Tax at U.S. federal income tax rate $ 52,253 $ 87,338 $ 102,560 State income taxes, net of federal income tax benefit 3,564 7,266 8,556 Tax reform impact (48,160) — — Section 199 qualifying production activities benefit (5,422) (8,007) (6,725)Net share-based payments windfalls* (1,001) — — Other (2,061) (836) (551)
Income tax expense (benefit) $ (827) $ 85,761 $ 103,840
* Applied beginning in fiscal 2017 upon adoption of new guidance.
In 2017, the most significant differences in the effective rate and the statutory rate is the revaluation of net deferred tax liabilities resulting from the Act.
Absent the Act, the most significant differences in the effective rate and the statutory rate are state income taxes offset by reductions for the Section 199 qualifyingproduction activities deduction.
Deferred tax assets (liabilities) are comprised of the following (amounts in thousands):
December 30, 2017 December 31, 2016 Self-insurance $ 4,972 $ 7,051 Compensation and employee benefits 8,836 13,512 Deferred income 8,705 10,893 Loss and credit carryforwards 13,453 19,556 Equity-based compensation 6,831 11,890 Hedging 2,754 676 Pension and postretirement benefits 13,344 27,537 Intangible assets 2,707 4,548 Other 9,657 16,801 Deferred tax assets valuation allowance (111) (18)
Deferred tax assets 71,148 112,446 Depreciation (47,552) (75,569)Intangible assets (104,597) (179,491)Other (1,975) (3,240)
Deferred tax liabilities (154,124) (258,300)Net deferred tax liability $ (82,976) $ (145,854)
The company has a deferred tax asset of $4.0 million related to a federal net operating loss carryforward which we expect to fully utilize before expiration.
Additionally, the company and various subsidiaries have a net deferred tax asset of $6.2 million related to state net operating loss carryforwards, and $3.1 millionfor credit carryforwards with expiration dates through fiscal 2036. The utilization of a portion of these state carryforwards could be limited in the future; therefore,an insignificant valuation allowance has been recorded. Should the company determine at a later date that certain of these losses which have been reserved for maybe utilized, a benefit may be recognized in the Consolidated Statements of Income. Likewise, should the company determine at a later date that certain of these netoperating losses for which a deferred tax asset has been recorded may not be utilized, a charge to the Consolidated Statements of Income may be necessary.
The gross amount of unrecognized tax benefits was $1.3 million and $1.8 million as of December 30, 2017 and December 31, 2016, respectively. Thischange is due to the expiration of the statute of limitations on several previously unrecognized tax benefits. These amounts are exclusive of interest accrued and arerecorded in other long-term liabilities on the Consolidated Balance Sheet. If recognized, the $1.3 million (less $0.3 million related to tax imposed in otherjurisdictions) would impact the effective rate.
The company accrues interest expense and penalties related to income tax liabilities as a component of income before taxes. No accrual of penalties isreflected on the company’s balance sheet as the company believes the accrual of penalties is not necessary based upon the merits of its income tax positions. Thecompany had an accrued interest balance of approximately $0.1 million and $0.2 million at December 30, 2017 and December 31, 2016, respectively.
F-57

The company defines the federal jurisdiction as well as various state jurisdictions as “major” jurisdictions. The company is no longer s ubject to federalexaminations for years prior to 2015, and with limited exceptions, for years prior to 2013 in state jurisdictions.
The following is a reconciliation of the total amounts of unrecognized tax benefits for fiscal years 2017, 2016 and 2015 (amounts in thousands):
Fiscal 2017 Fiscal 2016 Fiscal 2015 Unrecognized tax benefit at beginning of fiscal year $ 1,754 $ 727 $ 2,107 Gross increases — 1,488 — Lapses of statutes of limitations (495) (461) (1,380)Unrecognized tax benefit at end of fiscal year $ 1,259 $ 1,754 $ 727
At this time, we do not anticipate significant changes to the amount of gross unrecognized tax benefits over the next twelve months.
Note 23. Commitments and Contingencies
Self-insurance reserves and other commitments and contingencies
The company has recorded current liabilities of $30.1 million and $28.0 million related to self-insurance reserves at December 30, 2017 and December 31,2016, respectively. The reserves include an estimate of expected settlements on pending claims, defense costs and a provision for claims incurred but not reported.These estimates are based on the company’s assessment of potential liability using an analysis of available information with respect to pending claims, historicalexperience and current cost trends. The amount of the company’s ultimate liability in respect of these matters may differ materially from these estimates.
In the event the company ceases to utilize the independent distributor model or exits a geographic market, the company is contractually required in somesituations to purchase the distribution rights from the independent distributor. The company expects to continue operating under this model and has concluded thatthe possibility of a loss is remote.
The company’s facilities are subject to various federal, state and local laws and regulations regarding the discharge of material into the environment and theprotection of the environment in other ways. The company is not a party to any material proceedings arising under these regulations. The company believes thatcompliance with existing environmental laws and regulations will not materially affect the consolidated financial condition, results of operations, cash flows or thecompetitive position of the company. The company believes it is currently in substantial compliance with all material environmental regulations affecting thecompany and its properties. On August 9, 2016, the U.S. Department of Labor (the “DOL”) notified the company that it was scheduled for a compliance reviewunder the Fair Labor Standards Act (“FLSA”). The company is cooperating with the DOL.
Litigation
The company and its subsidiaries from time to time are parties to, or targets of, lawsuits, claims, investigations and proceedings, including personal injury,commercial, contract, environmental, antitrust, product liability, health and safety and employment matters, which are being handled and defended in the ordinarycourse of business. While the company is unable to predict the outcome of these matters, it believes, based upon currently available facts, that it is remote that theultimate resolution of any such pending matters will have a material adverse effect on its overall financial condition, results of operations or cash flows in thefuture. However, adverse developments could negatively impact earnings in a particular future fiscal period.
F-58

At this time, the company is defending 33 complaints filed by distributors alleging that such distributors were misclassified as independent contractors. Twenty-two of these lawsuits seek class and/or collective action treatment. The remaining 11 cases allege individual claims and do not seek class or collective actiontreatment. The respective courts have ruled on plaintiffs’ motions for class certification i n 16 of the pending cases, each of which is discussed below. Unlessotherwise noted, a class was conditionally certified under the FLSA in each of the cases described below, although the company has the ability to petition the courtto decertify that clas s at a later date : Case Name Case No. Venue Date Filed StatusMartinez et al. v. FlowersFoods, Inc., Flowers BakeriesBrands, Inc., Flowers BakingCo. of California, LLC, andFlowers Baking Co. ofHenderson, LLC
2:15-cv-05112 16-56327
U.S. District Court Central District ofCalifornia U.S. Court of Appeals for the Ninth Circuit
7/7/2015 The court denied a motion to certifyPlaintiffs’ California state law claims againstDefendants as a class action. This lawsuitwas settled on confidential terms on June 29,2016, and thereafter dismissed withprejudice. The denial of the classcertification is currently on appeal to theU.S. Court of Appeals for the Ninth Circuit
Rosinbaum et al. v. FlowersFoods, Inc. and FranklinBaking Co., LLC
7:16-cv-00233 U.S. District Court Eastern District of NorthCarolina
12/1/2015
Coyle v. Flowers Foods, Inc.and Holsum Bakery, Inc.
2:15-cv-01372 U.S. District Court District of Arizona 7/20/2015 On October 4, 2017, the parties filed withthe court a Motion for Preliminary Approvalof Class Action Settlement informing thecourt that the parties reached an agreementto settle this matter for a payment of $4.3million, comprised of $1.2 million insettlement funds, $2.9 million in attorneys’fees, and $0.2 million as an incentive forclass members who are active distributorsnot to opt out of certain portions of the newdistributor agreement. This settlementcharge has been recorded as a selling,distribution and administrative expense inour Consolidated Statements of Incomeduring the third quarter of fiscal 2017. Theparties are working to obtain final courtapproval of the settlement.
F-59

Case Name Case No. Venue Date Filed StatusMcCurley v. Flowers Foods,Inc. and Derst Baking Co.,LLC
5:16-cv-00194 U.S. District Court District of SouthCarolina
1/20/2016 On December 7, 2017, the parties reached anagreement in principal to settle this matterfor a payment of $1.5 million, comprised of$0.8 million in settlement funds, $0.6million in attorneys’ fees, and a collective$0.1 million for a service award and as anincentive for class members who are activedistributors not to opt out of certain portionsof the new distributor agreement. Thissettlement charge has been recorded as aselling, distribution and administrativeexpense in our Consolidated Statements ofIncome during the fourth quarter of fiscal2017. The parties are working to obtaincourt approval of the settlement.
Neff et al. v. Flowers Foods,Inc., Lepage Bakeries ParkStreet, LLC, and CK SalesCo., LLC
5:15-cv-00254 U.S. District Court District of Vermont 12/2/2015
Noll v. Flowers Foods, Inc.,Lepage Bakeries Park Street,LLC, and CK Sales Co., LLC
1:15-cv-00493 U.S. District Court District of Maine 12/3/2015
Zapata et al. v. FlowersFoods, Inc. and FlowersBaking Co. of Houston, LLC
4:16-cv-00676 U.S. District Court Southern District ofTexas
3/14/2016
Rodriguez et al. v. FlowersFoods, Inc. and FlowersBaking Co. of Houston, LLC
4:16-cv-00245 U.S. District Court Southern District ofTexas
1/28/2016
Richard et al. v. FlowersFoods, Inc., Flowers BakingCo. of Lafayette, LLC,Flowers Baking Co. of BatonRouge, LLC, Flowers BakingCo. of Tyler, LLC andFlowers Baking Co. of NewOrleans, LLC
6:15-cv-02557 U.S. District Court Western District ofLouisiana
10/21/2015
Carr et al. v. Flowers Foods,Inc. and Flowers Baking Co.of Oxford, Inc.
2:15-cv-06391 U.S. District Court Eastern District ofPennsylvania
12/1/2015
Boulange v. Flowers Foods,Inc. and Flowers Baking Co.of Oxford, Inc.
2:16-cv-02581 U.S. District Court Eastern District ofPennsylvania
3/25/2016 This matter has been consolidated with theCarr litigation described immediately above.
F-60
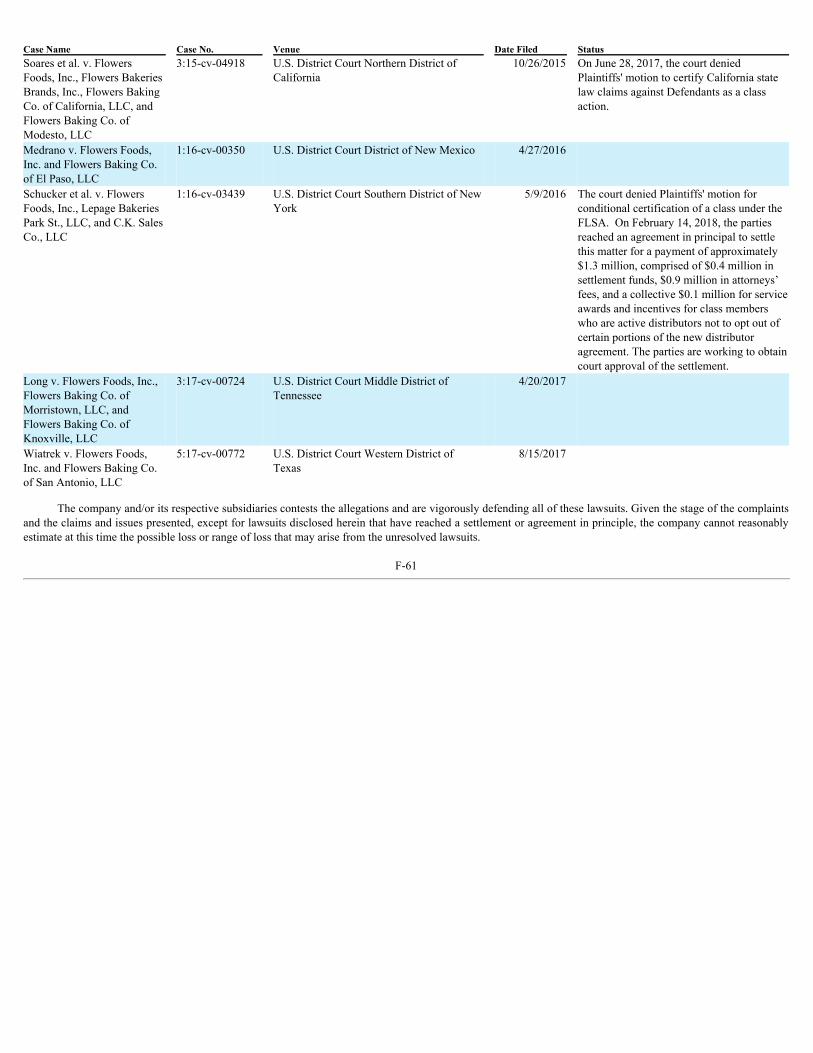
Case Name Case No. Venue Date Filed StatusSoares et al. v. FlowersFoods, Inc., Flowers BakeriesBrands, Inc., Flowers BakingCo. of California, LLC, andFlowers Baking Co. ofModesto, LLC
3:15-cv-04918 U.S. District Court Northern District ofCalifornia
10/26/2015 On June 28, 2017, the court deniedPlaintiffs' motion to certify California statelaw claims against Defendants as a classaction.
Medrano v. Flowers Foods,Inc. and Flowers Baking Co.of El Paso, LLC
1:16-cv-00350 U.S. District Court District of New Mexico 4/27/2016
Schucker et al. v. FlowersFoods, Inc., Lepage BakeriesPark St., LLC, and C.K. SalesCo., LLC
1:16-cv-03439 U.S. District Court Southern District of NewYork
5/9/2016 The court denied Plaintiffs' motion forconditional certification of a class under theFLSA. On February 14, 2018, the partiesreached an agreement in principal to settlethis matter for a payment of approximately$1.3 million, comprised of $0.4 million insettlement funds, $0.9 million in attorneys’fees, and a collective $0.1 million for serviceawards and incentives for class memberswho are active distributors not to opt out ofcertain portions of the new distributoragreement. The parties are working to obtaincourt approval of the settlement.
Long v. Flowers Foods, Inc.,Flowers Baking Co. ofMorristown, LLC, andFlowers Baking Co. ofKnoxville, LLC
3:17-cv-00724 U.S. District Court Middle District ofTennessee
4/20/2017
Wiatrek v. Flowers Foods,Inc. and Flowers Baking Co.of San Antonio, LLC
5:17-cv-00772 U.S. District Court Western District ofTexas
8/15/2017
The company and/or its respective subsidiaries contests the allegations and are vigorously defending all of these lawsuits. Given the stage of the complaintsand the claims and issues presented, except for lawsuits disclosed herein that have reached a settlement or agreement in principle, the company cannot reasonablyestimate at this time the possible loss or range of loss that may arise from the unresolved lawsuits.
F-61
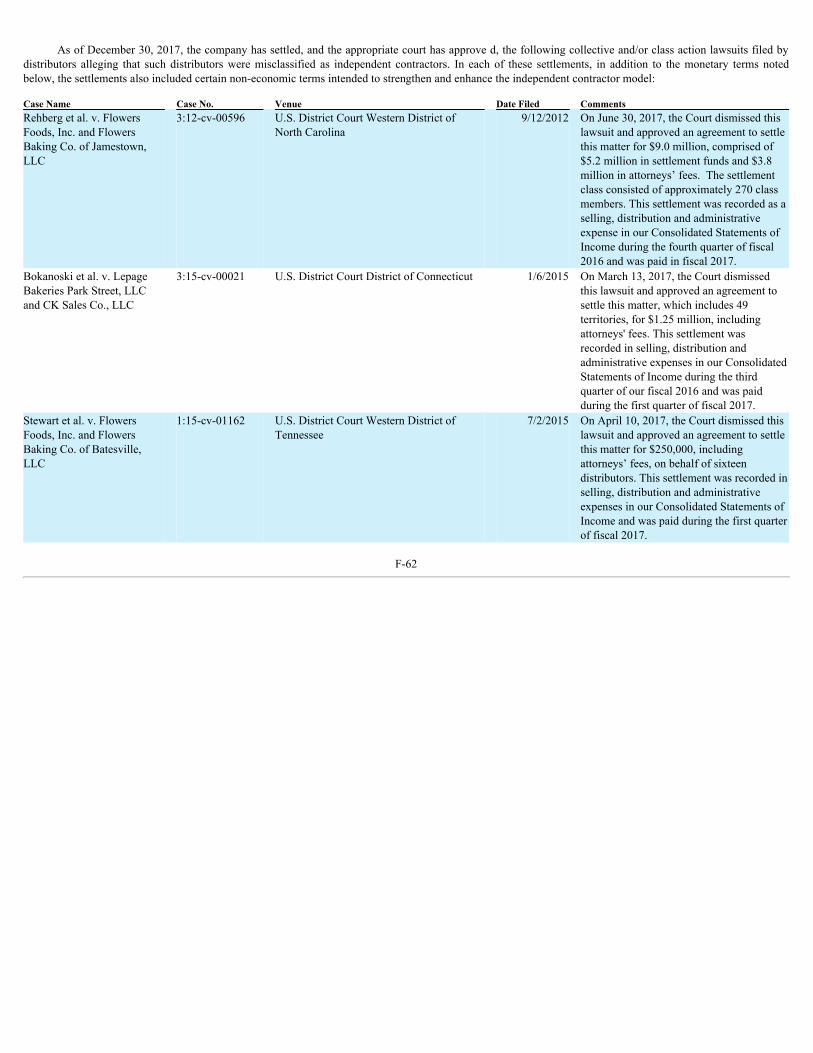
As of December 30, 2017, the company has settled, and the appropriate court has approve d, the following collective and/or class action lawsuits filed by
distributors alleging that such distributors were misclassified as independent contractors. In each of these settlements, in addition to the monetary terms notedbelow, the settlements also included certain non-economic terms intended to strengthen and enhance the independent contractor model:
Case Name Case No. Venue Date Filed CommentsRehberg et al. v. FlowersFoods, Inc. and FlowersBaking Co. of Jamestown,LLC
3:12-cv-00596 U.S. District Court Western District ofNorth Carolina
9/12/2012 On June 30, 2017, the Court dismissed thislawsuit and approved an agreement to settlethis matter for $9.0 million, comprised of$5.2 million in settlement funds and $3.8million in attorneys’ fees. The settlementclass consisted of approximately 270 classmembers. This settlement was recorded as aselling, distribution and administrativeexpense in our Consolidated Statements ofIncome during the fourth quarter of fiscal2016 and was paid in fiscal 2017.
Bokanoski et al. v. LepageBakeries Park Street, LLCand CK Sales Co., LLC
3:15-cv-00021 U.S. District Court District of Connecticut 1/6/2015 On March 13, 2017, the Court dismissedthis lawsuit and approved an agreement tosettle this matter, which includes 49territories, for $1.25 million, includingattorneys' fees. This settlement wasrecorded in selling, distribution andadministrative expenses in our ConsolidatedStatements of Income during the thirdquarter of our fiscal 2016 and was paidduring the first quarter of fiscal 2017.
Stewart et al. v. FlowersFoods, Inc. and FlowersBaking Co. of Batesville,LLC
1:15-cv-01162 U.S. District Court Western District ofTennessee
7/2/2015 On April 10, 2017, the Court dismissed thislawsuit and approved an agreement to settlethis matter for $250,000, includingattorneys’ fees, on behalf of sixteendistributors. This settlement was recorded inselling, distribution and administrativeexpenses in our Consolidated Statements ofIncome and was paid during the first quarterof fiscal 2017.
F-62

On August 12, 2016, a class action complaint was filed in the U.S. District Court for the Southern District of New York by Chris B. Hendley (the “Hendleycomplaint”) against the company and certain senior members of management (collectively, the “defendants”). On August 17, 2016, another class action complaintwas filed in the U.S. District Court for the Southern District of New York by Scott Dovell, II (the “Dovell complaint” and togethe r with the Hendley complaint, the“complaints”) against the defendants. Plaintiffs in the complaints are securities holders that acquired company securities between February 7, 2013 and August 10,2016. The complaints generally allege that the defendants m ade materially false and/or misleading statements and/or failed to disclose that (1) the company’s laborpractices were not in compliance with applicable federal laws and regulations; (2) such non-compliance exposed the company to legal liability and/or ne gativeregulatory action; and (3) as a result, the defendants’ statements about the company’s business, operations, and prospects were false and misleading and/or lacked areasonable basis. The counts of the complaints are asserted against the defendants p ursuant to Sections 10(b) and 20(a) of the Exchange Act and Rule 10b-5 underthe Exchange Act. The complaints seek (1) class certification under the Federal Rules of Civil Procedure, (2) compensatory damages in favor of the plaintiffs andall other class m embers against the defendants, jointly and severally, for all damages sustained as a result of wrongdoing, in an amount to be proven at trial,including interest, and (3) awarding plaintiffs and the class their reasonable costs and expenses incurred in the actions, including counsel and expert fees. OnOctober 21, 2016, the U.S. District Court for the Southern District of New York consolidated the complaints into one action captioned “In re Flowers Foods, Inc.Securities Litigation” (the “consolidated actio n”), appointed Walter Matthews as lead plaintiff (“lead plaintiff”), and appointed Glancy Prongay & Murray LLPand Johnson & Weaver, LLP as co-lead counsel for the putative class. On November 21, 2016, the court granted defendants’ and lead plaintiff’s jo int motion totransfer the consolidated action to the U.S. District Court for the Middle District of Georgia. Lead plaintiff filed his Consolidated Class Action Complaint onJanuary 12, 2017, raising the same counts and general allegations and seeking the same relief as the Dovell and Hendley complaints. On March 13, 2017, thecompany filed a motion to dismiss the lawsuit which remains pending before the court at this time. The company and/or its respective subsidiaries are vigorouslydefending these laws uits. Given the stage of the complaints and the claims and issues presented, the company cannot reasonably estimate at this time the possibleloss or range of loss, if any, that may arise from the unresolved lawsuits.
See Note 14, Debt, Lease and Other Commitments , for additional information on the company’s commitments. Note 24. Segment Reporting
The company’s DSD Segment primarily produces fresh packaged breads, buns, rolls, tortillas, and snack cakes and the Warehouse Segment produces freshand frozen bread and rolls and snack cakes.
The company purchased DKB and Alpine during fiscal 2015. See Note 10, Acquisitions , for more detailed disclosures for these acquisitions. DKB isincluded in our DSD Segment and Alpine is included in our Warehouse Segment. Their results from operations and impact on our total assets are included in thetables below in their respective segment.
F-63

The company evaluates each segment’s performance based on income or loss before interest and income taxes, excluding unallocated expenses and chargeswhich the company’s management deems to be an overall corporate cost or a cost not reflective of the segments’ core operating businesses. Information regardingthe operations of these segments is as follows for fiscal years 2017, 2016, and 2015 (amounts in thousands):
Fiscal 2017 Fiscal 2016 Fiscal 2015 Sales:
DSD Segment $ 3,383,564 $ 3,347,616 $ 3,242,482 Warehouse Segment 767,844 787,233 733,170 Eliminations:
Sales from Warehouse Segment to DSD Segment (165,674) (144,525) (134,013)Sales from DSD Segment to Warehouse Segment (65,001) (63,439) (63,134)
$ 3,920,733 $ 3,926,885 $ 3,778,505 Gain on divestiture:
Warehouse Segment $ 28,875 $ — $ — $ 28,875 $ — $ — Multi-employer pension plan withdrawal costs:
DSD Segment $ 18,268 $ — $ — $ 18,268 $ — $ — Restructuring and related impairment charges:
DSD Segment $ 80,026 $ — $ — Warehouse Segment 20,122 — — Unallocated corporate costs 3,982 — —
$ 104,130 $ — $ — Impairment of assets:
DSD Segment $ — $ 24,877 $ 3,771 $ — $ 24,877 $ 3,771 Depreciation and amortization:
DSD Segment $ 126,485 $ 120,009 $ 115,801 Warehouse Segment 20,642 20,138 16,734 Unallocated corporate costs(1) (408) 722 (360)
$ 146,719 $ 140,869 $ 132,175 Income from operations:
DSD Segment $ 202,669 $ 260,495 $ 302,361 Warehouse Segment 54,738 58,465 55,266 Unallocated corporate costs(2) (94,495) (55,070) (59,748)
$ 162,912 $ 263,890 $ 297,879 Interest expense $ 36,557 $ 34,905 $ 26,815 Interest income $ (22,938) $ (20,552) $ (21,967)Income before income taxes $ 149,293 $ 249,537 $ 293,031 Capital expenditures:
DSD Segment $ 64,317 $ 61,669 $ 72,148 Warehouse Segment 6,933 16,792 9,596 Other(3) 3,982 23,266 9,029
$ 75,232 $ 101,727 $ 90,773
December 30, 2017 December 31, 2016
Assets: DSD Segment $ 2,270,179 $ 2,344,616 Warehouse Segment 296,157 330,006 Other (3) 93,388 86,446
$ 2,659,724 $ 2,761,068
(1) Represents costs allocated to the company’s corporate head office.
F-64

(2) Represents costs allocated to the company’s corporate head office and pension settlement loss.(3) Represents the company’s corporate head office assets including primarily cash and cash equivalents.
Sales by product category in each reportable segment are as follows for fiscal years 2017, 2016, and 2015 (amounts in thousands):
Fiscal 2017 Fiscal 2016 Fiscal 2015
Total DSD
Segment Warehouse
Segment Total DSD
Segment Warehouse
Segment Total DSD
Segment Warehouse
Segment Branded retail $ 2,299,931 $ 2,149,966 $ 149,965 $ 2,283,526 $ 2,114,142 $ 169,384 $ 2,151,514 $ 2,011,433 $ 140,081 Store branded retail 582,454 470,941 111,513 582,280 464,456 117,824 571,827 457,467 114,360 Non-retail and other 1,038,348 697,656 340,692 1,061,079 705,579 355,500 1,055,164 710,448 344,716 Total $ 3,920,733 $ 3,318,563 $ 602,170 $ 3,926,885 $ 3,284,177 $ 642,708 $ 3,778,505 $ 3,179,348 $ 599,157
Note 25. Unaudited Quarterly Financial Information
Results of operations for each of the four quarters in the respective fiscal years are as follows. Each quarter during fiscal 2017 and fiscal 2016 represents aperiod of twelve weeks, except the first quarter, which includes sixteen weeks (amounts in thousands, except per share data):
First Quarter** Second Quarter** Third Quarter** Fourth Quarter Sales 2017 $ 1,187,649 $ 926,639 $ 932,822 $ 873,623 2016 $ 1,204,352 $ 935,025 $ 918,791 $ 868,717 Materials, supplies, labor and other production costs (exclusive of depreciation and amortization shown separately)* 2017 $ 607,941 $ 468,152 $ 476,170 $ 456,800 2016 $ 621,190 $ 477,955 $ 476,760 $ 450,462 Net income (loss) 2017 $ 60,418 $ 44,740 $ (33,571) $ 78,533 2016 $ 59,363 $ 51,155 $ 40,216 $ 13,042 Basic net income (loss) per share 2017 $ 0.29 $ 0.21 $ (0.16) $ 0.37 2016 $ 0.28 $ 0.25 $ 0.19 $ 0.06 Diluted net income (loss) per share 2017 $ 0.29 $ 0.21 $ (0.16) $ 0.37 2016 $ 0.28 $ 0.24 $ 0.19 $ 0.06
* The company does not report gross margin. This line item presents our material, supplies, labor and other production costs (exclusive of depreciation andamortization shown separately) under an alternative presentation.
** As disclosed in Note 4, Financial Statement Revisions , the company reported cash receipts and payments for the repurchase and sale of territories and cashpaid at issuance of notes receivable at net when these transactions should have been disaggregated. We concluded that the errors were not material to any ofthese prior periods that were impacted. The error resulted in an understatement of cash flows from operating activities and cash flows used in investingactivities of $5.9 million, $12.1 million and $12.8 million, respectively, for the sixteen, twenty-eight, and forty week amounts included in the first, second,and third quarters of fiscal 2017, respectively. These amounts will be revised upon subsequent presentation of these financial statements.
The table below presents financial results that impact comparability, by quarter, for fiscal 2017 (amounts in thousands):
Items presented separately on the Consolidated Statements ofIncome First Quarter Second Quarter Third Quarter Fourth Quarter Fiscal 2017 FootnoteGain on divestiture $ (28,875) $ — $ — $ — $ (28,875) Note 6Restructuring and related impairment charges $ — $ — $ 100,549 $ 3,581 $ 104,130 Note 5Multi-employer pension plan withdrawal costs $ — $ — $ 18,268 $ — $ 18,268 Note 21Pension settlement loss $ — $ — $ 3,030 $ 1,619 $ 4,649 Note 21Income tax benefit resulting from Tax reform $ — $ — $ — $ (48,160) $ (48,160) Note 22
F-65

The table below presents financial results that impact comparability, by quarter, for fiscal 2016 (amounts in thousands):
Items presented separately on the Consolidated Statements ofIncome First Quarter Second Quarter Third Quarter Fourth Quarter Fiscal 2016 FootnoteImpairment of assets $ — $ — $ — $ 24,877 $ 24,877 Note 9Pension settlement loss $ — $ 4,641 $ 1,832 $ 173 $ 6,646 Note 21
During the fourth quarter of fiscal 2016, we identified and recorded out-of-period adjustments of $2.3 million for an intangible asset impairment whichrelated to the second quarter of fiscal 2016 and a $0.9 million reduction to deferred tax expense which related to the fourth quarter of fiscal 2015. The net impactof these two items resulted in $0.5 million of lower net income in the fourth quarter of fiscal 2016. We concluded that the correction of the errors was not materialto the fourth quarter of fiscal 2016 or to any of the prior periods that were impacted.
Note 26. Subsequent Events
The company has evaluated subsequent events since December 30, 2017, the date of these financial statements. We believe there were no material events ortransactions discovered during this evaluation that requires recognition or disclosure in the financial statements other than the items discussed below.
Dividend. On February 16, 2018, the Board of Directors declared a dividend of $0.17 per share on the company’s common stock to be paid on March 16,2018 to shareholders of record on March 2, 2018.
Legal settlement . On February 14, 2018, the company reached an agreement in principal to settle a distributor classification legal matter (Schucker case)for a payment of approximately $1.3 million. See Note 23, Commitment and Contingencies , for additional details.
F-66

Exhibit 12
Flowers Foods, Inc.Computation of Ratio of Earnings to Fixed Charges
Fiscal 2013 - 2017(000’s Omitted, Except Ratio Amounts)
Fiscal Year 2017 2016 2015 2014 2013
Fixed Charges: Interest expense $ 36,557 $ 34,905 $ 26,815 $ 28,288 $ 28,875 Interest portion of rent expense(1) $ 31,671 $ 32,452 $ 29,028 $ 29,564 $ 30,100 Total Fixed Charges $ 68,228 $ 67,357 $ 55,843 $ 57,852 $ 58,975 Earnings: Income before income taxes $ 149,293 $ 249,537 $ 293,031 $ 268,054 $ 322,373 Plus: Fixed charges(2) $ 68,228 $ 67,357 $ 55,843 $ 57,852 $ 58,975 Earnings Available to Cover Fixed Charges $ 217,521 $ 316,894 $ 348,874 $ 325,906 $ 381,348 Ratio of Earnings to Fixed Charges 3.2 4.7 6.2 5.6 6.5
(1) One-third of total rent expense is the portion deemed representative of the interest factor.(2) Fixed charges represent gross interest expense plus the interest portion of rent expense.

Exhibit 21
SUBSIDIARIES OF FLOWERS FOODS, INC.
Name of Subsidiary
Jurisdiction ofIncorporation
or Organization14th Street Baking Co. of Birmingham, LLC AlabamaBailey Street Bakery, LLC AlabamaFlowers Bakery of Montgomery, LLC AlabamaFlowers Baking Co. of Birmingham, LLC AlabamaFlowers Baking Co. of Opelika, LLC AlabamaTuscaloosa Organic Baking Co., LLC AlabamaAlpine Valley Bread Company ArizonaFast Food Services, Inc. ArizonaHolsum Bakery of Tolleson, LLC ArizonaHolsum Bakery, Inc. ArizonaHolsum Holdings, LLC ArizonaFlowers Bakery of Texarkana, LLC ArkansasFlowers Baking Co. of Batesville, LLC ArkansasFlowers Baking Co. of Pine Bluff, LLC ArkansasFort Smith Baking Co., LLC ArkansasFlowers Baking Co. of California, LLC CaliforniaFlowers Baking Co. of Modesto, LLC CaliforniaFlowers Baking Co. of Sacramento, LLC CaliforniaFlowers Baking Co. of Stockton, LLC CaliforniaFlowers Baking Co. of Denver, LLC ColoradoC&G Holdings, Inc. DelawareCK Sales Co., LLC DelawareFlowers Bakeries Brands, LLC DelawareFlowers Baking Co. of Lakeland, Inc. DelawareFlowers Finance II, LLC DelawareFlowers Finance, LLC DelawareBusch Drive Baking Co. of Jacksonville, LLC FloridaFlowers Baking Co. of Bradenton, LLC FloridaFlowers Baking Co. of Florida, LLC FloridaFlowers Baking Co. of Jacksonville, LLC FloridaFlowers Baking Co. of Miami, LLC FloridaFlowers Baking Co. of Orlando, LLC FloridaDerst Baking Company, LLC GeorgiaFBC Georgia, LLC GeorgiaFlowers Bakeries, LLC GeorgiaFlowers Bakery of Suwannee, LLC GeorgiaFlowers Baking Co. of Thomasville, LLC GeorgiaFlowers Baking Co. of Tucker, LLC GeorgiaFlowers Baking Co. of Tyler, LLC GeorgiaFlowers Baking Co. of Villa Rica, LLC GeorgiaFlowers Foods Specialty Group, LLC GeorgiaFlowers Specialty Foodservice Sales, LLC GeorgiaFlowers Baking Co. of Hodgkins, LLC IllinoisFlowers Baking Co. of Peoria, LLC IllinoisFlowers Baking Co. of Columbus, LLC IndianaFlowers Baking Co. of Waterloo, LLC IowaFlowers Baking Co. of Lenexa, LLC KansasFlowers Bakery of London, LLC KentuckyFlowers Baking Co. of Bardstown, LLC KentuckyFlowers Baking Co. of Alexandria, LLC Louisiana
1

Flowers Baking Co. of Baton Rouge, LLC LouisianaFlowers Baking Co. of Lafayette, LLC LouisianaFlowers Baking Co. of New Orleans, LLC LouisianaFlowers Baking Co. of Biddeford, LLC MaineLepage Bakeries Cedar Street, LLC MaineLepage Bakeries Park Street, LLC MaineLepage Leasing, LLC MaineEl Paso Baking Co. de Mexico, S.A. de C.V. MexicoFlowers Baking Co. of Booneville, LLC MissouriFlowers Baking Co. of Henderson, LLC NevadaFlowers Bakery of Winston-Salem, LLC North CarolinaFlowers Baking Co. of Jamestown, LLC North CarolinaFlowers Baking Co. of Newton, LLC North CarolinaFlowers Baking Co. of Rocky Mount, LLC North CarolinaFranklin Baking Company, LLC North CarolinaFlowers Baking Co. of Ohio, LLC OhioFlowers Baking Co. of Tulsa, LLC OklahomaDave's Killer Bread, Inc. OregonDKB-Alpine Organic Bakeries Group, LLC OregonFlowers Baking Co. of Portland, LLC OregonFlowers Baking Co. of Oxford, Inc. PennsylvaniaTasty Baking Company PennsylvaniaTBC Financial Services, Inc. PennsylvaniaFlowers Specialty Brands, LLC South CarolinaFlowers Bakery of Cleveland, LLC TennesseeFlowers Bakery of Crossville, LLC TennesseeFlowers Baking Co. of Knoxville, LLC TennesseeFlowers Baking Co. of Memphis, LLC TennesseeFlowers Baking Co. of Morristown, LLC TennesseeFlowers Baking Co. of Nashville, LLC TennesseeFlowers Specialty Snack Sales, Inc. TennesseeMonroe Avenue Baking Co. of Memphis, LLC TennesseeFlowers Baking Co. of Denton, LLC TexasFlowers Baking Co. of El Paso, LLC TexasFlowers Baking Co. of Houston, LLC TexasFlowers Baking Co. of San Antonio, LLC TexasFlowers Baking Co. of Texas, LLC TexasLeeland Baking Co., LLC TexasFlowers Baking Co. of Ogden, LLC UtahLepage Bakeries Brattleboro, LLC VermontFlowers Baking Co. of Lynchburg, LLC VirginiaFlowers Baking Co. of Norfolk, LLC VirginiaFlowers Baking Co. of West Virginia, LLC West Virginia
2

Exhibit 23
CONSENT OF INDEPENDENT REGISTERED PUBLIC ACCOUNTING FIRM
We hereby consent to the incorporation by reference in the Registration Statements on Form S-3 (No. 333-220079) and Form S-8 (Nos. 333-132293, 333-58320, 333-59354, 333-156471, 333-151746, 333-159814, 333-196124 and 333-196125) of Flowers Foods, Inc. of our report dated February 21, 2018 relating tothe financial statements and the effectiveness of internal control over financial reporting, which appears in this Form 10-K.
/s/ PricewaterhouseCoopers LLPAtlanta, GAFebruary 21, 2018
Exhibit 31.1
I, Allen L. Shiver, certify that:
1. I have reviewed this Annual Report on Form 10-K of Flowers Foods, Inc.;
2. Based on my knowledge, this report does not contain any untrue statement of a material fact or omit to state a material fact necessary to make thestatements made, in light of the circumstances under which such statements were made, not misleading with respect to the period covered by this report;
3. Based on my knowledge, the financial statements, and other financial information included in this report, fairly present in all material respects thefinancial condition, results of operations and cash flows of the registrant as of, and for, the periods presented in this report;
4. The registrant’s other certifying officers and I are responsible for establishing and maintaining disclosure controls and procedures (as defined in ExchangeAct Rules 13a-15(e) and 15d-15(e)) and internal control over financial reporting (as defined in Exchange Act Rules 13a-15(f) and 15d-15(f)) for the registrant andhave:
(a) designed such disclosure controls and procedures, or caused such disclosure controls and procedures to be designed under our supervision, toensure that material information relating to the registrant, including its consolidated subsidiaries, is made known to us by others within those entities,particularly during the period in which this report is being prepared;
(b) designed such internal control over financial reporting, or caused such internal control over financial reporting to be designed under oursupervision, to provide reasonable assurance regarding the reliability of financial reporting and the preparation of financial statements for external purposesin accordance with generally accepted accounting principles;
(c) evaluated the effectiveness of the registrant’s disclosure controls and procedures and presented in this report our conclusions about theeffectiveness of the disclosure controls and procedures, as of the end of the period covered by this report based on such evaluation; and
(d) disclosed in this report any change in the registrant’s internal control over financial reporting that occurred during the registrant’s most recentfiscal quarter (the registrant’s fourth fiscal quarter in the case of an annual report) that has materially affected, or is reasonably likely to materially affect, theregistrant’s internal control over financial reporting; and
5. The registrant’s other certifying officers and I have disclosed, based on our most recent evaluation of internal control over financial reporting, to theregistrant’s auditors and the audit committee of registrant’s board of directors (or persons performing the equivalent functions):
(a) All significant deficiencies and material weaknesses in the design or operation of internal control over financial reporting which are reasonablylikely to adversely affect the registrant’s ability to record, process, summarize and report financial information; and
(b) Any fraud, whether or not material, that involves management or other employees who have a significant role in the registrant’s internal controlover financial reporting.
/s/ ALLEN L. SHIVER
Allen L. ShiverPresident and Chief Executive Officer
Date: February 21, 2018

Exhibit 31.2
I, R. Steve Kinsey, certify that:
1. I have reviewed this Annual Report on Form 10-K of Flowers Foods, Inc.;
2. Based on my knowledge, this report does not contain any untrue statement of a material fact or omit to state a material fact necessary to make thestatements made, in light of the circumstances under which such statements were made, not misleading with respect to the period covered by this report;
3. Based on my knowledge, the financial statements, and other financial information included in this report, fairly present in all material respects thefinancial condition, results of operations and cash flows of the registrant as of, and for, the periods presented in this report;
4. The registrant’s other certifying officers and I are responsible for establishing and maintaining disclosure controls and procedures (as defined in ExchangeAct Rules 13a-15(e) and 15d-15(e)) and internal control over financial reporting (as defined in Exchange Act Rules 13a-15(f) and 15d-15(f)) for the registrant andhave:
(a) designed such disclosure controls and procedures, or caused such disclosure controls and procedures to be designed under our supervision, toensure that material information relating to the registrant, including its consolidated subsidiaries, is made known to us by others within those entities,particularly during the period in which this report is being prepared;
(b) designed such internal control over financial reporting, or caused such internal control over financial reporting to be designed under oursupervision, to provide reasonable assurance regarding the reliability of financial reporting and the preparation of financial statements for external purposesin accordance with generally accepted accounting principles;
(c) evaluated the effectiveness of the registrant’s disclosure controls and procedures and presented in this report our conclusions about theeffectiveness of the disclosure controls and procedures, as of the end of the period covered by this report based on such evaluation; and
(d) disclosed in this report any change in the registrant’s internal control over financial reporting that occurred during the registrant’s most recentfiscal quarter (the registrant’s fourth fiscal quarter in the case of an annual report) that has materially affected, or is reasonably likely to materially affect, theregistrant’s internal control over financial reporting; and
5. The registrant’s other certifying officers and I have disclosed, based on our most recent evaluation of internal control over financial reporting, to theregistrant’s auditors and the audit committee of registrant’s board of directors (or persons performing the equivalent functions):
(a) All significant deficiencies and material weaknesses in the design or operation of internal control over financial reporting which are reasonablylikely to adversely affect the registrant’s ability to record, process, summarize and report financial information; and
(b) Any fraud, whether or not material, that involves management or other employees who have a significant role in the registrant’s internal controlover financial reporting.
/s/ R. STEVE KINSEY
R. Steve KinseyChief Financial Officer andChief Administrative Officer
Date: February 21, 2018

Exhibit 31.3
I, Karyl H. Lauder, certify that:
1. I have reviewed this Annual Report on Form 10-K of Flowers Foods, Inc.;
2. Based on my knowledge, this report does not contain any untrue statement of a material fact or omit to state a material fact necessary to make thestatements made, in light of the circumstances under which such statements were made, not misleading with respect to the period covered by this report;
3. Based on my knowledge, the financial statements, and other financial information included in this report, fairly present in all material respects thefinancial condition, results of operations and cash flows of the registrant as of, and for, the periods presented in this report;
4. The registrant’s other certifying officers and I are responsible for establishing and maintaining disclosure controls and procedures (as defined in ExchangeAct Rules 13a-15(e) and 15d-15(e)) and internal control over financial reporting (as defined in Exchange Act Rules 13a-15(f) and 15d-15(f)) for the registrant andhave:
(a) designed such disclosure controls and procedures, or caused such disclosure controls and procedures to be designed under our supervision, toensure that material information relating to the registrant, including its consolidated subsidiaries, is made known to us by others within those entities,particularly during the period in which this report is being prepared;
(b) designed such internal control over financial reporting, or caused such internal control over financial reporting to be designed under oursupervision, to provide reasonable assurance regarding the reliability of financial reporting and the preparation of financial statements for external purposesin accordance with generally accepted accounting principles;
(c) evaluated the effectiveness of the registrant’s disclosure controls and procedures and presented in this report our conclusions about theeffectiveness of the disclosure controls and procedures, as of the end of the period covered by this report based on such evaluation; and
(d) disclosed in this report any change in the registrant’s internal control over financial reporting that occurred during the registrant’s most recentfiscal quarter (the registrant’s fourth fiscal quarter in the case of an annual report) that has materially affected, or is reasonably likely to materially affect, theregistrant’s internal control over financial reporting; and
5. The registrant’s other certifying officers and I have disclosed, based on our most recent evaluation of internal control over financial reporting, to theregistrant’s auditors and the audit committee of registrant’s board of directors (or persons performing the equivalent functions):
(a) All significant deficiencies and material weaknesses in the design or operation of internal control over financial reporting which are reasonablylikely to adversely affect the registrant’s ability to record, process, summarize and report financial information; and
(b) Any fraud, whether or not material, that involves management or other employees who have a significant role in the registrant’s internal controlover financial reporting.
/s/ KARYL H. LAUDER
Karyl H. LauderSenior Vice President andChief Accounting Officer
Date: February 21, 2018

Exhibit 32
CERTIFICATION PURSUANT TO18 U.S.C. SECTION 1350,
AS ADOPTED PURSUANT TO
SECTION 906 OF THE SARBANES-OXLEY ACT OF 2002
In connection with the Annual Report of Flowers Foods, Inc. (the “company”) on Form 10-K for the period ended December 30, 2017, as filed with theSecurities and Exchange Commission on the date hereof (the “Report”), each of the undersigned officers of the company certifies, pursuant to 18 U.S.C.Section 1350, as adopted pursuant to Section 906 of the Sarbanes-Oxley Act of 2002, that, to such officer’s knowledge:
1. The Report fully complies with the requirements of Section 13(a) or 15(d) of the Securities Exchange Act of 1934; and
2. The information contained in the Report fairly presents, in all material respects, the financial condition and results of operations of the company asof the dates and for the periods expressed in the Report.
/s/ ALLEN L. SHIVER
Allen L. ShiverPresident and
Chief Executive Officer
/s/ R. STEVE KINSEYR. Steve Kinsey
Chief Financial Officer andChief Administrative Officer
/s/ KARYL H. LAUDERKaryl H. Lauder
Senior Vice President andChief Accounting Officer
Date: February 21, 2018
The foregoing certification is being furnished solely pursuant to 18 U.S.C. Section 1350 and is not being filed as part of the Report or as a separatedisclosure document.