Flow32-1K Sap Flow Monitoring System Installation ... · PDF filesap flow system using one...
83
P L A N T - W A T E R - B I O -S E NS O R S - ENVIRONMENT AL - H Y D R O L O G Y I N S T R U M E N T A T I O N Flow32-1K Sap Flow Monitoring System Installation & Operation Manual 10808 Fallstone Rd #350 Houston TX 77099 USA 281-564-5100 www.dynamax.com [email protected]
Transcript of Flow32-1K Sap Flow Monitoring System Installation ... · PDF filesap flow system using one...

PLANT - WATER - BIO-SENSORS - ENVIRONMENTAL - HYDROLOGY INSTRUMENTATION
Flow32-1K Sap Flow Monitoring SystemInstallation & Operation Manual10808 Fallstone Rd #350 Houston TX 77099 USA 281-564-5100 www.dynamax.com [email protected]

Copyright 2007-2017, Dynamax Inc
All Rights Reserved
This manual refers to Flow32-1K sap flow system with CR1000 data logger, including PC400 data logger support software. Specifications are subject to change. Dynagage is a new product for experimental purposes under development. DYNAMAX Inc assumes no liability for customer assistance, infringements of patents or copyrights arising from the use of this product. DYNAMAX does not warrant or represent that any license, either express or implied, is granted under any patent right, copyright, or other intellectual property right of DYNAMAX relating to this product, or process. There are no implied warranties of merchantability or of fitness for a particular purpose given with the sale of any goods. DYNAMAX Inc shall not be liable for consequential, incidental or special charges. VELCRO is a trademark of Velcro USA Dynagage, Flow32, Flow32W, Flow32-1K and Dynamax are trademarks of Dynamax Inc CR1000, CR Basic, PC208W, PC400 and LoggerNet are trademarks of Campbell Scientific Inc Windows XP, Windows Vista, Window 7, Windows 8, Windows 10, Microsoft Office, Microsoft Excel are trademarks of Microsoft Corporation.
Updated: 10/10/2017

Dynamax Inc
2
BLANK PAGE

Flow32-1K
3
Program and algorithms, Copyright, Dynamax, Inc., 2006-2017 Portions of the manual are courtesy of Campbell Scientific, Inc and are subject to Copyright © 2006-2017 Campbell Scientific, Inc.
Trademarks used are property of their respective owners.
SOFTWARE LICENSE AGREEMENT Product Name: Fl32-1K-SW System software for use with Flow32-1K sap flow system Copyright 2006-2017, All rights reserved. Dynamax Inc, 10808 Fallstone Rd. Ste. 350 Houston, TX 77099 USA PLEASE READ THIS SOFTWARE LICENSE AGREEMENT CAREFULLY BEFORE DOWNLOADING OR USING THE SOFTWARE. BY DOWNLOADING THE PRODUCT, OR USING THE EQUIPMENT THAT CONTAINS THIS PRODUCT, YOU ARE CONSENTING TO BE BOUND BY THIS AGREEMENT. IF YOU DO NOT AGREE TO ALL OF THE TERMS OF THIS AGREEMENT, TALK TO YOUR DYNAMAX REPRESENTATIVE FOR A COURSE OF ACTION OR RETURN THE PRODUCT TO THE PLACE OF PURCHASE FOR A FULL REFUND, OR DO NOT DOWNLOAD THE PRODUCT. Single User / Single Data Logger License Grant: Dynamax, Inc. and its suppliers grant to Customer a nonexclusive and nontransferable license to use the Flow32-1K programs written in CRBasic and for operation with Flow32-1K sap flow system using one CR1000 data logger only. The license is provided for a single computer installation only to be used in conjunction with a single Flow32-1K Sap Flow System. The computer may be owned or leased by Customer or otherwise purchased from Dynamax. Due to the nature and application of Flow32-1K, Dynamax realizes the need for computers to be mobile and available on portable computers for mobile applications. To facilitate this the user may install Flow32-1K software and associated programs on one other computer such as a laptop notebook, Tablet PC, portable devices operating on Microsoft windows based operating systems. EXCEPT AS EXPRESSLY AUTHORIZED ABOVE, CUSTOMER SHALL NOT: COPY, IN WHOLE OR IN PART, SOFTWARE OR DOCUMENTATION; MODIFY THE SOFTWARE; REVERSE COMPILE OR REVERSE ASSEMBLE ALL OR ANY PORTION OF THE SOFTWARE; OR RENT, LEASE, DISTRIBUTE, SELL, OR CREATE DERIVATIVE WORKS OF THE SOFTWARE. Customer agrees that aspects of the licensed materials, including the specific design and structure of individual programs, constitute trade secrets and/or copyrighted material of Dynamax. Customer agrees not to disclose, provide, or otherwise make available such trade secrets or copyrighted material in any form to any third party without the prior written consent of Dynamax. Customer agrees to implement reasonable security measures to protect such information and copyrighted material. Title to Software and documentation shall remain solely with Dynamax. LIMITED WARRANTY. Dynamax warrants that for a period of ninety (90) days from the date of shipment from Dynamax the Software substantially conforms to its published specifications. Except for the foregoing, the Software is provided AS IS. This limited warranty extends only to Customer as the original licensee.

Dynamax Inc
4
In no event does Dynamax warrants that the Software is error free or that Customer will be able to operate the Software without problems or interruptions. This warranty does not apply if the software (a) has been altered, except by Dynamax, (b) has not been installed, operated, repaired, or maintained in accordance with instructions supplied by Dynamax, (c) has been subjected to abnormal physical or electrical stress, misuse, negligence, or accident, or (d) is used in ultra-hazardous activities. DISCLAIMER. EXCEPT AS SPECIFIED IN THIS WARRANTY, ALL EXPRESS OR IMPLIED CONDITIONS, REPRESENTATIONS, AND WARRANTIES INCLUDING, WITHOUT LIMITATION, ANY IMPLIED WARRANTY OF MERCHANTABILITY, FITNESS FOR A PARTICULAR PURPOSE, NONINFRINGEMENT OR ARISING FROM A COURSE OF DEALING, USAGE, OR TRADE PRACTICE, ARE HEREBY EXCLUDED TO THE EXTENT ALLOWED BY APPLICABLE LAW. The above warranty DOES NOT apply to any beta software, any software made available for testing or demonstration purposes, any temporary software modules or any software for which Dynamax does not receive a license fee. All such software products are provided AS IS without any warranty whatsoever. This License is effective until terminated. Customer may terminate this License at any time by destroying all copies of Software including any documentation. This License will terminate immediately without notice from Dynamax if Customer fails to comply with any provision of this License. Upon termination, Customer must destroy all copies of Software.

Flow32-1K
5
TABLE OF CONTENTS
1.0 INTRODUCTION TO FLOW32-1K ....................................................................................7
1.1 Flow32A-1K Packaging - Control System Assembly Overview ................................8
1.2 Operation Overview And Quick Start Guide ..............................................................8
1.3 Unpacking, Bill Of Materials ...................................................................................... 10 1.3.1 Bill Of Materials ..................................................................................................... 11
1.4 Customer Provided Requirements ........................................................................... 12
1.5 System Requirements ................................................................................................ 13
1.6 Communication Options ............................................................................................ 14
2.0 GENERAL SYSTEM SET UP - OPTIONS ..................................................................... 145
2.1 Field Installation ......................................................................................................... 15 2.1.1 Sensor Connection To Logger .............................................................................. 16
2.2 System Set Up ............................................................................................................ 17
2.3 Solar Power - Batteries - Charger - Expansion Options.......................................... 18 2.3.1 Solar Panel Requirements .................................................................................... 18 2.3.2 Worldwide Solar Distribution Chart -Worst Case Winter Data Esh ........................ 18 2.3.3 Solar power Budget Sheet .................................................................................... 20 2.3.4 Solar calculations Example ................................................................................... 21
2.4 120 VAC Power ........................................................................................................... 21
2.5 Flow32-1K Expansion Modules ................................................................................. 23
2.6 Hardware Expansion For 16, 24 Or 32 Gauges ........................................................ 25
2.7 Setting The Sensor Input Voltage ........................................................................... 256
3.0 SOFTWARE INSTALLATION ......................................................................................... 29
3.1 PC400 Installation ...................................................................................................... 29 3.1.1 Working Directory Location ................................................................................... 31
3.2 Flow32-1K software installation ................................................................................ 32
4.0 USING PC400 ................................................................................................................ 323
4.1 Launch PC400 ............................................................................................................. 33
4.2 Setup, Program Logger and Communications ........................................................ 34
4.3 Connect To Logger .................................................................................................... 38
4.4 Programming the Logger ......................................................................................... 389 4.4.1 Modifying the program ........................................................................................... 39

Dynamax Inc
6
4.4.2 Programming the Logger ....................................................................................... 44
4.5 Monitor Data In Real-Time ......................................................................................... 45
5.0 DATA RETRIEVAL AND PROCESSING ........................................................................ 46
5.1 Collect Data For Offline Processing ......................................................................... 46
5.2 Graphics Mode Display - File Data .......................................................................... 489
5.3 View data in excel ....................................................................................................... 51
6.0 DATA ANALYSIS ............................................................................................................ 53
6.1 Recalculating Sap Flow With New Parameters ........................................................ 53
6.2 Correct Sap Temperature Increase - Analysis ........................................................ 56
6.3 Interpretation Of Sunup Events .............................................................................. 589
6.4 Transpiration Versus Sap-Flow ................................................................................. 60
7.0 COMMUNICATIONS ....................................................................................................... 61
7.1 RF Modem (RFMX) ..................................................................................................... 62 7.1.1 Specifications ........................................................................................................ 63 7.1.2 List of Hardware .................................................................................................... 63 7.1.3 Programming ......................................................................................................... 64 7.1.4 Antenna/ Tower ..................................................................................................... 64 7.1.5 Host Modem Installation ...................................................................................... 646 7.1.6 Remote Station Installation ................................................................................... 65 7.1.7 Use of Repeater .................................................................................................... 66
7.2 Dual band cellular wireless Modem (GSM) .............................................................. 67
7.3 Modes of Communication .......................................................................................... 68 7.3.1 Modes of Configuration .......................................................................................... 68 7.3.2 A sample large scale setup ................................................................................... 70
APPENDIX A: AUTO ZERO .................................................................................................. 72
APPENDIX B: DATA TABLES AND FORMAT ................................................................... 724
APPENDIX C: SENSOR STATUS EXPLAINED ................................................................... 74
APPENDIX D: Flow32-1K SYSTEM WIRING ....................................................................... 75

Flow32-1K
7
1.0 INTRODUCTION TO FLOW32-1K Sap Flow measurements are made easier by the Dynamax Flow32 system. Over the past decade researcher and commercial users have been using Flow32 system for sapflow measurements from Dynagage sensors. Now the widely accepted system is improved using CR1000 data logger to give greater performance, extended memory storage and ease of use with integrated sapflow calculations. The new product Flow32-1K, integrates all the necessary electronics, software and sensors into a full and complete solution. The main system, Flow32A-1K with CR1000 data logger, multiplexer and AVRD to power the sensors with variable voltage can read up to 8 Dynagage sensors. In addition the basic system can be expanded to accommodate up to 32 sensors in steps of 8 sensors, using Flow32B-1K. The expansion unit termed Flow32B-1K contains electronics to read sensors, send the data to main unit Flow32A-1K. Field or greenhouse sap flow measurement is accomplished with Flow32-1K in an easily expandable set of modules. Each module is designed to support eight sap flow sensors, and up to four modules are available on a single system. Each expansion unit connects to the main unit using a 100 ft cable.
Following are some of the features of New Flow32-1K sapflow logger,
Integrated CR1000 data logger
Built-in sapflow calculations
4MB Data memory capacity
Stored data contains one year of daily accumulated and hourly accumulated sapflow data for each sensor.
In addition short and long form outputs available
Memory capacity of up to 8 months for short and long form outputs.
Status symbols/ codes for each sensor to relay the condition or sensors or cables or any of the settings
Built-in auto zero to calibrate sensors at predawn
Power save option at night time with allowance for warm-up time for sensors before valid data can be obtained
Efficient AVRD to power excitation voltage to Dynagage sensors
8 Dynagage sensors on basic system, assembled with pigtail cables
Expandable up to 32 Dynagages in steps of 8, by simply adding expansion kits with multiplexer only.
Solar panel and AC power option
USB port as well as 9-pin serial port.
Dynamax Inc
8
1.1 Flow32A-1K Packaging - Control System Assembly Overview A standard 8 Gauge Model Flow32A-1K includes: a) Custom CR1000 Logger with built-in Dynagage sap flow calculations b) Input Multiplexer for 8 Sensors, AM16/32 c) Weather proof System Enclosure, with pole mounting brackets and U clamps. d) High-efficiency and High-current adjustable Voltage Regulator to power Dynagage sensors e) Optional Solar Panels f) 120/220 V AC Battery Charger and 7 AH Sealed Lead Acid Battery (120V/220V supplied as per requirement of the user) g) Eight 25 ft Cables (Cat no. EQC25) with voltage dividers installed at multiplexer. h) Grounding cable (green) i) Power wiring harness for Battery, Solar Panel, or CHG120 connection terminals (red and black wires) j) Direct PC RS232 Link for Program Download, Real Time Monitor, and Data Retrieval, 5' communication cable.
k) 2Mb Solid State Memory data storage, optional 4MB also available.
AVRD
Multiplexer
Communication cable
AVRD voltage adj. Knob for V2
CR1000 logger
Conduit- sealed
Ground wire
Dynagage pigtail cables
AVRD voltage adj. Knob for V1

Flow32-1K
9
1.2 Operation Overview And Quick Start Guide A. Survey site, Prepare site, select and prepare plants. B. Unpack system C. Mount Flow 32 Enclosure(s), and connecting control cables Connecting Power and connect
personal computer D. Install utilities PC400, Flow32-1K from PC support software CDs
PC400 setup.exe and Flow32-1K programs E. Install Dynagage sensors installation F. Load Maintenance or test programs to the logger to check installation. G. Modify the main program with required scanning rate, gage and plant parameters into the main
program. Load the stem sizes, gauge sizes/ heater specs, zero set, stem thermal specs and logger/power down timing:
H. Download Flow32 program, and set the logger internal clock with the PC time/date. Click on the Set Datalogger Clk
I. Monitor, collect data at the required intervals. L. Retrieve flow information by selecting the required tables from the list and clicking of the collect
button, then its saved data into assigned files on disk directory. PC400 -> Connect -> Collect all button
M. Display, print, and format flow information saved on the files on disk. N. Recalculating sap flow using excel if required, Ksh changes after data is collected from the
logger. Refer to data analysis chapter.
O. Graphing and analyzing the results by importing to excel into the analysis and graphics utilities favored by the user.
PC400 -> Connect -> Graphics button, import or open data file and then select fields of interest with Add and Paste buttons.
With experience each of the steps above can take as little as five to 15 minutes to perform except for gauge installation (5 -10 minutes each). The sensor installation can take much longer depending on the species if there is any special preparation required, and it depends on the number of plants. Site preparation may require conduit installation or added precautions if there are going to be tillage or other heavy equipment among the plants to be tested. To efficiently install and learn these steps, only this manual is required. All steps above are explained in detail, and example screen menus and printouts are provided as the operations are described. All of the data retrieval examples in this manual are run using sample data provided on the Flow32-1K software CD. The fast learner should become familiar with this entire manual by running the examples and checking printouts to see if the results are the same as provided herein. The essential installation instructions of the Dynagages are covered in Dynagage section of the manual. The PC400 logger software support manual may be needed to handle unusual questions about custom systems. In any case the help files with PC400 contain extensive on line support, so the manual is not normally required. Additional manuals are also provided for detailed information on the datalogger and peripherals, the CR1000 Logger Manual, and the PC400 software support manual (on a CD), which supports IBM compatible PC's. The user may find occasional need to refer to added information provided he/she wishes to add general-purpose sensors to the Flow32-1K system such as, radiation or soil moisture sensors. The user will not normally need to get into these manuals, because the component connections are either done at the factory, or the essential information is already included in this manual. If special weather sensors or other customized operation is desired, the additional manuals provide all the information necessary.

Dynamax Inc
10
1.3 Unpacking, Bill Of Materials Using the following bill of materials, open the cartons and check off the items to see that all material was received in good condition. Notify Dynamax no later than 10 days after receipt if there are any discrepancies. Notify the shipper and Dynamax immediately if goods are damaged in transit by mishandling. The white Flow32A-1K enclosure contains the logger, the AM16/32 multiplexer, one AVRDC regulator, and the RS232. Gauge cables, 12 V power leads exit from the bottom of the system enclosure. Each sensor lead is labeled with a sequence number. Be careful at all times not to step on or otherwise bend the gage connector leads. Each connector is protected with a rubber boot. Pull this boot aside when connecting to a sensor. Replace the boot after removing a cable to protect the exposed gold pins during shipping or storage. PC400 software CD-ROM is supplied with Flow32-1K systems unless you order advanced software such as LoggerNet.

Flow32-1K
11
1.3.1 Bill Of Materials
Flow32A-1K -Bill Of Materials
ENC12-14, 2 Mounting Brackets
CR1000 data logger
AM16/32
USB- serial converter
PC400 logger support software ON USB Memory Stick o Serial Number is supplied to download and activate.
Optional LoggerNet software may be obtained for network applications.
Flow32-1K-SW software ON USB Memory Stick
MSX-xxR Solar Panel, xx Watts with regulator (optional)
HPM5/10 Mount Kit
Regulator installed in panel
Charger and 7Ah 12 battery 120/220V
AVRDC dual voltage regulator
8 ea. EQC25 Cable - with voltage dividers
5' communication cable
Ease release Canola oil w/ spray bottle
G4 Compound, 1 ea
Manuals o Flow32-1K Installation and Operation manual with Dynagage o CR1000 - Operators Manual, Test and NBS Certificate
Spares Kit, Screwdriver
Flow32B-1K Expansion kit
ENC12-14
AM16/32
POWER SOURCE o MSX-xxR Solar Panel, xx Watts with regulator o 120V/ 220V AC Charger o 7Ah 12 battery
HPM5/10 Mount Kit
AVRDC.
100 ft multiplexer control cable w/ connector
8 each - EQC25 Cable with voltage dividers

Dynamax Inc
12
1.4 Customer Provided Requirements
35 mm (1.5 ") mounting pole, or suitable alternative mounting for field installation of Flow32 enclosure.
Grounding Rod - 4-6 ft copper stake and ground wire clamp. (For CHG120 Option) Outlet for 120VAC power supply if AC line power is available.
(For Solar Panel Option) 12 VDC marine or deep cycle battery(s) (use solar calculator to determine the rating and number of batteries required)
Plastic battery box(es) to keep battery dry. May be purchased from battery supplier or Dynamax Model: ENC-PL.
PC for software and monitoring data logger.
Tools and supplies usually necessary: o Volt - Ohm meter (VOM) o caliper or flexible measuring tape 1/2" or 13 mm o open end wrench o small flat blade screwdriver (included with Flow32) o sharp knife o electrical tape – o vinyl aluminum foil o medium sandpaper o towels o water o nylon tie wraps, o clear packing tape, or white vinyl tape to secure weather shields o Electrical insulation compound - G4 (provided) and o canola oil releasing compound (provided with sensors)
Depending on the location and the selection of power options the customer provided accessories are the following:
o One or more 12VDC 60- 80Ahr deep cycle marine grade lead acid battery o When using solar array with numerous tree gauges compute the total battery and solar
panel requirements from solar calculator spreadsheet.
A single deep cycle marine or recreational vehicle battery is appropriate with as many as eight SGA5 through SGA16 stem gauges. One battery per Flow32 module is needed.
Battery boxes for charger and batteries if outside. Most inexpensive automotive or motorboat battery boxes are available with tie down strap from automotive stores or hardware supply stores. The Battery boxes are usually heavy-duty plastic construction able to keep out moisture and to prevent contamination. Shade the battery boxes to keep the temperature from going too high inside on hot days.
WARNING: USE SEPARATE BOXES TO HOLD THE CHARGER AND THE BATTERY, EXPLOSIVE GASES FROM THE BATTERY MUST NOT BE ALLOWED TO BE TRAPPED IN THE SAME ENCLOSURE AS THE BATTERY CHARGER.
1.5 " diameter galvanized pipe with end cap, 4 to 6 ft long. One pipe per module.
Two 2 -1/8" "U" bolt for each solar panel
Implements to set pipe/mix concrete. Concrete mix to set pipe in soil for a more permanent setup.
PVC conduits and elbows if underground wiring is needed.
Four foot to six-foot (1-2 m) copper grounding rod and clamp.
Padlock to secure enclosures outdoors

Flow32-1K
13
1.5 System Requirements
Laptop/ Desktop with the following minimum configuration, Intel based 32-bit computers or 64 bit Windows 7,8,10 or equivalent OS Minimum of 2 GB windows OS space at least 80MB free space on hard disk USB Memory Stick Support TCP/IP and modem support At least one COM port, RS232 serial data port or USB port, available
Using Microsoft Windows operating systems such as Windows 7, and Windows 8, Windows 10. SVGA monitor recommended, 800 by 600 pixel is recommended, however 600x480 will work. Graphics card in 16-bit (65k) color mode or better recommended, however 8-bit (256) will work.

Dynamax Inc
14
1.6 Communication Options Flow32-1K Sapflow logger offers a variety of communication choices of user to establish communication between logger and PC using PC400 supplied with Flow32-1K. In addition, Flow32 supports remote communication options given below with easy to use software features. (Model: GSM) Dual-band GSM Cellular modem (900/1800, 850/1900): GSM cellular modem for serial data rates of up to 115,200 bps, using cellular network where available. GSM modem is a very low power modem with battery capacity of 33Hours of communication and 20Days on idle. GSM modem installed in remote site can be connected to PC using a 56K landline modem (Model: DNX9600) and telephone network. GSM-CMK is a cellular modem kit that includes modem, surge protector, antenna and 15' long antenna cable assembled in a weatherproof enclosure, optional solar panels for continuous powering the modem. Software setup for GSM modem is same as that of Data Modem. For frequency (product) selection suitable to your project please contact a Dynamax representative.

Flow32-1K
15
2.0 GENERAL SYSTEM SET UP - OPTIONS This chapter covers the installation instructions that are required for Flow32-1K, operation. In further chapters we talk about programming and data collection using PC400 software.
2.1 Field Installation A Flow32-1K system is shipped with all cables attached and ready to use, except the battery connector or solar power. The following steps are important to any system monitoring Dynagages.
1. Check the AVRD power switch to see if it is in the off position. 2. Mount the enclosure to a 1.5" diameter pole with the pole mounting hardware provided in the
spares kit, or to a vertical surface with "U" mounting bolts and nuts.
3. Attach the positive battery lead red wire to the (+) battery terminal. Then connect the ground, black terminal to the (-) battery. For safety reasons and to prevent the unit from turning on during shipment, the positive lead is wrapped in tape.
4. Attach the green wire to an earth ground. Greenhouse and environmental chambers have
earth ground in the wall sockets, so you can plug the banana lead into the ground receptacle (3rd wire). Under no circumstances should the AC power line neutral be used instead of the earth ground. This could easily be confused with the hot wire and lead to a hazardous shock. If you are indoors, and cannot confirm a solid earth ground it is better to have no connection for now.
Field installations require that the ground wire is firmly attached to a copper grounding rod. Iron or copper water pipes will also serve as a good grounding point. Hardware stores and electrical shops also stock ground rods for lightning protection on antenna installations as well. The copper rod should be driven into the earth at least four feet.
5. Plug in the AC battery charger into a 120 VAC outlet, if the system is within 6 ft. of a 120 VAC outlet. If not, plug in the AC Charger into an extension cord. ** For installations outside North America, a 220V AC battery charger will be supplied.
6. Put the battery and charger into separate battery boxes. Wiring plugs or plug contacts should not be left exposed to rain or irrigation water.

Dynamax Inc
16
2.1.1 Sensor Connection To Logger Flow32-1K is supplied with data logger, multiplexer for up to 8 Dynagages, and AVRD for supplying sensor heater voltage assembled in a weatherproof enclosure. Each system is assembled with pigtail cables for Dynagage sensor, so the user can simply connect simply snapping pigtail to EQC-25 cable or required length extension cable. The big advantage to the Flow32 is that all of the wiring is completed, tested, and working before it leaves the factory. The (+) signals from the male connector side correspond to the (+) input channels on the logger. The (-) signal reference is "H", the white wire, and must be connected to the (-) differential inputs of Hc, Ha, and Hb with two short jumper wires. This is due to the design, where all three microvolt signals C, A, B, share the same common reference wire. Jumper wires should be insulated, single-stranded, 20-24 Gage hookup wire. Each wire may be pre-cut to around 1" (3cm) long. Be sure to tighten the screws retaining the wiring securely at the logger side on the exposed copper, and not on the insulation.
Note that the excitation power at Vin terminals labeled D and E are monitored with separate sensing wires, Orange (+), and Yellow (-) that come all the way back from the sensor connector. The sense wires are separated so that the heater voltage is known precisely without regard to the cable voltage drop. Cables carry the heater current from the voltage regulator to each sensor, and therefore are expected to have a varying voltage drop from the supply voltage the AVRD setting, depending on the load, and resistance in the length of the cable. So that the energy balance is properly computed, this voltage drop is measured with a separate sensing wire pair. Extension cables from Dynamax come complete with internal voltage dividers, or signal attenuators, that consist
of a pair of resistors soldered into end of the pigtails, and covered with black heat shrink tube. These resistors scale the signal into a range acceptable by the logger. Generally the maximum logger input voltage is 2.5 V, the sensor heater voltage is much higher, and thus we need to divide the signal with a fixed precision resistor divider network. Thus the Vin = (4H - 4L) measured at the logger is multiplied by 4.0 in software to scale the Vin signal back to the actual level. In the example of the attenuator shown above, the ratio is 5k Ohms/ 20k Ohms (1:4). This resistor network attenuates the input to a logger acceptable level. A 1:4 ratio is typical for Flow32, and is already factored into the logger program. Since the extension cables include eight wires plus a shield, any connector between the sensor and the logger requires at least 9 conductors. These connectors are available as the MEC model splash-proof locking connectors. It is recommended to install the MEC connectors about 0.5 m from the logger enclosure so that the rest of the cables can be separated for easy transportation and storage. Once the extensions more than 50 ft. are required, the MEC option is highly recommended.

Flow32-1K
17
2.2 System Set Up
Before starting the system, perform or confirm the following basic steps: 1. Make notes on the heater impedance found on the sensor serial number label. 2. Make the stem diameter measurement at the midpoint of the gauge installation. Record this measurement for loading as a stem parameter into the software later. 3. Note these parameters in the Lab notes sheet (given below) for entering in to software and programming. 4. Complete the sensor installation described in the previous Section. Cables should be attached to the sensors during this step, and electrical tape should be wrapped around the connector interface when using the system outdoors. Make a record of the cable number corresponding to the sensor/plant. 5. Attach the 9-pin RS232 connector to the personal computer or laptop COM1 connector. 6. Plug the AC adapter into a 120 VAC outlet. The backup battery begins charging at this time, and the Logger is waiting for instruction to begin running.
Allow the battery to become fully charged, and keep the battery charged fully from now on. The battery serves as a back up should power outages occur, and is not intended to last for more than 4 hours operation.

Dynamax Inc
18
2.3 Solar Power - Batteries - Charger - Expansion Options
2.3.1 Solar Panel Requirements Download the Solar Calculator from our Dynamax.com support and technical section of
downloads. http://www.dynamax.com/products/transpiration-sap-flow/flow32-1k-sap-flow-system A 60 Amp hour battery can be easily discharged overnight by a few large gages. A reference sheet is included in the following section that shows how to properly calculate the solar panel size needed and the backup battery capacity required. The Flow32-1K software includes the solarcalc.xls spreadsheet to perform the calculations. 1) The details of mounting the solar panel to a pole are contained in the instruction sheet shipped with the panels. Field applications with no line power available are handled with an external 12-volt regulated solar panel, connected to a large deep-cycle battery. Each logger module must have its own power source, which is distributed to the number of sensors attached. More than one battery may be connected in parallel to extend the operation life in cloudy weather in the larger trunk sensor application. The regulated output of the solar panels usually have the ring connectors attached, and are ready to be wired to a battery. More than one solar panel may be connected in parallel to provide enough current to run the large trunk gauges. 2.) Use caution not to touch black and red leads together. Connect solar panel red lead battery (+) to the battery (+). Next attach the solar panel battery (-), black lead and the battery (-), which is attached to the black lead to the logger (-). The AVRD regulator is normally installed into enclosures for systems. 3.) Attach the green wire to an earth ground stake or water pipe. Field installations require that the ground wire is firmly attached to a copper grounding rod. Steel or copper water pipes will also serve as a good grounding point. Hardware stores and TV/Radio electrical shops also stock ground rods for lightning protection on antenna installations as well. The copper rod should be driven into the earth at least four feet. Then clamp the green earth ground lead from the logger enclosure to the grounding rod clamp. 4) For operation with trunk gages, the user supplied 60 AHr battery, must be preserved by use of the power down mode. Refer to the modifying program and programming the logger sections on how to enact this option to save power at night. The size of the solar panel must be large enough to replace the number of amp-hours drawn by the gauges and recording equipment within the worst-case sunlight hours available at the site of installation. A power budget guide and solar radiation chart for the worst-case equivalent solar hours is provided in the following section. The spreadsheet file is included in your FLOW32-1K software CD. These charts enable one to prepare a power budget for any given sensor requirement. The work sheet may be downloaded from the Dynamax website also. Access is by a web browser to http://dynamax.com/products/transpiration-sap-flow/flow32-1k-sap-flow-system. Download this Excel file, F32-Solcalc.XLS (Office '2000 version or higher), if you would like to have the solar panel requirements automatically calculated. The battery(s) required will also be calculated. The process is to enter the quantity of sensors in each category, and then enter the "Equivalent Sun Hours", ESH, value for your area. The spreadsheet calculates the totals, and the array current required. Finally at the bottom right provides size and number of solar panels required as well as size and number of deep-cycle batteries required. Contact Dynamax or your distributor if further assistance is desired to size the solar panels for your geographic location and sensor application.
2.3.2 Worldwide Solar Distribution Chart -Worst Case Winter Data Esh

Flow32-1K
19

Dynamax Inc
20
2.3.3 Solar power Budget Sheet (Bold entries by customer)
Solar Power Calculator : Flow32-1K Sap Flow System Revision 5.0 Copyright © Dynamax Inc 2007
Using AVRD rev. 2.3 3/26/2007
Dynamax, Inc
Power Each Sensor 10808 Fallstone Rd.
Sensor Watts X Qty = Tot W P/V = I I= Amperes Suite. 350
SGA2 0.05 0 0.00 Houston, TX 77081
SGA3 0.05 0 0.00 Phone: 281-564-5100
SGA5 0.08 0 0.00 Fax: 281-564-5200
SGA9 0.10 0 0.00
SGA10 0.10 0 0.00
SGA13 0.15 0 0.00
SGB16 0.20 0 0.00
SGB19 0.30 4 1.20 See insulation Chart
SGB25 0.50 0 0.00 ESH Examples
__________ Canada 2.0 - 2.5
Total 1.20 12.00 0.10 Amp USA 3.5 - 5.0
India 7.0
SGB35 0.90 4 3.60 Brazil 4.0
SGB50 1.40 0 0.00 Africa 4.5 - 7.0
SGA70 1.60 0 0.00 Australia 2.5 - 5.0
__________ Spain 3.5
Total 3.60 12.00 0.30 Amp
SGA100 4.00 0 0.00
SGA150 10.80 0 0.00
__________
Total 0.00 12.00 0.00 Amp
Solar Panel Current Out
Sum all sensors Total Amps 0.40 Amp MSX60 3.56
Safety Factor 20%, 90 % Eff X1.3 0.52 Amp MSX30 1.75
24 Hr Consumption X24 Hr 12.48 AHrs MSX20 1.19
Consumption w/ Power Down X15 Hr 7.80 AHrs MSX10 0.59
Enter Equivalent Sun Hours (ESH) 5 2.50 Array Current Required (24 H Oper.)
Backup Battery 10 1.56 Array Current Required (15 Hr Oper.)
Battery Amperage 90 Solar Panel Type Reqired - 24Hr 2.50
Quantity of Solar Panels Required 0.70
Quantity of 90 Ahr Batteries Needed 1.4 Solar Panel Type Required - 15Hr 1.56
Quantity of 90 Ahr Batteries Needed 0.9 Quantity of Solar Panels Required 0.9 http://www.dynamax.com/products/transpiration-sap-flow/flow32-1k-sap-flow-system download for newest version.

Flow32-1K
21
Keep in mind that the ESH is for worst-case winter solar conditions, and your summer only experiments in the growing season may have significantly more "sun hours". Note that the specified batteries need to be deep - cycle, marine type batteries. It is normal to take the commercial amperage hours and derate the stated capacity on the specification by 40%, to account for the voltage limit required to maintain the datalogger operation, typically no less than 10 volts.
2.3.4 Solar calculations Example As shown in the solar calculations spread sheet. When using four SGB19’s and four SGB35’s, enter 4 in the quantity column against SGB19 and SGB35. Also enter the ESH from the chart as discussed above. From this information spreadsheet calculates current consumption and finally power requirement from the solar panel, the size and number of each of the solar modules required. Additionally one would need to have battery backup during nighttime, this is accomplished by using deep cycle type marine batteries. The spreadsheet application also calculates the battery power required as well as the number of 90Ahr batteries required. For installations requiring power save option open during nighttime, use the calculated results for 15 hours instead of 24hour operation.
Do not mix solar panels of different sizes into one system
Regulators are battery chargers and only one may be attached to a battery, or a battery
bank.

Dynamax Inc
22
2.4 120 VAC Power The pair of power leads connected from the logger enclosure conduit exit is firmly attached with the battery leads and the battery charger terminals (Red to +12), black to (-). Plug in the charger 3-prong socket to a suitably grounded receptacle; note the charging light when everything is attached. Keep the backup battery fully charged before and after operation on the logger system. The AC charger specification should include a safety protection to 45C from overcharge, shorts, and reverse charge. The AC charger specification should have a safety ground on its wall socket. This ground is isolated from the output, and is not an earth ground for the logger and sensors. It is very important that the logger and sensors should be attached to a single earth ground by the green wire. There must not be any extra wires connecting Earth to the AC power Ground, since these are not the same potential, and can cause severe ground noise (ground loops) and logger malfunctions. If the system is to be shut down for extended periods, let the battery charge 6 hours, turn off the charger and remove the battery leads. Insulate the battery leads with tape to prevent a short, and remove the wires completely.

Flow32-1K
23
2.5 Flow32-1K Expansion Modules The economy of the system solution increases by adding up to 32 Dynagage sap flow sensors since the expansion modules Flow32B-1K are inexpensive to add once the central controller is obtained. Only very simple software entries are performed to enable the data collection of expansion modules. The benefits of having plants monitored in several possible treatments or the collection of transpiration response of different varieties in a known environment is a clear advantage to a commercial plant test or research project. Within normal plant to plant variability, and accounting for leaf area index or stem diameter index of the transpiration data, four to eight stem gauges per treatment are recommended for good to excellent data correlation. Each basic model, Flow32A-1K, is delivered with all the software functions on a pre-configured installation CD (or diskette if requested) as well as individual software module copies for customized applications. All software provided has the capacity to scan, retrieve, monitor, and chart on screen a full complement of 32 gauges. Once the base system is running with eight units, the expansion to 32 gauges requires only the addition of three add-on kits. Total of 32 Sensors by Expansion Option
Flow32A-1K = 1-8 Gauges + Flow32B-1K = 9 -16 Gauges + Flow32B-1K = 17 - 24 Gauges + Flow32B-1K = 25 - 32 Gauges
Dynagage Flow32 system control is handled by PC keyboard that controls all setup and logging functions including performance maintenance. An optional keyboard/display, CR1000-KD, is available for remote display and manipulation of constants, instead of a portable PC. It should be noted that initial software installation and setup is either done by a direct PC connection. Dynamax provides the commercial production or research facility with an easily installed and upgraded system. Customer can modify the program time parameters and sensor or plant parameters as required and loads the datalogger with the solar time-date, all programs and parameters with the PC400. Data retrieval is also automated by this user-friendly menu program, PC400, which greatly simplifies program initialization, modification, or maintenance. The graphics-terminal communications utility in PC400 by launching any of the Logger connect software and pressing on the "Connect button". With built-in Dynagage sapflow calculations, each datalogger supplied with the Flow32A-1K contains a very powerful, customized sap-flow calculation program, which processes the constant heat, energy balance equations used by Dynagage sensors.

Dynamax Inc
24
Flow32 Sap Flow System Expansion Extension Cables: The maximum recommended extension cable is 75 ft (EXQC-75) in addition to the standard 25 ft (EQC-25), for a total of 100 ft (33 m). Since the extension cables include eight wires plus a shield, any connector between the sensor and the logger requires at least 9 conductors. These connectors are available as the MEC model splash-proof locking connectors. It is recommended to install the MEC connectors about 0.5 m from the logger enclosure so that the rest of the cables can be separated for easy transportation and storage. For use with trunk gauge sensors such as SGA100 and SGA150, a special cable order is required with part number EQC-xx/LR where xx stands for length of the cable. These cables are installed directly on the multiplexer with voltage dividers, and on the other end to Dynagage sensors.

Flow32-1K
25
2.6 Hardware Expansion for 16, 24 or 32 Gauges To add the Flow32-B, for one to 16, 24, or 32 sensors, respectively, all that is required is to attach the control cable and to follow the identical steps for installation, including the power supplies (or solar panels). The Flow32-A unit is positioned in the middle of the test site, and then the other modules may be positioned about 90 feet distant. The standard control cable is 100 ft long. On the free end are ten wires, color-coded and labeled by function. Once the expansion module is positioned and mounted, the free end of the control cable is fed into the Flow32A enclosure. The color-coding and labels are used to connect the signals to the appropriate DNX10 wiring panel screw terminals. Referring to Appendix A-6, starting with the blue wire, or up to three more wires for three expansion modules, carefully loosen the screw for the first signal wire to be attached, 1H on the wiring panel, insert the bare lead wire (s), (up to 4 wires per terminal) and then tighten the screw terminal firmly with the screwdriver provided with the system. Tug on the wires to be sure that the clamp has a tight hold on all wires. Continue the data connection as follows: Logger Control Cable 1H Blue 1L White 2H Green 2L Yellow After connecting the four common wires, connect the rest as follows for the appropriate number of modules: Logger Terminals Control Cable (+12) Red- (+12- AM416), Flow32-B, -C, -B, All Expansion Modules Ground GND BLK -(0V AM416), Flow32-B, -C, -B, All Expansion Modules Chassis GND Earth Bare - Shield (Control /Data Cable Shields Only) Control 1(C1) Orange (CLK), Flow32-B, -C, -B, All Expansion Modules Control 3(C3) Brown, (RES), Flow32-B, Expansion Module 1 Control 4(C4) Brown (RES) Flow32-C, Expansion Module 2 Control 6(C6) Brown (RES) Flow32-B, Expansion Module 3 Control 7(C7) Power Down Control (AVRDC only), All Expansion Modules 1- 3

Dynamax Inc
26
2.7 Setting the Sensor Input Voltage WARNING - DO NOT POWER UP THE AVRD WITHOUT UNDERSTANDING THE VOLTAGE INPUT REQUIREMENTS OF THE SENSORS. 1. The sensor voltage requirements are listed in the Dynagage Specifications Section of the Dynagage manual. Also shown below for easy access
2. The system will be shipped with both voltage regulator knobs set at about 2.0 volts. The adjustable voltage regulator is also turned off when shipped. After the sensors are installed, connected and the power is attached, flip the AVRD power switch on.
3. The potentiometer which sets the voltage is a 15 turn knob adjustor on the top of the AVRD. Clockwise rotation increases the voltage. Counter clockwise rotation decreases the voltage.
4. With the AVRD, two controls are available such that both trunk gages and stem gages connected to the Flow32 at the same time. The trunk and stem gauge requirements vary too much to be compatible, so separate voltages can be provided.
5. After choosing a target from the specification, there are two means to set the voltage.
6. Use a voltmeter attached between the chassis ground and the AVRD output terminal V1. Power leads on the end of the sensor cables are all connected together at one common point and labeled with the sensor cable number. Turn on the AVRD and adjust the voltage to the minimum required by the sensors (shown above).
Heater input voltage D.C. Measured at device terminals D (+), E (-) Part Number Min Typ Max Unit
SGA2 2.1 2.3 2.5 V. SGA3 2.2 2.5 2.7 V. SGA5 3.5 4.0 4.5 V. SGA9 3.5 4.0 5.0 V. SGA10 3.5 4.0 5.0 V. SGA13 3.5 4.0 5.0 V. SGB16 3.5 4.5 5.0 V. SGB19 3.5 4.5 5.0 V. SGB25 3.5 4.0 5.0 V. SGB35 4.5 5.5 7.0 V. SGB50 4.5 5.5 7.0 V. SGA70 5.0 6.0 7.0 V. SGA100 6.0 8.5 10.0 V. SGA150 8.5 9.0 10.0 V.
Flow32-1K
27
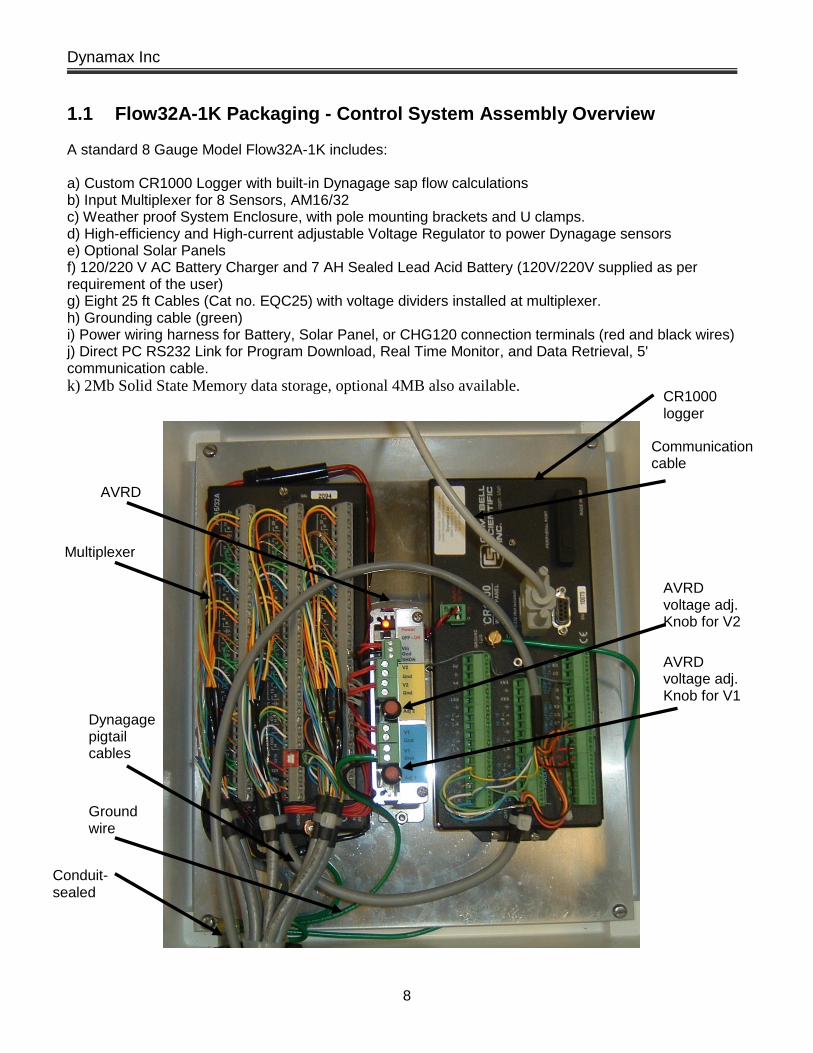
AVRD
AVRD voltage adj. Knob for V2 For sensors #5 - #8
AVRD voltage adj. Knob for V1. For sensors #1 - #4

Dynamax Inc
28
An alternate and accurate method is to use the data logger and PC400 software to monitor and set heater voltages. Since the datalogger is actually a precision digital voltmeter, it is just as well to follow the procedure below:
1. Once the hardware and sensors are setup launch the PC400 software and connect to logger.
2. Send test program F32-1K_Tst.cr1 to the logger
3. Click on Monitor mode, after loading the datalogger program, and observe the voltage as it is scanned by the logger. If you are not certain, it is best to have the adjusting knobs turned counterclockwise all the way before proceeding. Turn on the AVRD power switch.
4. Heater voltage applied to sensors are iH_V (1), iH_V (2)
5. The AH, BH, & CH channels can be selected also.
6. For setting heater voltage for sensors #1 to #4 by turning adjustable knob labeled V1 on the AVRD.
7. Turn the adjustable voltage regulator knobs until reaching the correct settings for the application and sensors attached. Be patient on the changes since five seconds elapse before the voltage is scanned and then displayed on the PC. Recall that one turn clockwise on the AVRDC is an increase of about one 0.6Volt.
8. This is an example of how to select the channels of interest for display in the monitor window, by pressing the Add button on the Monitor panel.
9. Change the update interval to 5 Seconds.
10. Repeat the steps above for setting heater voltage for sensors #5 to #8 by turning adjustable knob labeled V2 on the AVRD.

Flow32-1K
29
3.0 SOFTWARE INSTALLATION Flow32-1K is a completely integrated weather station capable of reading Dynagage sap flow sensors. Sensor readings are then stored in data logger’s memory. Data from the logger is available for down load using data logger support software. Flow32-1K station is integrated with CR1000 data logger. Hence can be operated using any of the following data logger support software,
PC400 LoggerNet
In this manual we explain using PC400 only. Procedures to operate using LoggerNet is very similar to PC400 with slight differences in the interface. For Procedure to connect, program download data using PC400 refer to the following chapters. As described above full capabilities of the Flow232-1K system can be achieved by using two sets of software programs,
1. CD 1: Flow32-1K software CD – contains,
a. Data logger program F32-1K.cr1 and F32-1K_Tst.cr1 to load in to CR1000 datalogger for reading Dynagage sensors, compute sapflow data from electrical measurements and store to logger memory.
b. Solar calculator spreadsheet to calculate solar panel requirement and battery requirement.
c. Sapflow computation spreadsheet: Excel spread sheet to calculate sapflow for dT values collected from the data logger. This spreadsheet has custom formulas to compute auto zero on the sensor data and then use zero values to compute sapflow.
2. CD 2: Data logger support software CD - PC400
Dynamax Inc
30
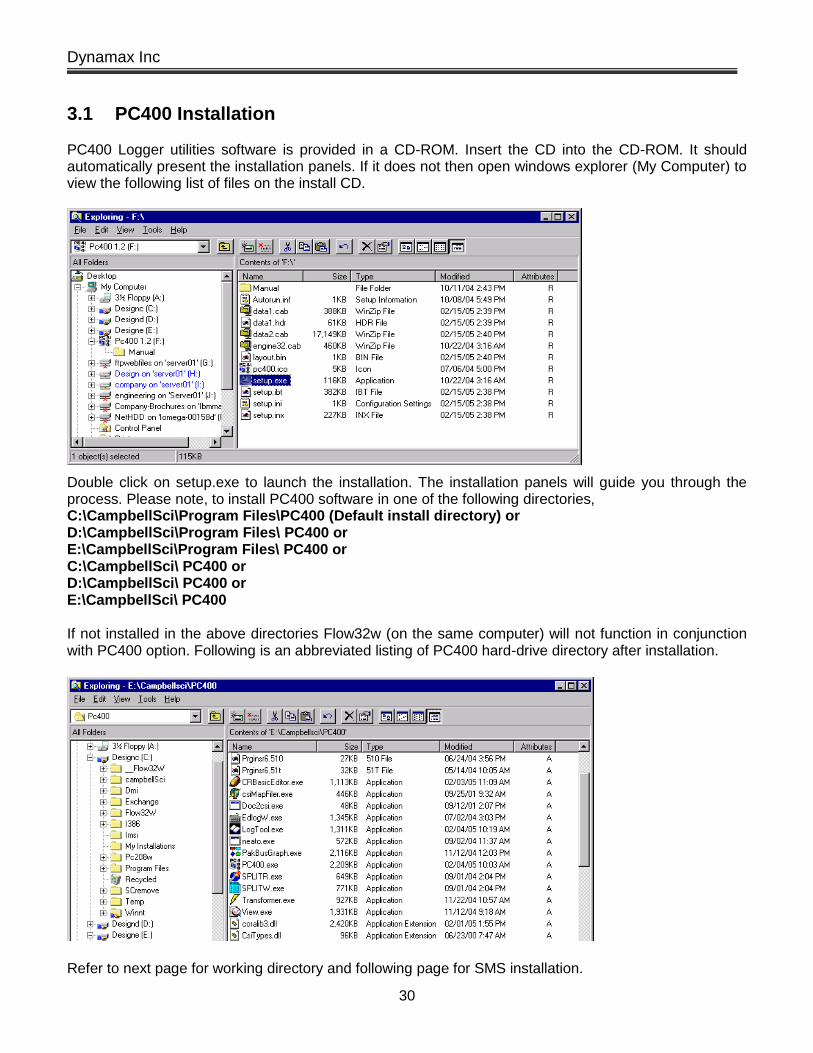
3.1 PC400 Installation PC400 Logger utilities software is provided in a CD-ROM. Insert the CD into the CD-ROM. It should automatically present the installation panels. If it does not then open windows explorer (My Computer) to view the following list of files on the install CD.
Double click on setup.exe to launch the installation. The installation panels will guide you through the process. Please note, to install PC400 software in one of the following directories, C:\CampbellSci\Program Files\PC400 (Default install directory) or D:\CampbellSci\Program Files\ PC400 or E:\CampbellSci\Program Files\ PC400 or C:\CampbellSci\ PC400 or D:\CampbellSci\ PC400 or E:\CampbellSci\ PC400 If not installed in the above directories Flow32w (on the same computer) will not function in conjunction with PC400 option. Following is an abbreviated listing of PC400 hard-drive directory after installation.
Refer to next page for working directory and following page for SMS installation.

Flow32-1K
31
3.1.1 Working Directory Location PC400 install wizard prompts for working directory location. By default working directory is C:\CampbellSci\PC400\ Specifying a different path location on the hard-drive during installation can change this to required location. Location of working directory will not affect the operation of PC400 or Flow32-1K software. This directory stores temporary files. Following is a typical list of working directory when working directory and PC400 executables are stored in different locations.

Dynamax Inc
32
3.2 Flow32-1K Software Installation To install the Flow32-1K software to your PC,
1. First create a subdirectory called Flow32-1K in your PC’s hard drive For example, C:\ Flow32-1K
2. Insert Flow32-1K software USB drive open to view the contents 3. Copy all the contents of USB folder to the new Flow32-1K folder in the hard drive
i.e. C:\\ Flow32-1K \
4. Make sure the new directory on hard drive contains all the files from the USB
5. Remove the USB and save it for future use
6. You will use the USB drive to install PC400. (Section 4.0)

Flow32-1K
33
4.0 USING PC400
4.1 Launch PC400
Launch PC400 software from the desktop icon or from the start menu. This opens the main PC400 window along with tool bars for PC400 components. To setup/ modify CR1000 parameters click on Setup Logger command. This will launch PC400 tool bar and SETUP screen, shown in the next page.

Dynamax Inc
34
4.2 Setup, Program Logger and Communications 1. If this first time using software or to add a new logger station to the software setup click on Add
button. PC400 offers a easy to use step-by-step EzSetup wizard that will guide through adding stations and connecting to logger features. If the station is already added in the list, proceed with connect to logger in the next section.
2. EzSetup wizard is shown in the screen below. Click Next to start the wizard or Cancel to manually setup station parameters at a later time.

Flow32-1K
35
If the communication test is successful Communication test successful window will be displayed as shown below. Click Next to continue with setup wizard.
3. Select Data logger type CR1000, use scroll bar to scroll down and select the logger type if necessary.
4. Type data logger name in the text field, for example Flow32-1K as shown in the figure. 5. Click next to proceed with setup process. 6. Select communication type,
Direct connect using RS232 cable or using any of the modem connections for remote communication. In this case we show a setup wizard using Direct Connect only. Following wizard may be different depending on the modem selection. Click Next to proceed with setup wizard.
7. Select COM port from the list and click Next.
8. Select Data logger settings shown below.
Set data logger baud rate to 9600. Other parameters Security code, Extra response time, Next time Online are optional defaults can be used.
Click Next to continue with setup.
9. Next window shows the setup summary
entered in the previous steps for review. If setup summary is as desired click Next to continue with connection wizard. Click Previous to make any changes to the data logger or communication setup.
10. At this point if data logger is connected to PC Com port user may proceed with communication test by selecting Yes for the radio button clicking Next. Or click Finish to close setup wizard, add
the new station (Flow32-1K) to the station list for connection and data retrieval in future.
11. If Test Communication is selected in the previous window, PC400 software tries to connect to the specified logger on the COM port assigned in the setup wizard. Displays the following dialog box while attempting to connect to logger.
Dynamax Inc
36
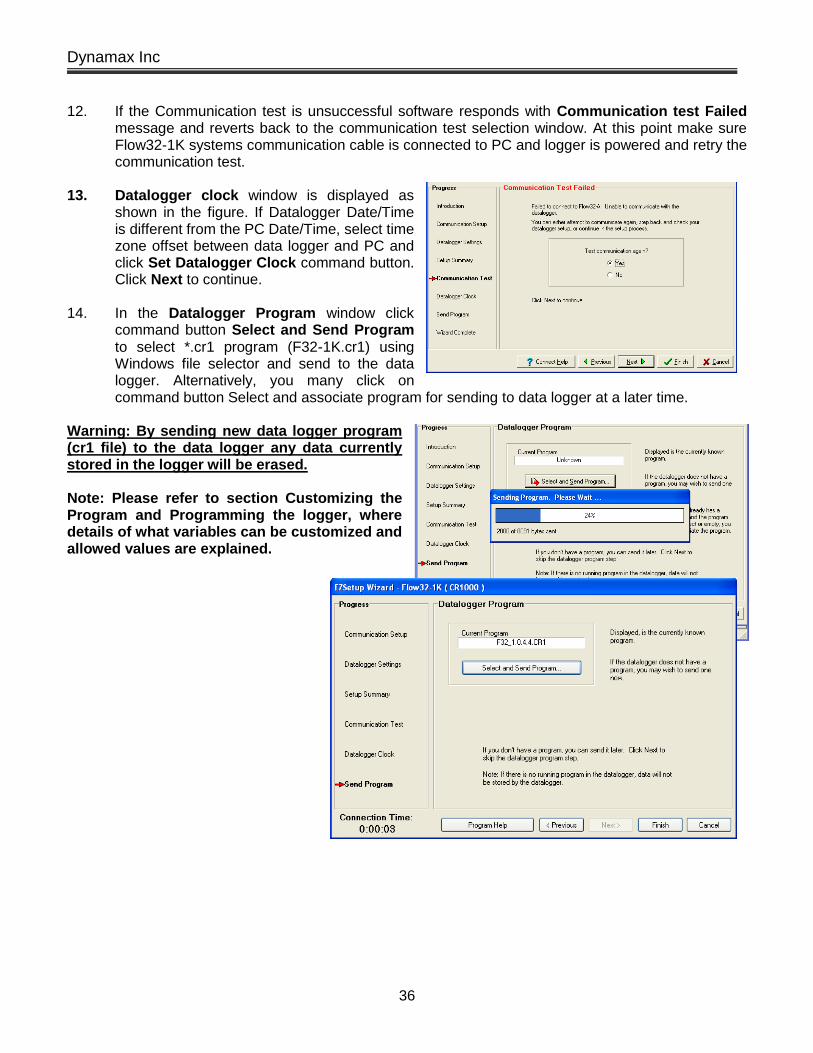
12. If the Communication test is unsuccessful software responds with Communication test Failed message and reverts back to the communication test selection window. At this point make sure Flow32-1K systems communication cable is connected to PC and logger is powered and retry the communication test.
13. Datalogger clock window is displayed as
shown in the figure. If Datalogger Date/Time is different from the PC Date/Time, select time zone offset between data logger and PC and click Set Datalogger Clock command button. Click Next to continue.
14. In the Datalogger Program window click
command button Select and Send Program to select *.cr1 program (F32-1K.cr1) using Windows file selector and send to the data logger. Alternatively, you many click on command button Select and associate program for sending to data logger at a later time.
Warning: By sending new data logger program (cr1 file) to the data logger any data currently stored in the logger will be erased.
Note: Please refer to section Customizing the Program and Programming the logger, where details of what variables can be customized and allowed values are explained.

Flow32-1K
37
15. New data file weather sent to the logger or associated in the software is displayed in the software window as shown below.
16. Click Next to continue. 17. This completes all the steps in EzSetup wizard. 18. Click Finish to close the EzSetup wizard and view PC400 main window as shown below. 19. In the PC400 Setup/Connect Tab notice “Disconnect button is displayed” as shown in the figure
below and on the bottom right corner displays Connection time, implying software is currently connected to the data logger. Also data logger clock and datalogger program can be set from this window.
20. Connection to a data logger already setup in the software is described in the next section.

Dynamax Inc
38
4.3 Connect To Logger PC400 saves data logger setting once added in the software for future connections. A list of stations with name assigned is displayed in the Setup/ Connect tab of PC400 software as shown in the figure. A summary of the previously assigned settings in the software is displayed on in this window as shown below.
In order to connect to a logger for setting up program or data retrieval simply select the logger and click the Connect button.
If the connection is successful Connect button changes to “Disconnect” and Connection time is displayed at the bottom right corner indicating software is currently connected to the data logger.
If datalogger clock and PC clock are different select Offset and click Set Clock to update datalogger clock.
To send and new program to the logger click command button Select and Send Program, click Select and Send Program to associate a new program to this logger but not sent to logger.
As soon as a connection is established to the logger, verify that the data logger clock and PC clock displayed on the PC400> Setup/Connect tab are same. If not, click the button Set Clock to set the data logger clock to current. If the computer in use set for a different time zone, use Time Zone Offset accordingly before applying Set Clock command.
Flow32-1K
39
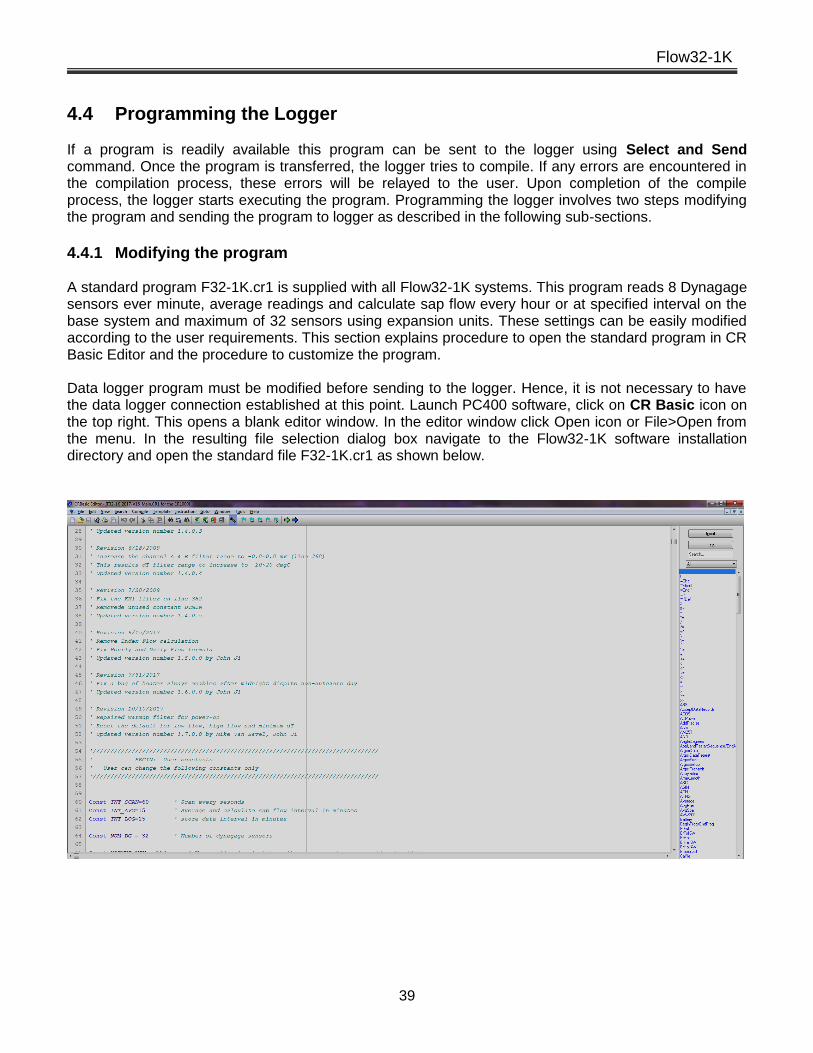
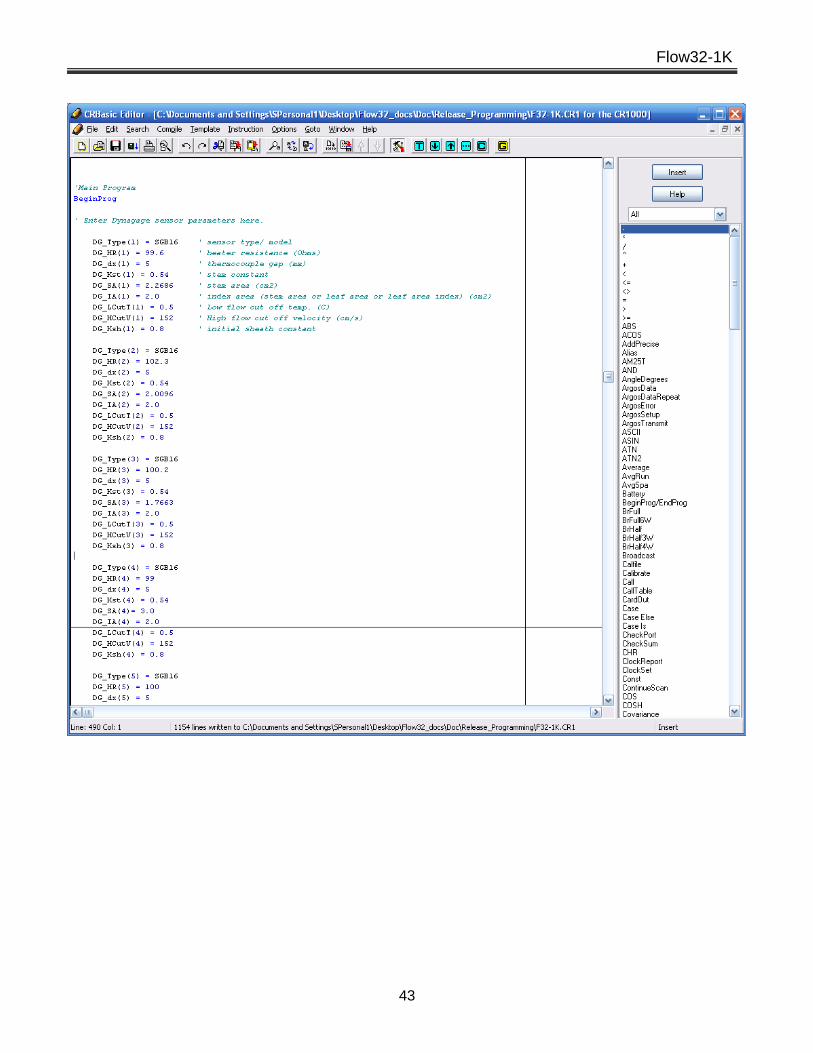
4.4 Programming the Logger If a program is readily available this program can be sent to the logger using Select and Send command. Once the program is transferred, the logger tries to compile. If any errors are encountered in the compilation process, these errors will be relayed to the user. Upon completion of the compile process, the logger starts executing the program. Programming the logger involves two steps modifying the program and sending the program to logger as described in the following sub-sections. 4.4.1 Modifying the program A standard program F32-1K.cr1 is supplied with all Flow32-1K systems. This program reads 8 Dynagage sensors ever minute, average readings and calculate sap flow every hour or at specified interval on the base system and maximum of 32 sensors using expansion units. These settings can be easily modified according to the user requirements. This section explains procedure to open the standard program in CR Basic Editor and the procedure to customize the program. Data logger program must be modified before sending to the logger. Hence, it is not necessary to have the data logger connection established at this point. Launch PC400 software, click on CR Basic icon on the top right. This opens a blank editor window. In the editor window click Open icon or File>Open from the menu. In the resulting file selection dialog box navigate to the Flow32-1K software installation directory and open the standard file F32-1K.cr1 as shown below.

Dynamax Inc
40
Navigate down in the program where the constants start and user modified constants are located. This can be identified with the following comments.
'///////////////////////////////////////////////////////////////////////////////// ' BEGIN: User constants ' User can change the following constants only '///////////////////////////////////////////////////////////////////////////////// A screen shot of the user constants in the editor window is shown below.
The following is a tabular listing of the constants and values permitted for each constant.

Flow32-1K
41
Constant Name Units Value Range Remarks
Default Maintenance INT_SCAN Sec 60 10 10 – 60 Interval between sensor
measurements INT_AVG Minutes 15 1 1 – 60 Average and sap flow
calculation interval INT_LOG Minutes 15 1 1 - 60 Store data to memory
interval NUM_DG Number 8 8 2 – 32 Number of Dynagage
sensors DTMIN Deg C 0.25 0.25 0.25 – 1.5 DT below which data is
ignored WARMUP_MIN Minutes 120 1 0 – 240 Sensor warm-up time PS_ENABLE False False 0 or 1 Power save flag (1-Enable) PS_START Number 1260 1260 0 – 1440 Power save start time PS_STOP Number 240 240 0 – 1440 Power save stop time ZERO_ENABLE 1 0 0 or 1 Auto-zero flag (1-Enable) ZERO_STARTHOUR Hour 3 3 1 – 23 Auto zero start hour ZERO_STOPHOUR Hour 5 5 1 – 23 Auto zero stop hour ZERO_DAYINT Number 1 1 1 – 10 Interval between auto zero
performing days.
Referring to the table above modify the user constants as required. Save the file with a different name so that original file is not modified. In addition to the above-mentioned list of parameters user must enter Dynagage sensor parameters such as Dynagage sensor type, Stem area, initial Ksh, for each one of the Dynagage sensors in use. This part of the code can be found starting from line number 461 in the program. A screen shot of this is shown below.
' Enter Dynagage sensor parameters here. DG_Type(1) = SGB16 ' sensor type/ model DG_HR(1) = 99.6 ' heater resistance (Ohms) DG_dx(1) = 5 ' thermocouple gap (mm) DG_Kst(1) = 0.54 ' stem constant DG_SA(1) = 2.0 ' stem area (cm2) DG_LCutT(1) = 0.5 ' Low flow cut off temp. (C) DG_HCutV(1) = 152 ' High flow cut off velocity (cm/s)
DG_Ksh(1) = 0.8 ' initial sheath constant
Dynamax Inc
42
DG_Type(1): Number 1 in the parenthesis denotes that the parameter is for Dynagage connected on sensor channel #1. Enter any of the sensor types corresponding to the sensor connected on channel #1. Sensor type entered can be any of the following. SGA2 SGA3 SGA5 SGA9 SGA10 SGA13 SGB16 SGB19 SGB25 SGB35 SGB50 SGA70 SGA100 SGA150 DG_HR(1): Resistance of the heater for the sensor connected on channel #1. Heater resistance in Ohms. DG_dx(1): Thermocouple gap. Obtain this number from Dynagage specifications DG_Kst(1): Stem constant of the plant or tree on which sensors are installed. Stem constant depends on whether the stem is woody, herb etc. DG_SA(1): Stem area of under the sensor, at the mid point. Measure diameter or circumference of the stem and calculate are of the circular stem from this data. Units in sq.cm DG_LCutT(1): Low flow cut-off temperature. Minimum temperature below which the sensor data is said to be invalid or suggests a problem with the sensor. Units in deg C DG_HCutV(1): High flow cut-off velocity, maximum velocity above which the senor is maxed out or the data form sensor is not reliable. Units in cm/s. DG_Ksh(1): Initial Ksh for the sensor on channel #1.
Flow32-1K
43

Dynamax Inc
44
4.4.2 Programming the Logger Launch PC400 software, Select the respective logger, and click Connect icon. Wait for the logger to establish communication. On the Setup/ Connect tab, check for data logger clock and set if necessary. Click select and send program command button, from the resulting file selection dialog box select the required file. Click command button Open to send the file. The software prompts a warning saying that the “Data from the logger will be lost” as shown below. Click Yes to proceed.

Flow32-1K
45
4.5 Monitor Data In Real-Time With communication established between software and the data logger, select Monitor Values tab in PC400 window.
1. Click on Add button to open the table and variable list. Select table name from the left column to
variables available in the right column. Select desired variables from the right column. Click on a cell in the Monitor values window, Click Paste button. All the selected variables will be displayed in the Monitor values window. Note that if you have a long averaging interval, it will take that amount of time to see a new reading on the averaged variables. You may want to temporarily select a smaller interval to test the operation. And then download main program with required long term averaging interval later. Any unwanted variables in Monitor window can be removed simply by selecting the cell and click Delete button.
2. Once in the Add menu, to select a range of values select the starting label, click on the beginning
of the range of intermediate memory (iC_mV(1)) and then a SHIFT-Click on the ending of the range (for example iC_mV(8)) and then click the Paste button.
3. Note any locations displaying "NAN" is a location out of range, or in the case of a sensor input
location, it is a open circuit/ not connected. See appendix for status code explanation.. Also explained below
Real time display is the best way to setup input voltage, adjusting AVRD output voltage to the sensors.
Dynamax Inc
46
5.0 DATA RETRIEVAL AND PROCESSING To initiate communications to the logger, refer to previous chapters covering the hardware setup and the communications path options. In the following section steps to retrieve the data and the data format is explained, and then we show how to interpret data collected and produce reports. Advanced post processing of data is explained in the next chapter.
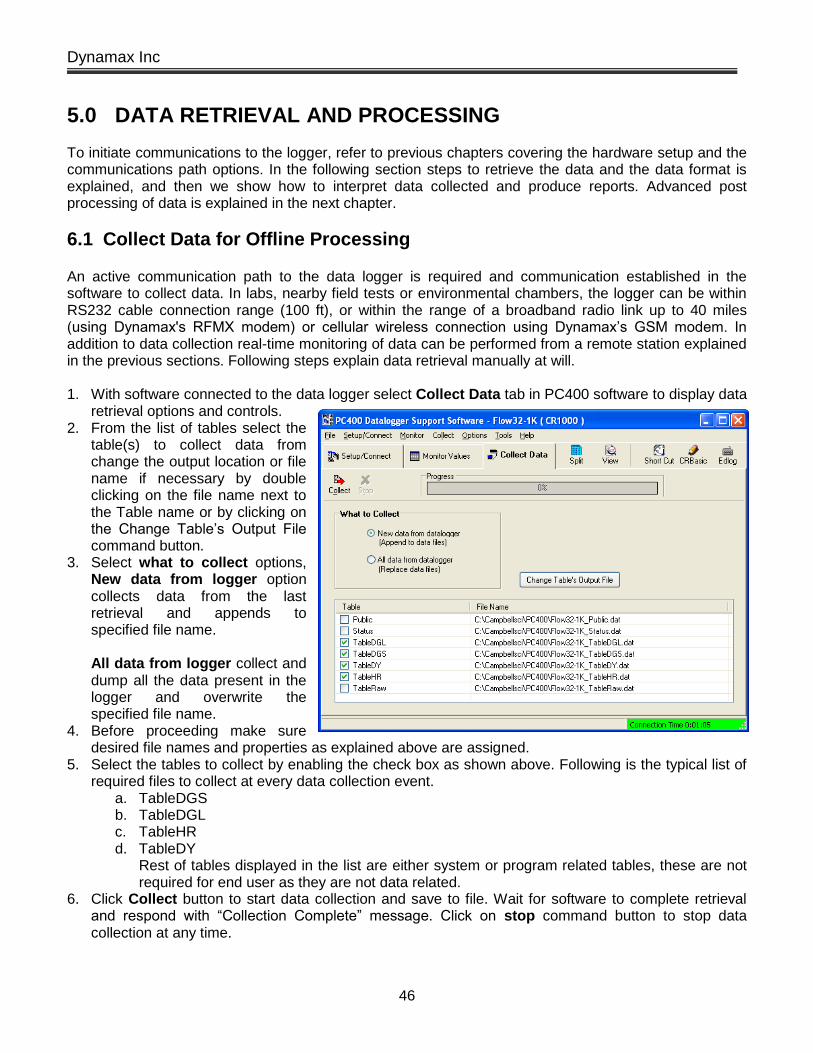
6.1 Collect Data for Offline Processing An active communication path to the data logger is required and communication established in the software to collect data. In labs, nearby field tests or environmental chambers, the logger can be within RS232 cable connection range (100 ft), or within the range of a broadband radio link up to 40 miles (using Dynamax's RFMX modem) or cellular wireless connection using Dynamax’s GSM modem. In addition to data collection real-time monitoring of data can be performed from a remote station explained in the previous sections. Following steps explain data retrieval manually at will. 1. With software connected to the data logger select Collect Data tab in PC400 software to display data
retrieval options and controls. 2. From the list of tables select the
table(s) to collect data from change the output location or file name if necessary by double clicking on the file name next to the Table name or by clicking on the Change Table’s Output File command button.
3. Select what to collect options, New data from logger option collects data from the last retrieval and appends to specified file name. All data from logger collect and dump all the data present in the logger and overwrite the specified file name.
4. Before proceeding make sure desired file names and properties as explained above are assigned.
5. Select the tables to collect by enabling the check box as shown above. Following is the typical list of required files to collect at every data collection event.
a. TableDGS b. TableDGL c. TableHR d. TableDY
Rest of tables displayed in the list are either system or program related tables, these are not required for end user as they are not data related.
6. Click Collect button to start data collection and save to file. Wait for software to complete retrieval and respond with “Collection Complete” message. Click on stop command button to stop data collection at any time.
Flow32-1K
47
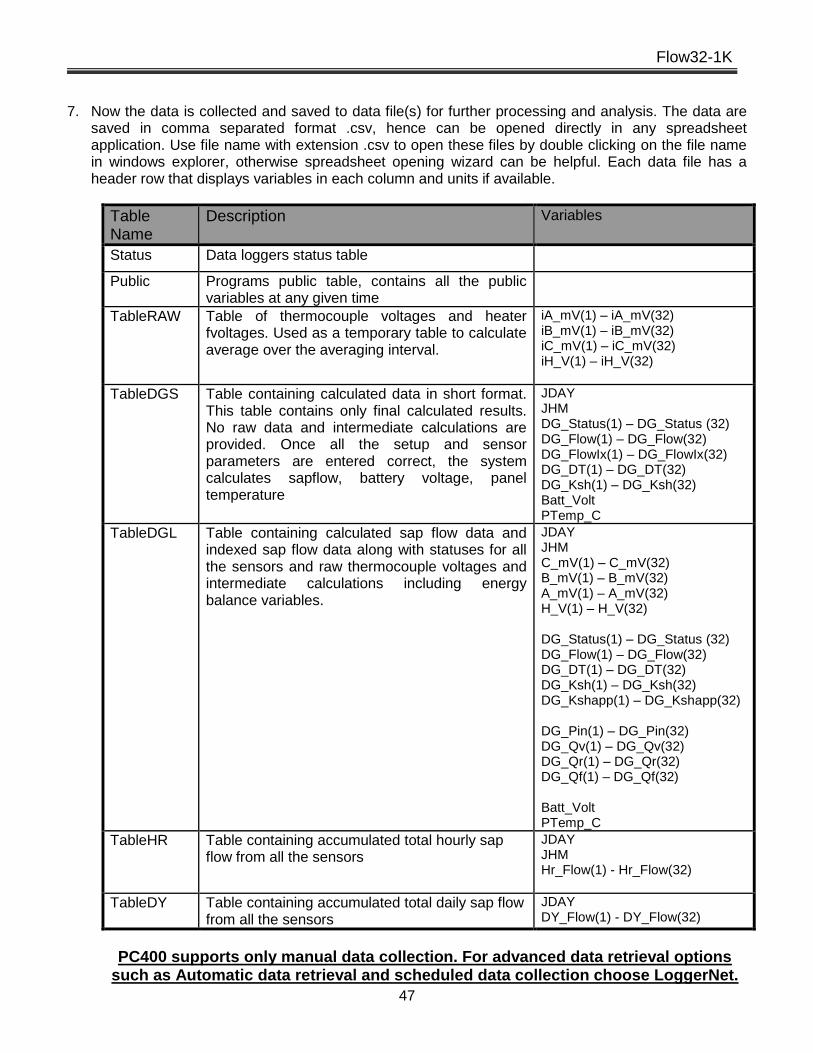
7. Now the data is collected and saved to data file(s) for further processing and analysis. The data are saved in comma separated format .csv, hence can be opened directly in any spreadsheet application. Use file name with extension .csv to open these files by double clicking on the file name in windows explorer, otherwise spreadsheet opening wizard can be helpful. Each data file has a header row that displays variables in each column and units if available.
Table Name
Description Variables
Status Data loggers status table
Public Programs public table, contains all the public variables at any given time
TableRAW Table of thermocouple voltages and heater fvoltages. Used as a temporary table to calculate average over the averaging interval.
iA_mV(1) – iA_mV(32) iB_mV(1) – iB_mV(32) iC_mV(1) – iC_mV(32) iH_V(1) – iH_V(32)
TableDGS Table containing calculated data in short format. This table contains only final calculated results. No raw data and intermediate calculations are provided. Once all the setup and sensor parameters are entered correct, the system calculates sapflow, battery voltage, panel temperature
JDAY JHM DG_Status(1) – DG_Status (32) DG_Flow(1) – DG_Flow(32) DG_FlowIx(1) – DG_FlowIx(32) DG_DT(1) – DG_DT(32) DG_Ksh(1) – DG_Ksh(32) Batt_Volt PTemp_C
TableDGL Table containing calculated sap flow data and indexed sap flow data along with statuses for all the sensors and raw thermocouple voltages and intermediate calculations including energy balance variables.
JDAY JHM C_mV(1) – C_mV(32) B_mV(1) – B_mV(32) A_mV(1) – A_mV(32) H_V(1) – H_V(32) DG_Status(1) – DG_Status (32) DG_Flow(1) – DG_Flow(32) DG_DT(1) – DG_DT(32) DG_Ksh(1) – DG_Ksh(32) DG_Kshapp(1) – DG_Kshapp(32) DG_Pin(1) – DG_Pin(32) DG_Qv(1) – DG_Qv(32) DG_Qr(1) – DG_Qr(32) DG_Qf(1) – DG_Qf(32) Batt_Volt PTemp_C
TableHR Table containing accumulated total hourly sap flow from all the sensors
JDAY JHM Hr_Flow(1) - Hr_Flow(32)
TableDY Table containing accumulated total daily sap flow from all the sensors
JDAY DY_Flow(1) - DY_Flow(32)
PC400 supports only manual data collection. For advanced data retrieval options such as Automatic data retrieval and scheduled data collection choose LoggerNet.

Dynamax Inc
48
Output Table Clarification:
TableHR – Output table for accumulated total hourly sapflow data. Accumulation starts with the first average of an hour and ends with the average at top of the following hour. For example, if INT_AVG=10 and INT_LOG=10, the accumulation starts with the average sapflow reading at 10 minute of an hour, followed by 20, 30, 40, 50 minutes of the hour, then ends at 0 minute on the next hour. The final result is labeled with the time of last average reading, for example below, 6/16/2017 19:00. Now we know hourly sapflow data contains the average of sapflow from the previous hour.
TableDY – Output table for accumulated total daily sapflow data. Similar to TableHR, it is
an accumulation of averaged sapflow that starts with the first average of the day and end with the average at top of the following day. So daily sapflow data contains the average of sapflow from the previous day.
TIMESTAMP RECORD JDAY JHM DG_Flow(2) Calculated
Total TableHR
6/16/2017 18:10 41 167 1810 18.1 44.60041
6/16/2017 18:20 42 167 1820 18.2 44.64428
6/16/2017 18:30 43 167 1830 18.3 44.59958
6/16/2017 18:40 44 167 1840 18.4 44.57451
6/16/2017 18:50 45 167 1850 18.5 44.49792
6/16/2017 19:00 46 167 1900 19 44.3481 44.54413 44.54413
TIMESTAMP RECORD JDAY JHM DG_Flow(2) Calculated
Daily TableDY
6/18/2017 0:00 220 169 0 0 0.3442472 222.1104 222.1104

Flow32-1K
49
6.2 Graphics Mode Display - File Data 1. In order to view data that has been collected by the data logger in the previous section, PC400 View utility is a great tool for a quick look at the data. Detailed charts are probably best done with another Windows application or the Recalculate option explained in the next chapter. Click on the View button on the PC400 main toolbar to get the following panel.
2. Click on File and browse down to Open file selection dialog. Select file name with .dat or .csv extension. FSL file is not necessary for CR1000 output files as the header information is saved in the same table output file.
3. Click on View then Expand tabs to see the data in a more readable column format.

Dynamax Inc
50
4. Click the on the required column to select it. The selected column will be highlighted in blue as shown below DG_Flow(1) is highlighted in blue.
5. To select a second column press control key on the keyboard, and click on the second required column with mouse button. The second column will be highlighted in Red. Shown for DG_DT(1) 6. Once the necessary column(s) are highlighted, click on Show Graph (1 Y-axis) or Show Graph (2 Y-axes) tool bar button. This launched a graph displaying selected column values in Y-axes. The X-axes is always the first column, i.e. time stamp. Examples of graphs with one Y-axis and with two Y-axes are shown to the right.
Flow32-1K
51
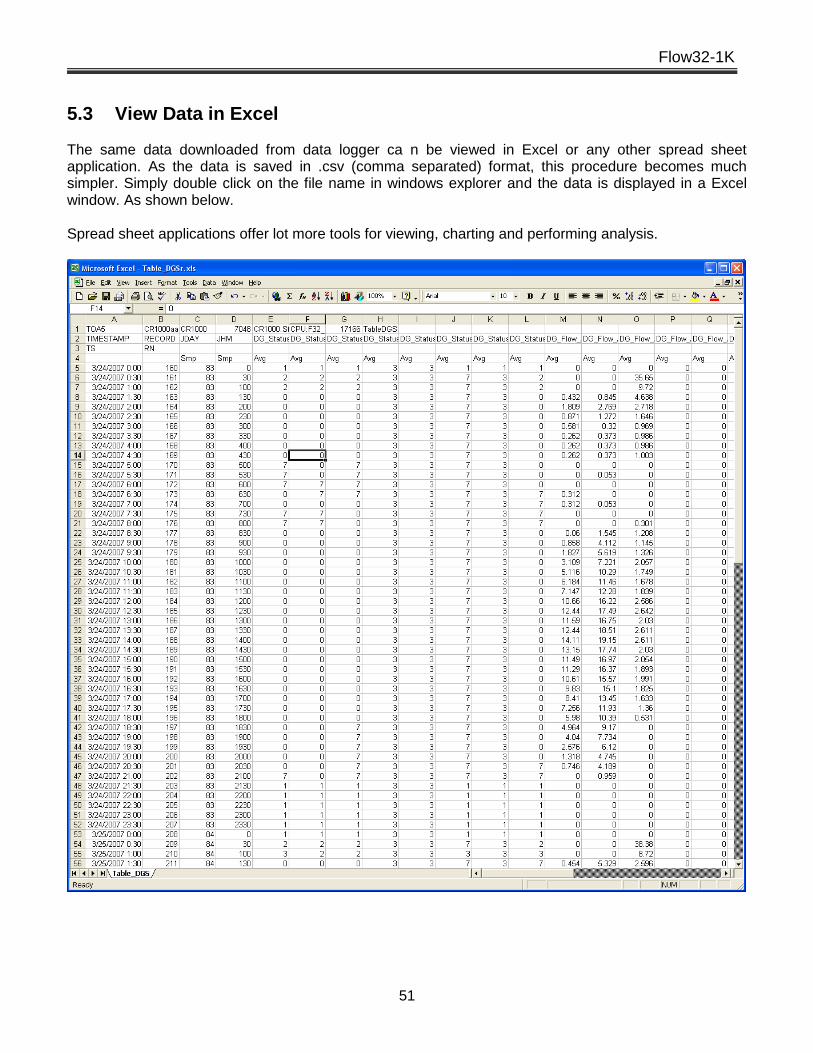
5.3 View Data in Excel The same data downloaded from data logger ca n be viewed in Excel or any other spread sheet application. As the data is saved in .csv (comma separated) format, this procedure becomes much simpler. Simply double click on the file name in windows explorer and the data is displayed in a Excel window. As shown below. Spread sheet applications offer lot more tools for viewing, charting and performing analysis.

Dynamax Inc
52
Simply click on the chart control button and select signals or variables to chart and follow through the chart wizard. You can also choose color of the lines, format, variables, background color and numbering format. Below is an example of chart generated in Excel for sapflow from sensor#1 and Sensor#2 in g/hr.
0
5
10
15
20
250
23
0
50
0
73
0
10
00
12
30
15
00
17
30
20
00
22
30
10
0
33
0
60
0
83
0
11
00
13
30
16
00
18
30
21
00
23
30
DG_Flow(1) (g/hr)
DG_Flow(2) (g/hr)
Flow32-1K
53
6.0 DATA ANALYSIS
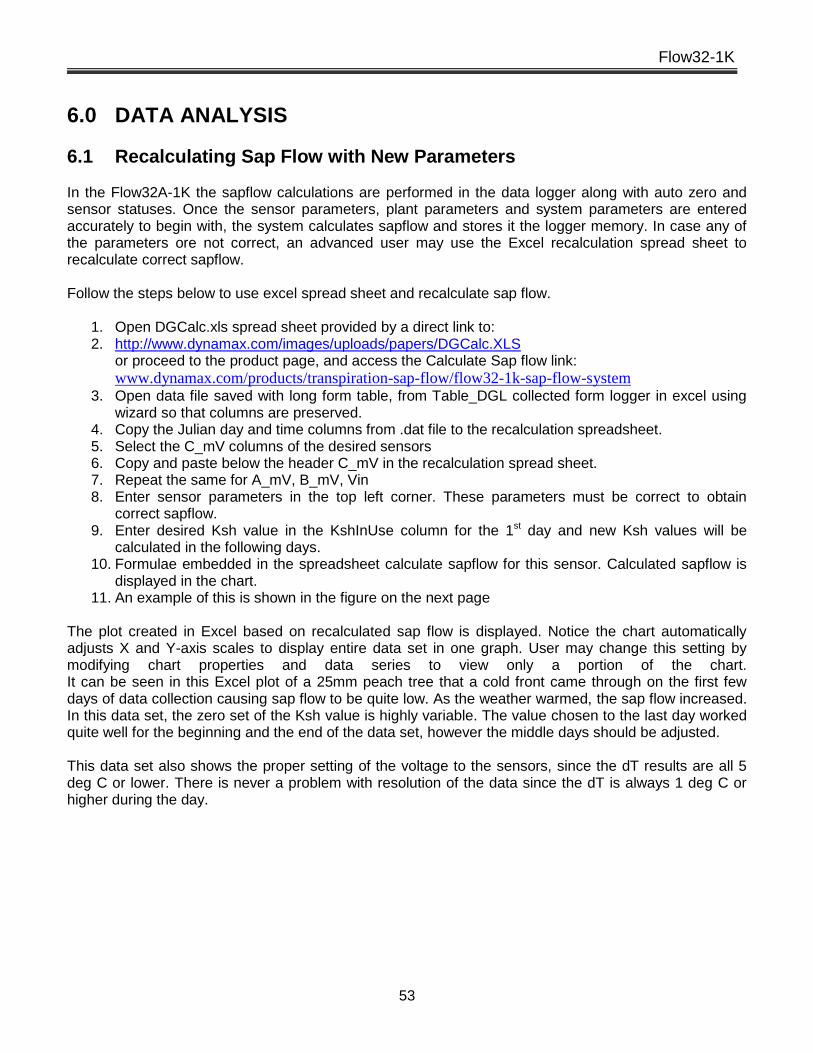
6.1 Recalculating Sap Flow with New Parameters In the Flow32A-1K the sapflow calculations are performed in the data logger along with auto zero and sensor statuses. Once the sensor parameters, plant parameters and system parameters are entered accurately to begin with, the system calculates sapflow and stores it the logger memory. In case any of the parameters ore not correct, an advanced user may use the Excel recalculation spread sheet to recalculate correct sapflow. Follow the steps below to use excel spread sheet and recalculate sap flow.
1. Open DGCalc.xls spread sheet provided by a direct link to: 2. http://www.dynamax.com/images/uploads/papers/DGCalc.XLS
or proceed to the product page, and access the Calculate Sap flow link:
www.dynamax.com/products/transpiration-sap-flow/flow32-1k-sap-flow-system
3. Open data file saved with long form table, from Table_DGL collected form logger in excel using wizard so that columns are preserved.
4. Copy the Julian day and time columns from .dat file to the recalculation spreadsheet. 5. Select the C_mV columns of the desired sensors 6. Copy and paste below the header C_mV in the recalculation spread sheet. 7. Repeat the same for A_mV, B_mV, Vin 8. Enter sensor parameters in the top left corner. These parameters must be correct to obtain
correct sapflow. 9. Enter desired Ksh value in the KshInUse column for the 1st day and new Ksh values will be
calculated in the following days. 10. Formulae embedded in the spreadsheet calculate sapflow for this sensor. Calculated sapflow is
displayed in the chart. 11. An example of this is shown in the figure on the next page
The plot created in Excel based on recalculated sap flow is displayed. Notice the chart automatically adjusts X and Y-axis scales to display entire data set in one graph. User may change this setting by modifying chart properties and data series to view only a portion of the chart. It can be seen in this Excel plot of a 25mm peach tree that a cold front came through on the first few days of data collection causing sap flow to be quite low. As the weather warmed, the sap flow increased. In this data set, the zero set of the Ksh value is highly variable. The value chosen to the last day worked quite well for the beginning and the end of the data set, however the middle days should be adjusted. This data set also shows the proper setting of the voltage to the sensors, since the dT results are all 5 deg C or lower. There is never a problem with resolution of the data since the dT is always 1 deg C or higher during the day.

Dynamax Inc
54
www.dynamax.com/products/transpiration-sap-flow/flow32-1k-sap-flow-system to download the latest verison DGCalc.XLS

Flow32-1K
55
BLANK PAGE

Dynamax Inc
56
6.2 Correct Sap Temperature Increase - Analysis The amount of power absorbed by the sap should be set high enough to get the proper signals, but low enough to cause no damage to the stem. The sap temperature rise, dT, should not exceed eight degrees in the morning and should be above .3 degrees C during the peak flow period. One way to monitor overheating of the stem or trunk is to monitor the sap temperature increase during the sunrise period of sap flow. If the maximum temperature increase, dT, exceeds eight degrees C by 25%, reduce the power 25% or more. As an example, the flow monitored on a cedar tree is graphed in the figure on the following page. The flow rate and the dT signals are shown. The power input was 1.3 W throughout the night. In this example, dT exceeded 14 C early in the morning as the flow started. Since the temperature at the high flow rate, around 600 g/hr, was well above the minimum required, and never decreased below 0.5 C, a lower power setting is necessary. A power reduction of 40% is recommended in this case. The same gauge was placed on an apple tree and the power was reduced to about .9 W. The apple tree data retrieved is charted in the figure on the next page. In addition to reducing the constant power setting, the power is applied only during the day. There are several benefits to this approach. First, note that there is no major oscillation of temperature as the sap flow begins, and no undershoot which could require interpolation of the flow rate. A second advantage is the battery power saved. The application of power is shown applied to the plant stem only when it is necessary, for example the hour before dawn. In the example of the apple tree, the maximum temperature increase is five degrees. The power was applied shortly before dawn as well as less power being applied at that time, thus reducing the effect of heat stored in sap that is not moving. Also, the flow of sap is expected to start later and ramp up slower because of thick clouds present and some rain until 11:00 in the morning. The heat flux figures themselves are indicators of the appropriate power settings. There are cases where the sap flow is expected to be very low for long periods. For example, the same apple tree that is shown in the figure on the next page, during fall or early spring will not be using much water. After observing dT approaching zero for the majority of the nighttime readings (assuming power is applied continuously), the first conclusion made is that the plant is shutting down flow at night completely. In the summer there will be a significant recharge of available water at night, and thus Ah and Bh readings will indicate positive numbers (averaged together, up to one degree dT, for example). The spring/fall procedure then is to minimize the power because heat builds up under the gauge at night. Again, in this case, it is prudent to use the power down timer to cut power to the gauge at night when very low flow is expected under normal circumstances. The timer may be set to turn on an hour before sunrise. The example of a large percentage of heat flux carried by the sap is shown in the reduced power application on apple, shown in the figure on the following page. In contrast, when a low sap-flow application is under measurement, the heat flux is partitioned 80 - 90% in radial power loss. When this large percentage of heat is lost by conduction out of the sensor insulation and the stem, as opposed to 80% or more lost by sap heat flux, a power setting too high may damage the stem. Damage can be caused by high temperature building up in the gauge. In this case the power down mode of the Flow32 must be used to prevent stem damage.

Flow32-1K
57

Dynamax Inc
58
The condition of low sap flow is found in wilted plants, indoor and tropical plants. Herbaceous plants during winter conditions have low flow rates, and plants in hibernation are expected to use less water. The user should be aware of the power and relative temperature increases during these low sap-flow conditions. If there is an excess of heat, the recommended solution is to lower the power and cycle power on only during the daytime. Besides a more efficient use of energy, lower power has fewer tendencies to cause condensation within the gauge in addition to the benefit of protecting the plant.
When sap-flow measurement on a species with a robust canopy is known to have a high liquid flow conductance (See reference 13, Steinberg, 1990), then monitoring dT is important during the day. If the dT signal is below .5 degrees C during the day, there should be more power applied to avoid a high probability of error in the sap flow computations. Temperature increase of the sap should be checked at the minimum values when sap-flow (Qf) accounts for 80% or more of the heat flux. In the figure below, sap flow is shown for a Pecan tree, which is 125 mm in diameter measured during September 2-4 in Texas. The days in question were very hot and the pecans are reaching maturity.
Simultaneous lysimeter readings showed that transpiration was 180 Kg per day. The figure shows that the sap temperature increase in the morning was not large enough to cause concern about overheating and reached a maximum dT of five degrees. However, the dT at 10:00 was less than .25 C, causing the high-flow filter to limit the flow computed to 14.5 kg/hr, avoiding the accumulation of out of range data. For the rest of the day, from 11:00 until 20:00, dT was below .5 C. Although the time constant of the gauge at 9:00 to 10:00 am changing from about 2hours to 30 minutes justifies the use of the filter during the sunup event, the majority of the readings thereafter are close to the minimum dT desired. In the case of continuously low dT, filtering for the majority of

Flow32-1K
59
6.3 Interpretation of Sunup Events Since Dynagage has a longer time constant in the morning, rapid changes in sap flow can cause a period of dynamic changes in the sensor signals, which take more time to stabilize than the usual 15 or 30-minute output computation. Some of the effects are caused by the rapid response of the thermopile not synchronized with the longer time response of the dT signal. Some of the effects, most noticeable in trees, are caused by the heat stored in the trunk section being released in the morning when the gauge section's sap has moved above the gauge. Both of these effects are referred to as "sunup events", concurrent to an initial flow of sap flow just after dawn and lasting for 30 minutes to two hours. If the heat stored is pronounced, and moves up the trunk quickly, before dissipation to the ambient, warm sap passes by the upper thermocouples, and a negative thermal conduction appears (Qv is negative). Negative upward conductive heat loss means simply that the heat conducted is into the stem section instead of outward. That is caused by sap at TC junction A having a higher temperature than at B. Usually the TC closest to the heater, B, is warmer than A, and the Ah signal is less than the Bh signal. As the high-temperature preheated sap moves past B, and is adjacent to A, then the Ah signal becomes larger than the Bh signal. As shown in field tests (Reference 5, Steinberg, 1988) and in simulations (Reference 9, Baker and Neiber), the accuracy of the flow computations are still maintained during these conditions within reasonable limits. Since the additional heat is properly accounted for in the energy balance, the user does not need any special computation to compensate for these events. In regard to the change in time constant from predawn to after sunup, the integration of the results over a diurnal period reduces temporary deviations to a minimal effect. In general, the energy balance method has compared favorably with gravimetric transpiration measurement on the basis of a daily integration period. When the water capacitance is very small, and the plant mass is a kilogram or less, there will be no noticeable lag in gravimetric transpiration versus sap-flow measurement (See Reference 14, Rose, 1990 and Reference 7, Dugas, 1990). These references used rose and cotton plants, species which were indicated as having low water capacitance. Due to the size of the gauges used, SGA10 to SGA16 models, the time constant is expected to be small as well. In contrast, the larger gauges with more mass in the stem section have a time constant which decreases as the sap flow rate increases. For this reason, the use of the gauge readings during the sunup event should not include direct conclusions about sap flow for the duration of the time constant. If the user finds there are large spikes in the flow calculations, which are attributed to sun on the exposed trunk below the gauge, or some other example of external thermal noise, then straight-line interpolation of the data is the most reasonable interpretation of the flow rates. Certainly it is prudent to take corrective action on the cause of the problem before making further readings. The interpolation should begin at least 30 minutes before the identified problem started, and continue until 30 minutes after the problem has subsided. In other words, a straight line joins two good data points together, and then the daily integration includes the data points from the straight line instead of the data out of range. A good example of this method is used in Reference 5 which explains how erroneous data caused by either a poor (loose) fit or sun incident on the trunk (not insulated enough below the gauge) was fixed. The final results after interpolation demonstrate that the sap flow was within +0.8% of the lysimeter readings over a three-day test.

Dynamax Inc
60
6.4 Transpiration versus Sap-Flow Only over long time periods, such as 24 hours or 12 daytime hours, will transpiration and sap flow be substantially equal. The possible difference over shorter periods of time is caused by changes in the water content of the plant above the gauge and on larger gauges it may be caused by a time lag in the measurement of sap flow. The size, or duration of this difference depends on the plant species, size, and the environmental conditions. When verifying the performance of the gauge, ideally one should maintain constant conditions over the period of the test. Usually this can be done only in a controlled environment facility. The foregoing is not to say that, in many conditions, the accumulated sap flow over an hour is not a close estimate of the transpiration by the plant, but caution is in order.

Flow32-1K
61
7.0 COMMUNICATIONS Dynamax sapflow systems and weather stations using CR1000 data loggers along with PC400 or LoggerNet has added communications and networking features for remote long distance and cable communications and scheduling. Below is a list of communication devices offered by Dynamax and are tested on CR1000 based systems for signal strength and transmission range.
Cellular Modem (GSM): GSM is a Dual-band cellular modem for serial communications using GSM mode. As GSM is widely acceptable and providers available in most countries. Cellular modem is offered in all the 4 available GSM frequencies making it possible to use in any country. Devices with serial data rates up to 15200bps can be connected using GSM modem.

Dynamax Inc
62
7.1 RF Modem (RFMX)
RFMX 900 MHz RF modem with transmission range of up to 40 miles LOS using a directional antenna is shown in figure below. Basic hardware setup using half-wave dipole antenna is shown above. RFMX modems with dipole antenna has a transmission range of up to 7 miles LOS. This chapter describes installation of RFMX modems along with hardware, required power, supplies, network topologies, etc. Also is included a list of compatible hardware for use with RF modems such as Surge protectors, high-gain Antennas, omni-directional antennas, coaxial cables and connectors, adapters etc. Refer to the list of hardware required for entire list.
2 RFMX Modems
Antenna
A0
(0,0)
Serial data cable
RFMX Remote
Modem
Surge Protector DSX
RPSMA-N N-N coaxial Logger
Null Modem

Flow32-1K
63
7.1.1 Specifications Communication Frequency 902 –928 MHz
Channel capacity 7 hopping sequences sharing 25 frequencies
RF baud rate 10,000 bps
Network Topology Point-to-point, Point-to-multi-point Multi-drop
Serial Interface RS-232
Serial Baud Rate 1200 – 115200 (programmable)
Performance Indoor Up to 1500’ (457m)
Outdoor 7miles/ 11Km LOS (dipole) 40 miles/ 64Km LOS (Yagi/ High-gain antenna)
Transmit power output 140mW (21.5dBm)
Receiver sensitivity -110dBm
Power Supply voltage 7 – 18 VDC
Transmit current 200mA
Receive current 7mA
Power down current <1mA
Physical properties Enclosure size 2.75” x 5.50” x 1.124”
Weight 7.1 oz (200g)
Operating temperature -40o to +85o C
Ce0rtifications FCC Part 15.247
Industry Canada
7.1.2 List of Hardware
Radio-Surge Protector cables Length
LMR400 N(M)-RPSMA(M) coax 3'
RPSMA(M) - RPSMA(F) 3'
RPSMA(M) - RPSMA(F) 10'
RPSMA(M) - RPSMA(F) 20'
Surge Protector DSX-POL N(F)
Antenna cables (Coaxial) Length
LMR400 N(M)-N(M) 10'
LMR400 N(M)-N(M) 20'
LMR400 N(M)-N(M) 30'
Antenna dB gain
Dipole/Half-wave comes with radio 2.1dB 2.1
High directional Yagi antenna 6, 9, 11
Omni directional antenna 3, 5, 7

Dynamax Inc
64
** Refer to RFMX data sheet for detailed specifications and various antenna and accessory configurations available. 7.1.3 Programming RFMX modems are programmable using LoggerNet software. Set DIP switches as sown in the figure above for RS232 mode. Connect RF modem directly to the PC using serial cable as shown above. Refer to RFMX manual for detailed programming and communication protocol.
7.1.4 Antenna/ Tower Line of sight between host and remote modem is essential to get maximum signal strength and maximum transmission range. This distance can be improved by using mounting antenna on a high tower such that common obstructions like trees, buildings are not causing an obstruction in to interface between the two points. An example of this is shown in the figure below.
7.1.5
Host Modem Installation

Flow32-1K
65
Configuration for Host station is shown in figure below. RF modem is connected to PC using serial cable and to transmitting antenna via surge protector to shield equipment from lightning surges. Make sure to earth ground the surge protector.
7.1.6 Remote Station Installation Hardware setup for remote Logger station is shown in figure below. Program RF modem from LoggerNet / PC400 software before connecting to remote station.
Tower
A0
(0,0)
Serial data cable
RFMX Remote Modem
Surge Protector DSX
N/Female – N/Female
RPSMA-N cable
3’ long
N-N coaxial cable
3’ long
LMR 400
Logger
Null Modem
RFMX Host Modem
Modem

Dynamax Inc
66
7.1.7 Use of Repeater For extreme terrain conditions, and transmission over long distances achievable using host and remote antennas it is possible to use a repeater tower along with a omni-directional antenna as shown in the figure below. This is simple store and forward method of repeater configuration. This configuration uses a loop back adapter supplied with RF modem. The repeater will buffer incoming data and retransmit it when there is a break in data reception.
RFMX Repeater Modem

Flow32-1K
67
7.2 Dual band cellular wireless Modem (GSM)
Dynamax sapflow systems and weather stations are compatible with cellular modem (GSM-F1/2) for remote communications using GSM wireless network. Communication can be established using PC400 or LoggerNet. **base modem / modem connected to the PC-software Conexant HCF 56K modem is not in the modem pick list Select “Rockwell HCF 56K modem” instead Enter data number corresponding to the remote modem – Phone modem/ GSM cellular modem Connecting to the Logger:
1. Click on Connect tool bar to open Connect to datalogger window. 2. Select CR1000 station with GSM modem.
3. Click on connect button to start dialing out to GSM modem and datalogger network.
Voice/
dialup lines
Phone
Company
Antenna

Dynamax Inc
68
7.3 Modes of Communication PC400 and LoggerNet components in software support various remote communication devices. Refer to section 1.6 for list of all the new features and upgrades. Following communication modes are possible using logger,
Point-to-point configuration of multiple Logger stations
Point-to-multi-point configuration of multiple Logger stations
Communication scheduling and automatic data collection
Simultaneous monitoring and control of multiple stations from single PC when each station connected to a different COM port.
Data logger systems along with LoggerNet supports the following communication interfaces,
Standard serial communication using Serial data cable
RF communication using Dynamax’s RFMX modems
Short-haul modem communication using Dynamax’s SHM.
GSM cellular communication modem For additional modes of communication not mentioned above may be used to communicate with Logger but would require manual configuration specific to the communication device.
7.3.1 Modes of Configuration
Point-to-point Point-to-point is a simple configuration in which two devices located at two different places are interfaces to communicate with each other by using cable, modem etc. Simple point-to-point configuration between Logger and COM1 on PC is shown in figure below. Cable interface in this figure can be replaced with RF or serial interface converter.
Point-to-multi-point Point-to-multi-point configuration is one in which two or more devices located at different places are interfaced to communicate with single control station or PC. An example of point-to-multi-point configuration is shown in the figure on the next page. Data loggers Logger 0, Logger 1 and Logger 2 are setup to communicate with PC on COM1. PC400 and LoggerNet can program host modem to communicate with only one of the remote stations at any given time.
Logger

Flow32-1K
69
Multi-station Scheduling A multi-station setup as shown in figure below is a configuration of more than one station connected to a single PC but each station connected on a different COM port. Main advantage of this type of configuration is in situations where it is required to simultaneously monitor and schedule more than one station from a single PC using LoggerNet software. Once hardware (cabling and connections) is setup the setup is ready to monitor anytime. Communication interface in this network can be substituted with any of the available types as long as there is only one Logger station setup on each COM port.
Logger 0
Logger 1
Logger 2
Logger 4
Logger 3
Logger 2
Logger 1
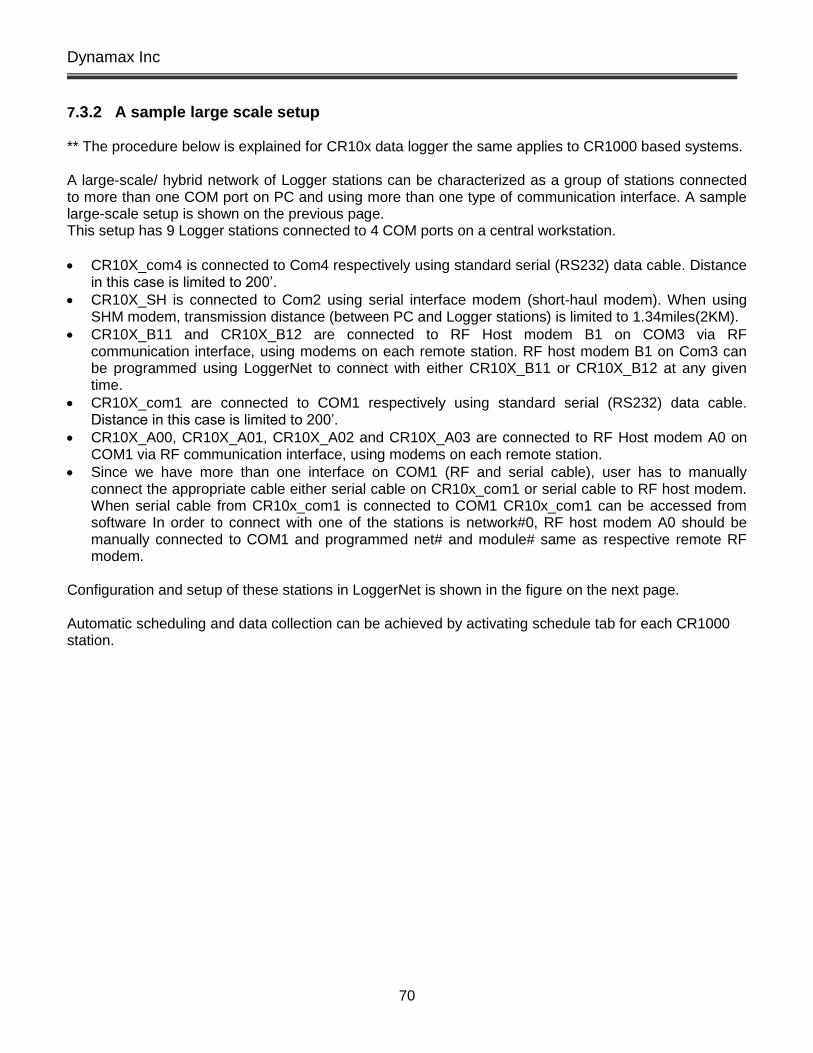
Dynamax Inc
70
7.3.2 A sample large scale setup ** The procedure below is explained for CR10x data logger the same applies to CR1000 based systems. A large-scale/ hybrid network of Logger stations can be characterized as a group of stations connected to more than one COM port on PC and using more than one type of communication interface. A sample large-scale setup is shown on the previous page. This setup has 9 Logger stations connected to 4 COM ports on a central workstation.
CR10X_com4 is connected to Com4 respectively using standard serial (RS232) data cable. Distance in this case is limited to 200’.
CR10X_SH is connected to Com2 using serial interface modem (short-haul modem). When using SHM modem, transmission distance (between PC and Logger stations) is limited to 1.34miles(2KM).
CR10X_B11 and CR10X_B12 are connected to RF Host modem B1 on COM3 via RF communication interface, using modems on each remote station. RF host modem B1 on Com3 can be programmed using LoggerNet to connect with either CR10X_B11 or CR10X_B12 at any given time.
CR10X_com1 are connected to COM1 respectively using standard serial (RS232) data cable. Distance in this case is limited to 200’.
CR10X_A00, CR10X_A01, CR10X_A02 and CR10X_A03 are connected to RF Host modem A0 on COM1 via RF communication interface, using modems on each remote station.
Since we have more than one interface on COM1 (RF and serial cable), user has to manually connect the appropriate cable either serial cable on CR10x_com1 or serial cable to RF host modem. When serial cable from CR10x_com1 is connected to COM1 CR10x_com1 can be accessed from software In order to connect with one of the stations is network#0, RF host modem A0 should be manually connected to COM1 and programmed net# and module# same as respective remote RF modem.
Configuration and setup of these stations in LoggerNet is shown in the figure on the next page. Automatic scheduling and data collection can be achieved by activating schedule tab for each CR1000 station.

Flow32-1K
71

Dynamax Inc
72
APPENDIX A: AUTO ZERO Flow32-1K uses a simplified auto zero to calculate Ksh value at predawn time. Ksh is the sheath content of the plant/branch when sapflow is zero or the plant is not conduction any sapflow. This occurs most of the cases at predawn between 2 and 6AM. During this time Ksh value is calculated according to the formula explained in Dynagage manual.
Ksh = (Pin - Qv) / (CH) (W/mV)
Where Pin, is the power give to Dynagage sensor heaters Qv, vertical heat conduction CH, Voltage measured from the thermopiles, for radial heat conduction From all the Ksh values calculated in this interval, data logger finds a minimum value (numerical minimum). Minimum Ksh value corresponds to zero sapflow for that particular plant on that day under that weather conditions. Hence, it is very important to realize that Ksh is not a fixed value for a plant or for a sensor. Ksh depends on the following factors, Plant Weather conditions plant is subjected to Water availability for the plant (stress level) Sensor heater voltage applied (not as significant) The calculated minimum value is used as Ksh value for performing sapflow calculations for the sensor until a new calibration is performed (following day or later). User can set the interval in days at which to perform auto zero, i.e. every 1-day, 3 days. User can also specify the auto zero times in the predawn time, 2AM – 6AM etc. Procedure to enter your own parameters is explained in modifying the program section of the manual. On a given day where auto zero is performed, and the value determined is not valid due to calculation errors or sensor problems, that sensor retains the most recent valid Ksh either calculated during calibration time or assigned by user in the program.
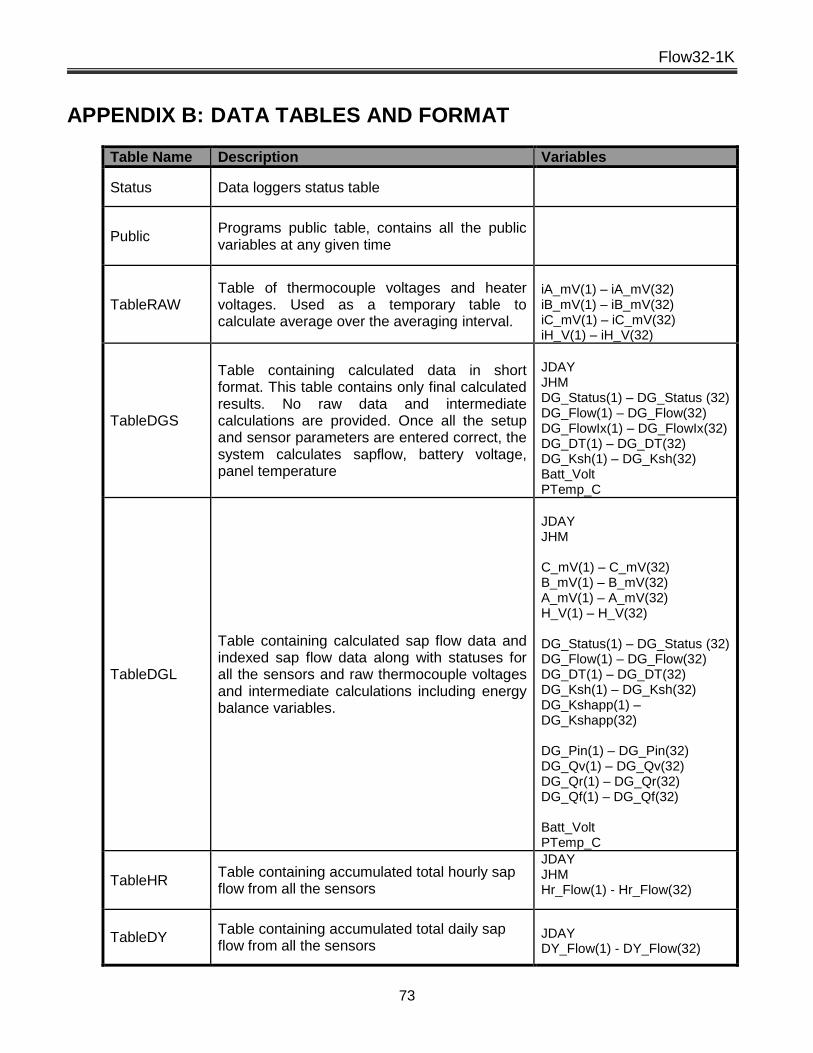
Flow32-1K
73
APPENDIX B: DATA TABLES AND FORMAT
Table Name Description Variables
Status Data loggers status table
Public Programs public table, contains all the public variables at any given time
TableRAW Table of thermocouple voltages and heater voltages. Used as a temporary table to calculate average over the averaging interval.
iA_mV(1) – iA_mV(32) iB_mV(1) – iB_mV(32) iC_mV(1) – iC_mV(32) iH_V(1) – iH_V(32)
TableDGS
Table containing calculated data in short format. This table contains only final calculated results. No raw data and intermediate calculations are provided. Once all the setup and sensor parameters are entered correct, the system calculates sapflow, battery voltage, panel temperature
JDAY JHM DG_Status(1) – DG_Status (32) DG_Flow(1) – DG_Flow(32) DG_FlowIx(1) – DG_FlowIx(32) DG_DT(1) – DG_DT(32) DG_Ksh(1) – DG_Ksh(32) Batt_Volt PTemp_C
TableDGL
Table containing calculated sap flow data and indexed sap flow data along with statuses for all the sensors and raw thermocouple voltages and intermediate calculations including energy balance variables.
JDAY JHM C_mV(1) – C_mV(32) B_mV(1) – B_mV(32) A_mV(1) – A_mV(32) H_V(1) – H_V(32) DG_Status(1) – DG_Status (32) DG_Flow(1) – DG_Flow(32) DG_DT(1) – DG_DT(32) DG_Ksh(1) – DG_Ksh(32) DG_Kshapp(1) – DG_Kshapp(32) DG_Pin(1) – DG_Pin(32) DG_Qv(1) – DG_Qv(32) DG_Qr(1) – DG_Qr(32) DG_Qf(1) – DG_Qf(32) Batt_Volt PTemp_C
TableHR Table containing accumulated total hourly sap flow from all the sensors
JDAY JHM Hr_Flow(1) - Hr_Flow(32)
TableDY Table containing accumulated total daily sap flow from all the sensors
JDAY DY_Flow(1) - DY_Flow(32)

Dynamax Inc
74
APPENDIX C: SENSOR STATUS EXPLAINED
Status# Status Description
0 OKV
Gage is connected properly, measurements are reported in the range and sap flow from this gage is reported in range. The calculated sapflow and dT data can be used for further analysis or presentation.
1 OFF OFF: Gage or gage cable is disconnected, No valid voltages from the gage.
2 WARM WARMING: Gage heater element is warming wait for warm-up time before collecting any valid data from the gages
3 FAULT FAULTED: Faulty installation of the gage or gage cable or an open channel on the Flow32 pigtails.d
4 MERR MATH ERROR resulting in an error or overflow of numerical numbers beyond the logger defined capability or a NAN report.
5 LOWF Very low sapflow, not significant to report, this can be due to stressed plant or problem in the installation or shielding or wiring of the sensor.
6 MAX MAX FLOW: dT is less than minimum value determined by the user or a default minimum value of 0.2
7 KHI KSH HIGH: Calculated Ksh (Kshapp) is higher than the initial-set value or the Ksh calculated by the system after performing Auto zero at predawn time.

Flow32-1K
75
APPENDIX D: Flow32-1K SYSTEM WIRING
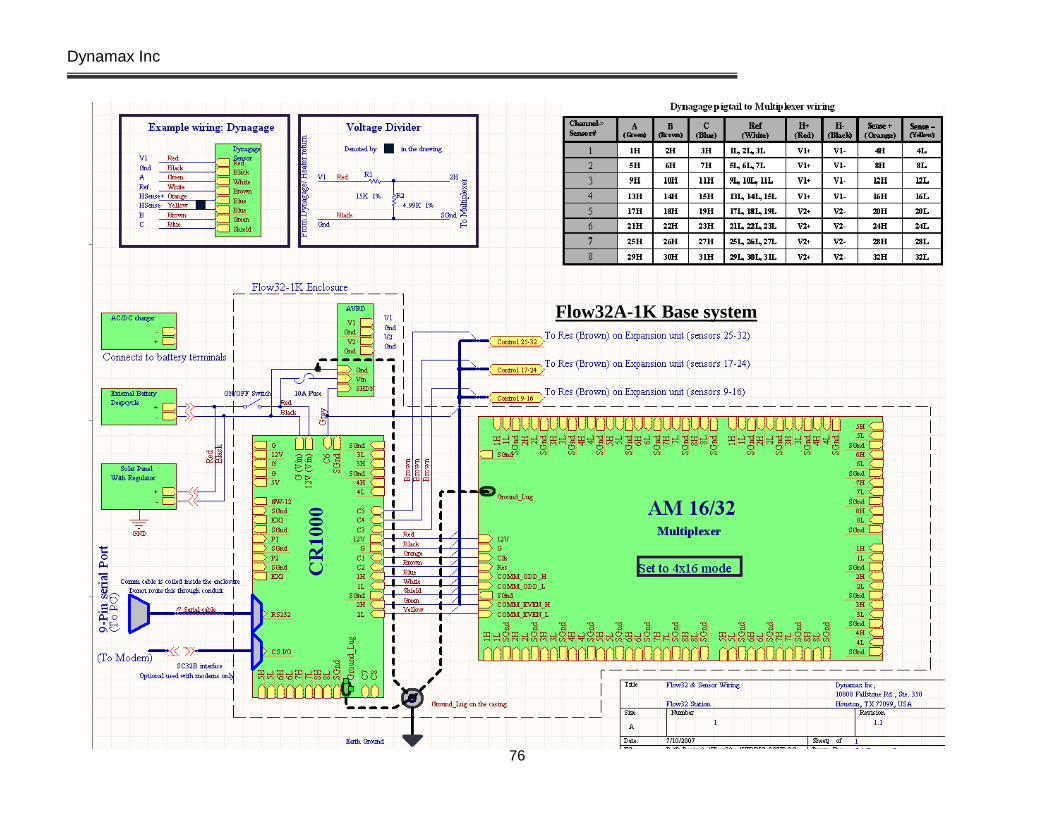
Dynamax Inc
76
Flow32A-1K Base system

Flow32-1K
77
Flow32B-1K Expansion kit

Dynamax Inc
78
1
2 3
4 5 6
7 8
9
8
54
9
7
2 3
1
6
Female
206485
Male
206486
3' Pig Tail
-- 9933 cable to 9-pin circular connector.
-- ECW with 9-pin circular connector.
F32A side.
9.5" stripped
w/voltage divider
A
B
C
E
D
H
9-pin circular
connector
1. Green
2. Brown
3. Blue
4. Red
5. Black
6. White
7. Orange
8. Drain Wire
9. Yellow
WPI Connector
A. Green
B. Brown
C. Blue
H. White
E. Black\Yellow
D. Orange\Red
EQC-25
ECW-25ft
WPI Male
Connector
Flow32
Copyright@1995
Dynamax Inc.
Sheet Size: Modify Date: Created By:
8.5 x 11 in April. 30th, 2003 John Ji
C:\0-IBM Backups\Flow32W
Dynamax Inc.
10808 Fallstone Suite 350
Houston, TX 77099File Name: FL32 PigTail -EQC-25

Flow32-1K
79
1
2 3
4 5 6
7 8
9
8
54
9
7
2 3
1
6
Female
206485Male
206486
-- 9933 cable to 9-pin circular connector.
-- with 9-pin circular connectors. (M-F)
Extension Cable
9-pin circular
connector
1. Green
2. Brown
3. Blue
4. Red
5. Black
6. White
7. Orange
8. Drain Wire
9. Yellow
Dynagage Extension Cables (M-F) Quick Connects
EXQC
Copyright@1995
Dynamax Inc.
Sheet Size: Modify Date: Created By:
8.5 x 11 in April. 30th, 2003 John Ji
C:\0-IBM Backups\Flow32W
Dynamax Inc.
10808 Fallstone Suite 350
Houston, TX 77099File Name: EXQC-25,50,75

Dynamax Inc
80
1
2 3
4 5 6
7 8
9
8
54
9
7
2 3
1
6
MEC
Female
MEC
Male
3 ft Pig Tail
A
BC
E
D
H
MEC
Connector
1. Green
2. Brown
3. Blue
4. Red
5. Black
6. White
7. Orange
8. Drain Wire
9. Yellow
DYN191
A. Green
B. Brown
C. Blue
H. White
E. Black\Yellow
D. Orange\Red
EQC-25
Modify Date:
June 17th, 2005
Dynamax Inc.
10808 Fallstone Suite 350
Houston, TX 77099
Version:V 1.01
File Name: EQC-25
\\ibmmauf \mauf-dyna\Flow32\schematics
Copyright@1995Dynamax Inc.
DYN191
(Male Connector)
25 ft Cable
Voltage Regulator
To F
low
32
Heat Shrink

Dynamax, Inc | 10808 Fallstone Rd #350 | Houston TX 77099 | USA | [email protected] | www.dynamax.com | 800-896-7108
Features
Flow32-1K™ Sap Flow System
Dynagage Respected Throughout the World
The Dynagage Flow32-1K Sap Flow system and Dynagage sensors have been servicing research plant scientists throughout the world for over 10 years. The Flow32-1K software makes working with Flow32-1K sap flow system easier than ever before with built-in algorithms for efficient and faster data analysis. Powerful functions include auto-zero and sensor status built into the data logger program. Sap flow data recalculation and automatic charting with an Excel™ Macro link makes the system a superior water relations measurement system. Sap Flow has never been this easy and powerful.
Dynagage sap flow sensors are the most accurate and reliable sensors available for measuring plant sap flow. Dynagage is now a key technique in modern water management, hydrology, crop studies, plant water relations, and biomass production.
The base Flow32A-1K system does not include gages and is configured with eight 7.6 m (25 ft) long sensor cables.
Applications
Sap flow measurements have an almost unlimited number of applications. Sap flow and transpiration rates provide commercial benefits from accurate irrigation schedules, improved irrigation set points and real crop ET coefficients. Sap flow is key data to model annual forest growth rates and conduct environmental remediation projections. After all, who can tell better than the plant how much water is consumed under varying conditions.
Real-time sap flow
Direct transpiration readings
8 months of data memory capacity for sap flow calculations
Modular and expandable system
Auto Ksh, auto zero algorithm built in
AVRD high efficiency regulator
Easy to use logger support software, PC400
4 MB Data storage memory

Dynamax, Inc | 10808 Fallstone Rd #350 | Houston TX 77099 | USA | [email protected] | www.dynamax.com | 800-896-7108
Ordering Information
Specifications
Flow32A-1K8 Gage System without Gages. Includes software and manualsDynagagesSelect Gage Sizes and QuantityPC-LOGPC400, PC support software for CR1000 loggersPC-LOGNETLoggerNet, PC support software for CR1000 loggersFlow32B-1KEight Gage expansion kitEXQC-XXExtra Cable Length XX’, available in lengths 25’, 50’, 75’, and 100’.EQC-XX/LRSpecial cable for SGA100 or SGA150MSXXXRSolar PanelCHG120, CHG220Spare 12 V Battery and Charger 120/220 V
Datalogger CR1000 logger with built-in sap flow calculatorBase Inputs 8 Differential Channels - Analog, SDI-12Channel Expansion AM16/32 Relay MultiplexerExpanded Inputs 32 Differential Channels - AnalogSensor Capacity (8) Dynagages up to (32) sensors with expansionRange & Resolution ± 2.5 mV, 0.33 µV to ± 2.5 mVVoltage Regulation AVRD Dual Voltage, 1.5 - 10 V, 5 A eachBase Memory 2 Mb
Hourly data - 1 yearDaily data - 1 yearSap flow calculation - 8 months for 8 gages
Expanded Memory 4 Mb built-in optionCommunications 9-PIN Male RS-232 Serial Cable, 15 ft (5m)Battery 7 Ahr / 12 V Sealed Lead AcidCharger 120 V AC, 6 A
220 V AC, 4.5 A Sensor Cables 8 x 7.6 m (25 ft) with ConnectorsEnclosure White fiberglass, NEMA 4X, with pole mounts, lockable,
17 x 14 x 6.5” (43 x 35 x 16 cm) System Weight 11.5 kg