Flow Near Submarine Canyons Driven by Constant Winds
25
Old Dominion University ODU Digital Commons CCPO Publications Center for Coastal Physical Oceanography 12-2000 Flow Near Submarine Canyons Driven by Constant Winds Jun She Old Dominion University John M. Klinck Old Dominion University, [email protected] Follow this and additional works at: hps://digitalcommons.odu.edu/ccpo_pubs Part of the Oceanography and Atmospheric Sciences and Meteorology Commons is Article is brought to you for free and open access by the Center for Coastal Physical Oceanography at ODU Digital Commons. It has been accepted for inclusion in CCPO Publications by an authorized administrator of ODU Digital Commons. For more information, please contact [email protected]. Repository Citation She, Jun and Klinck, John M., "Flow Near Submarine Canyons Driven by Constant Winds" (2000). CCPO Publications. 52. hps://digitalcommons.odu.edu/ccpo_pubs/52 Original Publication Citation She, J., & Klinck, J.M. (2000). Flow near submarine canyons driven by constant winds. Journal of Geophysical Research-Oceans, 105(C12), 28671-28694. doi: 10.1029/2000jc900126
Transcript of Flow Near Submarine Canyons Driven by Constant Winds

Old Dominion UniversityODU Digital Commons
CCPO Publications Center for Coastal Physical Oceanography
12-2000
Flow Near Submarine Canyons Driven byConstant WindsJun SheOld Dominion University
John M. KlinckOld Dominion University, [email protected]
Follow this and additional works at: https://digitalcommons.odu.edu/ccpo_pubs
Part of the Oceanography and Atmospheric Sciences and Meteorology Commons
This Article is brought to you for free and open access by the Center for Coastal Physical Oceanography at ODU Digital Commons. It has beenaccepted for inclusion in CCPO Publications by an authorized administrator of ODU Digital Commons. For more information, please [email protected].
Repository CitationShe, Jun and Klinck, John M., "Flow Near Submarine Canyons Driven by Constant Winds" (2000). CCPO Publications. 52.https://digitalcommons.odu.edu/ccpo_pubs/52
Original Publication CitationShe, J., & Klinck, J.M. (2000). Flow near submarine canyons driven by constant winds. Journal of Geophysical Research-Oceans,105(C12), 28671-28694. doi: 10.1029/2000jc900126

JOURNAL OF GEOPHYSICAL RESEARCH, VOL. 105, NO. C12, PAGES 28,671-28,694, DECEMBER 15, 2000
Flow near submarine canyons driven by constant winds
Jun She • and John M. Klinck
Center for Coastal Physical Oceanography, Old Dominion University, Norfolk, Virginia
Abstract. Circulation over coastal submarine canyons driven by constant upwelling or downwelling wind stress is simulated and analyzed with a primitive equation ocean model. Astoria Canyon, on the west coast of North America, is the focus of this study, and model results are consistent with most major features of mean canyon circulation observed in Astoria Canyon. Near-surface flow crosses over the canyon, while a closed cyclone occurs within the canyon. Upwelling prevails within the canyon and is larger than wind-driven upwelling along the adjacent shelf break. Water rises from depths reaching 300 m to the canyon rim and, subsequently, onto the adjacent shell Onshore flow within the canyon is driven by the onshore pressure gradient force, due to the free surface slope created by the upwelling wind, and is enhanced by the limitation to alongshore flow by the canyon topography. Density gradients largely compensate the surface slope with realistic stratification, but continual upwelling persists near the edges of the canyon. Within the upper canyon (50-150 m below the canyon rim) a cyclone is created by flow turning into the canyon mouth, separating from the upstream edge, and advecting toward the downstream rim. Below this layer the cyclone is created by vortex stretching due to the upwelling. Downwelling winds create nearly the opposite flow, in which compression and momentum advection create a strong anticyclone within the canyon. Momentum advection is found to be important both in creating strong circulation within the canyon and in allowing the surface flow to cross the canyon undisturbed. Model results indicate that Astoria-like submarine canyons produce across shore transport of sufficient volume to flush a continental shelf in a few (2-5) years.
1. Introduction
Submarine canyons incise the shelf edge along most of the world's coastline and are important passages for across shore transport of nutrient-rich dense water and sediments [Inman et al., 1976]. As a specific example of canyon-related upwelling, Freeland and Denman [1982] found a persistent pool of dense water on the shelf near Vancouver Island. Analysis of water properties indi- cated that it had come from offshore and depths of more than 400 m.
The circulation within and near canyons is com- plicated by interaction of stratified coastal flow and canyon topography. One of the best measured subma- rine canyons is Astoria, on the northwestern coast of North America [Hickey, 1997]. During northerly winds, upwelling prevails throughout the canyon, while a cy- clone is found within the canyon and sometimes up to
X Now at Danish Meteorological Institute, Copenhagen, Denmark
Copyright 2000 by the American Geophysical Union.
Paper number 2000JC900126. 0148-0227/00/2000JC900126509.00
50 m above the canyon rim [Hickey, 1997]. Water col- umn stretching was observed within the canyon with vortex compression in a 50 m thick layer above the canyon. The upper layer of water over the shelf (100 m above the rim) is little influenced by the canyon topog- raphy.
Literature on theoretical analysis and modeling stud- ies of canyon circulation is relatively sparse. Freeland and Denman [1982] proposed that the up-canyon flow was driven by the onshore geostrophic pressure gra- dient. Klinck [1988] discussed the effects of different canyon widths and suggested that a narrow canyon should be defined as one whose width is smaller than
half of the internal Rossby deformation radius. Only a narrow canyon has a strong effect on the circulation, while a wide canyon just distorts flow to be along iso- baths. With an analytical model, Klinck [1989] investi- gated the geostrophic adjustment over different canyon scales and examined the effects of canyon width on the canyon and coastal flow.
Klinck [1996] used a numerical model to simulate weakly and strongly stratified flow in both directions along the coast interacting with canyon topography. He found that the strength of stratification influences the magnitude of the topographic effect on coastal flow,
28,671

28,672 SHE AND KLINCK: FLOW NEAR CANYONS DRIVEN BY CONSTANT WINDS
while the direction of incident flow has a much stronger effect on canyon-coast flow interaction. Right bounded flow (coast is to the right looking in the direction of flow) was largely benign with water rounding the canyon but otherwise not being much affected. Left bounded flow resulted in upwelling in the canyon and considerable transport of water across the shelf break.
Allen [1996] investigated the spin-up and steady state of narrow canyon circulation with analytical and nu- merical solutions of a three-layer model. Analytical solutions were obtained for the initial circulation and
for steady state. These solutions display the deflection of the flow around the canyon in both layers over the shelf. The middle layer has considerable onshore flow over the canyon. Numerical solutions with and without momentum advection have similar flow patterns, but the steady solutions were markedly different. In par- ticular, the cyclone in the canyon was associated with nonlinear advection as the flow turns into the canyon. This study shows that the onshore flow in the canyon under upwelling forcing is up to 50 times that which occurs over the shelf break. S. E. Allen (personal com- munication, 1998) likes to say, "Canyons steal coastal upwelling."
Both of theses studies [Klinck, 1996; Allen, 1996] show some similarity to observed canyon flow. Both models show upwelling and cyclonic vorticity in part of the canyon. Below the canyon rim, alongshore flow turns into the canyon, on the upstream side by Klinck
[1996] and on the downstream side by Allen [1996]. Allen also finds that incident flow in the upper layer (to depths of 50 m) is not influenced by the canyon topography.
However, neither study included explicit wind forc- ing, and both models had simplified physics. Neither study showed the closed cyclonic streamlines in and near the canyon, nor was there upwelling over the entire canyon. Therefore neither model provides an explana- tion for a mean cyclonic circulation within the canyon.
Interaction of alongshore flow with canyon topogra- phy is time-dependent as Hickey [1997] showed in As- toria Canyon. Fluctuations of velocity, vorticity, and temperature have complicated phase relationships with each other and with the wind. None of these features
have been simulated by the above mentioned models, so the physical processes associated with these observa- tions have yet to be investigated.
This study has three purposes: (1) to demonstrate the capability of the coastal numerical model to sim- ulate circulation in a generic narrow canyon, for both steady and transient forcing; (2) to improve our under- standing of the mechanism of canyon circulation and its temporal variability; and (3) to extend observational re- sults to other canyons. Discrepancies between the pre- vious model studies and observations are considerable.
It is clearly necessary to show the ability of a model to
simulate the main observational findings before analy- sis of mechanisms and calculation of cross-shelf flux is
possible. This is our first objective. Since there are constraints both in observation and
modeling of canyon circulation, our understanding of the physics of canyon circulation is still limited. The second objective is to use the model to analyze both steady and transient processes. The major questions for steady flow include What produces the trapped cyclone within a narrow canyon; What are the roles of wind forcing, stratification, and nonlinearity; and What is the vertical excursion of water moving from the canyon onto the shelf? Transient flow situations raise addi-
tional questions How does the circulation change as the forcing changes; What is the phase relationship among vertical speed, vorticity, and temperature as the forc- ing changes; and How and over what time span do ini- tial conditions affect the circulation driven by transient winds?
Statistically significant conclusions are not easily ob- tained from observations in canyons because of the small number of realizations, the difficulty in placing instruments, and the variability of canyon bathymetry. The third purpose is to show that a model study can compliment observations. For example, vertical veloc- ity is not directly measured and must be estimated on the basis of certain assumptions (say, that horizontal temperature advection is small). It is not easy to jus- tify these assumptions with observations because of the low resolution or short time spans. Models can be used to evaluate some assumptions made in the observational analysis and to help determine if an observed feature is unique to a specific event and bathymetry or is general for similar shapes and forcing.
The above objectives are too grand for a single paper. We have limited the study to conditions (bathymetry, stratification, and forcing) related to Astoria Canyon and to times when winds are mostly upwelling favor- able, although a case with downwelling winds is added for contrast. Under these restrictions we will consider
the above objectives in two papers. This paper deals with circulation in canyons driven by steady winds, while J. M. Klinck et al. (Circulation near submarine canyons: Transient wind forcing, submitted to Journal of Geophysical Research, 2000, hereinafter referred to as Klinck et al., submitted manuscript, 2000) considers circulation driven by time variable winds. Our inten- tion is to continue this study to look at how changes in bathymetry, stratification, and forcing modify the re- sults presented here.
Section 2 presents details of the the numerical model, canyon bathymetry, parameter choices, and error analy- sis. Section 3 presents the model results for three cases. Section 4 analyzes these cases and describes the various processes. Section 5 considers the implications of these results. Section 6 gives conclusions.

SHE AND KLINCK: FLOW NEAR CANYONS DRIVEN BY CONSTANT WINDS 28,673
2. Methods
2.1. Model Description
We use version 1.0 of the Rutgers University Ocean Model (ROMS), which uses a modified terrain-following coordinate (s coordinate), which can be stretched at the top and bottom to provide higher resolution [Song and Haidvogel, 1994] to better resolve surface and bottom frictional layers.
2.1.1. Domain and canyon bathymetry. The model domain (Figure la) is 80 km in the alongshore (•) direction and 80 km in the cross-shore (y) direction. Consistent with a canyon on the west coast of North America, positive • points northward and positive y points westward (offshore). A small region surrounding the canyon (40 km alongshore and 66 km across shore) is used to display the simulation results.
The s coordinate system (Figure lb) is constructed with parameters Os = 5, Ob ---- 0.98 and Tclin e = 200. The first parameter increases the grid resolution above Tcline, while the second parameter splits the increased
resolution between the surface and the bottom, with the surface getting slightly preferential treatment.
The domain is periodic in the alongshore (x) direc- tion; the coast is a flee-slip wall, while the offshore boundary is open. At the offshore boundary all vari- ables (surface elevation, velocity, and density) are re- quired to have no across shore (y) gradient. No smooth- ing or additional dissipation is imposed at this bound- ary.
The bottom topography is constructed from a lin- early sloping continental shelf and an outer shelf and slope based on the hyperbolic tangent. The submarine canyon incises both the continental shelf and the off- shore slope (Figure la). The canyon bottom along the axis depends on the square root of the offshore distance, and the width has a Gaussian shape. The topographic parameters are chosen to be similar to Astoria Canyon [Hickey, 1997] so that the model results can be com- pared to these observations.
The shelf deepens linearly from 50 m (Hc) at coastal wall to 150 m (Hsb) at the shelf break (Ysb), which is
o
I
o
o
80
60
40
20
0
-40
I I I I I
Model Bathymetry
t 600 --
i 7 + •o•
1-•- --2
800 --
200 --
-20 0 20 40
Alongshore distance (km) Figure 1. Model Domain, canyon bathymetry, and vertical grid. (a) The solid lines are isobaths with an interval of 100 m. Pluses indicate station locations at which time series of model values are obtained. The dashed line encloses a subregion for which results are displayed. (b) This cross section is along the canyon axis, showing the location of vertical velocity points. Vertical lines are shown at every other grid location. Sloping lines indicate every s coordinate surface.

28,674 SHE AND KLINCK: FLOW NEAR CANYONS DRIVEN BY CONSTANT WINDS
200
4OO
600
8OO
1000
25 50 75
Across-shore distance (km)
Figure 1. (continued)
30 km offshore. The offshore ocean is 1000 m deep
(Hot), the approximate water depth at the mouth of Astoria Canyon. A canyon is created with a maxi- mum depth (distance from free surface to bottom at the mouth, dcan) of 600 m. Away from the canyon, the continental shelf depth is
Hs(y) - Hc - (Hsb - H•) min(y/ysb, 1)
Ho• - Hs• 1 + tanh( y Ls• 4- 2 ' where y• - 50 km is the location of the middle of the
slope and Ls•(= 5 kin) is the half-width of the slope. Coastal canyons tend to be triangular in shape so the
width (W(y)) for the canyon increases offshore, Y
W(y) - W•(0.5 + •), where the canyon width scale (Wc) is 2 km. The depth of the canyon along the axis relative to the surrounding shelf is
Hcan(y)-max(0-Hs(y)4-dcan• y- yc ) " Ys• -- Yc '
where y•(= 15 km) is the location of the head of the canyon. The complete bottom topography is created from these functions as
X -- Xc
H(x,y) - Hs(y) + Hcan(Y) exp - 2W(y) ' where Xc(- 0) is the location of the axis of the canyon (Figure la).
Topographic slopes in Astoria Canyon are as large as 45%, which would cause problems with terrain follow- ing vertical coordinates (details below). To reduce the topographic slopes the bottom of the canyon is rounded compared to Astoria. The model canyon is also wider (14 kin) than Astoria (10 kin). The steepest slope in the model is 8.5%. The model canyon remains narrow since the canyon mouth is about equal to the internal radius of deformation [Klinck, 1988] (details below).
The model canyon bathymetry is different from Asto- ria in other, potentially important, ways. The distance from the coast to the shelf break decreases to the north
near Astoria, and the axis of the canyon is not normal to the shelf break; the head of Astoria is a little north of the mouth. These two features cause the northern
side of Astoria to look wedge-shaped. For the present study we choose a straight shelf break with the canyon oriented normal to shelf isobaths. We defer to a later
study the importance of these variations in the shape of the canyon. However, it is useful to keep in mind the

SHE AND KLINCK: FLOW NEAR CANYONS DRIVEN BY CONSTANT WINDS 28,675
bathymetric differences between the model and Astoria Canyons as we compare results.
2.1.2. Parameter specifications. Model vari- ables are the three components of flow, density, and surface height. The temperature array in the model is used to hold density, and the specification of a linear equation of state with a thermal expansion coefficient of 1.0 makes the temperature and density equivalent. Salinity is not active in these simulations. The model has a 0.5 km horizontal grid spacing (distance between like variables) and 16 vertical layers. The Coriolis pa- rameter is assumed constant (f - 1.13 x 10 -4 s-1). Vertical viscosity and diffusivity are determined by the parameterization presented by Large et al. [1994] which includes effects due to shear instability and density con- vection. The model allows viscosity and diffusivity to be as small as 10 -4 and 10 -5 m 2 s -1 , respectively, with largest values of 5 x 10 -3 m 2 s -• for both. The critical Richardson number is 0.7. Density inversions produce viscosity and diffusivity of 10 -2 m 2 s -•. Horizontal Laplacian diffusivity is weak (10 m 2 s -i for velocity and 5 m 2 s -1 for temperature). To avoid resolving the sur- face Ekman layer, the wind stress is applied as a body force over the top three layers (depth ranges from 9 m at the coast to 43 m at the offshore boundary). Bottom friction is parameterized with a quadratic bulk formula with a coefficient of 3 x 10 -3. For all the cases the time
step is 2.4 and 60 s for the fast and slow dynamics, respectively.
The initial density field, a functional fit to observa- tions near Astoria [Hickey, 1997], is horizontally homo- geneous;
z
rr(z,t- 0) -- 27.34- 4.5 exp 11•' where z is the depth in meters. The first internal mode from this stratification has a radius of deformation of
12.7 km. A weaker stratification, with one quarter of this strength, is used in one simulation, producing a radius of deformation of 6.4 km. The canyon is not necessarily narrow for the weaker stratification.
2.2. Model Error Considerations
Two sources of error in the numerical model are
of particular concern: steep topography with terrain- following coordinates and periodic continuation in the alongshore direction. Before embarking on the simula- tion study it is necessary to quantify these errors and their time variation. These issues have been stressed
in previous studies [e.g., Haney, 1991; Beckmann and Haidvogel, 1993; Mellor et al., 1994; Klinck, 1996] for different applications.
Generally, all terrain-following models have trouble in the presence of steep bathymetry, mainly because of the error in calculating the horizontal pressure gradient with a discrete numerical scheme [Haney, 1991; Mellor et al., 1994]. ROMS uses some efficient methods to re-
duce the error, such as removing a reference density and using a fourth-order difference scheme in the pressure gradient calculation.
We have run the model as described above with ini-
tially level isopycnals but without wind forcing. The resulting flow should remain zero, but errors in the pressure gradient calculation produce maximum speeds after 5 days of 0.0074 m s -• at 300 m depth. Maxi- mum error flows at other depths range from 0.0077 to 0.0042 m s -•. The horizontal average of error flows at various depths ranges from 0.0002 to 0.0008 m s -•, which are at most 1.6-2.5% of the wind-driven flows de-
scribed in this paper. These errors are small enough not to affect these model results. Furthermore, the wind- forced signals are very clear, especially in the transient wind forcing case (Klinck et al. submitted manuscript, 2000), so these small errors do not mask the circulation that we are analyzing.
With periodic alongshore boundary conditions, dis- turbances that should radiate from the canyon reap- pear upstream, contaminating the results. These dis- turbances are due to surface and internal gravity waves, coastal trapped waves, and advection. The surface gravity wave is very fast but is generally small in am- plitude. The first-mode internal waves travel at 0.6-
1.3 m s -1 (for depths of 900 and 150 m, respectively) but also tend to be somewhat small in amplitude. The effects of coastal trapped waves, because of the slow propagation speed, are small in the first 10-15 model days. These vorticity waves travel at 0.2-0.3 m s -•, taking 6-10 days to circle the domain. Furthermore, the alongshore current driven by upwelling winds is oppo- site to the shelf wave propagation so the contamination is delayed. Simulations show that dynamic instabili- ties (similar to those described by Barth [1989, 1994]) occur in the model after 3 weeks of steady forcing, so we limit the analysis to the first 15 days of simulation. Finally, ongoing simulations with open boundary con- ditions (details not given) show that contamination by waves in the periodic environment is, for the most part, small although some important differences do occur in the deeper flow (M. S. Dinniman and J. M. Klinck, manuscript in preparation, 2000).
2.3. Cases
Three cases are described in this paper, representing wind-driven flow over a continental shelf with a sub-
marine canyon. Upwelling winds near Astoria Canyon [Hickey, 1997] have peak speeds near 10 m s -• (stress is about 0.1 N m-2), but typical winds are weaker, with a stress of 0.05 N m -2. The first case uses typical Astoria stratification and is forced by winds (0.05 N m-2). Stronger upwelling winds (0.1 N m -2) drive similar flow with somewhat higher amplitudes (re- sults not shown). The second case is forced by upwelling winds (0.05 N m -2) but with stratification reduced by a factor of 4. Finally, a third case has Astoria stratifi-

28,676 SHE AND KLINCK' FLOW NEAR CANYONS DRIVEN BY CONSTANT WINDS
cation with moderate (0.05 N m -2) downwelling winds, just to see the difference in behavior. All of these cases were run for 20 days or longer but only the first 15 days of the simulations are described here.
3. Results
The first case, with Astoria stratification and up- welling winds, is used as the standard scenario; the steady features are compared to observations to show close comparison of the numerical results to the ob- served flow. Simulations are analyzed at three levels (50, 150, and 300 m) representing the water over the shelf, near the canyon rim, and within the canyon, re- spectively. Vertical sections of density across the shelf display the vertical and horizontal structure. Time his- tories of flow and integrated transport are used as diag- nostics. Results from the other cases are compared to the standard scenario.
Despite the steady forcing the model does not set- tle into a true steady state. A relatively rapid adjust- ment occurs in the first 5 days as the upwelling winds
modify the upper water column and establish a conven- tional upwelling front. However, upwelling within the canyon continues throughout the simulation, so there is slow, continuous change. After about 20 days the frontal flow over the shelf develops meanders that be- come unstable, creating large eddies. This issue is re- solved by the fact that winds over continental shelves are not steady but vary in strength. Simulations with time variable winds, discussed by Klinck et al. (submit- ted manuscript, 2000), do not develop large-amplitude eddies. Time variability plays another role by clouding, to some extent, the comparison of the steady forced model results with observations that are affected by variable forcing. We will see that the response of the model, and by implication, the continental shelf flow, is rather rapid so both systems are largely in equilibrium with the slowly varying surface forcing.
3.1. Reminder of Astoria Observations
Observations reveal three features that need to be
represented in any realistic simulation. First, canyon to-
6O
5O
• 40
• 30
20
lO
6O
5O
• 40
• 30
2o
lO
•600 600!
150m, Day 12 10 cm/s
Figure 2. Horizontal velocity vectors at selected depths at model day 12 for upwelling winds over Astoria stratification: (a) at a depth of 50 m, (b) at a depth of 150 m, and (c) at a depth of 300 m. Vectors are shown at every other model grid point, only in the vicinity of the canyon. Solid lines are isobaths with an interval of 100 m.
-2o o 2o -2o o 2o
Alongshore distance (km) Alongshore distance (km)

SHE AND KLINCK: FLOW NEAR CANYONS DRIVEN BY CONSTANT WINDS 28,677
50
30
20
_
• 200 -
lO
300m, Day 12 5 cm/s 0
""'""1''"'""1'""'''"1'''''''"
-20 -10 0 10 20
Alongshore distance (km)
Figure 2. (continued)
pography has little influence on upper layer flow across a canyon [Hunkins, 1988; Hickey, 1997]. Second, the time mean (over several weeks) circulation within As- toria Canyon driven by upwelling winds is an appar- ently trapped cyclonic eddy [Hickey, 1997]. Third, dur- ing times of weak incident flow (i.e., Rossby number < 0.25), cyclonic circulation penetrates vertically a dis- tance 40-100 m above the canyon.
Observations [Hickey, 1997] reveal patterns in iso- therm depths that can be compared directly with model results. The stratification over the shelf near Asto-
ria Canyon has a strong thermocline at about 100 m. At times of maximum upwelling winds, isotherms near and above the canyon rim tilt upward on the down- stream side and downward on the upstream side of the canyon. Below the canyon rim the isotherm tilt is op- posite [Hickey, 1997, Figure 18]. Distances between isotherms deep in the canyon are larger during upwelling winds.
3.2. Upwelling Winds With Astoria Stratification
3.2.1. Horizontal structures. Model circulation
from the first case (upwelling wind forcing with Asto- ria stratification) is considered at three levels (Figure
2) at model day 12 in the vicinity of the canyon. The fundamentally three-dimensional nature of the flow is evident in the differences in circulation pattern at the different levels. At 50 m the flow (Figure 2a) is south- ward along the shelf driven by the northerly winds. A strong jet (0.3-0.4 m s -1) occurs between 10 and 20 km offshore, which is associated with the upwelling front. A second, weaker (0.1 m s -•) jet occurs along the up- per slope (about 45 km offshore). Away from these jets, the alongshore flow is 0.05-0.1 m s -•. The circula- tion at this level does not react strongly to the canyon bathymetry; it turns slightly onshore over and upstream of the canyon and turns offshore downstream of the canyon. The free surface (figure not shown) slope is consistent with a geostrophic balance of flow near the surface and does not react to the canyon. The near- surface circulation shows little evidence of upwelling at the head of the canyon.
Just below the canyon rim (150 m), water flows gener- ally alongshore (0.1-0.2 m s -•) except near the canyon (Figure 2b). Onshore flow occurs between the center and the downstream rim of the canyon. Weak onshore flow occurs at the upstream offshore edge of the canyon but most of the flow along the upstream rim is offshore. A strong closed cyclone is evident in the canyon with the center of circulation shifted upstream of the canyon axis.
At 300 m depth the flow (Figure 2c) outside of the canyon is along the slope (0.05 m s-•), with some de- flection near the canyon entrance. Within the canyon the flow follows isobaths but does cross isobaths along the downstream side of the canyon. This circulation nearly fills the canyon, extending from the head to very near the mouth. Onshore flow is stronger than offshore, resulting in upwelling.
3.2.2. Vertical sections. The density change from initial conditions along the canyon axis (Figure 3a) after 12 days shows upwelling clearly, with the strongest density increase in the middle and inner shelf where an upwelling front has separated from the coast. Such development is consistent with simulations by Allen et al. [1995] among others. A large density change oc- curs near the bottom over the shelf and into the up- per canyon (100-200 m depth). Weaker upwelling oc- curs over the shelf break upstream of the canyon (Fig- ure 3b), where upwelling is confined to a bottom fric- tional layer and the vertical excursion of the water is smaller (smaller density change of the upwelled water).
The alongshore structure of the density change (35 km offshore) after 12 days (Figure 3c) reveals an upward motion of all isopycnals, with the largest change around 150 m depth. Dense water appears at both edges of the canyon, with denser water on the upstream (north) side. However, isopycnals are lifted higher on the south side, as shown in the schematic by Hickey [1997, Figure 18]. The strong effect of the canyon is seen by comparing the thin layer of increased density upstream of the canyon to that over the canyon.

28,678 SHE AND KLINCK: FLOW NEAR CANYONS DRIVEN BY CONSTANT WINDS
100
200
300 density change p(za) - p(oa)
500
0 10 20 30 40 50
Across-shore distance (km) 6O
Figure 3. Density change from initial conditions for upwelling winds over Astoria stratification at model day 12: (a) section along canyon axis, (b) section across the shelf 17 km upstream of canyon, and (c) section along the shelf 35 km from the coastal wall. Positive (negative) change is indicated by solid (dashed) contours. The contour interval is 0.1a. The shading indicates bottom topography. The view is from the coast looking offshore.
The above results are consistent with the mean con-
ditions derived from canyon observations [Hickey, 1997] with one exception. The model does not develop a closed cyclonic circulation above the canyon rim, a fea- ture observed over Astoria Canyon when the flow is weak. The Rossby number for this flow is 0.1-0.2, which is in the proper range to develop the cyclone above the canyon.
3.2.3. Time development. The previous analy- sis assumes that the circulation is steady after about a week, but it continues to change under the influence of steady surface wind stress. Three processes pre- vent a steady state: wraparound flow due to periodic boundaries, canyon upwelling driven by alongshore flow, and continual offshore migration of the upwelling front, which develops meanders.
Initial circulation in the model undergoes a rapid adjustment to the steady surface forcing, which lasts about a week. After this time the circulation changes at a slower rate until about 3 weeks, when the frontal instability develops. The details of this time develop-
ment are displayed as time and depth plots at a point (Figure 4). Similar behavior occurs at other points.
Alongshore and across shore speed at a point in the center of the canyon about 35 km from the coastal wall (station 5 on Figure la) illustrate the time behavior. The alongshore flow (Figure 4a) above the depth of the surrounding shelf (about 150 m) accelerates over about 5 days to speeds of about 0.1 m s -1. There is little vertical shear down to 100 m; the alongshore flow slows significantly in the top 50 m of the canyon, coming to zero at around 175 m. By day 12 the near-surface flow is above 0.15 m s -i, and a clear vertical shear has de- veloped. The velocity shear in the upper canyon has strengthened to the point where the alongshore flow stops over a thickness of about 50 m. The flow at 200 m is opposite to the wind, indicating the development and strengthening of a cyclone (after day 6). Deep within the canyon (below 275 m), water again moves in the di- rection of the wind, consistent with a deep, anticyclonic swirl.
The across shore flow at station 5 (Figure 4b) is off-

SHE AND KLINCK: FLOW NEAR CANYONS DRIVEN BY CONSTANT WINDS
• .... • • • I • I U OO -• •
1oo
28,679
2OO
300 density change
- ,o(Od)
4OO
500
IO0
2OO
3OO
400 :::':. ß
ß
10 20 30 40 50 60 Across-shore distance (km)
I I : •!• .-•;,•4• ; i I I I !•J:OL • ! -- :---
i ••- . - •- 0.00 • -
_
..
ß
.). .:
500" ... ß
-•0 -10 0 10
Alongshore distance (km)
Figure 3. (continued)
2O

28,680 SHE AND KLINCK: FLOW NEAR CANYONS DRIVEN BY CONSTANT WINDS
lOO
200
3OO
4OO
5OO Alongshore
0 5 10 15
Time (Days)
Figure 4. Vertical and time behavior of flow at station 5 for upwelling winds over Astoria stratification: (a) alongshore speed (cm s -1), with a contour interval of 2 cm s -i, and (b) across- shore speed (cm s -1) with a contour interval of I cm s -1. Positive (negative) speed is indicated by solid (dashed) contours.
shore above 30 m throughout the simulation consistent with the offshore Ekman flux. Compensating onshore flow develops down to 300 m, with the strongest on- shore speed near the top of the canyon (150 m), which strengthens throughout the simulation. Offshore flow below 250 m increases because of stronger swirl flow with an outgoing branch that widens. In summary, the shelf flow above the canyon changes slowly after the ini- tial startup, but the flow into the canyon continues to strengthen throughout the simulation.
A final description of the circulation is obtained from integrated transport calculated across two planes de- fined by the top of the canyon (150 m depth) and the extension of the shelf break across the canyon (40 km offshore of the coastal wall), which is referred to here as the mouth of the canyon. Each of these planes is divided into four sections by the axis of the canyon and by either 150 m or by the extension of the shelf break (40 km offshore).
The horizontal transport across the shelf break at the canyon mouth (Figure 5a) is calculated over four subar- eas (labeled north or south and upper or lower). Above
the shelf break the transport is in opposite directions with onshore flow on the upstream side of the canyon (Nu, dotted line) and offshore flow downstream (Su, solid line). Onshore flow is almost always larger than offshore, indicating net onshore flow. The deep trans- port across the canyon mouth is more time variable. The upstream transport (N1, dash-dotted line) is on- shore for the first week but slows to zero after day 10. The downstream transport (S1, dashed line) is small but variable for the first week after which it becomes strongly onshore. This time behavior indicates the ini- tial onshore flow on the north side of the axis and the eventual development of the cyclone, which shifts the onshore flow to the south side of the canyon.
The vertical transport over four subareas (labeled north or south and inner or outer) across the top of the canyon (150 m) quantifies the time behavior of ex- changes (Figure 5b). Upwelling occurs over the canyon throughout the simulation with the downstream up- welling (Si, solid line) being larger and increasing con- tinuously, while the upstream upwelling (Ni, dotted line) develops over a week and then reverses to down-

SHE AND KLINCK' FLOW NEAR CANYONS DRIVEN BY CONSTANT WINDS
b
100 •-
200 -
_
_
_
_
_
_
300 - _
_
_
_
_
_
_
400 - _
_
_
_
_
_
_
500 -
0
Across-shore i i i i
10 15
Time (Days) Figure 3. (continued)
28,681
welling over the remainder of the simulation. The ver- tical transport offshore of the canyon mouth is affected by the deep topography of the canyon but has opposite signs with upwelling on the upstream side (No, dash- dotted line) and downwelling on the downstream side (So, dashed line) after the initial spin-up. Nevertheless, the upwelling is always larger than the downwelling even offshore of the canyon mouth.
Onshore transport is also calculated at the offshore wall of the model to see the effect of the ocean boundary condition (figures not shown). The transport was cal- culated over four subareas created by the canyon axis and 150 m. The upper transports are both offshore and constant with magnitudes of 3-4 mSv (1 mSv - 1000 m 3 s -•) until about day 15. The deep transports are both onshore and increase throughout the simulation with values of 5-6 mSv at day 15. Even relatively far offshore, the canyon distorts the alongshore flow, cre- ating a net onshore flow in the deeper layers needed to balance the water that is upwelled through the canyon. It is not that water from far offshore upwells in the canyon but rather that water at depth along the slope is replaced by a general onshore flow, which pulls wa- ter through the offshore boundary. Considerable flow
distortion would occur if the offshore boundary were a solid wall.
3.3. Reduced Stratification With Upwelling Winds
The importance of stratification is considered by re- ducing the initial stratification to one quarter of that from Astoria, thus reducing the internal radius of de- formation by half (6.4 kin). The simulation is forced by steady upwelling winds (0.05 N m-2).
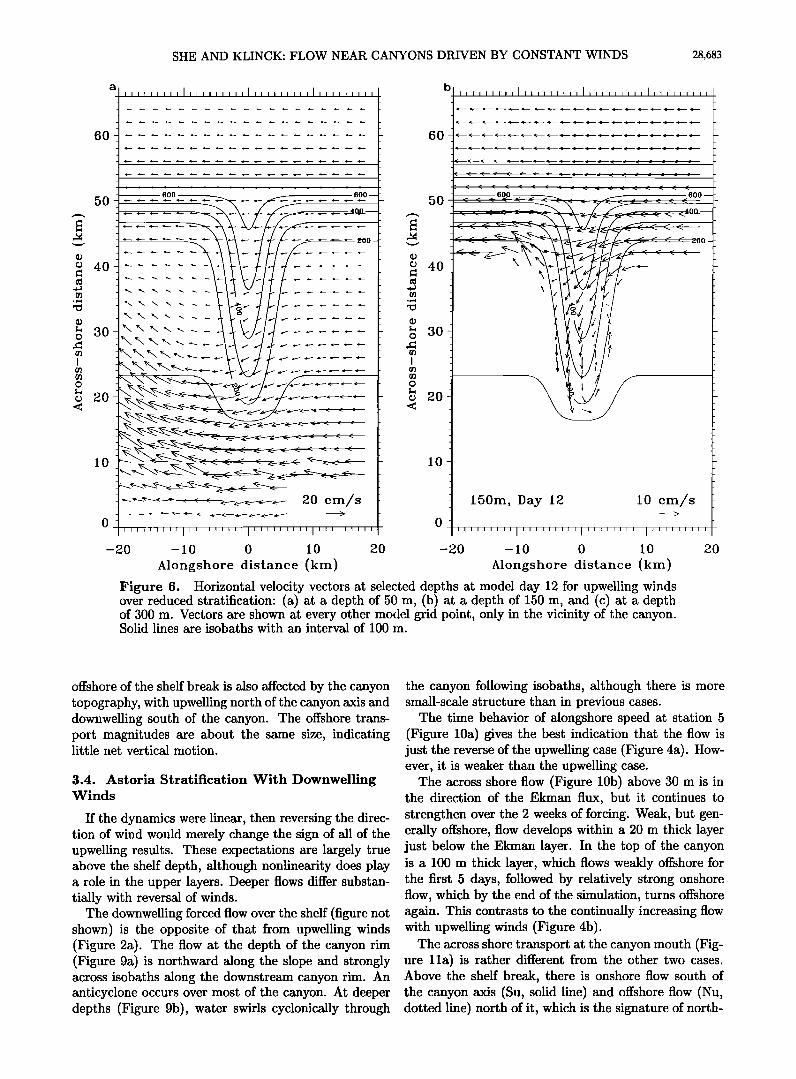
Bottom topography has a stronger effect on the near- surface flow after 12 days of forcing (Figure 6a) where there is clear onshore turning of the flow upstream of the canyon, onshore flow over the canyon, and an off- shore turning downstream of the canyon. Note that even flow in the upwelling jet along the coast turns off- shore downstream of the canyon. Just below the canyon rim (Figure 6b) the flow is everywhere into the canyon. Offshore flow develops in the inner canyon along the upstream rim, indicating the development of a cyclone. The deeper flow (Figure 6c) is onshore over most of the canyon with a weak offshore flow along the downstream rim. The flow along the continental slope is largely un- affected by the canyon at these three depths.

28,682 SHE AND KLINCK: FLOW NEAR CANYONS DRIVEN BY CONSTANT WINDS
40
20
-20
-40
30
20
10
-10
-20
. [ [ , , , ! [ [ , , , [ ! ,
- Horizontal Transport _-
%''%' •' •. ,.• .... ---- - .... .--• -'% '• "• •'•'.'•-..... • •' N1 - - • • _ •. •-.... .• .... _ •: • • •-•-.-• .... :•-• ........... -•- •. •. •- -• ................................
_
_
6 8 l0 l• 14
Time (day)
i i ' , ' i _
Vertical Transport
_
..... . .... _.
_-:_ So _
--
- _ _
_
I I I I I I , ._t._ • I , --
0 • 4 6 8 10 1• 14
Time (day)
Figure 5. Time series of transport for upwelling winds over Astoria stratification. The units are 1000 m 3 s-1: (a) across shore transport at the canyon mouth (40 km from the coast) over four planes created by 150 m depth and the canyon axis, and (b) vertical transport across the top of the canyon (150 m) over four planes created by the extension of the shelf break and the axis of the canyon. The symbols are N, north; S, south; i, inner; o, outer; u, upper; and l, lower.
Upwelling at the head of the canyon is evident from the density difference at 12 days relative to the initial density (figure not shown), which looks very much like Figure 3a but with reduced values. The depth of max- imum density change remains near 200 m. The density change in a section across the canyon looks like Fig- ure 3c with smaller values. The density change contours tilt more strongly in this case, with the 0.1 change con- tour tilting by 50 m across the width of the canyon with reduced stratification while the 0.2 contour in Figure 3c has very little tilt. The weaker stratification allows a stronger lifting of the isopycnals.
The reduced vertical shear in the horizontal velocity is evident in the time series of flow over depth at station 5 in the head of the canyon (Figure 7). The alongshore speed becomes relatively steady after about 7 days (Fig- ure 7a). There is a very weak reversal after 10 days of forcing. The across shore speed is everywhere onshore, except in the surface Ekman layer (Figure 7b). After 7 days of forcing the flow is relatively steady. The speed and vertical shear are smaller than in the more strongly stratified simulation (Figure 4).
The across shore transports at the mouth of the canyon (Figure 8a) are similar to those obtained for the stronger stratification. The transports adjust rapidly over the first week, with the upper transports reducing somewhat over the next week. The deeper transports continue to change over the span of the simulation, with net onshore flow after 10 days. The strengthening deep onshore flow on the downstream side of the canyon (S1, dashed line) relative to that along the upstream side (N1, dash-dotted line) indicates the downstream shift of the up-canyon flow and the development of the canyon cyclone. Finally, there is more onshore than offshore transport at each level, which provides water to upwell through the canyon (Figure 8b).
The vertical transport through the four sections (Fig- ure 8b) at 150 m is similar to that ibr the stronger stratification. In this case the inner transports become approximately steady after 6 days or so. Furthermore, the upwelling is stronger on the upstream side of the canyon (Ni, dotted line) compared to the downstream side (Si, solid line), which is opposite to that seen in the simulation with stronger stratification. The region
SHE AND KLINCK: FLOW NEAR CANYONS DRIVEN BY CONSTANT WINDS 28,683
5O
•o
•o
20 c /s 0 I'''''''''l'''''''''l ..... '"'1'' ....... -20 -10 0 10 20
Alongshore distance (km)
60-
5O
30
•0
10
-2O
[tllllililllflllffflillllllllliilllllll
150m, Day 12 10 cm/s >
-10 0 10 20
Alongshore distance (km)
Figure 6. Horizontal velocity vectors at selected depths at model day 12 for upwelling winds over reduced stratification: (a) at a depth of 50 m, (b) at a depth of 150 m, and (c) at a depth of 300 m. Vectors are shown at every other model grid point, only in the vicinity of the canyon. Solid lines are isobaths with an interval of 100 •n.
offshore of the shelf break is also affected by the canyon topography, with upwelling north of the canyon axis and downwelling south of the canyon. The offshore trans- port magnitudes are about the same size, indicating little net vertical motion.
3.4. Astoria Stratification With Downwelling Winds
If the dynamics were linear, then reversing the direc- tion of wind would merely change the sign of all of the upwelling results. These expectations are largely true above the shelf depth, although nonlinearity does play a role in the upper layers. Deeper flows differ substan- tially with reversal of winds.
The downwelling forced flow over the shelf (figure not shown) is the opposite of that from upwelling winds (Figure 2a). The flow at the depth of the canyon rim (Figure 9a) is northward along the slope and strongly across isobaths along the downstream canyon rim. An anticyclone occurs over most of the canyon. At deeper depths (Figure 9b), water swirls cyclonically through
the canyon following isobaths, although there is more small-scale structure than in previous cases.
The time behavior of alongshore speed at station 5 (Figure 10a) gives the best indication that the flow is just the reverse of the upwelling case (Figure 4a). How- ever, it is weaker than the upwelling case.
The across shore flow (Figure 10b) above 30 m is in the direction of the Ekman flux, but it continues to strengthen over the 2 weeks of forcing. Weak, but gen- erally offshore, flow develops within a 20 m thick layer just below the Ekman layer. In the top of the canyon is a 100 m thick layer, which flows weakly offshore for the first 5 days, followed by relatively strong onshore flow, which by the end of the simulation, turns offshore again. This contrasts to the continually increasing flow with upwelling winds (Figure 4b).
The across shore transport at the canyon mouth (Fig- ure 11a) is rather different from the other two cases. Above the shelf break, there is onshore flow south of the canyon axis (Su, solid line) and offshore flow (Nu, dotted line) north of it, which is the signature of north-

28,684 SHE AND KLINCK: FLOW NEAR CANYONS DRIVEN BY CONSTANT WINDS
60
50
30
20
10
-20
i
200 -
300m, Day 12 5 cm/s
-lO o lO 20
Alongshore distance (km)
Figure 6. (continued)
ward flow across the mouth of the canyon that dips into the canyon mouth. The onshore transport (Su) is larger than the offshore (Nu) as required for net downwelling •a v •:;/ •//• •,c•J.J.•V •jj.j..
The deep transports (Figure 11a) are largely oppo- site, with a direction change around 7 days. There is a net offshore deep transport in the first few days, as the downwelling winds depress the isopycnals in the canyon. Around 7 days, the transports switch sign with the development of an anticyclone in the canyon. The strength of the deep transports decline over the second week of the simulation.
The vertical transport through the four areas at the top of the canyon (Figure 11b) is downward over the canyon (Ni, dotted line, and Si, solid line) as well as off- shore of the canyon on the north side (No, dash-dotted line). Upwelling occurs offshore south of the canyon axis (So, dashed line). Offshore, upwelling on one side of the canyon axis is stronger than downwelling on the other side. Downwelling occurs over the whole canyon and is stronger over the upstream rim (Si compared to Ni).
4. Discussion
4.1. Circulation Forced by Upwelling Winds
The three-dimensional canyon circulation driven by constant upwelling favorable wind forcing has the fol- lowing general structure. Above 100 m, there is only small influence of canyon topography with onshore flow over and upstream of the canyon (Figure 2a) and off- shore downstream of the canyon. An upwelling front develops near the coast and is closer to the coast up- stream of the canyon and more offshore downstream as the shelf flow turns offshore (anticyclonic) downstream of the canyon. Near the canyon rim (100-200 m), flow is onshore (Figure 2b) within the canyon, particularly along the downstream (southern) rim. The deep flow largely follows isobaths (Figure 2c) with some trans- port imbalance that produces upwelling that extends to 300 m depth.
These results are consistent with previous observa- tions, except for the closed cyclone above the canyon. We can deduce mechanisms driving canyon circulation from these simulations in response to several questions. How does the wind drive up-canyon flow and ultimately upwelling of water onto the shelf? What is the cause of the cyclonic circulation trapped within the canyon? What is the role of momentum advection in canyon cir- culation? What are the timescales over which these
patterns of circulation develop? 4.1.1. Dynamics of canyon circulation. The
answer to the first question lies in the traditional ex- planation of up-canyon flow, where the key point is the across shore pressure gradient and the narrow steep canyon topography, which inhibits alongshore flow. The canyon topography breaks the geostrophic constraint, allowing across shore flow. Upwelling wind stress cre- ates a geostrophicaily balanced alongshore flow, which is supported by an onshore pressure gradient over the ,.,.-,.d-: ......d-_l ,.1 :_ T'• .... _' .... :1__ f'•___• _ _1
elibile tU•tbb•ti UUIIIELIII. UUI'1II• tile IlI'S13 Week this pres- sure gradient drives water into the canyon, creating up- welling. At the head of the canyon, water in all layers is lifted; some water is lifted out of the canyon and de- posited on the shelf. There is flow across isobaths along whole rim of the canyon and not just at the head (Fig- ure 2b). Deep upwelling exists within the canyon on the upstream edge (Figure 2c), even though this water never reaches the shelf.
Over time, upwelling tilts the isopycnals largely com- pensating the surface pressure gradient (Figure 12a) over the top of the canyon. There remains an unbal- anced onshore pressure gradient force over the inner canyon except at the head (Figure 12b), which continu- ally drives water into the canyon (Figure 2b). A positive residual offshore force develops along the outer canyon to oppose flow into the canyon and to drive water off- shore.
Model results indicate that wind-forced coastal up-

a
100 - _
_
_
_
_
_
L
_
200
_
_
_
_
_
300 • _
_
_
_
_
400
oof
I '1 ,j , j l
Alongshore
' I
Time (Days)
lOO
200
3OO
4OO
500
0 5 10 15 Time (Days)
Figure 7. Vertical and time behavior of flow at station 5 for upwelling winds over reduced stratification: (a) alongshore speed (cm s-•), with a contour interval of I cm s -•, and (b) across shore speed (cm s -•), with a contour interval of I cm s -•. Positive (negative) speed is indicated by solid (dashed) contours.
28,685

28,686 SHE AND KLINCK: FLOW NEAR CANYONS DRIVEN BY CONSTANT WINDS
40
20
-20
-4O
0
30
20
10
-10
-20
i i , , , J i i i , , ,
_ _
- $u -
'- '•'•.. • N1 -
'%. '-.. / / • • • - / ..................
.......... •;•' Nu ........................ _
_
, , , I , , , I • - • ..... • -•/ • • • • [ • , • [ ,
2 4 6 8 10 12 14
Time (day)
i i i i i i _
Vertical Transport : _
N i S• _•_•.--------'"'• .................. • • -..-..:_ .....
So
0 2 4 6 8 10 12 14
Time (day) Figure 8. Time series of transport for upwelling winds over reduced stratification. The units are 1000 m 3 s-1: (a) across shore transport at the canyon mouth (40 km from the coast) over four planes created by 150 m depth and the canyon axis, and (b) vertical transport across the top of the canyon (150 m) over four planes created by the extension of the shelf break and the axis of the canyon. The symbols are N, north; S, south; i, inner; o, outer; u, upper; and l, lower.
welling is much weaker away from the canyon than over it. The former produces density changes at the shelf break of 0.1a (Figure 3b), while the latter produces changes at the head of the canyon about 0.5a that ex- tend over a greater thickness of water (Figure 3a). The enhanced vertical motion within the canyon is due to onshore flow, which is due to the narrow canyon.
4.1.2. Cause of the canyon cyclone. There are two sources of cyclonic vorticity in the canyon, which play a role in the development of the cyclone (Fig- ure 2b). First is the cyclonic turning of the flow into the canyon, the strength and location of which depends on the flow speed and the details of the bathymetry at the canyon entrance. The circulation considered here is sufficiently strong for momentum advection to cause separation at the upstream corner, pushing the onshore flow closer to the downstream rim. The second source is stretching of planetary vorticity by the vertical mo- tion within the canyon. The water below the maximum density change (Figure 3a) is the region of stretching, while vortex compression occurs above the maximum.
The cyclonic vorticity in the model is comparable to that observed [Hickey, 1997]. The swirl speed in the cy- clone (Figure 2b) is about 0.1 m s -1, which compares with measurements by Hickey [1997, Figure 9a]. The estimated relative vorticity is about 0.4f (0.1 m s -1 swirl with a diameter of 5 kin), which is about half of the value calculated by Hickey [1997, Figure 12]. Pro- cesses not included in these simulations could further
strengthen the cyclone. Flow rectification [Holloway, 1987] due to random eddies interacting with topogra- phy was proposed as the cause of a trapped cyclone in regions with weak wind forcing [Hunkins, 1988]. Phase shift between transient wind forcing and flow generates stronger cyclones (Klinck et al., submitted manuscript, 2000).
4.2. Influence of Stratification
Stratification allows vertical gradients in the flow, re- ducing the influence of bathymetry. As stratification is reduced to zero (and assuming weak friction), the flow is strongly constrained to follow bathymetric contours. As

SHE AND KLINCK: FLOW NEAR CANYONS DRIVEN BY CONSTANT WINDS 28,687
6O
5O
30
20
10
-2O
IflllllllJll[[llll[ll]•Sl•1111llllll11
150m, Day 12 10 cm/s
[[[,],•,,],,[,[,•,•[,,,•,,][[[,•],•,,[,
-10 0 10 20
Alongshore dislance (km)
6O
5O
10
-2O
200-
300m, Day 12 5 cm/s
-10 0 10 20
Alongshore dislance (km)
Figure 9. Horizontal velocity vectors at selected depths at model day 12 for downwelling winds over Astoria stratification: (a) at a depth of 150 m, and (b) at a depth of 300 m. Vectors are shown at every other model grid point, only in the vicinity of the canyon. Solid lines are isobaths with an interval of 100 m.
stratification is made very strong, then slight changes in the density structure due to initial upwelling isolates the circulation from the bathymetry.
In the cases considered here, weaker stratification al- lows more influence of the bathymetry (Figure 6a) on the near-surface flow, weaker onshore flow in the upper canyon but covering more of the width (Figure 6b), and weaker deep flow within the canyon (Figure 6c). Inter- estingly, the weak stratification case has larger cross- shore transports below 150 m (Figures 5 and 8), but they tend to compensate so that the net onshore trans- port is smaller. The across shore pressure gradient (Fig- ure 13a) is comparable to that with stronger stratifica- tion (Figure 12a), which is not surprising since it is due to the free surface tilt created by the wind. The residual pressure gradient (Figure 13b) is consistently onshore, indicating the inability of the weaker density structure to isolate the canyon from the pressure gradient due to the surface slope.
An additional simulation was run with stratification 4 times that of Astoria driven by constant upwelling winds. In spite of the further doubling of the radius of deformation the resulting flow is not markedly differ- ent from the first case. The structure of the flow looks rather like Figure 2 with flow speeds about the same. The depth of upwelling in the canyon was around 300 m. There was reversal of the flow in the deeper sections of the canyon with the development of a deep anticyclone (flow follows isobaths). Such a deep flow was less evi- dent with the Astoria stratification. There is no further qualitative difference in the flow with such increases in the stratification of values stronger than observed near Astoria Canyon.
4.3. Circulation Forced by Downwelling Winds
Circulation forced by downwelling winds is largely op- posite to that forced by upwelling winds. A strong anti- cyclone in the canyon (Figure 9), which is comparable to

28,688 SHE AND KLINCK: FLOW NEAR CANYONS DRIVEN BY CONSTANT WINDS
\
\\
\
\,,j/
ø L
(•u)
(xn) q]do(I

SHE AND KLINCK' FLOW NEAR CANYONS DRIVEN BY CONSTANT WINDS
4O
2O
o
-20
-40
3o
2o
lO
-lO
-2o
' ' i ' ' ' i i , i ' ' ß ' i i ' ' ß i '
Horizontal Transport -
t•.:.--..-..-•-:•--'•'---.... / •'• •. • .5:-' • "• ........... Su
.• •:-•' •, / ..... . - ...............
ß ,, .......
0 2 4 6 8 10 12 14
Time (day) b
' I _ I , , ,
_ Vertical Transport _
_
So
- • , , I , , , I • , • I • • , I • , , I , • [ I • , • I • -
0 2 4 6 8 10 12 14
Time (day)
Figure 11. Time series of transport for downwelling winds over Astoria stratification. The units are 1000 m s s -1' (a) across shore transport at the canyon mouth (40 km from the coast) over four planes created by 150 m depth and the canyon axis, and (b) vertical transport across the top of the canyon (150 m) over four planes created by the extension of the shelf break and the axis of the canyon. The symbols are N, north; S, south; i, inner; o, outer; u, upper; and l, lower.
28,689
the cyclone generated in the upwelling case (Figure 2), is driven by vortex compression or frictional coupling to the alongshore flow. The flow at 150 m (Figure 9a) is directly into shallower water, creating strong flow to- ward the shelf (causing downwelling, not upwelling). In the upwelling case the cyclone tends to fill the canyon.
Previous numerical results [Klinck, 1996] show that right bounded (downwelling) Circulation past a canyon causes little net cross-shelf exchange, while left bounded flow produces significant exchange. Wind-driven sim- ulations discussed here differ from previous results by showing a net exchange for either direction of wind forc- ing. However, upwelling winds produce stronger ex- change than downwelling, as seen in the vertical trans- port time series (Figure 5b and 11b). Also, note that changing the sign of the wind forcing changes the sign of the vertical transport for the first 5 days; that is, the response is largely linear over that time. Beyond that time the transport time series are no longer opposite because of differently developing density structure and nonlinear effects.
The across shore pressure gradient is almost oppo- site of upwelling with offshore force throughout (Fig- ure 14a). However, it remains nonzero over the canyon, while the upwelling case has a sign reversal; the down- welling case cannot develop sufficient density contrast to compensate the surface gradient. It is interesting that circulation near the top of the canyon with downwelling winds is more alongshore (except at the upstream rim), while upwelling winds create mainly across shore flow. The residual pressure gradient (Figure 14b) has along- shore antisymmetry with onshore residual force up- stream and offshore downstream. The residual force in the upwelling case is across shore antisymmetric with onshore force near the canyon head and offshore over the outer canyon.
We note in passing that a thick bottom boundary layer (figure not shown) develops, which also plays a role in decoupling the alongshore flow on the shelf from the bottom topography. This difference between upwelling and downwelling winds also occurs in these simulations, but these features are discussed elsewhere [Chapman

28,690 SHE AND KLINCK: FLOW NEAR CANYONS DRIVEN BY CONSTANT WINDS
_11111111111 _
_
_
_
i ]11111
(re>I) ooue]s!p o.toqs-sso.toV
J
\
I
I
I
I
I
I /
I
I
I
I
I
(re>I) oau•1s!p o.toqs-sso.tav

SHE AND KLINCK: FLOW NEAR CANYONS DRIVEN BY CONSTANT WINDS 28,691
I I I I [ 1 [ ill [ I]l[ [ [
I [ ,
c::) I.
:1
i[
i[ I ! :l
'l I \ -\
.i r --• • •- • •; • 0• ' - • --•-•
l,;,, _ _ . . r j J> • -- • • k • • .....•;. ..... • -- % % % % ..... ." ..:
• % % % ...." ....
.
I / /: I / / ' /
/ 'f I
I 'k .
I I /
[ • ß
I ' I
I I : • . .
(mI) oous!p oxoqs-ssoxo¾
/
^ /
I \ /
I \1
\
\
\
\
/
o
(mI) oouls!p ozoqs-ssoxov

28,692 SHE AND KLINCK: FLOW NEAR CANYONS DRIVEN BY CONSTANT WINDS
(thai) oou•:•s!p oaoqs-ssoaov
o
o2
(tu•I) oou•:•s!p oaoqs-ssoaov

SHE AND KLINCK: FLOW NEAR CANYONS DRIVEN BY CONSTANT WINDS 28,693
and Lentz, 1997; Middleton and Cirano, 1999], and these processes are not dominant in these simulations.
4.4. Influence of Momentum Advection
Momentum advection is important in creating the ob- served flow patterns near canyons. Upwelling winds drive upwelling within the canyon even without mo- mentum advection (figure not shown). However, the onshore flow is constrained to the upstream edge of the canyon unless advection pushes this flow toward the downstream rim. Thus up-canyon flow, though driven by the surface pressure g;adient, requires momentum advection to expand over the canyon. Also, shelf flow is pushed close to the coastal wall (Figure 2a) by on- shore flow upstream of the canyon. Without momentum advection the flow along the shelf is largely symmetric (figure not shown), with the water returning to its orig- inal distance from the coast after a quick trip around the canyon.
Momentum advection is found to be essential in form-
ing the surface flow across the canyon and the trapped cyclone within the canyon. Without the momentum ad- vection the near-surface flow follows the canyon bathy- metry, and the cyclonic vorticity occurs only below 400 m depth (figure not shown).
4.5. Timescale of Response to Winds
We need to know how rapidly circulation near a canyon responds to a change in the wind stress. The timescale allows an estimate of the amount of the dense
water transported to the continental shelf by subma- rine canyons. For Astoria stratification the circulation near the head of the canyon (Figure 4) becomes approx- imately steady after 5-6 days. The vertical velocity is nonzero as long as the winds blow, so onshore trans- port continues. Over many weeks it is possible for slow adjustments to modify these results, but we have not investigated such slow changes. Winds over the west- ern North America shelf rarely persist longer than a week [Hickey, 1998]; it does not make much sense to ask about the ultimate steady state. Additionally, the periodic model domain produces unrealistic circulation after about 20 days so this model setup is not appro- priate for a long simulation with steady forcing, in any case.
What we do learn from the initial transients is that
the circulation in the canyon reacts in a few days to an increase in the strength of surface stress. Over an additional few days, nonlinear effects modify the circu- lation, spreading the across shore flow over the canyon. Density advection reduces the pressure gradients over a week or so, In spite of these adjustments, upwelling in the canyor, continues at rates that allow considerable water (20 mSv or 1.6 km 3 d -1) to move onto the shelf. By continuity, there must be an equivalent transport of water off the shelf across the adjacent shelf break, flush- ing the continental shelf. If there were one canyon per
100 km of a shelf (100 m deep and 100 km wide), then steady upwelling would flush this shelf in about 2 years (1000 km 3 water volume over exchange of 2 km 3 d -• gives 500 days).
5. Conclusions
This paper considers steady flow near and within a narrow submarine canyon driven by surface wind stress. The thermal and dynamic features in the solutions are consistent with the observations, which suggest that the ocean model can be used in a comprehensive canyon- shelf flow interaction study. On the basis of model re- sults some unresolved issues in canyon dynamics are analyzed.
In the upper layers (above 100 m) the influence of canyon topography on the flow is gentle, with the ef- fect being reduced as stratification increases. Alongshelf flow turns slightly onshore upstream of the canyon and turns offshore downstream. Near the rim (100-200 m), flow turns into the canyon mouth and moves across shore on the downstream side of the canyon. Upwelling or downwelling occurs near the canyon rim depending on the direction of the winds. A closed circulation is cre-
ated within the canyon in response to vortex stretching (upwelling) or compression (downwelling). Upwelling winds create persistent across shelf transport, while downwelling winds lead to small net exchanges.
This picture is consistent with the previous obser- vations, and we are able to deduce mechanisms that drive this circulation. With upwelling winds, onshore flow in the canyon is driven by the pressure gradient because of the tilted free surface and the reduction of
alongshore flow by the canyon topography. The con- trary baroclinic pressure gradient reduces but does not eliminate the surface pressure gradient so the force ex- tends deep into the canyon. This mechanism does not depend on momentum advection. Cyclonic vorticity is produced by flow detachment from the upstream rim and by vortex stretching due to continual upwelling. Closed circulation in the canyon develops in response to these two processes. Downwelling winds produce op- positely directed circulation in the upper and middle layers. These circulation patterns develop in about a week but change slowly over an additional 2 weeks with continuous forcing.
This study has practical importance because it calcu- lates the amount of the dense water transported to the continental shelf through submarine canyons, resulting in shelf flushing times of a few (2-5) years. There is also a rectification of this cross-shore transport as upwelling causes exchange but downwelling does not. Thus trans- ports from reversing winds do not cancel, and canyon circulation can still flush the shelf even in cases of winds
with zero mean. Better estimates of the flushing times are obtained with time variable winds, which will be considered in the following paper (Klinck et al., sub- mitted manuscript, 2000).

28,694 SHE AND KLINCK: FLOW NEAR CANYONS DRIVEN BY CONSTANT WINDS
Acknowledgments. The authors thank Barbara M. Hickey and Susan E. Allen for their continuing contribution to the setup and analysis of these simulations. Thanks are extended to Mike Dinniman for generating some of the sim- ulations and producing figures for this paper. This work was supported by the U.S. National Science Foundation by grant OCE-9618293. Some computer resources were provided by Glenn Wheless and Cathy Lascara of the Virtual Environ- ment Lab at the Commonwealth Center for Coastal Phys- ical Oceanography on their SGI Origin 2000 (made avail- able with funding provided through NSF grant OCE-98- 71100 and Old Dominion University). Computer facilities and support were provided by the Commonwealth Center for Coastal Physical Oceanography. This support is appre- ciated.
References
Allen, J. S., P. A. Newberger, and J. Fedriuk, Upwelling cir- culation on the Oregon continental shelf, part I, Response to idealized forcing, J. Phys. Oceanogr., 25, 1843-1866, 1995.
Allen, S. E., Topographically generated, subinertial flows within a finite length canyon, J. Phys. Oceanogr., 26, 1608-1632, 1996.
Barth, J. A., Stability of a coastal upwelling front, 2, Model results and comparison with observations, J. Geophys. Res., 9•, 10,857-10,883, 1989.
Barth, J. A., Short-wavelength instability on coastal jets and fronts, J. Geophys. Res., 99, 16,095-16,115, 1994.
Beckmann, A., and D. B. Haidvogel, Numerical simulation of flow around a tall isolated sea mountain, part I, Problem formation and model accuracy, J. Phys. Oceanogr., 23, 1736-1753, 1993.
Chapman, D.C., and S. J. Lentz, Adjustment of stratified flow over a sloping bottom, J. Phys. Oceanogr., 27, 340- 356, 1997.
Freeland, H. J., and K. L. Denman, A topographically con- trolled upwelling center off southern Vancouver Island, J. Mar. Res., dO, 1069-1093, 1982.
Haney, R. L., On the pressure gradient force over steep topography in sigma coordinate ocean models, J. Phys. Oceanogr., œ1, 610-619, 1991.
Hickey, B. M., The response of a steep-sided, narrow canyon
to time-variable wind forcing, J. Phys. Oceanogr., 27, 697- 726, 1997.
Hickey, B. M., Cbastal oceanography of western North Am- erica from the tip of Baja California to Vanouver Island, in The Sea, vol. 11, edited by A. R. Robinson and K. H. Brink, pp. 345-393, John Wiley, New York, 1998.
Holloway, G., Systematic forcing of large-scale geophysical flows by eddy-topography interaction, J. Fluid Mech., 18d, 463-476, 1987.
Hunkins, K., Mean and tidal currents in Baltimore canyon, J. Geophys. Res., 93, 6917-6929, 1988.
Inman, D. L., C. E. Nordstrom, and R. E. Flick, Currents in submarine canyons: An air-sea-land interaction, Annu. Rev. Fluid Mech., 8, 275-310, 1976.
Klinck, J. M., The influence of a narrow transverse canyon on initially geostrophic flow, J. Geophys. Res., 93, 509- 515, 1988.
Klinck, J. M., Geostrophic adjustment over submarine can- yons, J. Geophys. Res., 9•, 6133-6144, 1989.
Klinck, J. M., Circulation near submarine canyons: a mod- eling study, J. Geophys. Res., 101, 1211-1223, 1996.
Large, W. G., J. C. McWilliams, and S.C. Doney, Oceanic vertical mixing: A review and a model with nonlocal boundary layer parameterization, Rev. Geophys., 32, 363- 403, 1994.
Mellor, G. L., T. Ezer, and L.-Y. Oey, The pressure gradient conundrum of sigma coordinate ocean models, J. Atmos. Oceanic Technol., 11, 1126-1134, 1994.
Middleton, J. F., and M. Cirano, Wind-forced downwelling slope currents: A numerical study, J. Phys. Oceanogr., 29, 1723-1743, 1999.
Song, Y., and D. B. Haidvogel, A semi-implicit ocean cir- culation model using a generalized topography-following coordinate system, J. Cornput. Phys, 115, 228-244, 1994.
J. M. Klinck Center for Coastal Physical Oceanog- raphy, Old Dominion University, Norfolk, VA 23529. ([email protected])
J. She, Danish Meteorological Institute, Copenhagen, Denmark.
(Received January 22, 1999; revised March 28, 2000; accepted June 14, 2000.)