Flow Estimation Methods for Small Urban Catchments… · FLOW ESTIMATION METHODS FOR SMALL URBAN...
65
Wallingford HydroSolutions Ltd FLOW ESTIMATION METHODS FOR SMALL URBAN CATCHMENTS August 2009 Final Report Maclean Building Crowmarsh Gifford Wallingford OX10 8BB www.hydrosolutions.co.uk
Transcript of Flow Estimation Methods for Small Urban Catchments… · FLOW ESTIMATION METHODS FOR SMALL URBAN...
Wallingford HydroSolutions Ltd
FLOW ESTIMATION METHODS FOR
SMALL URBAN CATCHMENTS
August 2009
Final Report
Maclean Building
Crowmarsh Gifford
Wallingford
OX10 8BB
www.hydrosolutions.co.uk

FLOW ESTIMATION METHODS FOR
SMALL URBAN CATCHMENTS
Final Report
For and on behalf of
Wallingford HydroSolutions Ltd.
Prepared by: A R Young
Approved by: A R Black
Position: Projects Manager Scotland
Date: 14/8/09
This report has been prepared by Wallingford HydroSolutions with all reasonable skill, care and diligence
within the terms of the Contract with the client and taking account of
the resources allocated to it by agreement with the client.
We disclaim any responsibility to
the client and others in respect of any matters outside the scope of
the above. This report is confidential to the client and we accept no responsibility of any
nature to third parties to whom this report, or any part thereof, is made
known. Any such party relies on the report at their own risk.

Contents
1 Literature and data availability review................1
1.1 Introduction .................................................................................. 1
1.2 Perturbations of natural recharge processes ...................................... 2
1.3 Rainfall-Runoff Models .................................................................... 5
1.4 Definition of impermeable areas ...................................................... 6
1.5 Impacts of water supply and sewage treatment on flows within
urbanised catchments. .............................................................................. 7
2 Simulating the impact of urbanisation upon flow
regime statistics......................................................8
2.1 Overview ...................................................................................... 8
2.2 Modelling Methodology ................................................................... 9
2.2.1 Incorporating the impact of urbanisation on calculation of effective
precipitation.......................................................................................... 9
2.2.2 Incorporating the impacts of sewer infiltration and mains leakage .. 11
2.2.3 Urbanisation Scenarios Tested.................................................... 16
2.3 Modelling Results ......................................................................... 16
2.3.1 The modelled impact of urbanisation on flow regimes.................... 16
2.3.2 Relationships between changes in the simulated flow statistics and the
characteristics of the catchment ............................................................ 24
2.4 Conclusions from the simulation results .......................................... 27
2.4.1 The simulated impact of urbanisation on Mean Flow...................... 27
2.4.2 The simulated impacts of urbanisation on the Q95 flow ................. 28
3 A comparison of the simulation results with the
detection of the influence of urbanisation on long
term gauged flow records within England and
Wales. ...................................................................30
4 Hydrometric monitoring in Dundee and the
detection of the impacts of urbanisation on low
flows within the Dundee and Glasgow catchments.
33
4.1 Catchment selection and instrumentation........................................ 33
4.1.1 Rationale................................................................................. 33
4.1.2 Sites selected........................................................................... 33
4.1.3 Instrumentation and commissioning............................................ 35
4.2 Gauge Operation and data quality assurance................................... 36
4.3 Results ....................................................................................... 38
4.4 Selection of analogues and assignment of flow percentiles ................ 45
4.5 Detection of the impacts of urbanisation within the Glasgow catchments
monitored by Scottish Water.................................................................... 47
5 Conclusions and definition of a method for
estimating mean flow and Q95 within small
urbanised catchments ...........................................52
5.1 Scientific Conclusions ................................................................... 52
5.2 A method for estimating the impact of urbanisation on the Q95 and
Mean Flow statistics................................................................................ 53
6 Recommendations for further work...................57
6.1 References.................................................................................. 58


1
1 Literature and data availability review
1.1 Introduction
The potential impacts of urbanisation on low flows can be split into two groups; the
perturbations of the natural recharge processes and the impacts of abstractions and
discharges which tend to be concentrated in urban areas.
The general perception (e.g. Shaw, 1983), which is not always supported by a body of
experimental evidence, is that following major urban developments in a catchment the
changes in the river flow, compared to that of a rural catchment are as follows:
• There is a higher proportion of rainfall appearing in surface runoff, and so the
total volume of discharge is increased and the recharge is reduced.
• For a specific rainfall event, the response of the catchment is accelerated, with a
steeper rising limb of the flow hydrograph, and the lag time and time to peak are
reduced.
• Flood peak magnitudes are increased.
• In times of low flows, discharges are decreased since there is a reduced
contribution from groundwater storage that has received less replenishment.
• Water quality in watercourses draining urban areas is degraded by effluent
discharges/pollution and water temperatures are increased.
The focus of this literature review is to identify evidence of the potential impacts of
urbanisation on low flows, of which literature is limited. Thus of the above changes in
river flow this literature review considers the proportion of rainfall appearing in surface
runoff and the reduced contributions from groundwater storage. This evidence can be
used to inform rainfall-runoff model structures that can be used to simulate the impacts
of urbanisation on low flows.
Secondly, this review considers the data required to apply desk based methods within a
catchment. This will require information on urban extent; information on population
densities; and per-capita consumption and mains leakage.

2
1.2 Perturbations of natural recharge processes
As urbanised areas develop within a catchment, large areas are covered with
impermeable layers, such as asphalt and concrete, disrupting the natural hydrological
processes. The covering of land surface by a large proportion of impervious materials
reduces the infiltration capacity of the catchment leading, potentially to a reduction in
soil water content and any recharge mechanisms. Thus a much higher proportion of any
rainfall forms immediate runoff (Hall, 1984). Marsalek et al (2006) conceptualises that
this increase in runoff volume plays a large part in urban flooding and reduces recharge
of groundwater aquifers. Where groundwater is withdrawn for water supply, aquifers are
often overexploited and land subsidence may occur. The reduction in groundwater
recharge lowers the groundwater table and reduces the base flows in watercourses. The
effect on a watercourses regime is dependent on the extent of the impervious area
(Shaw, 1983).
Runoff from roofs and paved areas within urban areas is routed to surface water via
storm drains. These may be separate or combined with the wastewater sewer system
and commonly in urban areas these are a mixture of the both. A typical combined
system conveys both surface water runoff and wastewaters in a single pipe. Whereas
within the separate system, the surface water runoff is transported by storm sewers and
discharged into the receiving waters (with or without treatment) and the wastewater is
conveyed directly to the treatment works. In dry weather, within the combined system,
the entire flow is transported to the sewerage treatment plant and treated. However in
wet weather, as the runoff inflow into the combined sewer increases, the capacity of the
collection system is exceeded and the excess flows are allowed to escape into the
receiving waters through combined sewer outfalls (Marsalek et al, 2006).
As urban areas develop there are extreme changes in runoff conveyance. Natural
channels are replaced by man-made channels and sewers, increasing the hydraulic
efficiency of runoff conveyance. Conveyance networks are often oversized in the
upstream parts, often culverted and characterised by a straight layout to limit routing
path lengths. Drains are often constructed with significant gradients to decrease drain
sizes and improve its self-cleansing (Marsalek et al, 2006). In general the quick routing
of runoff through the sewer system increases the speed of runoff giving rise to higher
flood peaks. The lag time between precipitation peak and discharge peak can be reduced
by a factor of up to 8 in urban areas (Wohl, 2000). The corollary of this is that increased
conveyance reduces low flows, however this impact is very localised and not reported in
literature and thus while this issue may be important it is out of scope of this study.

3
All drainage systems leak to a greater or lesser extent and hence, outside of
precipitation events, it is likely that some of the natural recharge will continue to be
intercepted by infiltration into the drainage system. However the opposite may also
occur; if a sewer below the water table is not water tight (which is often the case) it may
suffer from groundwater infiltration and essentially drain groundwater aquifers and
saturated soils (Marsalek et al, 2006).
The impact on the natural flow regimes is therefore a change in the distribution of the
flows; with experimental evidence to support high flows being increased and the base
flow potentially being decreased. This potential impact on low flows may be exacerbated
by channelisation of watercourses to improve flood conveyance and infiltration of
groundwaters into the sewer system. The development of sewer systems within the UK
progressively took place within the late 19th and 20th centuries; prior to this many
streams within urban areas were grossly polluted and commonly were culverted and
incorporated into the sewer system, hence potentially adding to the reduction of natural
flow in previously confluent water courses.
Discharges to the receiving waters from the sewerage network consist of either treated
discharges via a sewerage treatment plant or untreated through both combined sewer
outfalls and storm sewers. The discharge points for these systems may be some distance
from the urban area of interest. Urban drainage systems may cross natural topographic
catchment with intercepted precipitation being transferred across watersheds through
the drain network. This will lead to an augmentation of flows within the catchment
receiving the outfall from the drainage system and a loss of flow within the catchment
from which the transfer occurs.
The Urban Pollution Management Manual (1998) discusses the use of simplified urban
pollution models, such as SIMPOL, which can take account the variability in rainfall, river
conditions and waste water discharges. However, this is used for specific storm events,
and requires detailed knowledge of the sewerage system.
Considering the impact on mean flow and the flow duration curve, the transfers will
occur generally at higher flows (unless there are very significant soil moisture deficits
and the precipitation is low). The result will be higher than expected flows in the
receiving catchment and lower than expected flows within the catchment from which the
water is transferred. This will obviously have an impact on the mean flow within both
catchments. The marginal impacts on low flows are likely to be low as the impact on low
flows will be driven by reductions in natural recharge, which is primarily dependent on

4
the fact that precipitation is captured by the drainage system and not on which
catchment the surface water drainage is discharged in to.
As expected there is little literature available for estimating the impacts of urbanisation
on low flows, with no quantitative literature available. The majority of the literature
covers impact on runoff generation and to a much lesser extent impacts on recharge.
The majority of the research literature identified within this review on the impacts of
urbanisation on the hydrological cycle, and associated operational practice, focuses on
enhanced flood risk as urbanisation will increase the runoff volume within an event and
reduce the catchment response time (e.g. Chow, 1988 and Hall, 1984). The various
formulae that have resulted from the individual studies are only applicable to the areas
where they have been derived and it is not advisable to use them for the areas with
different climates and topography (Shaw, 1983).
Small urban catchments are more affected by the urban runoff flows than large
catchments flowing through a large city, where local urban runoff contributes to a small
proportion of the river flow (Maksimovic and Tucci, 2001). A two year study on the
impact of urbanisation on a small catchment (19.3km2) in Slovenia showed an increase
in impermeable surfaces through urbanisation gave the expected effect of faster runoff
and enlarged stream discharges. It was shown that the urbanisation enabled the runoff
generation during low precipitation and accelerated runoff in general (Brilly et al. 2006).
These two studies unfortunately do not state either the percentage runoff or impervious
extents used.
A comprehensive review of many studies is given by Packman (1980) on the effects of
urbanisation on flood hydrology. This highlighted that the development of generic
methods for predicting the impacts of urbanisation are hampered by four principle
problems:
• an increase in the complexity of the hydrological cycle;
• the problem of a suitable parametric description of urban development;
• a general lack of reliable data; and
• difficulty in generalising the results.
Whilst these points are made with reference to flood hydrology they are equally
pertinent to the impacts on flow duration curve statistics with the proviso that sub daily

5
routing effects can be ignored. This removes a lot of the hydraulic complexities of the
problem and the focus on time to peak, where much of the research effort has been
expended to date.
In comparison, less effort has been concentrated on quantifying the effect of
urbanisation on flood runoff volumes. Kjeldsen (2008) presents a simple and intuitive
extension to percentage runoff-type loss model based upon Packman (1980). This
explicitly incorporates the effect of urbanisation on percentage runoff, considering the
total percentage runoff (PR) as a sum of the contributions for the rural and urbanised
parts of the catchment, as follows:
Where PRr is the rural percentage runoff, I is the overall percentage imperviousness of
the catchment, and PRu is the percentage runoff from impervious areas.
All previous literature in the UK (e.g. Kjeldsen, 2008 and Packman, 1980) has focused
on estimating runoff volumes. Ragab et al. (2003) considers infiltration through road
surfaces. It is quite often assumed that urban infiltration is zero and runoff is 100% of
the rainfall, which leads to an assumed over estimation of road runoff volume and an
underestimation of direct recharge to groundwater. Ragab et al. (2003) demonstrates
that infiltration through road surfaces can be in the region of 6 to 9% of annual rainfall
within Wallingford in the Thames catchment.
1.3 Rainfall-Runoff Models
Perry and Nawaz (2008) investigated the impact of increasing imperviousness in
suburban areas through hard surfacing of domestic gardens in an area of Leeds, UK.
Over a 33 year study period an increase of 13% in impervious areas was observed within
the 1.16km2 study area. The study used the L-THIA (long-term hydrologic impact
assessment) model, which estimates runoff based on the relationship between the
nature of land surface, the daily rainfall and the soil type (Lim et al., 2006). This model
was successfully used to assess the impact of urbanisation in Merseyside, UK by Whitford
et al. (2001). This study investigated the ecological performance of urban areas and
hence required a simple model of runoff with minimal input data, and used aerial
photography to define the percentage land-cover.
The rainfall-runoff model CLASSIC (Climate and Land-use Scenario Simulation in
Catchments) was originally written to simulate the impacts of climate and land-use
6
change on large UK catchments (Naden et al., 1996). CLASSIC incorporates
impermeable surfaces through two methods. The first deducts a value for potential
evaporation of up to 0.5mm, as in MORECS (Thomson et al., 1982), from the rainfall for
a grid square to determine the effective rainfall (Crooks and Naden, 2007). The second
PDR (percentage of direct rainfall), is a factor which allows a proportion of the
precipitation falling on semi-impermeable surfaces to become effective rainfall without
being routed through the soil-moisture module (Crooks et al., 1996).
The CLASSIC drainage model also includes an urban function for impermeable, paved
surfaces which is modelled as a one-component store. The total output flow from each
grid square at time t is a sum of the flow from permeable soils, the quick and slow flows
from semi-permeable soils and the flow from urban areas (Crooks and Naden, 2007).
This study used HOST type to map 5 soils types to the IHACRES model (Littlewood and
Jakeman, 1994).
1.4 Definition of impermeable areas
General experience dictates that the percentage runoff from impervious areas during
precipitation events in an urban environment is between 60% and 90%, with a value of
70% being used in the UK (Department of Environment, 1981).
For catchments larger than 2 km2, a typical urbanised area is considered to be 30%
impervious (Packman, 1980). The use of a rainfall-runoff model within a catchment
requires a definition of the extent of an impermeable areas and its impact upon the
runoff. Chormanski et al. (2008) evaluated different methods for estimating the impact
of impervious surfaces on the prediction of peak discharges determined by a fully
distributed rainfall-runoff model in a 31km2 Belgian catchment. One of the most
important inputs for a spatial distributed rainfall-runoff model in urbanised areas is the
area and distribution of impermeable areas. Although the rainfall-runoff model proposed
for use within this study is a lumped model, this study still provides valuable information
on the mapping of impermeable areas. There is no standard method for deriving these
estimates and there is high variability in the amount of imperviousness within the same
land-use class.
Using land-cover information derived from satellite imagery, Chormanski et al. (2008)
compared an average percentage of imperviousness for the urban area as a whole
(scenario 1); an average percentage of imperviousness for different types of urban land
use (scenario 2); and a local percentage of imperviousness for every 30m cell within the
urban area (scenario 3). Scenario 1 found that impervious areas were significantly

7
higher than the default 30% at an average of 45%. Scenario 2 uses three different levels
of imperviousness for the different types of urban land use: 30% for low density built up
area, 50% for infrastructure, high density built up area, roads and highways and 70%
for city centre and industrial areas. The paper compared the use of high-resolution and
medium-resolution estimates of land-cover. Both resolutions produced similar estimates
of the average degree of imperviousness within the catchment. Although the difference
between the peak flow produced by the high and medium resolution land-cover increases
within the semi- and fully-distributed approaches.
As stated earlier Packman (1980) defines a typical urbanised area to be 30%
impervious, using the URBAN extent extracted from 1:50k Ordnance Survey maps. The
FEH CD-ROM provides a simple to use, widely accessible method of extracting
information on the urban extent for a catchment. The FEH CD-ROM V1 presented a new
urban descriptor, URBEXT1999, which reduces the influence of the sub-urban element
with a weight of 0.5. Thus the relationship between URBAN and URBEXT1990 was
reported as URBAN = 2.05 URBEXT1999 (Bayliss, 1999). The latest coverage of urban
areas is defined within version 2 of the FEH CD-ROM by URBEXT2000 (Bayliss et al.,
2007), which updates the land coverage from that of the Land Cover Map 2000 and
incorporates an additional class of inland bare ground. Given the broad relationship
between URBAN and URBEXT1999 and the similarity between URBEXT1999 and
URBEXT2000 (allowing for development over time), it is thought that the factor of 2.05
is also applicable to URBEXT2000.
1.5 Impacts of water supply and sewage treatment on flows within
urbanised catchments.
Abstractions and discharges will be licensed under the Controlled Activities Regulations
and, as these regulations mature, information on actual abstraction and discharge
volumes will increasingly become available. LowFlows Enterprise has comprehensive
facilities for explicitly incorporating abstractions and discharges into the natural low flow
estimation procedures and hence we will not consider these further within this study.
These estimates of influence volume can be exported from Low Flows Enterprise and
used in conjunction with the Report 101 methods as a simplified method of incorporating
the degree of influence.
However, the leakage from water supply pipes and leakage from, and infiltration to
sewer systems should be considered as, certainly in the case of leakage from water
supply pipes, this water can represent a significant import of water to an urban area.

8
Water supply for urban areas may originate from a number of sources including; ground
water abstractions within the catchment, upstream surface water abstractions/supply
from upstream impoundments and imports from other catchment. Unaccounted for
losses “main leakage” are generally in the order of 15-20% of water entering into supply
and thus represent a significant import of water into the urban catchment. The Scotland
wide average figure for mains leakage (2007/8) is 189 lh-1d-1 (Iain Campbell, pers
comm.).
Sewers and water mains commonly run in close proximity and hence the import of water
into a catchment through mains leakage is offset by infiltration into the sewer network.
When recorded sewer flow data are available, the infiltration methodology used by
Scottish Water is fundamentally is based on Armstrong et al. (1996). Where no recorded
data are available then Scottish Water use a default of 100l/h/d. For new developments
a rule of thumb of 40% of population (or trace/commercial) dry weather flow is used
(Kieran Downey, pers comm).
To apply methods that take mains leakage and sewer infiltration into account will need
information on the population within a catchment, as will be discussed these data are
available from the General Register Office (GRO) for Scotland.
2 Simulating the impact of urbanisation upon
flow regime statistics
2.1 Overview
The literature review, as expected has highlighted the paucity of information on the
impacts of urbanisation on low flow regimes. This section presents the outcomes of a
simulation study that used a rainfall runoff model to simulate the potential impacts of
urbanisation on the flow regimes across many catchments. The flow statistics considered
within the study were:
• Mean Flow;
• Q20 flow;
• Q50 flow;
• Q95 flow; and
• the BFI.
9
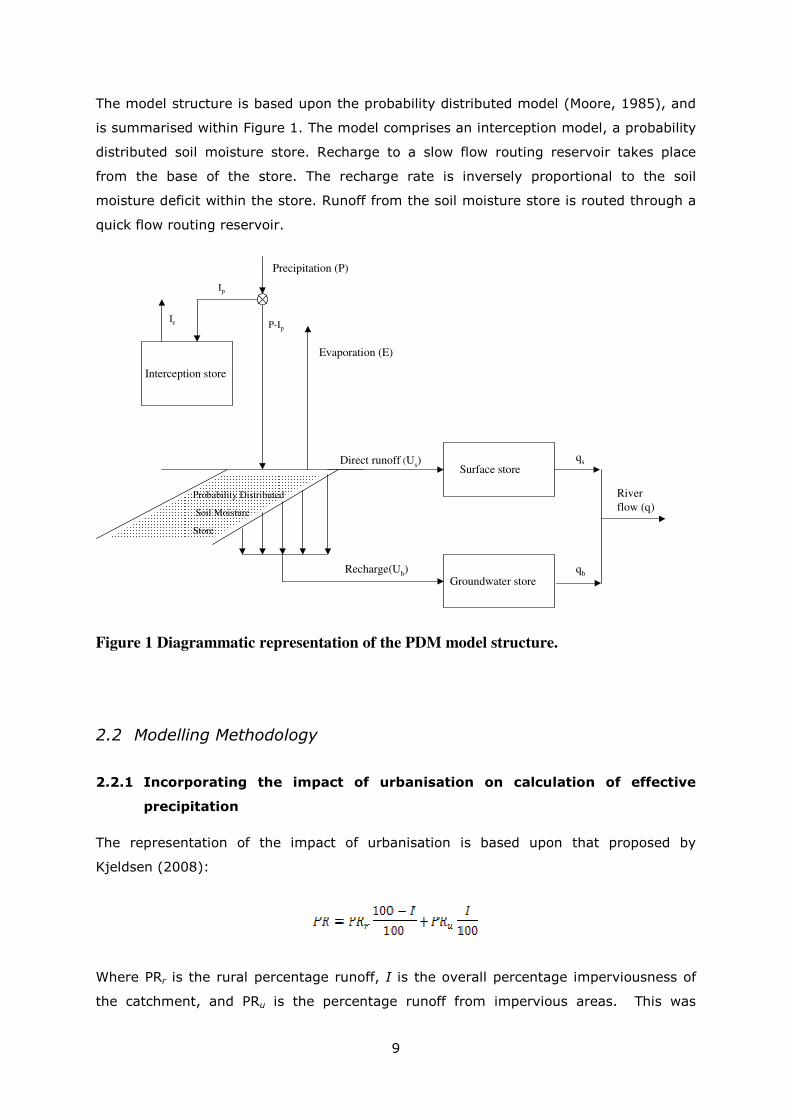
The model structure is based upon the probability distributed model (Moore, 1985), and
is summarised within Figure 1. The model comprises an interception model, a probability
distributed soil moisture store. Recharge to a slow flow routing reservoir takes place
from the base of the store. The recharge rate is inversely proportional to the soil
moisture deficit within the store. Runoff from the soil moisture store is routed through a
quick flow routing reservoir.
Probability Distributed
Soil Moisture
Store
Recharge(Ub)
Direct runoff (Us)
Surface store
Groundwater store
Interception store
River
flow (q)
Ie P-Ip
Evaporation (E)
Ip
Precipitation (P)
qs
qb
Figure 1 Diagrammatic representation of the PDM model structure.
2.2 Modelling Methodology
2.2.1 Incorporating the impact of urbanisation on calculation of effective
precipitation
The representation of the impact of urbanisation is based upon that proposed by
Kjeldsen (2008):
Where PRr is the rural percentage runoff, I is the overall percentage imperviousness of
the catchment, and PRu is the percentage runoff from impervious areas. This was
10
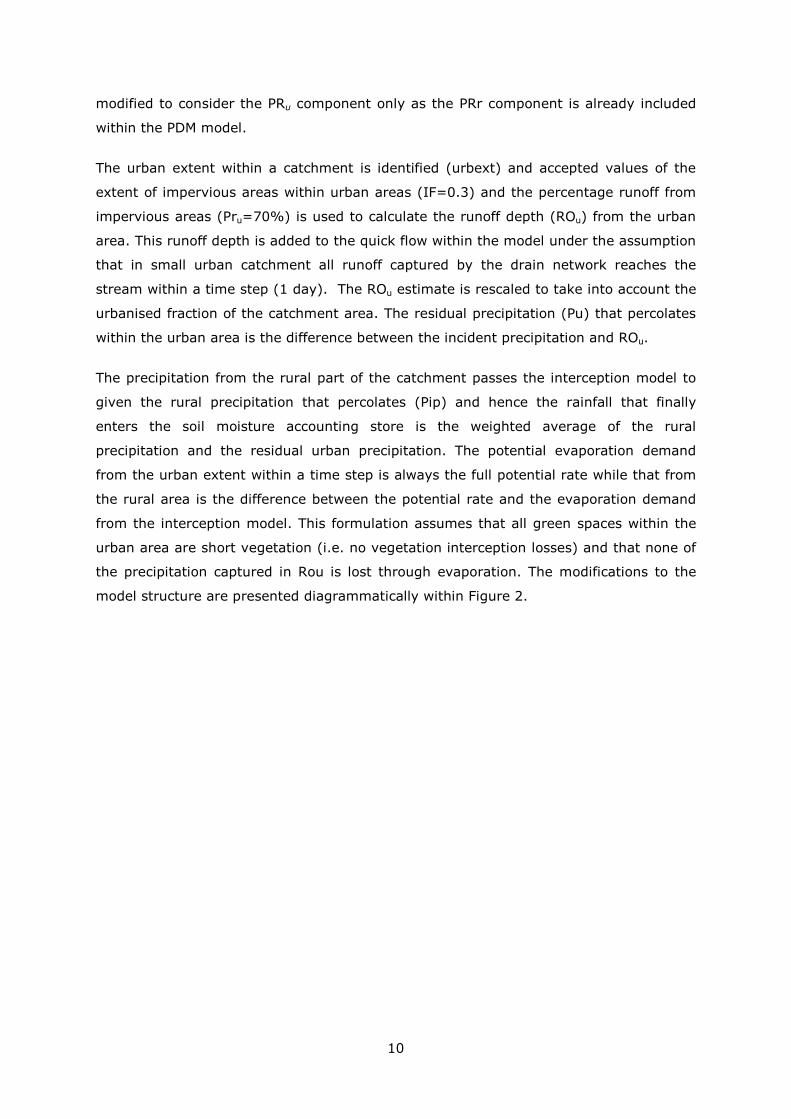
modified to consider the PRu component only as the PRr component is already included
within the PDM model.
The urban extent within a catchment is identified (urbext) and accepted values of the
extent of impervious areas within urban areas (IF=0.3) and the percentage runoff from
impervious areas (Pru=70%) is used to calculate the runoff depth (ROu) from the urban
area. This runoff depth is added to the quick flow within the model under the assumption
that in small urban catchment all runoff captured by the drain network reaches the
stream within a time step (1 day). The ROu estimate is rescaled to take into account the
urbanised fraction of the catchment area. The residual precipitation (Pu) that percolates
within the urban area is the difference between the incident precipitation and ROu.
The precipitation from the rural part of the catchment passes the interception model to
given the rural precipitation that percolates (Pip) and hence the rainfall that finally
enters the soil moisture accounting store is the weighted average of the rural
precipitation and the residual urban precipitation. The potential evaporation demand
from the urban extent within a time step is always the full potential rate while that from
the rural area is the difference between the potential rate and the evaporation demand
from the interception model. This formulation assumes that all green spaces within the
urban area are short vegetation (i.e. no vegetation interception losses) and that none of
the precipitation captured in Rou is lost through evaporation. The modifications to the
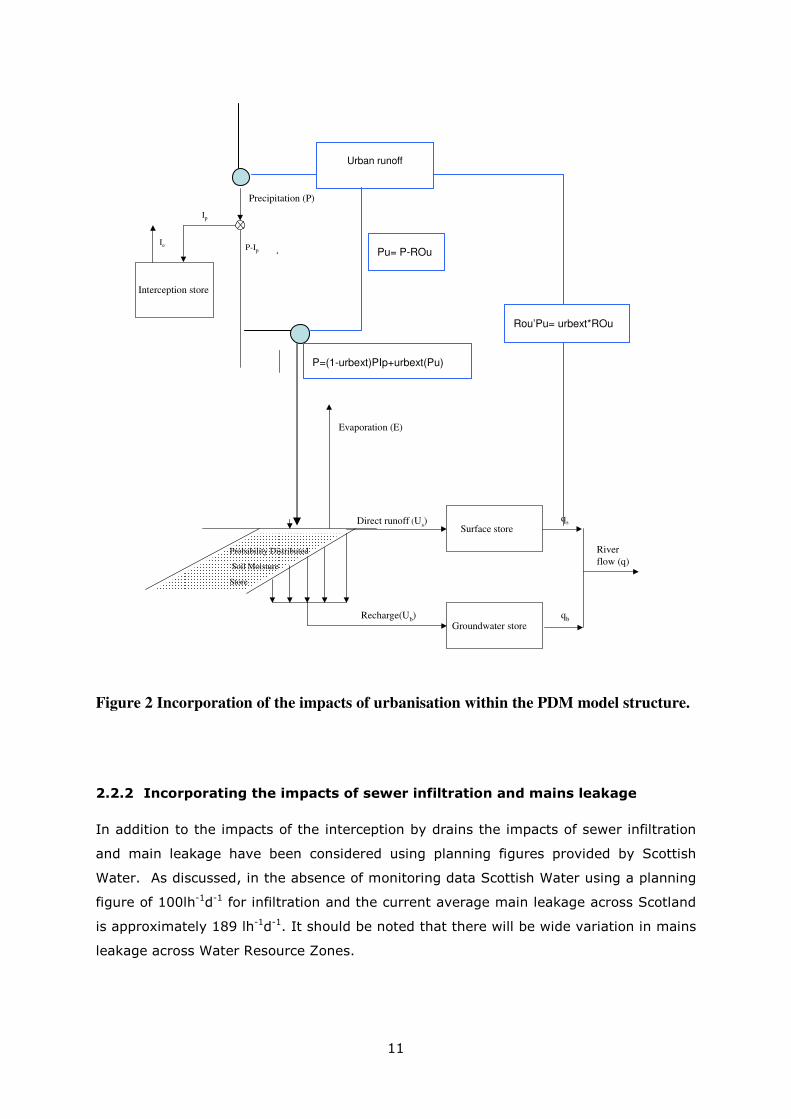
model structure are presented diagrammatically within Figure 2.
11
Figure 2 Incorporation of the impacts of urbanisation within the PDM model structure.
2.2.2 Incorporating the impacts of sewer infiltration and mains leakage
In addition to the impacts of the interception by drains the impacts of sewer infiltration
and main leakage have been considered using planning figures provided by Scottish
Water. As discussed, in the absence of monitoring data Scottish Water using a planning
figure of 100lh-1d-1 for infiltration and the current average main leakage across Scotland
is approximately 189 lh-1d-1. It should be noted that there will be wide variation in mains
leakage across Water Resource Zones.
Probability Distributed
Soil Moisture
Store
Recharge(Ub)
Direct runoff (Us)Surface store
Groundwater store
Interception store
River
flow (q)
Ie P-Ip
Evaporation (E)
Ip
Precipitation (P)
qs
qb
Interception store
Ie P-Ip
Evaporation (E)
Ip
Precipitation (P)
Urban runoff
P=(1-urbext)PIp+urbext(Pu)
Pu= P-ROu
Rou’Pu= urbext*ROu

12
Both these figures are expressed as per capita figures and thus an estimate of
population density (h/km-2) within urban areas is required to apply these figures within a
catchment model.
The Scottish Government disseminates a range of small area statistics, including
population, through the Scottish Neighbourhood Statistics website. The statistics are
provided per data zone area, for which Scotland has been divided into over 6,500 zones.
For each data zone area (polygon shape files downloaded from http://www.sns.gov.uk
on 01/12/08), there is an associated 2007 small area population estimate (downloaded
from http://www.gro-scotland.gov.uk on 01/12/08). These population estimates were
used to calculate a population density per square kilometre.
To allow a comparison between population density and urban areas, the CEH Land Cover
Map 2000 ‘continuous urban’ and ‘suburban / rural development’ classes were used
across mainland Scotland (see Figure 3). Within each data zone the percentage coverage
of both urban and suburban land cover classes has been calculated and compared with
the 2007 population density. Figure 4 and Figure 5 present the relationship between
urban and sub-urban, respectively, across mainland Scotland. As the aim of this project
is to consider small catchments with over 50% urban coverage Figure 6 and Figure 7
present this relationship within each zone with more than 50% coverage urban/sub-
urban. While there is a wide variation in population density the median value of
approximately 5000 people h/km-2 has been used within the study.

13
© Copyright Wall ingford HydroSolu tions Ltd. No part of th is map may be reproduced wi thout prio r permi ssi on
Continuous Urban
Suburban / Rural Developed
Scottish Mainland
-
Project:
Title:
LEGEND
Flow Estimation Methods for Small Urban Catchments
Urban Areas within Scotland
Figure 3 Continuous urban and suburban across mainland Scotland
0.0001
0.001
0.01
0.1
1
10
100
0.1 1 10 100 1000 10000 100000
Percent urban
Population Density per square km
Figure 4 Relationship between population density and percent urban within each
data zone across Scotland

14
0.0001
0.001
0.01
0.1
1
10
100
0.1 1 10 100 1000 10000 100000
Percent sub-urban
Population Density per square km
Figure 5 Relationship between population density and percent sub-urban within
each data zone across Scotland
50
60
70
80
90
100
0 10000 20000 30000 40000 50000
Percent urban
Population Density per square km
Figure 6 Relationship between population density and percent urban within data
zone containing 50 to 100% urban coverage

15
50
60
70
80
90
100
0 10000 20000 30000 40000 50000
Percent sub-urban
Population Density per square km
Figure 7 Relationship between population density and percent sub-urban within
data zone containing 50 to 100% urban coverage
Sewers and water mains commonly run in close proximity to one another, both leak and
hence it has been assumed that water intercepted by the sewers contains a high
proportion of mains leakage. Thus the import of water into an urban area has been
assumed to be the difference between the planning figures for interception and mains
leakage. This is equivalent to 89 lh-1d-1 and assumes that the sewer network discharges
outside of the catchment. Combining this figure with the population density figure and
converting into the model units of mmd-1 yields a net import of water of 0.445 mmd-1.
This is a substantial amount of water equating to 162mmyr-1. To put this in context, a
catchment receiving around 700mm/yr of rainfall might be expected to have an annual
runoff of around 250mmyr-1. The figures used within this calculation are approximate
and will vary widely in practice. As will be discussed, the result obtained must hence be
viewed as an assessment of the sensitivity of the urban water balance to the import of
water associated with supply of potable water.

16
2.2.3 Urbanisation Scenarios Tested
Three urbanisation scenarios of 50% 75% and 100% were considered over 160
catchments across GB for which model have been previously calibrated. Catchments
from England and Wales have been used as there are only 67 calibrated catchments
within Scotland. The full catchment dataset was screened to exclude 19 groundwater
catchments catchment with significant outcrops of chalk, oolitic limestone or Triassic
sandstones.
The differences between the simulated flow statistics for the 0% baseline case and the
50, 77 and 100% cases were extracted and expressed as a percentage of their gauged
counterparts over the period of record for each catchment. If the flow statistic is greater
under an urbanisation scenario than the baseline statistic the percentage is negative.
The following four cases were tested for each urbanisation scenario:
1. No export, no leakage – in this case it is assumed that all water captured by the
surface drains is returned within the catchment and there is no allowance made
for the impact of mains leakage
2. Full export, no leakage – in this case it is assumed that all water captured by the
surface drains is discharged downstream of the catchment outlet. In this case the
urban runoff component is not added to the total stream flow.
3. No export, leakage accounted for – as above but with leakage incorporated within
the model.
4. Full export, leakage accounted for – as above but with leakage incorporated
within the model.
2.3 Modelling Results
2.3.1 The modelled impact of urbanisation on flow regimes

17
Table 1 below presents 68% confidence intervals for the percentage change in the MF,
BFI, Q20, Q50 and Q95 flow statistics over the 160 catchment considered for Cases 1
and 2. For clarity the figures within the table do not account for the import of water
associated with potable supply
18
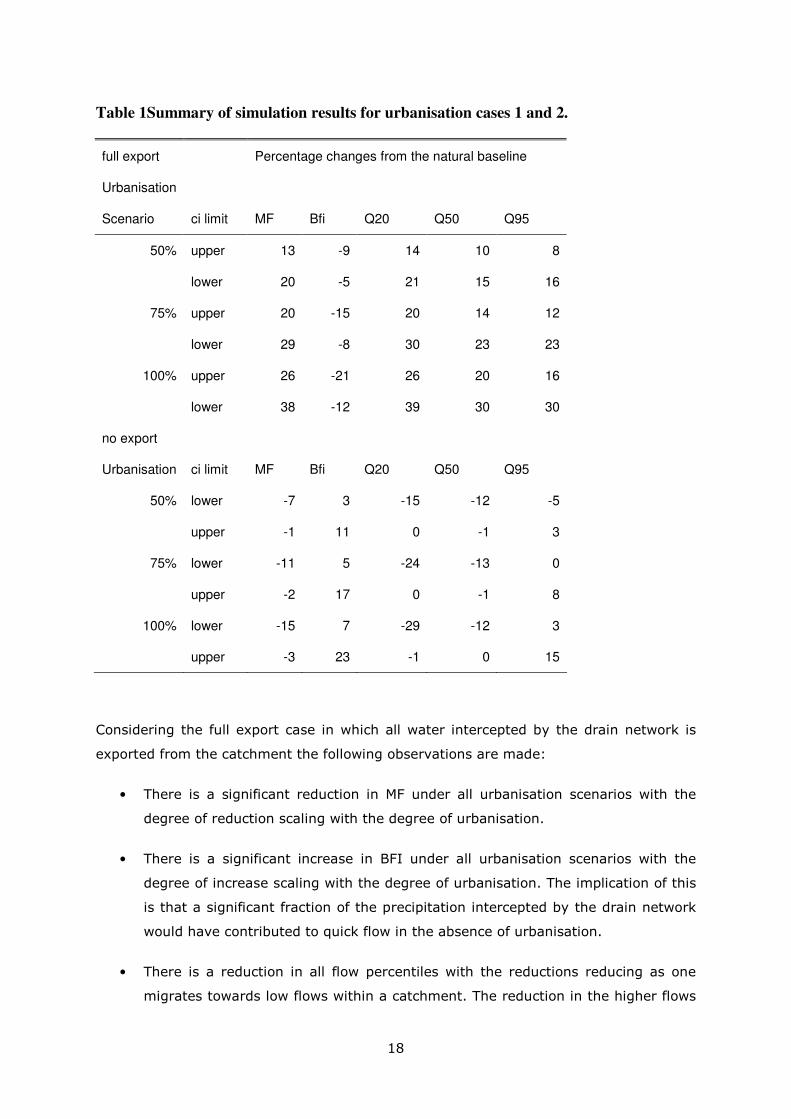
Table 1Summary of simulation results for urbanisation cases 1 and 2.
full export Percentage changes from the natural baseline
Urbanisation
Scenario ci limit MF Bfi Q20 Q50 Q95
50% upper 13 -9 14 10 8
lower 20 -5 21 15 16
75% upper 20 -15 20 14 12
lower 29 -8 30 23 23
100% upper 26 -21 26 20 16
lower 38 -12 39 30 30
no export
Urbanisation ci limit MF Bfi Q20 Q50 Q95
50% lower -7 3 -15 -12 -5
upper -1 11 0 -1 3
75% lower -11 5 -24 -13 0
upper -2 17 0 -1 8
100% lower -15 7 -29 -12 3
upper -3 23 -1 0 15
Considering the full export case in which all water intercepted by the drain network is
exported from the catchment the following observations are made:
• There is a significant reduction in MF under all urbanisation scenarios with the
degree of reduction scaling with the degree of urbanisation.
• There is a significant increase in BFI under all urbanisation scenarios with the
degree of increase scaling with the degree of urbanisation. The implication of this
is that a significant fraction of the precipitation intercepted by the drain network
would have contributed to quick flow in the absence of urbanisation.
• There is a reduction in all flow percentiles with the reductions reducing as one
migrates towards low flows within a catchment. The reduction in the higher flows

19
is likely to be related to reductions in quick flow whilst for the low flows it will be
a reduction of the recharge to the unsaturated and saturated zones within the
catchments.
Considering the no export case in which all water intercepted by the drain network is
returned within the catchment:
• There is a significant increase in MF under all urbanisation scenarios with the
degree of increase scaling with the degree of urbanisation. This is likely to be a
consequence of the reduced evaporation losses within the urban areas.
Evaporation losses are reduced as the urban runoff is not retained within the soil
horizons and hence is not made available for evaporation and furthermore,
evaporation from the soil horizons under paved surfaces is likely to be negligible).
• There is a significant decrease in BFI under all urbanisation scenarios with the
degree of decrease scaling with the degree of urbanisation. The implication of this
is that the drain network is enhancing the quick flow component both through
diverting precipitation that would have otherwise recharged the soils and also
through reducing evaporation losses
• There is a clear tendency to increase the Q20 and Q50 flow statistics with 68% of
the catchments in the dataset experiencing an increase in these statistics under
all urbanisation scenarios.
• The impact on the Q95 flows is less marked for all scenarios. For the 50%
urbanisation case the 68% ci is roughly centred on zero change catchments
showing increases and decreases in equal numbers. The number showing
decreases is more marked for the 75% urbanisation case (68% showing a small
decrease in Q95) and the 100% urbanisation case. The implication is that whilst
urbanisation has an impact on recharge this is offset by a certain extent at low
flows by reductions in evaporation and the direct routing of a fraction of the
precipitation depth within summer events to stream flow which would have
otherwise not formed runoff due to soil moisture deficits within the catchment.
Table 2 below presents 68% confidence intervals for the percentage change in the MF,
BFI, Q20, Q50 and Q95 flow statistics over the 160 catchment considered for Cases 3
and 4. For clarity the figures within the table take full account for the import of water
associated with potable supply and mains leakage.
Table 2 Summary of simulation results for urbanisation cases 3 and 4.

20
full export Percentage changes from the natural baseline
Urbanisation ci limit MF Bfi Q20 Q50 Q95
50% upper 2 -6 1 -2 -11
lower 8 -4 9 4 -3
75% upper 3 -9 1 -3 -17
lower 12 -6 13 6 -5
100% upper 4 -13 1 -4 -22
lower 16 -8 18 8 -6
no export
Urbanisation ci limit MF Bfi Q20 Q50 Q95
50% lower -26 4 -34 -28 -29
upper -7 12 -7 -11 -13
75% lower -39 5 -51 -38 -37
upper -11 17 -11 -15 -16
100% lower -52 7 -67 -46 -43
upper -15 21 -15 -18 -19
Considering the full export case, the following observations regarding the impacts of
main leakage on the previous results:
• The mean flow for catchments lying within the 68% interval is still reduced across
all catchments and across all urbanisation scenarios. However these reductions
are very significantly lower when net mains leakage is taken into account.
• A similar pattern is observed for the Q20 flow statistic. Indeed the upper limit is 1
for all urbanisation scenarios and thus 16% of the catchment either experienced
reductions of less that 1% in Q20 or an increase in the Q20 flow.
• BFI is still increased under all scenarios with the extent of the increase increasing
with the degree of urbanisation. However, the extents of the increases are
smaller for all scenarios demonstrating that the main leakage is maintaining soil
water content and hence the quick flow response of the catchment to effective
precipitation.

21
• Without taking into account mains leakage the impact of urbanisation is to reduce
the Q50 flow statistic across all catchments lying within the 68% interval.
However, taking mains leakage into account the upper limit to the interval are all
negative demonstrating that some catchments within the interval experience an
increase in Q50. However, the lower limit is positive, and twice the magnitude of
the upper limit for all scenarios indicating that the majority of catchments still
experience a decrease in the Q50 for all scenarios. It is interesting to note that
the interval widens as the degree of urbanisation increases but the ratio between
the lower and upper limit remains unchanged indicating a linear simulation
response.
• The most significant impacts are on Q95 flow statistics. When mains leakage is
not considered the model simulates reductions in the Q95 flow across all
catchments lying within the 68% confidence interval for all scenarios. Once mains
leakage is included this pattern is reversed for the Q95 statistic with all
catchments within the interval experiencing increases in the Q95 flow for all
urbanisation scenario. The extent of the increases increase with the scenario. This
is a consequence of the augmentation of base flow by the net import of water
associated with mains leakage. The ratio of the upper and lower limits is also
constant indicating a linear scaling.
Considering the no export case, the following observations regarding the impacts of
main leakage on the previous results:
• The net import of mains leakage equivalent to 162mm/yr of runoff has a very
significant effect on the mean flow statistic for all scenarios. The increases in
mean flow due to enhanced runoff is associated with a higher runoff volume
during events. The impact of the net import of mains leakage will be across
the entire flow regime. The lower intervals for all scenarios are very high,
increasing with the degree of urbanisation.
• The BFI is significantly decreased across all scenarios. However, the 68%
interval limits are very similar to those simulated when the impact of main
leakage is not incorporated. The impact of the net mains leakage is to
therefore to enhance both the quick and slow flow components of the model
thus essentially not additionally modifying the BFI estimate.
• The impact of mains leakage on both the Q20 and the Q50 flow statistic is to
increase the flow statistic for all scenarios with the magnitude of the increase
scaling with the degree of urbanisation.
22
• The Q95 flow statistic is significantly augmented by the mains leakage with
simulated increases in Q95 observed for all scenarios and with the magnitude
of increase increasing with the degree of urbanisation. This contrasts
markedly with the simulation results obtained when main leakage is not taken
into account when decreases in Q95 were simulated across all catchments
within the 68% interval for the 75% and 100% urbanisation scenario.
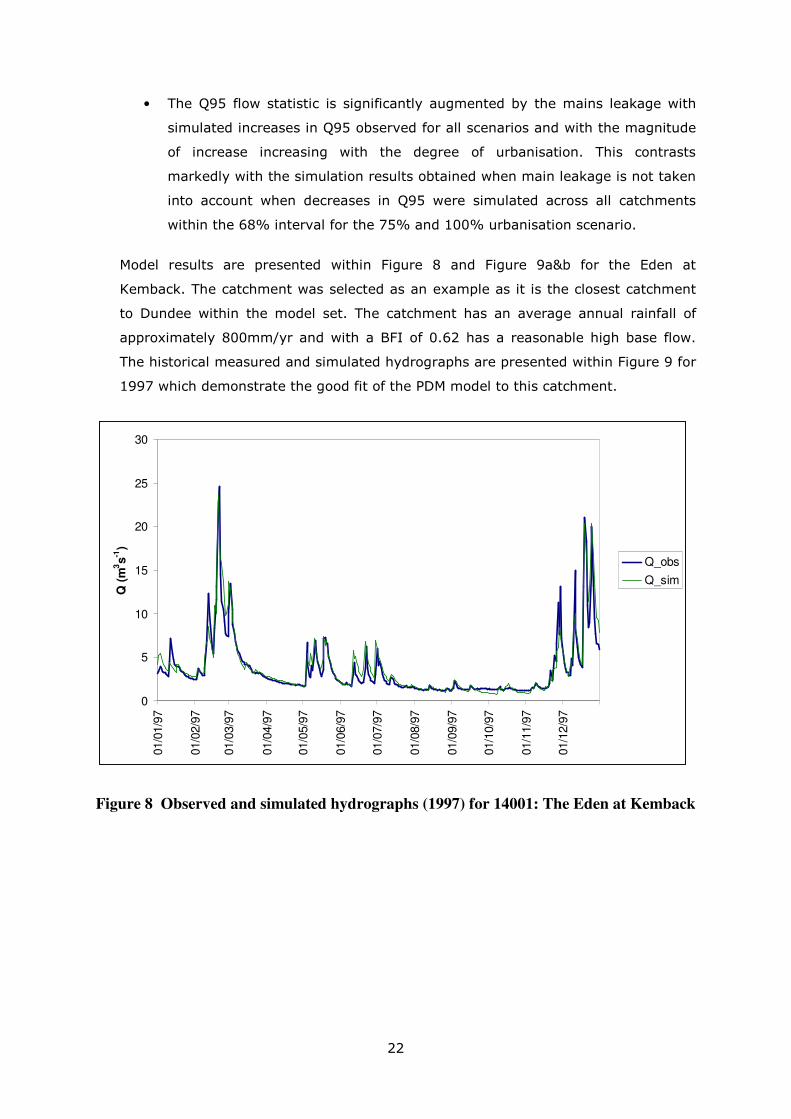
Model results are presented within Figure 8 and Figure 9a&b for the Eden at
Kemback. The catchment was selected as an example as it is the closest catchment
to Dundee within the model set. The catchment has an average annual rainfall of
approximately 800mm/yr and with a BFI of 0.62 has a reasonable high base flow.
The historical measured and simulated hydrographs are presented within Figure 9 for
1997 which demonstrate the good fit of the PDM model to this catchment.
0
5
10
15
20
25
30
01/0
1/9
7
01/0
2/9
7
01/0
3/9
7
01/0
4/9
7
01/0
5/9
7
01/0
6/9
7
01/0
7/9
7
01/0
8/9
7
01/0
9/9
7
01/1
0/9
7
01/1
1/9
7
01/1
2/9
7
Q (
m3s
-1)
Q_obs
Q_sim
Figure 8 Observed and simulated hydrographs (1997) for 14001: The Eden at Kemback

23
0
5
10
15
20
25
30
01/0
1/9
7
01/0
2/9
7
01/0
3/9
7
01/0
4/9
7
01/0
5/9
7
01/0
6/9
7
01/0
7/9
7
01/0
8/9
7
01/0
9/9
7
01/1
0/9
7
01/1
1/9
7
01/1
2/9
7
Q (
m3s
-1)
Q_sim
Q_FE_NL
Q_FE_L
(b) Simulation scenario hydrographs for the full export case (L= leakage, NL=No
Leakage).
0
5
10
15
20
25
30
01/0
1/9
7
01/0
2/9
7
01/0
3/9
7
01/0
4/9
7
01/0
5/9
7
01/0
6/9
7
01/0
7/9
7
01/0
8/9
7
01/0
9/9
7
01/1
0/9
7
01/1
1/9
7
01/1
2/9
7
Q (
m3s
-1)
Q_sim
Q_NE_NL
Q_NE_L
(c) Simulation scenario hydrographs for the no export case (L= leakage, NL=No Leakage).
Figure 9 Scenario simulation hydrographs for 14001: The Eden at Kemback

24
The leakage and no leakage scenario hydrographs for the 75% urbanisation full export
case are presented within Figure 9a together with the historical simulated hydrograph.
The impact of urbanisation on the attenuation of both high flows and low flows in this
catchment can be clearly seen together with the base flow support provided by the
leakage term. This contrasts with the 75% urbanisation no export case (Figure 9b) in
which the simulated enhancement of summer flows through small precipitation events is
clearly shown together with the base flow support offered by net mains leakage.
2.3.2 Relationships between changes in the simulated flow statistics and the
characteristics of the catchment
The previous section presented summary statistics for the changes in flow statistics for
the three urbanisation scenarios across catchments lying within the 68% simulation
interval for each statistic.
This section explores the relationships between changes with the flow statistics for each
catchment and the hydrological characteristics of the catchment. The characteristics
considered are:
• Gauged runoff (RO_OBS) – a measure of how wet the catchments are;
• Catchment area (AREA) – to evaluate whether there are dependencies on
catchment size;
• Gauged Q95 normalised by mean flow (Q95_MF) ; and
• BFI.
In addition to these hydrological descriptors the magnitude of the model interception
parameter was also included to see whether simulated changes in the flow statistics
could be related to the replacement of tall vegetation by urban areas.
This analysis considered the simulation results obtained when net mains leakage was not
included within the model so that the impact of urbanisation on the generation of
effective precipitation could be investigated.
Figure 10 presents a scatter plot matrix of the relationships between the changes within
the target flow statistics and the catchment descriptors for the no export scenario (all
urban runoff retained within the catchment). Each point represents a catchment
outcome.
25
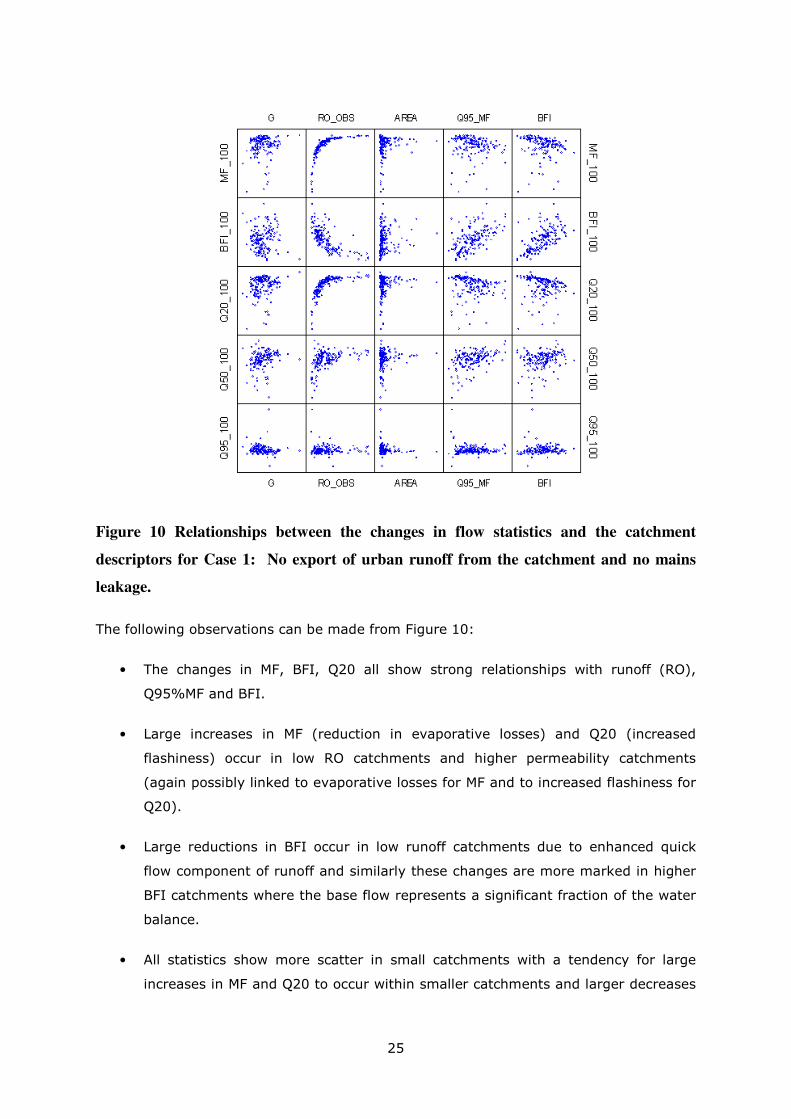
Figure 10 Relationships between the changes in flow statistics and the catchment
descriptors for Case 1: No export of urban runoff from the catchment and no mains
leakage.
The following observations can be made from Figure 10:
• The changes in MF, BFI, Q20 all show strong relationships with runoff (RO),
Q95%MF and BFI.
• Large increases in MF (reduction in evaporative losses) and Q20 (increased
flashiness) occur in low RO catchments and higher permeability catchments
(again possibly linked to evaporative losses for MF and to increased flashiness for
Q20).
• Large reductions in BFI occur in low runoff catchments due to enhanced quick
flow component of runoff and similarly these changes are more marked in higher
BFI catchments where the base flow represents a significant fraction of the water
balance.
• All statistics show more scatter in small catchments with a tendency for large
increases in MF and Q20 to occur within smaller catchments and larger decreases

26
in Q95 to only occur in the smallest catchments (although large increases also
occur within these catchments.
The same scatter plot matrix is presented for Case 2: full export of urban runoff within
Figure 11.
G
MF
_10
0
RO_OBS AREA Q95_MF BFIM
F_
100
BF
I_1
00
BF
I_10
0
Q20_
100
Q20_
100
Q50_
100
Q50
_10
0
G
Q95_
100
RO_OBS AREA Q95_MF BFI
Q95
_10
0
Figure 11 Relationships between the changes in flow statistics and the catchment
descriptors for Case 2: Full export of urban runoff from the catchment and no mains
leakage.
Under full export the following observations can be made:
• The patterns between the changes within the flow statistics and catchment
descriptors are very similar for all three urbanisation scenarios.
• There appears to be little correlation other than between the decreases in mean
flow and (to a lesser extent) Q20 and runoff and the increases in BFI and runoff.
The rationale for these correlations is the same as for the no export scenarios
except the urban runoff is being exported from the catchment resulting in the
reductions in MF Q20, as discussed, and the increases in BFI.
27
• There are no relationships with area for any flow statistic other than the changes
are much more variable in magnitude within small catchments, which may be a
consequence of the much greater homogeneity of soil types and vegetation types
within individual small catchments. Within larger catchments the magnitude of
the changes all appear to be attenuated, which indicated some averaging out of
effects within these catchments.
• The changes in BFI and the flow duration statistics show a correlation with runoff
with smaller increases in BFI and larger reductions in the flow duration statistics
in low runoff catchments, although this is not very clear for changes in the Q95
flow statistic.
• The permeability of the catchment appears to have an influence on the magnitude
of the increase in BFI will smaller increases only tending occur in more
impermeable catchments. Similarly the smaller reductions in Q50 and Q20 tend
to only occur within low permeability catchments.
2.4 Conclusions from the simulation results
The initial focus of the project was on the impacts of urbanisation on the Mean Flow and
Q95 flow statistics. The simulations also consider the BFI, Q20 and Q75 statistics, and
the simulations results for these statistics are presented in detail within section 2.3. For
clarity these conclusions focus on the Q95 and MF statistics.
The simulation analysis considered both the case when precipitation intercepted by drain
network is returned within the catchment and when it is exported from the catchment.
The simulation analysis also evaluated both cases when the import of water through
mains leakage is considered.
2.4.1 The simulated impact of urbanisation on Mean Flow
Considering the impact of urbanisation in the absence of mains leakage, if the urban
runoff is exported from the catchment through the drain network there is a significant
reduction in MF under all urbanisation scenarios with the degree of reduction scaling with
the degree of urbanisation.
Conversely, if the urban runoff is not exported there is a significant increase in MF under
all urbanisation scenarios with the degree of increase scaling with the degree of
urbanisation. This is likely to be a consequence of the reduced evaporation losses within
the urban areas. Evaporation losses are reduced as the urban runoff is not retained

28
within the soil horizons and hence is not made available for evaporation and
furthermore, evaporation from the soil horizons under paved surfaces is likely to be
negligible.
If main leakage is taken into account the mean flow within a catchment is still reduced if
the urban runoff is exported from the catchment, and the reduction scales with the
degree of urbanisation. However these reductions are very significantly lower when net
mains leakage is taken into account.
The net import of mains leakage equivalent to 162mm/yr of runoff, if the urban runoff is
retained within the catchment the additional effect of mains leakage gives rise to very
significant increases in the mean flow statistic for all scenarios (scaling with the degree
of urbanisation). The increase in mean flow due to enhanced urban runoff is associated
with a higher runoff volume during precipitation events. In contrast, the impact of the
net import of mains leakage will be across the entire flow regime.
2.4.2 The simulated impacts of urbanisation on the Q95 flow
Considering the impact of urbanisation in the absence of mains leakage, if the urban
runoff is exported from the catchment through the drain network there is a significant
reduction in the Q95 flow across all urbanisation scenarios (and scaling with the
scenario), which is a consequence of a reduction in the recharge to the unsaturated and
saturated zones within the catchments.
If the urban runoff intercepted by the drain network is returned within the catchment the
impact on the Q95 flows is less marked for all scenarios. For the 50% urbanisation
scenario equal numbers of catchments demonstrate increases and decreases in Q95. The
number showing decreases in Q95 is more marked for the 75% urbanisation case and
the 100% urbanisation case. The implication is that whilst urbanisation has an impact on
recharge if the urban runoff is not exported this is offset by a certain extent at low flows
by reductions in evaporation and the direct routing of a fraction of the precipitation
depth within summer events to stream flow. This summer precipitation would have
otherwise not formed runoff due to soil moisture deficits within the catchment.
If main leakage is taken into account catchments generally experience increases in the
Q95 flow for all urbanisation scenarios. The extent of the increases in Q95 scale with the
urbanised extent within a catchment. This is a consequence of the augmentation of base
flow by the net import of water associated with mains leakage.

29
Considering the case when the urban runoff is not exported from a catchment, the Q95
flow statistic is significantly augmented by the mains leakage with simulated increases in
Q95 observed for all scenarios and with the magnitude of increase increasing with the
degree of urbanisation. This contrasts markedly with the simulation results obtained
when main leakage is not taken into account.
The simulation modelling has considered a range of urbanisation scenarios and looked at
simulation patterns across a large set of catchments. As a general rule the magnitude of
the impact on the MF for a given scenario is more significant within drier catchments as
a greater fraction of the water balance is being modified. The patterns for the Q95
statistic are not clear. For all statistics considered there is much greater variability within
small catchments within the dataset used, this is probably a consequence of the greater
variation in soils and land cover between small catchments.
The simulation modelling work has used catchment models to explore the potential
impacts of urbanisation on the catchment water balance and low flows. The modelling
work suggests that urbanisation will increase the Q95 flow statistic and will increase the
MF flow statistic if the urban runoff is retained within the catchment. If the urban runoff
is not retained within the catchment the catchment mean flow is likely to be lower than
the natural mean flow. The magnitude of the changes in the flow statistics will depend
on the following local conditions:
• the degree to which urban runoff captured by the drain network is exported from
the catchment;
• how dry the catchment is;
• the urban extent within the catchment;
• the balance between mains leakage and sewer interception within the catchment;
and
• the soils and land cover of the catchment, if the catchment is small.
In practice the patterns between catchments, particularly sub-5km2 catchments will vary
markedly.

30
3 A comparison of the simulation results with the
detection of the influence of urbanisation on
long term gauged flow records within England
and Wales.
This section presents a summary of an analysis of the impact of urbanisation on flow
duration statistics within gauged catchments used within the England and Wales version
of Low Flows Enterprise. Scottish gauged catchments were not considered within the
analysis as there are no gauged catchments within the Scottish version of LowFlows
Enterprise with significant urban extents.
This analysis was conducted by WHS as part of our internal research and development
programme within Low Flows and hence does not formally form part of the deliverables
for the current project. The analysis considered 23 gauged catchments with an
urban/suburban extent of more than 25%, the median extent was 40% and the
catchment with the largest extent was 58% urbanised. Of the catchments 15 lie within
the Thames and Lee catchments, 2 lie within Essex, 2 within the Trent catchment, one in
Hampshire and the remaining three catchment lie within the North East of England.
The LowFlows methodology makes no provision for the impacts of urbanisation when
predicting Q95%MF. However, when predicting within these 23 catchments in practice
other urbanised catchments with similar soils and geology are preferentially selected
from the ROI pool and the prediction results are essentially unbiased. The reason for this
is that the urban catchments tend to be located in geographical clusters around the
major conurbations and the because of relatively low spatial gradients in HOST class
distributions they tend, within a cluster to have similar HOST characteristics.
To test whether urbanisation is having an effect on the Q95%MF Jack knife estimates of
Q95%MF were generated for these catchments using the ROI pool for England and Wales
without the 23 catchments included in the pool. The ratio of the observed Q95%MF to
the jack knifed Q95%MF estimate plotted as a function of the percentage urban extent
within Figure 12. The catchments are grouped according to the dominant HOST class
within the catchment.

31
Figure 12 The ratio of gauged Q96%MF to jack knifed LowFlows Enterprise estimates
of Q95%MF generated using an ROI pool excluding urban catchments for 23 urbanised
catchments.
A ratio of unity or greater indicates that the estimate utilising flow statistics from urban
catchments is higher than the estimate based upon catchments with no urban. The
figure shows that 18 out of the 23 catchments have a ratio of greater than 1 indicating
that within these catchments the impact of urbanisation is to increase the noramalised
low flows. It should be noted that the scatter includes both the potential impacts of
urbanisation and the uncertainty in the natural LowFLows Enterprise estimate relating to
pooling group membership. However, given the natural prediction uncertainty for the
predictions of Q95%MF within LowFLows Enterprise has a Factorial Standard Error
(f.s.e.) 1.37, all of the Q95%MF ratios that are larger than 1.37 and less than 0.7 are
signficant in the context of detecting the impact of urbanisation.
Considering the different HOST classes, all the catchments dominated by HOST 25
(impermebale soft massive clays) are above a ratio of 1 with the exception of 39098
(The River Pinn at Uxbridge). The Pinn drains through west London and has a very low
value of Q95%MF and thus the natural estimate, irrespective of the influence of

32
urbanisation is sensitive to variations in pooling group membership. HOST 21 and 24
(both dominated by impermeable shales and mudestones) show a similar pattern to the
clay catchments but with a less marked effect, which may be attributable to these
catchments being wetter and hence any import of water associated with water supply
and leakage will be a smaller fraction of the water balance.
In contrast the signal is less clear for catchment containing a high extent of HOST class
3 (soft, permeable sandstones). Within these catchments the Q95%MF ratio is relatively
close to unity and while three out of the four catchment dominated by HOST3 have
Q95%MF ratios less than unity all lie within the prediction uncertainty for the natural
flow estimates. On possible explaination for this is that the low flows are higher within
these higher storage catchments and thus the impact of urbanisation is a smaller
fraction of the water balance at low flows.
In summary, the impact of urbanisation, and the associated import of water, is to
elevate low flows within the dry, clay catchment ofsouth east England. The effect is less
pronounced in wetter impermeable catchments and more pemeable catchments as
within these catchment the potential urban component will be a smaller fraction of the
water balance at low flows.
Drawing comparisons with the outcomes of the simulation results presented within
section 2, these observations show an increase in the Q95 statistics that is
commensurate for the wetter catchments and significantly greater for the drier clay
catchments. These clay catchments are drier than the majority of the catchment used
within the simulation work.

33
4 Hydrometric monitoring in Dundee and the
detection of the impacts of urbanisation on low
flows within the Dundee and Glasgow
catchments.
4.1 Catchment selection and instrumentation
4.1.1 Rationale
The research programme required the establishment of a number of gauging stations on
small, urban watercourses in order to provide an empirical evidence base for the
development of existing methods of estimating flows. It was proposed to select sites in
Dundee for this purpose. These could be selected within a small geographical area,
thereby offering resource efficiencies in the required fieldwork, and further efficiencies
through close proximity to project personnel.
It was agreed that the sites to be adopted should conform as closely as possible to the
following:
• >50% urban
• <5 km2 catchment area
4.1.2 Sites selected
After reviewing all urban watercourses in the Dundee and Perth areas, three Dundee
watercourses were agreed for monitoring and subsequent analysis. Their catchment and
site characteristics are detailed in Table 3 and Table 4.
Table 3: Hydrological characteristics derived from LowFlows Enterprise
Catchment Outfall
Easting
Outfall
Northing
Catchment
Area (km2)
Mean annual
precipitation
(mm)
Potential
Evaporation
(mm)
Mean
annual
runoff
(mm)
Base
Flow
Index
Lochee 335151 731774 6.826 724 520 336.8 0.584

34
Burn
Gelly Burn 340446 733088 4.684 737 519 359.9 0.521
Whitfield
Burn
344903 733350 2.201 717 524 295.8 0.571
Table 4: Catchment descriptions
Catchment Catchment notes Site notes
Lochee Burn Eastern (largest) part of catchment is
heavily developed and burn is entirely
hidden below ground. Western part is
separately drained - separate tributary
joins Lochee Burn below ground. CSO
discharge apparent.
Natural control
immediately d/s of
emergence from culvert
system.
Gelly Burn Upper catchment is golf course and
woodland. Drains through SUDS ponds
on entry to urban fringe, then entirely
culverted for c.2km. CSO discharges
apparent. About 120m vertically from
top to bottom of catchment. Lowest
part of catchment also golf course.
Site provided by vehicle
bridge in municipal golf
course. Natural control.
Whitfield Burn Lower catchment developed mostly in
past 10 years (approx). SUDS features
expected to be prominent. Scarcely any
culverting. Urban lower catchment and
otherwise mostly arable farmland.
Site is at face of culvert
under road. Control
provided by grille on u/s
face of culvert. Some
risk of changes in control
caused by drifting debris
getting stuck, but regular
monitoring will allow this
effect to be controlled.
35
The selections were made on the basis of:
� catchment characteristics satisfying the required criteria;
� expected hydrometric performance;
� site security in relation to possible vandalism; and
� access
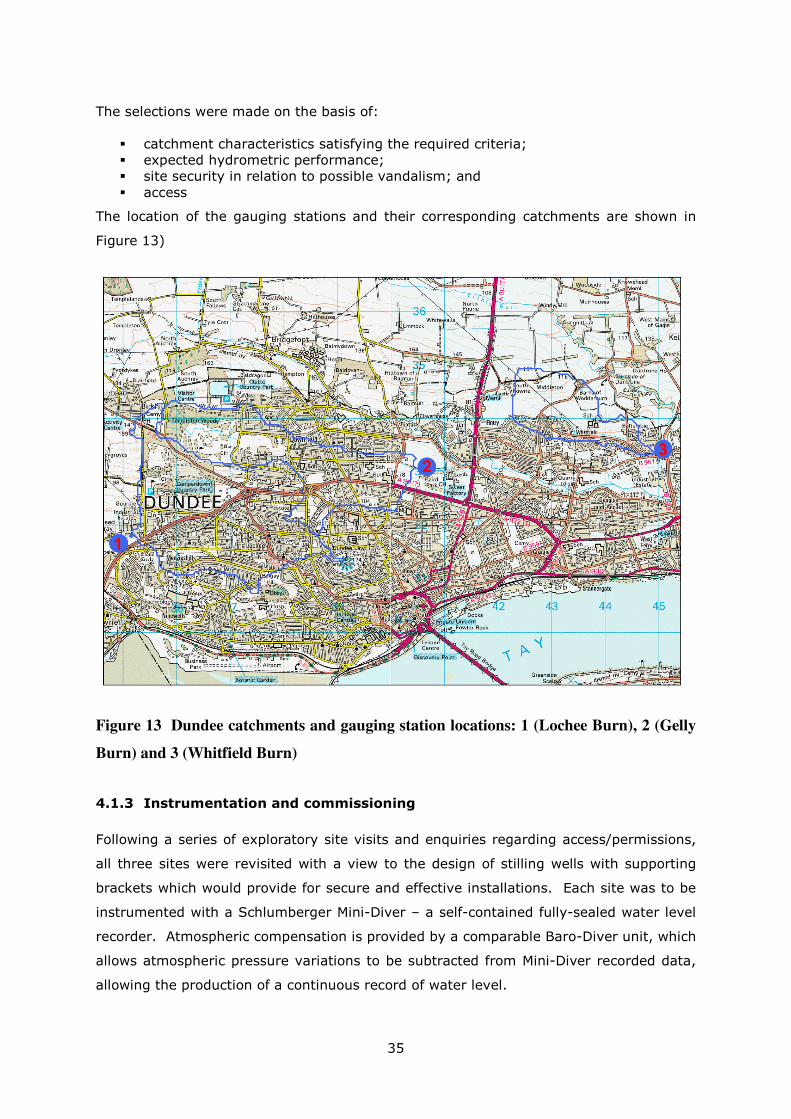
The location of the gauging stations and their corresponding catchments are shown in
Figure 13)
Figure 13 Dundee catchments and gauging station locations: 1 (Lochee Burn), 2 (Gelly
Burn) and 3 (Whitfield Burn)
4.1.3 Instrumentation and commissioning
Following a series of exploratory site visits and enquiries regarding access/permissions,
all three sites were revisited with a view to the design of stilling wells with supporting
brackets which would provide for secure and effective installations. Each site was to be
instrumented with a Schlumberger Mini-Diver – a self-contained fully-sealed water level
recorder. Atmospheric compensation is provided by a comparable Baro-Diver unit, which
allows atmospheric pressure variations to be subtracted from Mini-Diver recorded data,
allowing the production of a continuous record of water level.

36
Stilling wells were designed and constructed to be highly resistant to vandalism. Each
was constructed from galvanised steel tube, with spars welded to the rear according to
the availability of suitable supporting materials at each site, allowing a strong fixing at a
minimum of six points of contact at each site. Each well was at least 1 m in length, and
fitted with a security-fixed cap which could be opened only by a bespoke design Allen
key. The Mini-Diver was suspended from the inside of the cap at each well.
Experience with Mini-Divers at other sites had shown these units to be robust,
dependable and capable of delivering precise records of water level.
4.2 Gauge Operation and data quality assurance
All three sites were fully set-up and equipment commissioned on 4 September 2008.
Loggers were set to record water levels at 15 minute intervals as per normal
hydrometric practice.
Photographs of the three completed installations are shown in Figure 14. Flow
measurement sections were identified within close proximity of each of the three sites,
with all measurement to be undertaken by wading gauging only. A Braystoke Electro-
Magnetic current meter was assigned for this purpose, and was ideally suited to the low
depth and low velocity conditions which were anticipated. A pattern of normally weekly
gaugings was established.
(a) Gelly Burn (b) Lochee Burn (c) Whitfield Burn
Figure 14 Hydrometric installations

37
For each weekly visit, the following were all routinely done:
� Stage board reading on arrival
� Photograph water level against stage-board
� Download Mini-Diver
� Download Baro-Diver
� Check data
� Flow gauging
� Stage board reading on departure
� Add gauging results to gauging plot
� Back up data
Over the first three weeks of visits, in addition, a repeat gauging was done to check
repeatability of results. This was judged prudent with a new member of staff responsible
for the fieldwork, and was discontinued once it became clear that dependable results
were being achieved. Two principal activities were undertaken for each site:
� Checking of recorded water levels against stage board readings
� Checking of gaugings for consistency
Checking of stage records against stage board readings produced some significant
inconsistencies at all three sites. Considerable effort has gone into this, and has taken a
considerable amount of time given apparently multiple factors interacting, making
progress difficult within a relatively short study period.
The stage boards were verified as remaining soundly fixed through the period and
remained as providing the reference level for comparisons with recorded level and flow
gaugings at each site.
Discrepancies between the variation of water levels shown in compensated Mini-Diver
data and stage board readings remained. Weekly or more frequent readings of level
allowed detailed assessment of these anomalies. Anomalies were examined in relation
to atmospheric pressure, temperature and time in order to identify patterns. A ratchet
effect was observed, such that stages after a peak tended not to return to pre-event
levels even after periods of a week. It was also observed that discrepancies tended to
occur either side of a Mini-Diver download even though the exact replacement of the unit
at the same level could be demonstrated: such discrepancies could be both steps up and
steps down with time.
Investigations to eliminate the measurement of atmospheric pressure by the Baro-Diver
as a potential source of the errors identified data from a privately-operated weather
38
station operating continuously at a site on Perth Road, Dundee, by Professor Geoff
Barton. These data were verified against those from Dundee Airport and as measured
using a superior instrument to the Baro Diver were used for compensating the Divers
stages.
After considerable further investigation, it was ascertained that these steps in stage
could be accounted for by the deposition and removal of fine sediment onto/off pressure
sensors, almost certainly associated with combined sewer overflow events within the
catchment. Accordingly, stage corrections were made using stage board observations
and the timing of suspect rises in recorded level, such that each resultant hydrograph
was consistent with all corresponding stage board readings. In this process, the
availability of photographs to verify water levels was invaluable.
After an initial period of operation and data review, it was agreed with SEPA that the
Whitfield Burn site should be discontinued on account of excess volatility of observed
water levels. While some backwater effect had been anticipated from the control
structure immediately downstream, the occurrence of the autumn leaf fall and the major
coincident flux of fine sediment (presumably from upstream ploughed fields or building
operations) proved to have a major and unacceptable effect on recorded levels.
Whitfield data are not taken forward for analysis.
4.3 Results
Gaugings were taken weekly, as noted above. Rating plots for the two remaining sites
are presented below in Figure 15 and Figure 16 respectively. Equations given in captions
were obtained by minimising root mean squared error for observed vs. rated flow.
39
Lochee Burn
0.00
0.01
0.02
0.03
0.04
0.05
0.06
0.07
0.00 0.01 0.02 0.03 0.04 0.05 0.06 0.07
Stage (m)
Dis
ch
arg
e (
m3s
-1)
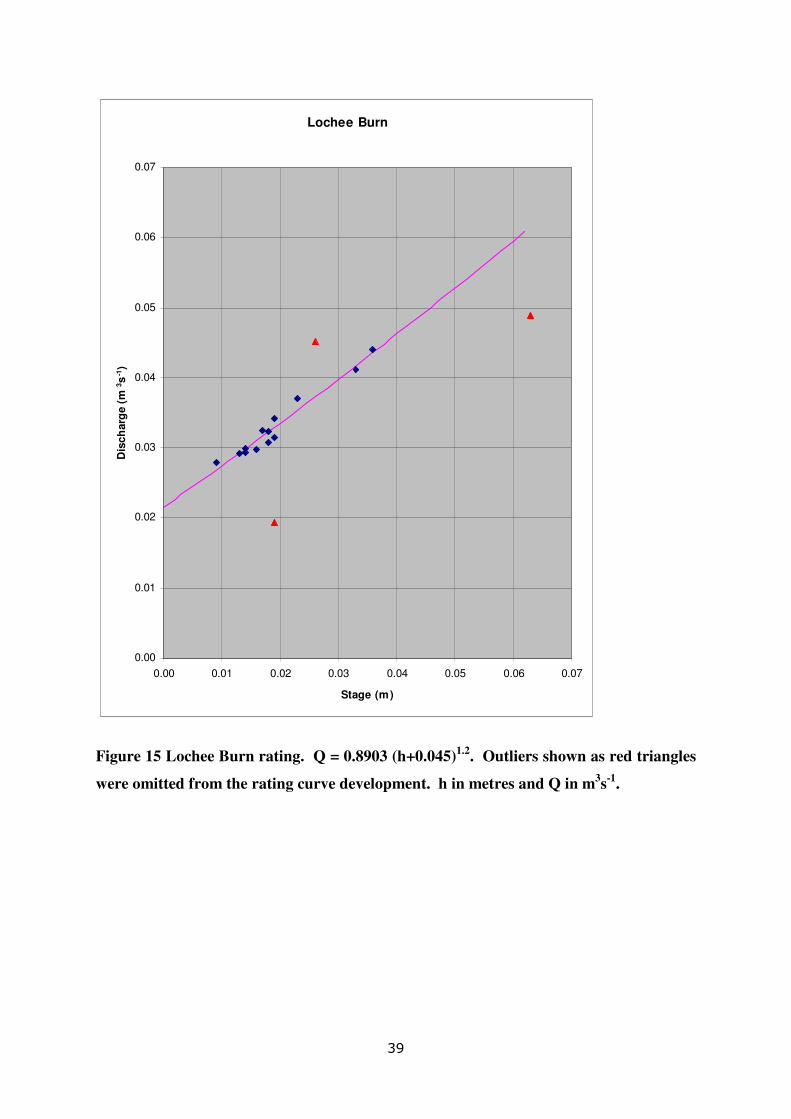
Figure 15 Lochee Burn rating. Q = 0.8903 (h+0.045)1.2
. Outliers shown as red triangles
were omitted from the rating curve development. h in metres and Q in m3s
-1.
40
Gelly Burn
0.000
0.001
0.002
0.003
0.004
0.005
0.006
0.007
0.00 0.02 0.04 0.06 0.08 0.10 0.12 0.14 0.16 0.18
Stage (m)
Dis
ch
arg
e (
m3s
-1)
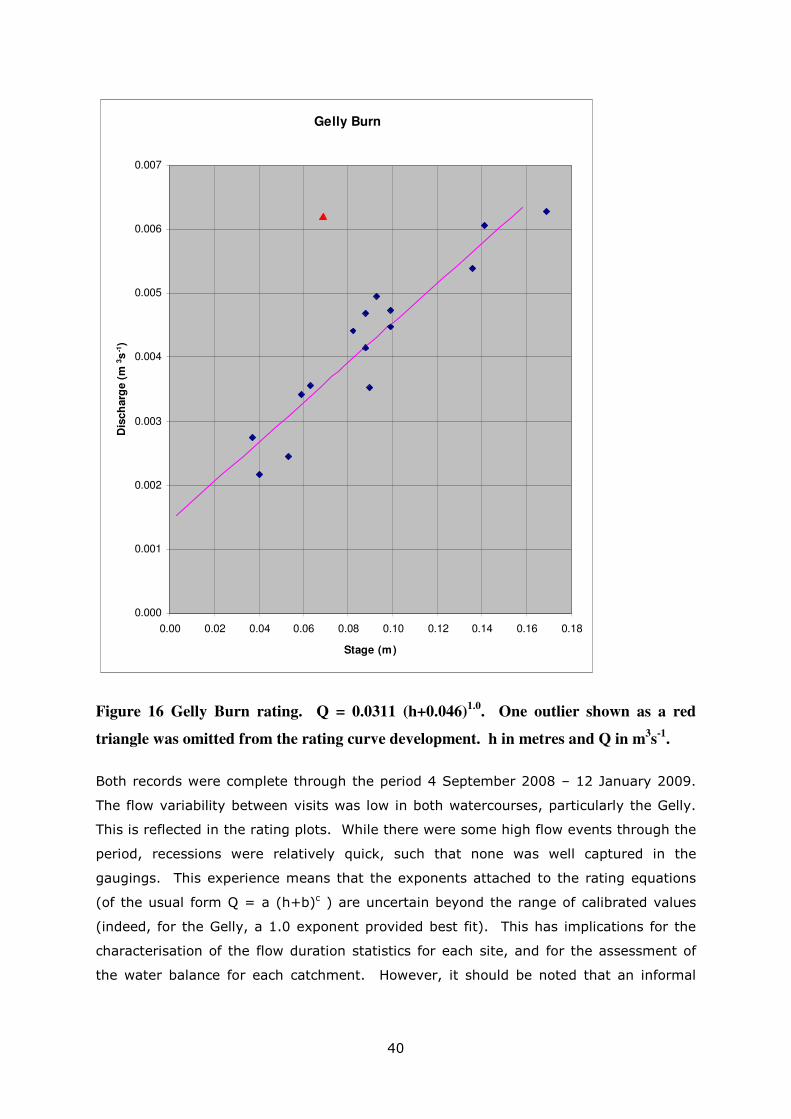
Figure 16 Gelly Burn rating. Q = 0.0311 (h+0.046)1.0
. One outlier shown as a red
triangle was omitted from the rating curve development. h in metres and Q in m3s
-1.
Both records were complete through the period 4 September 2008 – 12 January 2009.
The flow variability between visits was low in both watercourses, particularly the Gelly.
This is reflected in the rating plots. While there were some high flow events through the
period, recessions were relatively quick, such that none was well captured in the
gaugings. This experience means that the exponents attached to the rating equations
(of the usual form Q = a (h+b)c ) are uncertain beyond the range of calibrated values
(indeed, for the Gelly, a 1.0 exponent provided best fit). This has implications for the
characterisation of the flow duration statistics for each site, and for the assessment of
the water balance for each catchment. However, it should be noted that an informal

41
sensitivity assessment of the rating exponent used for the Gelly site showed the total
runoff to be highly insensitive to the exponent for values 1.0<c<1.5.
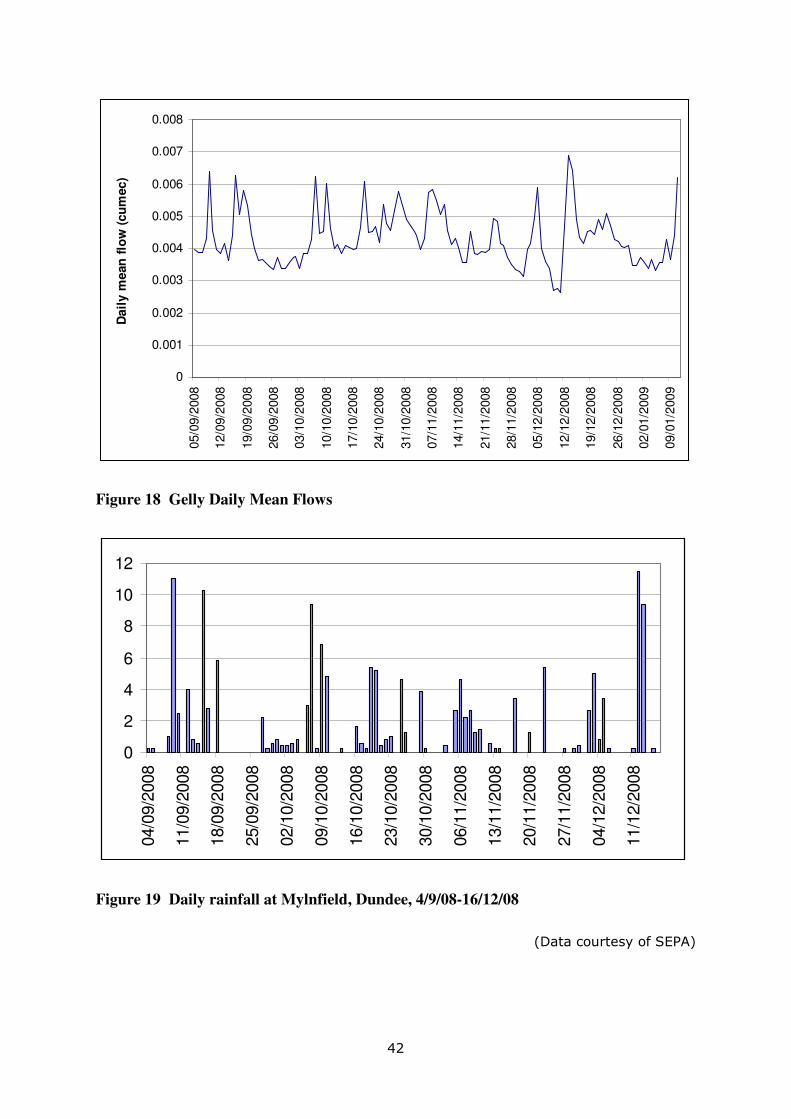
The resultant hydrographs are shown in Figure 17 and Figure 18. Both are characterised
by restricted ranges of flows. The minimum flows are asynchronous, occurring in
October for the Lochee Burn and December for the Gelly Burn. Neither catchment
exhibits any extended period of recession, which is unsurprising given the rainfall
patterns (Figure 19).
0
0.01
0.02
0.03
0.04
0.05
0.06
0.07
05/0
9/2
008
12/0
9/2
008
19/0
9/2
008
26/0
9/2
008
03/1
0/2
008
10/1
0/2
008
17/1
0/2
008
24/1
0/2
008
31/1
0/2
008
07/1
1/2
008
14/1
1/2
008
21/1
1/2
008
28/1
1/2
008
05/1
2/2
008
12/1
2/2
008
19/1
2/2
008
26/1
2/2
008
02/0
1/2
009
09/0
1/2
009
Dail
y m
ean
flo
w (
cu
mec)
Figure 17 Lochee Daily Mean Flows
42
0
0.001
0.002
0.003
0.004
0.005
0.006
0.007
0.008
05/0
9/2
008
12/0
9/2
008
19/0
9/2
008
26/0
9/2
008
03/1
0/2
008
10/1
0/2
008
17/1
0/2
008
24/1
0/2
008
31/1
0/2
008
07/1
1/2
008
14/1
1/2
008
21/1
1/2
008
28/1
1/2
008
05/1
2/2
008
12/1
2/2
008
19/1
2/2
008
26/1
2/2
008
02/0
1/2
009
09/0
1/2
009
Dail
y m
ean
flo
w (
cu
mec)
Figure 18 Gelly Daily Mean Flows
0
2
4
6
8
10
12
04/0
9/2
008
11/0
9/2
008
18/0
9/2
008
25/0
9/2
008
02/1
0/2
008
09/1
0/2
008
16/1
0/2
008
23/1
0/2
008
30/1
0/2
008
06/1
1/2
008
13/1
1/2
008
20/1
1/2
008
27/1
1/2
008
04/1
2/2
008
11/1
2/2
008
Figure 19 Daily rainfall at Mylnfield, Dundee, 4/9/08-16/12/08
(Data courtesy of SEPA)
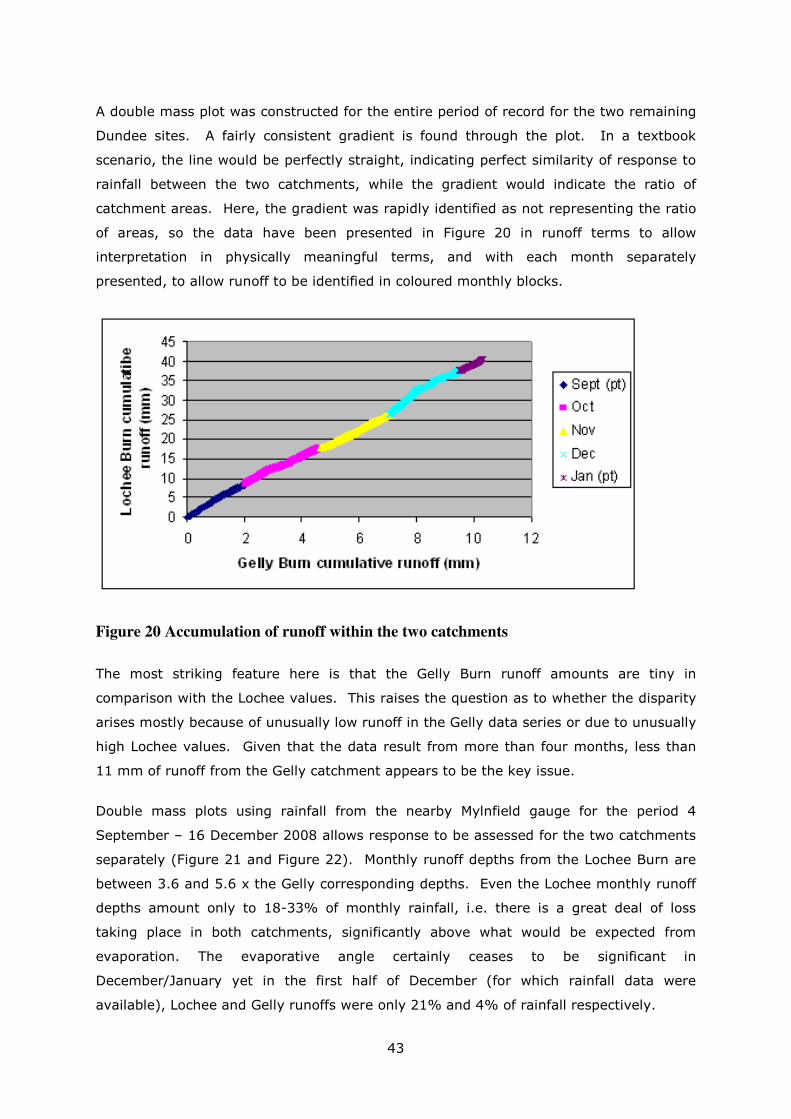
43
A double mass plot was constructed for the entire period of record for the two remaining
Dundee sites. A fairly consistent gradient is found through the plot. In a textbook
scenario, the line would be perfectly straight, indicating perfect similarity of response to
rainfall between the two catchments, while the gradient would indicate the ratio of
catchment areas. Here, the gradient was rapidly identified as not representing the ratio
of areas, so the data have been presented in Figure 20 in runoff terms to allow
interpretation in physically meaningful terms, and with each month separately
presented, to allow runoff to be identified in coloured monthly blocks.
Figure 20 Accumulation of runoff within the two catchments
The most striking feature here is that the Gelly Burn runoff amounts are tiny in
comparison with the Lochee values. This raises the question as to whether the disparity
arises mostly because of unusually low runoff in the Gelly data series or due to unusually
high Lochee values. Given that the data result from more than four months, less than
11 mm of runoff from the Gelly catchment appears to be the key issue.
Double mass plots using rainfall from the nearby Mylnfield gauge for the period 4
September – 16 December 2008 allows response to be assessed for the two catchments
separately (Figure 21 and Figure 22). Monthly runoff depths from the Lochee Burn are
between 3.6 and 5.6 x the Gelly corresponding depths. Even the Lochee monthly runoff
depths amount only to 18-33% of monthly rainfall, i.e. there is a great deal of loss
taking place in both catchments, significantly above what would be expected from
evaporation. The evaporative angle certainly ceases to be significant in
December/January yet in the first half of December (for which rainfall data were
available), Lochee and Gelly runoffs were only 21% and 4% of rainfall respectively.
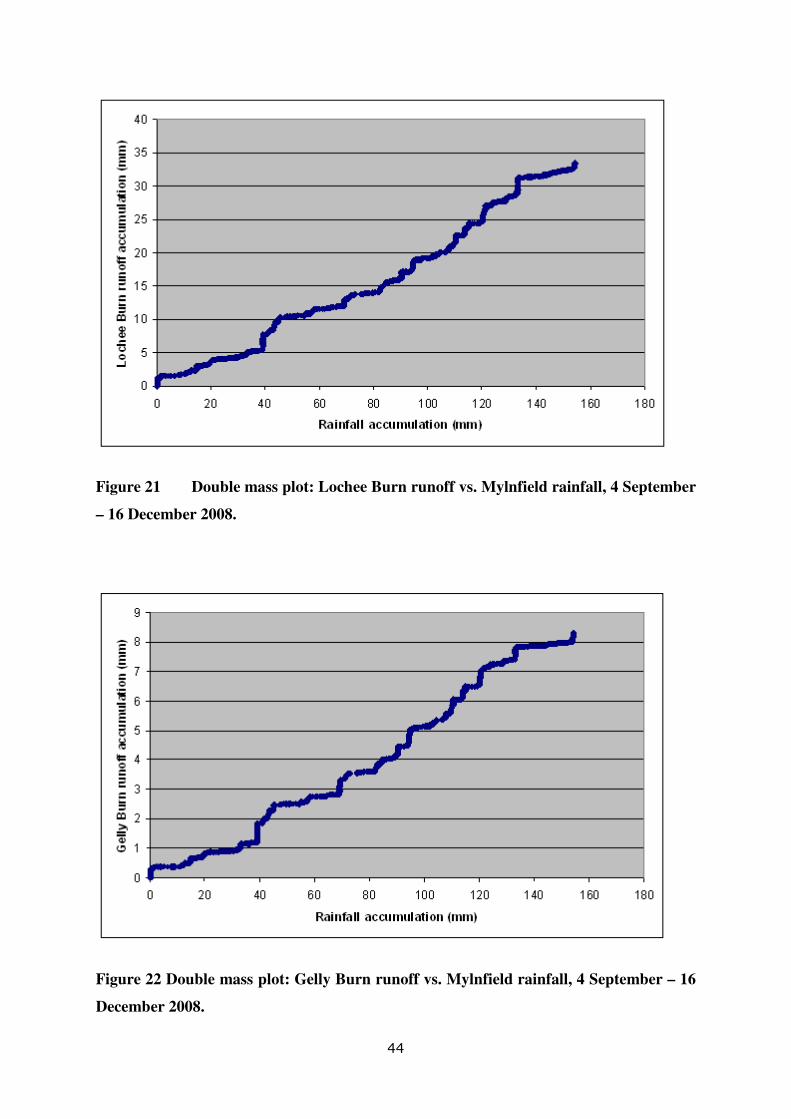
44
Figure 21 Double mass plot: Lochee Burn runoff vs. Mylnfield rainfall, 4 September
– 16 December 2008.
Figure 22 Double mass plot: Gelly Burn runoff vs. Mylnfield rainfall, 4 September – 16
December 2008.

45
4.4 Selection of analogues and assignment of flow percentiles
SEPA’s analogue catchment selector tool was used to select analogue catchments for the
Lochee and Gelly catchments. The object of using analogue sites was to assess recorded
flows in the context of longer-term flow behaviour for a nearby site at which flows were
monitored over the same period. The analogue selector selected gauge 14002 Dighty
Water at Balmossie Mill as rank #1 for both catchments, with three catchments tied in
second rank position. The Balmossie Mill gauge is located approximately 5km away from
the Dundee catchments and experience has demonstrated that the flows would be highly
covariant with natural flows at the gauged locations.
A flow comparator tool developed by WHS was used to compare the study catchments’
hydrology (based on daily mean flows) with that of the preferred analogue, the
Balmossie catchment. The tool was used to extract matching site-flow and analogue
percentile pairs for each site. This obtained daily flow percentile values for the analogue
catchment for each day of operation of the study sites. To facilitate comparison with the
flow regime of the analogue, the tool plots the flows within each catchment, normalised
by the mean over the period of measurement as a function of flow percentile. For the
analogue this will yield the FDC over the range of observed flow percentiles. If the site is
totally covariant and has an identical hydrological behaviour to the analogue, the flow
plot for the site would coincide with that for the analogue. Figure 23 clearly shows that
this assumption does not hold for either catchment, and that both Dundee urban
catchments appear to respond to rainfall in a highly asynchronous way to the analogue
and that the flow regimes are dominated by a fairly constant base flow. At flows above
Q30 the urban flows are lower than those for the analogue while for flow below Q30 the
flows are higher. This is consistent with the visual interpretation of a suppressed
response to rainfall and a maintained base flow. It is important to note that the
monitoring period does not include low flows but the evidence points towards the
normalised low flows being very significantly higher than the normalised low flows within
the corresponding analogue catchment. While not reported, this behaviour was also
observed for the other analogues.

46
Normalised flows
0.000
0.500
1.000
1.500
2.000
2.500
3.000
3.500
0 10 20 30 40 50 60
P(x)
q(x
) Analogue
Lochee
Normalised flows
0.000
0.500
1.000
1.500
2.000
2.500
3.000
3.500
0 10 20 30 40 50 60
P(x)
q(x
) Analogue
Gelly
Figure 23 Normalised Flow-Percentile plots for the Lochee and Gelly Burns
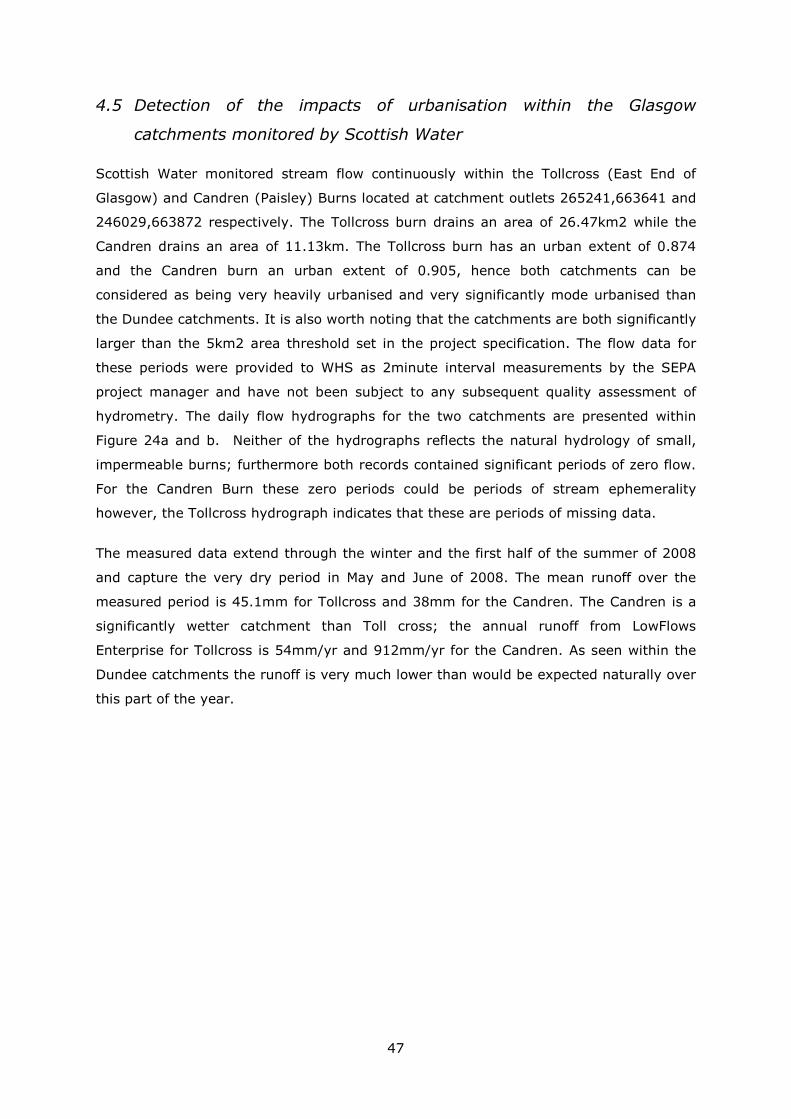
47
4.5 Detection of the impacts of urbanisation within the Glasgow
catchments monitored by Scottish Water
Scottish Water monitored stream flow continuously within the Tollcross (East End of
Glasgow) and Candren (Paisley) Burns located at catchment outlets 265241,663641 and
246029,663872 respectively. The Tollcross burn drains an area of 26.47km2 while the
Candren drains an area of 11.13km. The Tollcross burn has an urban extent of 0.874
and the Candren burn an urban extent of 0.905, hence both catchments can be
considered as being very heavily urbanised and very significantly mode urbanised than
the Dundee catchments. It is also worth noting that the catchments are both significantly
larger than the 5km2 area threshold set in the project specification. The flow data for
these periods were provided to WHS as 2minute interval measurements by the SEPA
project manager and have not been subject to any subsequent quality assessment of
hydrometry. The daily flow hydrographs for the two catchments are presented within
Figure 24a and b. Neither of the hydrographs reflects the natural hydrology of small,
impermeable burns; furthermore both records contained significant periods of zero flow.
For the Candren Burn these zero periods could be periods of stream ephemerality
however, the Tollcross hydrograph indicates that these are periods of missing data.
The measured data extend through the winter and the first half of the summer of 2008
and capture the very dry period in May and June of 2008. The mean runoff over the
measured period is 45.1mm for Tollcross and 38mm for the Candren. The Candren is a
significantly wetter catchment than Toll cross; the annual runoff from LowFlows
Enterprise for Tollcross is 54mm/yr and 912mm/yr for the Candren. As seen within the
Dundee catchments the runoff is very much lower than would be expected naturally over
this part of the year.

48
Daily Mean Flow Hydrograph of Tollcross Burn
0
0.05
0.1
0.15
0.2
0.25
0.3
07-Feb 03-Mar 28-Mar 22-Apr 17-May 11-Jun 06-Jul
Date
Dail
y M
ean
Flo
w (
m3/s
)
(a)
Daily Mean Flow Hydrograph of Candren Burn
0
0.1
0.2
0.3
0.4
0.5
0.6
12-Feb 03-Mar 23-Mar 12-Apr 02-May 22-May
Date
Dail
y M
ean
Flo
w (
m3/s
)
(b)
Figure 24 2008 Flow Hydrographs for the Scottish Water Glasgow catchments

49
Using the SEPA analogue catchment selector tool the Auchengeich gauge was selected as
an analogue for the Tollcross burn and the Hawkhead gauge was selected as an
analogue for the Candren burn. The WHS flow comparator tool was used to repeat the
analogue catchment analysis for the two burns and the normalised FDC derived are
presented within Considering the Tollcross catchment, the form of the normalised FDC is
very similar to that seen within the Dundee catchments with little relationship between
the flows and those within the natural analogue catchment. As with the Dundee
catchments the base flows are maintained above the natural levels.
In contrast, the high flows within the Candren catchment tally with high flows in the
analogue catchment and the catchment appears, from the reported data, to be dry at
low flows. As discussed, the results from the Candren catchment have to be treated with
caution as there is no differentiation between zero flows and missing data within the
data files supplied and, furthermore, there were no stage data supplied to enable this to
be investigated further.
Normalised flow duration curves for the two catchments, together with the selected
analogues are presented within Figure 25 a and b. These figures demonstrate that the
flows within the analogue catchments extend down to the Q99 flow during the dry May
and June of 2008.
Considering the Tollcross catchment, the form of the normalised FDC is very similar to
that seen within the Dundee catchments with little relationship between the flows and
those within the natural analogue catchment. As with the Dundee catchments the base
flows are maintained above the natural levels.
In contrast, the high flows within the Candren catchment tally with high flows in the
analogue catchment and the catchment appears, from the reported data, to be dry at
low flows. As discussed, the results from the Candren catchment have to be treated with
caution as there is no differentiation between zero flows and missing data within the
data files supplied and, furthermore, there were no stage data supplied to enable this to
be investigated further.
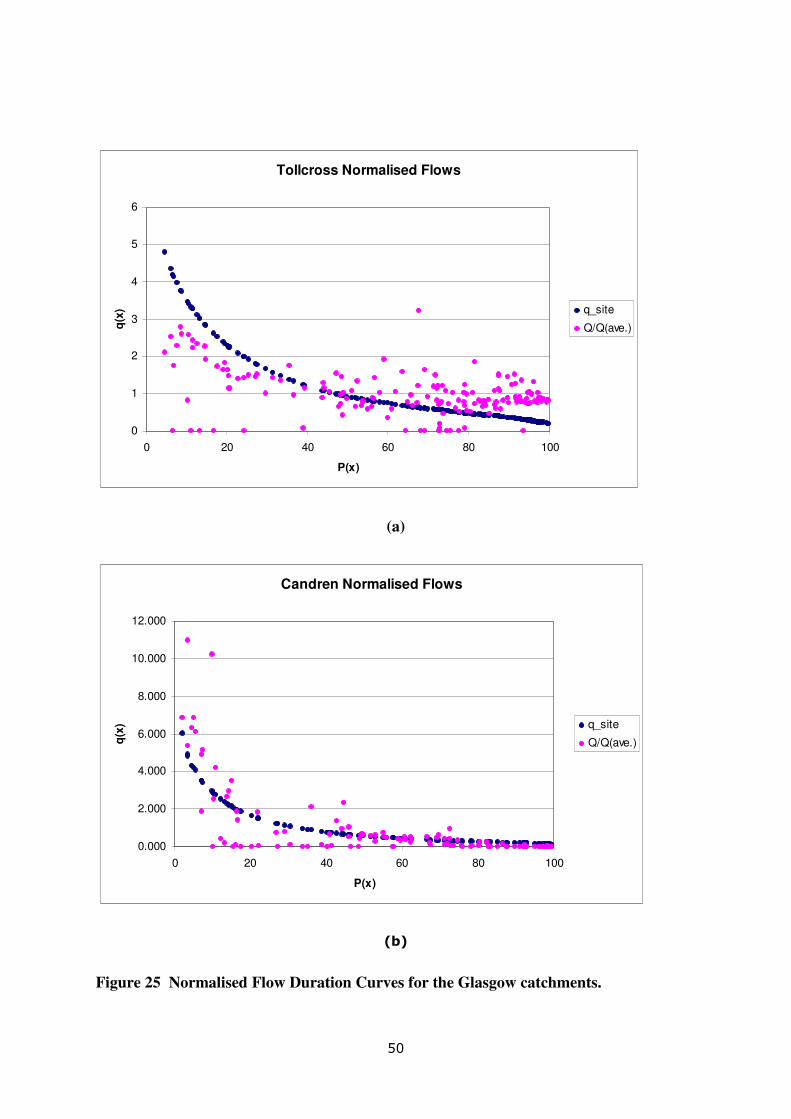
50
Tollcross Normalised Flows
0
1
2
3
4
5
6
0 20 40 60 80 100
P(x)
q(x
) q_site
Q/Q(ave.)
(a)
Candren Normalised Flows
0.000
2.000
4.000
6.000
8.000
10.000
12.000
0 20 40 60 80 100
P(x)
q(x
) q_site
Q/Q(ave.)
(b)
Figure 25 Normalised Flow Duration Curves for the Glasgow catchments.

51
4.6 Summary
The monitoring data show that the runoff in both Dundee catchments is significantly
lower than would be expected from the equivalent natural catchment within a similar
climatic regime. Inspection of the hydrographs demonstrates that the flow regimes are
dominated by a fairly constant base flow with a relatively small number of rainfall driven
events. The base flow is significantly greater than that would be expected from natural
catchments of this type. The overall runoff accumulation is also very much lower than
would be expected from catchments of this type and the events that do occur are
thought to be associated with combined sewer discharges. On the basis of this evidence
it would indicate that nearly all the quick runoff within the catchments is captured by the
drain network and exported from the catchment but that the base flows are supported,
possibly by mains leakage. The base flows certainly equate to the same order of
magnitude of runoff that the net leakage based on Scottish Waters planning figures
indicate.
The results from the Tollcross catchment in Glasgow are very similar to the results
observed within the Dundee catchment. In contrast, while the runoff from the Candren
Paisley catchment is very much suppressed the catchment appears to be ephemeral, as
discussed this may be real or it may be an artefact of the hydrometry within the Glasgow
catchments.

52
5 Conclusions and definition of a method for
estimating mean flow and Q95 within small
urbanised catchments
5.1 Scientific Conclusions
This report presents an in depth assessment of the potential impacts of urbanisation on
both low flows and the mean flow based upon three independent approaches:
1. Simulation based scenario modelling using a deterministic rainfall runoff model
(section 2);
2. A data based investigation of prediction within significantly urbanised catchments
using the LowFlows software (section 3); and
3. Analysis of short record continuous monitoring campaigns within two catchments
in Dundee and two catchments in the Glasgow area (section 4).
The simulation modelling, based on urbanisation scenario modelling within a large
catchment dataset, considered both the direct impacts of urbanisation on runoff (through
capture of precipitation by the drain network) and the influence of mains leakage on
base flow. Based on planning figures provided by Scottish Water, main leakage can be a
very significant component of the urban water balance. The scenario modelling
considered the case where the drain network discharges above the point of interest and
the case where the discharge is below the point of interest. In the absence of mains
leakage the simulation modelling typically indicated significant reductions in mean flow
and the Q95 flow if the drain water is exported from the catchment and small increases
in mean flow and small reductions in Q95 if the drain water is retained within the
catchment. When leakage is taken into account within the scenario, the impact of
urbanisation is to elevate low flows. The magnitude of the increase is higher if the drain
water is retained within the catchment and scales with the urbanised extent. If mains
leakage is taken into account then typically mean flows are lower if the drain water is
exported from the catchment and higher if the drain water is retained within the a
catchment.
The data based assessment of the predictive performance of LowFlows within urbanised
catchments supports the outcomes of the simulation modelling results and demonstrates
that urbanisation is likely to result in an increase in low flows. The increases are very

53
significant in dry impermeable catchments and not significant in wetter, groundwater
dominated catchments. In interpreting these results it should be borne in mind that the
urbanised catchments investigated are all significantly larger than the sub-5km2
threshold set for this project.
The results from the Dundee monitoring studies indicate that the base flows within small
urbanised catchments are significantly higher than the natural flows that might be
expected within these catchments. Although it should be recognised that in the Dundee
catchments the monitoring period did not include summer flows because of the project
timescales. Conversely, mean flows are likely to be very much reduced when compared
with the expected natural runoff patterns but with significant variation between
catchments.
The results from the Tollcross catchment in Glasgow confirm the results observed within
the Dundee catchment over very low flow conditions. In contrast, while the runoff from
the Candren Paisley catchment is very much suppressed the catchment appears to be
ephemeral, as discussed this may be real or it may be an artefact of the hydrometry
within the Glasgow catchments.
In summary, the balance of evidence provided by the scientific investigations reported,
indicates that base flows within urban catchments are maintained or elevated by mains
leakage with this support more than offsetting any loss of recharge associated with the
capture of precipitation by the surface water drain network. However, if the drain
network discharges below the point of interest then the overall water balance is very
significantly reduced resulting in a reduction in mean flow.
5.2 A method for estimating the impact of urbanisation on the Q95 and
Mean Flow statistics
In interpreting the scientific findings results it should be remembered that estimating the
impact of urbanisation on the low regime within small urban catchments is uncertain and
is complicated by:
• the degree to which the reduced recharge within the urban area is augmented by
mains leakage; and
• whether the drains are effluent within the catchment.
Population density and mains leakage vary significantly across Scotland and the planning
figures used within the simulation aspects of the study cannot be relied on to provide

54
evidence of base flow support in a site specific assessment. Furthermore, the evidence
from the monitoring data in small urban catchments suggests that the actual flow regime
may vary significantly from the expected natural regime. The scope of the study was
also restricted to considering the potential impacts of urbanisation on the water balance
and has not considered the potential impacts of culverting on the hydrology of small
burns. These effects will be very site specific and not amenable to a desk based
evaluation.
SEPA as the environmental regulatory body in Scotland has the responsibility to ensure
discharge has sufficient dilution and, therefore, will adopt a precautionary approach for a
desk based assessment. Hence SEPA will use the results from the “full export and no
leakage” modelling scenario as the basis for adjusting natural flow statistics for the
impacts of urbanisation. This represents a worst case scenario and as such is
precautionary.
Figure 26a and Figure 26b present the median and 68% confidence interval for Q95 and
MF percentage reductions factors as a function of the degree of urbanisation. The
relationships are linear and have been extrapolated down to an urbanised extent of
25%. It is recommended that these factors are used to reduce the predictions of natural
MF and Q95 within a desk based assessment. It is recommended that LowFlows natural
estimates are used within the assessment as they are likely to be lower error estimates
that the corresponding Report 101 estimates.
It is recommended that the reduction factors replace the SEPA composite method
currently used within small urban catchments to reduce Q95. Hitherto the SEPA methods
have not adjusted the MF statistic. The impact on MF of the simulation scenario selected
by SEPA to form the basis of the method is greater than the equivalent impact on the
Q95 statistic. It is, therefore, recommended that this statistic is adjusted in future
assessments.
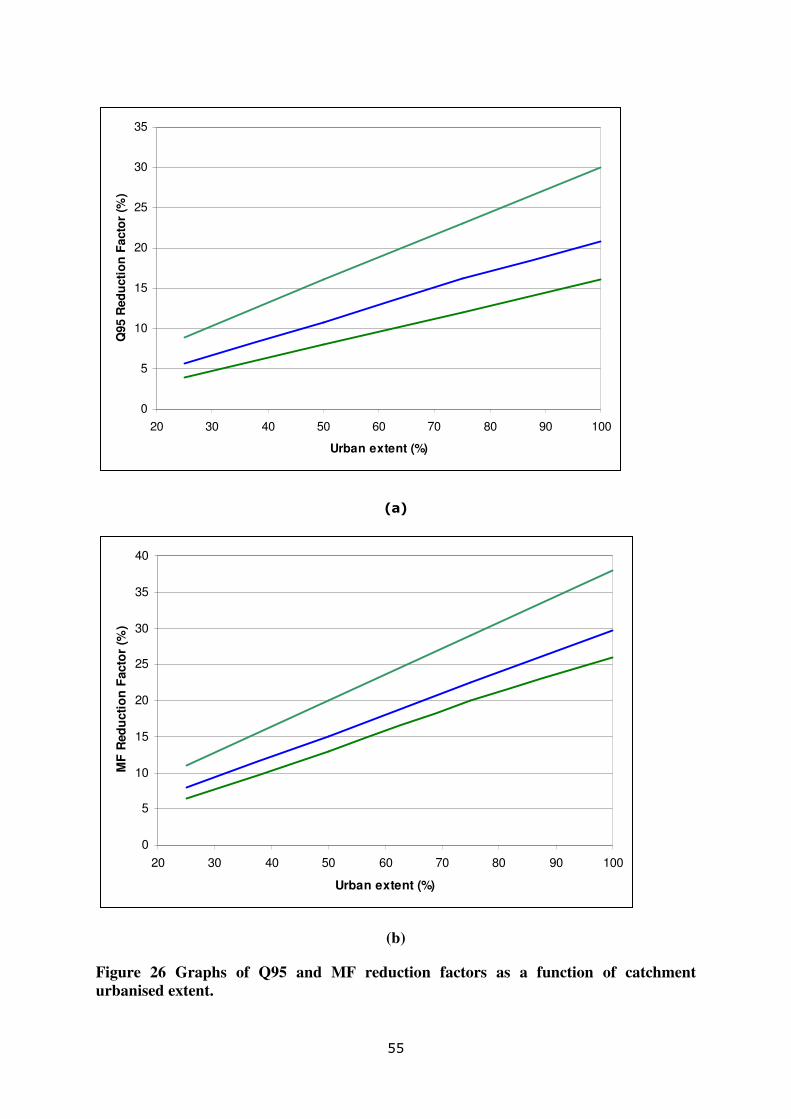
55
0
5
10
15
20
25
30
35
20 30 40 50 60 70 80 90 100
Urban extent (%)
Q95 R
ed
ucti
on
Facto
r (%
)
(a)
0
5
10
15
20
25
30
35
40
20 30 40 50 60 70 80 90 100
Urban extent (%)
MF
Red
ucti
on
Facto
r (%
)
(b)
Figure 26 Graphs of Q95 and MF reduction factors as a function of catchment
urbanised extent.
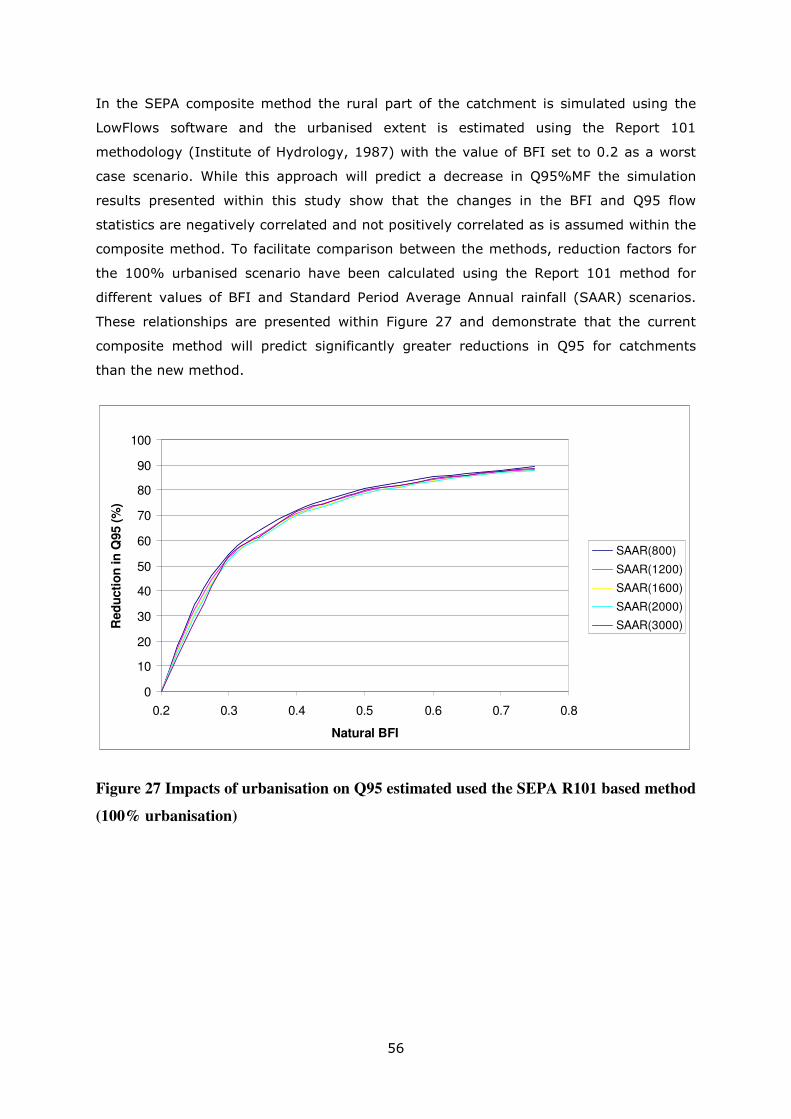
56
In the SEPA composite method the rural part of the catchment is simulated using the
LowFlows software and the urbanised extent is estimated using the Report 101
methodology (Institute of Hydrology, 1987) with the value of BFI set to 0.2 as a worst
case scenario. While this approach will predict a decrease in Q95%MF the simulation
results presented within this study show that the changes in the BFI and Q95 flow
statistics are negatively correlated and not positively correlated as is assumed within the
composite method. To facilitate comparison between the methods, reduction factors for
the 100% urbanised scenario have been calculated using the Report 101 method for
different values of BFI and Standard Period Average Annual rainfall (SAAR) scenarios.
These relationships are presented within Figure 27 and demonstrate that the current
composite method will predict significantly greater reductions in Q95 for catchments
than the new method.
0
10
20
30
40
50
60
70
80
90
100
0.2 0.3 0.4 0.5 0.6 0.7 0.8
Natural BFI
Red
ucti
on
in
Q95 (
%)
SAAR(800)
SAAR(1200)
SAAR(1600)
SAAR(2000)
SAAR(3000)
Figure 27 Impacts of urbanisation on Q95 estimated used the SEPA R101 based method
(100% urbanisation)

57
6 Recommendations for further work
We would recommend the following:
Urban flow regimes for small burns differ markedly from the expected natural regime
and many influences on flows are likely to be site specific. We strongly recommend that
a period of at least 12 months monitoring of stream flow is undertaken to support high
value decision making.
It is recommended that monitoring within the Dundee catchments is maintained in the
future by SEPA subject to funding. Any monitoring of flows should be accompanied by a
water quality monitoring programme to observe chemical tracers that are associated
with urban development. This should include the sanitary determinands as a tracer for
combined sewer overflows and a tracer compound such as salt, the heavy metals or a
hydrocarbon that will be associated with runoff from the urban catchment surface. This
chemistry information will be invaluable in determining the runoff processes within urban
catchments.
We would also recommend an extended spot monitoring campaign of small urbanised
burns under summer low flow conditions to further ascertain the base flow of these
water courses under low flow conditions.

58
7 References
Armstrong R.J. 1996. Modelling dry weather flow. WaPUB User Note No. 33. 6pp.
www.wapug.org.uk
Bayliss, A.C. 1999. Volume 5: Catchment descriptors. Flood Estimation Handbook.
Institute of Hydrology.
Bayliss, A.C., Black, K.B., Fava-Verde, A. and Kjeldsen, T.R. 2007. URBEXT2000 - A new
FEH catchment descriptor: Calculation, dissemination and application. Defra/EA R&D
Technical Report FD1919/TR. Defra, London, 49pp.
Brilly, M., Rusjan, S., Vidmar, A. 2006. Monitoring the impact of urbanisation on the
Glinscica stream. Physics and Chemistry of the Earth 31(17) 1089-1096.
Chormanski, J., Voorde, T.V., Batelaan, O., and Canters, F. 2008. Improving Distributed
Runoff Prediction in Urbanized Catchments. Sensors, 8, 910-932.
Chow, V.T., Maidment, D.R. and Mays, L.W. 1988. Applied Hydrology. McGraw-Hill
Publishing Co., New York.
Crooks, S., Naden, P., Broadhurst, P., and Gannon, B. 1996. Modelling the flood
response of large catchments: initial estimates of the impacts of climate and land use
change. Report to Ministry of Agriculture, Fisheries and Food. 69pp.
Crooks, S. M.; Naden, P. S. 2007 CLASSIC: a semi-distributed rainfall-runoff modelling
system. Hydrology and Earth System Sciences, 11 (1). 516-531.
Department of Environment. 1981. Design and analysis of urban storm drainage – the
Wallingford Procedures, 4 Volumes, Standing Technical Committee Reports 28-31,
National Water Council.
General Register Office for Scotland. 2008. http://www.gro-
scotland.gov.uk/statistics/publications-and-data/small-area-population-
estimates/index.html
Institute of Hydrology 1987. Report 101: Low Flow Estimation in Scotland. pp28.
Hall, M.J. 1984. Urban Hydrology. Elsevier. Applied Science Publishers Ltd, Essex.
59
Kjeldsen, 2008. Modelling the impact of urbanisation of flood runoff volumes. Submitted
to Water Management.
Lim, K.J., Engel, B.A., Tanga, Z., Muthukrishnan, S., Choi J. and Kim K. 2006. Effects of
calibration on L-THIA GIS runoff and pollutant estimation. Journal of Environmental
Management. 78 (1) 35-43.
Littlewood, I.G. and Jakeman, A.J. 1994. A new method of rainfall-runoff modelling and
its applications in catchment hydrology. Environmental Modelling Volume II 143-171.
Edited by P. Zanetta. Computational Mechanicals Publication, Southampton.
Maksimovic, C. and Tucci, C. 2001. Urban drainage in specific climates. Urban drainage
in humid tropics, Volume I. IHP – V, Technical documents in hydrology UNESCO, Paris,
40, 227pp.
Marsalek, J., Jimenez-Cisneros, B.E., Malmquist, P.A., Karamouz, M., Goldenfum, J., and
Chocat, B. 2006. Urban water cycle processes and interactions. International
Hydrological Programme. Technical Documents in Hydrology No. 78.
Moore, R.J. 1985. The probability-distributed principle and runoff production at point
basin scales. Hydrol. Sci. J., 30 273-297.
Naden, P., Crooks, S., and Broadhurst, P. 1996. Impact of climate and land use change
on the flood response of large catchments. Proc. 31st MAFF Conference of river and
coastal engineers. 2.1.1-2.1.16.
Packman, J.C. 1980. The effects of urbanisation on flood magnitude and frequency. IH
Report No 63. Institute of Hydrology, Wallingford.
Perry, T., and Nawaz, R. 2008. An investigation into the extent and impacts of hard
surfacing of domestic gardens in an area of Leeds, United Kingdom. Landscape and
Urban Planning, 86 1-13.
Ragab, R., Rosier, P., Dixon, A., Bromley, J. and Cooper J. D. 2003. Experimental study
of water fluxes in a residential area: 2. Road infiltration, runoff and evaporation.
Hydrological Processes 17 (12) 2423 – 2437.
Shaw, E.M. 1983. Hydrology in practice. Second Edition. Stanley Thornes Ltd,
Cheltenham.

60
Thomson, N., Barrie, I.A., and Ayles, M. 1982. The Meteorological Office Rainfall and
Evaporation Calculations System: MORECS. Hydrological Memorandum No. 45, Met
Office, Bracknell.
Urban Pollution Management Manual. 1998. 2nd Edition. Foundation for Water Research.
Whitford, V. Ennos, A.R. and Handley J.F. 2001. “City form and natural process”—
indicators for the ecological performance of urban areas and their application to
Merseyside, UK. Landscape and Urban Planning. 57 (2) 91-103.
Wohl, E (2000). Inland flood hazards. Cambridge University Press, Cambridge.