Flow Cytometric Evaluation of Platelet Disorders - NASCOLA Platelet Function... · Flow Cytometric...
55
Flow Cytometric Evaluation of Platelet Disorders Dong Chen MD PhD Special Coagulation Laboratory Division of Hematopathology Mayo Clinic
Transcript of Flow Cytometric Evaluation of Platelet Disorders - NASCOLA Platelet Function... · Flow Cytometric...
Flow Cytometric Evaluation of Platelet Disorders
Dong Chen MD PhDSpecial Coagulation Laboratory
Division of HematopathologyMayo Clinic
DISCLOSURE
•
Relevant Financial Relationship(s)None
•
Off Label UsageNone
Objectives
•
The Concept of Flow Cytometry
•
Applications of Flow Cytometry in Platelet Function Testing
•
Applications of Flow Cytometry in Other Coagulation Testing

The Concept of Flow Cytometry
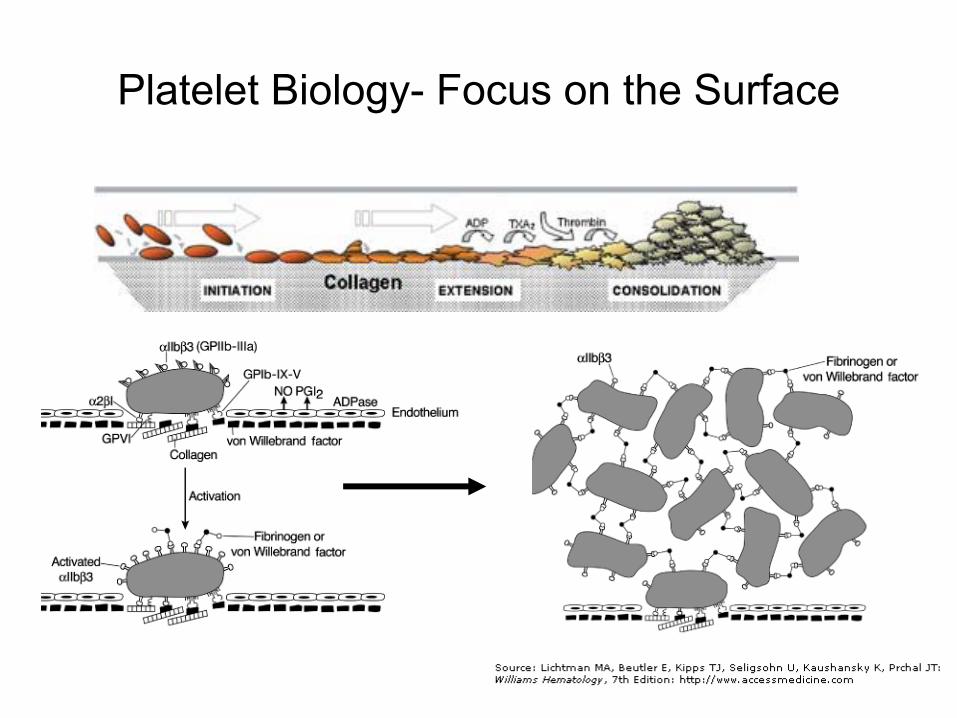
Platelet Biology-
Focus on the Surface
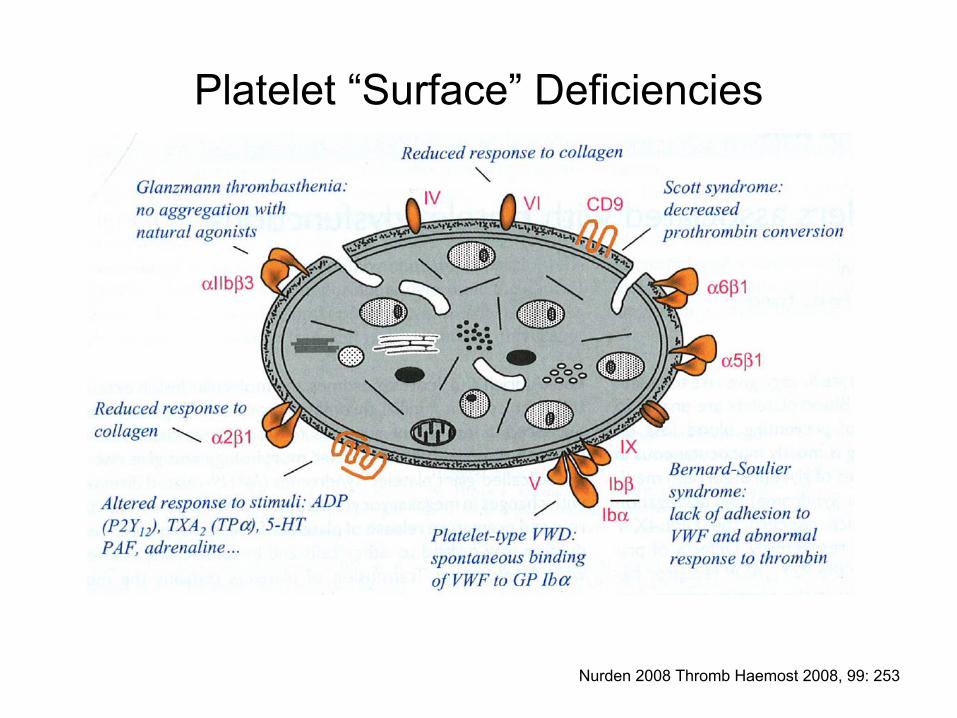
Platelet “Surface”
Deficiencies
Nurden
2008 Thromb
Haemost
2008, 99: 253
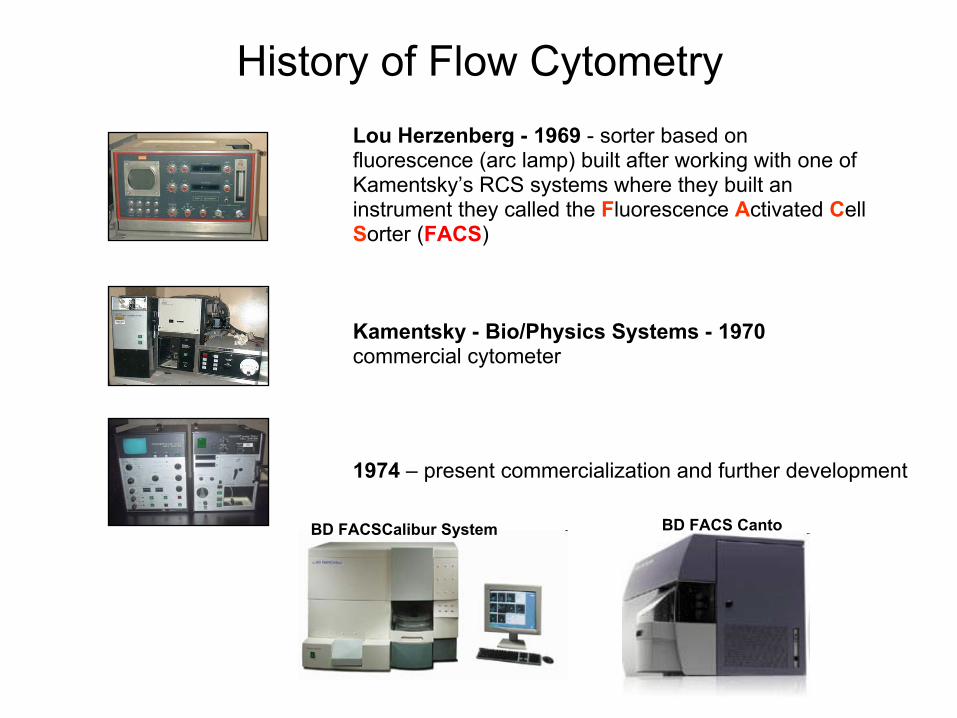
Lou Herzenberg -
1969
-
sorter based on fluorescence (arc lamp) built after working with one of Kamentsky’s
RCS systems where they built an instrument they called the Fluorescence Activated Cell Sorter (FACS)
Kamentsky
-
Bio/Physics Systems -
1970
commercial cytometer
1974
–
present commercialization and further development
BD FACSCalibur
System BD FACS Canto
History of Flow Cytometry
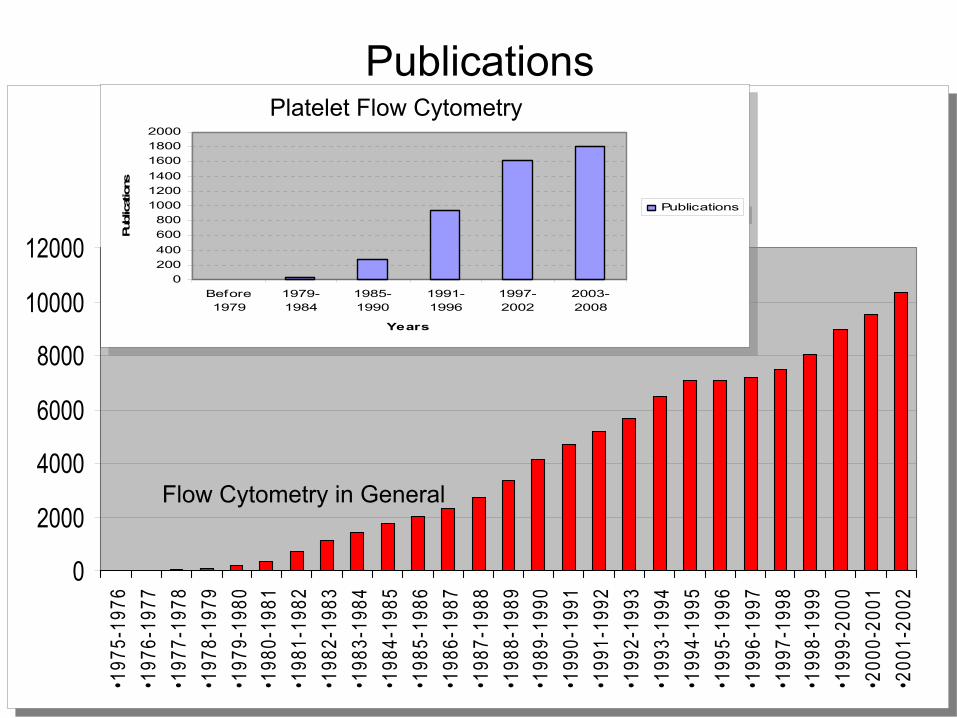
Publications
0
2000
4000
6000
8000
10000
12000
•197
5-19
76•1
976-
1977
•197
7-19
78•1
978-
1979
•197
9-19
80•1
980-
1981
•198
1-19
82•1
982-
1983
•198
3-19
84•1
984-
1985
•198
5-19
86•1
986-
1987
•198
7-19
88•1
988-
1989
•198
9-19
90•1
990-
1991
•199
1-19
92•1
992-
1993
•199
3-19
94•1
994-
1995
•199
5-19
96•1
996-
1997
•199
7-19
98•1
998-
1999
•199
9-20
00•2
000-
2001
•200
1-20
02
Publications
0200400600800
100012001400160018002000
Before1979
1979-1984
1985-1990
1991-1996
1997-2002
2003-2008
Years
Publ
icat
ions
Publications
Publications
0200400600800
100012001400160018002000
Before1979
1979-1984
1985-1990
1991-1996
1997-2002
2003-2008
Years
Publ
icat
ions
Publications
Flow Cytometry in General
Platelet Flow Cytometry

Diagnosing Platelet Abnormalities by Flow Cytometry
Disease Deficiency Testing by Flow CytometryGlycoprotein (GP) Abnormality:Glanzmann thrombastheniaBernard-Soulier syndromePlatelet-type VWDCollagen receptor deficiencyWiskott-Aldrich syndrome
GP IIb-IIIaGP Ib-V-IXGP IbGP Ia-IIa
& GP IVCD43
Thromb
Res.
1992;67(4):457-66.Haematologica.
1989;74:39-44.
Thromb
Res.
1992 Jan 15;65(2):165-76.Flow on lymphocytes
Abnormal Granules:Storage pool deficiencyGray platelet syndrome
Delta-granuleAlpha-granule
Br J Haematol. 1995 Jan;89(1):117-23. J Clin
Invest. 1991 Mar;87(3):919-29.
Abnormal Signal Transduction:Platelet receptor defects (congenital or acquired)Defects in arachidonic acid metabolismDefects in PLC and Calcium responsiveness
P2Y12 ADP receptor (VASP)COXPLC and Ca2+
Thromb
Haemost. 1999 Sep;82(3):1145-52.
Cytometry B Clin
Cytom. 2008 Mar;74(2):110-7Cytometry. 1988 Mar;9(2):138-42.
Abnormal Procoagulant ActivityScott syndromeMicroparticle
ProcoagulantProcoagulant
Blood. 1993 May 15;81(10):2554-65. Thromb
Res. 1996 Jun 15;82(6):509-22.
Other Acquired ConditionsHITITP
Anti-Heparin/PF4Platelet Binding Ig
Cytometry B Clin
Cytom. 2004 Mar;58(1):32-8. Am J Clin
Pathol. 1987 Apr;87(4):518-22.

Principles of Flow Cytometry
YYYY
YY
Platelet Flow Cytometry Tests
•
Glycoprotein Profile
•
Platelet Function Analysis

YY YY
YYYY
YY
YY
YYYY
YYYY
YY
YY
YY
YY
YY
YYYY
YY
Platelet Glycoprotein Profiles

Early Examples in Literature
Unaffected Carrier Patient
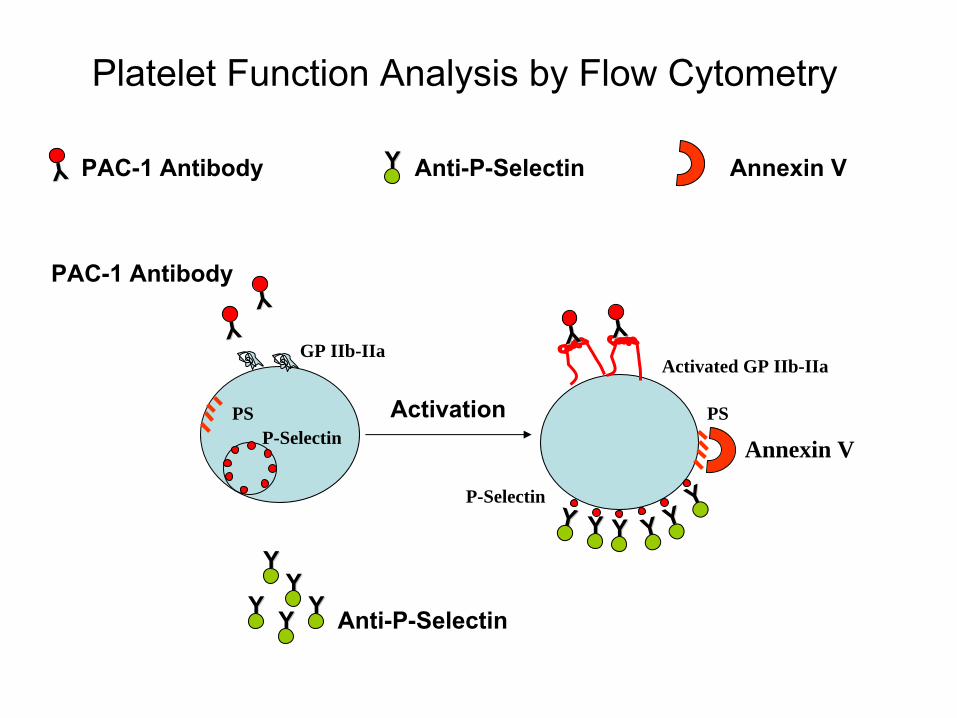
Platelet Function Analysis by Flow Cytometry
YY
YY YY YY YY YYYY
YYYYYYYY
P-Selectin
Activated GP IIb-IIaYYYY
YYYY
Anti-P-Selectin
PAC-1 Antibody
Activation
GP IIb-IIa
P-SelectinPS PS
Annexin V
YYYYPAC-1 Antibody Anti-P-Selectin Annexin
V
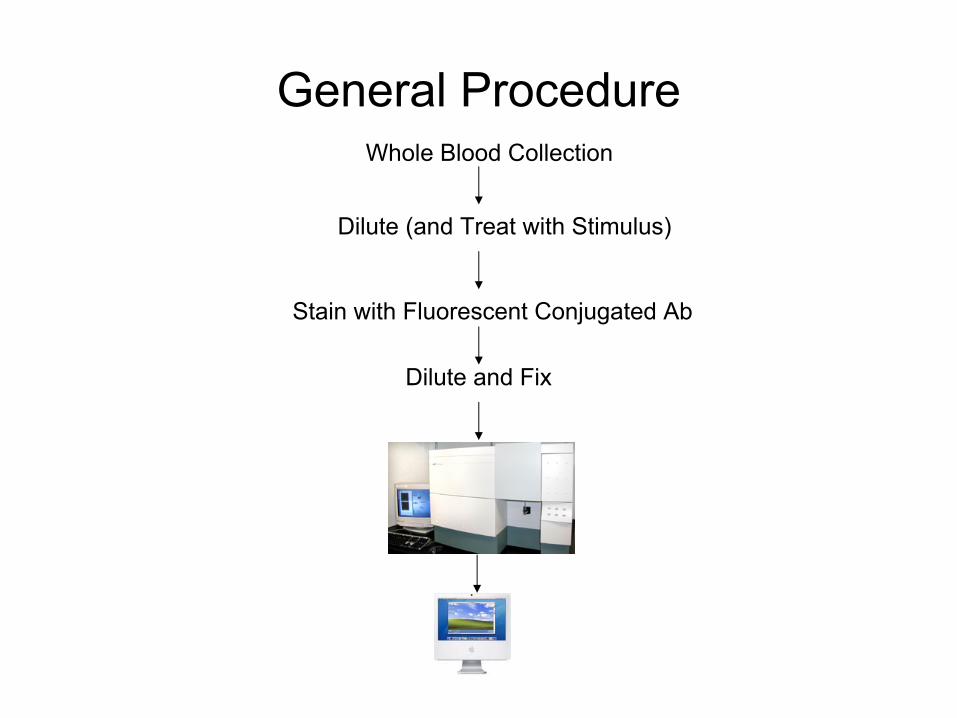
General ProcedureWhole Blood Collection
Dilute (and Treat with Stimulus)
Stain with Fluorescent Conjugated Ab
Dilute and Fix
Applications of Flow Cytometry in Platelet Testing
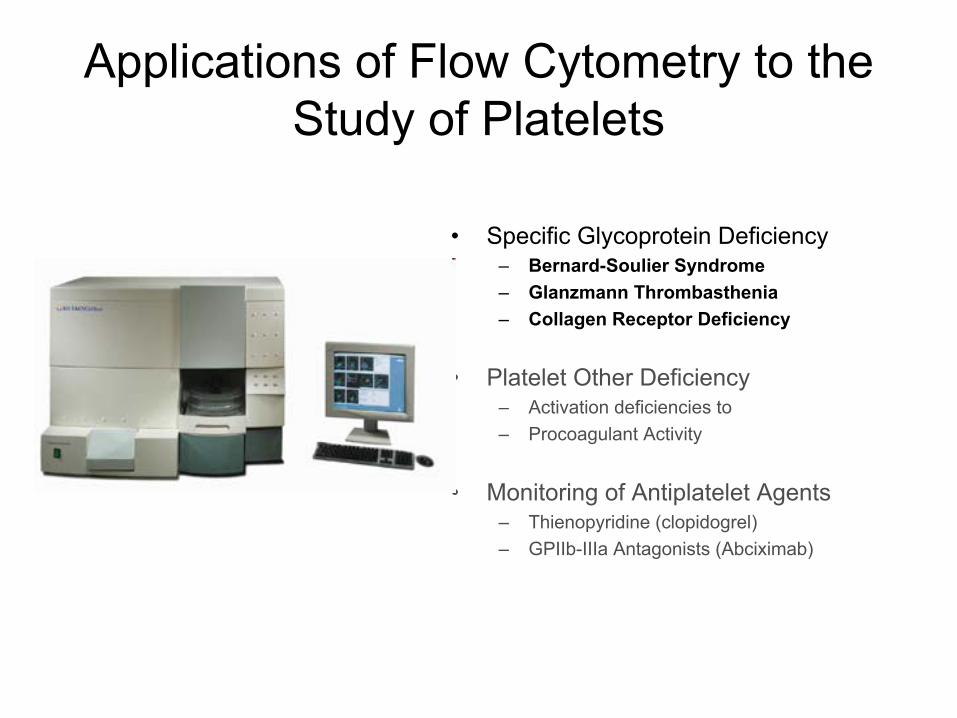
Applications of Flow Cytometry to the Study of Platelets
•
Specific Glycoprotein Deficiency–
Bernard-Soulier Syndrome–
Glanzmann Thrombasthenia–
Collagen Receptor Deficiency
•
Platelet Other Deficiency–
Activation deficiencies to –
Procoagulant Activity
•
Monitoring of Antiplatelet Agents–
Thienopyridine (clopidogrel)–
GPIIb-IIIa Antagonists (Abciximab)
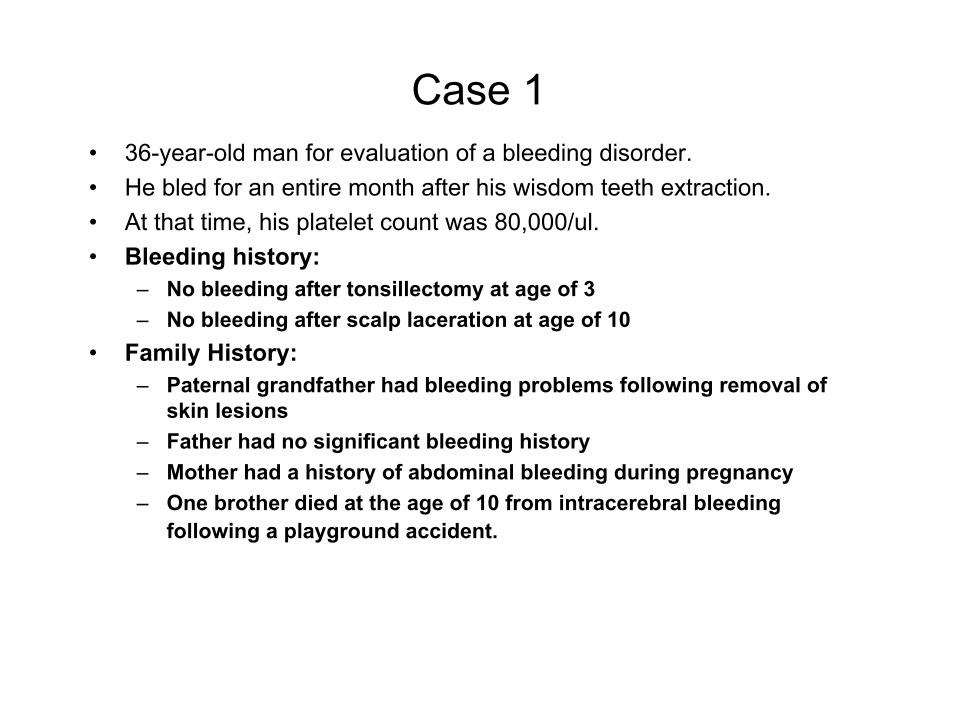
Case 1•
36-year-old man for evaluation of a bleeding disorder. •
He bled for an entire month after his wisdom teeth extraction. •
At that time, his platelet count was 80,000/ul. •
Bleeding history:–
No bleeding after tonsillectomy at age of 3–
No bleeding after scalp laceration at age of 10•
Family History:–
Paternal grandfather had bleeding problems following removal of skin lesions
–
Father had no significant bleeding history–
Mother had a history of abdominal bleeding during pregnancy –
One brother died at the age of 10 from intracerebral bleeding following a playground accident.
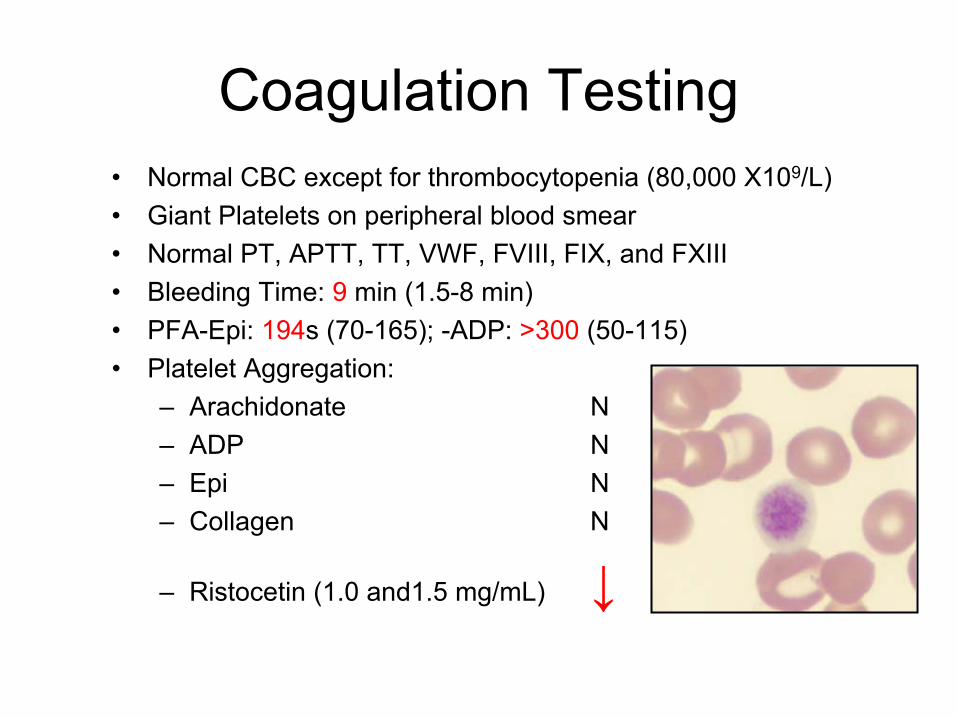
Coagulation Testing•
Normal CBC except for thrombocytopenia (80,000 X109/L)•
Giant Platelets on peripheral blood smear•
Normal PT, APTT, TT, VWF, FVIII, FIX, and FXIII•
Bleeding Time: 9
min (1.5-8 min)•
PFA-Epi: 194s (70-165); -ADP: >300 (50-115)•
Platelet Aggregation:–
Arachidonate N–
ADP N–
Epi N–
Collagen N
–
Ristocetin (1.0 and1.5 mg/mL) ↓

Flow Cytometry Studies
100 101 102 103 104Forward Scatter
100 101 102 103 104CD61 FITC
100 101 102 103 104CD42b PE
100 101 102 103 104CD42a FITC
Size
GPIIIa GPIX
GPIbα
Control: Green Patient: Red
Even
tsEv
ents
Even
tsEv
ents
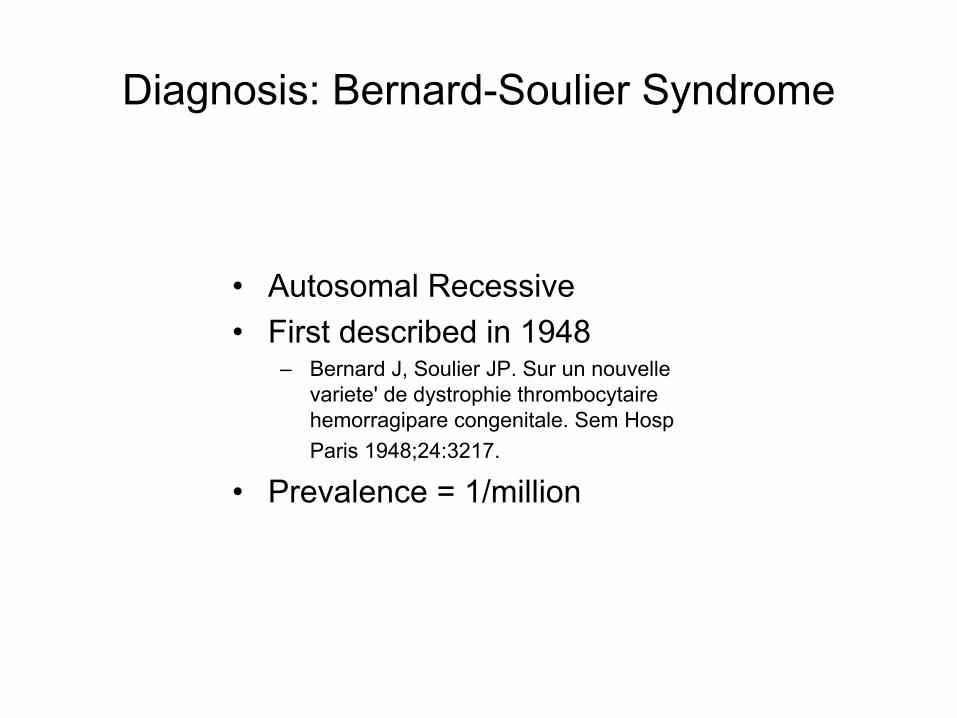
Diagnosis: Bernard-Soulier Syndrome
•
Autosomal Recessive •
First described in 1948
–
Bernard J, Soulier JP. Sur un nouvelle variete' de dystrophie
thrombocytaire
hemorragipare
congenitale. Sem
Hosp Paris 1948;24:3217.
•
Prevalence = 1/million
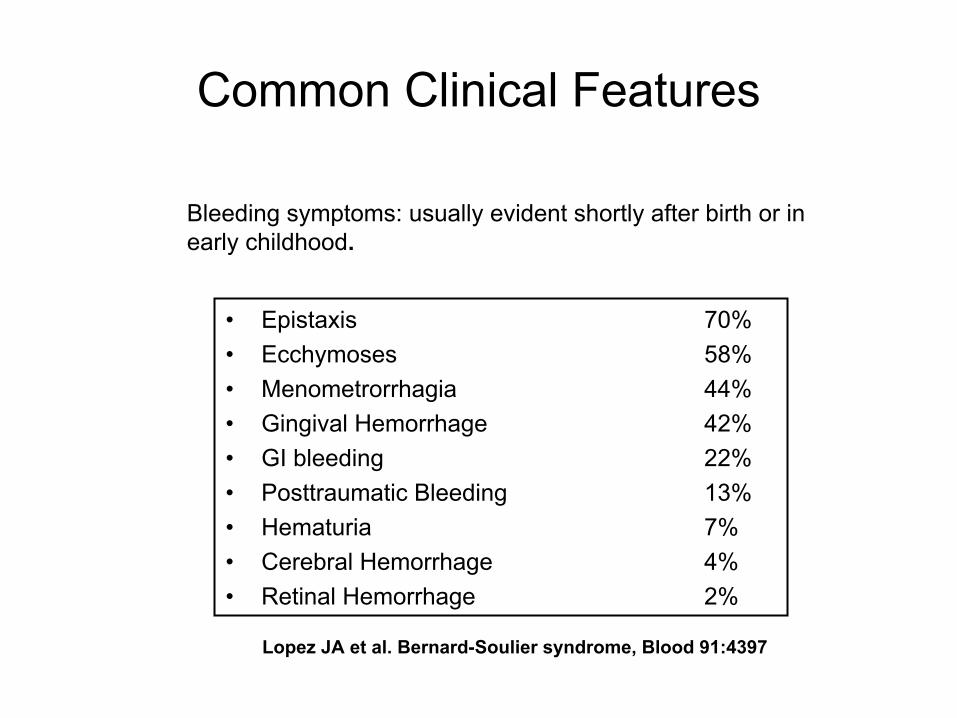
Common Clinical Features
•
Epistaxis
70%•
Ecchymoses
58%•
Menometrorrhagia
44%•
Gingival Hemorrhage 42%•
GI bleeding 22%•
Posttraumatic Bleeding 13%•
Hematuria
7%•
Cerebral Hemorrhage 4%•
Retinal Hemorrhage 2%
Lopez JA et al. Bernard-Soulier syndrome, Blood 91:4397
Bleeding symptoms: usually evident shortly after birth or in early childhood.

13
Nurden
AT, Nature 255, 720-722
Drouin
J, Blood 1988, 72:1086
Bernard-Soulier Syndrome- GPIb-V-IX Deficiency
NL BSS
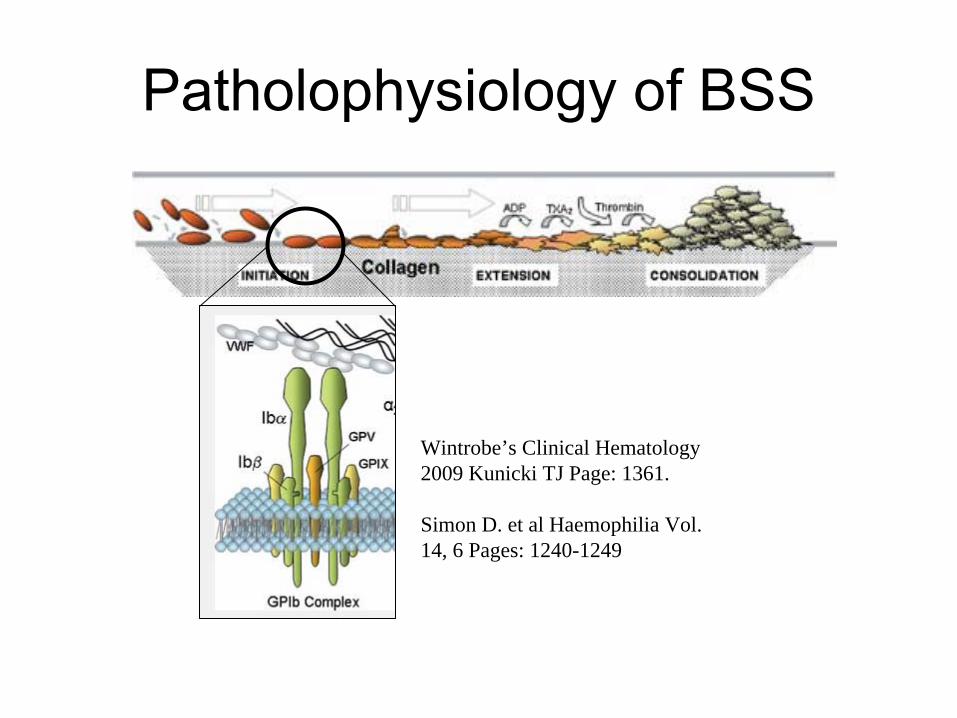
Patholophysiology
of BSS
Wintrobe’s Clinical Hematology 2009 Kunicki TJ Page: 1361.
Simon D. et al Haemophilia Vol. 14, 6 Pages: 1240-1249

Mutations of GPIb-V-IX Complex
Platelet 2007 2nd
Edition-page 1034Inherited Disorders of Platelet FunctionAlan T. Nurden
and Paquita
Nurden

Features of BSS Hemorrhagic Diathesis
•
Thrombocytopenia•
Giant Platelets (>10 µm George JN Br J Haematol
1981;48:459–467.
)•
↓
Ristocetin induced PLT Aggregation•
↓
or absent GPIb-V-IX complex•
Classification:–
Type 1: Quantitative/Qualitative–
Type 2: Normal platelet count and size (Kenny D. et al. 1998 Blood 92: 175)

Treatment
•
Platelet transfusion for severe bleeding•
Desmopressin•
Recombinant factor VII•
Antifibrinolytic agents

Trivia for BSS
•
Rare BSS variant my have normal platelet count and size.
•
Patients with DiGeorge syndrome may have missing GPIb
beta.
•
Degrees of GPIb
and IX deficiency do not appear to correlate with bleeding severity.
•
GPV is not a essential component and its abnormalities do not cause BSS.
Flow Cytometry Studies for Mailed-in Samples
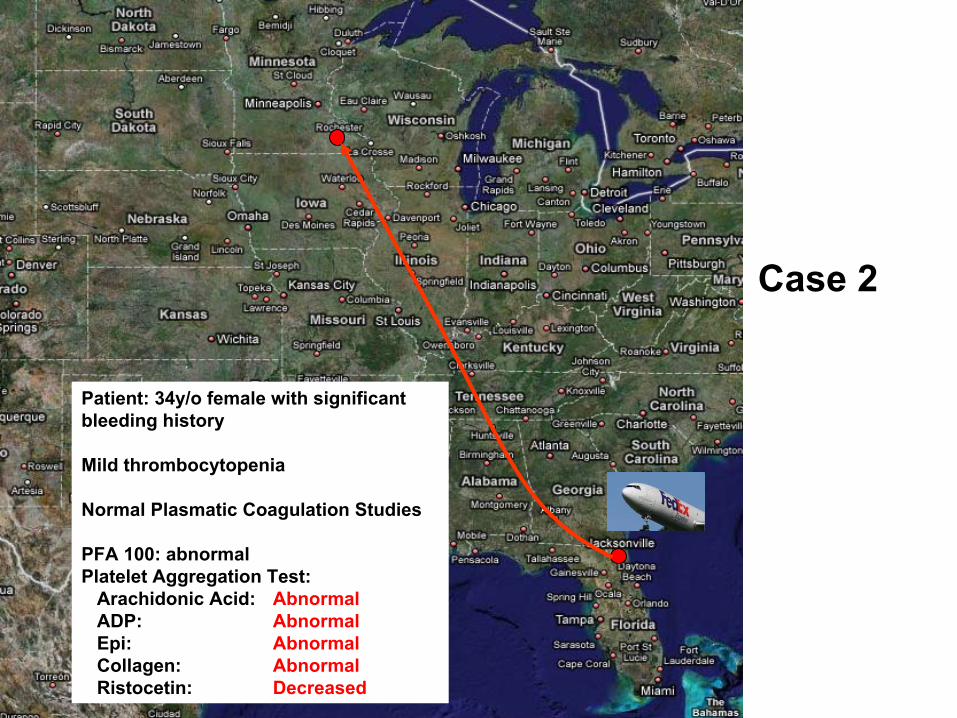
Patient: 34y/o female with significant bleeding history
Mild thrombocytopenia
Normal Plasmatic Coagulation Studies
PFA 100: abnormalPlatelet Aggregation Test:
Arachidonic Acid: AbnormalADP: AbnormalEpi: AbnormalCollagen: AbnormalRistocetin: Decreased
Case 2
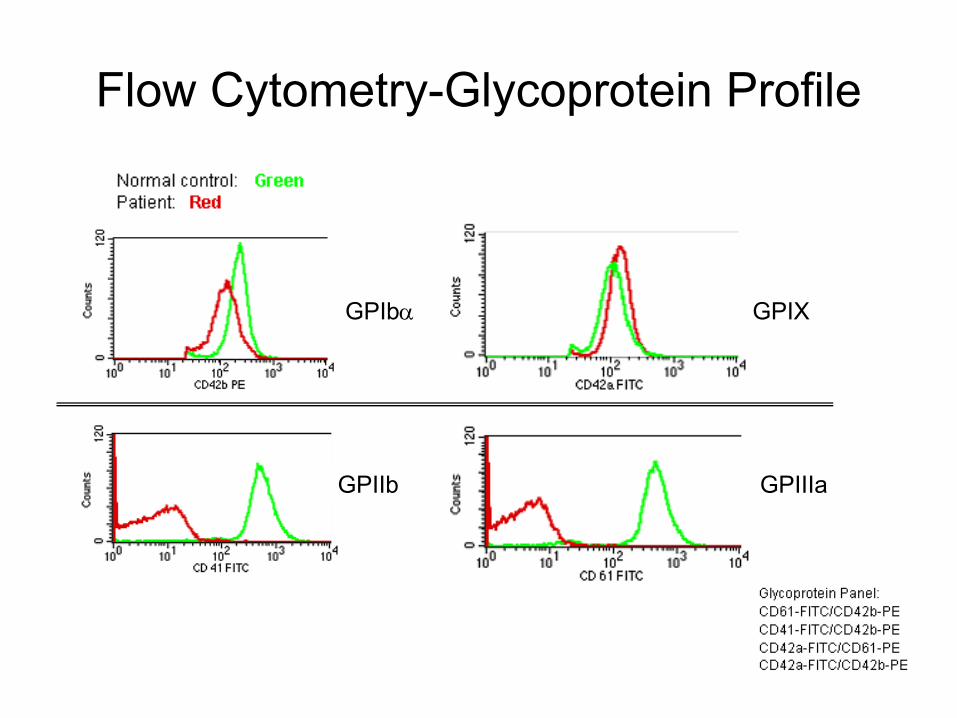
Flow Cytometry-Glycoprotein Profile
GPIIb
GPIbα GPIX
GPIIIa
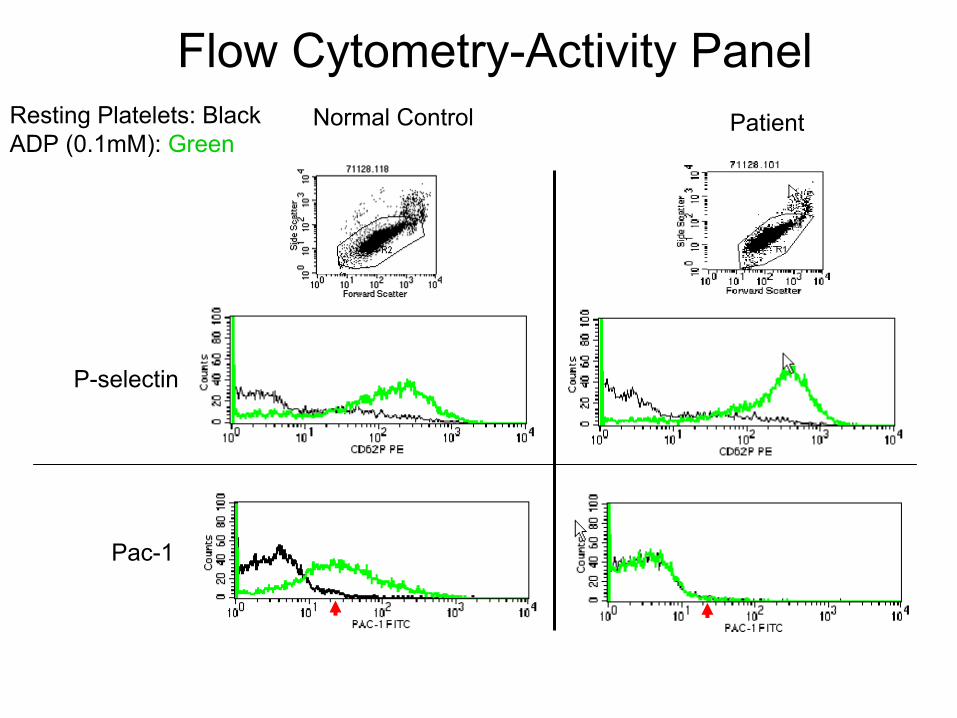
Resting Platelets: BlackADP (0.1mM): Green
Normal Control Patient
Flow Cytometry-Activity Panel
P-selectin
Pac-1
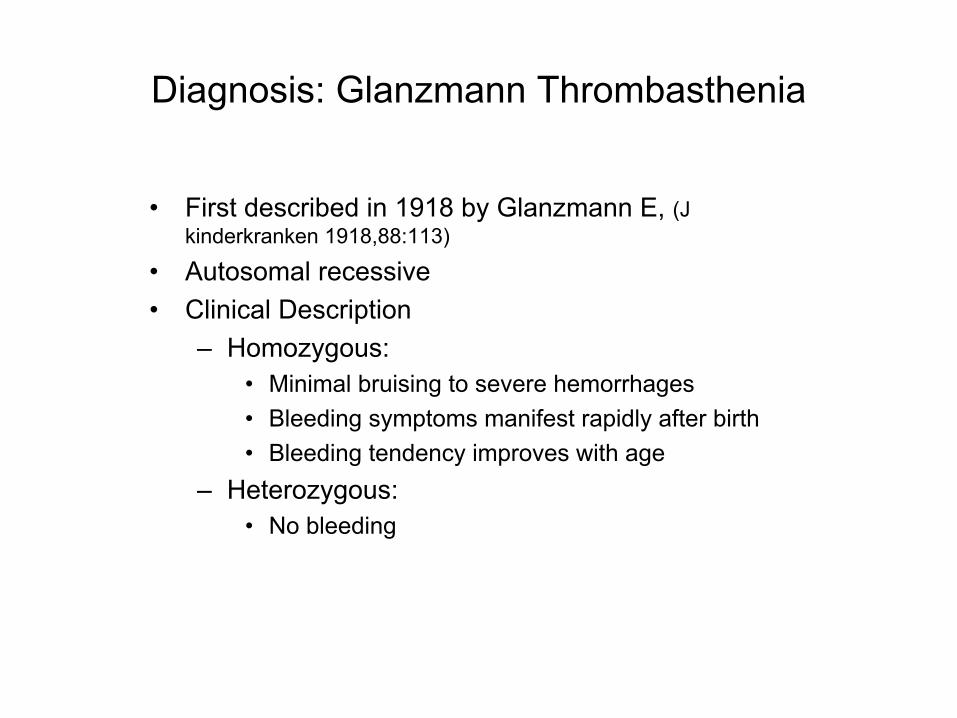
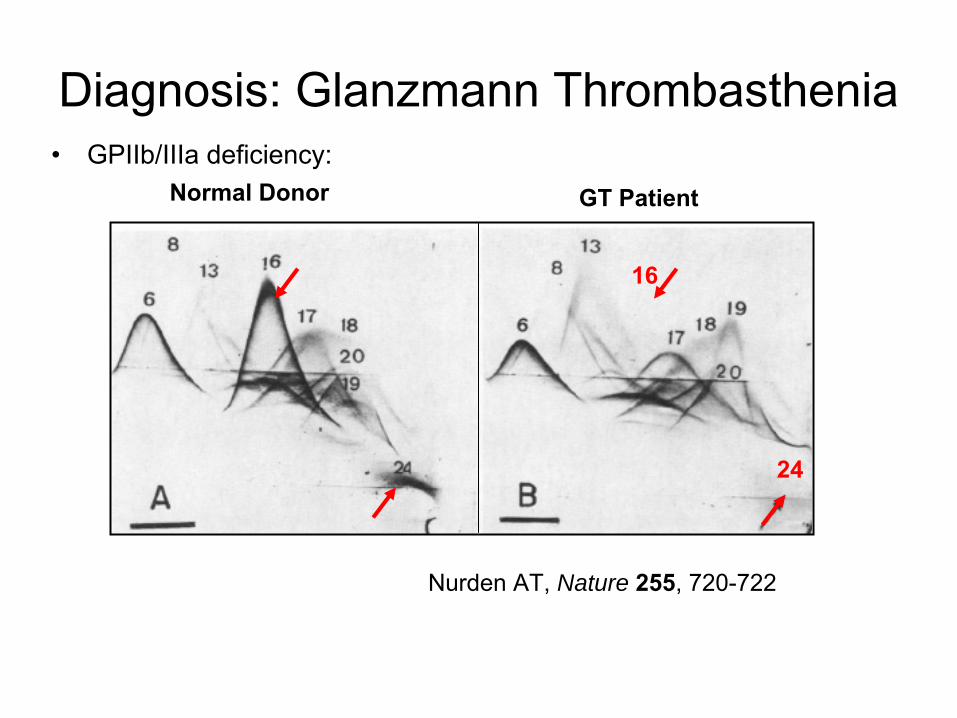
Diagnosis: Glanzmann Thrombasthenia
•
First described in 1918 by Glanzmann E, (J kinderkranken
1918,88:113)
•
Autosomal recessive•
Clinical Description–
Homozygous: •
Minimal bruising to severe hemorrhages•
Bleeding symptoms manifest rapidly after birth•
Bleeding tendency improves with age–
Heterozygous: •
No bleeding
•
GPIIb/IIIa deficiency:
Diagnosis: Glanzmann Thrombasthenia
16
24
Nurden
AT, Nature 255, 720-722
Normal Donor GT Patient

Diagnostic Methods for GT•
Clinical/family history •
Peripheral blood•
Routine Coagulation studies•
Platelet Function studies–
PFA-100–
Platelet Aggregation:•
Arachidonic acid: ↓•
ADP ↓•
Epi ↓•
Collagen ↓•
Ristocetin NL/ ↓•
Flow cytometry: GPIIb/IIIa ↓ ↓ ↓•
Mutation analysis: best for prenatal and carrier status analyses.
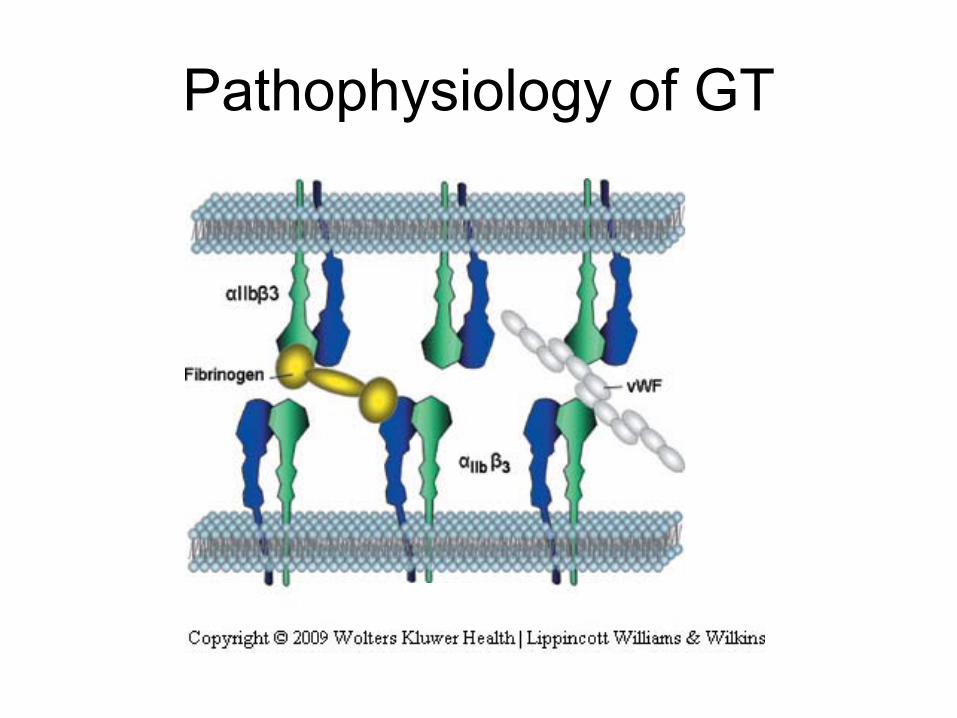
Pathophysiology of GT
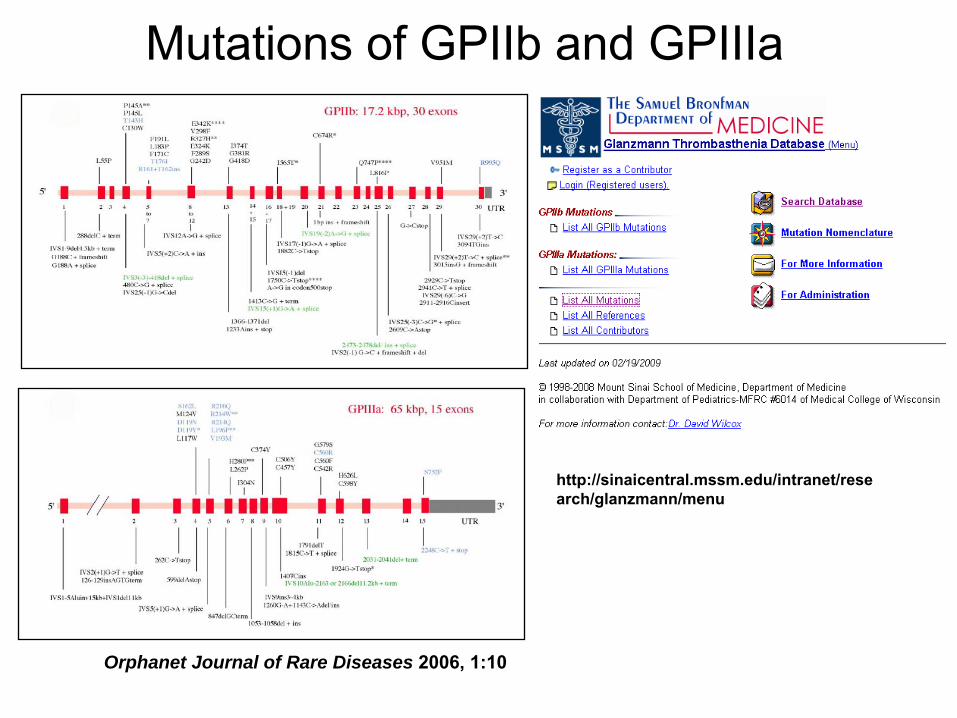
Mutations of GPIIb and GPIIIa
Orphanet Journal of Rare Diseases 2006, 1:10
http://sinaicentral.mssm.edu/intranet/rese
arch/glanzmann/menu
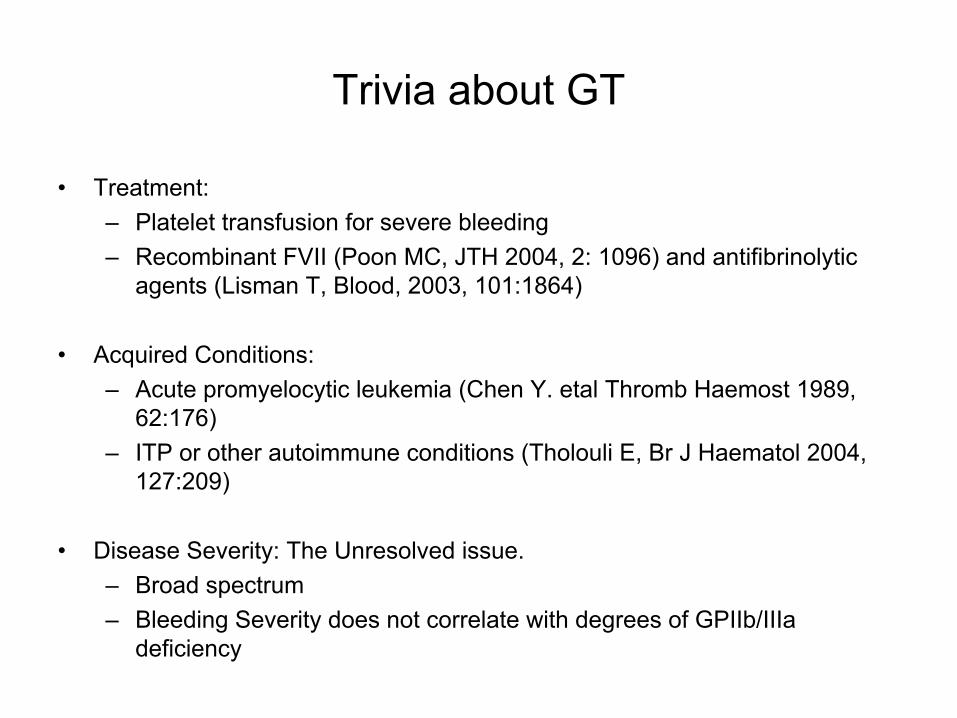
Trivia about GT
•
Treatment:–
Platelet transfusion for severe bleeding –
Recombinant FVII (Poon
MC, JTH 2004, 2: 1096) and antifibrinolytic agents (Lisman
T, Blood, 2003, 101:1864)
•
Acquired Conditions:–
Acute promyelocytic leukemia (Chen Y. etal
Thromb
Haemost
1989, 62:176)
–
ITP or other autoimmune conditions (Tholouli
E, Br J Haematol
2004, 127:209)
•
Disease Severity: The Unresolved issue.–
Broad spectrum–
Bleeding Severity does not correlate with degrees of GPIIb/IIIa deficiency
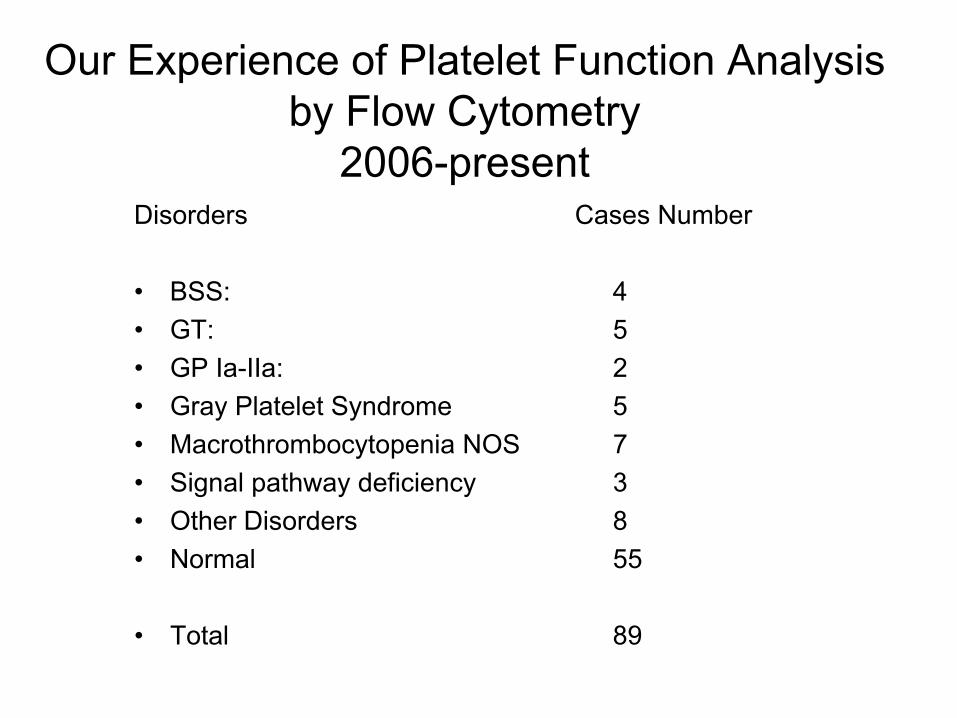
Our Experience of Platelet Function Analysis by Flow Cytometry
2006-presentDisorders Cases Number
•
BSS: 4•
GT:
5•
GP Ia-IIa:
2•
Gray Platelet Syndrome 5•
Macrothrombocytopenia NOS
7•
Signal pathway deficiency
3•
Other Disorders
8•
Normal 55
•
Total 89
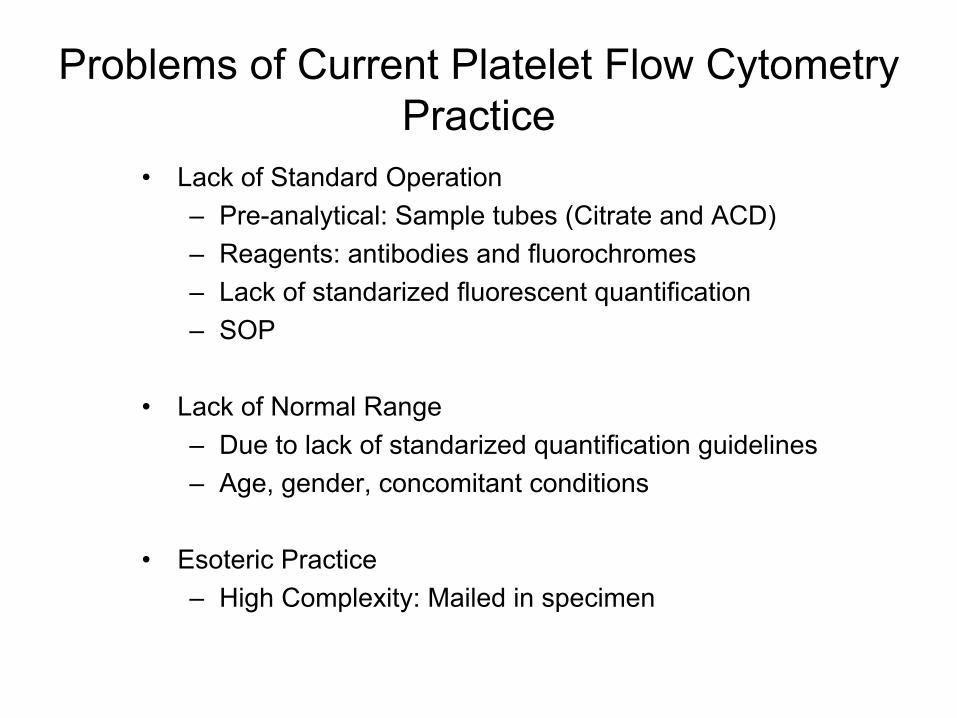
Problems of Current Platelet Flow Cytometry Practice
•
Lack of Standard Operation–
Pre-analytical: Sample tubes (Citrate and ACD)–
Reagents: antibodies and fluorochromes–
Lack of standarized fluorescent quantification–
SOP
•
Lack of Normal Range–
Due to lack of standarized quantification guidelines–
Age, gender, concomitant conditions
•
Esoteric Practice–
High Complexity: Mailed in specimen
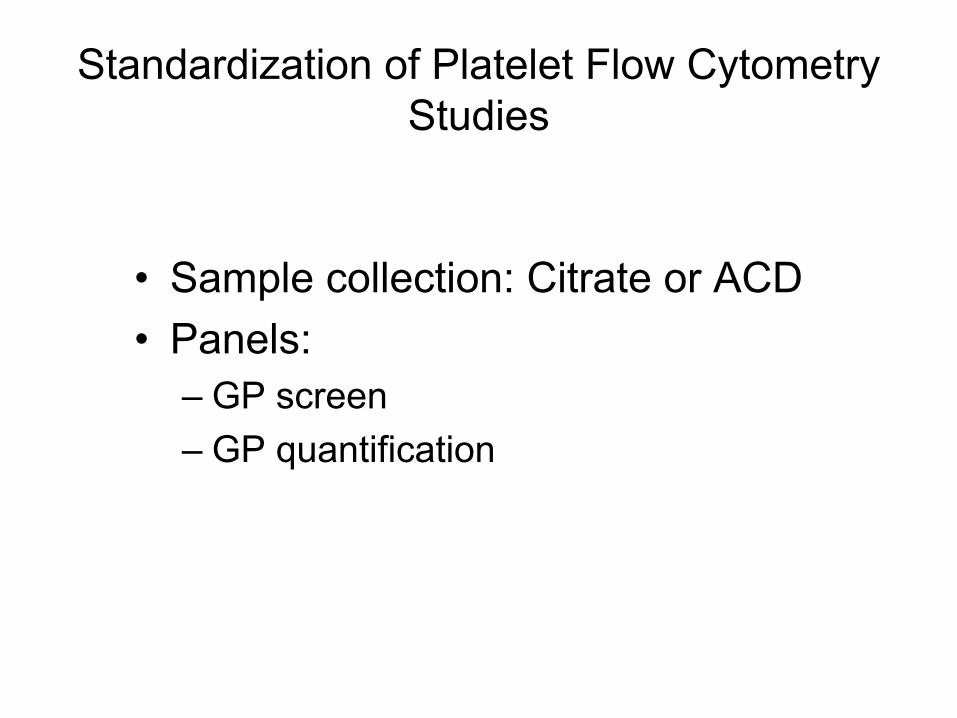
Standardization of Platelet Flow Cytometry Studies
•
Sample collection: Citrate or ACD•
Panels:–
GP screen
–
GP quantification

System Description•
Glycoprotein screening assays:•
-
by mean fluorescent intensity •
-
Whole blood sample in citrate (3.2%) or ACD tubes (A or B)•
-
Conjugated antibodies to •
CD41 (GPIIb) •
CD61(GPIIIa) •
CD42a (GPIX)•
CD 42b (GPIba)•
CD49a (IaIIa)•
-Gated with Forward and Side light scatter histogram.•
-The mean fluorescent equivalences (MFE) are calculated from a standard curve of calibrator beads.
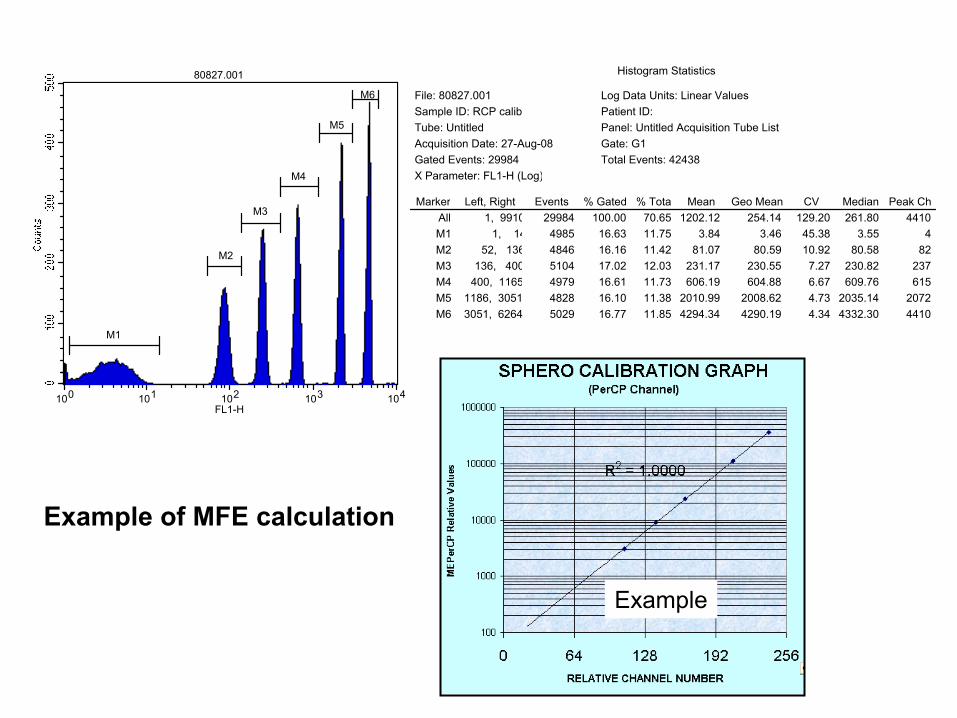
100 101 102 103 104FL1-H
80827.001
M1
M2
M3
M4
M5
M6
Histogram Statistics
Marker Left, Right Events % Gated % Total Mean Geo Mean CV Median Peak ChAll 1, 9910 29984 100.00 70.65 1202.12 254.14 129.20 261.80 4410M1 1, 14 4985 16.63 11.75 3.84 3.46 45.38 3.55 4M2 52, 136 4846 16.16 11.42 81.07 80.59 10.92 80.58 82M3 136, 400 5104 17.02 12.03 231.17 230.55 7.27 230.82 237M4 400, 1165 4979 16.61 11.73 606.19 604.88 6.67 609.76 615M5 1186, 3051 4828 16.10 11.38 2010.99 2008.62 4.73 2035.14 2072M6 3051, 6264 5029 16.77 11.85 4294.34 4290.19 4.34 4332.30 4410
File: 80827.001 Log Data Units: Linear ValuesSample ID: RCP calib Patient ID: Tube: Untitled Panel: Untitled Acquisition Tube ListAcquisition Date: 27-Aug-08 Gate: G1Gated Events: 29984 Total Events: 42438X Parameter: FL1-H (Log)
Example
Example of MFE calculation

Quantitative glycoprotein screen test by Biocytex: -
Whole blood in citrate or ACD tube. -
Anti-CD61 (IIIa), -CD42a (GPIX) and -CD49a (GPIa/IIa) antibodies, and then stained with conjugated secondary antibody.
*The MFI will be compared with a standard curve derived from a standard primary antibody coated beads.
*Copy numbers of glycoproteins will extrapolated from the standard curve.
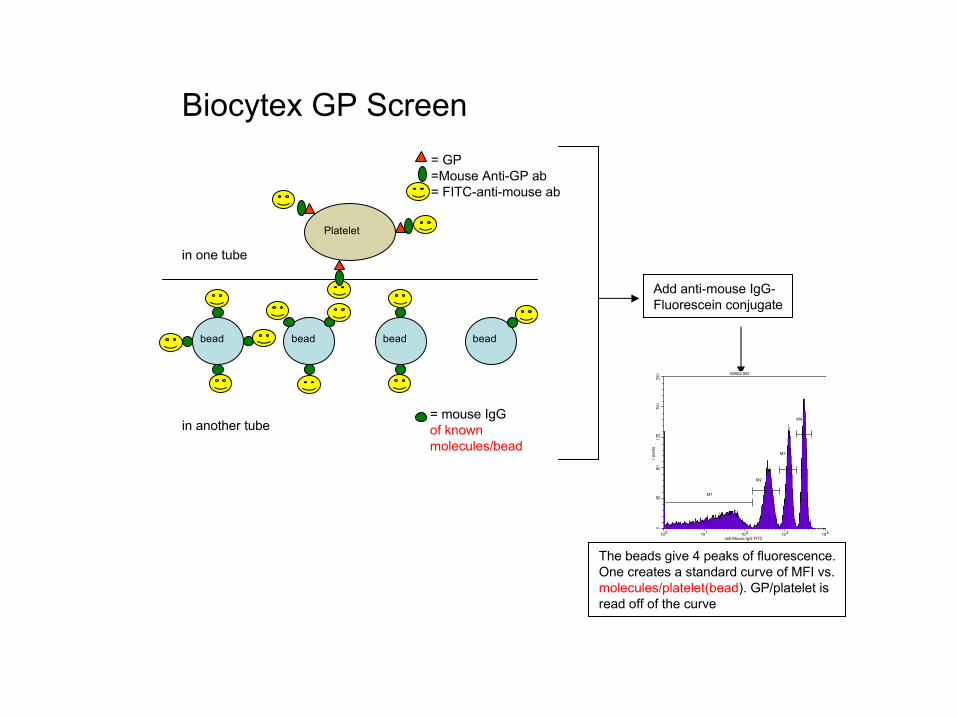
Platelet
= GP=Mouse Anti-GP ab= FITC-anti-mouse ab
= mouse IgGof known molecules/bead
bead bead bead bead
Add anti-mouse IgG-Fluorescein conjugate
in one tube
in another tube
The beads give 4 peaks of fluorescence.One creates a standard curve of MFI vs.molecules/platelet(bead). GP/platelet isread off of the curve
100 101 102 103 104anti-Mouse IgG FITC
80502.005
M1
M2
M3
M4
Biocytex
GP Screen
100 101 102 103 104anti-Mouse IgG FITC
80502.005
M1
M2
M3
M4
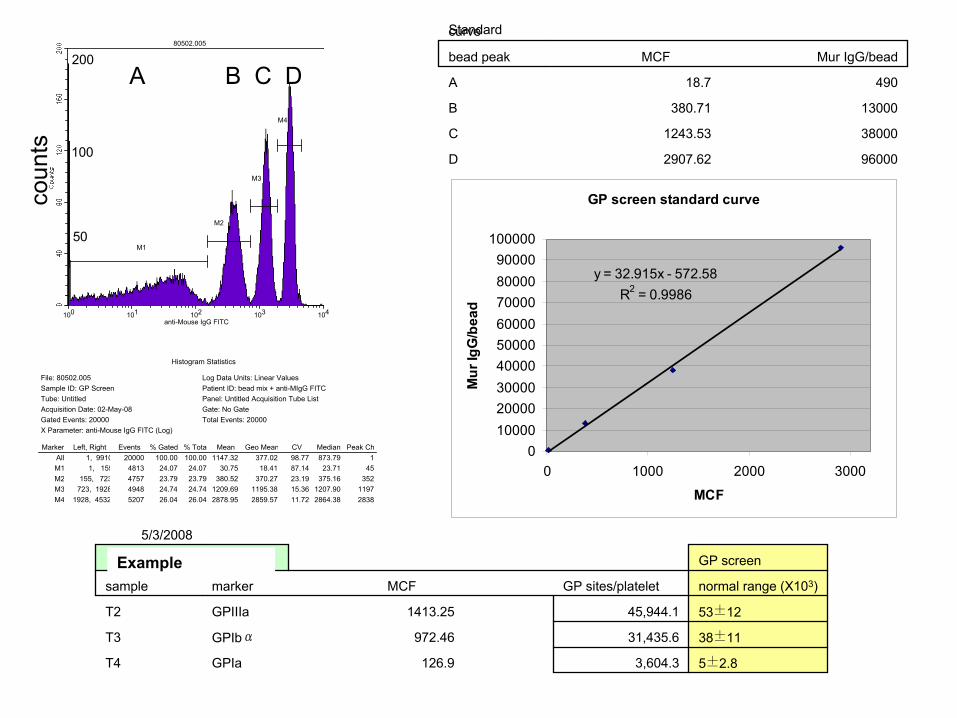
Histogram Statistics
Marker Left, Right Events % Gated % Tota Mean Geo Mean CV Median Peak ChAll 1, 9910 20000 100.00 100.00 1147.32 377.02 98.77 873.79 1M1 1, 155 4813 24.07 24.07 30.75 18.41 87.14 23.71 45M2 155, 723 4757 23.79 23.79 380.52 370.27 23.19 375.16 352M3 723, 1928 4948 24.74 24.74 1209.69 1195.38 15.36 1207.90 1197M4 1928, 4532 5207 26.04 26.04 2878.95 2859.57 11.72 2864.38 2838
File: 80502.005 Log Data Units: Linear ValuesSample ID: GP Screen Patient ID: bead mix + anti-MIgG FITCTube: Untitled Panel: Untitled Acquisition Tube ListAcquisition Date: 02-May-08 Gate: No GateGated Events: 20000 Total Events: 20000X Parameter: anti-Mouse IgG FITC (Log)
Standard curve
bead peak MCF Mur IgG/bead
A 18.7 490
B 380.71 13000
C 1243.53 38000
D 2907.62 96000
GP screen standard curve
y = 32.915x - 572.58R2 = 0.9986
0100002000030000400005000060000700008000090000
100000
0 1000 2000 3000
MCFM
ur Ig
G/b
ead
5/3/2008
6-010-15, post-surgery GP screen
sample marker MCF GP sites/platelet normal range (X103)
T2 GPIIIa 1413.25 45,944.1 53±12
T3 GPIbα 972.46 31,435.6 38±11
T4 GPIa 126.9 3,604.3 5±2.8
A B C Dco
unts
200
100
50
Example
Applications of Flow Cytometry in Other Coagulation Testing
VWF Ristocetin (VWF:RCo) Activity by Flow Cytometry
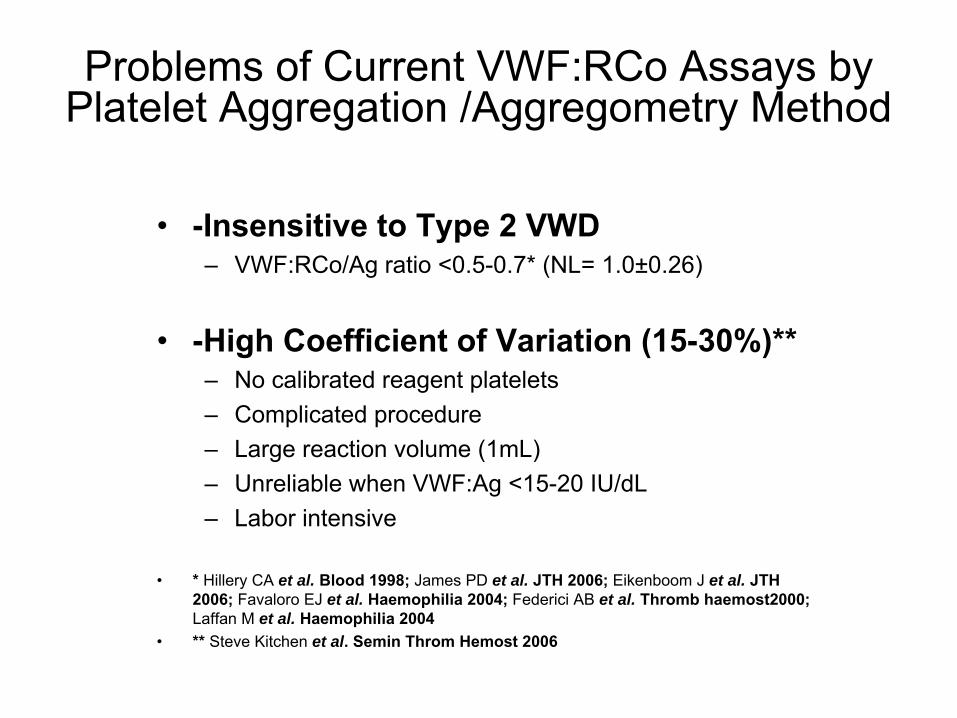
•
-Insensitive to Type 2 VWD–
VWF:RCo/Ag
ratio <0.5-0.7* (NL= 1.0±0.26)
•
-High Coefficient of Variation (15-30%)**–
No calibrated reagent platelets–
Complicated procedure–
Large reaction volume (1mL)–
Unreliable when VWF:Ag <15-20 IU/dL–
Labor intensive
•
* Hillery
CA
et al. Blood 1998; James PD
et al. JTH 2006; Eikenboom
J
et al. JTH 2006; Favaloro EJ
et al. Haemophilia
2004; Federici AB
et al. Thromb
haemost2000; Laffan
M
et al. Haemophilia
2004 •
** Steve Kitchen
et al. Semin
Throm
Hemost
2006
Problems of Current VWF:RCo
Assays by Platelet Aggregation /Aggregometry Method
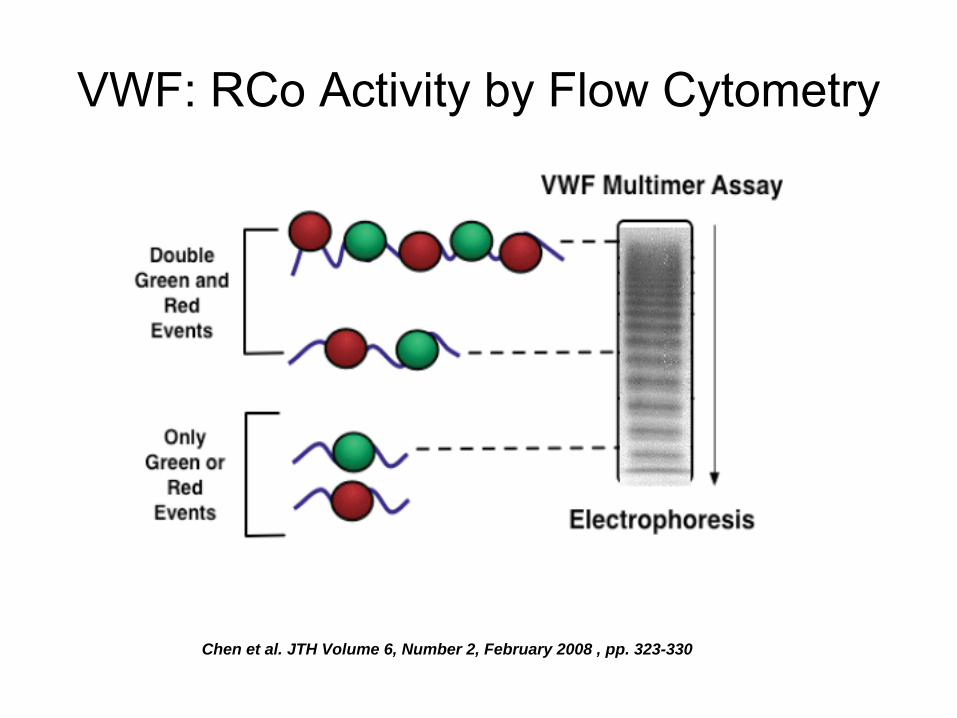
VWF: RCo
Activity by Flow Cytometry
Chen et al. JTH Volume 6, Number 2, February 2008 , pp. 323-330


VWF:Ristocetin
Testing Procedure
0.5 μl plasma

Validation of VWF:RCo
by Flow Cytometry Method
AggregationCut off
Flow Cut off
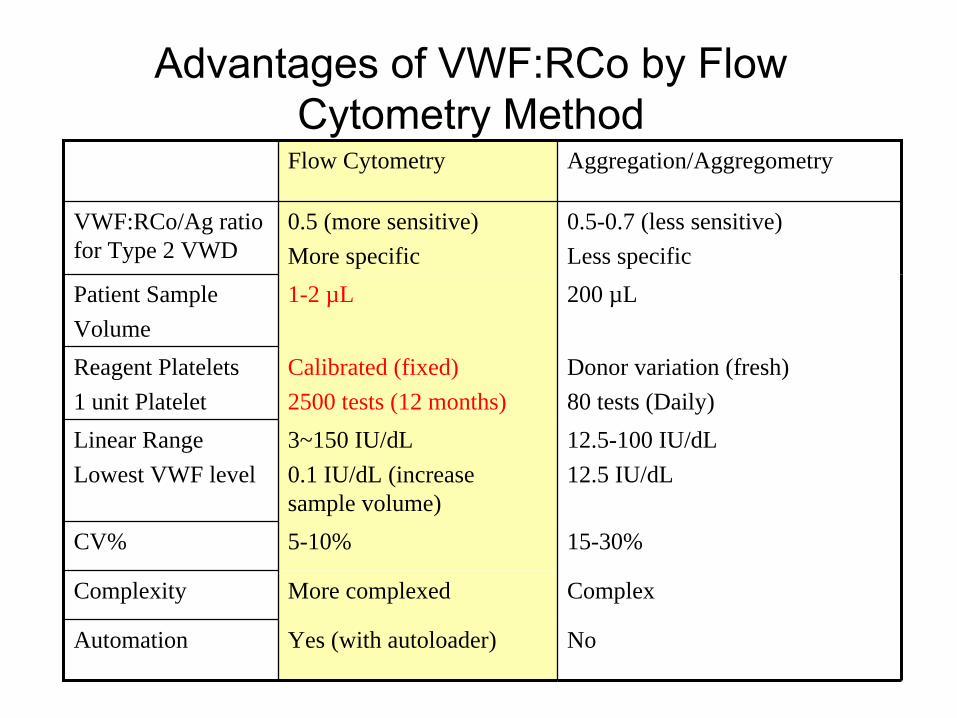
Advantages of VWF:RCo
by Flow Cytometry Method
Flow Cytometry Aggregation/Aggregometry
VWF:RCo/Ag ratio for Type 2 VWD
0.5 (more sensitive)More specific
0.5-0.7 (less sensitive)Less specific
Patient Sample Volume
1-2 µL 200 µL
Reagent Platelets1 unit Platelet
Calibrated (fixed)2500 tests (12 months)
Donor variation (fresh)80 tests (Daily)
Linear RangeLowest VWF level
3~150 IU/dL0.1 IU/dL (increase sample volume)
12.5-100 IU/dL12.5 IU/dL
CV% 5-10% 15-30%
Complexity More complexed Complex
Automation Yes (with autoloader) No

Summary
•
The Concept of Flow Cytometry
•
Applications of Flow Cytometry in Platelet Function Testing
•
Applications of Flow Cytometry in Other Coagulation Testing
Acknowledgments
•
Dr. Whyte G. Owen•
Dr. William L. Nichols
•
Dr. Rajiv K. Pruthi•
Dr. John A. Heit
•
Randall S. Miller–
Flow cytometry specialist