Flow Behavior and Microstructural Evolution of INCOLOY 945 ...
169
Flow Behavior and Microstructural Evolution of INCOLOY 945 During High Temperature Deformation Stephen Coryell - Student Dr. Kip Finley - Department of Metallurgical and Materials Engineering Colorado School of Mines, Golden CO Funded by FIERF 1. Background Increasing energy demands are forcing oil producers to drill in harsh environments requiring improved structural materials. For the forger, supplying superalloy rod, such requirements call for fine grains and tight restrictions on grain size uniformity. Understanding flow and recrystallization behavior is critical for optimizing forge and annealing practices to meet these requirements. INCOLOY® 945 is a newly developed hybrid of alloys 718 and 925 with a unique combination of strength and corrosion resistance. However, the effect of alloying on flow behavior and microstructural evolution has not been studied comprehensively for this new alloy. INCONEL and INCOLOY alloys are often used because of their high tensile strength accompanied by only slightly reduced toughness at very low temperatures, high fatigue resistance and mechanical strength at moderate temperatures, and moderate creep strength. INCOLOY has a larger copper content than INCONEL 718, which likely contributes to improved machinability and corrosion resistance. 2. Project Description This thesis focuses on understanding flow and recrystallization behavior and kinetics over a range of temperatures (950 – 1150C) and strain rates ranging between 0.001 – 1.0 s-1 for INCOLOY 945. It further investigates the relationship between texture evolution and deformation condition, including temperature, compressive strain, and strain rate. 3. Summary of Conclusions At high strain rates and low deformation temperatures, high degrees of strain hardening are observed, followed by a drastic transition to strain softening at a critical strain. At low strain rates and high deformation temperatures, secondary yield points are observed, likely from substitutional static strain aging assisted by micro-strain dynamic strain aging.
Transcript of Flow Behavior and Microstructural Evolution of INCOLOY 945 ...
Flow Behavior and Microstructural Evolution of INCOLOY 945
During High Temperature Deformation
Stephen Coryell - Student
Dr. Kip Finley - Department of Metallurgical and Materials Engineering
Colorado School of Mines, Golden CO
Funded by FIERF
1. Background
Increasing energy demands are forcing oil producers to drill in harsh environments requiring
improved structural materials. For the forger, supplying superalloy rod, such requirements call
for fine grains and tight restrictions on grain size uniformity. Understanding flow and
recrystallization behavior is critical for optimizing forge and annealing practices to meet these
requirements.
INCOLOY® 945 is a newly developed hybrid of alloys 718 and 925 with a unique combination
of strength and corrosion resistance. However, the effect of alloying on flow behavior and
microstructural evolution has not been studied comprehensively for this new alloy.
INCONEL and INCOLOY alloys are often used because of their high tensile strength
accompanied by only slightly reduced toughness at very low temperatures, high fatigue
resistance and mechanical strength at moderate temperatures, and moderate creep strength.
INCOLOY has a larger copper content than INCONEL 718, which likely contributes to
improved machinability and corrosion resistance.
2. Project Description
This thesis focuses on understanding flow and recrystallization behavior and kinetics over a
range of temperatures (950 – 1150C) and strain rates ranging between 0.001 – 1.0 s-1 for
INCOLOY 945. It further investigates the relationship between texture evolution and
deformation condition, including temperature, compressive strain, and strain rate.
3. Summary of Conclusions
At high strain rates and low deformation temperatures, high degrees of strain hardening are
observed, followed by a drastic transition to strain softening at a critical strain.
At low strain rates and high deformation temperatures, secondary yield points are observed,
likely from substitutional static strain aging assisted by micro-strain dynamic strain aging.

The flow behavior of INCOLOY® 945 is similar to other nickel-base alloys discussed in the
literature. In some cases, the yield stress and strain hardening rates were lower for higher strain
rates, contrary to typical material behavior. The backward trends are attributed to dynamic strain
aging, which was especially present at higher temperatures and lower strain rates throughout
deformation. At low temperatures and high strain rates, dynamic strain aging did not have time
to occur, so a decrease in strain hardening is observed.
Microstructural analysis showed that recrystallization occurs with increasing test temperatures
along initial grain boundaries and annealing twins. Recrystallization was especially prevalent at
low strain rates, which was later confirmed to be due to dynamic recrystallization. Static
recrystallization becomes more prevalent at higher strain rates. The recrystallized grain size is
temperature and strain rate dependent, generally increasing with increasing temperatures and
decreasing strain rates.
The evolution of microstructure was investigated by deformation at 1050 °C and a strain rate of
0.001 s-1 at incremental strains. The fraction of recrystallization increases as deformation
progresses. However strain appears to have no effect on the stable recrystallized grain size,
which is typical of behavior observed in nickel with a high initial grain size undergoing
recrystallization. The critical strain for the onset of recrystallization in this deformation condition
was determined to be between 0.2 and 0.3. This was further supported through calculated grain
misorientations and texture analysis.

1
Note: This Thesis Contains
Color Images – Please Refer
to PDF Version to Identify
FLOW BEHAVIOR AND MICROSTRUCTURAL EVOLUTION OF INCOLOY® 945
DURING HIGH TEMPERATURE DEFORMATION
by
Stephen P. Coryell


ii
A thesis submitted to the Faculty and the Boards of Trustees of the Colorado School of
Mines in partial fulfillment of the requirements for the degree of Masters of Science
(Metallurgical and Materials Engineering).
Golden, Colorado
Date: __________
Signed: Stephen P. Coryell
Signed: Dr. Kip O. Findley
Thesis Advisor
Golden, Colorado
Date: __________
Signed: Dr. Michael Kaufman
Professor and Head Department of Metallurgical and
Materials Engineering


iii
ABSTRACT
The development of advanced materials is driving producers to obtain a fine grain
structure and tight restrictions on grain size uniformity in forged superalloy rod.
Understanding flow and recrystallization behavior is critical for optimizing forge and
annealing practices to meet these requirements. Frictionless uniaxial compression testing
characteristic of hot working was performed on INCOLOY® 945, a newly developed
hybrid of alloys 718 and 925, to study flow and recrystallization behavior and kinetics
over a range of temperatures and strain rates. Compression was performed at
temperatures ranging between 950˚-1150 ˚C and strain rates ranging between 0.001-
1.0 s-1. Subsequent microstructural analysis, including light optical microscopy, electron
channeling contrast imaging, electron backscatter diffraction, and transmission electron
microscopy were used to relate the microstructural evolution during hot working to the
flow behavior. Grain morphologies and misorientations were used to determine
recrystallization mechanisms, which were subsequently compared to reported behavior of
similar alloys in the literature. Grain orientations also assisted in determining dominant
compression and recrystallization textures with varying strains, strain rates, and
deformation temperatures.
The flow and microstructural behavior of this new alloy related closely with other
similar nickel-base alloys like the common alloy 718. High temperature deformation
indicates the presence of substitutional strain aging and dynamic recovery. Load drops
from substitutional strain aging are also observed in alloy 718, but the effects of
composition and deformation conditions are unclear. Dynamic recrystallization
nucleated by grain and twin bulging and grain boundary migration, which was found to
be a dominant mechanism for grain refinement in INCOLOY® 945. Models were
developed that accurately predict and explain the steady state flow behavior and
recrystallization in INCOLOY® 945 during hot deformation.

iv
TABLE OF CONTENTS
ABSTRACT...................................................................................................................... iii
LIST OF FIGURES ........................................................................................................ vii
LIST OF TABLES .......................................................................................................... xv
ACKNOWLEDGEMENTS .......................................................................................... xvi
CHAPTER 1 : INTRODUCTION................................................................................... 1
1.1 Research Objectives............................................................................................ 1
1.2 Thesis Overview ................................................................................................. 2
CHAPTER 2 : BACKGROUND ..................................................................................... 5
2.1 Alloy Comparison............................................................................................... 5
2.2 Flow Behavior during Hot Deformation............................................................. 7
2.2.1 Experimental Flow Behavior .......................................................................... 7
2.2.2 Modeling of Flow Behavior during Hot Deformation.................................. 15
2.3 Recrystallization ............................................................................................... 17
2.3.1 Recrystallization Mechanisms ...................................................................... 18
2.3.2 Modeling of Dynamic Recrystallization....................................................... 26
2.3.3 Modeling of Static and Metadynamic Recrystallization............................... 29
2.3.4 Twinning Effects on Recrystallization.......................................................... 32
2.4 Deformation and Recrystallization Textures .................................................... 34
2.4.1 Compression Textures .................................................................................. 34
2.4.2 Recrystallization Textures ............................................................................ 38

v
2.5 Applicability to Other Material Systems .......................................................... 41
CHAPTER 3 : EXPERIMENTAL METHODS........................................................... 43
3.1 Material ............................................................................................................. 43
3.1.1 Chemical Composition.................................................................................. 43
3.1.2 Initial Heat Treat Study and Microstructure ................................................. 43
3.2 Hot Compression Testing ................................................................................. 44
3.2.1 Sample Design .............................................................................................. 45
3.2.2 Machine Setup .............................................................................................. 46
3.2.3 Hot Compression Procedures........................................................................ 47
3.2.4 Hot Compression Test Conditions ................................................................ 48
3.3 Light Optical Microscopy (LOM) .................................................................... 50
3.3.1 Sample Preparation for LOM........................................................................ 51
3.3.2 Recrystallization Characterization ................................................................ 52
3.4 Electron Microscopy......................................................................................... 52
3.4.1 Scanning Electron Microscopy (SEM) ......................................................... 53
3.4.2 Electron Channeling Contrast Imaging (ECCI)............................................ 53
3.4.3 Electron Backscatter Diffraction (EBSD)..................................................... 54
3.4.4 Transmission Electron Microscopy (TEM) .................................................. 57
CHAPTER 4 : RESULTS AND DISCUSSION ........................................................... 61
4.1 Hot Deformation Flow Behavior ...................................................................... 61
4.1.1 Stages of Hot Deformation in INCOLOY® 945 .......................................... 61
4.1.2 Strain Aging Effects on Flow Behavior........................................................ 69
4.1.3 Deformation Heating During Hot Compression........................................... 75
4.1.4 Comparison to Other Alloys ......................................................................... 77

vi
4.2 Microstructural Analysis................................................................................... 79
4.2.1 Effect of Deformation Temperature and Strain Rate on the Microstructure 79
4.2.2 Hardness of Deformed INCOLOY® 945 ..................................................... 90
4.2.3 Microstructural Evolution............................................................................. 90
4.2.4 Mechanisms and Modes for Recrystallization.............................................. 95
4.2.5 Comparison to Other Alloys ....................................................................... 102
4.3 Modeling of Flow and Microstructural Behavior ........................................... 103
4.3.1 Determination of Material Constants.......................................................... 104
4.3.2 Steady-State Flow Stress Model ................................................................. 107
4.3.3 Recrystallized Grain Size Model ................................................................ 110
4.3.4 Comparison to Other Alloys ....................................................................... 111
4.4 Texture Development...................................................................................... 112
4.4.1 Texture Development in INCOLOY® 945 ................................................ 112
4.4.2 Comparison to Other Alloys ....................................................................... 119
CHAPTER 5 : SUMMARY AND CONCLUSIONS ................................................. 121
CHAPTER 6 : FUTURE WORK ................................................................................ 125
REFERENCES.............................................................................................................. 127
APPENDIX A: CONSTANT TRUE STRAIN RATE PROGRAM [81] ................. 135
APPENDIX B: TEMPERATURE AND STRAIN RATE-DEPENDENT MDFS... 139
APPENDIX C: EVOLUTION OF MDFS WITH STRAIN ...................................... 143

vii
LIST OF FIGURES
Figure 2.1 Stress-strain curves and hot deformation regions of (a) Zr-0.7%Sn compressed at 775 °C (0.5Tm) and (b) Armco iron compressed at 700 °C (0.54Tm) with strain rates ranging from 1.5x10⁻⁵ to 8.0x10⁻¹ [7,9]. ..... 8
Figure 2.2 Transition from athermal deformation to thermally aided deformation shown by (a) a flow stress transition with temperature where
21 εε && > and (b) stress dependence on the Zener-Holloman parameter [7]. ............................................................................................................... 9
Figure 2.3 Dynamic recrystallization shown by (a) theoretical flow curves labeling important aspects of the recrystallization process [7], and (b) hot compression of 0.68% C steel at a strain rate of 1.3x10⁻³ s-1 [13].... 11
Figure 2.4 Stress strain curves showing the effect of initial grain size on dynamic recrystallization behavior in (a) hot compression of copper at 502 °C and 2x10⁻³ s-1 [14], and (b) hot torsion of nickel at 1000 °C and 3.8x10⁻⁴ s-1 [13]....................................................................................... 12
Figure 2.5 Stress-strain behavior showing dynamic recrystallization during hot compression at varying deformation conditions of (a) γ-TiAl, (b) pure nickel, and (c) pure copper [15]. ............................................................... 13
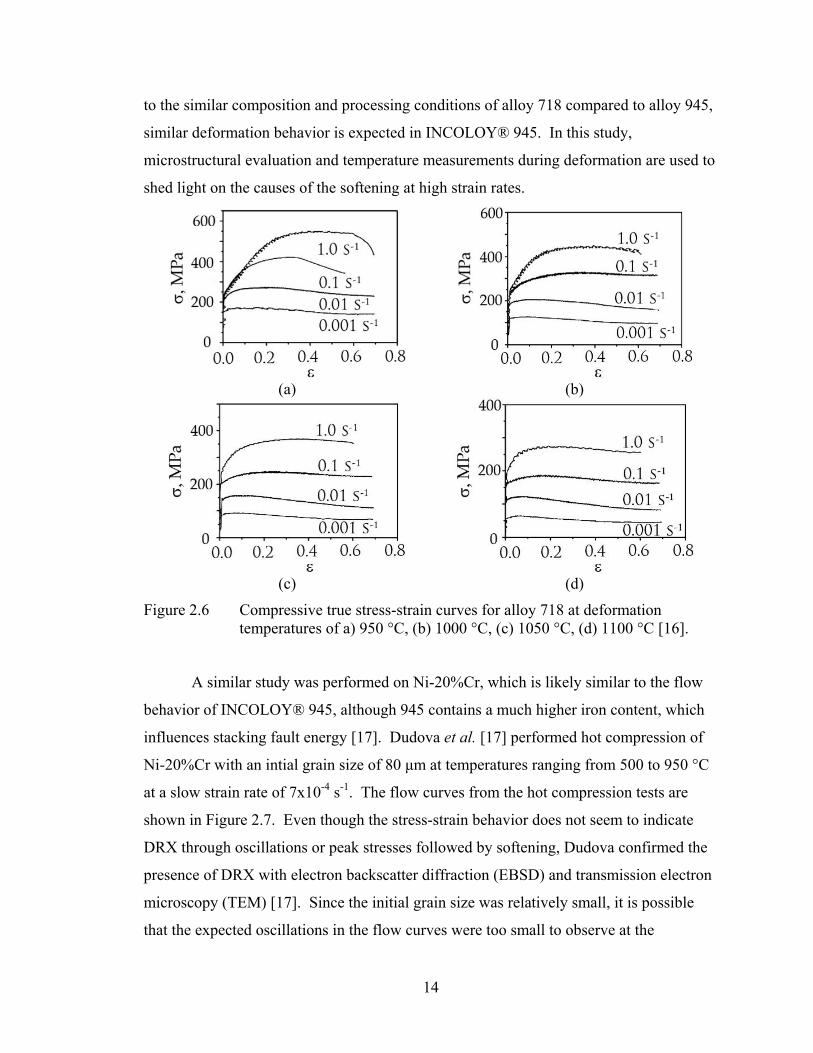
Figure 2.6 Compressive true stress-strain curves for alloy 718 at deformation temperatures of a) 950 °C, (b) 1000 °C, (c) 1050 °C, (d) 1100 °C [16]. .. 14
Figure 2.7 Flow behavior of Ni-20%Cr during hot compression at varying deformation temperatures and a strain rate of 7x10⁻⁴ s-1 [17]. .................. 15
Figure 2.8 Schematics showing (a) boundaries dragged by impurities and bulging driven by locally concentrated dislocations, and (b) boundaries dragged and bulging driven by low angle boundaries. Both forms of BLG often lead to dynamic recrystallization [23]. ................................... 19
Figure 2.9 Schematic showing subgrain rotation as a mechanism leading to continuous dynamic recrystallization [23]................................................ 21
Figure 2.10 Effect of deformation conditions on dynamic recrystallization behavior observed by (a) Shimizu for Quartz [23], and (b) Dudova for Ni20%Cr. SGR: subgrain rotation; BLG: grain boundary bulging; GBM: grain boundary migration; CDRX: continuous dynamic recrystallization; DDRX: discontinuous dynamic recrystallization [17].. 21

viii
Figure 2.11 Subgrain coalescence (SGC) in high stacking fault energy materials where cells A, B, and C combine to form one recrystallization nuclei [7]. ............................................................................................................. 23
Figure 2.12 Subgrain growth (SGG) leading to SRX where areas of high strain energy and orientation gradients migrate out to form a recrystallization nuclei [7]. .................................................................................................. 24
Figure 2.13 Strain induced grain boundary migration (SIBM) leading to SRX, which occurs by migration of a high angle boundaries that are partially pinned by subboundaries. The migration is driven by differences in dislocation density on opposite sides of the boundary [7]. ....................... 25
Figure 2.14 Electron backscatter diffraction results showing the relative frequency of misorientation angles for alloy 718 compressed to different strains at a strain rate of 10-1 s-1 and a temperature of: (a) 950 °C, and (b) 1100 °C [19].............................................................................................. 26
Figure 2.15 Several proposed models for dynamic recrystallized grain size as a function of the Zener-Holloman parameter for alloy 718 at constant strains [16,18,29]. ..................................................................................... 28
Figure 2.16 Deformation dwell time history for three positions along a workpiece deformed using radial forging at a rate of one minute per pass [21,30]. .. 30
Figure 2.17 Variation of average grain size with the Zener-Holloman parameter for alloy 718 [31]. ........................................................................................... 31
Figure 2.18 Schematic representation of texture evolution during compression of an fcc material showing (a) the rotation of the slip plane normal towards the compression axis and (b) the path of rotation of the compression axis toward [110] [40]. ........................................................ 35
Figure 2.19 Predicted inverse pole figures of uniaxially compressed fcc materials using (a) the Taylor model and (b) the Self-Consistent model [41]. ........ 36
Figure 2.20 Inverse pole figures comparing textures of several fcc materials. Top row: initial bar stock textures; Middle row: Taylor simulations of compressed textures; Bottom row: Experimental textures after uniaxial compression to 2.0 strain [39]................................................................... 37
Figure 2.21 Inverse pole figures of nickel (a and b) and copper (c and d) compressed at the following deformation conditions: (a) ε = 0.94 at 900 °C and 10-4 s-1, (b) ε = 1.7 at 632 °C and 10-4 s-1, (c) ε = 1.0 at 800 °C and 10-4 s-1, and (d) ε = 1.5 at 364 °C and 10-3 s-1 [15]. ............... 38
Figure 2.22 Recrystallization {111} textures of cold rolled (a) aluminum, (b) copper, (c) Cu-37%Zn brass, and (d) two-phase Al-Mn AA3103 [39]. ... 40

ix
Figure 2.23 Plot showing the evolution of deformation and recrystallization texture components as percent recrystallization is increased during annealing of cold-rolled copper [39]. ........................................................................ 40
Figure 2.24 Inverse pole figures of dynamically recrystallized textures of pure nickel during uniaxial compression to (a) 0.10 strain at 900 °C and 10-
4 s-1 and (b) 0.31 strain at 632 °C and 10-4 s-1 [15]. .................................. 41
Figure 3.1 Results from initial heat treatment study on INCOLOY® 945 compression specimens at 1200 °C showing (a) grain size converging to a constant value after approximately 60 minutes, and (b) the resulting microstructure after a 90 minute heat treatment at 1200 °C (ASTM grain size > 00, 410 μm).............................................................. 45
Figure 3.2 Hot compression specimen design with recessed face ends for lubricant well [47]..................................................................................... 45
Figure 3.3 Servohydraulic machine and clamshell furnace used for hot compression testing shown (a) schematically [21] and (b) photographically. ...................................................................................... 46
Figure 3.4 Schematic showing the processing history of specimens subjected to single-step hot uniaxial compression. ....................................................... 49
Figure 3.5 Correct EBSD indexing as a function of the confidence index for polycrystalline aluminum [54]. ................................................................. 56
Figure 3.6 EBSD alignment correction changed from (a) default software settings to (b) aligning the normal direction parallel to the compression axis [55]. ........................................................................................................... 56
Figure 4.1 True stress-true strain curves for INCOLOY® 945 tested at strain rates ranging from 0.001 s-1 to 1 s-1 and temperatures of (a) 950 °C, (b) 1000 °C, (c) 1050 °C, (d) 1100 °C, and (e) 1150 °C. Part (f) shows a schematic stress-strain curve of INCOLOY® 945 during hot compression, divided into four regions..................................................... 62
Figure 4.2 Yield stresses of INCOLOY® 945 determined for the experimental deformation conditions. ............................................................................ 64
Figure 4.3 Curves showing the rate of stress change with strain, dσ/dε, for INCOLOY® 945 tested at strain rates ranging from 0.001 s-1 to 1 s-1 and temperatures of (a) 950 °C, (b) 1000 °C, (c) 1050 °C, (d) 1100 °C, and (e) 1150 °C. ........................................................................................ 65
Figure 4.4 The strains corresponding to the transition from Stage III (or Stage II in specimens where Stage III deformation is absent) to Stage IV

x
deformation for INCOLOY® 945 (a) isothermally and (b) at constant strain rates. ................................................................................................ 66
Figure 4.5 Magnified true stress-strain curve of the specimen compressed at 1150 °C at a strain rate of 0.001 s-1, shown (a) unaltered, and (b) altered to remove machine noise and/or dynamic strain aging to reveal a macroscopic DRX oscillation. ............................................................... 67
Figure 4.6 The change in deformation temperature normalized by the target temperature measured as a function of strain during high temperature compression of INCOLOY® 945. ............................................................ 68
Figure 4.7 Internal crack formation observed at low deformation temperatures and high strain rates (high stress deformation) possibly caused from localized deformation and likely leading to the drastic softening observed in stress-strain curves. Representative scanning electron images shown in (a) and (b) were taken after hot compression to 1.0 strain (compression direction shown by arrows) at a test temperature of 950 °C and strain rate of 1.0 s-1. ............................................................... 69
Figure 4.8 True stress-true strain curves for (a) alloy 718 showing a return of a load drop after 70-second hold times at 1150 °C [30], and (b) INCOLOY® 945 showing the return of a load drop after 5.5-minute hold times at 1150 °C between passes. The applied strain in (b) was 0.23 per pass at an engineering strain rate of 0.1 s-1. ................................ 70
Figure 4.9 Model comparison to experimentally measured temperature increases from deformation heating of INCOLOY® 945 during hot compression at a strain rate of 1.0 s-1. The model assumes 100% conversion of work to heat............................................................................................... 77
Figure 4.10 Microstructures of INCOLOY® 945 after uniaxial compression to a strain of 0.97 at deformation temperatures of (a-d) 950 °C, (e-h) 1000 °C, (i-l) 1050 °C, (m-p) 1100 °C, and (q-t) 1150 °C with each column increasing in magnitude of strain rate from about 0.001 s-1 to 1.0 s -1. Microstructures were revealed using a 7-acids etchant. ........................... 81
Figure 4.11 Percent recrystallization (a) and recrystallized grain size (b) in INCOLOY® 945 after hot compression to a strain of 1.0 at the experimental strains and strain rates. ........................................................ 82
Figure 4.12 ECCI images showing recrystallization and substructure formation in INCOLOY® 945 compressed to 1.0 strain at strain rates of (a-c) 0.001 s-1 and (d-f) 1.0 s-1 at temperatures of (a and d) 950 °C, (b and e) 1050 °C and (c and f) 1150 °C.................................................................. 84
Figure 4.13 Grain boundary misorientation maps of INCOLOY® 945 specimens compressed to 1.0 strain at (a and b) 950 °C, (c and d) 1050 °C, and (e

xi
and f) 1150 °C at strain rates of (a, c, and e) 0.001 s-1 and (b, d, and f) 1.0 s-1. Refer to the electronic document for color imaging. Grain misorientations are indicated by red (2-5°), green (5-15°), blue (>15°), and purple (60°±5° [111] twin)................................................................. 85
Figure 4.14 The distribution of grain misorientations in INCOLOY® 945 after hot compression to 1.0 strain at strain rates of 0.001 and 1.0 s-1 at deformation temperatures of (a) 950 °C, (b) 1050 °C, and (c) 1150 °C... 86
Figure 4.15 Misorientation distribution function of INCOLOY® 945 after compression to 1.0 strain at 1150 °C and a strain rate of 0.001 s-1........... 88
Figure 4.16 Precipitation along initial high angle grain boundaries observed in INCOLOY® 945 specimens compressed to 1.0 strain at 950 °C. The ECCI images shown above were taken from a specimen compressed at a strain rate of 0.001 s-1. Image (b) shows a zoomed in view of the area outlined by the dotted boxed in (a).................................................... 89
Figure 4.17 Intergranular precipitation in INCOLOY® 945 compressed to 1.0 strain at 950 °C. The precipitates shown in the ECCI image (a) appear to be niobium-rich shown by the niobium EDS map in (b), indicative of the high temperature Ni3Nb δ phase. .................................................... 89
Figure 4.18 Hardness profiles of INCOLOY® 945 specimens compressed to 1.0 true strain as a function of deformation temperature and strain rate. ....... 90
Figure 4.19 Magnified true stress-true strain curve (a), and microstructure of INCOLOY® 945 after uniaxial compression at a deformation temperature of 1050 °C, strain rate of 0.001 s-1, and strains of (b) 0.2, (c) 0.4, (d) 0.6, (e) 0.8, and (f) 1.0, showing evolution of DRX. Microstructures were revealed using a 7-acids etchant. ........................... 91
Figure 4.20 Recrystallized grain size and volume fraction of recrystallized grains during hot compression of INCOLOY® 945 at 1050 °C and 0.001 s-1.... 92
Figure 4.21 Grain misorientation maps of INCOLOY® 945 specimens compressed at 1050 °C and 0.001 s-1 to strains of (a) 0, or the non-deformed material, (b) 0.2, (c) 0.4, (d) 0.6, (e) 0.8, and (f) 1.0. Refer to the electronic document for color imaging. Grain misorientations are indicated by red (2-5°), green (5-15°), blue (>15°), and purple (60°±5° [111] twin). ............................................................................................... 94
Figure 4.22 Histogram showing the change in distribution of grain misorientations with increasing compressive strain for INCOLOY® 945 deformed at 1050 °C and 0.001 s-1................................................................................ 95
Figure 4.23 TEM images showing (a) SRX structure in non-deformed material, (b) microstructure after compression to 1.0 strain at 1150 °C and 0.001 s-1

xii
resulting in DRX, and (c and d) microstructure after compression to 1.0 strain at 1150 °C and 1.0 s-1 resulting in a mix of DRX (c) and SRX (d). .................................................................................................... 96
Figure 4.24 ECCI images of INCOLOY® 945 showing (a) substructure formation within a recrystallized grain indicating DRX after compression to 1.0 strain at 1150 °C and 0.001 s-1 and (b) substructure-free recrystallized grains indicating at least some SRX after compression to 1.0 strain at 1150 °C and 1.0 s-1.................................................................................... 98
Figure 4.25 Light optical images of INCOLOY® 945 after hot compression to 1.0 strain at (a and b) 1050 °C and (c and d) 1150 °C at strain rates of (a and c) 0.001 s-1 and (b and d) 1.0 s-1 showing serrated grain boundaries (dotted arrows), bulging of non-recrystallized grains (solid arrows), and necklace structures suggesting BLG as the dominant recrystallization mechanism...................................................................... 99
Figure 4.26 Dislocation tangles indicating the beginning of subgrain formation in INCOLOY® 945 specimens compressed to 1.0 strain at 1150 °C and strain rates of (a and b) 0.001 s-1 and (c) 1.0 s-1...................................... 101
Figure 4.27 TEM bright field images of an INCOLOY® 945 specimen compressed to 1.0 strain at 1150 °C and 0.001 s-1 showing grain and subgrain misorientations calculated using selected area electron diffraction........ 102
Figure 4.28 Plots showing the (a) log relationship between flow stress and strain rate and (b) relationship between natural log flow stress and inverse temperature for INCOLOY® 945, used in determining stress exponents, n, and activation energies for deformation, Q, respectively. 105
Figure 4.29 Plots showing the variations of calculated (a) stress exponents and (b) activation energies for INCOLOY® 945................................................ 106
Figure 4.30 Plot (a) shows the calculated strain rate sensitivities for the experimental deformation conditions for INCOLOY® 945. A schematic of strain rate sensitivity across a wide range of temperatures is shown in part (b). ................................................................................ 107
Figure 4.31 The relationship between grain size and temperature for INCOLOY® 945; the slopes (-cQ/R) are related to activation energy for deformation. ............................................................................................ 108
Figure 4.32 Comparison of experimental data and mathematical models for flow stress of INCOLOY® 945 showing (a) model that does not account for deformation heating and (b) model taking into account deformation heating through temperature correction. ................................................. 109

xiii
Figure 4.33 Natural log relationship between recrystallized grain size, d, and the Zener-Holloman parameter, Z, after hot uniaxial compression of INCOLOY® 945 to a strain of 1.0 at the experimental deformation conditions. Experimental data is compared to a semi-empirical model. 111
Figure 4.34 Keys used for (a) coloring of the pole figure maps shown in Figure 4.35 and Figure 4.37 and (b) determining the pole densities shown in the inverse pole figures of Figure 4.36, Figure 4.38, and Figure 4.40. Refer to the electronic copy for color interpretation............................... 113
Figure 4.35 Inverse pole figure maps showing the distribution of crystallographic poles oriented parallel to the compression axis for INCOLOY® 945 compressed to 1.0 strain at (a and d) 950 °C, (b and e) 1050 °C, (c and f) 1150 °C at strain rates of (a-c) 0.001 s-1 and (d-f) 1.0 s-1. Refer to the electronic copy for the color version................................................. 113
Figure 4.36 Inverse pole figures showing the distribution of crystallographic poles oriented parallel to the compression axis for INCOLOY® 945 compressed to 1.0 strain at (a and b) 950 °C, (c and d) 1050 °C, (e and f) 1150 °C at strain rates of (a, c, and e) 0.001 s-1 and (b, d, and f) 1.0 s-1. Textures of the overall microstructure and recrystallized regions are shown. .................................................................................. 114
Figure 4.37 Inverse pole figure maps showing the distribution of crystallographic poles oriented parallel to the compression axis for INCOLOY® 945 compressed at 1050 °C and 0.001 s-1 to strains of (a) 0.0 or non-deformed material, (b) 0.2, (c) 0.4, (d) 0.6, (e) 0.8, and (f) 1.0. Refer to the electronic copy for the color version. ........................................... 117
Figure 4.38 Inverse pole figures showing the distribution of crystallographic poles oriented parallel to the compression axis for INCOLOY® 945 compressed at 1050 °C and 0.001 s-1 to strains of (a) 0.0 or non-deformed material, (b) 0.2, (c) 0.4, (d) 0.6, (e) 0.8, and (f) 1.0. Textures of the overall microstructure as well as textures of the recrystallized regions are shown............................................................. 118
Figure 4.39 Evolution of texture in INCOLOY® 945 compressed at 1050 °C and 0.001 s-1 shown by the change in maximum pole density, PMAX, with strain........................................................................................................ 119
Figure 4.40 Inverse pole figures of INCOLOY® 945 compressed to 1.0 strain at 1050 °C and 0.001 s-1 with textures taken from (a) the radial center of a longitudinal cross-section, (b) the radial edge of a longitudinal cross-section, and (c) the radial center of a lateral cross section...................... 120
Figure B.1 Misorientation distribution functions of INCOLOY® 945 compressed to 1.0 strain at 950 °C and at strain rates of (a) 0.001 s-1 and (b) 1.0 s-1. 139

xiv
Figure B.2 Misorientation distribution functions of INCOLOY® 945 compressed to 1.0 strain at 1050 °C and at strain rates of (a) 0.001 s-1 and (b) 1.0 s-
1. .............................................................................................................. 140
Figure B.3 Misorientation distribution functions of INCOLOY® 945 compressed to 1.0 strain at 1150 °C and at strain rates of (a) 0.001 s-1 and (b) 1.0 s-
1. .............................................................................................................. 141
Figure C.1 Misorientation distribution function of INCOLOY® 945 starting material (zero imposed strain). ............................................................... 143
Figure C.2 Misorientation distribution function of INCOLOY® 945 compressed to 0.2 strain at 1050 °C and a strain rate of 0.001 s-1.............................. 143
Figure C.3 Misorientation distribution function of INCOLOY® 945 compressed to 0.4 strain at 1050 °C and a strain rate of 0.001 s-1.............................. 144
Figure C.4 Misorientation distribution function of INCOLOY® 945 compressed to 0.6 strain at 1050 °C and a strain rate of 0.001 s-1.............................. 144
Figure C.5 Misorientation distribution function of INCOLOY® 945 compressed to 0.8 strain at 1050 °C and a strain rate of 0.001 s-1.............................. 145
Figure C.6 Misorientation distribution function of INCOLOY® 945 compressed to 1.0 strain at 1050 °C and a strain rate of 0.001 s-1.............................. 145
xv
LIST OF TABLES
Table 2.1 Weight percent chemical compositions of INCONEL® 718, INCOLOY® 925, and the hybrid alloy of interest, INCOLOY® 945 [1-3]............................................................................................................. 6
Table 2.2 Classification of dynamic recrystallization nucleation and growth mechanisms [23] ....................................................................................... 23
Table 2.3 Hot compression parameters used in the development of dynamic recrystallized grain size models ................................................................ 28
Table 3.1 Chemical composition of INCOLOY® 945 used in this study (weight percent) ..................................................................................................... 44
Table 3.2 Target hot compression conditions compared to actual measured strains and strain rates............................................................................... 50
Table 3.3 Steps used to prepare specimens for light optical microscopy (LOM), scanning electron microscopy (SEM), and electron backscatter diffraction (EBSD).................................................................................... 51
Table 4.1 Yield stresses and deformation paths for compression according to Figure 4.1f for the experimental deformation conditions ......................... 63
Table 4.2 Measured increases in temperature in INCOLOY® 945 specimens compressed to a strain of 1.0 at various temperatures and strain rates ..... 68
Table 4.3 Diffusivities and activation energies for diffusion of several species in a nickel and iron matrix [60,61]............................................................... 72
Table 4.4 Diffusion rates for several species in an fcc nickel and bcc iron matrix .. 72
Table 4.5 Possible coincident site lattices observed in INCOLOY® 945 recrystallized structures and the fraction of CSL boundaries present after 1.0 compressive strain at 1150 °C and a strain rate of 0.001 s-1....... 88
Table 4.6 Values of strain-rate dependent material constant, c, used in recrystallized grain size modeling .......................................................... 111

xvi
ACKNOWLEDGEMENTS
The author of this work would like to extend a special thank you to the Advanced
Steel Processing and Products Research Center (ASPPRC) at Colorado School of Mines
(CSM), participating industrial sponsors, and the Forging Industry Education and
Research Foundation (FIERF) for the funding and technical support throughout the
completion of this research. In particular, the advisor to this work, Dr. Kip Findley, and
participating thesis committee members, Dr. Marty Mataya and Dr. Chet Van Tyne of
Colorado School of Mines. The industrial mentors to this work, Dr. Roger Jaramillo and
Dr. John Weber from Precision Castparts Corporation – Special Metals were key
contributors by initiating this project proposal, providing machined material for testing,
and offering continual constructive feedback. The ASPPRC administrative assistant,
Elaine Sutton, was tremendously helpful in organizing travel arrangements and
supporting financial matters. Undergraduate research assistants Pete Stacey and Dane
Lindblad assisted in manual labor, improving research efficiency. Fellow graduate
student colleagues and post-doctorate members of the ASPPRC, especially Dr.
Emmanuel De Moor, Nika Muckelroy, Lee Rothleutner, and Tyson Brown were essential
for assistance in interpreting new data, information technology (IT) support, and
maintaining a good balance between work and social interactions.
Special recognition should also be made to Dr. John Chandler and Gary Zito, both
research faculty at CSM, for training and assistance with advanced microscopy work
including SEM, EBSD, and TEM. Dr. Elliot Brown made all of the TEM work possible
through devoted assistance in sample preparation, training, TEM diffraction acquisition,
and interpretation.
Lastly, and most importantly, the author would like to thank our gracious God,
loving and supportive parents Mary and Jim Coryell, brothers Jason and Ryan Coryell,
and their wives Melodie and Jennifer Coryell, respectively, for their presence in times of
need and support through the good and bad. I owe the rest of my career to Jason and my
Dad; their careers in metallurgical engineering inspired me to follow in their footsteps.
For all those mentioned above, and certainly others that remain unmentioned, I
am forever in your debt. Thank you for your continued devotion.


1
CHAPTER 1 : INTRODUCTION
Increasing energy demands are forcing oil producers to drill in harsh
environments requiring improved structural materials. The current demand for forged
rod from the oil industry is significant and the ability to produce consistent, quality
product is key for producers. The demand for improved materials is continuously
pushing producers to obtain superior properties through microstructural control. For
forged superalloy rod, such requirements call for fine grains and tight restrictions on
grain size uniformity. Understanding flow and recrystallization behavior is critical for
optimizing forge and annealing practices to meet these requirements. Knowledge
regarding recrystallization behavior during multi-step forging would contribute to
consistently meeting current microstructural requirements and addressing future needs.
Most high temperature superalloy forging studies have been conducted on alloy
718, originally developed by Special Metals Corporation as INCONEL® 718. There are
other alloys being developed to meet strength and corrosion requirements of the oil
industry. One example is INCOLOY® alloy 945, a newly developed hybrid of alloys
718 and 925 with a unique combination of strength and corrosion resistance. The effect
of alloying on flow behavior and microstructural evolution has not been studied
comprehensively for the class of alloys close to the alloy 718 composition. In general,
the results from hot deformation studies in a single phase field are applicable to wide
range of metallic systems including those with nickel, iron, or nickel-iron based
compositions.
1.1 Research Objectives
The research presented in this thesis used INCOLOY® 945 to investigate five
primary objectives, listed below:

2
1. Examine the hot compression behavior and microstructural evolution of
INCOLOY® 945 as a function of temperature and strain rate.
2. Evaluate models that predict flow and recrystallization behavior based on the
Zener-Holloman parameter.
3. Compare the flow/recrystallization behavior of INCOLOY® 945 to other
alloys based on composition and stacking fault energy.
4. Understand recrystallization mechanisms of INCOLOY® 945 and assess the
applicability to other austenitic alloys.
5. Examine the relationships between texture evolution and deformation
conditions, including temperature, compressive strain, and strain rate.
1.2 Thesis Overview
In this investigation, INCOLOY® 945 was the material system used to study flow
and recrystallization behavior during hot compression that emulated conventional forging
processes. Elevated temperature uniaxial compression was performed at varying
temperatures, strains, and strain rates. Resulting flow behavior was related to
corresponding microstructural development. Multiple microscopy techniques, such as
light optical microscopy (OM), scanning electron microscopy (SEM), electron
backscatter diffraction (EBSD), and transmission electron microscopy (TEM) were used
to investigate microstructural evolution, texture development, grain misorientations, and
possible recrystallization mechanisms. Finally, steady state flow behavior and
recrystallized grain sizes were related to the Zener-Holloman parameter through
previously developed models, and their physical meaning was interpreted in terms of
strain rate sensitivity and activation energy for deformation. The flow and
recrystallization behavior was compared to deformation in similar alloys such as alloy
718 to determine the effect of alloying and starting microstructure on hot deformation
behavior.
Chapter 2 contains the background section on hot deformation and
recrystallization behavior. The background describes the different regions of typical flow
curves during high temperature deformation and the effects of grain sizes, deformation

3
conditions, and stacking fault energies on the microstructural evolution and flow
behavior. The mechanisms for dynamic and static recrystallization described in the
literature are discussed as a prelude to the work on INCOLOY® 945. Previously
proposed models for steady state stress and recrystallized grain sizes during hot
deformation have shown tremendous differences, so understanding the limitations of such
models is essential for applying them to new materials and deformation conditions. The
Background in Chapter 2 discusses some of these limitations, proposes reasons for some
of the controversy in the literature, and describes the benefits to modeling flow and
recrystallization behavior. The effects of initial microstructures and stacking fault
energies on texture evolution and recrystallization mechanisms are also described.
The experimental procedures are described in Chapter 3, including the methods
used for hot compression testing and subsequent microstructural and texture analysis.
Specific operating conditions for scanning electron microscopy, electron backscatter
diffraction, and transmission electron microscopy are provided. The design of the
experimental procedures is also discussed and related to some of the discrepancies in
recrystallization mechanisms and modeling, which are discussed in Chapter 2.
Finally, the Results and Discussion, presented in Chapter 4, use INCOLOY® 945
as a model material for further understanding flow behavior and recrystallization of
austenitic materials. Regions of the stress-strain curves are analyzed and compared to
similar alloys such as alloy 718 or stainless steels, proposing possible mechanisms
driving the shape of the flow curves. Microstructural and texture evolution assist in
understanding characteristics in the flow curves and describing the modes of deformation
and recrystallization at varying temperatures, strains, and strain rates. Models for steady
state flow behavior and recrystallized grain size are presented for INCOLOY® 945 with
a detailed description on their development and limitations.


5
CHAPTER 2 : BACKGROUND
Several studies have been performed in the past to understand deformation and
recrystallization behavior in a wide range of materials during high temperature
deformation. In this chapter, deformation and recrystallization behavior of alloy 718 and
other fcc austenitic alloys are discussed as a prelude to the investigation of the new
INCOLOY® 945. The behavior of the alloys discussed in this chapter is subsequently
compared to expected behavior in INCOLOY® 945.
2.1 Alloy Comparison
INCONEL® and INCOLOY® alloys are often used because of their cryogenic
properties, fatigue resistance and mechanical strength at moderate temperatures, and
moderate creep strength. INCONEL® 718, INCOLOY® 925, and INCOLOY® 945 are
nickel-based superalloys that were originally developed by Special Metals Corporation to
have excellent corrosion resistance, mechanical properties sufficient for application at a
wide range of temperatures, and excellent weldability [1]. The chemical compositions of
alloys 718, 925 and 945 are shown in Table 2.1 [1-3]. INCOLOY® 945 and 925 have a
larger copper content compared to alloy 718, which likely contributes to the improved
machinability and corrosion resistance. The two most abundant elements (nickel and
chromium) provide the alloys’ resistance to corrosion, oxidation, and carburizing, even at
high temperatures [4], while chromium and molybdenum act as solid solution
strengtheners [4].
Nickel-base superalloys are often used in their precipitation hardened state. Grain
boundary precipitation during high temperature processing and cooling produces
intergranular flow resistance at high temperatures. Intragranular precipitation is
produced by aging the material, after forging at solutionizing temperatures, and rapid
quenching. Intragranular precipitation is not be addressed in this project because the

6
focus of the project is on the hot deformation microstructures that evolve during the
forging process, but a short summary of precipitation in nickel-base superalloys is
Table 2.1 Weight percent chemical compositions of INCONEL® 718, INCOLOY® 925, and the hybrid alloy of interest, INCOLOY® 945 [1-3].
INCONEL® 718 INCOLOY® 945 INCOLOY® 925
Ni 50.00-55.00 45.00-55.00 42.00-46.00
Cr 17.00-21.00 19.50-23.00 19.50-22.50
Fe Balance Balance 22.00 min.
Nb+Ta 4.75-5.50 2.50-4.50 0.50 max.
Mo 2.80-3.30 3.00-4.00 2.50-3.50
Ti 0.65-1.15 0.50-2.50 1.90-2.40
Al 0.20-0.80 0.01-0.70 0.10-0.50
Co 1.00 max. -- --
C 0.08 max. 0.005-0.040 0.03 max.
Mn 0.35 max. 1.00 max. 1.00 max.
Si 0.35 max. 0.50 max. 0.50 max.
P 0.015 max. 0.03 max. --
S 0.015 max. 0.03 max. 0.03 max.
B 0.006 max. -- --
Cu 0.30 max. 1.50-3.00 1.5-3.50
provided as a reference. Several of the alloying elements contribute to potential
precipitation. Carbon is added to precipitate (Nb,Ti)C carbides [4]. Titanium and
aluminum precipitate as the Ni3(Ti,Al) metastable γ'-phase [4]. Niobium is added to
produce the most effective hardening phase, Ni3Nb or γ'' [4]. The γ''-phase, although
effective in precipitation hardening, is metastable. At elevated temperatures (about 950-
1050 °C) the coherent ordered body centered tetragonal γ'' phase in alloy 718 transitions
to an incoherent orthorhombic δ-phase (still having a composition of Ni3Nb) [4,5]. At
this point, little research has been conducted regarding the precipitate phases in
INCOLOY® 945. However, preliminary research has shown that the δ-phase is rarely

7
present in INCOLOY® 945, likely due to the decreased niobium content [6]. Instead, a
higher temperature Ni3Ti η-phase precipitates, which may be a more stable form of the γ'-
phase. The exact precipitation temperatures have not yet been precisely determined, but
the η-phase does not appear to be present above 950 °C.
2.2 Flow Behavior during Hot Deformation
During high temperature deformation, several processes may occur driving a
change in the material’s flow behavior: dislocation multiplication, strain aging, recovery,
recrystallization, creep, etc. The goal of this section is to shed light on how these
processes appear in the form of stress-strain behavior and the flow stress dependence on
initial microstructure and deformation conditions.
2.2.1 Experimental Flow Behavior
When a recrystallized metal is deformed at a constant strain rate at elevated
temperatures, the flow curves may be divided into three regions. Regions 1 and 2 are
represented by Zr-0.7%Sn flow curves in Figure 2.1a, deformed at 775 °C and three
different strain rates. Regions 2 and 3 are represented in Figure 2.1b by the flow curves
of Armco iron deformed at 700 °C and seven different strain rates [7].
In the first region, shown in Figure 2.1a, the material is primarily deforming
elastically and microstrain deformation may occur. The experimentally measured slope
of the stress-strain curve in this region (dσ/dε) ranges from approximately E/50 at high
temperatures and low strain rates to about E/5 at intermediate deformation temperatures
and high strain rates, where E is Young’s modulus [8]. The deviation in the slope from
the modulus may be attributed to the microscopic plastic strain produced during loading
prior to macroscopic flow [7,8] and inaccuracy in measuring material elastic strain with
conventional extensometry or actuator displacement. As macroscopic yielding
commences, the initial work hardening rate is E/100-E/500 depending on the deformation
conditions as shown for Zr-0.7%Sn in Figure 2.1a and Armco iron in Figure 2.1b [8].
The dislocation density at the yield point is typically about three orders of magnitude

8
lower than that achieved at steady state flow (in region three discussed below) [7]. In
general, yield drops are not observed because there is sufficient thermal aid for
dislocations to overcome barriers and accommodate the imposed strain rate at elevated
temperatures [7].
(a) (b)
Figure 2.1 Stress-strain curves and hot deformation regions of (a) Zr-0.7%Sn compressed at 775 °C (0.5Tm) and (b) Armco iron compressed at 700 °C (0.54Tm) with strain rates ranging from 1.5x10⁻⁵ to 8.0x10⁻¹ [7,9].
The transition from region one, where the material primarily deforms elastically,
to region two, where macroscopic plastic deformation commences, may be clearly seen in
Figure 2.1a. In the second region, the material work hardens from dislocation
multiplication. The rate of work hardening gradually decreases until region three, where
a balance of work hardening and softening mechanisms is achieved and the work
hardening rate is approximately zero. Region three is clear for Armco iron (Figure 2.1b)
where a steady-state stress level is reached; the steady state stress is higher for higher
strain rates [9]. Steady state stress is the result of a balance between work hardening and
dynamic recovery. However, depending on the material and deformation conditions,
Region 2 Region 1

9
other mechanisms such as recrystallization, deformation heating, precipitate coarsening,
superplastic flow, or modification of hard textures could cause flow softening while
strain induced precipitation or the elimination of textures could cause further strain
hardening [7]. These mechanisms are considered in the analysis of INCOLOY® 945
flow behavior during hot compression.
In order to achieve thermally aided flow where the contribution to flow resistance
from athermal obstacles is diminished and recovery can occur, a material must be
deformed in a sufficiently high temperature regime. The transition from athermal flow at
low deformation temperatures to thermally activated flow at high temperatures is strain
rate dependent and shown in Figure 2.2a [7]. Figure 2.2b shows how flow stress changes
as a function of the temperature corrected strain rate, or Zener-Holloman parameter (Z),
which is discussed further in the next section. At low Z values (corresponding to high
deformation temperatures and low strain rates), the yield stress, σy, and steady state flow
stress, σs, are relatively low. As Z is increased, the yield stress becomes increasingly less
dependent on temperature and strain rate until an athermal flow condition is achieved
between 1011 and 1012 s-1 [7]. In addition, as Z is increased (deformation temperature is
decreased and strain rate is increased), achieving a steady state flow stress becomes more
and more difficult because there is not enough thermal aid for recovery or
recrystallization [7].
(a) (b)
Figure 2.2 Transition from athermal deformation to thermally aided deformation shown by (a) a flow stress transition with temperature where 21 εε && > and (b) stress dependence on the Zener-Holloman parameter [7].

10
Dynamic recrystallization is another softening mechanism. Dynamic
recrystallization manifests itself as oscillations in the flow curve as shown in Figure 2.3a,
which were not shown in the flow curves of Figure 2.1a and b [7,10-12]. At high strain
rates, the flow stress increases to a peak stress that corresponds to a critical strain,
triggering the onset of recrystallization. Recrystallization causes the stress to decrease to
a value between the peak and yield stresses [7]. Before recrystallization is complete,
recrystallized grains begin recrystallizing again, creating a continual formation of nuclei
and keeping the average flow stress low [7]. At low strain rates, the flow curve also
increases to a peak stress triggering recrystallization at a critical strain value, but contrary
to high strain rates there is enough time during subsequent deformation for the
recrystallized grains to work harden. As the recrystallized grains work harden, the flow
stress increases again to another peak, triggering a second cycle of recrystallization, and
so on. Therefore, materials exhibiting dynamic recrystallization at low strain rates often
contain several oscillations in the flow curve, decreasing in amplitude with strain [7,10-
12]. Decreasing temperature has the same effect as increasing strain rate for the effect of
dynamic recrystallization on flow behavior, as shown in Figure 2.3b for 0.68% steel
deformed at 1.3x10⁻³ s-1 [13]. Intermediate deformation temperatures result in a single
peak in the flow curve for dynamic recrystallization while oscillations are observed in the
flow curves at high deformation temperatures. The critical strain for the onset of
dynamic recrystallization increases with increasing strain rate and decreasing
deformation temperature [7,11]. Dynamic recrystallization is discussed in more detail in
Section 2.3.
Sakai investigated the effects of initial grain size on the flow behavior of nickel
and copper during dynamic recrystallization [13,14]. He found that materials with a large
initial grain size exhibited a single peak in the flow curve during dynamic
recrystallization (similar to low temperature or high strain rate conditions), while
oscillations in the flow curves were present with small initial grain sizes. This conclusion
held true for both nickel and copper, regardless of the loading conditions [13,14]. Figure
2.4a shows this initial grain size effect on copper deformed via hot compression at
502 °C and a strain rate of 2x10⁻³ s-1 while Figure 2.4b shows the same effect for hot
torsion of nickel at 1000 °C and 3.8x10⁻⁴ s-1. Sakai also concluded that single peak DRX

11
of large initial grains indicated grain refining to a mean recrystallized grain size while
oscillations during DRX of small initial grains resulted in grain coarsening after
recrystallization to the same mean recrystallized grain size [13,14]. Therefore,
recrystallized grain size is simply a function of temperature and strain rate.
(a) (b)
Figure 2.3 Dynamic recrystallization shown by (a) theoretical flow curves labeling important aspects of the recrystallization process [7], and (b) hot compression of 0.68% C steel at a strain rate of 1.3x10⁻³ s-1 [13].
The effects of stacking fault energy (SFE) on the flow behavior of fcc materials
during dynamic recrystallization was investigated by Hasegawa et al. [15]. Hasegawa
compared hot compression data of γ-TiAl, pure nickel, and pure copper in order of
decreasing SFE. Figure 2.5 shows the stress-strain behavior of these materials
compressed at various temperatures and strain rates. The γ-TiAl reached much larger
stresses than nickel and copper, even at higher deformation temperatures. The γ-TiAl
exhibited single-peak DRX flow curves, as discussed above, while copper exhibited
oscillations during DRX and nickel showed both curve shapes depending on deformation
conditions [15]. Although the SFE varied from material to material, other factors may
affect the shape of the flow curves (e.g. initial grain size). A transition from an
oscillation-type flow curve at low Zener-Holloman conditions to single-peak flow at high
Zener-Holloman conditions was observed in pure nickel, which is consistent with the

12
conclusions made above. Lastly, although not specifically pointed out by Hasegawa in
the deformation behavior analysis, the flow curves of pure nickel and copper (low
stacking fault energies) in hot compression exhibited serrations indicative of dynamic
strain aging, while the higher SFE γ-TiAl did not. Dynamic strain aging (DSA) refers to
the repetitive locking of dislocations during deformation, which is discussed further in
Section 4.1.2.
(a) (b)
Figure 2.4 Stress strain curves showing the effect of initial grain size on dynamic recrystallization behavior in (a) hot compression of copper at 502 °C and 2x10⁻³ s-1 [14], and (b) hot torsion of nickel at 1000 °C and 3.8x10⁻⁴ s-1 [13].
Wang et al. studied the flow and recrystallization behavior of alloy 718 by
performing hot uniaxial compression at temperatures ranging from 950 oC to 1100 oC and
strain rates from 0.001 s-1 to 1 s-1 [16]. The true stress-strain curves are shown in Figure
2.6 [16]. The stress-strain curves tend to increase to a peak stress, which corresponds to
an increase in dislocation density and the formation of subgrain boundaries. As the
material is strained beyond its peak stress, the stress either remains constant (at low strain
rates) or decreases (at high strain rates) with strain, which Wang explains as indication of
a recovery process [16]. It is also asserted that this curve shape is typical of materials
with low stacking fault energy that are likely to exhibit dynamic recrystallization because
recovery occurs slowly in low stacking fault energy materials [16]. However, at high

13
(a)
(b)
(c)
Figure 2.5 Stress-strain behavior showing dynamic recrystallization during hot compression at varying deformation conditions of (a) γ-TiAl, (b) pure nickel, and (c) pure copper [15].
strain rates, there is little time for dynamic recrystallization to occur. In addition,
recovery is slow and therefore unlikely in low stacking fault energy materials like alloy
718. The softening may likely be attributed to deformation heating or shear bands. Due
14
to the similar composition and processing conditions of alloy 718 compared to alloy 945,
similar deformation behavior is expected in INCOLOY® 945. In this study,
microstructural evaluation and temperature measurements during deformation are used to
shed light on the causes of the softening at high strain rates.
(a) (b)
(c) (d)
Figure 2.6 Compressive true stress-strain curves for alloy 718 at deformation temperatures of a) 950 °C, (b) 1000 °C, (c) 1050 °C, (d) 1100 °C [16].
A similar study was performed on Ni-20%Cr, which is likely similar to the flow
behavior of INCOLOY® 945, although 945 contains a much higher iron content, which
influences stacking fault energy [17]. Dudova et al. [17] performed hot compression of
Ni-20%Cr with an intial grain size of 80 μm at temperatures ranging from 500 to 950 °C
at a slow strain rate of 7x10⁻⁴ s-1. The flow curves from the hot compression tests are
shown in Figure 2.7. Even though the stress-strain behavior does not seem to indicate
DRX through oscillations or peak stresses followed by softening, Dudova confirmed the
presence of DRX with electron backscatter diffraction (EBSD) and transmission electron
microscopy (TEM) [17]. Since the initial grain size was relatively small, it is possible
that the expected oscillations in the flow curves were too small to observe at the

15
magnification in Figure 2.7 due to the multitude of nucleation sites. In comparison to
alloy 718 flow behavior discussed above, no strain softening was observed at low
deformation temperatures, even though the flow stresses reached higher values, which
would increase the effects of deformation heating. It is likely that the strain rate used to
compress Ni-20%Cr was sufficiently low to avoid shear bands and to allow the
conversion of work to heat to dissipate.
Figure 2.7 Flow behavior of Ni-20%Cr during hot compression at varying deformation temperatures and a strain rate of 7x10⁻⁴ s-1 [17].
2.2.2 Modeling of Flow Behavior during Hot Deformation
Extensive experimentation has been conducted to develop relationships between
flow stress, temperature, and strain rate in alloy 718, an alloy close to INCOLOY® 945.
These approaches are similar to those used in this investigation to optimize forging
processes [4,16,18-20].
Peak and flow stress increase with strain rate and decreasing temperature. The
most commonly used equation to model the effect of strain rate and temperature on the
peak or steady state flow stress for alloy 718 is [10]:
⎟⎟⎠
⎞⎜⎝⎛ −
=RT
QZ expε& (2.1)

16
Z is the Zener-Holloman parameter, also referred to as the “temperature-modified strain
rate,” and may be related to stress and temperature through [10]:
nAZ )][sinh(1 ασ= (2.2)
This model is applicable for a wide range of stresses. At low stresses, where ασ < 1.0,
Equation (2.2) may be reduced to a power law creep type equation:
nAZ σ2= (2.3)
At high stresses where ασ > 1.2, Equation (2.1) may be reduced to an exponential
relation:
)exp(3 βσAZ = (2.4)
where Q is the activation energy for deformation, T is temperature, R is the ideal gas
constant, n is the stress exponent (or inverse strain rate sensitivity), σ is the steady state
flow stress, and A1, A2, A3, α, and β are material constants. Although most proposed
models for flow stress of alloy 718 in the literature use the same general form of that
shown in Equations (2.1) and (2.2), the reported material constants, activation energies,
and stress exponents vary dramatically. Proposed activation energies for deformation of
alloy 718 have ranged from 144 kJ/mol to 443 kJ/mol in the literature [5,16,18].
Additionally, stress exponents have ranged from 1.96 to 5.35 [5,16,18]. Even though
flow stress data for hot deformation of alloy 718 appears relatively similar from study to
study, researchers have disagreed on the quantitative contributions of activation energies
and stress exponents.
The differences in flow stress models can likely be explained by the change in
activation energies and stress exponents with temperature. The stress exponent is defined
as [18]:
T
n,)log(
)log(
εσδεδ &
= (2.5)
In most studies, n is assumed to be constant as temperature or strain rate change.
However, Medeiros found that linearity is only a good approximation for alloy 718 in the
temperature range bounded by the γ'' and δ solvus temperatures (962-1038 oC) and the

17
strain rate range of 0.001-0.1 s-1 [18]. The activation energy, also assumed to be
constant, is defined as [18]:
εεδ
σδ
&,)/1()ln(
TnRQ = (2.6)
However, at higher temperatures and strain rates, the activation energy appears to change,
indicating a change in the mechanism for deformation [18]. In addition, it is unclear
what multitude of mechanisms may be incorporated in the activation energy for
deformation. For instance, Q can be affected by diffusional processes or boundary
movements, such as recrystallization, recovery, or energy required to overcome solute
pinning of dislocations. Alternatively, Q for all these mechanisms may be related to
more fundamental behavior such as the energy necessary for a dislocation to overcome a
barrier besides solute pinning. Equations (2.1) and (2.2) are a starting point in modeling
flow behavior in INCOLOY® 945. Understanding the change in activation energy and
stress exponents provides insight into deformation mechanisms as a function of
temperature.
2.3 Recrystallization
Recovery and recrystallization are the two most common softening mechanisms
during and after hot deformation. Recovery leads to the annihilation of pairs of
dislocations and the formation of low angle grain boundaries (also referred to as
subboundaries) and subgrains [13]. However in materials with low to medium stacking
fault energies, such as nickel superalloys (the focus of this research), recovery occurs
more slowly and is less common. Therefore, dislocation density increases to appreciably
higher levels during deformation, permitting the nucleation of recrystallization before the
onset of recovery [13].
Recrystallization during hot deformation can occur through dynamic,
metadynamic, and static processes or some combination as material is held at high
temperatures between deformation passes. Recrystallization usually occurs along
existing grain boundaries but may nucleate on deformation bands, twins, or inclusions,

18
especially in coarse grained materials deformed at high strain rates [13].
Dynamically recrystallized grains undergo deformation as the grains nucleate and
grow [21]. As deformation continues, the dislocation density within the recrystallized
grains increases to a critical level, triggering another cycle of dynamic recrystallization
(DRX). Therefore, dynamically recrystallized structures are often characterized by grains
containing high dislocation densities. DRX is enhanced by increased deformation
temperatures, slower strain rates, and smaller initial grain sizes. Roberts et al.. showed
that the critical strain required for the onset of dynamic recrystallization decreases
significantly with decreasing initial grain size for austenitic stainless steels [22]; similar
behavior is expected for INCOLOY® 945. DRX is most common in the hot working of
fcc metals with low stacking fault energies, such as copper, nickel, and austenitic
stainless steels [21]. Metals with high stacking fault energies, such as aluminum, exhibit
dynamic and/or static recovery in preference to recrystallization [21].
Static recrystallization (SRX) occurs after deformation is complete and is driven
by retained work within the grains. The retained work during deformation is increased
with an increased strain rate and decreased deformation temperature [21]. SRX is
subsequently enhanced by higher temperatures, finer starting grain sizes, and greater
degrees of retained work. A statically recrystallized microstructure results in equiaxed
dislocation-free grains [21]. While DRX occurs during deformation, SRX requires an
incubation time after deformation [21].
Metadynamic recrystallization (MDRX) initiates dynamically and continues after
the cessation of deformation. Metadynamically recrystallized grains typically contain
higher dislocation densities in a portion of the recrystallized grain, while the remaining
portion of the grain is dislocation-free [21].
2.3.1 Recrystallization Mechanisms
Dynamic recrystallization occurs by the reconstruction and rearrangement of
grain boundaries during warm or hot deformation. Several mechanisms for DRX have
been discussed in previous studies, such as bulging of initial grain boundaries, grain
boundary migration, strain induced subgrain rotation, mechanical twinning, and pinching

19
off of pancaked original grains [7,12,13,17,23-27]. The two most commonly accepted
and discussed mechanisms are variations of initial grain boundary bulging (BLG) and
subgrain rotation (SGR), while the others only cover a narrow range of materials and
deformation conditions.
BLG is known as the classical mechanism for DRX and occurs when areas of a
grain boundary are pinned by low angle boundaries or impurities [23]. As deformation
continues, grain boundary shearing leads to inhomogeneous local strain gradients along
boundaries, causing initial grain boundaries to bow out (appearing optically as serrated
grain boundaries) from local strain induced boundary migrations [24]. The new bulged
regions of the boundary are dislocation free and become recrystallization nuclei. A
schematic of the BLG mechanism is shown in Figure 2.8. Recrystallization by grain
boundary bulging is often characterized optically by a necklace structure
(recrystallization nucleating on grain boundaries) referred to as discontinuous dynamic
recrystallization (DDRX) [17]. Although recrystallization mechanisms may change with
deformation conditions, BLG is especially prevalent in materials with a low stacking
fault energy and coarse initial grain size [13,17]. When a coarse grained material
recrystallizes dynamically by the BLG mechanism, the recrystallized grain size usually
remains relatively constant as recrystallization progresses [13]. This is because work
hardening takes place with concurrent deformation, eliminating the driving force for
growth (driven by gradients in dislocation density) once the stable dynamic grain size is
reached [13]. The BLG mechanism may therefore be considered ‘growth controlled.’
(a) (b)
Figure 2.8 Schematics showing (a) boundaries dragged by impurities and bulging driven by locally concentrated dislocations, and (b) boundaries dragged and bulging driven by low angle boundaries. Both forms of BLG often lead to dynamic recrystallization [23].

20
When DRX nucleates at grain boundaries via BLG where subgrain boundaries are
pinning original high angle grain boundaries, then the number of sites per volume
available for nucleation was reported to be proportional to 2/Dd2, where D is the DRX
grain size and d is the subgrain cell size [25,28]. For the BLG mechanism, this results in
a recrystallized grain size given by [25]:
23
21Dd
PD
= (2.7)
where P is the probability of a site being activated. This model can be employed
assuming that subgrains form with a relatively stable size and with knowledge of the
activation probability.
Strain induced rotation of dislocation sub-boundaries (SGR) assisted by dynamic
recovery is another mechanism for dynamic recrystallization. The low angle boundaries
rotate with further straining and the misorientations increase leading to an evolution of
high angle recrystallized grain boundaries [23]. The critical angle used to differentiate
low and high angle grain boundaries is typically taken to be 10-15°. In contrast to BLG,
recrystallized grains via SGR do not necessarily nucleate on prior grain boundaries.
Recrystallized grains may nucleate near boundaries or within deformed grains, leading to
a continuous dynamic recrystallization (CDRX) structure [17]. Dynamic recovery aids
the formation of sub-boundaries, subsequently enhancing DRX [24]. Since dynamic
recovery is slow in low stacking fault materials, SGR is therefore most prevalent in
aluminum, magnesium, and other high stacking fault energy alloys. SGR is also more
prevalent in materials with a fine initial grain size providing a high initial nucleus density
[13]. In contrast to the ‘growth controlled’ BLG mechanism, SGR may therefore be
considered as ‘nucleation controlled’ [13]. A schematic of this process is shown in
Figure 2.9. The metastable recrystallized grain size produced is typically smaller than the
stable recrystallized grain size achieved through BLG [13]. After a new grain nucleates
via SGR, the nuclei may continue to grow until the grains impinge on each other.
There is disagreement in the literature on the effects of deformation conditions on
the dominant dynamic recrystallization mechanisms. Using Quartz as a model material,
Shimizu et al. [23] proposed that subgrain rotation causing intracrystalline nucleation is
more dominant in low stress regimes where deformation temperature is high and strain

21
rate is low. Subsequently, Shimizu found grain boundary bulging to be the prominent
mechanism in high stress conditions causing very little nucleation [23]. This behavior is
shown graphically in Figure 2.10a.
Figure 2.9 Schematic showing subgrain rotation as a mechanism leading to continuous dynamic recrystallization [23].
(a) (b)
Figure 2.10 Effect of deformation conditions on dynamic recrystallization behavior observed by (a) Shimizu for Quartz [23], and (b) Dudova for Ni20%Cr. SGR: subgrain rotation; BLG: grain boundary bulging; GBM: grain boundary migration; CDRX: continuous dynamic recrystallization; DDRX: discontinuous dynamic recrystallization [17].
Conversely, Dudova et al. [17] observed grain boundary bulging to be the
dominant mechanism in high temperature, low stress conditions for a Ni20%Cr alloy.
BLG is driven by stored energy and requires a critical strain to occur. When large strain
gradients evolve, strain-induced boundaries form with medium to high misorientations
allowing recrystallization via SGR. Dudova proposed that in order to develop those
highly misoriented subgrains for SGR, a larger critical strain was needed at high
deformation temperatures [17]. At lower deformation temperatures, the grain boundary
mobility is slower and the onset of BLG requires a stronger driving force. Therefore, a

22
higher critical strain is required for BLG than SGR at low deformation temperatures.
This behavior observed by Dudova is shown in Figure 2.10b. The mechanisms for
recrystallization depend on the composition of the alloy as well as the deformation
conditions, so differences in the literature are not surprising. Some have also proposed
that there is no clear transition from BLG to SGR mechanisms, as both may occur
simultaneously [12,17]. Results from advanced microscopy will be used to help
understand the mechanisms for recrystallization in INCOLOY® 945, which will provide
more insight on the effects of deformation conditions on recrystallization behavior.
Following nucleation of DRX, the new recrystallized grains grow at the expense
of larger grains via grain boundary migration to reduce the material’s strain energy [23].
This is in contrast to SRX, which is driven by gradients in dislocation density until the
microstructure is fully recrystallized, when grain growth is driven by grain boundary
surface energy. Therefore, recrystallized grains continue to grow during SRX at the
expense of small recrystallized grains. Grain boundary migration following DRX
nucleation is driven by the differences in dislocation density between the new
recrystallized grain and the adjacent non-recrystallized grain and is characterized by
strain softening [12]. Highly deformed older grains full of dislocations are replaced by
softer relatively undeformed grains via grain boundary migration [23].
Even though the effect of deformation conditions is reported to vary from material
to material, there is a general agreement in the literature that grain boundary bulging, or
BLG leads to a discontinous or necklace structure while subgrain rotation (SGR)
enhanced by dynamic recovery leads to a more uniform continous structure (with
recrystallization nucleating intragranularly) [7,12,13,23,24,26]. After nucleation has
occurred by BLG and/or SGR, the recrystallized grains grow via grain boundary
migration (GBM). A summary of these two dominant mechanisms is shown in Table 2.2.
Static recrystallization (SRX) may occur after the cessation of deformation. The
mechanisms for SRX are somewhat similar to those proposed for DRX. The most
popular SRX mechanisms proposed in literature are subgrain coalescence (SGC),
subgrain growth (SGG), and strain induced grain boundary migration (SIBM) [7,12].

23
Table 2.2 Classification of dynamic recrystallization nucleation and growth mechanisms [23]
Recrystallization Process Transient Steady
Nucleation Grain Boundary Bulging (BLG) Discontinous
DRX Grain Growth none Grain Boundary Migration
(GBM)
Nucleation Subgrain Rotation (SGR) Continuous
DRX Grain Growth none Grain Boundary Migration
(GBM)
SGC is most common in materials such as aluminum or those with a high stacking
fault energy after deformation to a high strain [7]. A schematic of this process is shown
in Figure 2.11. Subgrains with initially low misorientation angles combine to form
crystallites with higher misorientation angles until the misorientation becomes large
enough for boundaries to move freely, forming a recrystallization nuclei. This occurs as
a result of dislocations at the cell boundaries migrating to surrounding subboundaries,
increasing their misorientation [7].
Figure 2.11 Subgrain coalescence (SGC) in high stacking fault energy materials where cells A, B, and C combine to form one recrystallization nuclei [7].
In low stacking fault energy materials such as copper or nickel, discontinous SGG
at sites of high strain energy and orientation gradients tends to be a more prominent
mechanism after deformation to large strains [7,12]. The concentration of dislocations in

24
tangles formed by straining is larger than that in high stacking fault energy materials [7].
The cell walls develop high misorientations and migrate directly at elevated temperatures,
causing subgrain growth. As the subgrain grows, the crystallite misorientation increases
until a recrystallized nuclei is formed. A schematic of the SGG process is shown in
Figure 2.12. This is similar to the grain boundary migration (GBM) proposed for the
dynamic growth of grains following DRX.
Figure 2.12 Subgrain growth (SGG) leading to SRX where areas of high strain energy and orientation gradients migrate out to form a recrystallization nuclei [7].
Lastly, SIBM is a common mechanism for SRX in materials deformed to strains
less than 20% [12]. This mechanism, shown schematically in Figure 2.13, is similar to
the grain boundary bulging mechanism (BLG) discussed for DRX. Deformed high angle
grain boundaries become pinned by subgrain or low angle boundaries. The variations in
dislocation density from grain to grain at low strains causes one grain to bulge out into
regions of higher dislocation density [7]. Since the recrystallized grains grow from
bulging of deformed grains, the recrystallized structure usually has a similar orientation
and texture as that of the deformed structure [12].
The mechanisms driving recrystallization in alloy 718 (similar to INCOLOY®
945) have been reported to change with deformation temperature. Samples of alloy 718
were analyzed by EBSD to study subgrain growth and twin boundary evolution. Figure
2.14a shows the relative frequency of misorientation angles between grains of an alloy
718 specimen deformed at a strain rate of 0.1 s-1 at a relatively low deformation
temperature of 950 oC [19]. Wang suggested that an increase in the frequency of grain
misorientations between 10 and 15 degrees with strain suggests subgrain rotation as a

25
primary mechanisms for recrystallization at relatively low deformation temperatures [19].
A misorientation angle between 10 and 15 degrees is required for nucleation of
recrystallized grains through subgrain rotation. Microstructural evaluation showed a
small grain size and tight grain size distribution, characteristic of continuous dynamic
recrystallization, a desirable trait often associated with subgrain rotation [19]. Figure
2.14a also shows an increase of misorientation angles less than ten degrees and a
decrease of misorientation angles greater than fifteen degrees with increasing strain,
indicating an increase in substructure formation with strain. An increase in substructure
is often associated with strain hardening, not softening mechanisms such as
recrystallization and recovery proposed by Wang. In addition, the reported increase in
10-15° misorientation angles appears negligible, so the presence of recrystallization
under these low temperature conditions should be assessed critically.
Figure 2.13 Strain induced grain boundary migration (SIBM) leading to SRX, which occurs by migration of a high angle boundaries that are partially pinned by subboundaries. The migration is driven by differences in dislocation density on opposite sides of the boundary [7].
On the other hand, at temperatures of about 1100 oC, the frequency of
misorientation angles between ten and fifteen degrees did not increase with increasing
strain. Instead, the reported dominant mechanism for recrystallization involved annealing
twins [19]. The presence of annealing twins caused bulging of grains and separation of
new grains from the original grains (BLG), thus increasing the driving force for
recrystallized grain incubation [19]. Using EBSD, a sharp peak at a misorientation angle
of approximately sixty degrees was observed (see Figure 2.14b), likely indicating the
presence of annealing twins. Although annealing twins have been shown to promote
recrystallization, recrystallization in turn was reported to decrease the amount of

26
annealing twins. This phenomena may be observed in Figure 2.14b. The frequency of
annealing twins (intensity of the peak at sixty degrees) decreases with increasing strain
[19]. However, it is also possible that the annealing twins were present in the initial
microstructure, and simply decreased in frequency as the crystals rotated from
deformation (not necessarily from recrystallization).
Figure 2.14 Electron backscatter diffraction results showing the relative frequency of misorientation angles for alloy 718 compressed to different strains at a strain rate of 10-1 s-1 and a temperature of: (a) 950 °C, and (b) 1100 °C [19].
(a) (b)
Serrated grain boundaries were observed in the recrystallized microstructure of
alloy 718 deformed at 1100 °C, which is often related to strain-induced grain boundary
migration [12,17,19,23]. Strain-induced grain boundary migration was determined to be
the primary mechanism for recrystallization at high deformation temperatures, leading to
discontinuous recrystallization, which is less desirable for producing a uniform grain
structure [17,19]. Areas of localized continuous recrystallization were still present in the
microstructure, indicating that occasional subgrain rotation still occurs at high
deformation temperatures. These mechanisms for recrystallization in alloy 718 are also
possible in INCOLOY® 945 and will be compared using advanced microscopy.
2.3.2 Modeling of Dynamic Recrystallization
Previously proposed models for alloy 718 and other materials may be used as a
starting point for modeling recrystallization in INCOLOY® 945. Modeling may be used

27
to predict conditions in which CDRX occurs, which is desirable to achieve a fine uniform
grain size during hot deformation. Compression tests over a range of temperatures and
strain rates have been used to determine the optimum conditions for dynamic
recrystallization (DRX) [18-20,29]. Percent recrystallization and dynamically
recrystallized grain size were both determined to increase with deformation temperature
and decreasing strain rate [4,16,18,20]. This trend may be observed in Figure 2.15,
which shows the change in DRX grain size as a function of the Zener-Holloman
parameter in alloy 718. Strain, as expected, also increases percent recrystallization, since
deformation strain energy drives recrystallization. However, strain does not affect the
DRX mean grain size [20].
Wang et al. [16] proposed that the dynamically recrystallized grain size tends to
follow a relationship given by the equation:
⎟⎠⎞
⎜⎝⎛ −
== −−
RTcQAAZd cc
DRX expε& (2.8)
where dDRX is the DRX grain size, Z is the Zener-Holloman parameter, and A and c are
material constants. In this study, A and c were found to be approximately 3·105 and 0.27,
respectively [16]. Park et al. [29] proposed a similar model, except with A and c to be
approximately 4.3·105 and 0.3, respectively. Other models have been proposed that
include both the Zener-Holloman parameter and extra temperature terms. For example,
Medeiros et al. [18] proposed that DRX grain size is related to temperature and strain rate
through the model:
Log (dDRX) = -0.027 Log (Z) – 7454/T + 8.49 (2.9)
Table 2.3 details the experimental conditions used by Park [29], Medeiros [18],
and Wang [16] in the development of dynamic recrystallized grain size models. Figure
2.15 shows a natural log plot of grain size as a function of the Zener-Holloman parameter
comparing all three of these models for alloy 718. The data used in developing the
models show significant discrepancies. The model proposed by Medeiros shows
deformation temperature to have a significant effect on recrystallization while strain rate
plays a much smaller role, indicated by the small linear slopes when temperature is held
constant. However, Park shows both strain rate and temperature to play a large role in

28
dynamic recrystallization. Wang’s model tends to follow more closely to Park’s model,
but temperature and strain rate cannot be individually distinguished, as they are grouped
into the Zener-Holloman parameter. The discrepancies may be due to the presence of
metadynamic and static recrystallization, which may occur within two seconds after hot
deformation of alloy 718 and is often interpreted as dynamic recrystallization [18].
Table 2.3 Hot compression parameters used in the development of dynamic recrystallized grain size models
Researcher Deformation Temperature Range (°C)
Strain Rate Range (s-1)
Total Strain Method
N. K. Park, et al. 982-1066 5·10-4 – 5 0.75 Two-step
compressionY. Wang,
et al. 950-1100 10-3 – 1 0.6 Single-step compression
S. C. Medeiros, et al. 975-1025 10-3 – 1 0.5 Single-step
compression
‐0.25
0.75
1.75
2.75
3.75
4.75
29 31 33 35 37 39 41 43ln(Z, s‐1)
ln(d, mm)
Medieros 975 °C Medieros 1000 °CMedieros 1025 °C Park 982 °CPark 1010 °C Park 1038 °CPark 1066 °C Wang 950‐1100 °C
Figure 2.15 Several proposed models for dynamic recrystallized grain size as a function of the Zener-Holloman parameter for alloy 718 at constant strains [16,18,29].

29
While Medeiros and Wang used single-step hot compression, Park used a two-
step compression process separated by a high-temperature hold time where metadynamic
and static recrystallization are likely to occur. Of the models shown in Figure 2.15, only
Wang appears to have used transmission electron microscopy (TEM) and electron
backscatter diffraction (EBSD) to distinguish between dynamic, metadynamic, and static
recrystallization, whereas the other models attempt to distinguish types of
recrystallization using only optical microscopy, which does not show dislocation density
within grains. Although these models use some basic fundamentals, such as activation
energy for deformation integrated into the Zener-Holloman parameter, a beneficial
approach to modeling may be to focus more on fundamentals, such as dislocation density
and state variables. All of these models will be used as a basis in modeling recrystallized
grain size in INCOLOY® 945.
2.3.3 Modeling of Static and Metadynamic Recrystallization
Mataya et al. investigated the effects of dwell times between steps of a multi-step
compression process on the grain refinement of alloy 718 [30]. In an industrial radial
forging operation, as many as seven to eight passes may be applied to the workpiece
before the final desired deformation is achieved. Static and metadynamic
recrystallization likely occur in the dwell times between passes. The speed of the
workpiece moving through conventional radial forging dies can vary between 2 and
5 m/min and dwell times can vary between seconds and minutes depending on the
position within the ingot (Figure 2.16). These large differences in dwell times may lead
to large differences in the final grain size.
In attempting to emulate this forging process, Mataya found that SRX was the
dominant mechanism for refinement of the grain structure through an analysis of flow
curves and light micrographs [30]. Since the critical strain required for the initiation of
DRX is significantly reduced with decreasing initial grain size, Mataya proposed that
DRX may become more prevalent in later passes as the grains have already been refined
by SRX, but no DRX will be observed in one single pass (contrary to the studies
discussed previously in modeling dynamic recrystallized grain size) [21].

30
Figure 2.16 Deformation dwell time history for three positions along a workpiece deformed using radial forging at a rate of one minute per pass [21,30].
Although Mataya’s study did not show any dynamic recrystallization, the strain
rates were limited to a range of 0.1-1.0 s-1. In a later investigation, Medeiros et al [31]
performed single-step compression at a larger range of strain rates and determined the
mode of recrystallization using processing maps and optical microscopy. Processing
maps show the manner in which power is dissipated by the workpiece through
microstructural means during hot deformation [31]. Medeiros stated that alloy 718
exhibits DRX when compressed at very slow strain rates of 0.001 s-1 at 975 °C and
superplasticity at 1100 °C. At strain rates (more comparable to Mataya’s study) of 0.01-
1.0 s-1 in a temperature range of 950-1100 °C, Medeiros stated that MDRX occurs,
resulting in microstructures that appear similar to that of an annealed statically
recrystallized structure [31].
Zhou et al. used TEM to conclude that dynamic recrystallization was most
prevalent at strain rates below 0.005 s-1, but some indications of DRX were observed at
all strain rates [32]. At strain rates above 0.05 s-1, Zhou stated that MDRX occurred
prevalently in addition to DRX [32].
Several researchers have used log plots of grain size versus the Zener-Holloman
parameter to show recrystallized grain size as a function of strain rate and temperature.
Medeiros combined data from many investigations onto one plot shown in Figure 2.17.
The high level of scatter demonstrates that the microstructural development during hot

31
deformation is sensitive to initial conditions and is not likely a result of a single
deterministic process like recrystallization [31]. Medeiros proposed several reasons for
the large scatter shown in Figure 2.17; the initial heat treatments given to the specimens,
the initial grain sizes (ranging from 22 µm to 350 µm), the types of hot workability
(compression, torsion, etc), the statistical variations in chemical compositions, and
fluctuations in test parameters [31].
Figure 2.17 Variation of average grain size with the Zener-Holloman parameter for alloy 718 [31].
Medieros proposed separating the strain rate and temperature term in the Z-
parameter by use of a strain rate exponent, p. Then, the MDRX grain size of alloy 718
(capturing both the dynamic initiation and static growth) may be modeled as [31]:
⎟⎟⎠
⎞⎜⎝⎛ −
= −
RTQcd p expε& (2.10)
where c (5.98·1010) and p (0.028) are material constants and Q (240 kJ/mol) is the
activation energy for MDRX, which is close to that for self-diffusion in nickel [31]. The
strain rate was shown to have little effect on final grain size, as indicated by the small
value of p. However, as mentioned by Mataya and other researchers, DRX, SRX, and
MDRX are dependent on initial grain size, so Equation (2.10) may only be valid for a
defined range of initial grain sizes [21,30]. In addition, static growth of grains occurs
during MDRX, which is dependent on strain; however, strain is not a variable in
Medeiros’ model.
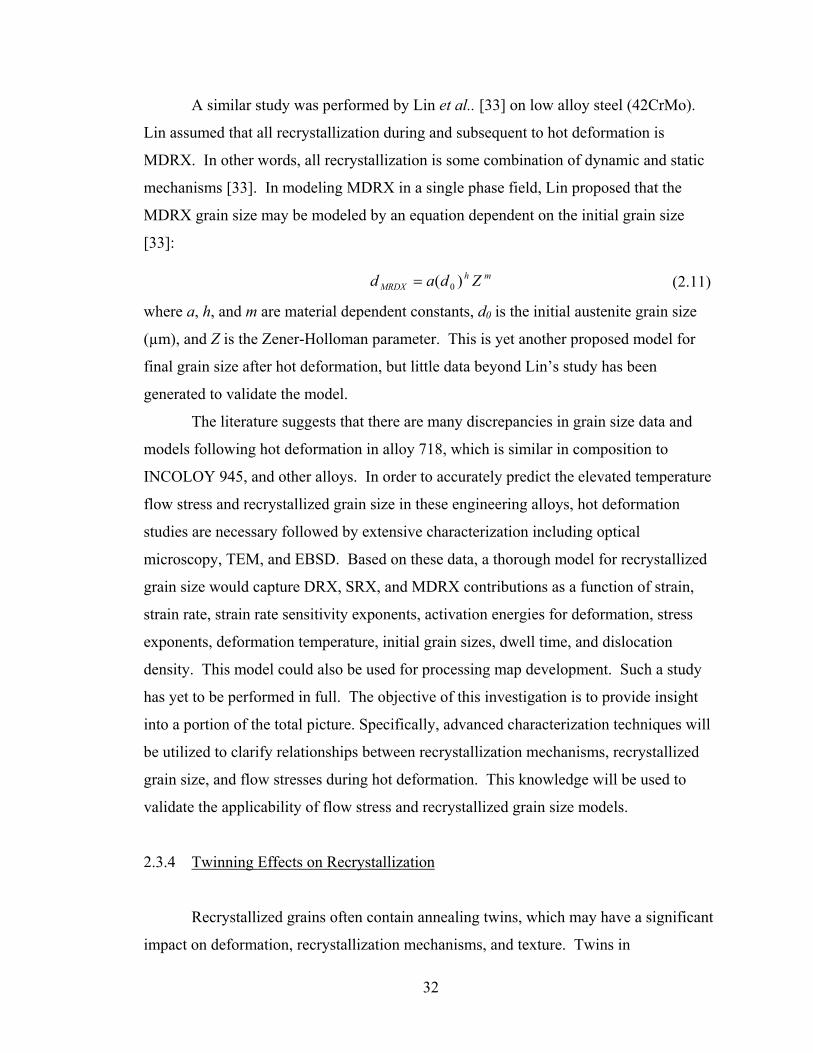
32
A similar study was performed by Lin et al.. [33] on low alloy steel (42CrMo).
Lin assumed that all recrystallization during and subsequent to hot deformation is
MDRX. In other words, all recrystallization is some combination of dynamic and static
mechanisms [33]. In modeling MDRX in a single phase field, Lin proposed that the
MDRX grain size may be modeled by an equation dependent on the initial grain size
[33]:
mhMRDX Zdad )( 0= (2.11)
where a, h, and m are material dependent constants, d0 is the initial austenite grain size
(µm), and Z is the Zener-Holloman parameter. This is yet another proposed model for
final grain size after hot deformation, but little data beyond Lin’s study has been
generated to validate the model.
The literature suggests that there are many discrepancies in grain size data and
models following hot deformation in alloy 718, which is similar in composition to
INCOLOY 945, and other alloys. In order to accurately predict the elevated temperature
flow stress and recrystallized grain size in these engineering alloys, hot deformation
studies are necessary followed by extensive characterization including optical
microscopy, TEM, and EBSD. Based on these data, a thorough model for recrystallized
grain size would capture DRX, SRX, and MDRX contributions as a function of strain,
strain rate, strain rate sensitivity exponents, activation energies for deformation, stress
exponents, deformation temperature, initial grain sizes, dwell time, and dislocation
density. This model could also be used for processing map development. Such a study
has yet to be performed in full. The objective of this investigation is to provide insight
into a portion of the total picture. Specifically, advanced characterization techniques will
be utilized to clarify relationships between recrystallization mechanisms, recrystallized
grain size, and flow stresses during hot deformation. This knowledge will be used to
validate the applicability of flow stress and recrystallized grain size models.
2.3.4 Twinning Effects on Recrystallization
Recrystallized grains often contain annealing twins, which may have a significant
impact on deformation, recrystallization mechanisms, and texture. Twins in

33
recrystallized grains are referred to as ‘annealing twins’ by convention, although they
may not necessarily form from an annealing process (e.g. twin formation during dynamic
grain growth of DRX grains). They result in the formation of new grains with rotations
of 60, 180, or 300° around the <111> axis with the parent grain [15]. The effect of twins
is mentioned briefly in the previous section and is also discussed in the proceeding
section on texture evolution.
For nickel, copper, and other low stacking fault energy materials, twinning is
more common in the recrystallized structures than higher stacking fault energy materials
like aluminum, silver, or gold [15,27]. In high SFE materials, dynamic recovery is much
stronger, preventing the onset of recrystallization and twin formation [27]. There is
disagreement in the literature on the exact stacking fault energy of pure nickel, ranging
from 90 mJ/m2 [34] to 400 mJ/m2 [35]. However there is general agreement that pure
nickel has at least a slightly higher SFE than copper. Likewise, annealing twin density
tends to be an order of magnitude higher in copper than nickel, and the difference
becomes even more pronounced in deformation twins [27]. Some studies have found
recrystallization texture to be less pronounced in low SFE materials, and attributed this
observation to the high frequency of twins [15]. With the absence of twinning, the
texture may continue to develop as the lattice rotates during deformation [15].
The frequency of twinning and its dependency on composition and deformation
conditions has yet to be clearly established in literature. In general, the frequency of
twinning during grain boundary migration (grain growth after nucleation of
recrystallization) is higher in low Zener-Holloman conditions than high Zener-Holloman
conditions due to the higher amount of recrystallization [15,27]. Twinning therefore
occurs readily in low SFE materials during DRX at warm temperatures and also occurs in
the early stages of static recovery (post-deformation) [36,37]. Fine bundles of twins
formed from static recovery can subsequently stimulate static recrystallization [36,37].
In high Zener-Holloman conditions on the other hand, subgrain formation within
recrystallized grains occurs more readily than twin formation during DRX [27].
Twinning characterization in INCOLOY® 945 during different deformation conditions in
Section 4.2.4 aids in determining recrystallization mechanisms.

34
2.4 Deformation and Recrystallization Textures
Almost all properties in polycrystals are anisotropic to some degree: chemical
resistance, strength, fracture toughness, etc. [38]. The degree of anisotropy in a material
is usually measured by determining the orientations of each crystal within a polycrystal
and developing an averaging scheme to characterize the material as a whole. For
example, in plastic yielding shearing occurs on selected slip systems, creating
tremendous anisotropy of stress, strain, and lattice rotations [38]. An understanding of
the relationships between deformation conditions, thermomechanical history, and texture
is essential for understanding the effects of hot deformation on microstructural evolution.
2.4.1 Compression Textures
During uniaxial deformation (tension or compression loading) of an axisymmetric
specimen, the preferred deformation texture may be sufficiently characterized by
measuring crystal orientation with respect to one reference direction (ignoring the reality
that no material is perfectly axisymmetric) [39]. Intuitively, one direction is insufficient
in characterizing non-axisymmetric starting materials, such as dendritic castings or rolled
microstructures. The most common way of showing texture for axisymmetric specimens
is through inverse pole figures, which show the preference for certain crystallographic
poles in the material to orient themselves parallel to a defined reference direction (the
compression axis in this case).
During compression of an fcc material, the slip plane normal rotates towards the
compression axis, as shown schematically for a single crystal in Figure 2.18a [40]. This
is equivalent to a rotation of the compression axis toward the slip plane normal. As an
fcc material is compressed, the compression axis rotates toward ]111[ until it reaches the
[100]-[110] boundary, where simultaneous slip occurs on the )111( and (111) planes
(duplex slip) causing a net rotation toward [110], which is the stable end orientation [40].
This texture evolution is shown schematically using an inverse pole figure in Figure
2.18b.

35
Three types of models have been used in the literature to predict deformation
textures in fcc materials: the Taylor model, the Sachs model, and the Self-Consistent
model [41]. While all of these approaches have been used for various loading conditions
such as compression, tension, and rolling, the scope of this review will focus on uniaxial
compression. The Taylor model assumes complete strain compatibility from grain to
grain and uniform plastic strain throughout the polycrystals. Therefore, the Taylor model
is limited to materials with a relatively weak texture [41]. The Sachs approach assumes a
constant stress direction and activation of a slip system once the resolved shear stress on
that slip system exceeds the critical resolved shear stress [41]. The Sachs model will not
be discussed further, since it is not successful for metals [41]. The Self-Consistent model
is a combination of the Taylor and Sachs models, accounting for both compatibility and
equilibrium between single crystals in a polycrystalline material. The Self-Consistent
model sets the average stresses and strains within the entire volume of single crystals as
the macroscopic stress and strain in the material [41].
(a) (b)
Figure 2.18 Schematic representation of texture evolution during compression of an fcc material showing (a) the rotation of the slip plane normal towards the compression axis and (b) the path of rotation of the compression axis toward [110] [40].

36
A prediction of textures of compressed fcc materials (such as nickel and copper)
using the Taylor and Self-Consistent models is shown in Figure 2.19. Both models
predict the {110} poles to orient themselves parallel to the compression axis, given the
commonly accepted fcc slip system, {111} <110>. The primary difference between these
predictions is that the Self-Consistent model shows a stronger texture around the {110}
pole, which is more consistent with experimental work [41]. Texture evolution in
INCOLOY® 945 will be compared to Taylor and Sachs models to assess the accuracy
and reliability, since most previous work was focused primarily on pure copper and
nickel.
(a) (b)
Figure 2.19 Predicted inverse pole figures of uniaxially compressed fcc materials using (a) the Taylor model and (b) the Self-Consistent model [41].
Figure 2.20 shows Taylor model predicted and experimental inverse pole figures
of several fcc metals (aluminum, copper, silver, and brass) before and after deformation.
The initial microstructure of the bar stock, shown in the first row, is a mixture of <111>
and <100> fiber components. A Taylor simulation was used to predict the texture after
compression to a strain of 2.0, shown in the second row of Figure 2.20. The simulation
predicted the deformation textures relatively well for aluminum, copper, and silver when
compared to the experimental textures shown in the bottom row. The deformed crystals
have a strong <110> fiber component when strained under uniaxial compression. In
other words, there is a preference for {110} poles in deformed crystals to orient
themselves parallel to the compression axis. The texture of compressed brass deviates
most from the Taylor model, likely due to twinning [39]. All four materials examined in
Figure 2.20 have significantly different stacking fault energies, which appears to have
little effect on compression texture. This is contrary to older work by English et al.,
which showed a large dependence on stacking fault energy [42]. However, English did

37
not appear to take into account initial microstructure (i.e. grain size) or solute effects
other than stacking fault energy, and studied textures of cold drawn wires (not uniaxial
compression) [42]. Engler et al. used the addition of manganese to copper to show that
solutes may cause significant changes in texture through short range ordering, even if the
stacking fault energy remains constant [43].
Similar textures were observed by Hasegawa et al. [15] after warm uniaxial
compression of pure nickel and copper. Hasegawa investigated the effects of
deformation conditions on texture development, as shown in Figure 2.21. In low Zener-
Holloman conditions (high deformation temperature, low strain rate), a very weak texture
was observed. The maximum pole density was only 1.6 for nickel compressed at 900 °C
and 10-4 s-1 to a compressive strain of 0.94 (Figure 2.21a), while the maximum pole
density was 1.8 for copper compressed at 800 °C and 10-4 s-1 to a compressive strain of
1.0 (Figure 2.21c) [15]. The pole density is a factor that describes the concentration of a
texture as a multiple of a completely random distribution (e.g. a pole density of 1 would
be perfectly random). Hasegawa suggested that a stronger texture formed in both nickel
and copper at higher Zener-Holloman conditions (low deformation temperature, high
strain rate) with accumulations around the orientation of about 10° away from the {011}
poles towards {001} [15]. While the stable texture for nickel and copper would likely
Figure 2.20 Inverse pole figures comparing textures of several fcc materials. Top row: initial bar stock textures; Middle row: Taylor simulations of compressed textures; Bottom row: Experimental textures after uniaxial compression to 2.0 strain [39].
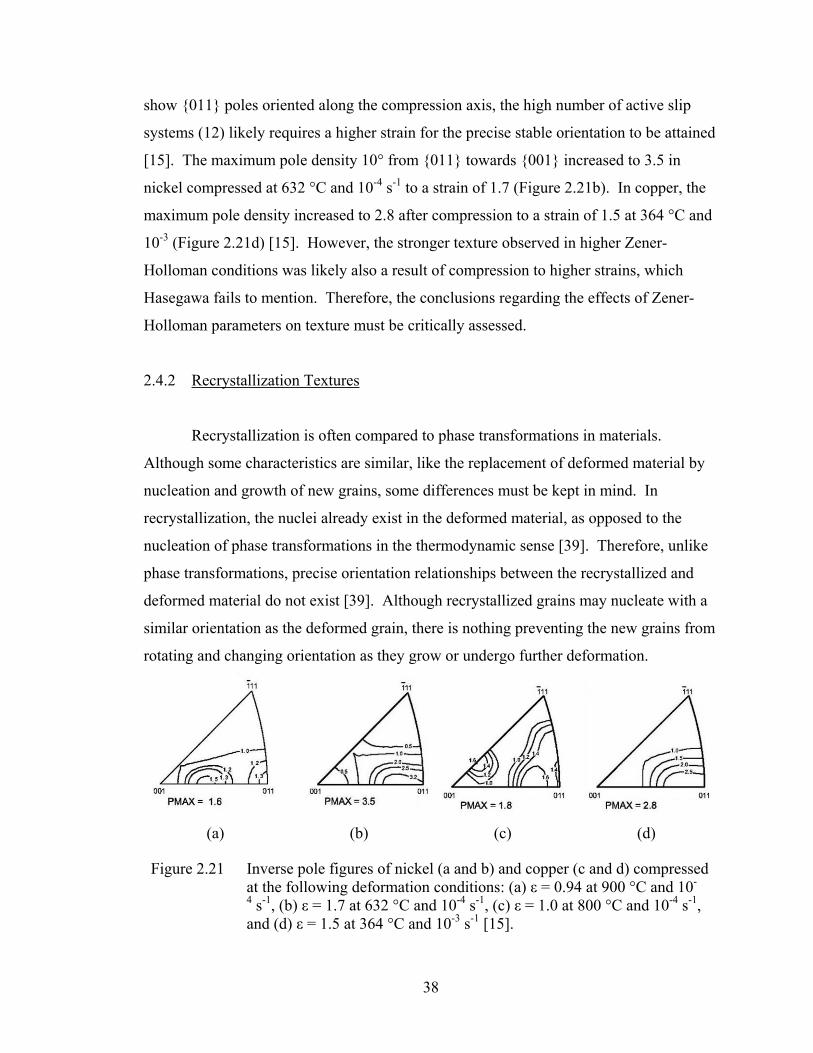
38
show {011} poles oriented along the compression axis, the high number of active slip
systems (12) likely requires a higher strain for the precise stable orientation to be attained
[15]. The maximum pole density 10° from {011} towards {001} increased to 3.5 in
nickel compressed at 632 °C and 10-4 s-1 to a strain of 1.7 (Figure 2.21b). In copper, the
maximum pole density increased to 2.8 after compression to a strain of 1.5 at 364 °C and
10-3 (Figure 2.21d) [15]. However, the stronger texture observed in higher Zener-
Holloman conditions was likely also a result of compression to higher strains, which
Hasegawa fails to mention. Therefore, the conclusions regarding the effects of Zener-
Holloman parameters on texture must be critically assessed.
2.4.2 Recrystallization Textures
Recrystallization is often compared to phase transformations in materials.
Although some characteristics are similar, like the replacement of deformed material by
nucleation and growth of new grains, some differences must be kept in mind. In
recrystallization, the nuclei already exist in the deformed material, as opposed to the
nucleation of phase transformations in the thermodynamic sense [39]. Therefore, unlike
phase transformations, precise orientation relationships between the recrystallized and
deformed material do not exist [39]. Although recrystallized grains may nucleate with a
similar orientation as the deformed grain, there is nothing preventing the new grains from
rotating and changing orientation as they grow or undergo further deformation.
(a) (b) (c) (d)
Figure 2.21 Inverse pole figures of nickel (a and b) and copper (c and d) compressed at the following deformation conditions: (a) ε = 0.94 at 900 °C and 10-
4 s-1, (b) ε = 1.7 at 632 °C and 10-4 s-1, (c) ε = 1.0 at 800 °C and 10-4 s-1, and (d) ε = 1.5 at 364 °C and 10-3 s-1 [15].

39
Previous work on textures of recrystallized material has been primarily limited to
recrystallization during and after rolling processes [39,44,45]. Differences between
recrystallized textures from compression loading and rolling have not been clearly
established. However, some have indicated that recrystallization textures from
axisymmetric loading do not always change from the texture of the deformed state
[15,39]. Figure 2.22 shows recrystallization textures of several fcc materials after cold
rolling and subsequent annealing. A significant dependence on stacking fault energy was
observed in the recrystallized textures. In stacking fault energies ranging from 73 mJ/m2
for copper [35] to 200 mJ/m2 for aluminum [35] (nickel falling somewhere in between), a
cube component is often observed (Figure 2.22a and b) [39]. In aluminum, or materials
with a very high stacking fault energy, a texture similar to the S-type rolling texture is
also observed (Figure 2.22a), referred to as an R-texture in recrystallization [39,44]. This
observation may be different under uniaxial compression loading. In Figure 2.22b, a first
generation twin texture exists from recrystallization twinning in copper and nickel alloys.
In contrast, materials with a much lower stacking fault energy, such as silver, brass, and
austenitic steels, a weak brass texture of {236}<385> develops (Figure 2.22c) [39].
When large second phase particles (> 1 μm) are present, such as the Al-Mn alloy in
Figure 2.22d, a much weaker texture develops, in comparison to pure aluminum in Figure
2.22a. This is likely due to particle stimulated nucleation [45].
Figure 2.23 shows the texture evolution of cold rolled copper during annealing.
Although the deformed texture (at 0% recrystallization) is likely different for uniaxial
compression than cold rolling, it is interesting to note that the deformation texture
components (brass, copper, and s-textures) decrease uniformly with recrystallization
while the recrystallization cube texture increases non-linearly [39].
Grain growth of recrystallized grains, especially in a material with a large initial
grain size, may also change the texture of a material. Grain growth can lead to texture
changes due to the variations in grain boundary energy and mobility in different texture
components [39,46]. Eichelkraut, et al. studied the effects of texture on continuous and
discontinuous grain growth in detail [46].

40
(a) (b)
(c) (d)
Figure 2.22 Recrystallization {111} textures of cold rolled (a) aluminum, (b) copper, (c) Cu-37%Zn brass, and (d) two-phase Al-Mn AA3103 [39].
Figure 2.23 Plot showing the evolution of deformation and recrystallization texture components as percent recrystallization is increased during annealing of cold-rolled copper [39].
Hasegawa, et al. [15] studied recrystallization textures in pure nickel subjected to
uniaxial compression. Grain bulging (BLG) was the dominant recrystallization
mechanism in low Zener-Holloman conditions, while lattice rotation (SGR) was the
dominant mechanism in high Zener-Holloman conditions [15]. However in low Z

41
conditions, Hasegawa commented that recrystallization did not occur in the vicinity of
grain boundaries, which is inconsistent with the proposed BLG mechanism. The
recrystallization texture was very weak in specimens compressed at low and high Zener-
Holloman conditions [15]. Inverse pole figures in the two Z conditions are shown in
Figure 2.24. However, the inverse pole figures were taken from the recrystallized grains
in material deformed to strains below 0.35. Therefore, the microstructures do not appear
to have much recrystallized structure, likely leading to a large amount of error in texture
analysis. Assuming a material deformed under uniaxial compression recrystallizes in a
random orientation, texture would likely return to the deformed <011> texture with
subsequent deformation (i.e. dynamically recrystallized grains that nucleate early in the
deformation process).
Recrystallized textures are not as well characterized in the literature in
comparison to deformation textures. However, the work presented above will act as a
valuable start in analyzing textures in INCOLOY® 945.
(a) (b)
Figure 2.24 Inverse pole figures of dynamically recrystallized textures of pure nickel during uniaxial compression to (a) 0.10 strain at 900 °C and 10-4 s-1 and (b) 0.31 strain at 632 °C and 10-4 s-1 [15].
2.5 Applicability to Other Material Systems
Hot deformation studies of nickel superalloys like INCOLOY® 945 offers the
benefit of understanding the deformation and recrystallization behavior in a single phase
field (austenite). Models used to describe flow and recrystallization behavior may be

42
used to gain a qualitative understanding of hot deformation in other materials like steel
and aluminum. The same form of flow and recrystallization models proposed below may
be applied to other materials with some adjustment of materials constants such as
activation energy.
Softening mechanisms (e.g. dynamic recrystallization) and microstructural
features (e.g. twins and grain boundary morphology) observed during hot deformation of
INCOLOY® 945 may be used as a comparison to behavior in similar nickel alloys or in
materials with similar stacking fault energies like copper. However, the microstructural
behavior in high stacking fault energy materials like low carbon steel and aluminum is
likely drastically different.
Analysis on the hot deformation of INCOLOY® 945 in the following chapters
may shed light on the understanding of austenitic deformation in steel and other systems
while avoiding the effects of complicated phase transformations upon cooling.

43
CHAPTER 3 : EXPERIMENTAL METHODS
This chapter outlines the methods to determine flow behavior and pre- and post-
deformation microstructures of INCOLOY® 945. The composition and initial
processing of the as-received material is also presented.
3.1 Material
The INCOLOY® 945 ingot used in this study underwent vacuum induction
melting followed by an electroslag re-melt. The material was then open die forged to a
30.5 cm (twelve-inch) diameter octagon bar. A Gyratory Forge Machine (GFM) rotary
forge was then used to reduce the material to a 108 mm (4.25-inch) diameter bar. The
108 mm bar was hot rolled into a 15.875 mm (0.625-inch) diameter bar, then cut into
45.7 cm (18-inch) length sections and annealed. The annealing procedures are discussed
further in Section 3.1.2.
3.1.1 Chemical Composition
The chemical composition of the alloy was determined after electroslag remelting
and is shown in Table 3.1. The chemistries, with the exception of carbon and nitrogen,
were determined using an optical emissions spectrometer. The carbon and nitrogen
content was determined more precisely using LECO combustion analyzers. For
comparison, the compositions of 718 and 925 are shown in Table 2.1.
3.1.2 Initial Heat Treat Study and Microstructure
A solution heat treatment study was performed using 15 mm high, 20 mm
diameter INCOLOY® 945 bar to determine the optimum heat treatment prior to

44
specimen machining and compression testing. The goal was to dissolve any precipitates
in the material and achieve a large and stable uniform grain size, which ensures that no
grain growth will occur during the preheat prior to compression testing. In addition, large
initial grains allow fine recrystallized grains to be distinguished more easily.
Table 3.1 Chemical composition of INCOLOY® 945 used in this study (weight percent)
Ni Cr Fe Nb Mo Ti Al
47.3 20.5 21.8 3.15 3.18 1.52 0.149
C N Mn Si P S Cu
0.0070 0.0060 0.0931 0.0569 0.0 0.0005 1.94
Heat treatments were performed at 1200 °C for times ranging between ten
minutes and two hours. The heat treat temperature was chosen to be above the maximum
hot compression test temperature (1150 °C) but below the solidus temperature
(~1262 °C). The specimens were quenched in water immediately following heat
treatment to preserve the microstructure. The results are shown in Figure 3.1a. The grain
size appears to reach a maximum, stable value at approximately 410 μm at a heat treat
time of approximately sixty minutes. Therefore, compression specimens were heat
treated conservatively at 1200 °C for 90 minutes and quenched to produce a consistent
initial microstructure. The resulting initial microstructure is shown in Figure 3.1b where
some pits are present from polishing and etching.
3.2 Hot Compression Testing
Hot uniaxial compression experiments were performed on INCOLOY® 945
specimens to emulate conventional forging processes. This section gives a detailed

45
explanation of the compression specimen design, machine setup, test conditions, and
lubrication used to prevent barreling.
100
200
300
400
500
0 40 80 120
Heat Treat Time (min)
Grain Size ( μm)
(a) (b)
Figure 3.1 Results from initial heat treatment study on INCOLOY® 945 compression specimens at 1200 °C showing (a) grain size converging to a constant value after approximately 60 minutes, and (b) the resulting microstructure after a 90 minute heat treatment at 1200 °C (ASTM grain size > 00, 410 μm).
3.2.1 Sample Design
After heat treatment, sections of 15.875 mm (0.625-inch) diameter INCOLOY®
945 rod were machined into compression specimens with the geometry shown in Figure
3.2. The samples were 12.7 mm (0.5-inch) in diameter and 19.05 mm (0.75-inch) high.
The flat faces of the cylinders were recessed to create a lubricant well at the interface
with the platens.
Figure 3.2 Hot compression specimen design with recessed face ends for lubricant well [47].

46
3.2.2 Machine Setup
A servohydraulic MTS 100-kip machine with a SATEC single-zone clamshell
furnace was used for the hot compression experiments. Figure 3.3a and b show a
schematic diagram and photograph of the test setup, respectively. The load train consists
of solid Astroloy™ compression rams that maintain high strength at elevated
temperatures and smooth silicon nitride platens that reduce friction. Water coolant lines
were installed in the rams using polyethylene and copper tubing with Swagelok stainless
steel pipe fittings. A program was developed using Visual Basic that generates input files
for the MTS Teststar II control and data acquisition software so the actuator displaces the
specimen at a constant true strain rate, taking into account initial specimen geometry and
coefficient of thermal expansion. The Visual Basic program is given in Appendix A for
reference.
(a) (b)
Figure 3.3 Servohydraulic machine and clamshell furnace used for hot compression testing shown (a) schematically [21] and (b) photographically.

47
Thermocouples placed in several locations within the clamshell furnace indicated
a large temperature gradient between the bottom and top of the clamshell chamber.
Fiberfrax refractory ceramic fiber was inserted in the bottom opening of the furnace and
over the top to reduce the temperature gradient. The compression dies were aligned such
that hot compression occurred in the center of the clamshell furnace. Thermocouples
were embedded into a compression specimen to measure the thermal gradient along the
height of the specimen. The bottom of the specimen was found to be approximately 4 °C
cooler than the top of the specimen, which is a negligible difference considering the high
temperatures of deformation. A calibration curve was formulated between temperature at
the center of the specimen and furnace set temperature to improve deformation
temperature accuracy. During compression testing, a control thermocouple was mounted
on the surface of the top platen and a second monitoring thermocouple was mounted on
the surface of the bottom platen, as shown in Figure 3.3a.
3.2.3 Hot Compression Procedures
Twenty four hours prior to hot compression testing, a water-based glass lubricant
was applied to the wells on each side of the compression samples to prevent friction
between the sample and platens. Deltaglaze® 153 lubricant, manufactured by Acheson
Industries in Port Huron, Michigan, was used for deformation temperatures of 1000 °C
and less. For temperatures higher than 1000 °C, Deltaglaze® 151 was used instead to
prevent high temperature lubricant oxidation. The glass lubricants were applied to each
face of the compression samples and allowed to dry overnight before testing. Upon
reheating the samples to the test temperature, the lubricants remelted, creating a lubricant
layer.
In preparation for testing, the compression rams were brought close together and
heated in the clamshell furnace for approximately three hours. The samples were then
inserted and heated to the test temperature between the two compression dies, which were
brought as close together as possible, without having the upper platen contact the
specimen, to minimize thermal gradients. Thermocouples were inserted in dummy

48
specimens to determine that a four-minute preheating time was required for the sample
temperature to stabilize. The test samples were heated for approximately five minutes to
ensure the specimen temperature equilibrated. While the samples were preheating, the
Visual Basic program detailed in Appendix A, was run using a DOS-based computer
program, Quick Basic. The program used inputs including desired percent reduction and
strain rate, coefficient of thermal expansion, deformation temperature, room temperature
specimen geometry, and the maximum stroke of the actuator to generate a text file, which
gives the MTS software a custom time-displacement procedure for testing at a constant
true strain rate. The deformation temperature and coefficient of thermal expansion were
used by the Visual Basic program to calculate the high temperature dimensions of the
compression specimen, adjusted from room temperature measurements. The
temperature-dependent coefficient of thermal expansion was determined at each test
temperature by linear extrapolation from data provided by Special Metals Corporation
[3]. After the preheat, a preload of 100 pounds (445 N) was applied to the sample over
one minute to bring the compression dies in contact with the specimen faces. At this
point, the specimen preheat time reached six minutes including the gradual preload.
Preheat times greater than six minutes caused the lubricant on the bottom surface of the
samples to seep out, increasing the friction between the compression sample and the
bottom platen. After the preload, the relative displacement was immediately zeroed, and
the custom time-displacement schedule from the input text file commenced. After
compression testing, the rams released and the specimens were immediately quenched in
water to limit static and/or metadynamic recrystallization, which may occur within two
seconds following deformation [18]. All of the specimens were quenched within
4 seconds after deformation. The specimens were then inspected for barreling or signs of
load train misalignment.
3.2.4 Hot Compression Test Conditions
A schematic diagram showing the heat treatment and hot compression processing
history is shown in Figure 3.4. Single-step hot compression tests to a target true strain of
1.0 were performed in 50 °C increments at temperatures ranging from 950 °C (0.79 T/Tm)

49
to 1150 °C (0.92 T/Tm) where Tm is the solidus temperature; the target true strain rates
range from 0.001 to 1.0 s-1 in order of magnitude increments. Table 3.2 lists the target
deformation conditions, along with the actual measured strains and strain rates. The
average measured strain was 0.97 ± 0.03 when the target strain was 1.0. The
compressive specimens hereinafter will be referred to by their target conditions for
simplicity, although measured conditions were used in analyses and models. The purpose
of compressing specimens to a large strain of 1.0 was to capture the entire range of flow
behavior for INCOLOY® 945. In addition, the flow data were used to calculate material
parameters such as activation energies, stress exponents, and strain rate sensitivities as a
pre-requisite for modeling.
Figure 3.4 Schematic showing the processing history of specimens subjected to single-step hot uniaxial compression.
Single-step compression was also performed at 1050 °C and a target true strain
rate of 0.001 s-1 at ~0.2 strain increments ranging from 0.2 to 1.0 to investigate
microstructural evolution and the effect of strain on dynamic recrystallization.
Experimentally measured strains and strain rates for the microstructural evolution
experiments are also reported in Table 3.2.
Multi-step compression tests were performed to investigate the effects of static
strain aging on elevated temperature yield stress in INCOLOY 945. The tests were
performed at 1150 °C and an engineering strain rate of 0.1 s-1 with 0.24 strain applied per
hit and 5.5 minute inter-step hold times.

50
Table 3.2 Target hot compression conditions compared to actual measured strains and strain rates
Deformation Temperature (°C)
Target Strain Rate (s-1)
Actual Strain Rate (s-1) Target Strain Actual Strain
0.001 0.00097 1.0 0.97 0.01 0.0096 1.0 0.96 0.1 0.095 1.0 0.95 950
1.0 0.91 1.0 0.91 0.001 0.00098 1.0 0.98 0.01 0.0096 1.0 0.96 0.1 0.095 1.0 0.95 1000
1.0 0.93 1.0 0.93 0.001 0.00102 1.0 1.02 0.01 0.0096 1.0 0.96 0.1 0.094 1.0 0.94 1050
1.0 0.96 1.0 0.96 0.001 0.00100 1.0 1.00 0.01 0.0098 1.0 0.98 0.1 0.097 1.0 0.97 1100
1.0 0.96 1.0 0.96 0.001 0.00101 1.0 1.01 0.01 0.0100 1.0 1.00 0.1 0.098 1.0 0.98 1150
1.0 0.96 1.0 0.96 0.001 0.00090 0.2 0.18 0.001 0.00095 0.4 0.38 0.001 0.00098 0.6 0.59
1050
0.001 0.00100 0.8 0.78
3.3 Light Optical Microscopy (LOM)
In order to understand the effects of deformation temperature, strain rate, and
strain on the microstructure, light optical microscopy (LOM) was performed using an
inverted Olympus PMG3 light optical microscope on the initial heat treated material and
all of the INCOLOY® 945 specimens subjected to single-step uniaxial compression.
LOM was also used to search for macroscopic shear bands and microstructural
inhomogeneities in the sample due to strain gradients that potentially developed during
compression testing.

51
3.3.1 Sample Preparation for LOM
To prepare specimens for LOM, hot compressed samples were first sectioned
longitudinally, so the elongated non-recrystallized grain structure could be observed in
conjunction with any recrystallized grains. The sectioned samples were then mounted in
Bakelite. All of the mounts were first ground on 60 grit silicon carbide paper with water
lubricant to remove any burrs and ensure a flat surface. Following the rough grind, the
specimens were polished using the steps shown in Table 3.3. A 200 N (45 pounds) force
was applied to the 9-mount automatic polisher holder during polishing. Between
polishing steps, the samples were cleaned using diluted soap and water, followed by an
ethanol rinse, and dried using heated air. After step six, the samples were rinsed with
soap and water and immediately placed in a beaker of acetone in an ultrasonicator for
five minutes before the samples were dried. This prevented surface staining from the
alumina or colloidal silica compound. Some pits were present in the material from the
polishing steps and should not be interpreted as precipitates.
Table 3.3 Steps used to prepare specimens for light optical microscopy (LOM), scanning electron microscopy (SEM), and electron backscatter diffraction (EBSD)
Step Compound Lubricant Pad Time (minutes) Method
1 None Water 60 grit paper < 1 Mechanical
Grinding
2 45 µm diamond suspension None Buehler
Ultra Pad 2 Turning Wheel
3 15 µm diamond suspension None Allied
Kempad 3-6 Turning Wheel
4 6 µm diamond suspension None Allied
Kempad 3-6 Turning Wheel
5 3 µm diamond paste
Alcohol-based extender
Allied Kempad 3 Turning
Wheel 6
(for LOM) 0.05 µm alumina None LECO
Lecloth 2 Turning Wheel
6 (for SEM and EBSD)
Colloidal Silica None LECO
Lecloth 120 Vibratory Polisher

52
The specimens were etched within five minutes of polishing using a seven-acids
etch recipe developed by Special Metals Corporation. If the specimens were not etched
within five minutes, a protective film formed on the surface of the material due to the
high chromium content, and an acid etch was ineffective. The seven-acids etch consists
of 300 ml distilled water, 300 ml hydrochloric acid (HCl), 60 ml nitric acid (HNO3),
60 ml phosphoric acid (H3PO4), 60 ml acetic acid (CH3COOH), 30 ml sulfuric acid
(H2SO4), 30 ml hydrofluoric acid (HF), and 30 g anhydrous iron (III) chloride (also
known as ferric chloride or FeCl3). A chemical squirt bottle was used to apply a constant
fresh coat of acid on the surface of each sample for 30 seconds. After etching, the
samples were immediately rinsed with distilled water, followed by ethanol, and dried
with heated air.
3.3.2 Recrystallization Characterization
The volume fraction of recrystallized grains and recrystallized grain sizes were
measured using the LOM images to determine the effect of temperature, strain, and strain
rate on microstructural evolution. Using ImageJ software, the volume fraction
recrystallized was measured by standard point counting techniques on a 10x10 grid
overlaid on each of the optical images. The percent recrystallization was taken to be the
average of six measurements (or 600 points) per specimen to minimize statistical error.
The recrystallized grain size was measured using standard line intercept techniques in
ImageJ software. However, the sampling was not random because regions of the
microstructure had to be specifically chosen to avoid measuring non-recrystallized grain
sizes. Grain size measurements were continually taken until the running average
converged to a stable value within ±0.1 µm.
3.4 Electron Microscopy
Several electron microscopy techniques, including scanning electron microscopy
(SEM), electron channeling contrast imaging (ECCI), electron backscatter diffraction
(EBSD), and transmission electron microscopy (TEM) were used to determine

53
recrystallization mechanisms and relate microstructural evolution during hot deformation
to the corresponding flow behavior. This section provides an overview of the procedures
used for each technique.
3.4.1 Scanning Electron Microscopy (SEM)
A JEOL JSM-7000F Field Emission SEM (FESEM) was used to obtain high
resolution images of the microstructures of as-heat-treated and deformed INCOLOY®
945 specimens. The high resolution of the FESEM is advantageous over LOM for
investigating grain boundary serrations, grain bulging, annealing twins, and other small
scale features that pertain to the dominant recrystallization mechanisms. SEM was used
to study specimens compressed to a strain of 1.0 at temperatures of 950, 1050, and
1150 °C and strain rates of 0.001 and 1.0 s-1 to understand the effects of deformation
temperature and strain rate. SEM was also performed on the specimens compressed at
1050 °C and 0.001 s-1 at 0.2 strain increments ranging from 0.2-1.0 to investigate
microstructural evolution during hot compression. Electron channeling contrast imaging
(ECCI), detailed in Section 3.4.2, was used to study the samples in the as-polished
condition.
3.4.2 Electron Channeling Contrast Imaging (ECCI)
If an FESEM is equipped with a good backscattered electron detector and the
electron beam has a large current and is sufficiently parallel, grain boundaries and
substructure may be observed in large atomic number materials using electron channeling
contrast imaging (ECCI) [48]. Several researchers have employed this technique in
recent years on carbon steels, stainless steels, aluminum, and copper alloys [48-52]. The
backscatter electron coefficient, or the number of backscattered electrons emitted from
the specimen, depends on crystal orientation, which affects the depth that the primary
beam can penetrate into the specimen, also called electron channeling. The crystal
orientation governs the amount of diffraction of the incident beam; if the lattice planes
are parallel to the primary beam, it penetrates deeper into the specimen and backscattered
54
electrons are less likely to escape [53]. Changes in tilt and strain and the presence of
defects that distort the crystal planes change the amount of diffraction and the
corresponding depth of penetration of the beam into the specimen, resulting in a variation
in grey scale in the ECCI image [48,53]. Therefore, slight misorientations between
grains and subgrains result in signal contrast between those regions, thus known as the
electron channeling effect. For optimum channeling contrast images, a large probe
current and low working distance is necessary [48]. Higher accelerating voltages
increase the contrast of the ECCI image; however, increasing accelerating voltages also
decreases the spatial resolution [48,49]. With low accelerating voltages (8-10 keV), a
spatial resolution of approximately 10 nm has been reported for aluminum in a FESEM
[48].
The specimens mounted and polished for SEM were investigated using ECCI at
an accelerating voltage of 10 kV, a probe current setting of 11 (arbitrary number setting
in the FESEM software), and a working distance of 7 mm. The specimens were tilted
±1° to reveal changes in contrast as the grain orientation changes with respect to the
incident beam. The purpose of using ECCI was to search for indications of possible
recrystallization mechanisms, substructure, and strain homogeneities within non-
recrystallized and recrystallized grains.
3.4.3 Electron Backscatter Diffraction (EBSD)
Electron backscatter diffraction (EBSD) was performed in a FESEM in the radial
center of longitudinal cross sections of the non-deformed heat treated initial material and
specimens compressed to 1.0 strain at deformation temperatures of 950, 1050, and
1150 °C and strain rates of 0.001 and 1.0 s-1. EBSD was also performed on the radial
edge of a longitudinal cross section of the specimen compressed to a strain of 1.0 at
1050 °C and 0.001 s-1 to eliminate any question of strain gradient effects from specimen
barreling during compression. A lateral cross section of the same specimen (1.0 strain at
1050 °C and 0.001 s-1) was investigated using EBSD to confirm the reliability of texture
analysis performed longitudinally. The EBSD specimens were prepared using the
techniques described in Table 3.3.

55
Two EBSD scans were performed on each EBSD sample by tilting the specimen
70° from horizontal in the SEM and inserting a charge coupled device (CCD) camera.
An accelerating voltage of 20 kV, probe current setting of 11, working distance of
20 mm, and a dynamic focus control set to ~73 was used for consistency. The EBSD
software then used 100 frames to collect a background image, which was subtracted from
the CCD camera signal. The gain and exposure were adjusted individually for each
sample prior to subtracting the background. The scans were then run against a standard
fcc austenite phase structure database for indexing. First, a 1x1 mm area was scanned
using a 2 µm step size to capture the overall texture, including recrystallized and non-
recrystallized grains. A smaller 0.5x0.5 mm area was scanned at a smaller step size of
approximately 0.6 µm (or less than 1/10 of the measured recrystallized grain size) to
capture precise recrystallized grain misorientations and subgrain formation. The average
confidence index for each scan was approximately 0.8. The confidence index (CI) is a
measure of the fraction of the Kikuchi bands indexed correctly, ranging from 0.0-1.0. A
voting scheme is used to measure the CI, defined as [54]:
IDEALV
VVCI 21 −
= (3.1)
where V1 and V2 are the number of votes for the first and second solutions, respectively,
and VIDEAL is the total number of possible votes from the detected Kikuchi bands. When
the CI is equal to zero, V1 and V2 are equal, so the Kikuchi pattern may still be indexed
correctly [54]. A graph showing the fraction of correctly indexed Kikuchi bands as a
function of the CI for aluminum (likely similar for all fcc materials such as nickel) is
shown in Figure 3.5. Even at a CI of 0.1, 95% of the Kikuchi bands are indexed
correctly.
TSL OIM Analysis 5 software was used to analyze the EBSD scan data. The
frame of reference of the data was first changed, so the compression axis was oriented
parallel to the EBSD normal direction, as shown in Figure 3.6. The default alignment
(Figure 3.1a) was rotated about the rolling direction as shown in Figure 3.6b to align the
normal direction with the compression axis of the specimen; pole figures and inverse pole
figures are plotted with respect to the normal direction. Since compression specimens
were subjected to axisymmetric loading, the default “rolling direction” and “transverse

56
directions” in Figure 3.6b refer to the radial directions in the specimen. A filter was then
applied to each scan to eliminate any scan data with a confidence index less than 0.1 and
any grains less than four scan steps in diameter. The texture and misorientation analysis
was then performed on fully recrystallized regions in addition to the overall
microstructure from the entire scan. The recrystallized regions were selected for analysis
using multiple polygon cropping.
0.3
0.4
0.5
0.6
0.7
0.8
0.9
1
0 0.1 0.2 0.3 0.4Confidence Index
Frac
tion
Cor
rect
Figure 3.5 Correct EBSD indexing as a function of the confidence index for
polycrystalline aluminum [54].
(a) (b)
Figure 3.6 EBSD alignment correction changed from (a) default software settings to (b) aligning the normal direction parallel to the compression axis [55].
After the EBSD data were corrected and filtered, several analytical tools were
used to obtain texture and grain misorientation data. Inverse pole figures and inverse
CCD camera
CCD camera

57
pole figure maps along the normal or compression direction were generated to study the
preference for crystallographic poles in deformed and recrystallized grains to orient
themselves parallel to the compression axis. Pole figures and orientation distribution
maps (ODFs) using Bunge angles were also generated, although they were determined to
be unnecessary for studying texture in axisymmetric deformation. In axisymmetric
deformation of cylinders, only two directions (the compression or normal direction and
radial direction) are defined and the specimens should not contain a radial texture
component. Grain misorientation maps were generated, which show the locations of low
angle grain boundaries (2-5°), intermediate misorientation angles (5-15°), high angle
grain boundaries (>15°), and primary twinning at 60±5° along <111> directions. Grain
misorientation maps were used to study substructure development, recrystallization, and
annealing twin formation for the deformation conditions. Yielding similar results,
histograms showing the number fraction frequency of misorientation angles were
generated as a function of strain, deformation temperature, and strain rate to show the
evolution of substructure and recrystallization.
3.4.4 Transmission Electron Microscopy (TEM)
Transmission electron microscopy was performed using a Philips CM12 TEM
with an accelerating potential of 120 kV. The exposure time for bright field imaging
ranged from 1.5 to 2.0 seconds to acquire TEM images. The TEM was used to
investigate the modes (dynamic versus static versus metadynamic) and mechanisms of
recrystallization in conjunction with ECCI and EBSD for three specimens. First, the non-
deformed initial heat treated structure (100% statically recrystallized) was studied for
comparison to the deformed structures. Two additional specimens compressed to 1.0
strain, representing the most favorable conditions for static and dynamic recrystallization
(1150 °C at 1.0 s-1 and 1150 °C at 0.001 s-1, respectively), were examined to see if
dislocations were present within recrystallized grains. As discussed in further detail in
Section 2.3, dynamically recrystallized grains should contain dislocations while statically
recrystallized grains should be relatively dislocation-free. TEM was also used to reveal
the differences in development of substructure for the two deformation conditions.

58
Selected area electron diffraction (SAD) was performed throughout the TEM foils
to measure misorientations across boundaries to distinguish between high and low angle
boundaries (i.e. high angle recrystallized grains and low angle substructure). A nominal
camera length of 370 mm was used for SAD in order to include an appreciable portion of
the Kikuchi electron diffraction pattern as well as the spot pattern. The orientations of
the grains were determined by monitoring the nearby associated Kikuchi center of the
Kikuchi diffraction pattern. The orientation of the Kikuchi center was determined using
the equation:
effLr
=θ2tan (3.2)
where 2θ is the angle between the Kikuchi center and transmitted electron beam, r is the
distance from the center of the electron diffraction pattern to the Kikuchi center, Leff is the
effective camera length, defined by:
electron
effKL
λ= (3.3)
where K is an empirically determined camera constant. The differences in 2θ and
azimuthal location in the SAD pattern plane between Kikuchi centers were used to
calculate grain and subgrain misorientations.
TEM foils were made by first sectioning the hot compressed specimens
longitudinally using a diamond saw. Parallel slices, 0.762 mm (30 mils) thick, were cut
from the middle of each specimen. The samples were then thinned to approximately
0.100 mm (~4 mils) by manual dry grinding with 400 and 600 grit silicon nitride papers.
Holes 3 mm in diameter were then punched from the radial and height center of each
sample and re-ground using 1200 grit silicon nitride paper to remove any burrs from
punching. The 3 mm circular disks were then electropolished using a twin-jet polisher to
create a gradual reduction in thickness from 0.100 mm (the initial thickness) along the
outer radius of the disks to zero in the middle. During electropolishing, a 30% nitric acid
in methanol solution was used with a voltage of 10 V, current of 46 mA, and polishing
speed of 4.5 for approximately one minute or until the acid penetrated through the

59
thickness of the specimen. Immediately following electropolishing, the TEM foils were
rinsed in methanol and placed on soft absorbent pads to dry.

61
CHAPTER 4 : RESULTS AND DISCUSSION
This chapter presents and discusses the experimental results obtained after hot
uniaxial compression testing and subsequent microstructural and texture analysis. This
chapter is divided into four sections: hot deformation flow behavior, microstructural
analysis, modeling, and texture development. The results are presented in an order that
allows for the discussion in a particular section to build on the discussion presented in
preceding sections.
4.1 Hot Deformation Flow Behavior
Hot compression was performed at several deformation conditions on
INCOLOY® 945. The resulting stress-strain behavior is characterized, discussed, and
compared to other alloys in this section.
4.1.1 Stages of Hot Deformation in INCOLOY® 945
Results from the hot compression tests are shown in Figure 4.1. The plots in
Figure 4.1 are shown on different scales in order to demonstrate the flow behavior at each
deformation condition. As expected, the flow and peak stress of INCOLOY® 945
increases with strain rate and decreases with deformation temperature. The background
on hot deformation flow behavior presented in Section 2.2 details three regions in the
typical stress-strain curve, which were determined to be insufficient in fully
characterizing INCOLOY® 945. Figure 4.1f shows a schematic of the typical flow
behavior observed in INCOLOY® 945, divided into four distinct stages. Although the
flow behavior varies depending on deformation conditions, all of the samples exhibit
some form of that shown in Figure 4.1f. The exact deformation path for each
temperature and strain rate is detailed in Table 4.1, along with corresponding yield
stresses.

62
0
100
200
300
400
0.0 0.2 0.4 0.6 0.8 1.0True Strain
True Stress (MPa)
0
10
20
30
40
50
60
True Stress (ksi)
1.0 s‐1
0.1 s‐1
0.01 s‐1
0.001 s‐1
0
100
200
300
400
0.0 0.2 0.4 0.6 0.8 1.0True Strain
True Stress (MPa)
0
10
20
30
40
50
True Stress (ksi)1.0 s‐1
0.1 s‐1
0.01 s‐1
0.001 s‐1
(a) (b)
0
100
200
300
0.0 0.2 0.4 0.6 0.8 1.0True Strain
True Stress (MPa)
0
10
20
30
40
50
True Stress (ksi)1.0 s‐1
0.1 s‐1
0.01 s‐1
0.001 s‐1
0
50
100
150
200
250
0.0 0.2 0.4 0.6 0.8 1.0True Strain
True Stress (MPa)
0
5
10
15
20
25
30
35
True Stress (ksi)1.0 s‐1
0.1 s‐1
0.01 s‐1
0.001 s‐1
(c) (d)
0
50
100
150
200
0.0 0.2 0.4 0.6 0.8 1.0True Strain
True Stress (MPa)
0
5
10
15
20
25
True Stress (ksi)1.0 s‐1
0.1 s‐1
0.01 s‐1
0.001 s‐1
True Strain
True Stress
I II III IVa
IVb
(e) (f)
Figure 4.1 True stress-true strain curves for INCOLOY® 945 tested at strain rates ranging from 0.001 s-1 to 1 s-1 and temperatures of (a) 950 °C, (b) 1000 °C, (c) 1050 °C, (d) 1100 °C, and (e) 1150 °C. Part (f) shows a schematic stress-strain curve of INCOLOY® 945 during hot compression, divided into four regions.
In Stage I, elastic and microstrain deformation occur according to the description
given in Section 2.2. This stage was manually corrected by subtracting off the machine
compliance to match the known temperature-dependent Young’s modulus. The high
homologous temperatures used in deformation (0.79-0.92 T/Tm) may enhance diffusion

63
rates, even at the low strains in Stage I, which subsequently affects flow stress behavior
(e.g. microstrain dynamic strain aging).
Table 4.1 Yield stresses and deformation paths for compression according to Figure 4.1f for the experimental deformation conditions
Deformation Temperature
(°C)
Strain Rate (s-1)
Yield Stress (MPa)
Magnitude of Stage II Load Drop
(MPa) Deformation Path
0.001 129 12 I II III IVa 0.01 153 -- I III IVa 0.1 168 -- I III IVb
950
1.0 153 -- I III IVb 0.001 96 16 I II IVa 0.01 145 13 I II III IVa 0.1 162 -- I III IVa
1000
1.0 158 -- I III IVb 0.001 71 7 I II IVa 0.01 111 14 I II III IVa 0.1 176 3 I II III IVa
1050
1.0 161 -- I III IVb 0.001 54 2 I II IVa 0.01 84 11 I II III IVa 0.1 134 29 I II III IVa
1100
1.0 194 2 I II III IVb 0.001 37 6 I II IVa 0.01 68 7 I II III IVa 0.1 103 23 I II III IVa
1150
1.0 154 23 I II III IVb
Specimens deformed at high temperatures and low strain rates exhibit Stage II
yielding, or the presence of a load drop and secondary yield point. The load drops and
secondary yield points are likely indicative of substitutional static strain aging (SSA),
possibly assisted by microstrain dynamic strain aging (DSA), which are discussed in
further detail in Section 4.1.2. The observed load drops are contrary to the work in
literature on alloy 718 and other nickel-base alloys [4,7,13,16,18,20,28-30]. However,
the exceptionally high initial grain size (410 µm) used in this study is associated with a
very low initial dislocation density, possibly enhancing the solute pinning effect and
promoting the load drop.

64
The yield points at the transition to Stage III (or Stage IV in cases where Stage III
was absent) deformation are reported in Table 4.1 and shown graphically in Figure 4.2.
For specimens that exhibited Stage II deformation, the yield stress was taken to be the
lower yield point (corresponding to the onset of Stage III). For specimens that
transitioned from Stage I straight to Stage III, a 0.002 strain offset was used to measure
yield stress. In general, yield stress decreases with increasing deformation temperature
and decreasing strain rate. However, an opposite effect is observed in some of the high
Z-parameter conditions. This behavior may be partially explained by microstrain
dynamic strain aging, which is covered in Section 4.1.2.
0
50
100
150
200
900 950 1000 1050 1100 1150 1200Temperature (oC)
Yield Stress (M
Pa)
0
5
10
15
20
25
30
Yield Stress (ksi)
0.001/sec0.01/sec0.1/sec1.0/sec
Figure 4.2 Yield stresses of INCOLOY® 945 determined for the experimental
deformation conditions.
Stage III deformation is present in most stress-strain curves, with the exception of
a few low Z-parameter conditions. Stage III may be characterized by plastic deformation
with a relatively constant work hardening (or strain hardening) rate (dσ/dε). The
evolution of dσ/dε with strain is shown for each of the deformation conditions in Figure
4.3. During work hardening, there is increased stress required to cause slip from previous
plastic deformation. The dislocations interact with each other and with barriers, which
impede their motion through the crystal lattice [10]. Rapid dislocation multiplication,
subgrain formation, and strengthening from δ or η precipitates in the matrix may also
increase strain hardening rates. High temperature precipitates often cause the hardening
rates to be very high initially, but they rapidly decrease [40]. The work hardening is
especially prevalent at low deformation temperatures and high strain rates where
recovery processes are not fast enough to affect deformation behavior and a higher

65
‐500
0
500
1000
1500
0.0 0.1 0.2 0.3 0.4True Strain
d σ/d
ε (MPa)
‐73
‐23
27
77
127
177
227
d σ/d
ε (ksi)
0.001/s0.01/s0.1/s1.0/s
−500
0
500
1000
1500
2000
2500
0.0 0.1 0.2 0.3 0.4True Strain
d σ/d
ε (MPa)
−73
−23
27
77
127
177
227
277
327
d σ/d
ε (ksi)
0.001/s0.01/s0.1/s1.0/s
(a) (b)
‐500
0
500
1000
1500
2000
0.0 0.1 0.2 0.3 0.4True Strain
d σ/d
ε (MPa)
‐73
‐23
27
77
127
177
227
277
d σ/d
ε (ksi)
0.001/s0.01/s0.1/s1.0/s
‐300
‐100
100
300
500
700
0.0 0.1 0.2 0.3 0.4True Strain
dσ/d
ε (MPa)
‐44
‐24
‐4
16
36
56
76
96
dσ/d
ε (ksi)
0.001/s0.01/s0.1/s1.0/s
(c) (d)
‐300
‐100
100
300
500
700
0.0 0.1 0.2 0.3 0.4True Strain
d σ/d
ε (MPa)
‐44
‐24
‐4
16
36
56
76
96d σ/d
ε (ksi)
0.001/s0.01/s0.1/s1.0/s
(e)
Figure 4.3 Curves showing the rate of stress change with strain, dσ/dε, for INCOLOY® 945 tested at strain rates ranging from 0.001 s-1 to 1 s-1 and temperatures of (a) 950 °C, (b) 1000 °C, (c) 1050 °C, (d) 1100 °C, and (e) 1150 °C.
critical dislocation density is needed for the onset of recrystallization. Lower stacking
fault energy materials (like INCOLOY® 945) tend to have a higher strain hardening

66
exponent because cross-slip is more difficult [40]. As shown in the flow curves of Figure
4.1 and strain hardening plots in Figure 4.3, the work hardening rates in Stage III
deformation tend to be higher in compression at 0.1 s-1 in comparison to 1.0 s-1 at low
temperatures, contrary to commonly observed behavior. This may confirm the presence
of dynamic strain aging, to be discussed more in Section 4.1.2.
As reported in Table 4.1, a few specimens deformed in low Z conditions exhibited
virtually no Stage III deformation. At high deformation temperatures and low strain
rates, a lower critical strain is needed for the onset of softening mechanisms like
recrystallization, triggering Stage IV. The critical strain corresponding to the transition
from Stage III to Stage IV was determined graphically; the critical strain decreases with
increasing temperature and decreasing strain rate, as shown in Figure 4.4. The
temperature dependence on the critical strain is much larger at higher strain rates.
0.00
0.05
0.10
0.15
0.20
0.25
0.30
0.35
0.0001 0.001 0.01 0.1 1 10Log(Strain Rate, s‐1)
ε III
-IV
950 °C1000 °C1050 °C1100 °C1150 °C
0.00
0.05
0.10
0.15
0.20
0.25
0.30
0.35
900 1000 1100 1200Temperature (oC)
ε III
-IV
0.001/s0.01/s0.1/s1.0/s
(a) (b)
Figure 4.4 The strains corresponding to the transition from Stage III (or Stage II in specimens where Stage III deformation is absent) to Stage IV deformation for INCOLOY® 945 (a) isothermally and (b) at constant strain rates.
Specimens compressed in low Z-parameter conditions exhibit type IVa
deformation after reaching a critical strain. While specimens exhibiting Stage IVa
deformation appear to reach a steady state stress macroscopically, a magnified view of
the flow curves show that slight oscillations occur in low strain rate and high temperature
specimens. An example of this behavior is shown in Figure 4.5 for hot compression at
1150 °C and 0.001 s-1. Figure 4.5 shows one oscillation in flow stress during deformation

67
to a strain of 1.0, which is consistent with previous observations of high initial grain size
materials undergoing dynamic recrystallization (discussed in Section 2.2) [13,14,25].
The macroscopic steady state flow behavior is therefore achieved from a balance between
work hardening and softening primarily by dynamic recrystallization.
30
32
34
36
38
40
42
44
0.0 0.2 0.4 0.6 0.8 1.0True Strain
True Stress (MPa)
4.4
4.9
5.4
5.9
6.4
True Stress (ksi)
30
32
34
36
38
40
42
44
0.0 0.2 0.4 0.6 0.8 1.0True Strain
True Stress (MPa)
4.4
4.9
5.4
5.9
6.4
True Stress (ksi)
(a) (b)
Figure 4.5 Magnified true stress-strain curve of the specimen compressed at 1150 °C at a strain rate of 0.001 s-1, shown (a) unaltered, and (b) altered to remove machine noise and/or dynamic strain aging to reveal a macroscopic DRX oscillation.
Other softening mechanisms besides dynamic recrystallization may be especially
prevalent in high Z deformation conditions, causing Stage IVb deformation. Stage IVb is
characterized by a drastic change to macroscopic softening (rather than steady state flow
in IVa), indicating a change in the microstructure or deformation mechanism. The low
fraction of observed recrystallized grains (discussed in Section 4.2.1) in high Z
deformation conditions where this phenomena is most prevalent indicates that other
mechanisms besides DRX are likely controlling the flow behavior.
Thermocouples were embedded into specimens, and compression tests were
performed to measure the temperature increase with deformation. The measured
increases in temperature from deformation heating are reported in Table 4.2 and shown
graphically after normalizing by the target temperature in Figure 4.6. The absolute
temperature increased by almost 5% in the high stress samples deformed at a target
temperature of 950 °C and strain rate of 1.0 s-1. On the other hand, specimens
compressed at strain rates 0.001-0.01 s-1 exhibited less than 1% increases in temperature,
insignificant in comparison to the high testing temperatures. The measured deformation

68
heating may have contributed to the softening observed in high Z conditions. However,
deformation heating, as shown in Figure 4.6, is a gradual process while the Stage III –
Stage IVb transition is more drastic. Further details on deformation heating in
INCOLOY® 945 during hot deformation are covered in Section 4.1.3.
Table 4.2 Measured increases in temperature in INCOLOY® 945 specimens compressed to a strain of 1.0 at various temperatures and strain rates
ΔT measured during deformation (°C) Target Temperature (°C) 0.001 s-1 0.01 s-1 0.1 s-1 1.0 s-1
950 0 5.3 26.7 56.4 1050 N.A.* N.A.* 14.3 49.2 1100 N.A.* N.A.* 13.2 38.6
*Deformation heating experiments were not performed due to the insignificant temperature increase at a target temperature of 950 °C.
‐0.01
0.01
0.03
0.05
0.0 0.2 0.4 0.6 0.8 1.0True Strain
ΔT/T target (
Κ/Κ
)
Initial T=950ºCInitial T=1050ºCInitial T=1100ºC0.001 1/s0.01 1/s0.1 1/s1.0 1/s
Figure 4.6 The change in deformation temperature normalized by the target
temperature measured as a function of strain during high temperature compression of INCOLOY® 945.
Internal cracking is observed in specimens deformed in high Z conditions,
representatively shown in Figure 4.7 after hot compression to 1.0 strain at 950 °C and a
strain rate of 1.0 s-1. The onset of cracking may be an additional cause for the transition
to Stage IVb softening. In general, the cracks were oriented 45° from the compression
direction (aligned vertically in Figure 4.7). Therefore, the cracks may also indicate the
presence of shear bands or large strain gradients in the material, although no macroscopic

69
shear bands were observed. Shear bands and strain gradients are covered further in
Section 4.2.1 on the microstructural analysis. Consequently, the transition from Stage III
to Stage IVb deformation is likely a contribution of multiple mechanisms: dynamic
recrystallization, deformation heating, internal cracking, and shear bands or strain
gradients.
(a) (b)
Figure 4.7 Internal crack formation observed at low deformation temperatures and high strain rates (high stress deformation) possibly caused from localized deformation and likely leading to the drastic softening observed in stress-strain curves. Representative scanning electron images shown in (a) and (b) were taken after hot compression to 1.0 strain (compression direction shown by arrows) at a test temperature of 950 °C and strain rate of 1.0 s-1.
4.1.2 Strain Aging Effects on Flow Behavior
Static and dynamic strain aging occur in INCOLOY® 945 during hot
deformation. Strain aging has been observed in alloy 718 [30,56], although not
consistently in other low SFE nickel-base alloys, especially above homologous
temperatures of about 0.5 T/Tm [7,57-59].
Static strain aging (SSA) occurs before the onset or after the cessation of
deformation at elevated temperatures. In the absence of an energy gradient, solute atoms
jump in a random fashion between interstitial sites, especially at higher temperatures
[60]. However, if an energy gradient is present (e.g. the stress field of an edge
dislocation), solute atoms diffuse down the gradient [60]. Therefore, solute atoms collect
around dislocations, which act as energy sinks. Upon deformation, this causes an upper
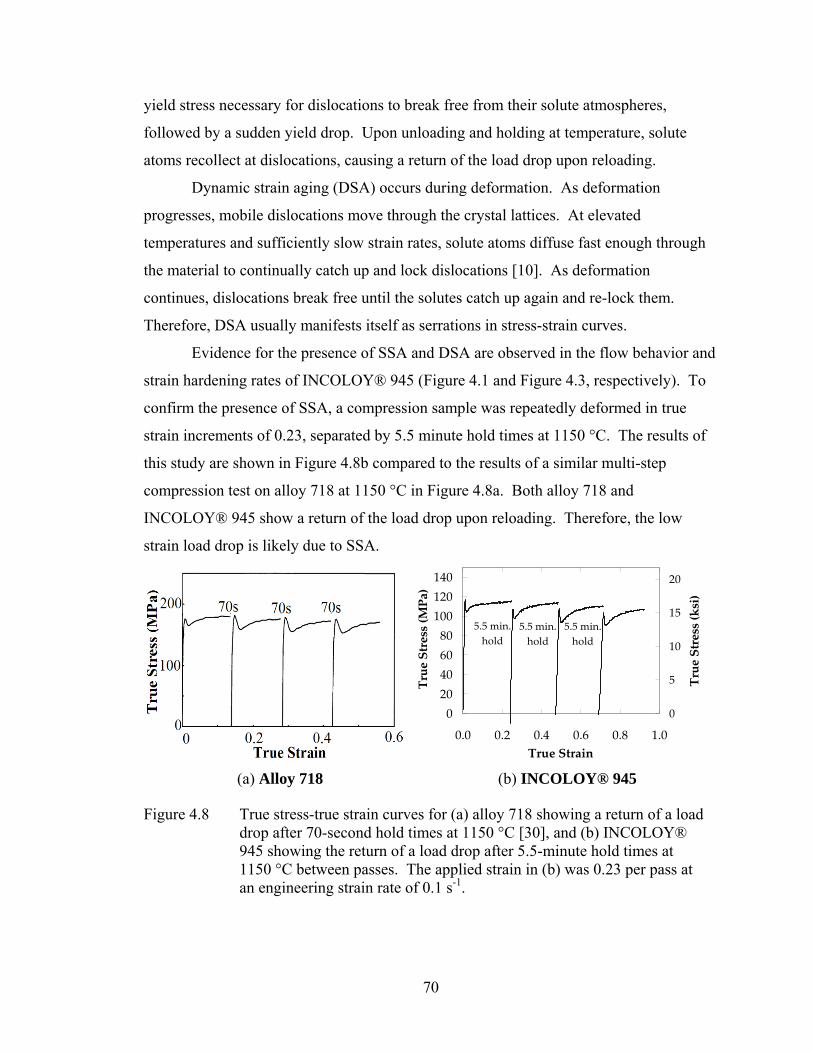
70
yield stress necessary for dislocations to break free from their solute atmospheres,
followed by a sudden yield drop. Upon unloading and holding at temperature, solute
atoms recollect at dislocations, causing a return of the load drop upon reloading.
Dynamic strain aging (DSA) occurs during deformation. As deformation
progresses, mobile dislocations move through the crystal lattices. At elevated
temperatures and sufficiently slow strain rates, solute atoms diffuse fast enough through
the material to continually catch up and lock dislocations [10]. As deformation
continues, dislocations break free until the solutes catch up again and re-lock them.
Therefore, DSA usually manifests itself as serrations in stress-strain curves.
Evidence for the presence of SSA and DSA are observed in the flow behavior and
strain hardening rates of INCOLOY® 945 (Figure 4.1 and Figure 4.3, respectively). To
confirm the presence of SSA, a compression sample was repeatedly deformed in true
strain increments of 0.23, separated by 5.5 minute hold times at 1150 °C. The results of
this study are shown in Figure 4.8b compared to the results of a similar multi-step
compression test on alloy 718 at 1150 °C in Figure 4.8a. Both alloy 718 and
INCOLOY® 945 show a return of the load drop upon reloading. Therefore, the low
strain load drop is likely due to SSA.
020406080100120140
0.0 0.2 0.4 0.6 0.8 1.0True Strain
True Stress (MPa)
0
5
10
15
20
True Stress (ksi)
5.5 min. hold
5.5 min. hold
5.5 min. hold
(a) Alloy 718 (b) INCOLOY® 945
Figure 4.8 True stress-true strain curves for (a) alloy 718 showing a return of a load drop after 70-second hold times at 1150 °C [30], and (b) INCOLOY® 945 showing the return of a load drop after 5.5-minute hold times at 1150 °C between passes. The applied strain in (b) was 0.23 per pass at an engineering strain rate of 0.1 s-1.

71
The presence of SSA in INCOLOY® 945 is generally more prevalent at high
deformation temperatures and low strain rates. Typically, SSA occurs in deformation
conditions where dislocations are less mobile: low deformation temperatures and high
strain rates. At 1150 °C, the load drop is more prominent at high strain rates, in line with
expected behavior. The hot compression tests were performed at a constant true strain
rate, which is correlated to dislocation motion by [10]:
vbρε =& (4.1)
where b is the burgers vector, ρ is the density of mobile dislocations, and v is the
velocity of mobile dislocations. Initially, the mobile dislocation density is very low, as
they are pinned by solute atoms. Therefore, to maintain the compression strain rate, a
high mobile dislocation velocity is required, which is related to applied stress by [10]:
m
v ⎟⎟⎠
⎞⎜⎜⎝
⎛=
0ττ
(4.2)
where τ is the applied stress, τ0 is the resolved shear stress corresponding to unit velocity,
and m is a material constant, not to be confused with the strain rate sensitivity. Once a
critical stress τ is reached, dislocations break free from solutes, causing a sudden increase
in mobile dislocation density. Since the strain rate in Equation (4.1) remains constant,
the velocity of mobile dislocations must drop to accommodate the higher mobile
dislocation density. Subsequently, according to Equation (4.2), the applied stress to
maintain the necessary dislocation velocity decreases.
Based on the mechanism described above, SSA is conventionally more prevalent
at high strain rates and low deformation temperatures. At high temperatures and low
strain rates, there is enough thermal aid and time for dislocations to overcome barriers
(e.g. solute atmospheres), leading to less of an SSA effect. The presence of substitutional
SSA or Suzuki locking, rather than the more common interstitial locking by carbon and
nitrogen atoms, may explain the opposite trend in INCOLOY® 945 [57,58]. Since
substitutional elements are large compared to interstitial elements, a higher temperature is
necessary for diffusion to other substitutional sites. If large substitutional elements like
chromium or iron are allowed to diffuse, only one or two jumps may be necessary to

72
anchor dislocations [58]. The high homologous temperatures used in this work may
prevent interstitial elements from contributing to solution hardening.
Several diffusion rates of interstitial and substitutional elements were compared to
assess the possibility of the Suzuki locking mechanism. In this investigation, SSA was
observed at 1100 °C in an fcc nickel matrix, while SSA has been more widely studied at
room temperature in bcc iron. Therefore, the diffusion rates of several substitutional
elements in fcc nickel at 1100 °C were compared to the diffusion rates for interstitial
carbon and nitrogen in bcc iron at 25 °C. The diffusion rates were calculated as:
⎟⎠
⎞⎜⎝
⎛ −=
RTE
DD aexp0 (4.3)
where D is in m2/s, D0 is the diffusivity given in m2/s, Ea is the activation energy for
diffusion given in J/mol, R is the ideal gas constant, and T is the absolute temperature in
K. The diffusivities and activation energies for diffusion are given in Table 4.3. The
resulting diffusion rates are shown in Table 4.4. The diffusion rates of large
substitutional elements (Cr, Fe, and Cu) in the highly packed fcc matrix were surprisingly
5-6 orders of magnitude larger at 1100 °C than the small interstitial elements (C and N)
in the less packed bcc structure at 25 °C.
Table 4.3 Diffusivities and activation energies for diffusion of several species in a nickel and iron matrix [61,62]
Diffusing Species Matrix Temperature Range
(°C) D0 (x10-4 m2/s) Ea (kJ/mol)
Cr Ni 1100-1268 1.1 272.6 Fe Ni 1205-1396 1.0 269.4 Cu Ni 1054-1359 0.57 258.3 C Fe Room Temperature 0.02 84.2 N Fe Room Temperature 0.015 80.0
Table 4.4 Diffusion rates for several species in an fcc nickel and bcc iron matrix
Diffusing Species Matrix Temperature (°C) D (m2/s) Cr Ni 1100 4.66·10-15
Fe Ni 1100 5.64·10-15 Cu Ni 1100 8.44·10-15 C Fe 25 3.49·10-21 N Fe 25 1.42·10-20

73
The diffusion distances of solute atoms through the matrix over a given time may
be calculated as:
Dtx = (4.4)
where x is in meters, D is in m2/s, and t is the diffusion time in seconds. Using this
equation, the substitutional chromium, iron, and copper may diffuse approximately 1.24,
1.36, and 1.67 μm through the nickel matrix in the 5.5-minute interstep hold times at
1100 °C, respectively. These diffusion distances are much larger than that needed for
static strain aging. In order for interstitial carbon or nitrogen to diffuse even 1.0 μm
through iron at room temperature, 9.2 or 2.2 years would be required, respectively.
Therefore, it is not surprising that static strain aging, which can occur via interstitial
diffusion in steel over several days at room temperature, may also occur via substitutional
diffusion in nickel during the 5.5-minute hold times at 1100 °C.
Microstrain (or Stage I) DSA may have also assisted SSA, which further explains
why the load drops are often more prominent at lower strain rates and higher
temperatures. DSA is more prevalent at higher temperatures where solutes diffuse faster
through the lattice and slower strain rates that allow solutes to catch up to mobile
dislocations. During microstrain deformation, solutes catch up to the few mobile
dislocations, pin them, and assist SSA in creating a macroscopic yield drop. Microstrain
DSA may also explain the yield point anomalies observed in Figure 4.2, such as the dip
in yield stress at low deformation temperatures and high strain rates where solutes are
less able to diffuse quickly enough through the fcc lattice to lock dislocations.
Serrations in the flow curves of specimens compressed at low Z conditions
indicate that DSA occurred in all stages of deformation. An example of the serrations is
shown for the 1150 °C, 0.001 s-1 condition in Figure 4.5a. Additionally, the comparative
rates of strain hardening (Figure 4.3) clearly show indications of DSA in Stage III
deformation. Higher strain hardening rates would typically be expected at high strain
rates where there is not as much time for dislocations to overcome barriers via thermal
aid. However, higher strain hardening rates are often observed during Stage III
deformation in specimens compressed at lower strain rates, especially at low deformation
temperatures. A higher stress is required to overcome barriers at low strain rates due to
DSA strengthening.

74
While results presented thus far support the presence of SSA and DSA in
INCOLOY® 945 during hot compression, strain aging is not expected to occur in this
alloy with these experimental test conditions. SSA is not typically observed in fcc
materials, especially at homologous temperatures above 0.79 T/Tm because of the high
number of slip systems and the contribution of thermal aid for dislocations to overcome
barriers. Likewise, DSA is not typically reported at such high homologous temperatures.
BCC materials, like low carbon steel, have a much lower atomic packing factor, so
interstitial solutes can diffuse easily through the lattice to pin dislocations, even at very
low temperatures [11]. At high temperatures on the other hand, the bcc lattice is more
relaxed and better able to accommodate the strain associated with interstitial atoms, so
discontinuous yielding from DSA disappears [11]. The atomic packing density of
INCOLOY® 945, an fcc alloy, is relatively large compared to bcc alloys. Therefore,
high homologous temperatures are necessary to expand the lattice enough to allow for
interstitial diffusion. Even higher temperatures are likely required to allow for
substitutional and vacancy diffusion of large elements like chromium, iron, or copper.
DSA is also often characterized by a region with zero or negative strain rate
sensitivity. The calculated strain rate sensitivity, discussed in Section 4.3.1, is never
negative for INCOLOY® 945. DSA may occur in regions of localized deformation from
inhomogeneous strain, which may disguise its influence on strain rate sensitivity in the
overall material. Kocks et al. discussed DSA with positive strain rate sensitivities in Ni-
C alloys [57]. It appears that even though the calculated overall strain rate sensitivity in
Kocks’ work was positive, the flow stress for the higher strain rates was smaller over
certain strain increments (like that observed in regions of Stage III deformation in
INCOLOY® 945), showing a clear negative strain rate sensitivity. Kocks suggested that
the kinetic effects on flow behavior are dominated by the kinetics of dislocation structure
evolution rather than the kinetics of flow stress at a constant structure [57]. He concluded
that a comparison of flow stresses at a constant strain is oftentimes meaningless, possibly
further explaining the positive strain rate sensitivity.
DSA also oftentimes requires a critical strain [63]. However, the high
homologous temperatures (0.79-0.92 T/Tm) used in this investigation may allow DSA to
occur at very small strains. In addition, as strain is increased, the dislocation density
75
requiring pinning increases while the number of available solute atoms does not increase.
Therefore, pinning may be more effective in microstrain deformation in INCOLOY® 945
where the initial dislocation density is exceptionally low.
If strain aging occurs by interstitial diffusion rather than substitutional diffusion,
an argument may be made that the carbon and nitrogen levels (reported in Table 2.1) are
too low to allow SSA or DSA. The initial microstructure consisted of fully statically
recrystallized grains 410 µm in diameter, leading to a very low initial dislocation density.
Therefore, it is possible that very little carbon or nitrogen is needed for pinning. The
chemical composition of INCOLOY® 945 reported in Table 2.1 was taken from a
chemistry sample after electroslag remelting of an industrially-sized ingot. Fluctuations
in chemistry throughout the ingot may have caused an increased carbon and/or nitrogen
content in the small compression specimens used in this study.
Some have also proposed alternative mechanisms for strain aging in fcc materials.
Rose and Glover proposed that even small amounts of carbon can promote strain aging in
fcc alloys through carbon-carbon pairs (one atom in a substitutional site, while the other
sits in an adjacent interstitial site) or carbon-vacancy pairs (a substitutional vacancy with
a carbon atom in an adjacent interstitial site) [64,65]. While individual carbon atoms in an
fcc lattice occupy octahedral sites, only causing symmetrical distortion of the lattice,
carbon-carbon or carbon-vacancy pairs may rotate upon applied stress and cause
asymmetric lattice distortions leading to Snoek locking [64]. Some have even reported
that hydrogen plays a significant role in strain aging of fcc materials [65-69]. However,
these mechanisms are obviously temperature dependent and have not been confirmed for
temperatures above 0.79 T/Tm.
4.1.3 Deformation Heating During Hot Compression
Temperature increases during deformation are often referred to as “adiabatic
heating.” However, this description is inaccurate, because adiabatic heating assumes that
no heat was lost to the environment. During hot compression, heat is likely lost through
conduction to the compression dies and convection to the atmosphere. The temperature
increases are therefore referred to as “deformation heating” in the remainder of this work.

76
Evidence of significant deformation heating, especially at high strain rates and
low starting temperatures, is reported in Table 4.2 and Figure 4.6. Although deformation
heating was measured for a range of deformation conditions, the exact temperature
increase for every condition could not be measured because the test furnace became
inoperable. Therefore, the following model was used to predict temperature increases for
all test conditions [56]:
∫=Δpl
dC
Tp
ε
εσρη
0 (4.5)
where ΔT is the increase in specimen temperature, η is the fraction of mechanical work
converted to heat, ρ is the density taken to be 0.007778 g/mm3, σ is the measured stress, ε
is the measured total strain, and Cp is the specific heat capacity for INCOLOY® 945
given by:
Cp = 444.9 + 0.2339T (4.6)
where Cp is given in J/(kg·C) and T is the initial deformation temperature in °C. Equation
(4.6) was determined by linear interpolation of lower temperature heat capacity data
provided by Special Metals Corporation [3]. εpl is the plastic strain, calculated by:
Etotalplσεε −= (4.7)
where εtotal is the measured total strain and E is Young’s modulus. The ram deflection
and machine compliance was previously subtracted from εpl in the analysis of the flow
behavior. The Young’s modulus for INCOLOY® 945 was calculated by linear
extrapolation of data provided by Special Metals Corporation summarized by the
equation [3]:
E = 197044 – 57.93T (4.8)
The results of the analysis described above are shown in Figure 4.9 for η=1.0,
comparing predictions from Equation (4.5) to experimental data. Although the model in
Equation (4.5) has been successful in predicting deformation heating in several materials
in the past using a work-to-heat efficiency of η=0.95 [56], great deviation is observed in
comparison to INCOLOY® 945 experimental data. Even when η is increased to 1.0
(assuming 100% conversion of mechanical work to heat), the model still under predicts

77
the temperature increase in INCOLOY® 945 (Figure 4.9). Strain inhomogeneities,
inaccuracies related to Cp interpolation, the dependence of Cp on substructure, and the
unaccounted changes in density with temperature may all contribute to the under
predictions by Equation (4.5). Further work is needed to confirm the reasons behind the
deviation between the model and experimental data.
0
10
20
30
40
50
60
0.0 0.2 0.4 0.6 0.8 1.0True Strain
ΔT (oC)
950 °C Experimental 1050 °C Experimental1100 °C Experimental Model Prediction
Figure 4.9 Model comparison to experimentally measured temperature increases from deformation heating of INCOLOY® 945 during hot compression at a strain rate of 1.0 s-1. The model assumes 100% conversion of work to heat.
4.1.4 Comparison to Other Alloys
Comparing the flow behavior of INCOLOY® 945 in this study to investigations
performed on other nickel-base alloys like alloy 718 poses challenges, since the flow
behavior is reported differently from study to study. The flow behavior of all materials is
obviously dependent on deformation temperature, strain rate, type of loading
(compression versus tension or torsion), initial grain size, and precipitates present in the
78
material. Therefore, comparing values of flow stress quantitatively is impractical.
However, qualitative comparisons of the flow behavior may be made. For more
quantitative comparisons, the reader is referred to recent papers and brochures on
INCOLOY® 945 published by Special Metals Corporation [3,70,71].
In general, the flow behavior of INCOLOY® 945 observed at high deformation
temperatures and low strain rates is consistent with previous research performed on pure
nickel, Ni-20%Cr, and alloy 718 discussed in Section 2.2, and other nickel-base alloys.
In low Z deformation conditions, a macroscopic steady state stress is achieved at a low
strain, indicating a balance between dislocation multiplication and softening mechanisms
like dynamic recrystallization. A closer look at the stress-strain curves in these
conditions show one or two low amplitude stress oscillations indicative of dynamic
recrystallization. Dynamic recrystallization is common at low strain rates and high
temperatures in nickel-base alloys because recovery processes are too slow due to the low
stacking fault energy. This behavior is also consistent with a wide range of materials
having a high initial grain size, where only one or two oscillations are observed in the
flow curves as opposed to several oscillations in fine grained materials. Examples of the
influence of initial grain size are shown for pure copper and pure nickel previously in
Figure 2.4.
The large degree of softening at high strain rates in INCOLOY® 945 has been
observed in other nickel-base alloys. However, researchers often attribute the softening
to dynamic recrystallization and deformation heating. Little research has gone into
investigating other possibilities like the effects of internal cracking and strain localization
on the flow behavior. The next section on Microstructural Analysis sheds more light in
this area.
The stress-strain curves of INCOLOY® 945 contain load drops from static strain
aging at high deformation temperatures. Similar behavior has been observed in some
alloy 718 studies but not consistently with all low SFE nickel-base materials. Static
strain aging, although less common in fcc materials, has been reported in nickel-base
alloys, but usually at much lower temperatures (< 500 °C) [57,59,63-65,72]. This
difference may be attributed to the differences in alloy composition and the possibility for

79
substitutional diffusion at such high deformation temperatures. Additional explanations
were given previously in Section 4.1.2.
4.2 Microstructural Analysis
Microstructural analysis was performed on hot compression specimens using light
optical microscopy (LOM), transmission electron microscopy (TEM), electron
channeling contrast imaging (ECCI), and electron backscatter diffraction (EBSD). The
following sub-sections discuss the effect of testing conditions on microstructure, the
evolution of microstructure with strain, and proposed mechanisms for recrystallization in
INCOLOY® 945.
4.2.1 Effect of Deformation Temperature and Strain Rate on the Microstructure
The effect of deformation temperature and strain rate on the final microstructure after
compressing to a strain of 0.97 ± 0.03 was examined. The final microstructures are
shown in Figure 4.10. At a deformation temperature of 950 °C (not accounting for
deformation heating), pancaking of the original grains is predominant over
recrystallization. Approximately 13% recrystallization is observed at the lowest strain
rate of 0.001 s-1, and less than 2% recrystallization is observed at higher strain rates. At
higher temperatures of 1000-1050 °C, recrystallization occurs at all strain rates, with
further pancaking of the original grains. Recrystallized grains nucleate on grain
boundaries and annealing twins. Further analysis of the mechanisms of nucleation are
covered in Section 4.2.4. At deformation temperatures of 1100-1150 °C, up to 94%
recrystallization is observed at the lowest strain rate of 0.001 s-1, and extensive
recrystallization occurs at all other strain rates as shown by the necklace structure in the
micrographs. At high deformation temperatures and low strain rates, grain growth of
recrystallized grains also occurs.
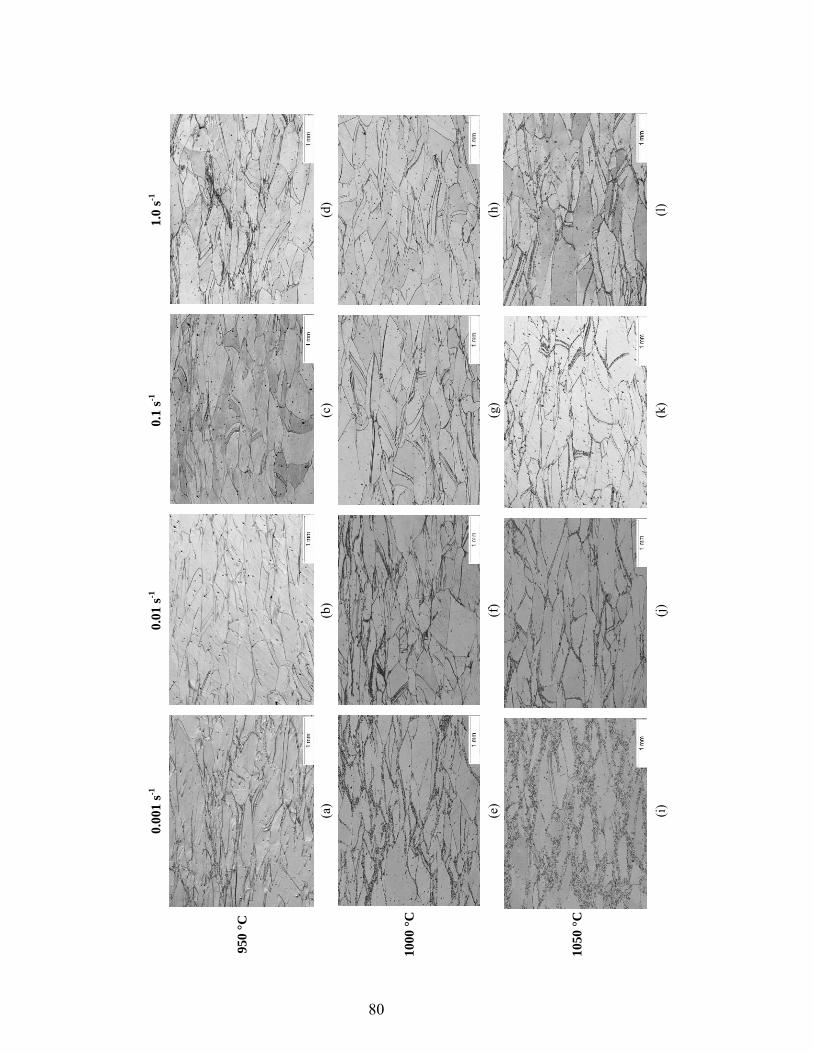
80
0.
001
s-1
0.01
s-1
0.1
s-1
1.0
s-1
950
°C
(a
) (b
) (c
) (d
)
1000
°C
(e
) (f
) (g
) (h
)
1050
°C
(i)
(j)
(k
) (l)
80
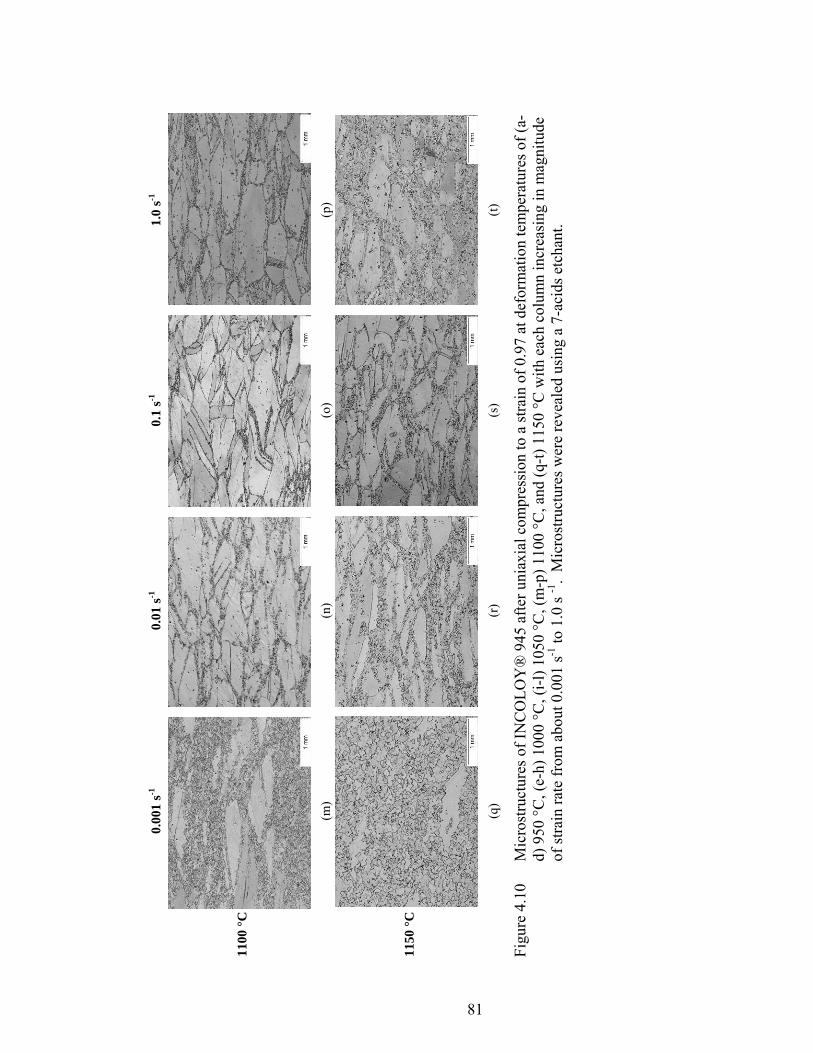
81
0.
001
s-1
0.01
s-1
0.1
s-1
1.0
s-1
1100
°C
(m
) (n
) (o
) (p
)
1150
°C
(q
) (r
) (s
) (t)
Figu
re 4
.10
Mic
rost
ruct
ures
of I
NC
OLO
Y®
945
afte
r uni
axia
l com
pres
sion
to a
stra
in o
f 0.9
7 at
def
orm
atio
n te
mpe
ratu
res o
f (a-
d) 9
50 °C
, (e-
h) 1
000
°C, (
i-l) 1
050
°C, (
m-p
) 110
0 °C
, and
(q-t)
115
0 °C
with
eac
h co
lum
n in
crea
sing
in m
agni
tude
of
stra
in ra
te fr
om a
bout
0.0
01 s-1
to 1
.0 s
-1.
Mic
rost
ruct
ures
wer
e re
veal
ed u
sing
a 7
-aci
ds e
tcha
nt.
81

82
Figure 4.11a shows a plot of volume percent recrystallized versus temperature.
At low deformation temperatures, the nucleation of recrystallized grains only happens
marginally at high strain rates. At all deformation temperatures, a higher fraction of
recrystallization occurs at low strain rates. The trends in recrystallization confirm the
presence of dynamic recrystallization, especially at slow strain rates, whereas static
recrystallization is enhanced by higher retained work produced by high strain rates. The
percent recrystallization decreases with increasing strain rate, up to a strain rate of 0.1 s-1.
As the strain rate is increased beyond 0.1 s-1, the percent recrystallization slightly
increases, which may be attributed to deformation heating and/or the onset of static
recrystallization after the cessation of deformation.
0102030405060708090
100
900 1000 1100 1200Temperature (oC)
% R
ecry
stal
lized
0.001 1/s0.01 1/s0.1 1/s1.0 1/s
1.0
10.0
100.0
0.0001 0.001 0.01 0.1 1 10Strain Rate (s-1)
d ( μ
m)
950 °C1000 °C1050 °C1100 °C1150 °C
(a) (b)
Figure 4.11 Percent recrystallization (a) and recrystallized grain size (b) in INCOLOY® 945 after hot compression to a strain of 1.0 at the experimental strains and strain rates.
Similar conclusions may be drawn from the recrystallized grain size trends,
shown in Figure 4.11b as a function of strain rate. Recrystallized grain size increases
with increasing deformation temperature. The highest recrystallized grain size occurs at
the lowest strain rates where more time is allowed for grain growth. For a constant
temperature, as the strain rate increases the recrystallized grain size decreases and either
reaches a plateau or increases slightly. A slight increase in recrystallized grain size at a
strain rate of 1.0 s-1 once again indicates a transition to static recrystallization, or may
simply be attributed to deformation heating.

83
ECCI images taken at various deformation temperatures and strain rates, shown in
Figure 4.12, reveal substructure formation during deformation. At a strain rate of 1.0 s-1,
especially at lower deformation temperatures, a large strain gradient may be clearly seen
within non-recrystallized deformed grains by the contrast eddies in Figure 4.12d and e.
The contrast in ECCI is directly related to the crystal orientation with respect to the
electron beam. The large non-uniform changes in contrast within deformed grains at high
strain rates confirms the presence of inhomogeneous strain gradients suggested in the
previous section. The inhomogeneous deformation may lead to microstrain deformation
(possibly leading to microstrain DSA), high strain hardening rates observed in the flow
curves, the onset of internal cracking, and a higher rate of deformation heating.
On the other hand, at a slower strain rate of 0.001 s-1, subgrain formation begins
to occur within non-recrystallized grains in place of the orientation eddies observed at
high strain rates. The subgrain formation at low strain rates may indicate the onset of
recovery, hence diminishing the amount of work hardening compared to high strain rates.
At the highest deformation temperature (1150 °C) and slowest strain rate (0.001 s-1),
shown in Figure 4.12c, the structure is almost fully recrystallized, and substructure
development is observed within recrystallized grains. The development of substructure
in recrystallized grains indicates that recrystallization occurred dynamically, which is
covered further in Section 4.2.4. In addition, the grain boundaries in the microstructures
at low strain rates and high temperatures where DRX is most favorable contain more
bulges and non-linear twins while SRX grain boundaries have more smooth boundaries
with straight twins.
EBSD was performed to further show the evolution of substructure by
quantitatively measuring the grain and subgrain misorientations in deformed
INCOLOY® 945 as a function of deformation temperatures and strain rates. Grain
boundary misorientation maps are shown in Figure 4.13. At low deformation
temperatures, substructure in the form of low angle grain boundaries (2-5°) is observed,
especially at a strain rate of 1.0 s-1. At higher deformation temperatures, the substructure
is replaced by recrystallized grains with high angle grain boundaries (>15°). This
observation is consistent with the trends observed using LOM.

84
950 °C 1050 °C 1150 °C
0.001 s-1
(a) (b) (c)
1.0 s-1
(d) (e) (f)
Figure 4.12 ECCI images showing recrystallization and substructure formation in INCOLOY® 945 compressed to 1.0 strain at strain rates of (a-c) 0.001 s-1 and (d-f) 1.0 s-1 at temperatures of (a and d) 950 °C, (b and e) 1050 °C and (c and f) 1150 °C.
At low strain rates and high temperatures of 1050-1150 °C, very little substructure
formation is observed in EBSD grain boundary misorientation maps. However, in the
ECCI images shown in Figure 4.12, clear subgrain formation is observed in non-
recrystallized grains at 1050 °C, and substructure begins to form within recrystallized
grains at 1150 °C. It is possible that the inconsistencies between ECCI and EBSD are
due to the EBSD scan step size or the small subgrain misorientations. The EBSD results
filtered out any misorientations less than 2°. TEM results, shown later, show that the
subgrains do have misorientations less than 2°, which supports the ECCI observations.

85
0.001 s-1 1.0 s-1
950 °C
(a) (b)
1050 °C
(c) (d)
1150 °C
(e) (f)
Figure 4.13 Grain boundary misorientation maps of INCOLOY® 945 specimens compressed to 1.0 strain at (a and b) 950 °C, (c and d) 1050 °C, and (e and f) 1150 °C at strain rates of (a, c, and e) 0.001 s-1 and (b, d, and f) 1.0 s-1. Refer to the electronic document for color imaging. Grain misorientations are indicated by red (2-5°), green (5-15°), blue (>15°), and purple (60°±5° [111] twin).

86
Twins are clearly present in the recrystallized grains at all other deformation
conditions. Twinning within recrystallized grains is consistent with previous studies on
nickel alloys. They tend to be more prominent in low stacking fault energy materials; in
high stacking fault energy materials, dynamic recovery is much more likely and takes
precedence over twinning and recrystallization.
The frequency of misorientation angles as a function of test temperature and strain
rate is shown in Figure 4.14. This figure supports the conclusions drawn from Figure
4.13 at a more quantitative level. At a deformation temperature of 950 °C, approximately
60% of the boundaries detected in the structure using EBSD were low or intermediate
angle boundaries (<15%) due to the limited amount of recrystallization. As deformation
temperature is increased, the frequency of low angle boundaries diminishes as the
frequency of high angle boundaries increases from recrystallization. This is especially
true at low strain rates where dynamic recrystallization is more prevalent. At
temperatures of 1050-1150 °C, a large peak of ~60° misorientations is observed,
characteristic of annealing twins or coincident site lattice boundaries.
950 oC, 1.0 Strain
0
0.1
0.2
0.3
0.4
0.5
0.6
0.7
4 10 16 22 29 35 41 48 54 60Angle (Degrees)
Number Fraction 0.001/s
1.0/s
1050 oC, 1.0 Strain
0
0.1
0.2
0.3
0.4
0.5
0.6
0.7
4 10 16 22 29 35 41 48 54 60Angle (Degrees)
Num
ber Fraction 0.001/s
1.0/s
(a) (b)
1150 oC, 1.0 Strain
0
0.1
0.2
0.3
0.4
0.5
0.6
0.7
4 10 16 22 29 35 41 48 54 60Angle (Degrees)
Number Fraction 0.001/s
1.0/s
(c)
Figure 4.14 The distribution of grain misorientations in INCOLOY® 945 after hot compression to 1.0 strain at strain rates of 0.001 and 1.0 s-1 at deformation temperatures of (a) 950 °C, (b) 1050 °C, and (c) 1150 °C.

87
Some recrystallized grains in INCOLOY® 945 form with low energy coincident
site lattice (CSL) boundaries. The preferred CSL boundaries may be observed using
misorientation distribution functions (MDFs). An MDF describes grain boundary
misorientations in terms of an axis of rotation that the two grains have in common, and
the rotation about the axis to bring the two lattices into coincidence (an axis/angle pair)
[55]. An MDF for the specimen compressed to 1.0 strain at 1150 °C and 0.001 s-1 is
shown in Figure 4.15. The concentrations of axis/angle pairs were correlated with CSL
boundaries reported for fcc materials. Possible CSL boundaries observed in INCOLOY®
945 are listed in Table 4.5 with the corresponding fractions of boundaries for the
condition shown in Figure 4.15. After deformation to 1.0 compressive strain at 1150 °C
and a strain rate of 0.001 s-1 where 94% recrystallization occurs, 53.1% of the grain
boundaries are within 10° of a low energy CSL boundary, about half of which may be
characterized as <111> 60° twin boundaries. Although the CSL boundary fraction does
not appear to change with deformation conditions, the preference for grains to form with
CSL boundaries increases with the amount of recrystallization (high temperatures and
low strain rates). The MDFs for all deformation conditions are shown in Appendix B.
Precipitation is observed along high angle boundaries in the specimens deformed
at 950-1000 °C at all strain rates tested 0.001-1.0 s-1. ECCI images of the precipitation
are shown in Figure 4.16. The precipitates are inconsistent in morphology, ranging from
cuboidal to rod-shaped. Since the precipitates are not observed in specimens deformed at
1050 °C and above, the microstructure was likely fully solutionized in the 90 minute heat
treatment at 1200 °C prior to machining. The second phase therefore precipitated during
the six minute preheats prior to compression testing. Deformation induced precipitation
is unlikely, since no precipitates were observed intragranularly or along dynamically
recrystallized grain boundaries. As shown in Figure 4.16, the precipitates are clearly only
present along initial high-angle grain boundaries.
Energy dispersive spectroscopy (EDS) was performed on regions of the 950 °C
0.001 s-1 microstructure containing precipitates in attempt to determine the precipitate
phase. Since the precipitates were only approximately 100 nm in diameter, an EDS spot
scan can only provide semi-quantitative information. Therefore, an EDS map was

88
collected over the image shown in Figure 4.17a for nickel, titanium, aluminum,
chromium, carbon, iron, and niobium. Figure 4.17a shows a migrating boundary being
pinned by one of the precipitates. Only niobium shows a clear increased concentration
within the precipitates, as shown in Figure 4.17b. The increased concentration of
niobium is indicative of a high temperature Ni3Nb δ phase, originally thought to be
absent in INCOLOY® 945. INCOLOY® 945 has been reported in unpublished work to
contain a high temperature η phase instead of δ. However, the η phase consists of Ni3Ti,
in which niobium is completely insoluble.
Table 4.5 Possible coincident site lattices observed in INCOLOY® 945 recrystallized structures and the fraction of CSL boundaries present after 1.0 compressive strain at 1150 °C and a strain rate of 0.001 s-1
Σ Common Axis <uvw> Misorientation (°) Fraction of
Boundaries 3 <111> 60.00 0.243
13a <100> 22.62 0.028 13b <111> 27.79 0.033 17a <100> 28.07 0.028 21a <111> 21.78 0.039 31b <211> 52.20 0.076 33c <110> 59.00 0.084
Figure 4.15 Misorientation distribution function of INCOLOY® 945 after
compression to 1.0 strain at 1150 °C and a strain rate of 0.001 s-1.

89
(a) (b)
Figure 4.16 Precipitation along initial high angle grain boundaries observed in INCOLOY® 945 specimens compressed to 1.0 strain at 950 °C. The ECCI images shown above were taken from a specimen compressed at a strain rate of 0.001 s-1. Image (b) shows a zoomed in view of the area outlined by the dotted boxed in (a).
(a) (b)
Figure 4.17 Intergranular precipitation in INCOLOY® 945 compressed to 1.0 strain at 950 °C. The precipitates shown in the ECCI image (a) appear to be niobium-rich shown by the niobium EDS map in (b), indicative of the high temperature Ni3Nb δ phase.

90
4.2.2 Hardness of Deformed INCOLOY® 945
Hardness tests were performed on the deformed samples to relate the
microstructural evolution during hot deformation to mechanical behavior. Results are
shown in Figure 4.18. Hardness measurements were performed using a Rockwell
indenter and an HRA scale since hardness values ranged between the more common
upper HRB and lower HRC scales. The hardness decreases with increasing temperature,
therefore not following a typical Hall-Petch relationship, since the average grain size was
smaller at higher temperatures due to recrystallization. Thus, the dislocation substructure
has a large effect on strength, and mechanical properties cannot necessarily be related
strictly to grain size after hot deformation. Figure 4.18 suggests that substructure
formation within recrystallized grains is significantly lower than the non-recrystallized
grains. In general, the hardness behavior follows closely to the trends in yield stress
shown in Figure 4.2.
72
74
76
78
80
82
900 1000 1100 1200
Temperature (oC)
Hardness (HRA)
1.0/s 0.1/s0.01/s 0.001/s
Figure 4.18 Hardness profiles of INCOLOY® 945 specimens compressed to 1.0 true strain as a function of deformation temperature and strain rate.
4.2.3 Microstructural Evolution
Specimens compressed at a slow strain rate undergoing Stage IVa deformation
(described in Section 4.1) exhibit slight oscillations in their stress-strain behavior, as
shown in Figure 4.5. The oscillations were described previously to be an indication of

91
dynamic recrystallization. Another example is shown in Figure 4.19a, which shows a
magnified true stress-strain curve of a specimen compressed at 1050 °C and a strain rate
of 0.001 s-1. DSA serrations in the stress-strain curve were removed to show the
macroscopic oscillation behavior. The slight increase in stress at a strain of 1.0 may
indicate a second cycle of recrystallization. Since the amplitude of the observed
oscillation is only approximately 6 MPa, optical microscopy was performed on
specimens compressed to incremental strains to determine whether a steady-state
microstructure was achieved (rather than a changing structure due to DRX). Figure
4.19b-f shows a clear increase in recrystallized volume fraction with increasing strain.
There is no recrystallization at a strain of 0.2 and the recrystallized volume fraction is
43% at a strain of 1.0, confirming the presence of dynamic recrystallization during
deformation.
65
67
69
71
73
75
77
79
81
0.0 0.2 0.4 0.6 0.8 1.0True Strain
True
Str
ess
(MPa
)
(a) (b) 0.2 strain (c) 0.4 strain
(d) 0.6 strain (e) 0.8 strain (f) 1.0 strain
Figure 4.19 Magnified true stress-true strain curve (a), and microstructure of INCOLOY® 945 after uniaxial compression at a deformation temperature of 1050 °C, strain rate of 0.001 s-1, and strains of (b) 0.2, (c) 0.4, (d) 0.6, (e) 0.8, and (f) 1.0, showing evolution of DRX. Microstructures were revealed using a 7-acids etchant.

92
As mentioned earlier, this microstructural evolution is consistent with observed
trends for nickel and copper with large initial grain sizes, where one oscillation in the
flow curves is observed, indicating one cycle of recrystallization [13,14]. The evolution
of microstructure is shown quantitatively in Figure 4.20 for deformation at 1050 °C and a
strain rate of 0.001 s-1. As clearly supported in the micrographs in Figure 4.19, the
volume fraction of recrystallization increases almost exponentially with strain. The
recrystallized grains nucleate at a strain slightly larger than 0.2, then rapidly grow to a
stable recrystallized grain size of 24 ± 4 µm for the remainder of deformation.
Surprisingly, the critical strain for the onset of Stage IVa deformation shown in Figure
4.4 is much lower than 0.2, indicating that recrystallization nucleates at a strain where
recrystallization is unobservable by LOM or that some recovery occurs at low strains
prior to recrystallization to balance strain hardening. While the stable recrystallized grain
size is clearly temperature and strain rate dependent, as shown previously in Figure
4.11b, strain appears to play a negligible role. This same behavior was observed in pure
nickel with a high initial grain size (470 µm) by Sakai [13]. Sakai suggested that the
stable grain size indicates recrystallization by the bulging mechanism leading to a
necklace structure (consistent with the LOM observations above) because work
hardening in recrystallized grains takes place with concurrent deformation, eliminating
the driving force for growth, which is driven by gradients in dislocation density.
Recrystallization mechanisms are discussed further in Section 4.2.4.
0
5
10
15
20
25
30
35
40
0.0 0.2 0.4 0.6 0.8 1.0True Strain
d (μm)
0
0.1
0.2
0.3
0.4
0.5
Fraction Rx, V
RX
dVRX
Figure 4.20 Recrystallized grain size and volume fraction of recrystallized grains during hot compression of INCOLOY® 945 at 1050 °C and 0.001 s-1.

93
EBSD scans were run on the same specimens to investigate the evolution of
recrystallization and substructure formation through grain misorientations. Grain
boundary misorientation maps are shown in Figure 4.21. The initial microstructure
(Figure 4.21a) consists of large strain-free statically recrystallized grains containing large
annealing twins. As deformation progresses, the development of substructure may be
observed in the form of low angle (2-5°) boundaries. The onset of recrystallization was
observed in LOM to occur at a critical strain between 0.2 and 0.4. Once recrystallization
begins to nucleate, the number of high angle grain boundaries increases with strain,
annihilating dislocations, and decreasing the amount of substructure within the deformed
grains. The recrystallized grains that form at 1050 °C and 0.001 s-1 contain annealing
twins because dynamic recovery is too slow to occur, which is consistent with
microstructures and EBSD scans presented in the previous section.
A histogram showing the quantitative distribution of grain misorientations is
shown in Figure 4.22. The low angle boundaries less than 10° in misorientation are
initially very low in frequency, but increase to over 60% of the total number of detected
boundaries between strains of 0.4 and 0.6. After the ~0.4 critical strain for the onset of
recrystallization is reached, the rate of increase in subboundary formation drops off.
Finally at a strain of 0.6, the frequency of low angle boundaries decreases with strain as
recrystallization annihilates dislocations. The opposite behavior is observed at high
misorientation angles. Initially, the microstructure consists of essentially 100% high
angle grain boundaries (>15°). The fraction of high angle boundaries drastically drops
with strain until a strain of 0.4. This is not to be confused with the false conclusion that
the number of high angle grain boundaries is decreasing. The rapid formation of low
angle boundaries decreases the number fraction of high angle boundaries as the
microstructure is dominated by substructure. As strain is increased past 0.4, the
frequency of high angle grain boundaries increases again with the nucleation of
recrystallization.
The formation of low-energy CSL boundaries with strain may be seen in the
misorientation distribution functions (MDFs) shown in Appendix C for INCOLOY® 945
deformed at 1050 °C and 0.001 s-1. Initially, strong recrystallization CSLs reported in
Table 4.5 are observed since the starting material is fully recrystallized. As the material

94
(a) non-deformed (b) 0.2 strain
(c) 0.4 strain (d) 0.6 strain
(e) 0.8 strain (f) 1.0 strain
Figure 4.21 Grain misorientation maps of INCOLOY® 945 specimens compressed at 1050 °C and 0.001 s-1 to strains of (a) 0, or the non-deformed material, (b) 0.2, (c) 0.4, (d) 0.6, (e) 0.8, and (f) 1.0. Refer to the electronic document for color imaging. Grain misorientations are indicated by red (2-5°), green (5-15°), blue (>15°), and purple (60°±5° [111] twin).

95
is subjected to deformation, the frequency of CSLs diminishes until 0.6 compressive
strain. With deformation beyond 0.6 strain, the CSLs reappear as the structure becomes
dominated by DRX grain boundaries.
1050 oC, 0.001 s‐1
0
0.1
0.2
0.3
0.4
0.5
0.6
0.7
7 13 19 26 32 38 45 51 57 63Misorientation Angle (Degrees)
Number Fraction
0.0 Strain 0.2 Strain 0.4 Strain0.6 Strain 0.8 Strain 1.0 Strain
Figure 4.22 Histogram showing the change in distribution of grain misorientations with increasing compressive strain for INCOLOY® 945 deformed at 1050 °C and 0.001 s-1.
The following section presents evidence for possible recrystallization mechanisms
occurring in INCOLOY® 945. In addition, transmission electron microscopy data is
presented to show the conditions where recrystallization occurs dynamically or statically.
4.2.4 Mechanisms and Modes for Recrystallization
Inconsistencies in the literature on the mechanisms of recrystallization (e.g. BLG
versus SGR) were discussed in Chapter 2. In addition, disagreements on the modes of
recrystallization (DRX versus SRX) were discussed, showing the need to properly
characterize the recrystallization behavior in INCOLOY® 945and possibly apply the
knowledge to similar alloys like alloy 718 or stainless steels.

96
Two deformation conditions were investigated using transmission electron
microscopy (TEM) to confirm the presence of dynamic and static recrystallization: 1.0
compressive strain at 1150 °C and 0.001 s-1, representing the most likely condition for
DRX, and 1.0 compressive strain at 1150 °C and 1.0 s-1, representing the most likely
condition for SRX. In addition, the initial non-deformed structure was investigated for
comparison. TEM images summarizing the results are shown in Figure 4.23.
(a) non-deformed (b) 1.0 strain, 0.001 s-1
(c) 1.0 strain, 1.0 s-1 (d) 1.0 strain, 1.0 s-1
Figure 4.23 TEM images showing (a) SRX structure in non-deformed material, (b) microstructure after compression to 1.0 strain at 1150 °C and 0.001 s-1 resulting in DRX, and (c and d) microstructure after compression to 1.0 strain at 1150 °C and 1.0 s-1 resulting in a mix of DRX (c) and SRX (d).

97
The initial microstructure, shown in Figure 4.23a, is fully statically recrystallized
and clearly has a low dislocation density. On the other hand, the specimen compressed at
a slow strain rate of 0.001 s-1 exhibits fully dynamic recrystallization, shown in Figure
4.23b, further supporting conclusions made in the sections on Flow Behavior and
Microstructural Analysis. Figure 4.23b shows a high angle boundary separating two
recrystallized grains, each with a high dislocation density, representative of the entire
microstructure. The high dislocation density within the recrystallized grains indicates
that further deformation was imposed on the grains after nucleation. Figure 4.23c and d
show representative TEM images of the specimen compressed at 1.0 s-1. Several bending
contours are observed, especially in the TEM images shown in Figure 4.23c and d. Upon
TEM foil preparation, the specimens had a tendency to curl upon thinning due to high
residual stresses, so bending contours were unavoidable. The high residual stresses are
likely due to quenching after deformation, which force the center of the specimens into
tension. At the high strain rate, some recrystallized grains appear fully dynamic while
others appear fully static. Figure 4.23c shows a recrystallized grain containing several
dislocations throughout, indicative of DRX. In contrast, Figure 4.23d shows a static
recrystallization front, where the recrystallized grain (bottom left) is free of dislocations.
No evidence of metadynamic recrystallization is observed, which would show up
as recrystallized grains with dislocations in a portion of the grain nucleated dynamically
followed by a dislocation free region where static growth occurred. Grain growth via
grain boundary migration is driven by differences in dislocation density. The lack of
MDRX suggests that the dislocation density gradients across grain boundaries upon the
cessation of deformation were small and the number of nucleation sites were high, such
that nucleation of new grains occurred in preference to MDRX. The low gradient in
dislocation density across grain boundaries in Figure 4.23 may also suggest that the strain
at high deformation temperatures was relatively uniform, unlike the observed
inhomogeneous behavior at low deformation temperatures and high strain rates.
ECCI images shown in Figure 4.24 support the observations made using TEM.
Figure 4.24a shows a recrystallized grain formed at 1150 °C and 0.001 s-1 after an applied
strain of 1.0. The changes in contrast within the recrystallized grain clearly show the
beginning formation of subgrains, which may only form if the recrystallized grain

98
nucleated and grew dynamically. In contrast, Figure 4.24b (an ECCI image of a
specimen deformed to a strain of 1.0 at 1150 °C and 1.0 s-1) shows nucleation of several
recrystallized grains around a non-recrystallized grain boundary. While some of the
recrystallized grains pictured show possible changes in contrast indicating possible
substructure, other recrystallized grains appear very clean of any kind of subboundary
formation and may be statically recrystallized.
(a) 0.001 s-1 (b) 1.0 s-1
Figure 4.24 ECCI images of INCOLOY® 945 showing (a) substructure formation within a recrystallized grain indicating DRX after compression to 1.0 strain at 1150 °C and 0.001 s-1 and (b) substructure-free recrystallized grains indicating at least some SRX after compression to 1.0 strain at 1150 °C and 1.0 s-1.
The observation of DRX at slow strain rates and SRX at high strain rates is
consistent with nickel self-diffusion kinetics. Compression to a strain of 1.0 at 0.001 s-1
requires 1000 seconds (~16 minutes) of deformation, while the same compression at
1.0 s-1 only requires one second of deformation. Assuming all of the specimens were
quenched in two seconds following deformation (allowing two seconds for the onset of
SRX), the ratio of times allowed for DRX to times allowed for SRX ranged from 500
tDRX/tSRX for 0.001 s-1 to only 0.5 tDRX/tSRX for 1.0 s-1.
The mechanisms driving dynamic recrystallization are primarily grain and twin
boundary bulging in all temperature regimes examined, with occasional nucleation via

99
subgrain rotation, especially in low Z parameter conditions (high deformation
temperatures and low strain rates). Such conclusions can primarily be made by
examination of microstructures via LOM. High magnification light optical images,
shown in Figure 4.25, provide evidence of boundary bulging and serrated grain
boundaries in samples compressed at high deformation temperatures where higher
recrystallized volume fractions are present.
0.001 s-1 1.0 s-1
1050 °C
(a) (b)
1150 °C
(c) (d)
Figure 4.25 Light optical images of INCOLOY® 945 after hot compression to 1.0 strain at (a and b) 1050 °C and (c and d) 1150 °C at strain rates of (a and c) 0.001 s-1 and (b and d) 1.0 s-1 showing serrated grain boundaries (dotted arrows), bulging of non-recrystallized grains (solid arrows), and necklace structures suggesting BLG as the dominant recrystallization mechanism.
The optical images of specimens compressed at 1150 °C in Figure 4.25c and d
show clear bulging of boundaries, likely leading to the nucleation of additional
recrystallized grains. Figure 4.25c shows a 100% recrystallized region, which is not
representative of the entire material since the specimen compressed at a strain rate of

100
0.001 s-1 is only 94% recrystallized. The optical images pictured for deformation at
1050 °C show serrated grain boundaries and the formation of a necklace structure. A
necklace structure is indicative of a bulging mechanism, rather than subgrain rotation,
which would occur intragranularly. Similar behavior is observed at 950 °C, although it is
less clear due to the limited amount of recrystallization. The boundary bulging
mechanism is consistent with research presented in Chapter 2 on the recrystallization of
low stacking fault energy materials with a large initial grain size. In addition, Dudova
proposed that grain boundary bulging was the dominant mechanism for recrystallization
at deformation temperatures above 0.5 T/Tm for a similar alloy, Ni-20%Cr [17].
Dudova’s work is presented in more detail in Section 2.3.1.
In addition to the light optical and TEM images suggesting grain/twin boundary
bulging, Figure 4.20 shows that a stable recrystallized grain size was achieved with
increasing strain. The development of a stable recrystallized grain size as strain
progresses further suggests a growth-controlled bulging mechanism. As bulging occurs,
the bulged region continues to work harden, decreasing the driving force for grain
growth. In contrast, recrystallized grains nucleated via subgrain rotation continue to
grow until the recrystallized grains impinge on each other.
While grain boundary bulging is certainly the dominant mechanism for dynamic
recrystallization of INCOLOY® 945 at homologous temperatures ranging 0.79-
0.92 T/Tm, occasional subgrain rotation leading to recrystallization was observed,
especially at high deformation temperatures and low strain rates. The most distinctive
characteristic of SGR is intragranular nucleation. The light optical images shown in
Figure 4.10 and Figure 4.25 show occasional recrystallized grains nucleating in the center
of deformed grains, indicating the presence of SGR.
In addition, subgrain formation is observed at slow strain rates and presented
earlier in ECCI images (Figure 4.12), showing that SGR is possible. The development of
subgrains is also shown via TEM in Figure 4.26 for deformation at 0.001 s-1 and 1.0 s-1 at
a temperature of 1150 °C. The subgrains are several microns in diameter, so selected
area diffraction (SAD) can be employed to measure grain misorientations. Figure 4.27
shows two TEM images where SAD was used to measure grain and subgrain
misorientations. SAD was performed on each grain in the location indicated by the

101
numbers within each region. The Kikuchi centers corresponding to the SAD patterns
were very close together between different subgrains, indicating a very low subgrain
misorientation (oftentimes less than 1°). In Figure 4.27a, the subgrains contain low
misorientation angles with an approximate <013> zone axis parallel to the transmitted
beam (or normal to the compression axis). In contrast, the grain labeled ‘4’ had a
drastically different orientation of <114> normal to the compression axis with a 14.31°
misorientation from the adjacent grain. The TEM montage in Figure 4.27b shows
primarily low angle grain boundaries with a few larger grain misorientations. The
presence of small subgrain misorientations, especially those less than 1°, further confirms
why boundaries were oftentimes not detected using EBSD, which only detects boundaries
greater than 2°. In addition, Figure 4.26 and Figure 4.27 show both individual
dislocations as well as dislocation nets in specimens deformed with a slow deformation
strain rate, which may further indicate dynamic recovery.
(a) 0.001 s-1 (b) 0.001 s-1 (c) 1.0 s-1
Figure 4.26 Dislocation tangles indicating the beginning of subgrain formation in INCOLOY® 945 specimens compressed to 1.0 strain at 1150 °C and strain rates of (a and b) 0.001 s-1 and (c) 1.0 s-1.
Static recrystallization mechanisms are in many ways similar to those stated for
dynamic recrystallization. Since statically recrystallized grains nucleated along prior
high angle grain boundaries, further promoting the necklace structure (Figure 4.24b),
SRX likely occurs via grain boundary migration (similar to the bulging mechanism),
rather than subgrain coalescence or rotations. Figure 4.23d shows evidence of a high

102
angle boundary migrating statically, leaving behind a clean dislocation-free recrystallized
structure.
(a) (b)
Figure 4.27 TEM bright field images of an INCOLOY® 945 specimen compressed to 1.0 strain at 1150 °C and 0.001 s-1 showing grain and subgrain misorientations calculated using selected area electron diffraction.
4.2.5 Comparison to Other Alloys
The microstructural development of INCOLOY® 945 after deformation is
consistent with behavior previously observed in nickel or low stacking fault energy alloys
undergoing dynamic recrystallization, as described in Section 2.3. As expected from the
flow behavior, the percent recrystallization increases with increasing strain, increasing
temperature, and decreasing strain rate.
TEM analysis shows that a transition from DRX to DRX+SRX is present with
increasing strain rates. There have been inconsistencies in distinguishing between DRX
and SRX in previous literature. Results for INCOLOY® 945 show that neither DRX nor
SRX can fully describe the recrystallization behavior in Ni-Cr-Fe alloys over the range of
deformation conditions examined in this study. No evidence of MDRX was observed in
INCOLOY® 945, contrary to work on alloy 718 by Medeiros [18,31]. The presence of
MDRX likely depends on the amount of imposed strain versus the critical strain for the
onset of dynamic recrystallization. If grains nucleate dynamically early in the
103
deformation process, the DRX grains are likely to contain a high dislocation density,
reducing the driving force for static growth after the cessation of deformation. However,
if grains nucleate later in deformation, then a sufficient gradient in dislocation density
may be present across grain boundaries to allow continued growth (MDRX) after
deformation has ended. TEM was only performed on INCOLOY® 945 specimens
compressed at 1150 °C where DRX probably occurred at very low strains. Further
analysis of specimens compressed to strains less than 1.0 or at lower temperatures where
critical strains for recrystallization are higher may show the presence of MDRX in line
with Medeiros’ work.
Dynamic recrystallization occurs primarily via a grain/twin bulging mechanism in
INCOLOY® 945 while static recrystallization occurs via grain boundary migration. This
behavior is consistent with results discussed in Section 2.3.1 on recrystallization in low
stacking fault energy materials with a high initial grain size. In addition, Dudova [17]
found the same recrystallization mechanisms for a similar Ni-20%Cr alloy at deformation
temperatures above 0.5 T/Tm. Twins within recrystallized grains are shown in all
deformation conditions of INCOLOY® 945 investigated, which is common in materials
with low stacking fault energy where dynamic recovery takes longer to occur. However,
at an exceptionally high temperature (1150 °C or 0.92 T/Tm) and low strain rate
(0.001 s-1) dynamic recovery occurs in competition with recrystallization and twinning.
Dynamic recovery may also be accommodated by an increase in stacking fault energy
with temperature.
4.3 Modeling of Flow and Microstructural Behavior
Several models for predicting the steady-state flow stress and recrystallized grain
sizes were presented in Chapter 2. The goal of this section is to assess the applicability of
these models to INCOLOY® 945, describe the model limitations, and discuss the
physical meaning behind them.
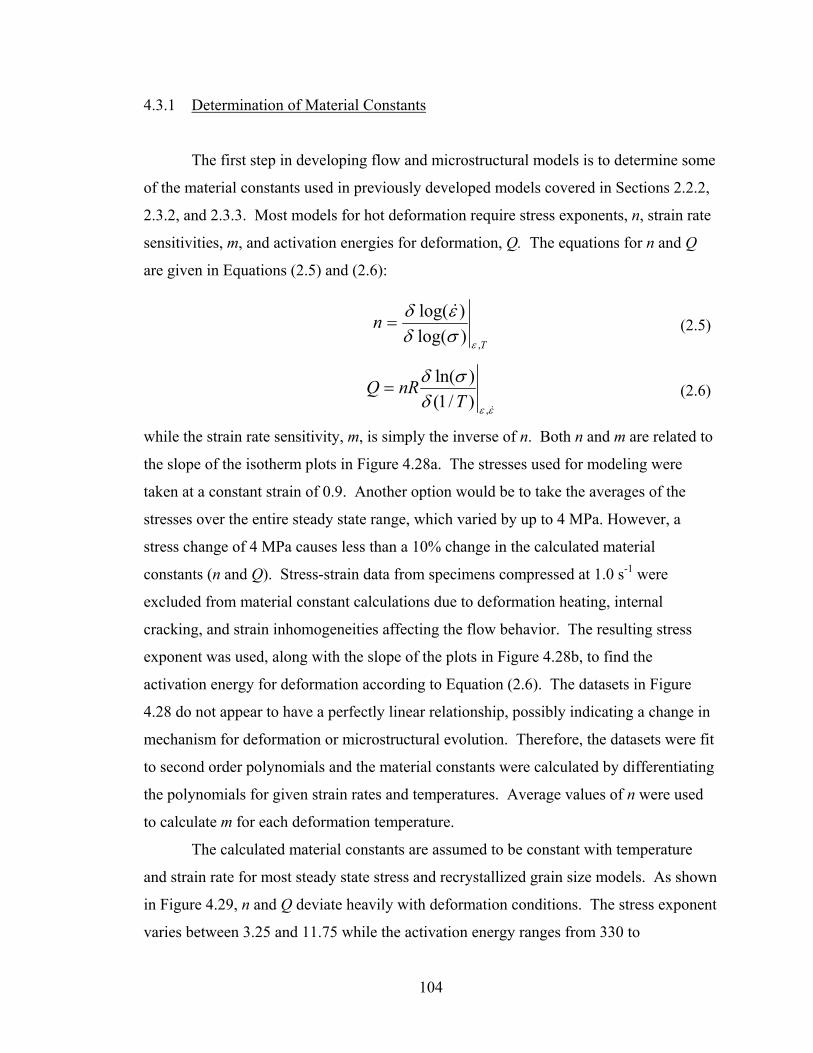
104
4.3.1 Determination of Material Constants
The first step in developing flow and microstructural models is to determine some
of the material constants used in previously developed models covered in Sections 2.2.2,
2.3.2, and 2.3.3. Most models for hot deformation require stress exponents, n, strain rate
sensitivities, m, and activation energies for deformation, Q. The equations for n and Q
are given in Equations (2.5) and (2.6):
T
n,)log(
)log(
εσδεδ &
= (2.5)
εεδ
σδ
&,)/1()ln(
TnRQ = (2.6)
while the strain rate sensitivity, m, is simply the inverse of n. Both n and m are related to
the slope of the isotherm plots in Figure 4.28a. The stresses used for modeling were
taken at a constant strain of 0.9. Another option would be to take the averages of the
stresses over the entire steady state range, which varied by up to 4 MPa. However, a
stress change of 4 MPa causes less than a 10% change in the calculated material
constants (n and Q). Stress-strain data from specimens compressed at 1.0 s-1 were
excluded from material constant calculations due to deformation heating, internal
cracking, and strain inhomogeneities affecting the flow behavior. The resulting stress
exponent was used, along with the slope of the plots in Figure 4.28b, to find the
activation energy for deformation according to Equation (2.6). The datasets in Figure
4.28 do not appear to have a perfectly linear relationship, possibly indicating a change in
mechanism for deformation or microstructural evolution. Therefore, the datasets were fit
to second order polynomials and the material constants were calculated by differentiating
the polynomials for given strain rates and temperatures. Average values of n were used
to calculate m for each deformation temperature.
The calculated material constants are assumed to be constant with temperature
and strain rate for most steady state stress and recrystallized grain size models. As shown
in Figure 4.29, n and Q deviate heavily with deformation conditions. The stress exponent
varies between 3.25 and 11.75 while the activation energy ranges from 330 to

105
850 kJ/mol. The strain rate sensitivity ranges between 0.13 and 0.22, shown in Figure
4.30. Several papers in the literature have set bounds on deformation conditions in which
n and Q remain relatively constant. However, these parameters are not constant over any
range of temperature or strain rate examined in this investigation. The material constants
determined over this temperature and strain rate range may incorporate several different
mechanisms that have not been individually accounted for. For example, n, m, and Q
may be influenced by the extent of recovery, recrystallization, creep, and solute pinning
of dislocations. The physical meaning of the “activation energy for deformation” is not
well understood, since Q may be affected by any sort of diffusional processes or
boundary movements. The activation energy for the self-diffusion of nickel (285 kJ/mol)
is well below the experimentally measured range in Figure 4.29b, indicating that other
mechanisms besides DRX occur during deformation. Since many processes may occur
during deformation over different temperature and strain rate regions, it is not
unreasonable that the material constants vary greatly.
1.51.61.71.81.92.02.12.22.32.42.5
‐3.5 ‐2.5 ‐1.5 ‐0.5Log(Strain Rate, s‐1)
Log(
σ, MPa)
950 °C1000 °C1050 °C1100 °C1150 °C
3.0
3.5
4.0
4.5
5.0
5.5
6.0
0.65 0.70 0.75 0.80 0.851000/T, K
Ln( σ, MPa)
0.1 1/s0.01 1/s0.001 1/s
(a) (b)
Figure 4.28 Plots showing the (a) log relationship between flow stress and strain rate and (b) relationship between natural log flow stress and inverse temperature for INCOLOY® 945, used in determining stress exponents, n, and activation energies for deformation, Q, respectively.
In addition, the increase in strain rate sensitivity with temperature suggests that
the deformation temperature may have not been high enough to ignore dislocation
mobility effects, even at a homologous temperature of 0.79 T/Tm. The strain rate

106
2
4
6
8
10
12
900 1000 1100 1200Temperature (oC)
Stress Exponent, n
0.001 1/s0.01 1/s0.1 1/s
300
400
500
600
700
800
900
900 1000 1100 1200Temperature (oC)
Activation Energy, Q (kJ/mol)
0.001 1/s0.01 1/s0.1 1/s
(a) (b)
Figure 4.29 Plots showing the variations of calculated (a) stress exponents and (b) activation energies for INCOLOY® 945.
sensitivities are plotted as a function of deformation conditions in Figure 4.30a. A
schematic of strain rate sensitivity over a wide range of temperatures is shown in Figure
4.30b, divided into three regions. Strain rate sensitivity remains relatively constant at low
temperatures (Region I), because dislocation mobility is low, and there is insufficient
thermal energy to aid dislocation movement around barriers no matter how low the strain
rate is. In Region II, the deformation temperature is high enough to contribute to
dislocations overcoming obstacles, provided a sufficiently low strain rate is applied
where there is a higher probability of thermally-aided deformation. In this stage, the
strain rate sensitivity increases dramatically with temperature as dislocations become
more mobile. Lastly, in Region III, the strain rate sensitivity plateaus again because
increasing temperature in this range does not provide significant increases in thermally
aided deformation processes. The experimentally measured strain rate sensitivity in
Figure 4.30a clearly increases with temperature, indicating that a plateau in strain rate
sensitivity has not been reached and that m cannot be assumed constant.
Since the activation energy for deformation varies drastically with strain rate and
temperature, the change in Q was investigated using recrystallized grain size for
comparison. By manipulating the proposed model in Equation (2.8):
⎟⎠⎞
⎜⎝⎛ −
== −−
RTcQAAZd cc
DRX expε& (2.8)

107
the slope of a natural log grain size versus inverse temperature plot (-cQ/R), shown in
Figure 4.31, may be related to the activation energy. The exact activation energies
cannot be calculated from Figure 4.31, since the slopes also depend on an empirical
fitting parameter, c. However, a qualitative understanding of the changes in Q across the
experimental testing conditions may be obtained. From Figure 4.31, the activation
energy appears to be higher at higher temperatures and strain rates, possibly indicating a
change in the mechanisms of microstructural evolution.
0.10
0.12
0.14
0.16
0.18
0.20
0.22
900 1000 1100 1200Temperature (oC)
Strain Rate Sensitivity, m
Temperature (oC)
Strain Rate Sensitivity, m
I II III
(a) (b)
Figure 4.30 Plot (a) shows the calculated strain rate sensitivities for the experimental deformation conditions for INCOLOY® 945. A schematic of strain rate sensitivity across a wide range of temperatures is shown in part (b).
Although the calculated stress exponents, strain rate sensitivities, and activation
energies for deformation have little physical meaning, they may be calculated for specific
deformation conditions and used in developing semi-empirical flow stress and
recrystallization models to predict experimental behavior.
4.3.2 Steady-State Flow Stress Model
Since the material constants calculated in the previous section vary with
deformation conditions, models were developed using a regression analysis to determine
material constants and compared to the experimentally determined values. A steady state

108
model used recurrently in literature for a wide range of alloys is given in Equations (2.1)
and (2.2):
( )[ ]nARTQZ ασε sinhexp =⎟
⎠⎞
⎜⎝⎛= & (2.1) and (2.2)
By manipulating this equation and determining material constants via regression analysis,
the steady state stress can be found as a function of deformation conditions:
⎟⎟⎠
⎞⎜⎜⎝
⎛⎟⎠⎞
⎜⎝⎛×=×= −−−−
nRTQZ nn exp1074.4sinh224)1074.4(sinh224 /141/141 εσ & (4.9)
where σ is the steady state stress given in MPa, T is the absolute temperature in K, ε& is
the strain rate in s-1, n was determined to be 5.87, and Q is 506 kJ/mol. Although n and Q
were found using a regression analysis, they fall within the experimentally determined
bounds shown in Figure 4.29. The model predictions, overlaid on the experimental data,
are shown in Figure 4.32a. The model is able to predict the steady state flow stress
within 15% accuracy for the majority of the deformation conditions. The accuracy drops
off at a strain rate of 0.001 s-1 as temperature is increased.
0.5
1.0
1.5
2.0
2.5
3.0
3.5
4.0
0.68 0.73 0.78 0.83
1000/(T, K)
ln(d, μm)
0.001 1/s0.01 1/s0.1 1/s1.0 1/s
(‐c/R)Q0.001 1/s = ‐18,800 K‐1
(‐c/R)Q0.01 1/s = ‐17,400 K‐1
(‐c/R)Q0.1 1/s = ‐18,600 K‐1
(‐c/R)Q1.0 1/s = ‐16,800 K‐1
(‐c/R)Q
Figure 4.31 The relationship between grain size and temperature for INCOLOY® 945; the slopes (-cQ/R) are related to activation energy for deformation.

109
3.5
4.0
4.5
5.0
5.5
6.0
35 40 45 50Ln(Z , s‐1)
Ln( σ, MPa)
Non‐TemperatureCorrectedExperimentalModel
σ = 224 sinh‐1(4.74x10‐4 Z 1/n)n = 5.87Q = 506 kJ/mol
3.0
3.5
4.0
4.5
5.0
5.5
6.0
25 30 35 40Ln(Z , s‐1)
Ln( σ, M
Pa)
Temperature CorrectedExperimentalNon‐TemperatureCorrected ExperimentalModel
σ = 161 sinh‐1(2.37x10‐4 Z 1/n)n = 3.90Q = 400 kJ/mol
(a) (b)
Figure 4.32 Comparison of experimental data and mathematical models for flow stress of INCOLOY® 945 showing (a) model that does not account for deformation heating and (b) model taking into account deformation heating through temperature correction.
After deformation heating was measured with embedded thermocouples, the
model was modified to account for deformation heating. At low deformation
temperatures and high strain rates, strain softening is observed instead of a steady state
flow behavior. The steady state stress was therefore taken to be the measured stress at a
strain of 0.9. Correspondingly, the temperature was taken to be the temperature
measured at a strain of 0.9. This assumes that the strain softening is strictly due to
deformation heating, even though there is evidence of internal cracking and
inhomogeneous strain. With the temperature corrections, the model becomes:
⎟⎟⎠
⎞⎜⎜⎝
⎛⎟⎠⎞
⎜⎝⎛×=×= −−−−
nRTQZ nn exp1037.2sinh161)1037.2(sinh161 /141/141 εσ & (4.10)
where n is 3.90 and Q is 400 kJ/mol. Even though the constants change drastically from
the model in Equation (4.9), n and Q were determined using a regression analysis and
still fall within the experimentally determined range. Predictions using Equation (4.10)
are shown in Figure 4.32b and compared to experimental data. The corrected model is
able to predict the steady state flow stress within 7% accuracy for the entire deformation
temperature and strain rate range investigated. Even though n and Q vary dramatically

110
with deformation conditions, a model with reasonable correlation to the experimental
data may be generated when n and Q are held constant, indicating the empirical nature of
the model. While physically-based models are preferable, empirical equations have their
purpose and have clearly shown success in predicting flow behavior of single-phase
alloys in a large range of deformation conditions.
4.3.3 Recrystallized Grain Size Model
A regression analysis was also used on the INCOLOY® 945 data to determine
constants for the recrystallized grain size model provided in Equation (2.8):
⎟⎠⎞
⎜⎝⎛ −
== −−
RTcQAAZd cc expε& (2.8)
where d is measured in microns. This model assumes a linear relationship between the
natural log of DRX grain size and the natural log of the Zener-Holloman parameter. The
experimental data shown in Figure 4.33 shows there is a different linear relationship
between ln(d) and ln(Z) for different strain rates, likely due to deformation heating and
the transition from DRX to SRX dominated microstructures at high strain rates. The
open data points in Figure 4.33 show temperature-corrected data, where the maximum
measured testing temperature was assumed to be the test temperature. This assumption is
an extreme case, since the temperature increases with strain. In other words, the grain
size evolved as the temperature increased during deformation, so the actual Zener-
Holloman value is somewhere between the temperature-corrected and non-temperature-
corrected data. To adapt Equation (2.8) to recrystallized grain size in general (rather than
strictly DRX), the material constant c was fit by regression analysis to each strain rate
dataset (Table 4.6). The value of A was determined to be 2·106 by regression analysis for
all test conditions, and the activation energy was assumed to be 400 kJ/mol, which was
determined in the temperature-corrected flow stress model.
Based on Table 4.6, the material constant c has the following relationship with
strain rate:
351.0log016.0 +−= ε&c (4.11)

111
The recrystallized grain size models are compared to the experimental data for
different strain rates in Figure 4.33. The empirical models fit experimental data with
reasonable correlation, like those that predict steady state flow stress.
Table 4.6 Values of strain-rate dependent material constant, c, used in recrystallized grain size modeling
Target Strain Rate (s-1) Average Measured Strain Rate (s-1) c 0.001 0.00100 ± 2·10-5 0.40 0.01 0.0097 ± 2·10-4 0.39 0.1 0.096 ± 2·10-3 0.37 1.0 0.94 ± 2·10-2 0.35
0.0
1.0
2.0
3.0
4.0
25 30 35 40ln(Z)
ln(d, μm)
0.001/s0.01/s0.1/s1.0/sTemperature‐corrected 0.1/sTemperature‐corrected 1.0/sModels
Figure 4.33 Natural log relationship between recrystallized grain size, d, and the Zener-Holloman parameter, Z, after hot uniaxial compression of INCOLOY® 945 to a strain of 1.0 at the experimental deformation conditions. Experimental data is compared to a semi-empirical model.
4.3.4 Comparison to Other Alloys
Previously developed models for steady state flow stress and recrystallized grain
size were adapted for INCOLOY® 945. Although these models have been used
successfully for predicting experimental data for a wide range of materials in the past, a
description of the model limitations is lacking in literature. The material constants used
in the models drastically vary with temperature and strain rate in INCOLOY® 945, and
likely similar materials such as alloy 718. Since the models assume constant values of
these variables, the physical meaning of the models is limited. However, the
112
experimental stresses and recrystallized grain sizes may still be predicted accurately even
though the models are not physically based. Further investigation is needed to assess
whether the model constants may be related to physical behavior. For example, the
change in the activation energy of deformation with temperature may signify a change in
deformation mechanisms or microstructural evolution during deformation.
4.4 Texture Development
Texture plays a key role in the final structure and properties of a material after
forging processes. The purpose of the following section is to discuss the texture
evolution in INCOLOY® 945 after compression at several deformation conditions and to
compare the results and assess the applicability to other alloys.
4.4.1 Texture Development in INCOLOY® 945
Electron backscatter diffraction (EBSD) was used to investigate the effects of
deformation conditions on the development of compression and recrystallization textures
in INCOLOY® 945 in comparison to other fcc alloys. Since deformation was
axisymmetric, texture could be fully characterized using inverse pole figures and inverse
pole figure maps. Figure 4.34 shows a key for the textures shown in the proceeding
figures.
Figure 4.35 shows inverse pole figure maps, correlated to the key provided in
Figure 4.34a, for the poles oriented parallel to the compression axis after compression to
1.0 strain for some of the experimental deformation conditions. The non-recrystallized
grains show a strong preference for their {110} poles to orient parallel to the compression
axis, which is the stable compression texture for fcc materials. The maps appear to show
a relatively random distribution of textures within recrystallized grains. One observation
absent in literature is the apparent transition to a {212} texture along non-recrystallized
grain boundaries possibly due to the local constraint of bulging grains pinned by subgrain
boundaries.

113
(a) (b)
Figure 4.34 Keys used for (a) coloring of the pole figure maps shown in Figure 4.35 and Figure 4.37 and (b) determining the pole densities shown in the inverse pole figures of Figure 4.36, Figure 4.38, and Figure 4.40. Refer to the electronic copy for color interpretation.
950 °C 1050 °C 1150 °C
0.001 s-1
(a) (b) (c)
1.0 s-1
(d) (e) (f)
Figure 4.35 Inverse pole figure maps showing the distribution of crystallographic poles oriented parallel to the compression axis for INCOLOY® 945 compressed to 1.0 strain at (a and d) 950 °C, (b and e) 1050 °C, (c and f) 1150 °C at strain rates of (a-c) 0.001 s-1 and (d-f) 1.0 s-1. Refer to the electronic copy for the color version.
The inverse pole figures corresponding to the inverse pole figure maps in Figure
4.35 are shown in Figure 4.36. For each deformation condition, two inverse pole figures
are shown: the texture of the overall microstructure and the texture of only the

114
recrystallized grains in the structure. The shades correspond to quantitative pole
densities, according to the key in Figure 4.34b. The pole density is a factor that describes
the concentration of a texture as a multiple of a completely random distribution (i.e. a
pole density of 1 would be perfectly random). Figure 4.36 also shows the maximum
measured pole densities (PMAX) for each inverse pole figure.
N.A. (< 2% Rx)
PMAX = 3.31 Overall
PMAX = 1.73 Recrystallized
PMAX = 7.33 Overall
PMAX N.A. Recrystallized
(a) 950 °C, 0.001 s-1 (b) 950 °C, 1.0 s-1
PMAX = 5.09
Overall PMAX = 1.45 Recrystallized
PMAX = 8.38 Overall
PMAX = 1.51 Recrystallized
(c) 1050 °C, 0.001 s-1 (d) 1050 °C, 1.0 s-1
N.A. (>94% Rx)
PMAX N.A.
Overall PMAX = 3.74 Recrystallized
PMAX = 2.74 Overall
PMAX = 1.32 Recrystallized
(e) 1150 °C, 0.001 s-1 (f) 1150 °C, 1.0 s-1
Figure 4.36 Inverse pole figures showing the distribution of crystallographic poles oriented parallel to the compression axis for INCOLOY® 945 compressed to 1.0 strain at (a and b) 950 °C, (c and d) 1050 °C, (e and f) 1150 °C at strain rates of (a, c, and e) 0.001 s-1 and (b, d, and f) 1.0 s-1. Textures of the overall microstructure and recrystallized regions are shown.
In general, the pole figures of the overall microstructures shown in Figure 4.36
tend to have a <110> fiber texture, which is likely dominated by the large non-

115
recrystallized grains, as shown in Figure 4.35. For deformation temperatures of 950-
1050 °C, the maximum pole density tends to be higher in the higher strain rate
specimens. At lower strain rates, there is more time for recrystallization and possibly
recovery to occur, annihilating dislocations and retained work in the structure, hence
decreasing the compression texture component. In most deformation conditions, the
texture of the recrystallized structure was almost random (PMAX < 2). The lack of
<111> fiber in the recrystallization texture is likely due to the randomly oriented DRX
grains rotating towards the compression texture with subsequent deformation.
Some literature has proposed that the randomness in recrystallized textures of low
stacking fault energy materials is due to twinning, which may hinder recrystallized
texture development [15]. However, a <100> fiber texture with a PMAX of 3.74
develops at the highest deformation temperature and lowest strain rate (1150 °C and
0.001 s-1, respectively). The overall and recrystallized textures appear the same, since the
structure is approximately 94% recrystallized. Even though the recrystallized <100>
fiber texture after hot compression is not fully understood, similar behavior has been
observed for other fcc metals [73-75]. Tsuji et al. suggested that grains with their {100}
poles oriented parallel to the compression axis are more difficult to recrystallize, so the
<100> fiber texture is due to remaining deformed grains that have not yet recrystallized
[74]. However, the microstructure containing this texture in INCOLOY® 945 is 94%
recrystallized; the non-recrystallized grains therefore have marginal contribution to the
observed texture. Tsuji [74] and Frommert et al. [73] also suggested that grains with a
<100> fiber orientation are metastable due to the high symmetry and have a slow rate of
lattice rotation. It is unlikely, however, that the <100> fiber texture may be fully
accounted for by the sluggish change in orientation. Lastly, Tsuji and Frommert
proposed that oriented grain growth may occur after recrystallization, leading to the
observed texture [73,74].
The development of recrystallization textures has been described by two
fundamental theories: oriented nucleation and oriented growth [76-80]. The oriented
grain nucleation (OGN) theory suggests that recrystallized grains have a tendency to
nucleate with preferred orientation relationships with the deformed matrix [76-78,80].
The oriented grain growth (OGG) theory suggests that grain growth occurs preferentially

116
via the movement of high mobility, high energy boundaries [76-79]. Since the
recrystallization texture in INCOLOY® 945 only develops at the highest deformation
temperature and lowest strain rate, the texture may be explained by OGG or OGN+OGG,
but not OGN alone. In further support of OGG, the recrystallized grains oriented within
25° of the <100> fiber orientation are generally larger than those with a different
orientation. The fraction of CSL boundaries also increases with recrystallization
(discussed in Sections 4.2.1 and 4.2.2). CSL boundaries have relatively low energy and
mobility. Therefore, when a significant fraction of these boundaries are present during
dynamic recrystallization and growth, there is a strong possibility for texture to develop
through the growth of grains with higher energy boundaries.
The evolution of texture with strain may be observed more clearly in Figure 4.37
and Figure 4.38, which show inverse pole figure maps and inverse pole figures at several
strain increments for the specimen compressed at 1050 °C and a strain rate of 0.001 s-1.
Figure 4.37 shows a relatively random texture in the statically recrystallized starting
microstructure. At low strains, gradual changes in misorientation across deformed grains
are observed (rather than distinct boundary changes) that are evidence of strain gradients
in the crystals. At a strain of 0.4, recrystallized grains begin to form, consistent with
LOM and quantitative grain misorientation data. Finally, at a strain of 1.0, the deformed
non-recrystallized grains show the same preference for the stable <110> fiber texture
observed in Figure 4.35, and the recrystallized grains are randomly oriented with twins.
The pole figures are shown in Figure 4.38. The evolution of overall texture shows
a close correlation to the evolution of compression textures given by Hosford [40] and
discussed in Section 2.4.1. The initial texture is likely random, although the PMAX is
2.89 in Figure 4.38a because the scanned area is dominated by a small number of large
grains. As strain progresses, the compression axis rotates toward the ]111[ until it
reaches the [100]-[101] boundary. Once the compression axis reaches this boundary,
duplex slip occurs along (111) and )111( slip planes until the texture rotates to the stable
<101> fiber. The recrystallized texture appears very weak until a strain of 0.8. At a
strain of 0.8, the recrystallization texture seems to evolve the same way as the deformed
texture, likely due to imposed strain after recrystallization. At a strain of 1.0, the

117
recrystallized texture is more random again, likely due to the increased rate of
recrystallization, shown in Figure 4.20, which dilutes the deformation texture.
(a) non-deformed (b) 0.2 strain (c) 0.4 strain
(d) 0.6 strain (e) 0.8 strain (f) 1.0 strain
Figure 4.37 Inverse pole figure maps showing the distribution of crystallographic poles oriented parallel to the compression axis for INCOLOY® 945 compressed at 1050 °C and 0.001 s-1 to strains of (a) 0.0 or non-deformed material, (b) 0.2, (c) 0.4, (d) 0.6, (e) 0.8, and (f) 1.0. Refer to the electronic copy for the color version.
The maximum pole density plotted in Figure 4.39 shows the evolution of texture
strength in the overall microstructure as deformation progresses. The initial
microstructure has a maximum pole density dominated by large strain-free grains, which
remains almost constant until a strain of 0.2, where a slight drop in the maximum pole
density is observed. The drop in texture strength at a strain between 0.2 and 0.4 is likely
due to the rotation gradients that develop in non-recrystallized grains with deformation.
After the onset of recrystallization and as non-recrystallized grains rotate towards their
stable texture, continued deformation increases the texture strength until a pole density
above 5.09 is observed at 1.0 strain.

118
N.A.*
N.A.*
PMAX = 2.89 Overall Recrystallized PMAX = 2.81
Overall
Recrystallized (a) non-deformed (b) 0.2 strain
N.A.*
PMAX = 2.38
Overall
Recrystallized PMAX = 2.67
Overall PMAX = 1.92 Recrystallized
(c) 0.4 strain (d) 0.6 strain
PMAX = 4.18
Overall PMAX = 3.05 Recrystallized
PMAX = 5.09 Overall
PMAX = 1.45 Recrystallized
(e) 0.8 strain (f) 1.0 strain
Figure 4.38 Inverse pole figures showing the distribution of crystallographic poles oriented parallel to the compression axis for INCOLOY® 945 compressed at 1050 °C and 0.001 s-1 to strains of (a) 0.0 or non-deformed material, (b) 0.2, (c) 0.4, (d) 0.6, (e) 0.8, and (f) 1.0. Textures of the overall microstructure as well as textures of the recrystallized regions are shown.
*Recrystallized textures not reported due to the limited amount of recrystallization.
All of the texture analysis was performed in the center of longitudinal cross
sections of the compression specimens. If any geometrical strain gradients are present in
the material from barreling during hot compression, a different texture may be observed
near the radial edge of the samples. In addition, performing a scan on a specimen

119
sectioned laterally may provide a more accurate measurement, since more non-
recrystallized grains may be captured. To confirm the reliability of the texture analysis,
three EBSD scans were performed on the specimen compressed to 1.0 strain at 1050 °C
and 0.001 s-1: one in the radial center of a longitudinal cross section (Figure 4.40a),
another on the radial edge of a longitudinal cross section (Figure 4.40b), and a third in the
center of a lateral cross section (Figure 4.40c). Results from the three scans are shown in
the form of inverse pole figures in Figure 4.40. All of the textures are reasonably similar
with minimal geometrical inconsistencies, confirming the reliability of the scans
performed on the longitudinal cross sections.
0
1
2
3
4
5
6
0 0.2 0.4 0.6 0.8 1
True Strain
PMAX
Figure 4.39 Evolution of texture in INCOLOY® 945 compressed at 1050 °C and 0.001 s-1 shown by the change in maximum pole density, PMAX, with strain.
4.4.2 Comparison to Other Alloys
The compression textures observed in INCOLOY® 945 are very similar to those
observed in other fcc materials like copper, nickel, brass, and aluminum, discussed in
Section 2.4 (regardless of stacking fault energy). The strength of the textures is
dependent on temperature, strain rate, and strain, so exact quantitative comparisons of
pole densities cannot be made since the conditions varied from studies in the literature.
The texture is also consistent with the predictions made using the Taylor and Self-
Consistent models in Figure 2.19. However, maximum pole densities cannot be
compared because the models shown in Figure 2.19 do not specify the assumed

120
compressive strain. In general, the texture first rotates such that the compression axis
moves toward the ]111[ pole until reaching the [100]-[110] border, then duplex slip
along (111) and )111( causes a net rotation towards the stable {110} texture in all
deformation conditions except the highest temperature and lowest strain rate.
PMAX = 5.10
PMAX = 6.01
PMAX = 6.19
(a) (b) (c)
Figure 4.40 Inverse pole figures of INCOLOY® 945 compressed to 1.0 strain at 1050 °C and 0.001 s-1 with textures taken from (a) the radial center of a longitudinal cross-section, (b) the radial edge of a longitudinal cross-section, and (c) the radial center of a lateral cross section.
The recrystallization textures appear to be random in most experimental
deformation conditions. Although fcc dynamic recrystallization textures have not been
discussed much in the literature, there is agreement in a few studies that only weak
textures usually form. In specimens where dynamic recrystallization occurs early in
deformation, the recrystallization texture may take on the typical deformation
compression texture, with the compression axis rotating towards the {110} plane normal.
In the high temperature, low strain rate specimen (1150 °C, 0.001 s-1) compressed
to 1.0 strain, a stronger recrystallization texture is observed in contrast to the random
recrystallized textures at other experimental deformation conditions. The compression
axis rotates toward the (100) plane normal. Although uncommon, similar observations
have been made in other fcc alloys [73-75]. This may be an indication of oriented grain
growth after recrystallization.

121
CHAPTER 5 : SUMMARY AND CONCLUSIONS
All of the primary goals discussed in Chapter 1 were addressed in this work. This
chapter briefly summarizes the main points of this research with respect to the project
objectives.
1. The flow behavior of INCOLOY® 945 was investigated using hot uniaxial
compression testing at strains of 0.2-1.0, deformation temperatures of 950-
1150 °C, and strain rates of 0.001-1.0 s-1. At high strain rates and low
deformation temperatures, high degrees of strain hardening are observed,
followed by a drastic transition to strain softening at a critical strain. Strain
hardening is likely due to a combination of dislocation multiplication and
inhomogeneous strain gradients. The subsequent softening may be attributed
to a combination of deformation heating, inhomogeneous strain gradients
leading to deformation or shear bands, and internal cracking. At low strain
rates and high deformation temperatures, secondary yield points are observed,
likely from substitutional static strain aging assisted by microstrain dynamic
strain aging. After a critical strain, a steady state stress is established
indicating a balance between work hardening and softening due to dynamic
recrystallization. The flow behavior of INCOLOY® 945 is similar to other
nickel-base alloys discussed in the literature.
2. In some cases, the yield stress and strain hardening rates were lower for higher
strain rates, contrary to typical material behavior. The backward trends are
attributed to dynamic strain aging, which was especially present at higher
temperatures and lower strain rates throughout deformation. At low
temperatures and high strain rates, dynamic strain aging did not have time to
occur, so a decrease in strain hardening is observed. Since homologous

122
temperatures above 0.72 T/Tm were used in this investigation, dynamic strain
aging may have occurred during microstrain deformation, leading to the
unexpected trend in yield stresses and possibly assisting static strain aging in
macroscopic yield drops.
3. Microstructural analysis showed that recrystallization occurs with increasing
test temperatures along initial grain boundaries and annealing twins.
Recrystallization was especially prevalent at low strain rates, which was later
confirmed to be due to dynamic recrystallization. Static recrystallization
becomes more prevalent at higher strain rates. The recrystallized grain size is
temperature and strain rate dependent, generally increasing with increasing
temperatures and decreasing strain rates. After deformation to 1.0
compressive strain, inhomogeneous strain gradients are present in high strain
rate specimens, while substructure develops in the form of subgrains in slow
strain rate specimens.
4. The evolution of microstructure was investigated by deformation at 1050 °C
and a strain rate of 0.001 s-1 at incremental strains. The fraction of
recrystallization increases as deformation progresses. However strain appears
to have no effect on the stable recrystallized grain size, which is typical of
behavior observed in nickel with a high initial grain size undergoing
recrystallization by the bulging mechanism. The critical strain for the onset of
recrystallization in this deformation condition was determined to be between
0.2 and 0.3. This was further supported through calculated grain
misorientations and texture analysis.
5. Semi-empirical models to predict steady state flow stress and recrystallized
grain size were adapted to INCOLOY® 945 to show flow and microstructural
relationships with the Zener-Holloman parameter. Although the models are
able to predict experimental data reasonably well, the equations have little
physical meaning. Material constants commonly used in such models,

123
including stress exponents, strain rate sensitivities, and activation energies for
deformation are assumed to be constant with testing conditions. However,
calculation of these parameters in INCOLOY® 945 showed that they were all
heavily dependent on temperature and strain rate, which is probably similar to
similar nickel-base alloys. The strong dependence of these so-called constants
on deformation conditions is often disregarded in literature and likely because
of the multiple diffusion processes and boundary movements occurring during
deformation.
6. Electron backscatter diffraction was used to understand texture development
during deformation of INCOLOY® 945. Consistent with compression of
other fcc materials, duplex slip along (111) and )111( planes occurs until a
stable <110> fiber compression texture is established. In general, the overall
texture tends to be stronger in specimens compressed at a higher strain rate
where less recrystallization occurs. Recrystallization textures are mostly
random, but shift towards the compression texture with further deformation.
An exception occurs with deformation at 1150 °C and 0.001 s-1 where the
microstructure is almost fully recrystallized. In this deformation condition, a
<100> fiber texture develops with recrystallization, likely indicating that
recrystallized grains with their {100} poles oriented parallel to the {110}
poles of the deformed matrix have high interfacial energy boundaries and
preference to grow.


125
CHAPTER 6 : FUTURE WORK
This work was performed as a starting point in understanding flow and
microstructural behavior in INCOLOY® 945 compared to similar alloys.
Now that a general understanding is established over a wide range of temperatures and
strain rates, more detailed studies may be performed to understand and confirm the
mechanisms of flow and recrystallization in specific conditions.
The hot compression work in this study primarily involved single-step uniaxial
deformation followed by an immediate quench to freeze in microstructure. In industrial
applications, forged rod undergoes small incremental reductions with several minute
holds at temperature between steps. A continuation of this project could involve the
implementation of high temperature hold times to better assess the effect of static
recrystallization between reduction steps. Prior to such work, a detailed study would
need to be performed on the onset and kinetics of static recrystallization after
compression as a function of strain, strain rate, and temperature.
A large initial grain size of 410 µm was used for this project. Since several
researchers have shown a dramatic effect of initial microstructure on the flow and
recrystallization behavior of materials, future work could follow a similar matrix to this
research with different starting microstructures. The goal of this work was to emulate
conventional forging processes. However, industrially sized ingots that undergo forging
usually contain a very large range in grain sizes (some grains being even larger than the
410 µm grains used here). Therefore, an investigation on the effect of initial
microstructure would be directly applicable to industrial processes. Such an investigation
may be performed simultaneously with an SRX study, which would change the grain size
distribution.
One of the observations made in this work was the presence of load drops from
static strain aging, which is not consistently observed for fcc materials deformed at such
high homologous temperatures. A project focused primarily on transmission electron
microscopy of materials containing ranging compositions would assist in further
understanding stacking fault energy effects and possibly strain aging behavior.

126
A deformation temperature and strain rate of 1050 °C and 0.001 s-1, respectively,
were chosen to study microstructural and texture evolution in this work by performing
hot compression to incremental strains. A similar investigation at 1150 °C may be useful
in understanding recrystallization texture evolution. A drastic change in recrystallization
texture from random at most deformation conditions to a <100> fiber orientation at
1150 °C and 0.001 s-1 (94% recrystallized) is present in INCOLOY® 945. Compression
to incremental strains at this temperature and strain rate may help understand the
mechanism driving the change in texture (i.e. oriented grain growth) and whether the
texture can be attributed to the final microstructure being fully recrystallized.

127
REFERENCES
[1] Special Metals Corporation, “INCONEL(R) 718 Brochure,” 2008.
[2] Special Metals Corporation, “INCOLOY(R) 925 Brochure,” 2008.
[3] Special Metals Corporation, “INCOLOY(R) 945 Brochure,” 2008.
[4] A. Thomas, M. El-Wahabi, J. Cabrera, and J. Prado, “High temperature deformation
of Inconel 718,” Journal of Materials Processing Technology, vol. 177, Jul. 2006,
pp. 469-472.
[5] C. Slama and M. Abdellaoui, “Structural characterization of the aged Inconel 718,”
Journal of Alloys and Compounds, vol. 306, Jun. 2000, pp. 277-284.
[6] S. Mannan, “Personal Communication,” Jan. 2009.
[7] H. McQueen and J. Jonas, “Recovery and Recrystallization during High
Temperature Deformation,” Treatise on Materials Science and Technology, vol. 6,
1975, pp. 393-493.
[8] J. Immarigeon, PhD Thesis, McGill University, 1974.
[9] J. Immarigeon and J. Jonas, “The deformation of armco iron and silicon steel in the
vicinitl of the curie temperature,” Acta Metallurgica, vol. 22, Oct. 1974, pp. 1235-
1247.
[10] G. Dieter, Mechanical Metallurgy, McGraw-Hill Science/Engineering/Math, 1986.
[11] G. Krauss, Steels, ASM International, 2005.
[12] F.J. Humphreys and M. Hatherly, Recrystallization and Related Annealing
Phenomena, Second Edition, Pergamon, 2004.
[13] T. Sakai and J. Jonas, “Overview no. 35 Dynamic recrystallization: Mechanical and
microstructural considerations,” Acta Metallurgica, vol. 32, Feb. 1984, pp. 189-
209.
[14] T. Sakai, “Dynamic recrystallization microstructures under hot working conditions,”
Journal of Materials Processing Technology, vol. 53, Aug. 1995, pp. 349-361.
[15] M. Hasegawa, M. Yamamoto, and H. Fukutomi, “Formation mechanism of texture
during dynamic recrystallization in gamma-TiAl, nickel and copper examined by
microstructure observation and grain boundary analysis based on local orientation

128
measurements,” Acta Materialia, vol. 51, Aug. 2003, pp. 3939-3950.
[16] Y. Wang, W. Shao, L. Zhen, L. Yang, and X. Zhang, “Flow behavior and
microstructures of superalloy 718 during high temperature deformation,” Materials
Science and Engineering: A, vol. 497, Dec. 2008, pp. 479-486.
[17] N. Dudova, A. Belyakov, T. Sakai, and R. Kaibyshev, “Dynamic recrystallization
mechanisms operating in a Ni-20%Cr alloy under hot-to-warm working,” Acta
Materialia, 2010.
[18] S.C. Medeiros, Y.V.R.K. Prasad, W.G. Frazier, and R. Srinivasan, “Modeling grain
size during hot deformation of IN 718,” Scripta Materialia, vol. 42, Dec. 1999, pp.
17-23.
[19] Y. Wang, W. Shao, L. Zhen, and X. Zhang, “Microstructure evolution during
dynamic recrystallization of hot deformed superalloy 718,” Materials Science and
Engineering: A, vol. 486, Jul. 2008, pp. 321-332.
[20] Y. Wang, W. Shao, L. Zhen, L. Lin, and Y. Cui, “Investigation of Dynamic
Recrystallization Behavior in Hot Deformed Superalloy Inconel 718,” Materials
Science Forum; Part 3, vol. 546/549, 2007, pp. 1297-1300.
[21] M.C. Mataya, M.L. Robinson, D. Chang, M.J. Weis, G.R. Edwards, and D.K.
Matlock, “Grain refinement during primary breakdown of alloy 718,” Toronto,
Canada: 1987.
[22] W. Roberts, H. Boden, and B. Ahlblom, “Dynamic recrystallization kinetics,” Metal
Science, vol. 13, Mar. 1979, pp. 195-205.
[23] I. Shimizu, “Theories and applicability of grain size piezometers: The role of
dynamic recrystallization mechanisms,” Journal of Structural Geology, vol. 30, Jul.
2008, pp. 899-917.
[24] A. Belyakov, H. Miura, and T. Sakai, “Dynamic recrystallization under warm
deformation of a 304 type austenitic stainless steel,” Materials Science and
Engineering A, vol. 255, Oct. 1998, pp. 139-147.
[25] T. Sakai and M. Ohashi, “Dislocation substructures developed during dynamic
recrystallisation in polycrystalline nickel,” Materials Science and Technology, vol.
6, Dec. 1990, pp. 1251-1257.
[26] J.K. Solberg, H.J. McQueen, N. Ryum, and E. Nes, “Influence of ultra-high strains

129
at elevated temperatures on the microstructure of aluminium. Part I,” Philosophical
Magazine A, vol. 60, 1989, p. 447.
[27] G. Gottstein and U. Kocks, “Dynamic recrystallization and dynamic recovery in
<111> single crystals of nickel and copper,” Acta Metallurgica, vol. 31, Jan. 1983,
pp. 175-188.
[28] J. Jonas and T. Sakai, “Deformation, Processing and Structure,” Steels, ASM
International, 1984, pp. 185-243.
[29] N.K. Park, I.S. Kim, Y.S. Na, and J.T. Yeom, “Hot forging of a nickel-base
superalloy,” Journal of Materials Processing Technology, vol. 111, Apr. 2001, pp.
98-102.
[30] M.C. Mataya and D.K. Matlock, “Effects of multiple reductions on grain refinement
during hot working of alloy 718,” Pittsburgh, PA: 1989.
[31] S.C. Medeiros, Y.V.R.K. Prasad, W.G. Frazier, and R. Srinivasan, “Microstructural
modeling of metadynamic recrystallization in hot working of IN 718 superalloy,”
Materials Science and Engineering A, vol. 293, Nov. 2000, pp. 198-207.
[32] L. Zhou and T. Baker, “Effects of dynamic and metadynamic recrystallization on
microstructures of wrought IN-718 due to hot deformation,” Materials Science and
Engineering: A, vol. 196, Jun. 1995, pp. 89-95.
[33] Y. Lin and M. Chen, “Study of microstructural evolution during metadynamic
recrystallization in a low-alloy steel,” Materials Science and Engineering: A, vol.
501, Feb. 2009, pp. 229-234.
[34] A. Beneteau and P. Coulomb, “Measure of the stacking fault energy of F.C.C.
metals and alloys by tensile deformation of polycrystalline samples,” Scripta
Metallurgica, vol. 12, Aug. 1978, pp. 741-743.
[35] J.P. Hirth and J. Lothe, Theory of Dislocations, Krieger Publishing Company, 1992.
[36] J. Huber and M. Hatherly, “Nucleation of recrystallized grains in heavily cold-
worked -brass,” Metal Science, vol. 13, Dec. 1979, pp. 665-669.
[37] A.R. Jones, “Annealing twinning and the nucleation of recrystallization at grain
boundaries,” Journal of Materials Science, vol. 16, May. 1981, pp. 1374-1380.
[38] U.F. Kocks, C.N. Tomé, H. Wenk, and H. Mecking, Texture and anisotropy,
Cambridge University Press, 2000.

130
[39] A. Rollett and S. Wright, “Typical Textures in Metals,” Texture and Anisotropy,
Cambridge University Press, 1998, pp. 178-240.
[40] W. Hosford, Mechanical Behavior of Materials, Cambridge University Press, 2005.
[41] K. Oh, “Analysis of texture evolution in FCC metals by full constraint and a self-
consistent viscoplastic model,” Metals and Materials International, vol. 4, Dec.
1998, pp. 1127-1131.
[42] A. English and G. Chin, “On the variation of wire texture with stacking fault energy
in f.c.c. metals and alloys,” Acta Metallurgica, vol. 13, Sep. 1965, pp. 1013-1016.
[43] O. Engler, C. Pithan, and K. Lücke, “Rolling Texture Development in Cu-Mn-
Alloys,” Materials Science Forum, vol. 157-162, 1994, pp. 679-684.
[44] K. Ito, R. Musick, and K. Lücke, “The influence of iron content and annealing
temperature on the recrystallization textures of high-purity aluminium-iron alloys,”
Acta Metallurgica, vol. 31, Dec. 1983, pp. 2137-2149.
[45] F. Humphreys, “The nucleation of recrystallization at second phase particles in
deformed aluminium,” Acta Metallurgica, vol. 25, Nov. 1977, pp. 1323-1344.
[46] H. Eichelkraut, G. Abbruzzese, and K. Lücke, “A theory of texture controlled grain
growth--II. Numerical and analytical treatment of grain growth in the presence of
two texture components,” Acta Metallurgica, vol. 36, Jan. 1988, pp. 55-68.
[47] Special Metals Corporation, “High Temperature Compression Sample Quality
Assurance,” 2009.
[48] P.J. Goodhew, J. Humphreys, and R. Beanland, Electron Microscopy and Analysis,
Third Edition, Taylor & Francis, 2000.
[49] E. Louis and D. Bourell, “Subgrain imaging of high-purity aluminum using electron
channeling in the SEM,” Metallography, vol. 20, Aug. 1987, pp. 321-334.
[50] I. Gutierrez-Urrutia, S. Zaefferer, and D. Raabe, “Electron channeling contrast
imaging of twins and dislocations in twinning-induced plasticity steels under
controlled diffraction conditions in a scanning electron microscope,” Scripta
Materialia, vol. 61, Oct. 2009, pp. 737-740.
[51] X.W. Li, Y.M. Hu, and Z.G. Wang, “Investigation of dislocation structure in a
cyclically deformed copper single crystal using electron channeling contrast
technique in SEM,” Materials Science and Engineering A, vol. 248, Jun. 1998, pp.

131
299-303.
[52] N.J. Wittridge and R.D. Knutsen, “Recovery and recrystallization characterization
in ferritic stainless steel by using electron channeling contrast,” Materials
Characterization, vol. 37, Jul. 1996, pp. 31-37.
[53] C. Trager-Cowan, F. Sweeney, P. Edwards, A. Wilkinson, A. Winkelmann, A. Day,
T. Wang, P. Parbrook, and I. Watson, “Electron channelling contrast imaging,- in
the scanning electron microscope - of tilt, atomic steps and dislocations in nitride
thin films,” Jan. 2008.
[54] S. Wright, “Fundamentals of Automated EBSD,” Electron Backscatter Diffraction
in Materials Science, Kluwer Academic/Plenum Publishers, 2000, pp. 51-61.
[55] OIM Analysis 5 Software, TSL, 2009.
[56] M. Mataya and V. Sackschewsky, “Effect of internal heating during hot
compression on the stress-strain behavior of alloy 304L,” Metallurgical and
Materials Transactions A, vol. 25, Dec. 1994, pp. 2737-2752.
[57] U. Kocks, R. Cook, and R. Mulford, “Strain aging and strain hardening in Ni-C
alloys,” Acta Metallurgica, vol. 33, Apr. 1985, pp. 623-638.
[58] F.R.N. Nabarro and M.S. Duesbery, Dislocations in solids, Elsevier, 2002.
[59] Y. Nakada and A. Keh, “Serrated flow in Ni-C alloys,” Acta Metallurgica, vol. 18,
Apr. 1970, pp. 437-443.
[60] R. Abbaschian and R.E. Reed-Hill, Physical Metallurgy Principles, CL-
Engineering, 1991.
[61] B.C. DeCooman, J.G. Speer, I.Y. Pyshmintsev, and N. Yoshinaga, Materials Design
- The Key to Modern Steel Products, GRIPS media, 2007.
[62] H. Bakker, H. Bonzel, C. Bruff, M. Dayananda, W. Gust, J. Horvath, I. Kaur, G.
Kidson, A. LeClaire, H. Mehrer, G. Murch, G. Neumann, N. Stolica, and N.
Stolwijk, “Diffusion in Solid Metals and Alloys,” Landolt-Bornstein: Numerical
Data and Functional Relationships in Science and Technology, 1990.
[63] A. Van Den Beukel and U.F. Kocks, “The strain dependence of static and dynamic
strain-aging,” Acta Metallurgica, vol. 30, May. 1982, pp. 1027-1034.
[64] K. Rose and S. Gloverj, “A study of strain-ageing in austenite,” Acta Metallurgica,
vol. 14, Nov. 1966, pp. 1505-1516.

132
[65] W. Cribb and R. Reed-Hill, “Static strain-aging in nickel 200 between 373 and 473
K,” Metallurgical and Materials Transactions A, vol. 8, Jan. 1977, pp. 71-76.
[66] T. Boniszewski and G.C. Smith, “The influence of hydrogen on the plastic
deformation ductility, and fracture of nickel in tension,” Acta Metallurgica, vol. 11,
Mar. 1963, pp. 165-178.
[67] B. Wilcox and G. Smith, “The Portevin-Le Chatelier effect in hydrogen charged
nickel,” Acta Metallurgica, vol. 12, Apr. 1964, pp. 371-376.
[68] B. Wilcox and G. Smith, “Intercrystalline fracture in hydrogen-charged nickel,”
Acta Metallurgica, vol. 13, Mar. 1965, pp. 331-343.
[69] E. Macherauch and O. Vöhringer, “Reckalterung bei nickel,” Acta Metallurgica,
vol. 11, Feb. 1963, pp. 157-158.
[70] S. Mannan and L. Patel, “A New High Strength Corrosion Resistant Alloy for Oil
and Gas Applications,” Corrosion 2008, New Orleans, LA: 2008.
[71] S. Mannan and L. Patel, “A New Ni-Base Superalloy for Oil and Gas Applications,”
Superalloys 2008, 2008, pp. 34-39.
[72] R. Mulford and U. Kocks, “New observations on the mechanisms of dynamic strain
aging and of jerky flow,” Acta Metallurgica, vol. 27, Jul. 1979, pp. 1125-1134.
[73] M. Frommert and G. Gottstein, “Mechanical behavior and microstructure evolution
during steady-state dynamic recrystallization in the austenitic steel 800H,”
Materials Science and Engineering: A, vol. 506, Apr. 2009, pp. 101-110.
[74] N. Tsuji, H. Yagi, Y. Matsubara, and Y. Saito, “Dynamic Recrystallization Texture
in Ferritic and Austenitic Steels,” Ottawa, Canada: unpublished, 2000.
[75] B. Pratt, S. Kulkarni, D. Pope, C. Graham, and G. Noel, “Deformation and
recrystallization textures in compressed polycrystalline silicon,” Metallurgical and
Materials Transactions A, vol. 8, Nov. 1977, pp. 1799-1804.
[76] P.A. Beck, “Notes on the theory of annealing textures,” Acta Metallurgica, vol. 1,
Mar. 1953, pp. 230-234.
[77] A. Merlini and P. Beck, “Study of the origin of the cube texture,” Acta
Metallurgica, vol. 1, Sep. 1953, pp. 598-606.
[78] H. Yoshida, B. Liebmann, and K. Lücke, “Orientation of recrystallized grains in
strained aluminum single crystals,” Acta Metallurgica, vol. 7, Jan. 1959, pp. 51-56.

133
[79] R.E. Smallman and R.J. Bishop, Modern Physical Metallurgy and Materials
Engineering, Sixth Edition, Butterworth-Heinemann, 1999.
[80] C. Barrett, C. Graham Jr., and J. Lommel, “Discussion of "Orientation of
recrystallized grains in strained aluminum single crystals",” Acta Metallurgica, vol.
7, Oct. 1959, pp. 699-700.
[81] M. Mataya, Constant True Strain Rate Compression, 2009.


135
APPENDIX A: CONSTANT TRUE STRAIN RATE PROGRAM [81]
10 REM THIS PROGRAM CREATES STROKE-TIME FILE FOR TESTSTAR-
ISOTHERMAL COMPRESSION
20 REM BASED ON REM BASIC PROGRAM: ICOMP6
30 DIM B(102, 3)
40 PRINT "INPUT TEST # (WHICH IS ALSO DISK FILE NAME)": INPUT G$
50 E$ = "c:\qb45\"
60 F$ = E$ + G$
65 H$ = F$ + "C"
70 S$ = F$ + ".BLK"
80 OPEN S$ FOR OUTPUT AS #2
81 PRINT #2, "FileType=Block-Arbitrary"
82 PRINT #2, "Channels=1"
83 PRINT #2, "Channel(1)=Channel 1"
84 PRINT #2, "Dimension= Length"
85 PRINT #2, "Count= 1.0000 segments"
86 PRINT #2, "Shape= Ramp"
90 PRINT #2, "Level2= 0.0000 mm"
100 PRINT #2, "Time", "Level1"
110 PRINT #2, "sec", "mm"
120 PRINT "INPUT DESIRED STRAIN RATE (PER SECOND)": INPUT R
130 PRINT "INPUT MAX. STROKE FOR RANGE SELECTED (MM)": INPUT S1
140 PRINT "INPUT INITIAL SPECIMEN HEIGHT LIP TO LIP (MM)": INPUT H
150 PRINT "INPUT INITIAL SPECIMEN HEIGHT FLAT TO FLAT (MM)": INPUT
H7
160 PRINT "INPUT INITIAL SPECIMEN DIAMETER (MM)": INPUT A0
170 PRINT "INPUT COEFF. OF THERMAL EXPANSION (PER DEG. C)": INPUT C
180 PRINT "INPUT DESIRED TEST TEMPERATURE (DEG. C)": INPUT T
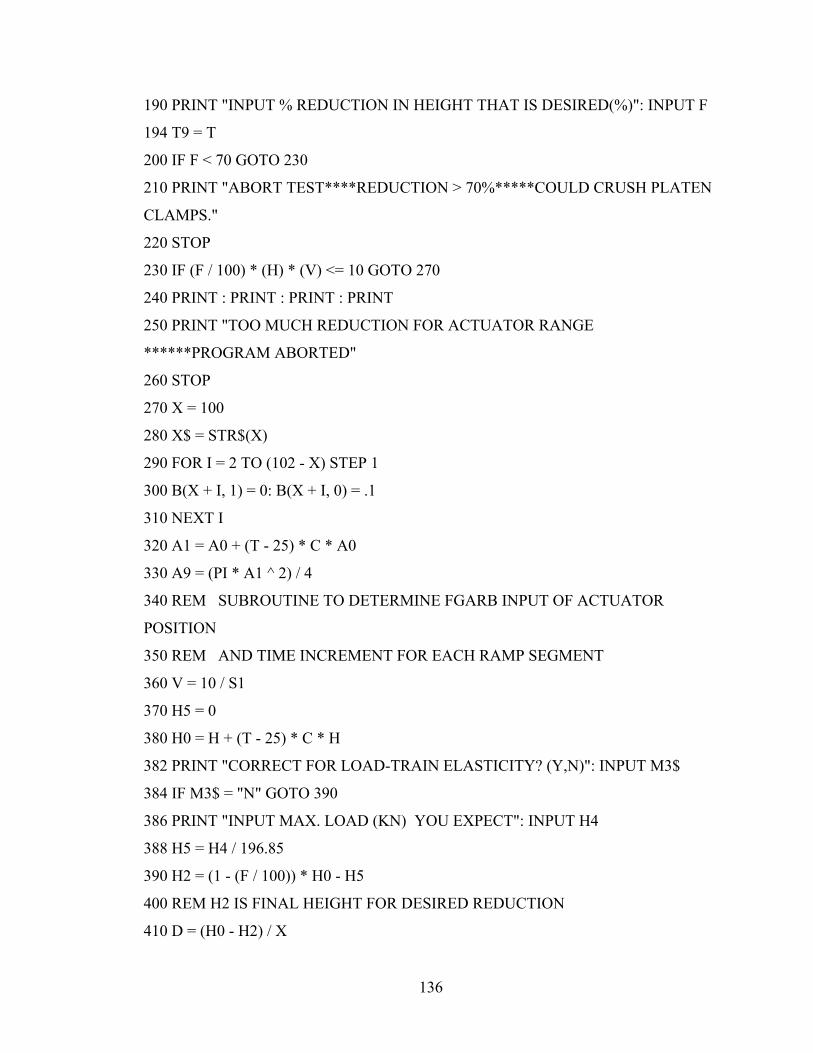
136
190 PRINT "INPUT % REDUCTION IN HEIGHT THAT IS DESIRED(%)": INPUT F
194 T9 = T
200 IF F < 70 GOTO 230
210 PRINT "ABORT TEST****REDUCTION > 70%*****COULD CRUSH PLATEN
CLAMPS."
220 STOP
230 IF (F / 100) * (H) * (V) <= 10 GOTO 270
240 PRINT : PRINT : PRINT : PRINT
250 PRINT "TOO MUCH REDUCTION FOR ACTUATOR RANGE
******PROGRAM ABORTED"
260 STOP
270 X = 100
280 X$ = STR$(X)
290 FOR I = 2 TO (102 - X) STEP 1
300 B(X + I, 1) = 0: B(X + I, 0) = .1
310 NEXT I
320 A1 = A0 + (T - 25) * C * A0
330 A9 = (PI * A1 ^ 2) / 4
340 REM SUBROUTINE TO DETERMINE FGARB INPUT OF ACTUATOR
POSITION
350 REM AND TIME INCREMENT FOR EACH RAMP SEGMENT
360 V = 10 / S1
370 H5 = 0
380 H0 = H + (T - 25) * C * H
382 PRINT "CORRECT FOR LOAD-TRAIN ELASTICITY? (Y,N)": INPUT M3$
384 IF M3$ = "N" GOTO 390
386 PRINT "INPUT MAX. LOAD (KN) YOU EXPECT": INPUT H4
388 H5 = H4 / 196.85
390 H2 = (1 - (F / 100)) * H0 - H5
400 REM H2 IS FINAL HEIGHT FOR DESIRED REDUCTION
410 D = (H0 - H2) / X

137
420 H3 = D
430 FOR I = 2 TO X + 1
440 B(I, 1) = -H3 * (V / 10)
450 H3 = H3 + D
460 PRINT "E.U. FOR ACTUATOR POS.=", B(I, 1)
470 NEXT I
480 PRINT : PRINT : PRINT
490 H2 = (1 - (F / 100)) * H0
500 D = (H0 - H2) / X
510 REM NOTE: H2 AND D ARE RECALCULATED W/O LOAD TRAIN
ELASTICITY CORRECTION
520 REM SO THAT CALCULATION OF TIME INCREMENT DOESN'T GET
SCREWED UP.
530 H1 = H0
540 T1 = 0
550 S0 = 0
560 S = 0
570 FOR I = 2 TO X + 1 STEP 1
580 H1 = H1 - D
590 T = -LOG(H1 / H0) / R
600 B(I, 0) = T - T1
610 S = B(I, 0)
620 S0 = S0 + S
630 T1 = T
640 PRINT "SPECIMEN HEIGHT="; H1, "TIME INCREMENT="; B(I, 0)
650 L$ = STR$(B(I, 1) * S1)
660 T$ = STR$(B(I, 0))
670 PRINT #2, T$, L$
680 NEXT I
690 CLOSE
691 K2 = 0: K1 = 0: I2 = 0: J1 = 0

138
692 OPEN H$ FOR OUTPUT AS #3
694 PRINT #3, G$: PRINT #3, STR$(R): PRINT #3, STR$(S1): PRINT #3, STR$(H)
695 PRINT #3, STR$(H0): PRINT #3, STR$(A0)
696 PRINT #3, STR$(C): PRINT #3, STR$(T9): PRINT #3, STR$(F): PRINT #3,
STR$(A9)
697 PRINT #3, STR$(K2): PRINT #3, STR$(K1): PRINT #3, STR$(I2): PRINT #3,
STR$(J1)
698 PRINT #3, STR$(B): PRINT #3, STR$(M): PRINT #3, STR$(N1): PRINT #3,
STR$(Y9)
699 PRINT #3, STR$(X9): PRINT #3, STR$(C9): PRINT #3, STR$(H7): PRINT #3,
STR$(H4)
704 CLOSE
706 IF H2 > 5.7 GOTO 730
710 PRINT "ABORT PROGRAM***NOTE: REDUCTION TOO GREAT***MAY
CRUSH PLATEN CLAMPS"
720 STOP
730 PRINT : PRINT : PRINT
740 PRINT "TOTAL TIME OF DEFORMATION=", S0
750 PRINT : PRINT : PRINT
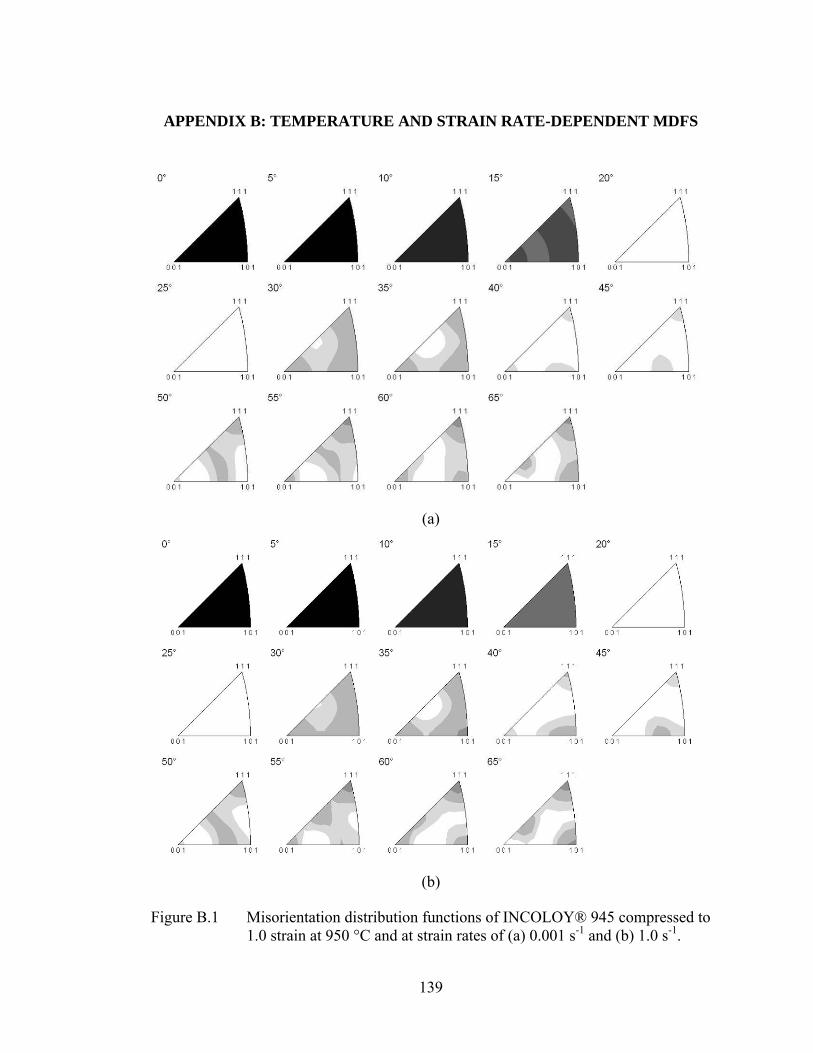
139
APPENDIX B: TEMPERATURE AND STRAIN RATE-DEPENDENT MDFS
(a)
(b)
Figure B.1 Misorientation distribution functions of INCOLOY® 945 compressed to 1.0 strain at 950 °C and at strain rates of (a) 0.001 s-1 and (b) 1.0 s-1.

140
(a)
(b)
Figure B.2 Misorientation distribution functions of INCOLOY® 945 compressed to 1.0 strain at 1050 °C and at strain rates of (a) 0.001 s-1 and (b) 1.0 s-1.

141
(a)
(b)
Figure B.3 Misorientation distribution functions of INCOLOY® 945 compressed to 1.0 strain at 1150 °C and at strain rates of (a) 0.001 s-1 and (b) 1.0 s-1.


143
APPENDIX C: EVOLUTION OF MDFS WITH STRAIN
Figure C.1 Misorientation distribution function of INCOLOY® 945 starting material (zero imposed strain).
Figure C.2 Misorientation distribution function of INCOLOY® 945 compressed to 0.2 strain at 1050 °C and a strain rate of 0.001 s-1.

144
Figure C.3 Misorientation distribution function of INCOLOY® 945 compressed to 0.4 strain at 1050 °C and a strain rate of 0.001 s-1.
Figure C.4 Misorientation distribution function of INCOLOY® 945 compressed to 0.6 strain at 1050 °C and a strain rate of 0.001 s-1.

145
Figure C.5 Misorientation distribution function of INCOLOY® 945 compressed to 0.8 strain at 1050 °C and a strain rate of 0.001 s-1.
Figure C.6 Misorientation distribution function of INCOLOY® 945 compressed to 1.0 strain at 1050 °C and a strain rate of 0.001 s-1.