Flotation of Coarse Phosphates
77
-
Upload
michelle-schroder -
Category
Documents
-
view
42 -
download
3
description
The use of column flotation for phosphate ores
Transcript of Flotation of Coarse Phosphates
The Florida Institute of Phosphate Research was created in 1978 bythe Florida Legislature (Chapter 378.101, Florida Statutes) andempowered to conduct research supportive to the responsibledevelopment of the state's phosphate resources. The Institute hastargeted areas of research responsibility. These are: reclamationalternatives in mining and processing, including wetlandsreclamation, phosphogypsum storage areas and phosphatic claycontainment areas; methods for more efficient, economical andenvironmentally balanced phosphate recovery and processing;disposal and utilization of phosphatic clay; and environmentaleffects involving the health and welfare of the people, includingthose effects related to radiation and water consumption.
FIPR is located in Polk County, in the heart of the central Floridaphosphate district. The Institute seeks to serve as an informationcenter on phosphate-related topics and welcomes informationrequests made in person, by mail, or by telephone.
Research Staff
Executive DirectorRichard F. McFarlin
Research Directors
G. Michael Lloyd Jr.Gordon D. NifongSteven G. RichardsonHassan El-ShallRobert S. Akins
-Chemical Processing-Environmental Services-Reclamation-Beneficiation-Mining
Florida Institute of Phosphate Research1855 West Main StreetBartow, Florida 33830
(813) 534-7160Fax:(813) 534-7165
DEVELOPMENT OF NOVEL FLOTATION-ELUTRIATION METHODFOR COARSE PHOSPHATE BENEFICIATION
FINAL REPORT
Heriban S. Soto
LAVAL UNIVERSITYQUEBEC CANADA G1K 7P4
Prepared for:FLORIDA INSTITUTE OF PHOSPHATE RESEARCH
1855 West Main StreetBartow, Florida 33830
Contract Manager: Dr. Hassan El Shall
February, 1992
DISCLAIMER
The contents of this report are reproduced herein as receivedfrom the contractor.
The opinions, findings and conclusions expressed herein are notnecessarily those of the Florida Institute of Phosphate Research,nor does mention of company names or products constitute endorse-ment by the Florida Institute of Phosphate Research.
ii
PERSPECTIVE
H. El-Shall, Project ManagerFlorida Institute of Phosphate Research
In the beneficiation of Florida phosphate rock, flotationplays a predominant role because it is the most economical way toseparate the phosphate values from the sand and other impuritiescontained in the matrix. Typically, the matrix is washed anddeslimed at 150 mesh. The material finer than 150 mesh is pumpedto clay settling ponds. An estimate of 20-30% of the phosphate(contained in the matrix) is lost with these clays. The rockcoarser than 150 mesh is screened to separate pebbles (-3 l/4 + 14mesh) which are of high phosphate content. Washed rock (-14 mesh+ 150 mesh) is sized into a fine (usually 35 x 150 mesh) and acoarse flotation feeds (usually 14 x 35 mesh) which are treated inseparate circuits.
Flotation of phosphates from the fine feed (35 x 150 mesh)presents very few difficulties and recoveries in excess of 90% arecommonly achieved using conventional mechanical cells.
On the other hand, recovery of the coarse phosphate feed ismuch more difficult and flotation by itself normally yieldsrecoveries of just 60% or even less. In the past, hammer millswere used for size reduction of the coarse feed. However, due tohigh maintenance costs and loss of phosphates as fines (generatedduring milling) its use has been discontinued. The industry,however, has taken other approaches to circumvent the problem oflow floatability of coarse particles. For instance, suchapproaches are exemplified by the use of gravitational devices suchas spirals, tables, launders, sluices and belt conveyors modifiedto perform a "skin flotation" of the reagentized pulp. Although avariable degree of success is obtained with these methods, theyhave to be normally supplemented by scavenger flotation. Inaddition, some of them require excessive maintenance, have lowcapacity or high operating costs. Their performance is less thansatisfactory and in certain cases their use has been discontinued.
The exact reasons that explain the low recoveries of coarseparticles in conventional flotation machines are not clear.Nevertheless, there have been several hypotheses about the behaviorof coarse particles. For instance, the low floatability of largeparticles could be related to the extra weight that has to belifted to the surface (usually under highly turbulent conditions)and then transferred and maintained in the froth layer. Factorssuch as density of the solid, turbulence, stability and height ofthe froth layer, tenacity of the particle - bubble attachment,depth of the water column, viscosity of the froth layer, and othervariables that can indirectly influence these factors determine thefloatability of coarse particles.
iii
Some effort towards improving the flotation of coarseparticles through stabilization of the froth layer, increase in thefroth height, improvement in froth viscosity. etc., through theaddition of fine particles and/or different frothers have beenundertaken. In this regard, beneficial results have been obtainedby modifying the flotation chemistry in coal and sulfides industry.To test this concept in the phosphate flotation, FIPR granted funds(FIPR #87-02-067) to University of Florida. The results from bothlaboratory and plant scale testing are encouraging. The finalreport is ready for publication and distribution to interestedparties.
Changes in the design of the flotation cells presently used inthe industry could constitute an alternative route to attack thecoarse flotation problem. This constitutes the major objective ofthis project.
The specific goals of this project as stated in the originalproposal were to establish the reasons that explain the lowrecovery of coarse particles in conventional flotation, and on thisbasis, to design and evaluate at the laboratory level a new type ofcell for coarse particle beneficiation. After the first year ofwork substantial progress was achieved and both objectives werepartially accomplished. The main conclusion obtained from thetheoretical and experimental study developed during the first yearwas that turbulence in mechanical cells is the most importantlimitation to coarse particles recovery. It was demonstrated thatrecovery in conventional cells decreases as agitation speedincreases beyond a certain critical value. The other majorlimitation to coarse particles recovery is related to froth aspectssuch as: froth stability, transfer and stability of heavyparticles in the froth. It was demonstrated that the larger theparticle size the lower the recovery in the froth bed. Therefore,by increasing the froth depth, recovery of coarse values decreases.
Laboratory scale experiments showed that a column cell with anet upwards flow of water can take care of both limitations andtherefore recoveries of up to 99% of phosphate up to 14 mesh ispossible.
In view of the rapid advances during the first year,objectives for the second year were extended to include scale upand actual testing of a pilot size column. This latter objectivewas accomplished with the successful testing of a one foot diametercolumn at Noralyn plant of IMC during the first two weeks of April1990. Results of this pilot test largely confirmed suggestionsbased on the laboratory work and demonstrated the soundness of thelaboratory testing and the scale up procedure.
Results obtained were extremely encouraging. Up to 99% BPLrecoveries were obtained with acceptable concentrate grade. Thefeed quality changed drastically during testing, but performance ofthe column was always much superior to that of the spirals circuit.Column recoveries were normally equal or better than the over all
iv
recovery obtained by the spirals plus the scavenger flotationcombined.
Future research work that would make it possible to extend theconclusions of this report to a continuous operation as pointed outby the author should be focused on two aspects: continuousoperation of the sparger, and automatic control of the tailingsflow rate (to keep a constant concentrate flow rate). Theperformance of the filter cloth sparger seems adequate but thisshould be corroborated in a continuous operation. Automaticcontrol of the tailings flow rate by a pinch valve coupled to aconductivity sensor has given encouraging results at LavalUniversity, but this or similar approached should be tested incontinuous operation under actual plant conditions.
Another suggestion for future research is the use of this type ofcell for the flotation of dolomite using any of the various reagentschemes proposed in the past. Results discussed in this reportsuggest that column flotation of dolomite should yield higherrecoveries than conventional cells, particularly in the case ofanionic flotation at acidic PH values that are difficult to obtainin an agitated pulp containing carbonate minerals, Also, columnflotation to upgrade low quality pebble could be attempted, thiscould be done with a minimum of grinding since column flotation ofmillimetre size particles seems possible. Pilot testing of theseideas should be encouraged. It seems that such recommendations forfuture work are sound and should be considered.
v
ACKNOWLEDGEMENTS
Several persons have collaborated during the development of this project. In the first place I wantto thank the contribution of my colleagues and assistants at Laval University: Professor G.Barbery, technicians M. Lefrancois, M.C. Lehoux and M. Gamache and graduate student A.Bouajila.
I am also in debt to IMC Fertilizer Inc. for the invaluable support that made it possible thedevelopment of the pilot test work and for providing reagents and ores for the laboratoryresearch. In particular I want to thank Dr. R. Wiegel and R. Snow of IMC for constantencouragement and helpful suggestions.
Finally, I want to acknowledge Dr. H. El Shall of FIPR for the interest and welcoming receptionhe has accorded this project since its inception.
vii
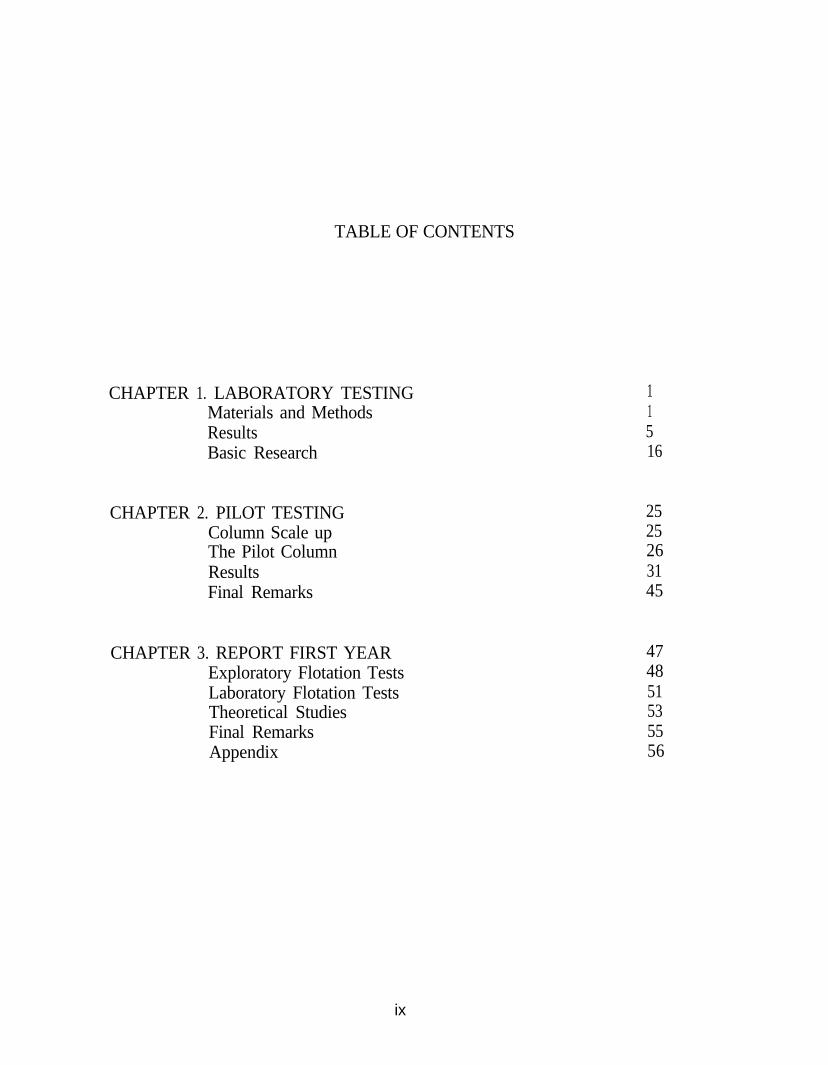
TABLE OF CONTENTS
CHAPTER 1. LABORATORY TESTING 1Materials and Methods 1Results 5Basic Research 16
CHAPTER 2. PILOT TESTING 25Column Scale up 25The Pilot Column 26Results 31Final Remarks 45
CHAPTER 3. REPORT FIRST YEARExploratory Flotation TestsLaboratory Flotation TestsTheoretical StudiesFinal RemarksAppendix
474851535556
ix
xi
xv
EXECUTIVE SUMMARY
This report covers experimental results and discussion of the test work developed throughout thistwo year project that officially ended in July 1990.
Material is organized in three chapters. The most relevant experimental data obtained atlaboratory level is presented in Chapter 1. Further details of this first laboratory phase can befound in Chapter 3 that includes all the work developed during the first year of the project thatwas not included in Chapter 1. Results obtained during the pilot test are presented in detail inChapter II. Also in this Chapter a discussion of the scale up procedure, a description of theaerator and the column itself, and an analysis of the results are presented.
LABORATORY TESTS
The specific goals of this project as stated in the original proposal were to establish the reasonsthat explain the low recovery of coarse particles in conventional flotation, and on this basis, todesign and evaluate at the laboratory level a new type of cell for coarse particle beneficiation.After the first year of work substantial progress was achieved and both objectives were at leastpartially accomplished. The main conclusion obtained from the theoretical and experimental studydeveloped during the first year was that turbulence in mechanical cells is the most importantlimitation to coarse particles recovery. It was demonstrated that recovery in conventional cellsdecreases as agitation speed increases beyond a certain critical value. The other major limitationto coarse particles recovery is related to froth aspects such as: froth stability, transfer and stabilityof heavy particles in the froth. It was demonstrated that the larger the particle size the lower therecovery in the froth bed. Therefore, by increasing the froth depth, recovery of coarse valuesdecreases.
Laboratory scale experiments showed that a column cell with a net upwards flow of water cantake care of both limitations and therefore recoveries of up to 99% of phosphate up to 14 meshis possible. Tests were performed under conditions as realistic as permitted by laboratoryrestrictions. (The terms “elutriation column,” “counter current column” and “negative biascolumn” are used interchangeably in this report to indicate a net upwards flow of water). In anegative bias condition the column is always full of liquid and no froth is formed on the surface.In general, column type cells make it possible to perform the flotation of coarse feeds in a lowturbulence environment. Therefore, any type of column should yield higher recoveries than those
xvii
obtained in agitated devices, but a thick froth layer has to be avoided. The introduction of anupwards water flow (usually termed a negative bias) is essential to reduce or eliminate the frothlayer. Extensive testing at laboratory level with different coarse phosphate feeds indicated thatit is possible to achieve a 98-99% recovery with reasonably good selectivity when up to 14 meshphosphate particles are floated. Under comparable conditions recovery of the coarser phosphatefractions in conventional laboratory cells was considerably lower.
Column flotation was strongly dependent on the reagent level. The best results were obtainedwith total reagent dosages (tall oil + fuel oil) in the range 3.0 to 3.8 kg/ton. These figurescorrespond to the bulk amount of industrial grade reagents added without correcting forimpurities or “active basis” or other considerations. During flotation itself, the most importantoperating variables were those related to bubble size. A small amount of frother (20-30 g/ton)was added to control bubble size. Contrary to our preliminary expectations we found that smallbubbles (0.5-0.8 mm) yield far better recoveries than larger bubbles. Using bubble sizes largerthan one millimetre decreased recovery sharply. A proper bubble size was easily achieved byusing porous steel, ceramic or glass spargers in the presence of a small amount-of frother. A lesssophisticated but equally effective sparger made with commercial quality filter cloth was adoptedfor the laboratory tests and also for the pilot column. Pore size and total surface of the sparger,frother concentration and air flow rate have an influence on bubble size.
Residence time of coarse phosphate particles in the laboratory column was determined to be justa few seconds, but this was enough to achieve very high recoveries. Such results indicate anextremely fast flotation kinetics. Capacity estimations based on these laboratory tests indicateabout 8 tph/m2 (0.7 tph/sq.feet) or about 7 tph/m3 cell (0.2 tph/ cubic feet).
PILOT TEST
In view of the rapid advances made during the first year, objectives for the second year wereextended to include scale up and actual testing of a pilot size column. This latter objective wasaccomplished with the successful testing of a one foot diameter column at Noralyn plant of IMCduring the first two weeks of April 1990. Results of this pilot test largely confirm suggestionsbased on the laboratory work and demonstrate the soundness of the laboratory testing and thescale up procedure.
The pilot column featured a new aerator design that has a number of advantages over otherconventional aerators: better distribution of bubbles, easy to replace or-inspect without shoutingdown the column, and low cost. Column dimensions were 1.0 foot diameter by 5.5 feet height,with an additional section that can increase the total height to 8 feet. This column was installedin the spirals section of IMC’s Noralyn plant and fed by gravity from one of the feed distributorsat a rate of 0.8 to 1.4 tph (metric tonnes are used throughout this report). According toinformation provided by IMC, collector dosage added to the spiral feed during testing was 3.7and 4.0 lbs per tonne (of concentrate) of fuel oil and soap respectively. The only reagent addedto the column was a small amount of frother in the water introduced at the bottom of the column.
xviii
Results obtained were extremely encouraging. Up to 99% BPL recoveries were obtained withacceptable concentrate grade. The feed quality changed drastically during testing, but performanceof the column was always much superior to that of the spirals circuit. Column recoveries werenormally equal or better than the over all recovery obtained by the spirals plus the scavengerflotation combined.
The effect of several operating variables was studied during the pilot test: frother concentration,air flow rate, water flow rate, feed rate, sparger surface and residence time . The most criticalvariables were, as in the laboratory testing, those related to bubble size. The presence of a frotherwas essential to achieve the fine bubble size distribution necessary for a good recovery. Dosagesof 30-60 g/ton of polyglycol type frothers proved to be quite effective. Aerator surface was alsoan important variable, a surface of at least half the column surface was required to obtain aproper bubble size.
Recovery increased with increasing air flow rates up to about 0.5 cm/s ( about 20 lpm). Air flowrates higher than about 0.8 cm/s tended to reduce recovery. Concentrate grade was independenton air flow rate. Recovery also increased when water flow rate was increased, but at theexpenses of lower grades. Optimum water flow rate was about 0.3 cm/s.
Flotation kinetics was extremely fast which is in agreement with the laboratory results. Acollection zone just 3 feet long yielded recoveries of over 90 % BPL. The bulk of the recoveryoccurs in the first 50 cm of column. Optimum performance of the column was observed withabout 0.8 tph (1.1 tph per square feet) but it is likely that capacity can be increased if columnlength is increased or if collector dosages and the oil/soap ratio are optimized.
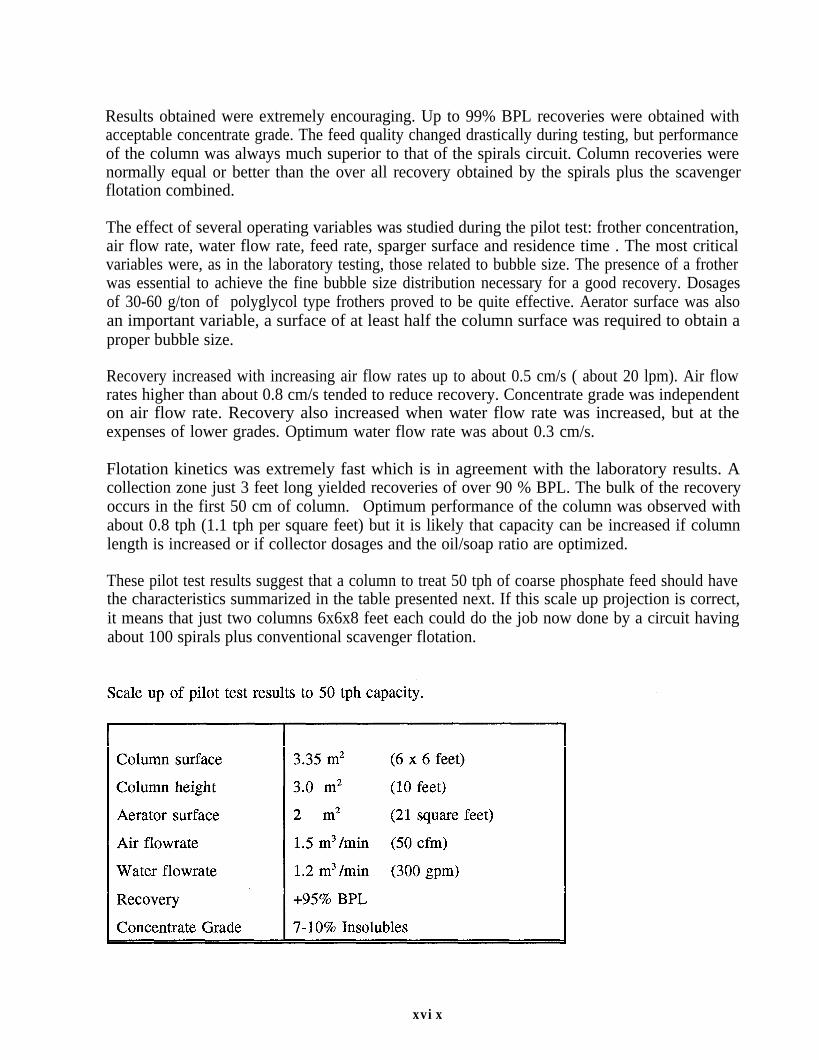
These pilot test results suggest that a column to treat 50 tph of coarse phosphate feed should havethe characteristics summarized in the table presented next. If this scale up projection is correct,it means that just two columns 6x6x8 feet each could do the job now done by a circuit havingabout 100 spirals plus conventional scavenger flotation.
xvix

I hope that this report helps to point out the valuable contribution that column type cells canmake in phosphate beneficiation. Columns are gradually replacing conventional cells in manyflotation operations. Most of the technical advantages that make columns a preferred type of cellin many modern operations are also present in phosphate beneficiation. Furthermore, theexperimental work presented here shows that columns can provide the low-turbulence conditionsthat are necessary to avoid abrasion of the mineral surface and particle detachment.
Future research work that would make it possible to extend the conclusions of this report to acontinuous operation should be focused on two aspects: continuous operation of the sparger, andautomatic control of the tailings flow rate (to keep a constant concentrate flow rate). Theperformance of the filter cloth sparger seems adequate but this should be corroborated in acontinuous operation. Automatic control of the tailings flow rate by a pinch valve coupled to aconductivity sensor has given encouraging results at Laval University, but this or similarapproaches should be corroborated in continuous operation under actual plant conditions.
Another suggestion for future research is the use of this type of cell for the flotation of dolomiteusing any of the various reagent schemes proposed in the past. Results discussed in this reportsuggest that column flotation of dolomite should yield higher recoveries than conventional cells,particularly in the case of anionic flotation at acidic pH values that are difficult to obtain in anagitated pulp containing carbonate minerals. Also, column flotation to upgrade low qualitypebble could be attempted, this could be done with a minimum of grinding since column flotationof millimetre size particles seems possible. Pilot testing of these ideas should be encouraged.
xx
CHAPTER 1
LABORATORY TESTING
MATERIALS AND METHODS
Phosphate Ores.
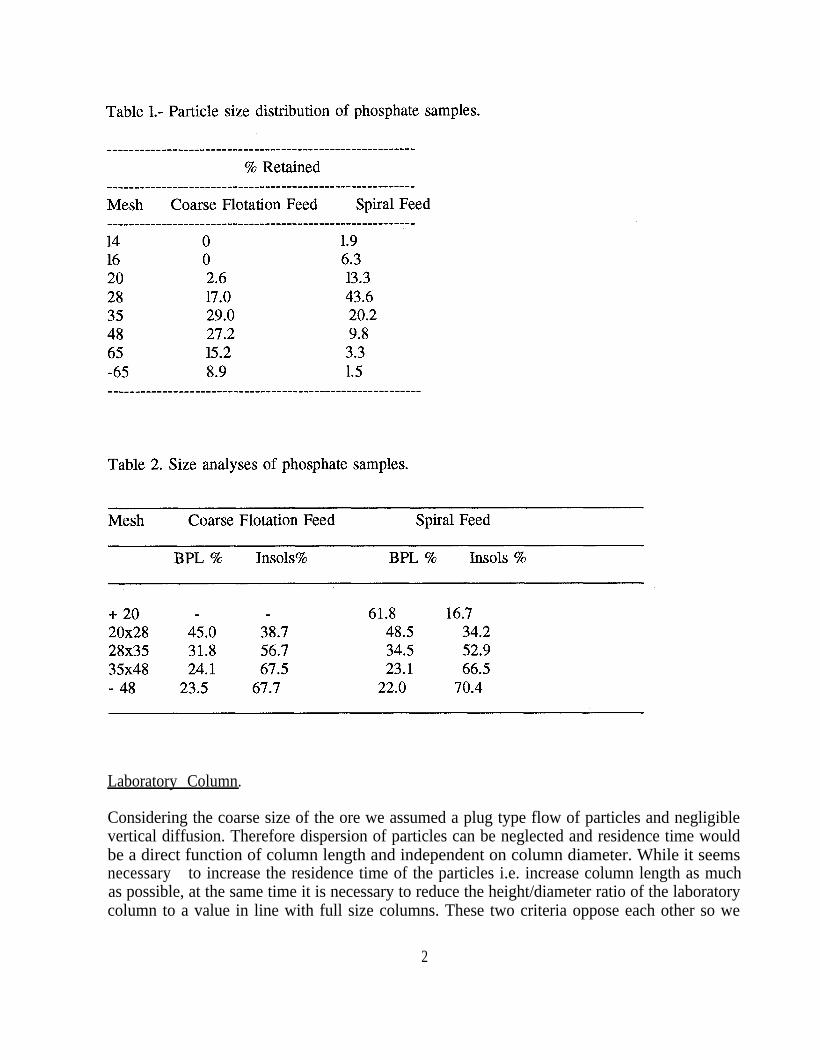
Two samples of coarse phosphate ore of about 1400 pounds were obtained from IMC of Bartow,Florida. This material was analyzed and characterized and then divided into 1.0 kg batchessuitable for laboratory testing. The coarser sample corresponds to the feed of the spiralconcentration circuit at Noralyn plant. The other sample is a coarse flotation feed of the sameplant. Particle size distribution of both materials is presented in Table 1. Note that the spiral feedis much coarser than normal coarse phosphate flotation feeds. Size by size analyses of bothsamples are presented in Table 2.
Both samples are industrial quality products and were used as received. They were subjected tono purification or other manipulation to assure that results obtained in this research could bedirectly related to industrial practice. Tap water was used for all testing involving phosphateminerals. Maximum water recycling as allowed by experimental constraints was the norm duringcolumn flotation tests. Chemical assays of the two phosphate samples indicated 30.5 % BPL and58% insolubles for the coarse flotation feed and 44.5% BPL with 39 % insolubles for the spiralfeed. Both samples contained essentially francolite and quartz with minor impurities of clays andfeldspars.
Reagents
Some early exploratory tests reported here were carried out with technical grade reagentsprovided by different suppliers. Fatty acid (Acintol AF3) was obtained from Arizona Chemicals.All other test work was conducted with industrial grade samples of collectors and oil extendersused in Florida phosphate plants. These include fatty acids (Tall oil) soaps, diesel fuel, diesel oil,amine condensate, Armak 2HT-75 ( a quaternary ammonium compound) and sodium silicatekindly provided by IMC Co. These reagents were also used “as received”.Tap water of total hardness of about 100 ppm calcium carbonate was used throughout theexperimental work.
Laboratory Column.
Considering the coarse size of the ore we assumed a plug type flow of particles and negligiblevertical diffusion. Therefore dispersion of particles can be neglected and residence time wouldbe a direct function of column length and independent on column diameter. While it seemsnecessary to increase the residence time of the particles i.e. increase column length as muchas possible, at the same time it is necessary to reduce the height/diameter ratio of the laboratorycolumn to a value in line with full size columns. These two criteria oppose each other so we
2
decided to begin with a compromise ratio of about 12, and then to study experimentally theinfluence of the residence time on recovery.
A 7.0 cm internal diameter laboratory column was chosen because it is an adequate size to workwith in the laboratory and experience with conventional columns indicate that 5.0 cm laboratorycolumns provide meaningful information for scale up to full size units. The scale up criteria wereto keep constant the air and water velocities (i.e. constant flow rates per unit area of column);and to keep a constant ratio: sparger area to column area. For conventional columns it has beensuggested a ratio of one or larger, however, for coarse particles flotation we think that given thelow external surface area of the particles a lower ratio can be tolerated.
Pumps, aerator and feeding system were dimensioned according to the requirements of the 7 cmcolumn. All pumps used were variable velocity peristaltic pumps which allowed a precise controlof flow rates. The body of the column was a plexiglass tube divided into different modularsections that were bolted together and sealed with rubber seals. The upper section included alaunder to collect the concentrate and the lower section contained the aerator and a spigot tointroduce the bias water. Intermediate sections could be added as needed to have a given columnlength. Most tests were performed with a total column length of just 82 cm.
Some minor difficulties to design and built an adequate aerator were encountered but finally asimple and reliable air diffuser was built. It consisted of a 3.7 cm diameter 2.0 cm long tube withindustrial filter cloth fixed at both ends. Total aerator surface is 21.5 cm which is still lower thanthe column area of 38.5 cm but a ratio sparger to column of about 0.6 seemed adequate at leastfor preliminary testing.
The feeding system presented a serious challenge due to the size of the particles, the relativelysmall amount of ore used, and to the absolute necessity of wet feeding and minimize abrasion.After several failed attempts we built a feeder based on a rotating spiral that allows reproduciblefeeding rates and showed no abrasion of the ore. Feed was introduced at a chosen depth and atthe center of the column. A diagram of the column is presented in Figure 1.
Control instrumental incorporated to the column included:
l.- Automatic on line pH control system.2.- Water flowmeter3.- Air flowmeter and manometer4.- Conductivity probes with automatic level control system.5.- Hydrostatic pressure manometers for air hold up measurements.
Not all of this instrumental was used in every test. In most routine tests only the pH controlsystem and the water and air flowmeters were used.
3
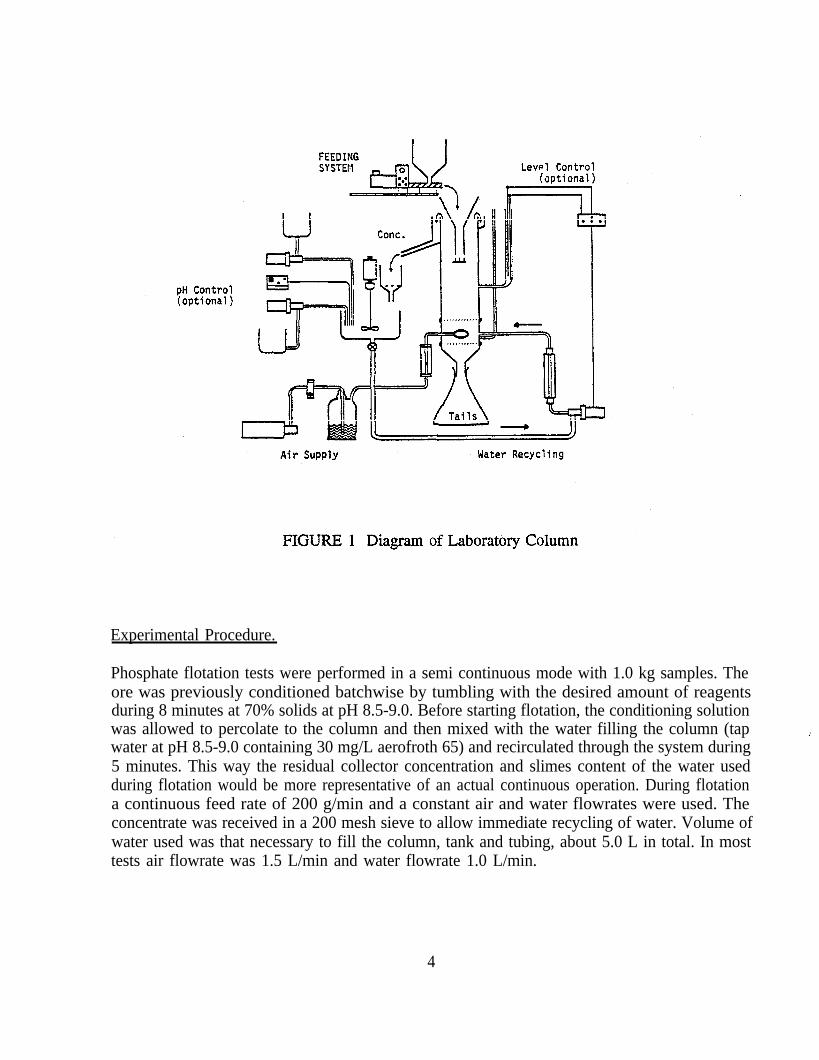
Experimental Procedure.
Phosphate flotation tests were performed in a semi continuous mode with 1.0 kg samples. Theore was previously conditioned batchwise by tumbling with the desired amount of reagentsduring 8 minutes at 70% solids at pH 8.5-9.0. Before starting flotation, the conditioning solutionwas allowed to percolate to the column and then mixed with the water filling the column (tapwater at pH 8.5-9.0 containing 30 mg/L aerofroth 65) and recirculated through the system during5 minutes. This way the residual collector concentration and slimes content of the water usedduring flotation would be more representative of an actual continuous operation. During flotationa continuous feed rate of 200 g/min and a constant air and water flowrates were used. Theconcentrate was received in a 200 mesh sieve to allow immediate recycling of water. Volume ofwater used was that necessary to fill the column, tank and tubing, about 5.0 L in total. In mosttests air flowrate was 1.5 L/min and water flowrate 1.0 L/min.
4
RESULTS
As could be expected flotation behaviour of phosphate was dependent on collector addition.Optimum collector dosage was found to be between 3.0 and 4.0 kg/ton. Very low recoverieswere observed for total collector dosage below 3.0 kg/t, on the other hand, at dosages of about3.6 kg/t recovery was better than 95%, at higher dosages limited gains in phosphate recoverywere possible but at the cost of increased flotation of insolubles. Some typical results includingmass balance calculations are shown in tables 3, 4, 5 and 6.
Table 3Flotation of coarse flotation feed in column with 1.3 kg/ton tall oil and 2.3 kg/ton fuel oil.Frother 30 mg/l, air 1400 ml/min, water 1000 ml/min.
Weight BPL Recovery Grade(grams) % BPL % Insols %
Concentrate 486 95.3 58.7 21.7Tailings 498 4.7 2.82 96.2Feed (calc) 984 100.0 30.4 59.8
Table 4. Flotation of mixture coarse+spiral feed.
(Same conditions as Table 3 but water flow reduced to 600 ml/min.)
Weight BPL Recovery Grade(grams) % BPL % Insols %
Concentrate 472 96.7 60.8 18.9Tailings 503 3.3 2.0 97.4Feed (calc) 975 100.0 30.5 59.6
5
Table 5. Flotation of spiral feed (Same conditions as in Table 3)
Weight BPL Recovery Grade(grams) % BPL % Insols %
Concentrate 621 97.8 68.2 9.0Tailings 363 2.2 2.6 96.5Feed (calc) 984 100.0 44.0 39.0
Table 6Flotation of mixture spiral+coarse Feed. (Same conditions as in Table 3.)
Weight(grams)
BPL Recovery Grade% BPL % Insols %
Concentrate 557 96.7 61.1 18.5Tailings 415 3.3 2.8 96.3Feed (Calc) 972 100.0 36.2 51.0
As seen in these tables spiral feed recoveries higher than 95% are possible while eliminatingabout 85 % of the sand in a single rougher flotation. If the collector addition is increased, nearly100 % recovery was achieved and about 60% of the sand was eliminated. For the coarseflotation feed recoveries were slightly lower with a maximum of 96-97% recovery at about 80%sand rejection, which yields a rougher concentrate grade of around 20% insols. Flotation of amixture of both feeds yielded results intermediate to those when both feeds were floatedseparately.
6
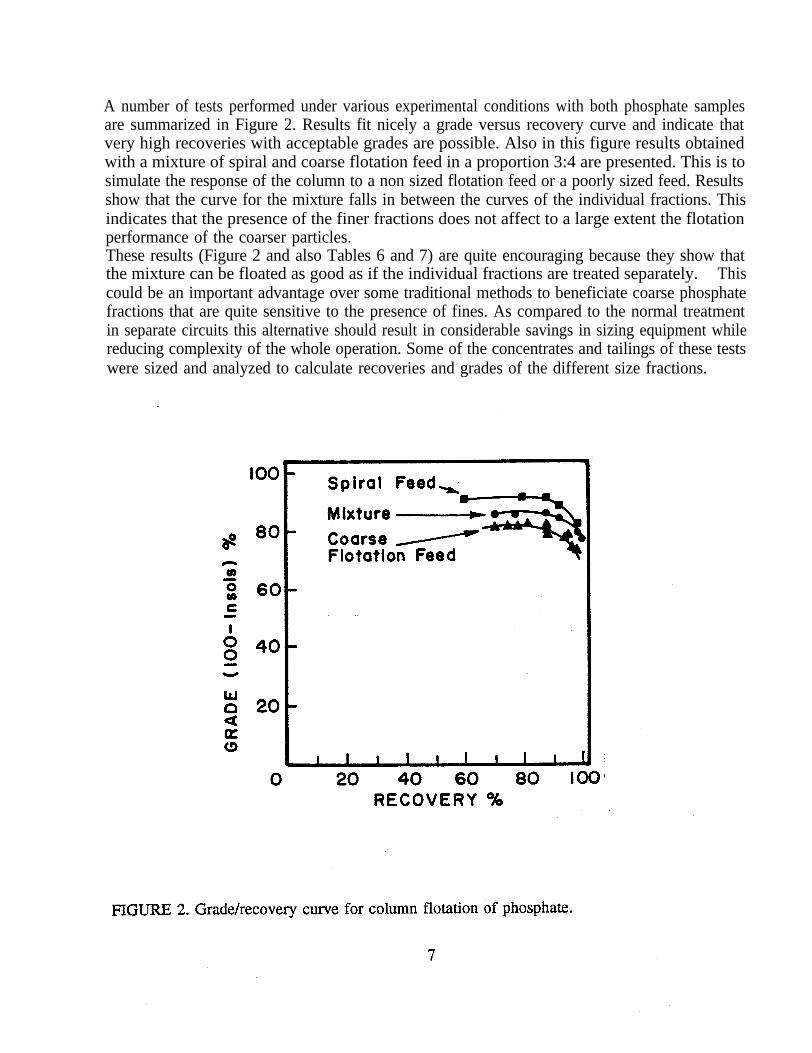
A number of tests performed under various experimental conditions with both phosphate samplesare summarized in Figure 2. Results fit nicely a grade versus recovery curve and indicate thatvery high recoveries with acceptable grades are possible. Also in this figure results obtainedwith a mixture of spiral and coarse flotation feed in a proportion 3:4 are presented. This is tosimulate the response of the column to a non sized flotation feed or a poorly sized feed. Resultsshow that the curve for the mixture falls in between the curves of the individual fractions. Thisindicates that the presence of the finer fractions does not affect to a large extent the flotationperformance of the coarser particles.These results (Figure 2 and also Tables 6 and 7) are quite encouraging because they show thatthe mixture can be floated as good as if the individual fractions are treated separately. Thiscould be an important advantage over some traditional methods to beneficiate coarse phosphatefractions that are quite sensitive to the presence of fines. As compared to the normal treatmentin separate circuits this alternative should result in considerable savings in sizing equipment whilereducing complexity of the whole operation. Some of the concentrates and tailings of these testswere sized and analyzed to calculate recoveries and grades of the different size fractions.
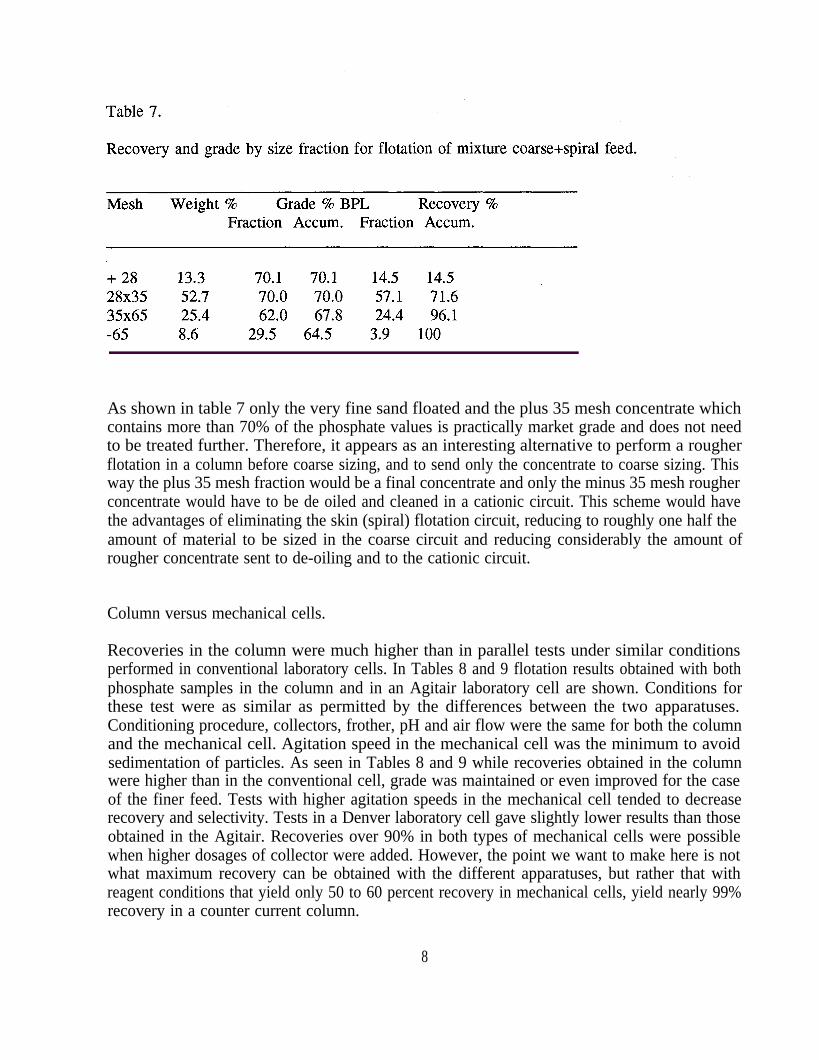
As shown in table 7 only the very fine sand floated and the plus 35 mesh concentrate whichcontains more than 70% of the phosphate values is practically market grade and does not needto be treated further. Therefore, it appears as an interesting alternative to perform a rougherflotation in a column before coarse sizing, and to send only the concentrate to coarse sizing. Thisway the plus 35 mesh fraction would be a final concentrate and only the minus 35 mesh rougherconcentrate would have to be de oiled and cleaned in a cationic circuit. This scheme would havethe advantages of eliminating the skin (spiral) flotation circuit, reducing to roughly one half theamount of material to be sized in the coarse circuit and reducing considerably the amount ofrougher concentrate sent to de-oiling and to the cationic circuit.
Column versus mechanical cells.
Recoveries in the column were much higher than in parallel tests under similar conditionsperformed in conventional laboratory cells. In Tables 8 and 9 flotation results obtained with bothphosphate samples in the column and in an Agitair laboratory cell are shown. Conditions forthese test were as similar as permitted by the differences between the two apparatuses.Conditioning procedure, collectors, frother, pH and air flow were the same for both the columnand the mechanical cell. Agitation speed in the mechanical cell was the minimum to avoidsedimentation of particles. As seen in Tables 8 and 9 while recoveries obtained in the columnwere higher than in the conventional cell, grade was maintained or even improved for the caseof the finer feed. Tests with higher agitation speeds in the mechanical cell tended to decreaserecovery and selectivity. Tests in a Denver laboratory cell gave slightly lower results than thoseobtained in the Agitair. Recoveries over 90% in both types of mechanical cells were possiblewhen higher dosages of collector were added. However, the point we want to make here is notwhat maximum recovery can be obtained with the different apparatuses, but rather that withreagent conditions that yield only 50 to 60 percent recovery in mechanical cells, yield nearly 99%recovery in a counter current column.
8
Gary Albarelli
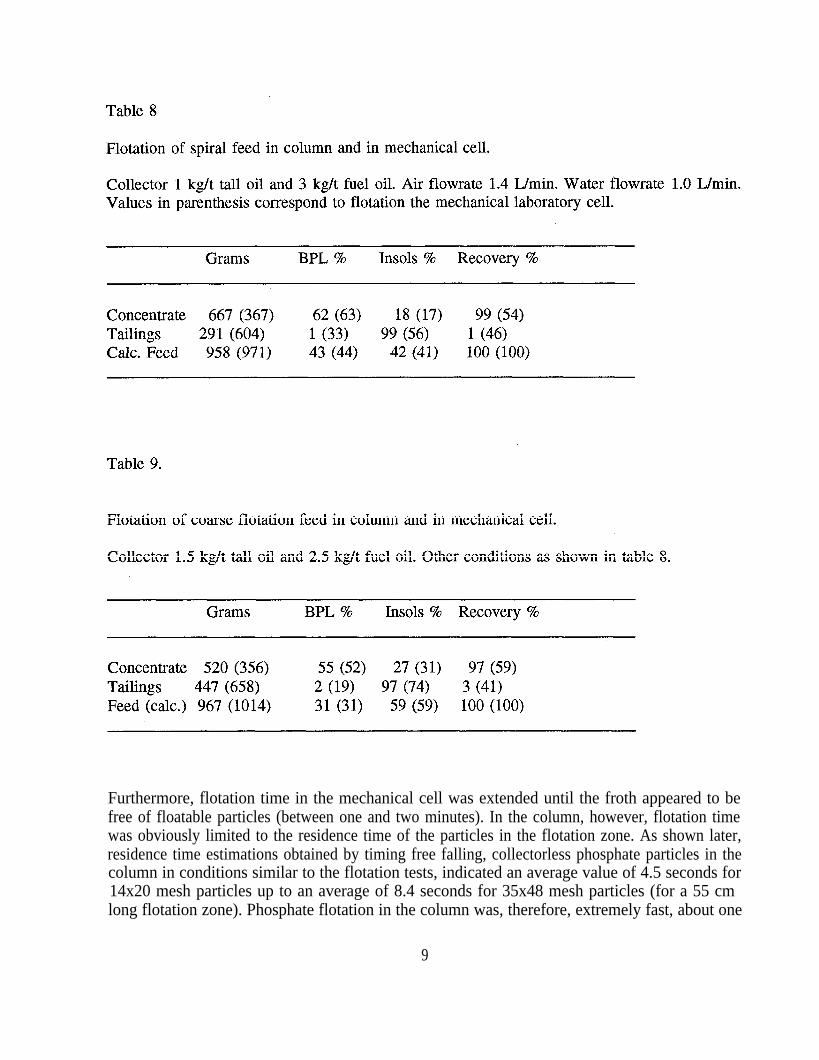
Furthermore, flotation time in the mechanical cell was extended until the froth appeared to befree of floatable particles (between one and two minutes). In the column, however, flotation timewas obviously limited to the residence time of the particles in the flotation zone. As shown later,residence time estimations obtained by timing free falling, collectorless phosphate particles in thecolumn in conditions similar to the flotation tests, indicated an average value of 4.5 seconds for14x20 mesh particles up to an average of 8.4 seconds for 35x48 mesh particles (for a 55 cmlong flotation zone). Phosphate flotation in the column was, therefore, extremely fast, about one
9
order of magnitude faster than in the conventional cell.
Effect of operating variables.
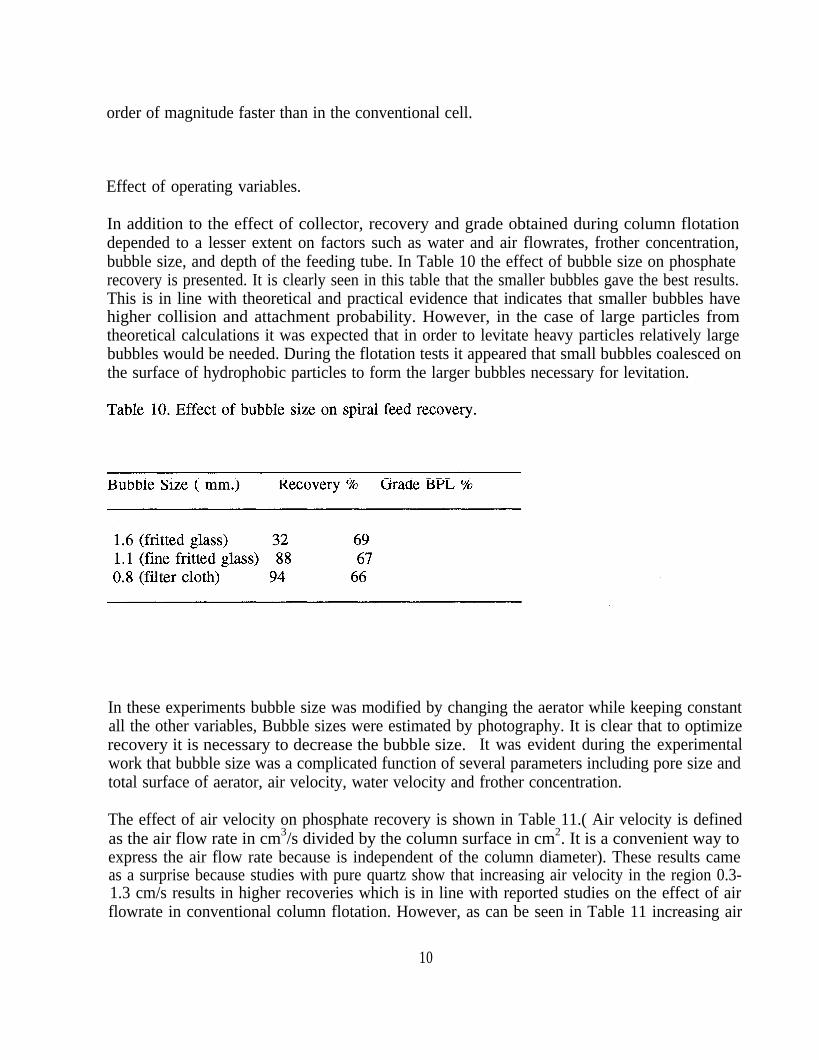
In addition to the effect of collector, recovery and grade obtained during column flotationdepended to a lesser extent on factors such as water and air flowrates, frother concentration,bubble size, and depth of the feeding tube. In Table 10 the effect of bubble size on phosphaterecovery is presented. It is clearly seen in this table that the smaller bubbles gave the best results.This is in line with theoretical and practical evidence that indicates that smaller bubbles havehigher collision and attachment probability. However, in the case of large particles fromtheoretical calculations it was expected that in order to levitate heavy particles relatively largebubbles would be needed. During the flotation tests it appeared that small bubbles coalesced onthe surface of hydrophobic particles to form the larger bubbles necessary for levitation.
In these experiments bubble size was modified by changing the aerator while keeping constantall the other variables, Bubble sizes were estimated by photography. It is clear that to optimizerecovery it is necessary to decrease the bubble size. It was evident during the experimentalwork that bubble size was a complicated function of several parameters including pore size andtotal surface of aerator, air velocity, water velocity and frother concentration.
The effect of air velocity on phosphate recovery is shown in Table 11.( Air velocity is definedas the air flow rate in cm3/s divided by the column surface in cm2. It is a convenient way toexpress the air flow rate because is independent of the column diameter). These results cameas a surprise because studies with pure quartz show that increasing air velocity in the region 0.3-1.3 cm/s results in higher recoveries which is in line with reported studies on the effect of airflowrate in conventional column flotation. However, as can be seen in Table 11 increasing air
10
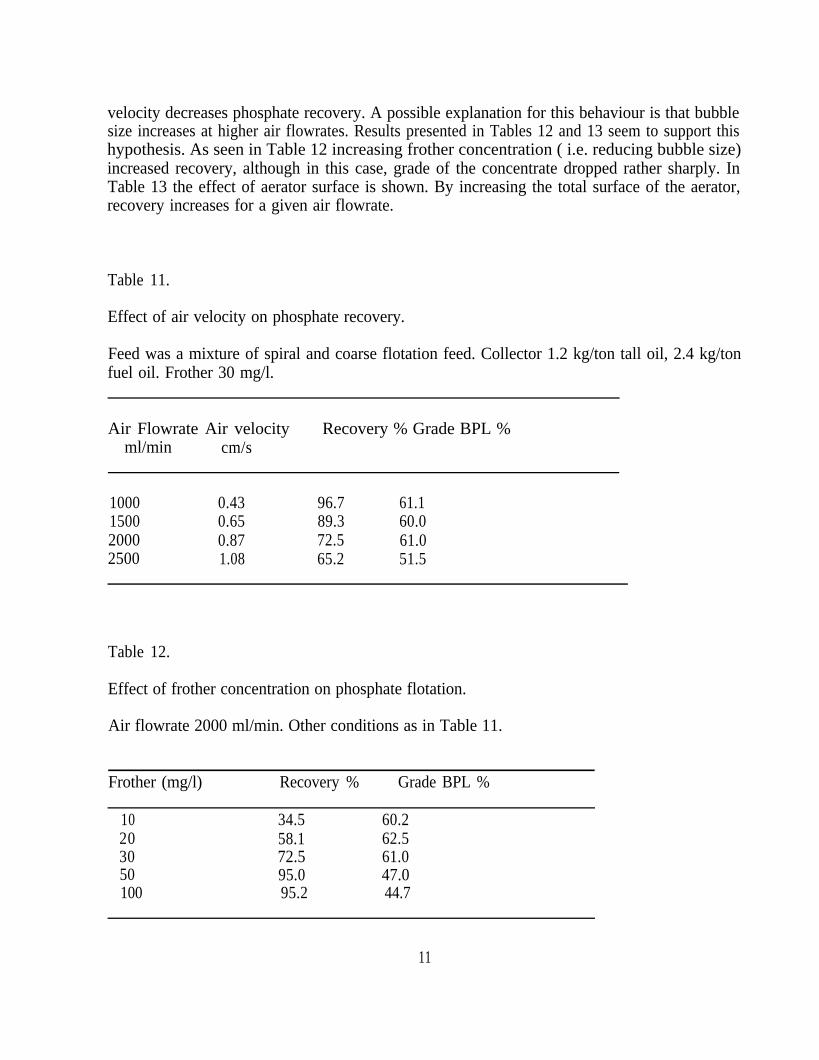
velocity decreases phosphate recovery. A possible explanation for this behaviour is that bubblesize increases at higher air flowrates. Results presented in Tables 12 and 13 seem to support thishypothesis. As seen in Table 12 increasing frother concentration ( i.e. reducing bubble size)increased recovery, although in this case, grade of the concentrate dropped rather sharply. InTable 13 the effect of aerator surface is shown. By increasing the total surface of the aerator,recovery increases for a given air flowrate.
Table 11.
Effect of air velocity on phosphate recovery.
Feed was a mixture of spiral and coarse flotation feed. Collector 1.2 kg/ton tall oil, 2.4 kg/tonfuel oil. Frother 30 mg/l.
Air Flowrate Air velocityml/min cm/s
Recovery % Grade BPL %
1000 0.43 96.7 61.11500 0.65 89.3 60.02000 0.87 72.5 61.02500 1.08 65.2 51.5
Table 12.
Effect of frother concentration on phosphate flotation.
Air flowrate 2000 ml/min. Other conditions as in Table 11.
Frother (mg/l) Recovery % Grade BPL %
10 34.5 60.220 58.1 62.530 72.5 61.050 95.0 47.0100 95.2 44.7
11
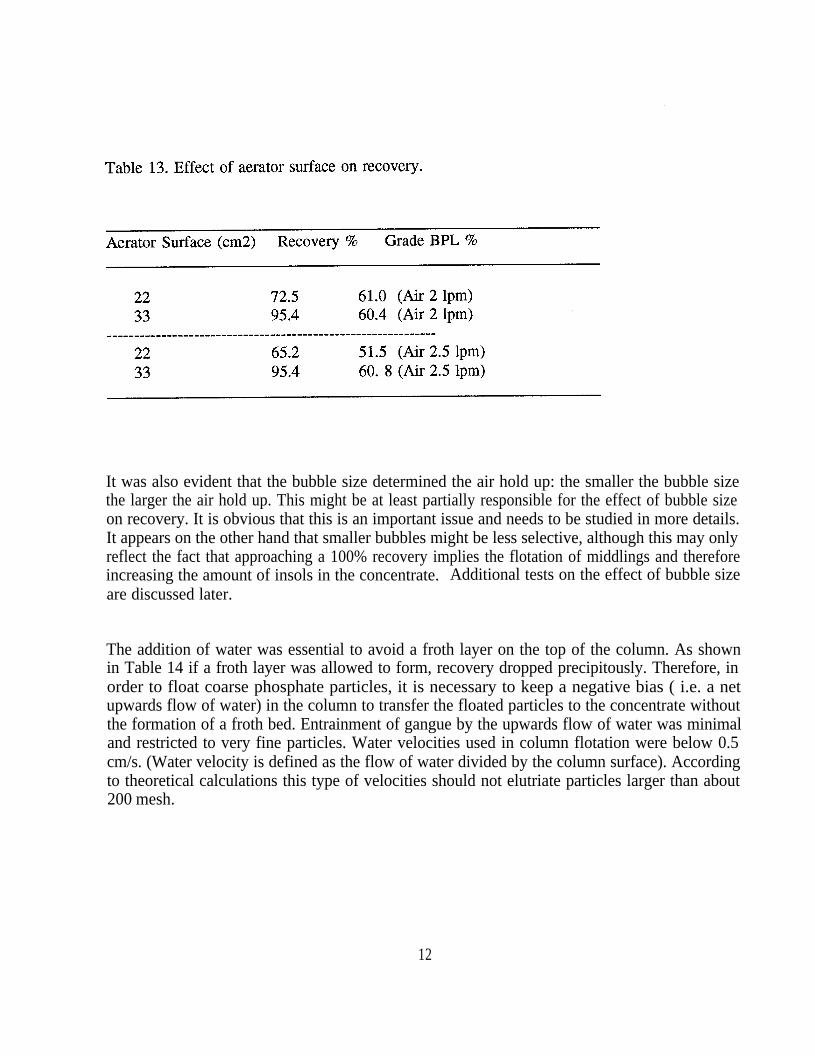
It was also evident that the bubble size determined the air hold up: the smaller the bubble sizethe larger the air hold up. This might be at least partially responsible for the effect of bubble sizeon recovery. It is obvious that this is an important issue and needs to be studied in more details.It appears on the other hand that smaller bubbles might be less selective, although this may onlyreflect the fact that approaching a 100% recovery implies the flotation of middlings and thereforeincreasing the amount of insols in the concentrate. Additional tests on the effect of bubble sizeare discussed later.
The addition of water was essential to avoid a froth layer on the top of the column. As shownin Table 14 if a froth layer was allowed to form, recovery dropped precipitously. Therefore, inorder to float coarse phosphate particles, it is necessary to keep a negative bias ( i.e. a netupwards flow of water) in the column to transfer the floated particles to the concentrate withoutthe formation of a froth bed. Entrainment of gangue by the upwards flow of water was minimaland restricted to very fine particles. Water velocities used in column flotation were below 0.5cm/s. (Water velocity is defined as the flow of water divided by the column surface). Accordingto theoretical calculations this type of velocities should not elutriate particles larger than about200 mesh.
12
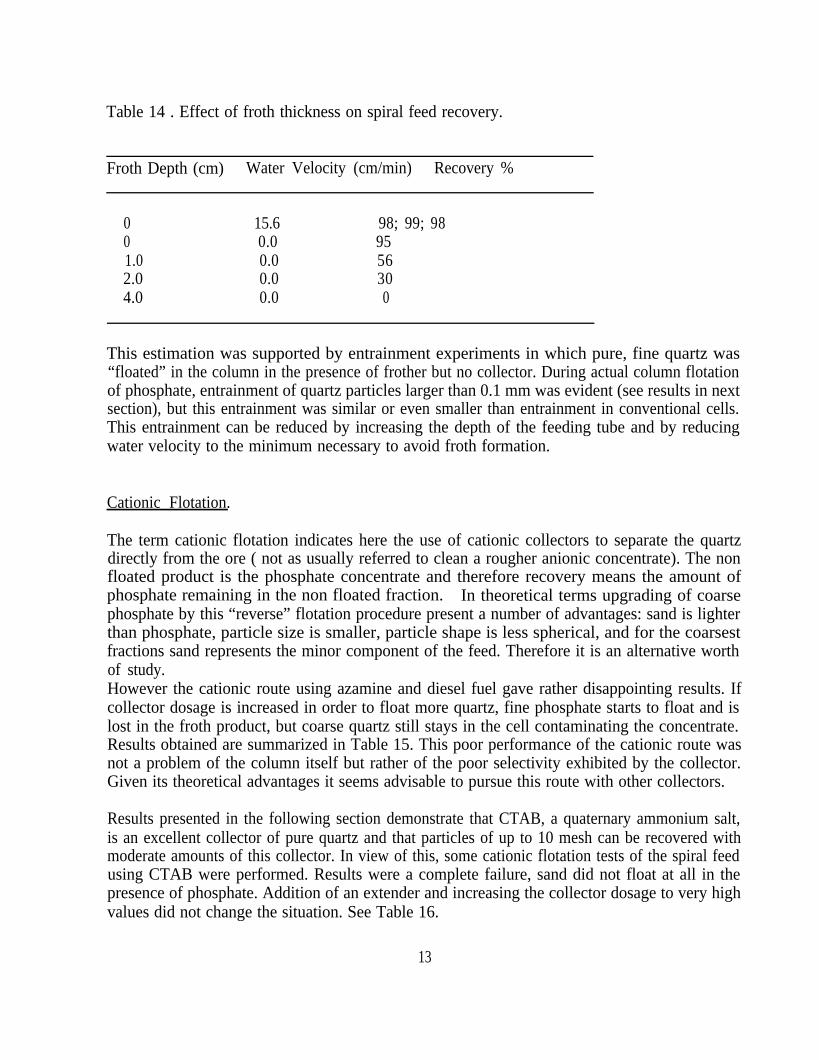
Table 14 . Effect of froth thickness on spiral feed recovery.
Froth Depth (cm) Water Velocity (cm/min) Recovery %
0 15.6 98; 99; 980 0.0 951.0 0.0 562.0 0.0 304.0 0.0 0
This estimation was supported by entrainment experiments in which pure, fine quartz was“floated” in the column in the presence of frother but no collector. During actual column flotationof phosphate, entrainment of quartz particles larger than 0.1 mm was evident (see results in nextsection), but this entrainment was similar or even smaller than entrainment in conventional cells.This entrainment can be reduced by increasing the depth of the feeding tube and by reducingwater velocity to the minimum necessary to avoid froth formation.
Cationic Flotation.
The term cationic flotation indicates here the use of cationic collectors to separate the quartzdirectly from the ore ( not as usually referred to clean a rougher anionic concentrate). The nonfloated product is the phosphate concentrate and therefore recovery means the amount ofphosphate remaining in the non floated fraction. In theoretical terms upgrading of coarsephosphate by this “reverse” flotation procedure present a number of advantages: sand is lighterthan phosphate, particle size is smaller, particle shape is less spherical, and for the coarsestfractions sand represents the minor component of the feed. Therefore it is an alternative worthof study.However the cationic route using azamine and diesel fuel gave rather disappointing results. Ifcollector dosage is increased in order to float more quartz, fine phosphate starts to float and islost in the froth product, but coarse quartz still stays in the cell contaminating the concentrate.Results obtained are summarized in Table 15. This poor performance of the cationic route wasnot a problem of the column itself but rather of the poor selectivity exhibited by the collector.Given its theoretical advantages it seems advisable to pursue this route with other collectors.
Results presented in the following section demonstrate that CTAB, a quaternary ammonium salt,is an excellent collector of pure quartz and that particles of up to 10 mesh can be recovered withmoderate amounts of this collector. In view of this, some cationic flotation tests of the spiral feedusing CTAB were performed. Results were a complete failure, sand did not float at all in thepresence of phosphate. Addition of an extender and increasing the collector dosage to very highvalues did not change the situation. See Table 16.
13
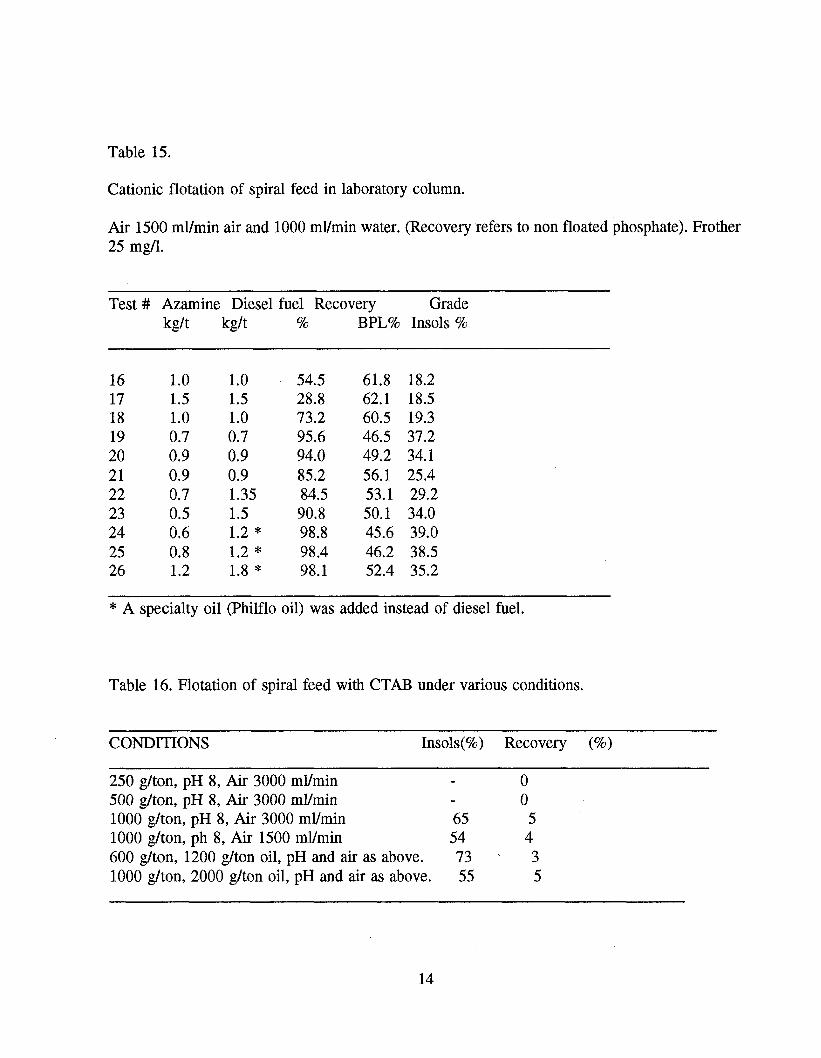
Table 15.
Cationic flotation of spiral feed in laboratory column.
Air 1500 ml/min air and 1000 ml/min water. (Recovery refers to non floated phosphate). Frother 25 mg/l.
Test # Azamine Diesel fuel Recovery Grade kg/t kg/t % BPL% Insols %
16 1.0 1.0 54.5 61.8 18.2 17 1.5 1.5 28.8 62.1 18.5 18 1.0 1.0 73.2 60.5 19.3 19 0.7 0.7 95.6 46.5 37.2 20 0.9 0.9 94.0 49.2 34.1 21 0.9 0.9 85.2 56.1 25.4 22 0.7 1.35 84.5 53.1 29.2 23 0.5 1.5 90.8 50.1 34.0 24 0.6 1.2 * 98.8 45.6 39.0 25 0.8 1.2 * 98.4 46.2 38.5 26 1.2 1.8 * 98.1 52.4 35.2
* A specialty oil (Philflo oil) was added instead of diesel fuel.
Table 16. Flotation of spiral feed with CTAB under various conditions.
CONDITIONS Insols(%) Recovery mo)
250 g/ton, pH 8, Air 3000 ml/min 0 500 g/ton, pH 8, Air 3000 ml/min 0 1000 g/ton, pH 8, Air 3000 ml/min 65 5 1000 g/ton, ph 8, Air 1500 ml/min 54 4 600 g/ton, 1200 g/ton oil, pH and air as above. 73 ~ 3 1000 g/ton, 2000 g/ton oil, pH and air as above. 55 5
14
Under the conditions shown in Table 16 pure quartz of up to 10 mesh size floats nearly 100percent. It was beyond the scope of this research to investigate the cause of this extremelydifferent behaviour, but it is certainly a challenging problem that would be interesting to inspectin details because it could provide some clue to the difficulty encountered to float quartz particlesfrom a phosphate feed.
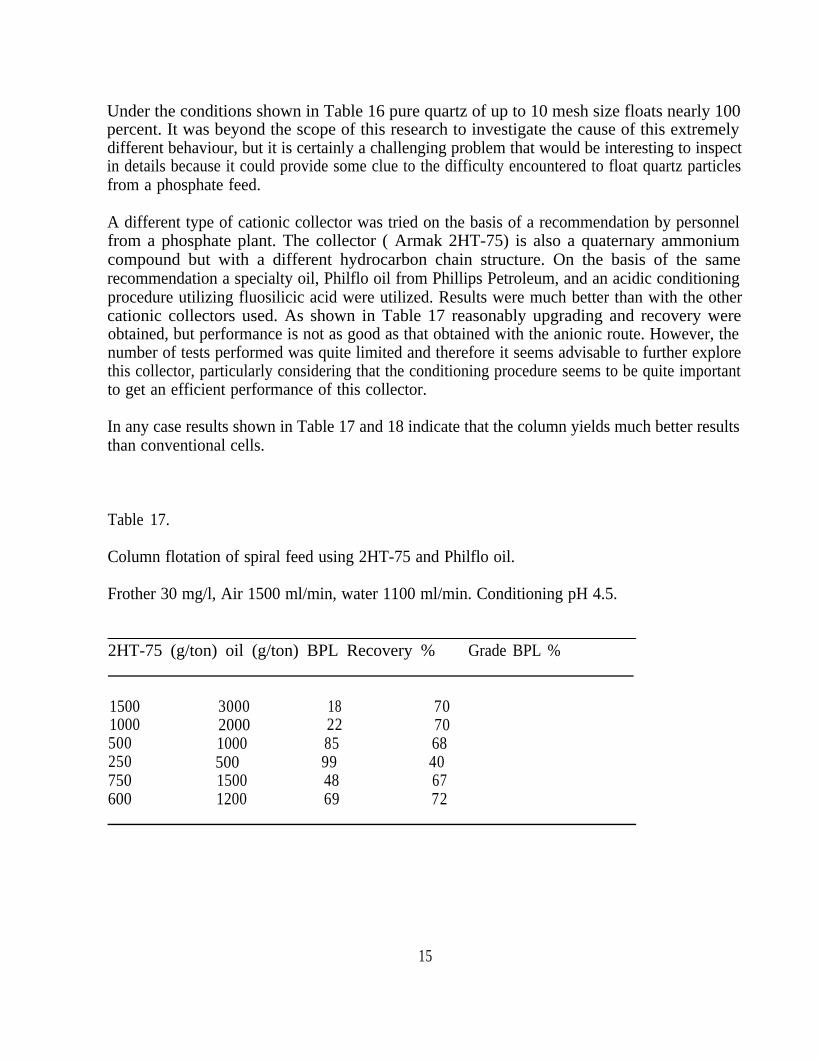
A different type of cationic collector was tried on the basis of a recommendation by personnelfrom a phosphate plant. The collector ( Armak 2HT-75) is also a quaternary ammoniumcompound but with a different hydrocarbon chain structure. On the basis of the samerecommendation a specialty oil, Philflo oil from Phillips Petroleum, and an acidic conditioningprocedure utilizing fluosilicic acid were utilized. Results were much better than with the othercationic collectors used. As shown in Table 17 reasonably upgrading and recovery wereobtained, but performance is not as good as that obtained with the anionic route. However, thenumber of tests performed was quite limited and therefore it seems advisable to further explorethis collector, particularly considering that the conditioning procedure seems to be quite importantto get an efficient performance of this collector.
In any case results shown in Table 17 and 18 indicate that the column yields much better resultsthan conventional cells.
Table 17.
Column flotation of spiral feed using 2HT-75 and Philflo oil.
Frother 30 mg/l, Air 1500 ml/min, water 1100 ml/min. Conditioning pH 4.5.
2HT-75 (g/ton) oil (g/ton) BPL Recovery % Grade BPL %
1500 3000 18 701000 2000 22 70500 1000 85 68250 500 99 40750 1500 48 67600 1200 69 72
15
Table 18
Mechanical cell flotation of spiral feed with 2HT-75 and Philflo oil.Conditions similar to Table 17.
2HT-75 Oil(g/ton) (g/ton)
Recovery % Grade BPL %
500 1000 100 401000 2000 99 401500 3000 85 56
BASIC RESEARCH
Effect of Agitation on Flotation.
For any given flotation system there are three critical impeller velocities that have to be satisfiedsimultaneously, namely: Critical velocity for particles suspension (Cvs), critical velocity for airdispersion (Cva) and critical velocity for bubble-particle detachment (Cvd). It is likely that airdispersion is a phenomena more or less independent on particle size. However, Cvs and Cvdshould both depend on particle size. Intuitively, it can be predicted that larger particles wouldrequire a stronger agitation to keep the solids from settling i.e. a larger Cvs; on the contrary thevalue of Cvd would decrease because a heavier particle would detach more easily from a bubblethan a smaller one.
With small particle sizes a rather wide range of impeller speeds exists where the agitation speedis large enough to exceed Cvs (and therefore fully suspend the particles) and at the same timeagitation is low enough so that Cvd is not reached ( and therefore bubble-particle aggregates arenot destroyed). For this kind of particle size, flotation would present no problems as far assuspension and stability of aggregates is concerned. However, since Cvs increases with particlesize and Cvd decreases, at a given particle size, Cvs will fatally surpass Cvd, and then, at noagitation speed both criteria can be met simultaneously.
Direct determination of Cvd in flotation machines is not possible. But at least the recovery ofparticles as a function of impeller speed and particle size can be measured. Flotation tests of
16
quartz of different particle size were carried out at different impeller velocities below the Cvs.One could expect that increasing agitation should improve recovery due to a better dispersion ofparticles. However, no such an improvement was evident for coarse particles. A plausibleexplanation is that the better dispersion is counter balanced by a lower stability of bubble-particleaggregates due to turbulence. In Table 19 spiral feed recovery as a function of impeller speedis presented.
Table 19.Spiral feed flotation as a function of impeller speed in Agitair cell.Tall oil 1.2 kg/ton, fuel oil 2.4 kg/ton, frother 30 mg/l. Air 2000 ml/min.
RPM BPL Recovery % Grade BPL %
600 58 67700 75 67800 59 55900 35 55
Recovery reaches a maximum at 700 rpm and decreases for higher or lower agitation intensities.At 700 rpm or lower, dispersion of particles was not complete and at 600 rpm or lower,dispersion of air appeared to be insufficient. Additional results are presented in Chapter 3.
As a conclusion we can say that the critical agitation speed for coarse phosphate particles ishigher than the agitation speed at which turbulence starts to destabilize the particle-bubbleaggregates. Thus, increasing energy input to the cell keep particles from settling but results inlower recoveries. Alternatively if the agitation is reduced recovery might increase, (up to a point),but at the expense of sanding the bottom of the cell. Different impeller design or tank geometrymight alleviate this problem, but these tests show that there is an inherent limitation ofconventional cells in the treatment of coarse particles, and that avoiding turbulence should be amajor concern in coarse particles flotation.
Flotation of Pure Quartz
Quartz flotation tests were carried out in the laboratory column in order to evaluate the effect ofvariables such as feed and air flowrates and column height. This model system was chosenbecause it is simpler, more reproducible and easier to work with than the commercial qualityphosphate system. A pure quartz sample analyzing 99.9% insolubles and hexadecyl trimethylammonium bromide (CTAB) collector were used. Particle size distribution of the quartz is shown
17
in Table 20. As seen there this sample is even coarser than the coarse phosphate feeds used inthis study. Tap water at natural pH containing 30 mg/L of aerofroth 65 was circulated throughthe column at a velocity of 11 cm/min (430 ml/min). Unless otherwise indicated air flowrate was1430 ml/min and feed flowrate 200 g/min of quartz at 70 % solids.
Table 20. Particle size distribution of coarse quartz.
Mesh (Tyler) % Retained
10 9.914 29.320 29.228 24.135 6.848 0.5
-48 0.1
In Figure 3 quartz recovery for three different collector concentrations as a function of columnheight are presented. In this figure “height” means the distance between the feeding point and theaerator. In previous testing a 55 cm height was standard. It can be seen that by increasing theheight to 130 cm, recovery increases about 10-15 %.
It is also clear in figure 3 that collector concentration is extremely important and that totalrecovery is possible with a short column if the collector dosage is high enough. According tothese data a full size column of just 1.5 to 2.0 meters should provide adequate residence time tofloat a properly hydrophobized mineral. In this respect far more important than the residence timeseems to be an adequate collector dosage.
18
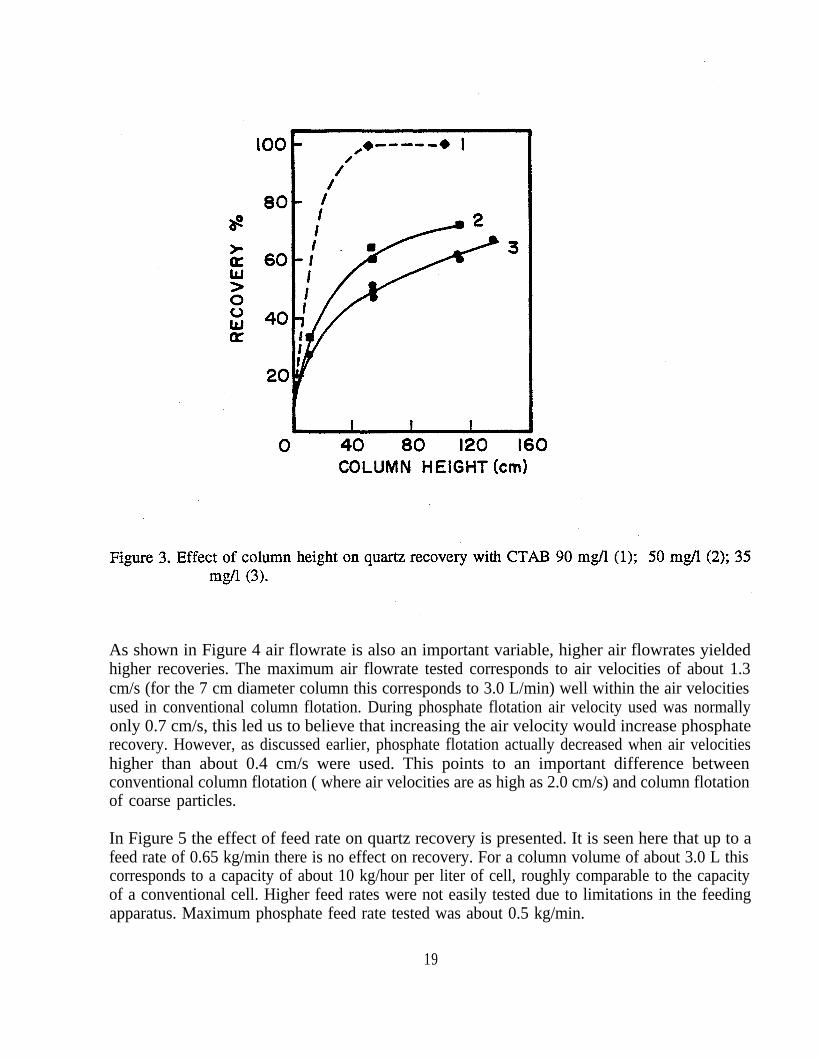
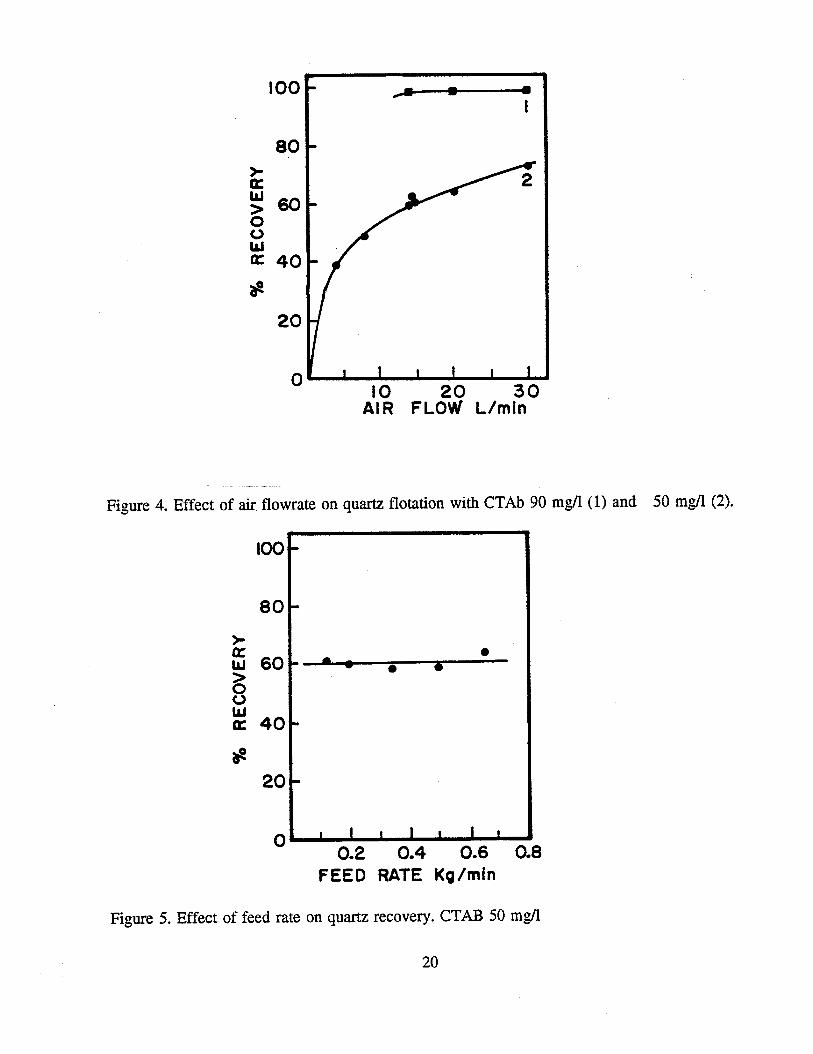
As shown in Figure 4 air flowrate is also an important variable, higher air flowrates yieldedhigher recoveries. The maximum air flowrate tested corresponds to air velocities of about 1.3cm/s (for the 7 cm diameter column this corresponds to 3.0 L/min) well within the air velocitiesused in conventional column flotation. During phosphate flotation air velocity used was normallyonly 0.7 cm/s, this led us to believe that increasing the air velocity would increase phosphaterecovery. However, as discussed earlier, phosphate flotation actually decreased when air velocitieshigher than about 0.4 cm/s were used. This points to an important difference betweenconventional column flotation ( where air velocities are as high as 2.0 cm/s) and column flotationof coarse particles.
In Figure 5 the effect of feed rate on quartz recovery is presented. It is seen here that up to afeed rate of 0.65 kg/min there is no effect on recovery. For a column volume of about 3.0 L thiscorresponds to a capacity of about 10 kg/hour per liter of cell, roughly comparable to the capacityof a conventional cell. Higher feed rates were not easily tested due to limitations in the feedingapparatus. Maximum phosphate feed rate tested was about 0.5 kg/min.
19
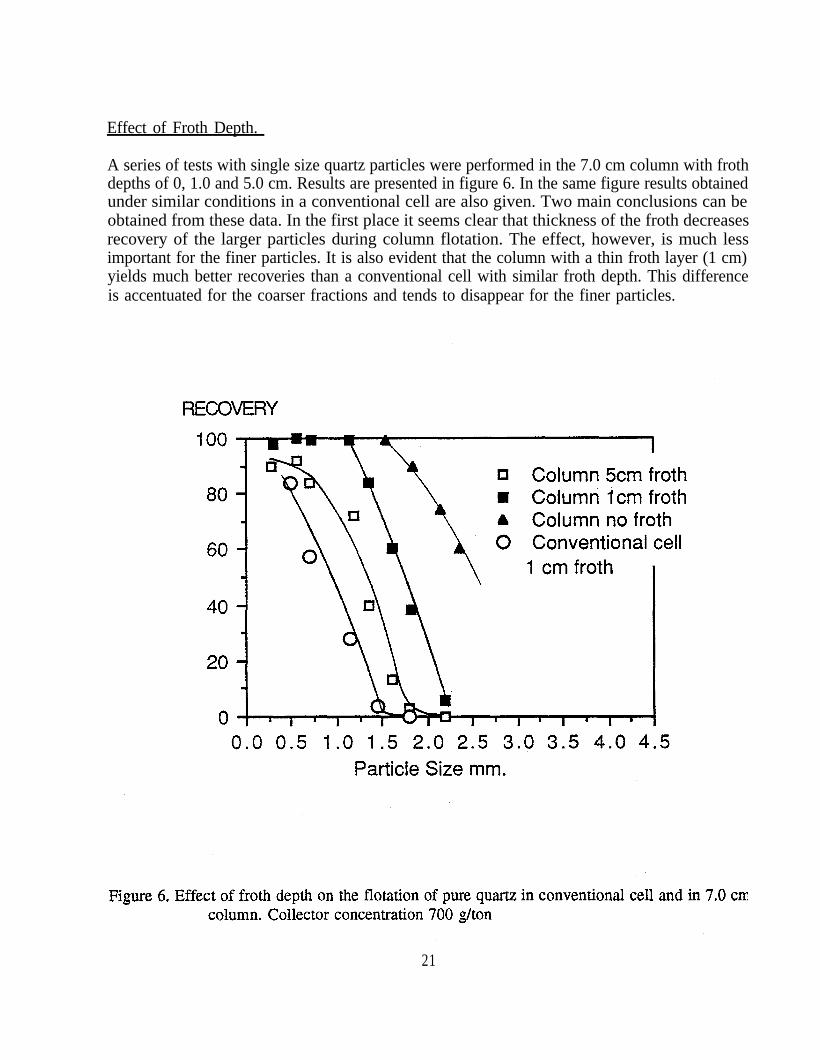
Effect of Froth Depth.
A series of tests with single size quartz particles were performed in the 7.0 cm column with frothdepths of 0, 1.0 and 5.0 cm. Results are presented in figure 6. In the same figure results obtainedunder similar conditions in a conventional cell are also given. Two main conclusions can beobtained from these data. In the first place it seems clear that thickness of the froth decreasesrecovery of the larger particles during column flotation. The effect, however, is much lessimportant for the finer particles. It is also evident that the column with a thin froth layer (1 cm)yields much better recoveries than a conventional cell with similar froth depth. This differenceis accentuated for the coarser fractions and tends to disappear for the finer particles.
21
Entrainment of fine quartz.
The entrainment of quartz particles by an upwards flow of water was determined in columnflotation test performed in the presence of frother but without addition of any collector. Sometests were carried out with single size fractions and others with a sample of a size distributionshown in table 21. One kg wet samples were fed to the column like in a normal flotationexperiment. Unless otherwise indicated air flowrate was 1500 ml/min, feeding time was 5minutes and the feeding tube was located at a depth of 20 cm.
Table 21. Particle size distribution of fine quartz sample.
Mesh (Tyler) % Retained
28 1.935 16.048 34.165 23.7150 20.1200 3.0
-200 1.1
As shown in table 22, water flowrate was the most important factor in controlling entrainment,on the other hand the effect of air flowrate seems minor.(see also Table 24)
Table 22. Effect of water flowrate on quartz entrainment
Water Flowrate(ml/min)
Entrainment%
0 0.2200 0.2400 0.8800 1.41100 2.5
22
The effect of depth of feeding point is shown in table 23. It is evident from the results shownin this table that entrainment can be controlled by adjusting the depth of feeding and that a fewcentimetres are enough to reduce the entrainment to negligible levels. The entrainment ofparticles larger than 150 mesh was practically nil.
Table 23. Effect of depth of feeding point on quartz entrainmentat a water flowrate of 800 ml/min.
Depth (cm) Entrainment %
0 3.420 1.640 0.975 0.2
Table 24. Effect of air flowrate on entrainment.
Air flowrate(ml/min)
Entrainment %
Water Flowrate (ml/min)0 430
400 0.99 (?)800 0.14 0.731500 0.112400 0.163300 0.78 1.5
23
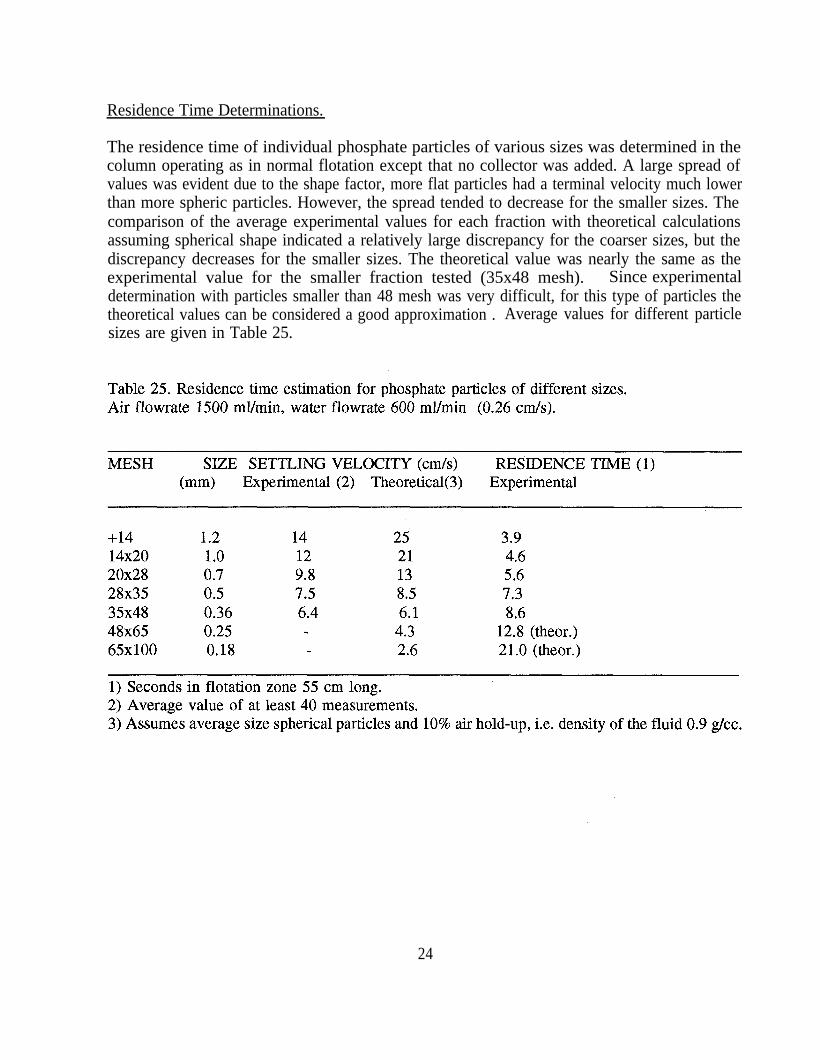
Residence Time Determinations.
The residence time of individual phosphate particles of various sizes was determined in thecolumn operating as in normal flotation except that no collector was added. A large spread ofvalues was evident due to the shape factor, more flat particles had a terminal velocity much lowerthan more spheric particles. However, the spread tended to decrease for the smaller sizes. Thecomparison of the average experimental values for each fraction with theoretical calculationsassuming spherical shape indicated a relatively large discrepancy for the coarser sizes, but thediscrepancy decreases for the smaller sizes. The theoretical value was nearly the same as theexperimental value for the smaller fraction tested (35x48 mesh). Since experimentaldetermination with particles smaller than 48 mesh was very difficult, for this type of particles thetheoretical values can be considered a good approximation . Average values for different particlesizes are given in Table 25.
24
CHAPTER II
PILOT TESTING
COLUMN SCALE UP
The conventional scale up procedure for conventional columns involves the experimentaldetermination of the flotation rate constants, the so called “carrying capacity” limitation, andthen an estimation of the axial dispersion factor that reduces the residence time of the mineralparticles in the collection zone of the column. More recently a lip discharge limitation has beenconsidered for very large diameter columns. In the case of a frothless column to treat coarseparticles any limitation by carrying capacity or lip discharge can be neglected. Also it can beassumed that the flow regime of the particles is plug type so no dispersion factors or short-circuiting problems need to be considered. If this is the case, the residence time of the particlesis simply the time that it takes the particles to settle from the feeding point down to the aeratorlevel at the bottom. Residence time is then a direct function of column height, particle size anddensity.
If we accept these basic points, the scale up procedure is quite simple: Capacity of the columnis scaled up as a direct ratio of the column surface. Column length is maintained essentiallyconstant in order to keep a constant residence (i.e. flotation ) time. (In practice some allowancefor a good radial distribution of air and feed would make it necessary to increase the columnlength as the surface of the column is scaled up.). Operating variables such as air and water flowrates and sparger surface should also be scaled up as a direct function of column surface. In otherwords this means to maintain constant air and water velocities and a constant aeratorsurface/column surface ratio. Accordingly, to scale up our laboratory column 7.0 cm diameterto a 1.0 foot unit we used the following criteria:
25
Column length (collection zone only): 4 feet. (This would give a residence time of the order of10 seconds).
Cleaning zone: 1 foot
Aerator surface: At least 50% of the column surface
Air Velocity: 0.6 cm/s
Water Velocity: 0.5 cm/s
Estimated Capacity: at least 0.5, tph (based on a laboratory capacity of about 0.7 tph/sq.foot)
THE PILOT COLUMN
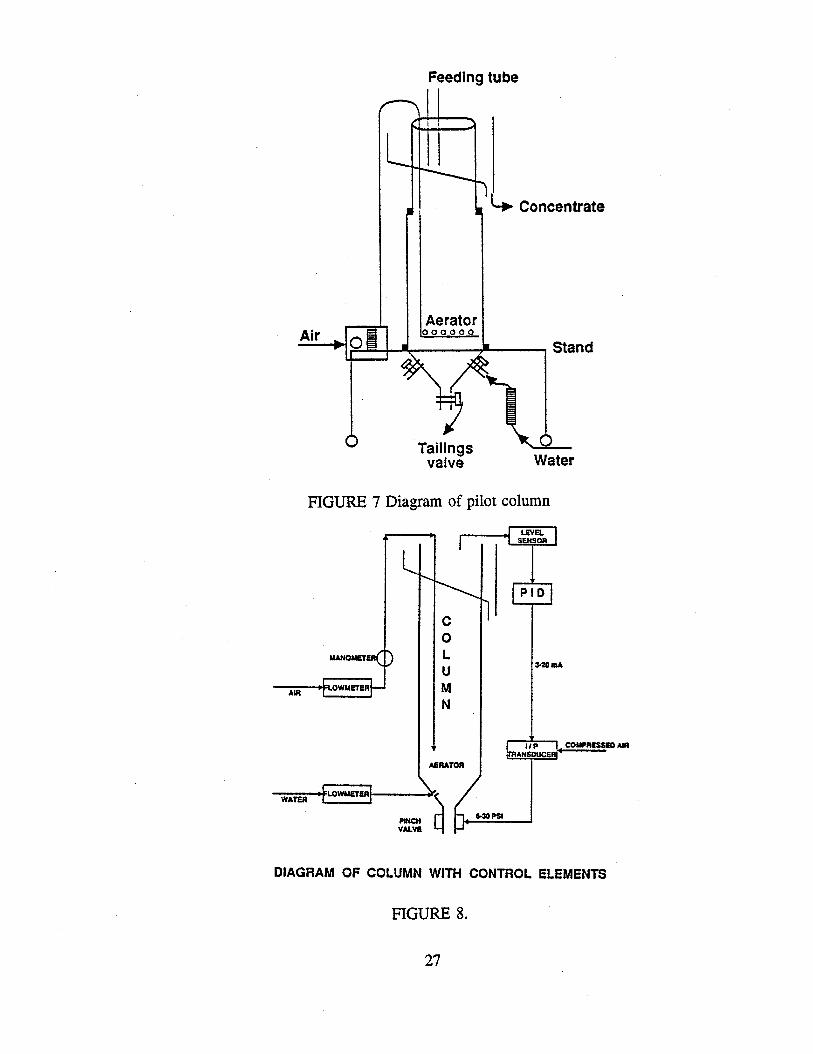
The column body was made of a transparent plexiglass tube (1.0' external diameter) to facilitatevisual observation. The conical bottom was made of stainless steel l/4" thick. The body wasdivided in three sections. Two intermediate sections 4' and 2.5' long respectively and an uppersection 1.5' long with a squarely shaped concentrate launder. The different sections were sealedwith rubber gaskets and bolted together. Feeding was done by introducing a two inch diametertube at the centre of the column to a depth of about one feet. The zone of the column above theend of the feeding tube can be considered a “cleaning zone”. For most of the testing only oneof the intermediate sections was used, thus the column length was just 5.5'. Out of this, aboutone foot corresponded to the “cleaning zone”, and therefore the collection, or active zone, wasjust 4.5' long. A diagram of the column is shown in Figure 7. As seen there, the conical bottomsection has two spigots to add the water necessary to obtain the elutriation effect. It also has a1 inch valve for regulating the tailings flow. The column is selfsupported by a 3'x3' mobilestructure made of square steel tubes.Instrumentation incorporated to the pilot column was quite modest, but enough for a propercontrol during operation. Instrumentation included flowmeters to measure the air and waterflowrates, manometer to determine air pressure and a manometer connected to the column toestimate air hold up. During testing variables such as feed, air, and water flows were keptconstant and tailings flow rate adjusted manually to the minimum necessary to avoidaccumulation of tailings in the bottom of the column. This way an upwards flow of water wasalways prevalent in the column. A commercial column should have automatic control of thetailings flow because fluctuations in the feed rate or feed grade make it necessary to adjust quiteoften the tailings flow rate in order to keep a steady state. Other variables do not need frequentregulation and they can therefore be set to the desired value manually.
After the pilot test was completed, additional instrumentation was incorporated to automaticallycontrol the tailings flow. This is shown in Figure 8 but it has not been tested in an actualcontinuous operation.
26
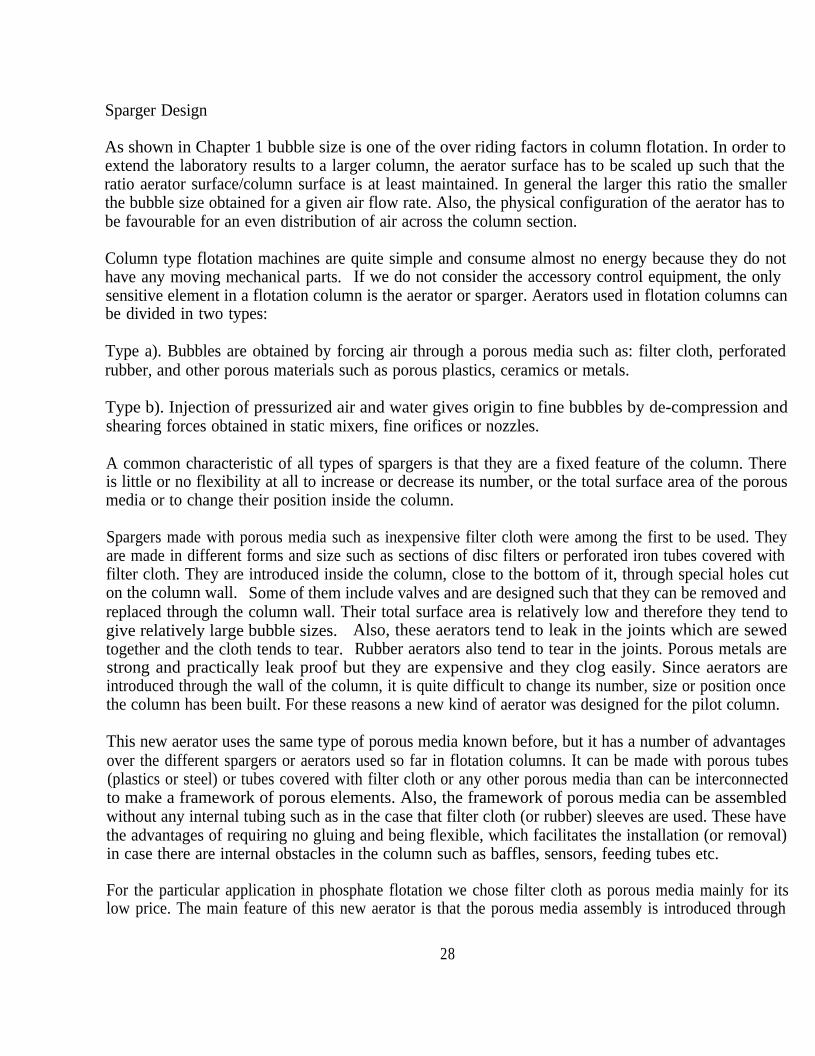
Sparger Design
As shown in Chapter 1 bubble size is one of the over riding factors in column flotation. In order toextend the laboratory results to a larger column, the aerator surface has to be scaled up such that theratio aerator surface/column surface is at least maintained. In general the larger this ratio the smallerthe bubble size obtained for a given air flow rate. Also, the physical configuration of the aerator has tobe favourable for an even distribution of air across the column section.
Column type flotation machines are quite simple and consume almost no energy because they do nothave any moving mechanical parts. If we do not consider the accessory control equipment, the onlysensitive element in a flotation column is the aerator or sparger. Aerators used in flotation columns canbe divided in two types:
Type a). Bubbles are obtained by forcing air through a porous media such as: filter cloth, perforatedrubber, and other porous materials such as porous plastics, ceramics or metals.
Type b). Injection of pressurized air and water gives origin to fine bubbles by de-compression andshearing forces obtained in static mixers, fine orifices or nozzles.
A common characteristic of all types of spargers is that they are a fixed feature of the column. Thereis little or no flexibility at all to increase or decrease its number, or the total surface area of the porousmedia or to change their position inside the column.
Spargers made with porous media such as inexpensive filter cloth were among the first to be used. Theyare made in different forms and size such as sections of disc filters or perforated iron tubes covered withfilter cloth. They are introduced inside the column, close to the bottom of it, through special holes cuton the column wall. Some of them include valves and are designed such that they can be removed andreplaced through the column wall. Their total surface area is relatively low and therefore they tend togive relatively large bubble sizes. Also, these aerators tend to leak in the joints which are sewedtogether and the cloth tends to tear. Rubber aerators also tend to tear in the joints. Porous metals arestrong and practically leak proof but they are expensive and they clog easily. Since aerators areintroduced through the wall of the column, it is quite difficult to change its number, size or position oncethe column has been built. For these reasons a new kind of aerator was designed for the pilot column.
This new aerator uses the same type of porous media known before, but it has a number of advantagesover the different spargers or aerators used so far in flotation columns. It can be made with porous tubes(plastics or steel) or tubes covered with filter cloth or any other porous media than can be interconnectedto make a framework of porous elements. Also, the framework of porous media can be assembledwithout any internal tubing such as in the case that filter cloth (or rubber) sleeves are used. These havethe advantages of requiring no gluing and being flexible, which facilitates the installation (or removal)in case there are internal obstacles in the column such as baffles, sensors, feeding tubes etc.
For the particular application in phosphate flotation we chose filter cloth as porous media mainly for itslow price. The main feature of this new aerator is that the porous media assembly is introduced through
28
the top of the column. This allows a great deal of flexibility regarding replacement, modifications andmaintenance of the sparger. These operations could all be made while the column is operating. Onesingle aerator could have more than one framework of porous elements connected to a single air tubeat different heights. In this way the total surface of porous media can be very large and thereforesmaller bubbles and/or higher flow rates can be obtained.
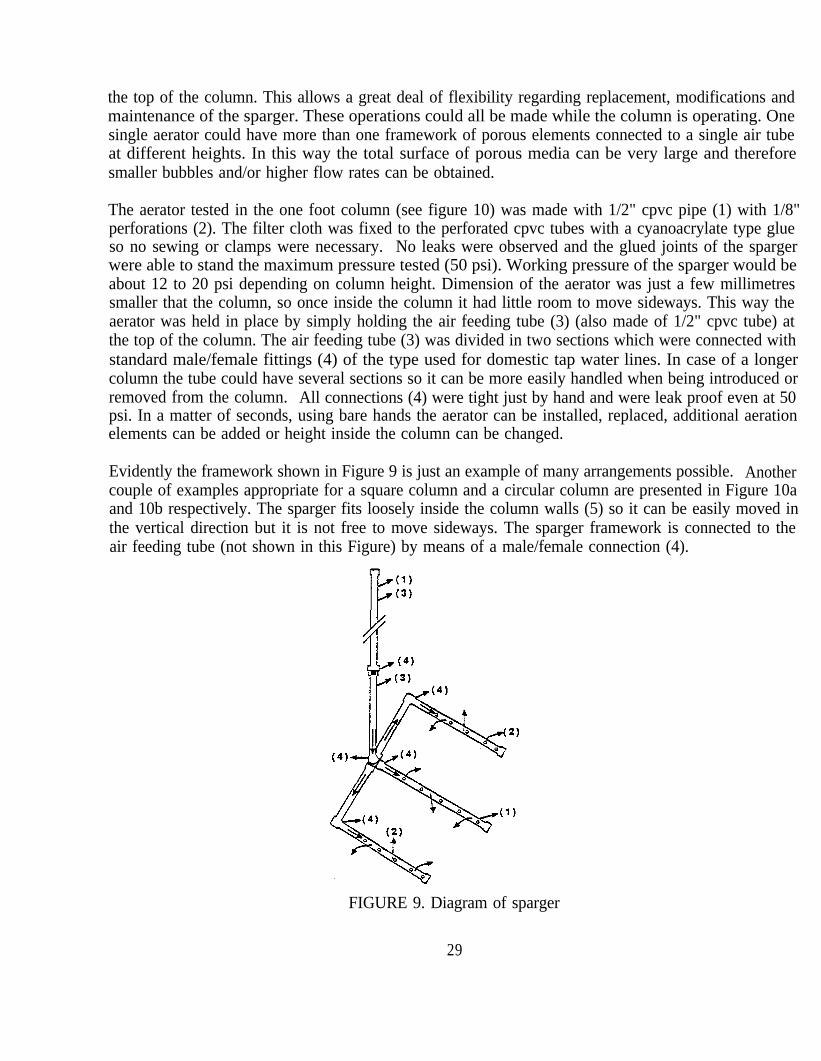
The aerator tested in the one foot column (see figure 10) was made with 1/2" cpvc pipe (1) with 1/8"perforations (2). The filter cloth was fixed to the perforated cpvc tubes with a cyanoacrylate type glueso no sewing or clamps were necessary. No leaks were observed and the glued joints of the spargerwere able to stand the maximum pressure tested (50 psi). Working pressure of the sparger would beabout 12 to 20 psi depending on column height. Dimension of the aerator was just a few millimetressmaller that the column, so once inside the column it had little room to move sideways. This way theaerator was held in place by simply holding the air feeding tube (3) (also made of 1/2" cpvc tube) atthe top of the column. The air feeding tube (3) was divided in two sections which were connected withstandard male/female fittings (4) of the type used for domestic tap water lines. In case of a longercolumn the tube could have several sections so it can be more easily handled when being introduced orremoved from the column. All connections (4) were tight just by hand and were leak proof even at 50psi. In a matter of seconds, using bare hands the aerator can be installed, replaced, additional aerationelements can be added or height inside the column can be changed.
Evidently the framework shown in Figure 9 is just an example of many arrangements possible. Anothercouple of examples appropriate for a square column and a circular column are presented in Figure 10aand 10b respectively. The sparger fits loosely inside the column walls (5) so it can be easily moved inthe vertical direction but it is not free to move sideways. The sparger framework is connected to theair feeding tube (not shown in this Figure) by means of a male/female connection (4).
FIGURE 9. Diagram of sparger
29
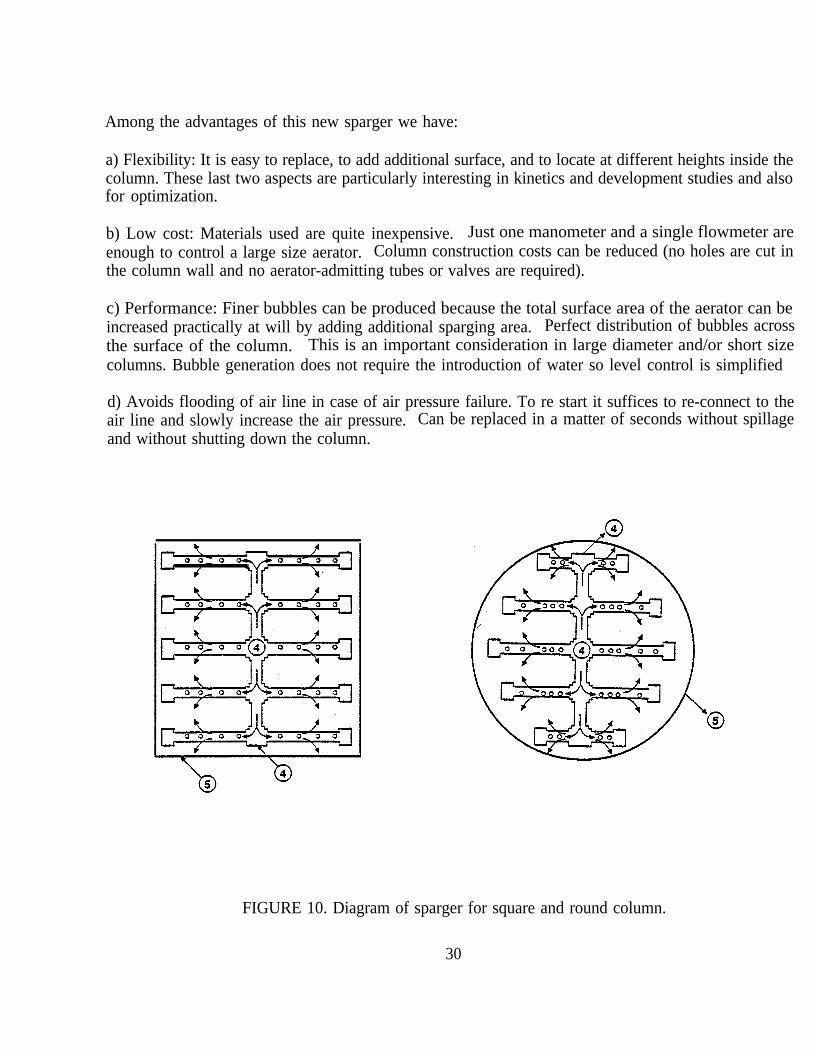
Among the advantages of this new sparger we have:
a) Flexibility: It is easy to replace, to add additional surface, and to locate at different heights inside thecolumn. These last two aspects are particularly interesting in kinetics and development studies and alsofor optimization.
b) Low cost: Materials used are quite inexpensive. Just one manometer and a single flowmeter areenough to control a large size aerator. Column construction costs can be reduced (no holes are cut inthe column wall and no aerator-admitting tubes or valves are required).
c) Performance: Finer bubbles can be produced because the total surface area of the aerator can beincreased practically at will by adding additional sparging area. Perfect distribution of bubbles acrossthe surface of the column. This is an important consideration in large diameter and/or short sizecolumns. Bubble generation does not require the introduction of water so level control is simplified
d) Avoids flooding of air line in case of air pressure failure. To re start it suffices to re-connect to theair line and slowly increase the air pressure. Can be replaced in a matter of seconds without spillageand without shutting down the column.
FIGURE 10. Diagram of sparger for square and round column.
30
Description of the Pilot Test
The column was installed in the spirals section of IMC’s Noralyn plant and fed by gravity with spiralfeed taken directly from one of the feed distributors by means of a 3' diameter pipe. No reagents at allwere added to the feed and this was sent “as is” to the column. We did not have any control on theamount of reagents or the pulp density or the particle size distribution of the feed. For this reason itcan be argued that this was not necessarily a favourable feed for column flotation. For example the pulpdensity of about 30% was way too low for the best performance of the column. Too much water in thefeed means that little additional water can be added at the bottom of the column to achieve the netupwards flow of water necessary for elutriation of bubble-particle agglomerates. Instead, feed watershort-circuits directly to the concentrate contributing to entrainment of fine sand. In spite of these lessthan ideal characteristics of the feed, the pilot test can be characterized as a remarkable success. A totalof 17 tests were performed in a period of 5 operating days with feed rates of 0.8 to 1.4 tph. Accordingto information provided by IMC, collector dosage added to the spiral feed during testing was 3.7 and4.0 lbs per tonne (of concentrate) of fuel oil and soap respectively. The only reagent added to the columnwas a small amount of frother in the water introduced at the bottom of the column.
Each test lasted for at least a couple of hours in which operating variables were kept constant at adesired value and then samples of the feed, tailings and concentrate were taken for analysis. All sampleswere analyzed for BPL and insolubles at IMC’s laboratory. Additional chemical assays and particle sizedistributions were determined at Laval.
RESULTS
The spirals section at Noralyn does not run continuously and frequent interruptions of feeding wereexperienced. Also some drastic changes in the feed characteristics occurred during testing. For examplethe first couple of days the feed was high grade (42% BPL) and coarsely sized. After that, feed waslower grade (36% BPL) and finer. Particle size distributions of both types of feed are presented inTables 26 and 27 . The best results were obtained with the higher grade feed.
31
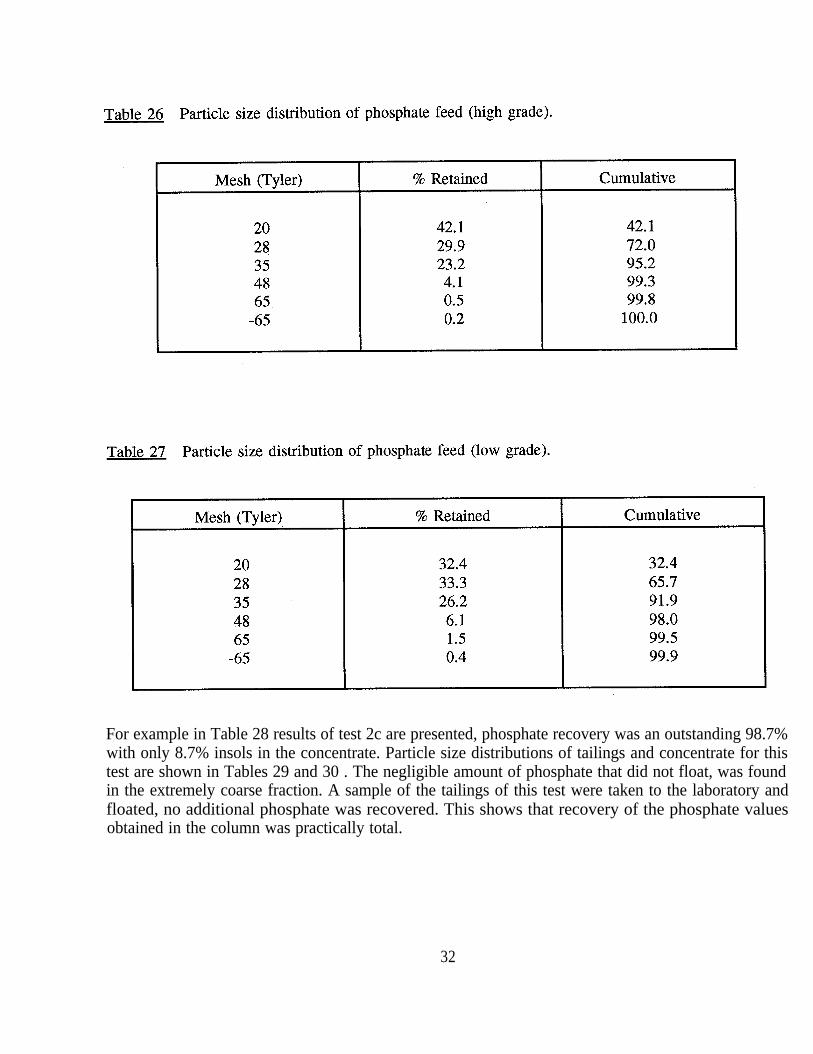
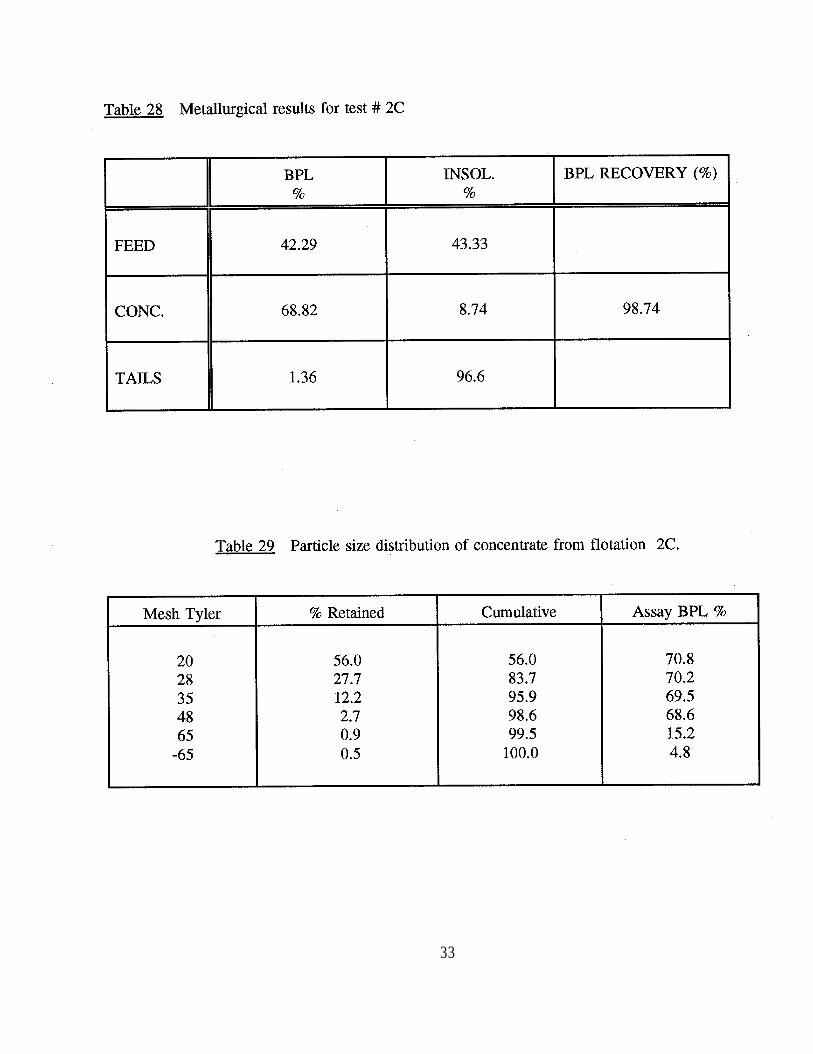
For example in Table 28 results of test 2c are presented, phosphate recovery was an outstanding 98.7%with only 8.7% insols in the concentrate. Particle size distributions of tailings and concentrate for thistest are shown in Tables 29 and 30 . The negligible amount of phosphate that did not float, was foundin the extremely coarse fraction. A sample of the tailings of this test were taken to the laboratory andfloated, no additional phosphate was recovered. This shows that recovery of the phosphate valuesobtained in the column was practically total.
32
33
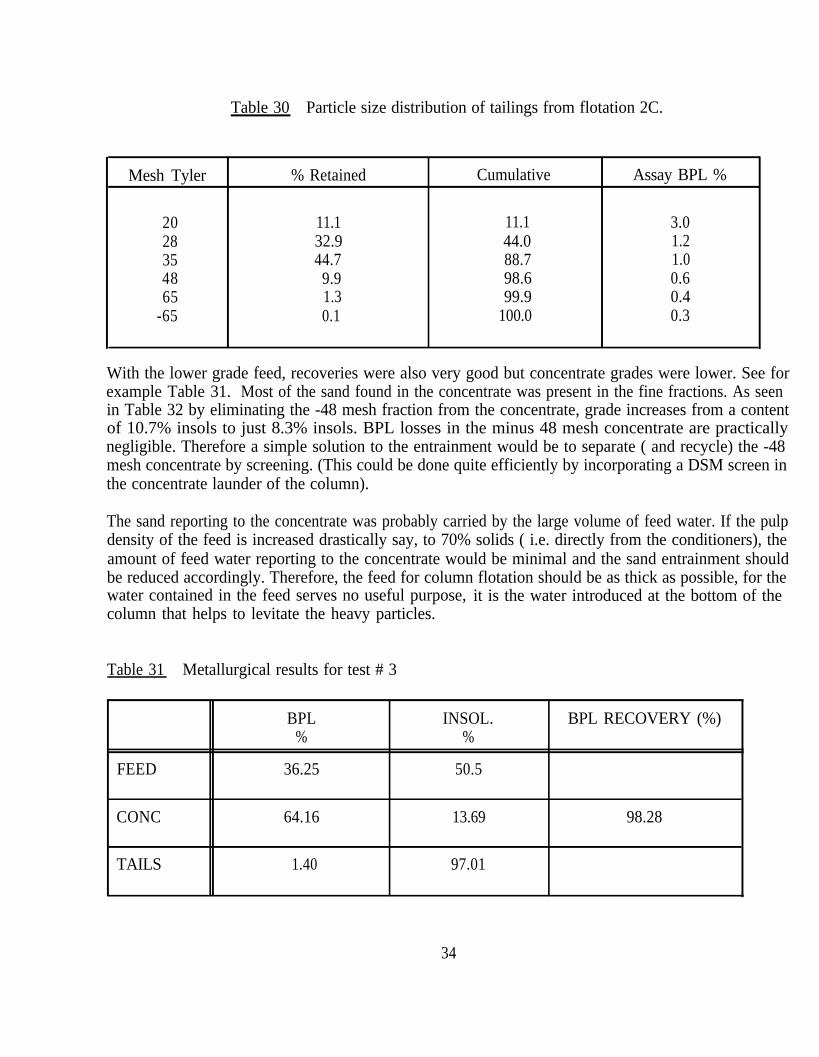
Table 30 Particle size distribution of tailings from flotation 2C.
Mesh Tyler % Retained Cumulative Assay BPL %
20 11.1 11.1 3.028 32.9 44.0 1.235 44.7 88.7 1.048 9.9 98.6 0.665 1.3 99.9 0.4
-65 0.1 100.0 0.3
With the lower grade feed, recoveries were also very good but concentrate grades were lower. See forexample Table 31. Most of the sand found in the concentrate was present in the fine fractions. As seenin Table 32 by eliminating the -48 mesh fraction from the concentrate, grade increases from a contentof 10.7% insols to just 8.3% insols. BPL losses in the minus 48 mesh concentrate are practicallynegligible. Therefore a simple solution to the entrainment would be to separate ( and recycle) the -48mesh concentrate by screening. (This could be done quite efficiently by incorporating a DSM screen inthe concentrate launder of the column).
The sand reporting to the concentrate was probably carried by the large volume of feed water. If the pulpdensity of the feed is increased drastically say, to 70% solids ( i.e. directly from the conditioners), theamount of feed water reporting to the concentrate would be minimal and the sand entrainment shouldbe reduced accordingly. Therefore, the feed for column flotation should be as thick as possible, for thewater contained in the feed serves no useful purpose, it is the water introduced at the bottom of thecolumn that helps to levitate the heavy particles.
Table 31 Metallurgical results for test # 3
FEED
CONC
TAILS
BPL INSOL.% %
36.25 50.5
64.16 13.69
1.40 97.01
BPL RECOVERY (%)
98.28
34
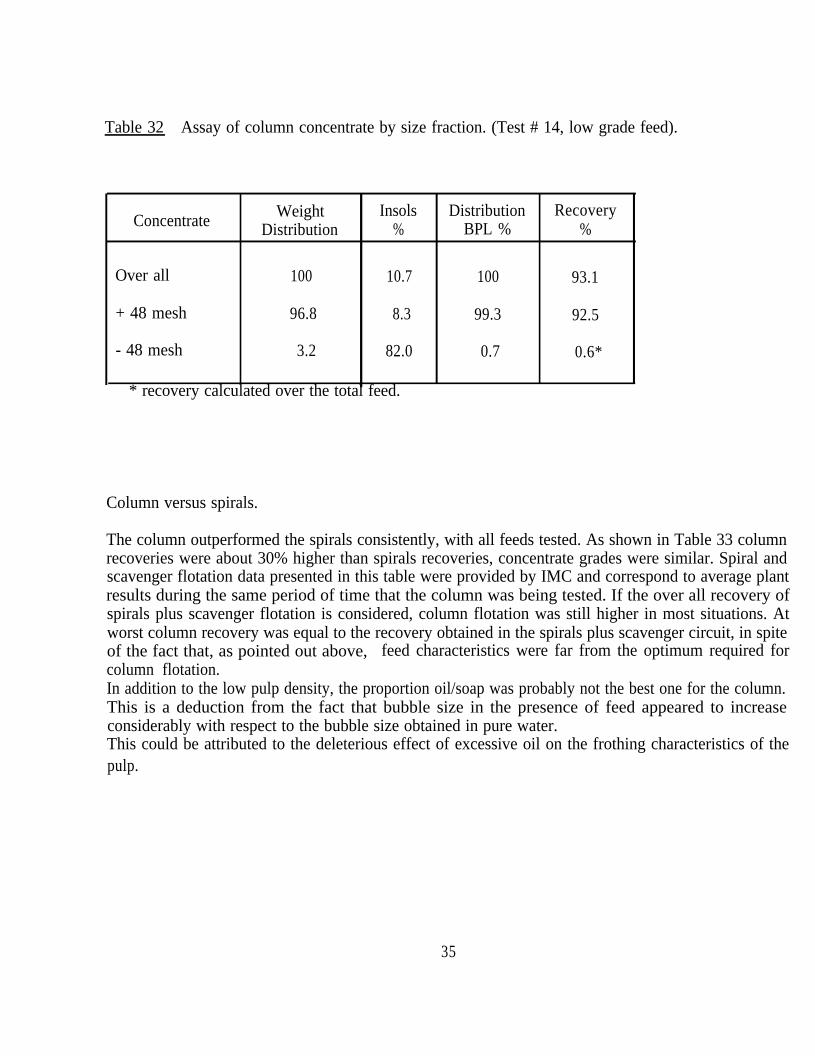
* recovery calculated over the total feed.
Concentrate
Over all
+ 48 mesh
- 48 mesh
Weight Insols Distribution RecoveryDistribution % BPL % %
100 10.7 100 93.1
96.8 8.3 99.3 92.5
3.2 82.0 0.7 0.6*
Table 32 Assay of column concentrate by size fraction. (Test # 14, low grade feed).
Column versus spirals.
The column outperformed the spirals consistently, with all feeds tested. As shown in Table 33 columnrecoveries were about 30% higher than spirals recoveries, concentrate grades were similar. Spiral andscavenger flotation data presented in this table were provided by IMC and correspond to average plantresults during the same period of time that the column was being tested. If the over all recovery ofspirals plus scavenger flotation is considered, column flotation was still higher in most situations. Atworst column recovery was equal to the recovery obtained in the spirals plus scavenger circuit, in spiteof the fact that, as pointed out above, feed characteristics were far from the optimum required forcolumn flotation.In addition to the low pulp density, the proportion oil/soap was probably not the best one for the column.This is a deduction from the fact that bubble size in the presence of feed appeared to increaseconsiderably with respect to the bubble size obtained in pure water.This could be attributed to the deleterious effect of excessive oil on the frothing characteristics of thepulp.
35
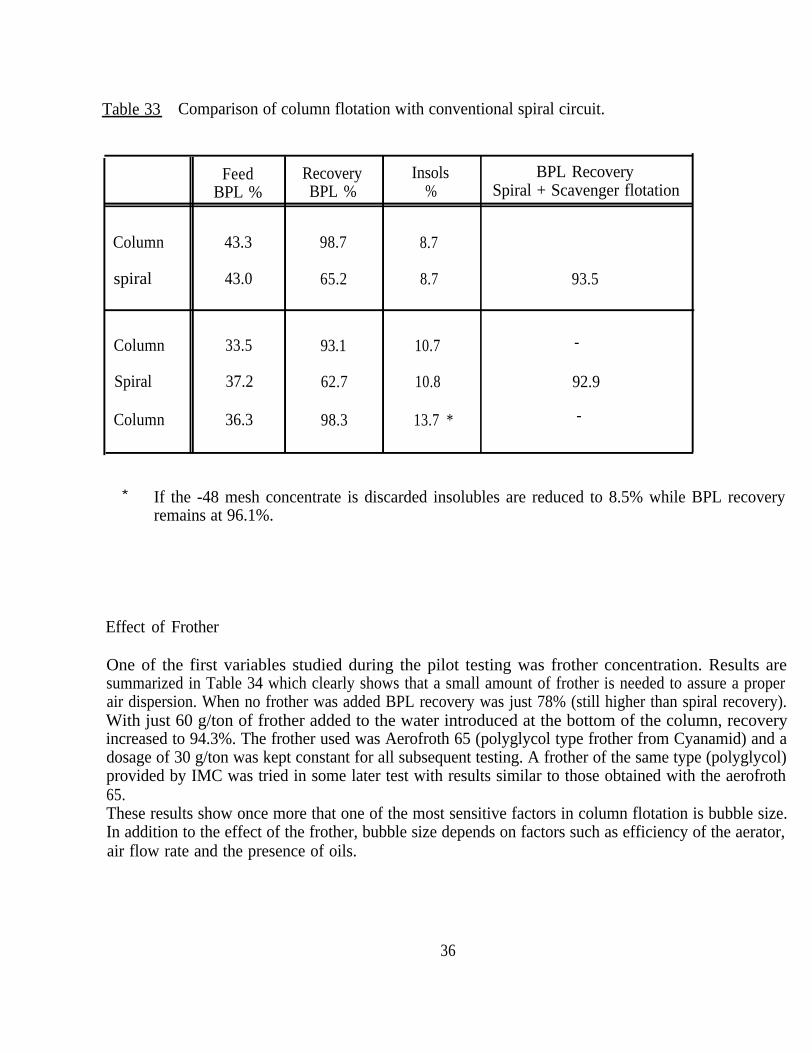
Table 33 Comparison of column flotation with conventional spiral circuit.
Column
spiral
Feed RecoveryBPL % BPL %
43.3 98.7
43.0 65.2
Insols%
8.7
8.7
BPL RecoverySpiral + Scavenger flotation
93.5
Column 33.5 93.1 10.7
Spiral 37.2 62.7 10.8 92.9
Column 36.3 98.3 13.7 *
* If the -48 mesh concentrate is discarded insolubles are reduced to 8.5% while BPL recoveryremains at 96.1%.
Effect of Frother
One of the first variables studied during the pilot testing was frother concentration. Results aresummarized in Table 34 which clearly shows that a small amount of frother is needed to assure a properair dispersion. When no frother was added BPL recovery was just 78% (still higher than spiral recovery).With just 60 g/ton of frother added to the water introduced at the bottom of the column, recoveryincreased to 94.3%. The frother used was Aerofroth 65 (polyglycol type frother from Cyanamid) and adosage of 30 g/ton was kept constant for all subsequent testing. A frother of the same type (polyglycol)provided by IMC was tried in some later test with results similar to those obtained with the aerofroth65.These results show once more that one of the most sensitive factors in column flotation is bubble size.In addition to the effect of the frother, bubble size depends on factors such as efficiency of the aerator,air flow rate and the presence of oils.
36
-
-
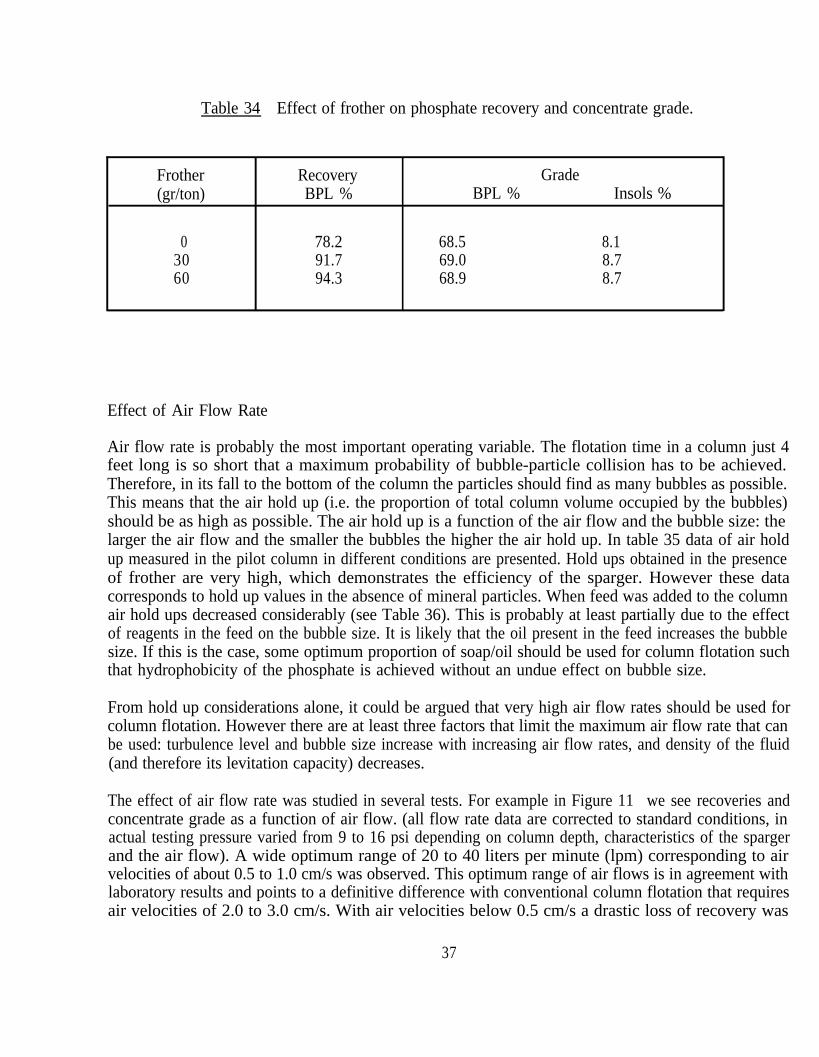
Table 34 Effect of frother on phosphate recovery and concentrate grade.
Frother Recovery(gr/ton) BPL %
0 78.230 91.760 94.3
GradeBPL % Insols %
68.5 8.169.0 8.768.9 8.7
Effect of Air Flow Rate
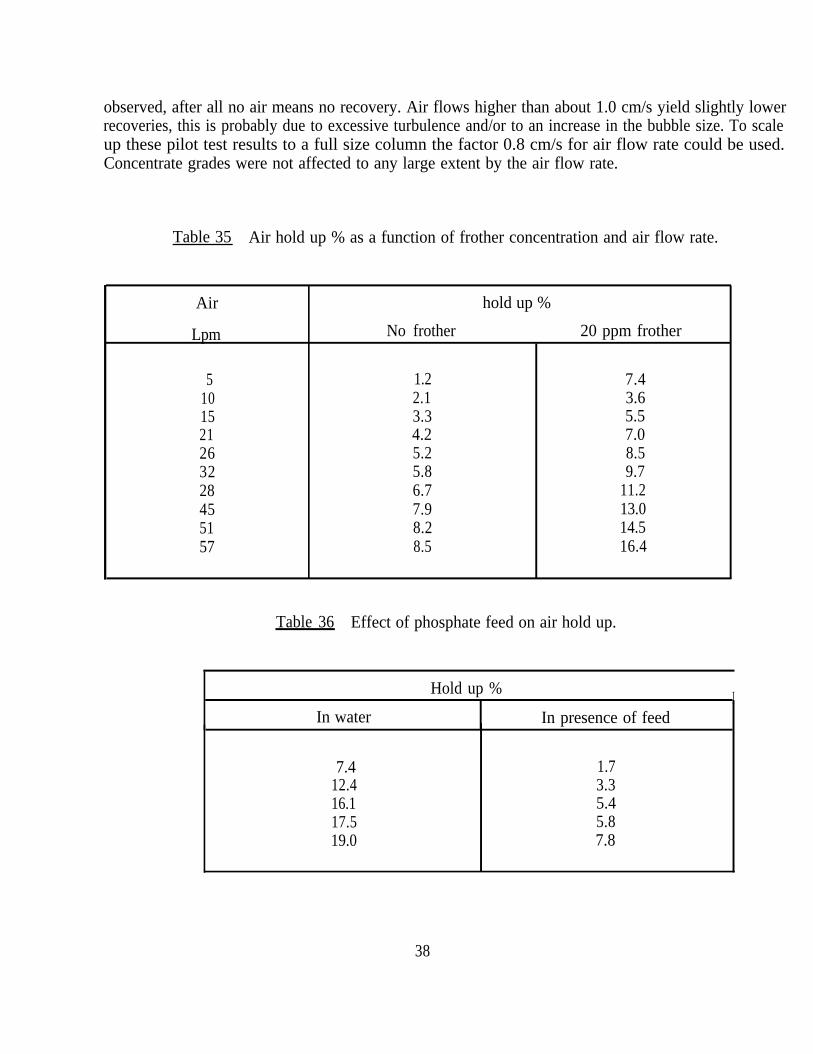
Air flow rate is probably the most important operating variable. The flotation time in a column just 4feet long is so short that a maximum probability of bubble-particle collision has to be achieved.Therefore, in its fall to the bottom of the column the particles should find as many bubbles as possible.This means that the air hold up (i.e. the proportion of total column volume occupied by the bubbles)should be as high as possible. The air hold up is a function of the air flow and the bubble size: thelarger the air flow and the smaller the bubbles the higher the air hold up. In table 35 data of air holdup measured in the pilot column in different conditions are presented. Hold ups obtained in the presenceof frother are very high, which demonstrates the efficiency of the sparger. However these datacorresponds to hold up values in the absence of mineral particles. When feed was added to the columnair hold ups decreased considerably (see Table 36). This is probably at least partially due to the effectof reagents in the feed on the bubble size. It is likely that the oil present in the feed increases the bubblesize. If this is the case, some optimum proportion of soap/oil should be used for column flotation suchthat hydrophobicity of the phosphate is achieved without an undue effect on bubble size.
From hold up considerations alone, it could be argued that very high air flow rates should be used forcolumn flotation. However there are at least three factors that limit the maximum air flow rate that canbe used: turbulence level and bubble size increase with increasing air flow rates, and density of the fluid(and therefore its levitation capacity) decreases.
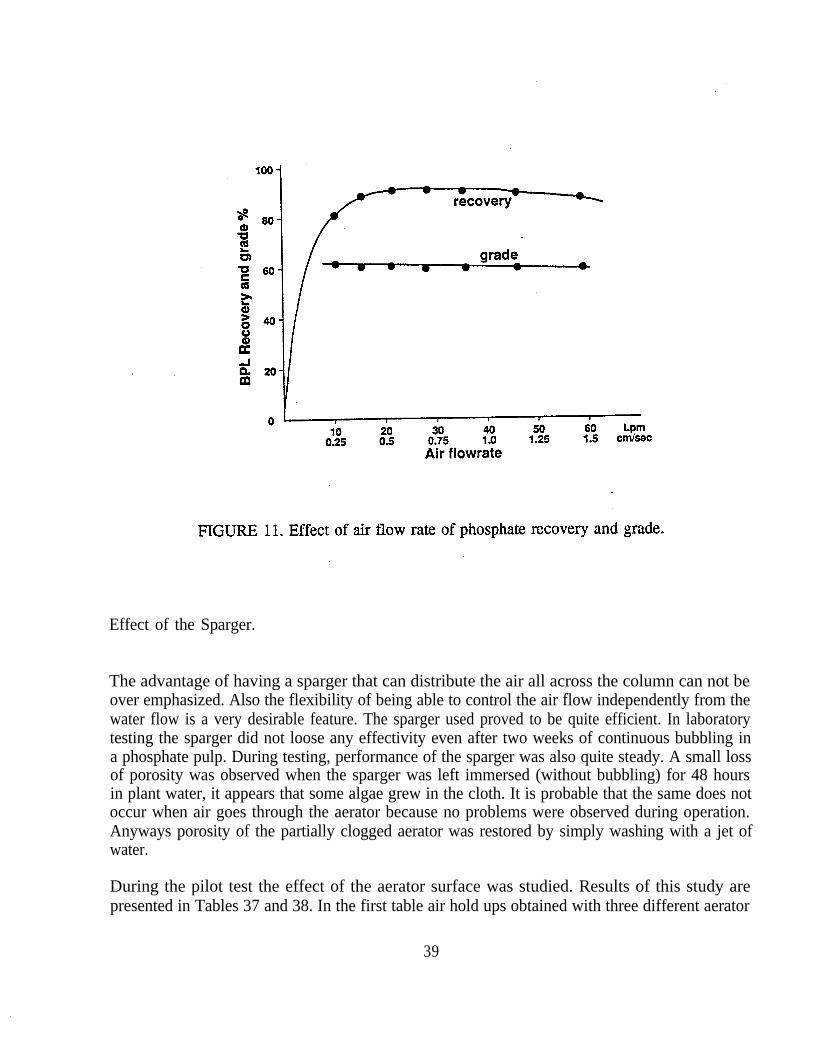
The effect of air flow rate was studied in several tests. For example in Figure 11 we see recoveries andconcentrate grade as a function of air flow. (all flow rate data are corrected to standard conditions, inactual testing pressure varied from 9 to 16 psi depending on column depth, characteristics of the spargerand the air flow). A wide optimum range of 20 to 40 liters per minute (lpm) corresponding to airvelocities of about 0.5 to 1.0 cm/s was observed. This optimum range of air flows is in agreement withlaboratory results and points to a definitive difference with conventional column flotation that requiresair velocities of 2.0 to 3.0 cm/s. With air velocities below 0.5 cm/s a drastic loss of recovery was
37
observed, after all no air means no recovery. Air flows higher than about 1.0 cm/s yield slightly lowerrecoveries, this is probably due to excessive turbulence and/or to an increase in the bubble size. To scaleup these pilot test results to a full size column the factor 0.8 cm/s for air flow rate could be used.Concentrate grades were not affected to any large extent by the air flow rate.
Table 35 Air hold up % as a function of frother concentration and air flow rate.
Air hold up %
Lpm No frother 20 ppm frother
5 1.2 7.410 2.1 3.615 3.3 5.521 4.2 7.026 5.2 8.532 5.8 9.728 6.7 11.245 7.9 13.051 8.2 14.557 8.5 16.4
Table 36 Effect of phosphate feed on air hold up.
In water
Hold up % IIn presence of feed
7.4 1.712.4 3.316.1 5.417.5 5.819.0 7.8
38
Effect of the Sparger.
The advantage of having a sparger that can distribute the air all across the column can not beover emphasized. Also the flexibility of being able to control the air flow independently from thewater flow is a very desirable feature. The sparger used proved to be quite efficient. In laboratorytesting the sparger did not loose any effectivity even after two weeks of continuous bubbling ina phosphate pulp. During testing, performance of the sparger was also quite steady. A small lossof porosity was observed when the sparger was left immersed (without bubbling) for 48 hoursin plant water, it appears that some algae grew in the cloth. It is probable that the same does notoccur when air goes through the aerator because no problems were observed during operation.Anyways porosity of the partially clogged aerator was restored by simply washing with a jet ofwater.
During the pilot test the effect of the aerator surface was studied. Results of this study arepresented in Tables 37 and 38. In the first table air hold ups obtained with three different aerator
39
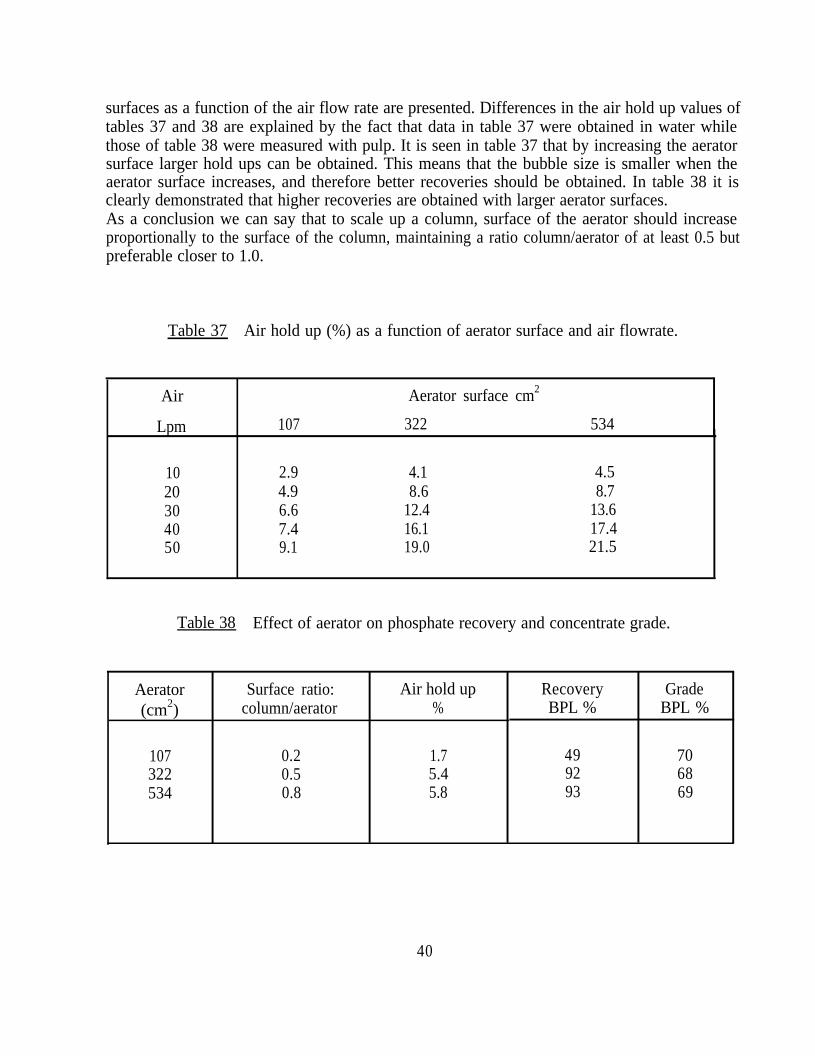
surfaces as a function of the air flow rate are presented. Differences in the air hold up values oftables 37 and 38 are explained by the fact that data in table 37 were obtained in water whilethose of table 38 were measured with pulp. It is seen in table 37 that by increasing the aeratorsurface larger hold ups can be obtained. This means that the bubble size is smaller when theaerator surface increases, and therefore better recoveries should be obtained. In table 38 it isclearly demonstrated that higher recoveries are obtained with larger aerator surfaces.As a conclusion we can say that to scale up a column, surface of the aerator should increaseproportionally to the surface of the column, maintaining a ratio column/aerator of at least 0.5 butpreferable closer to 1.0.
Table 37 Air hold up (%) as a function of aerator surface and air flowrate.
Air
Lpm
10 2.9 4.1 4.520 4.9 8.6 8.730 6.6 12.4 13.640 7.4 16.1 17.450 9.1 19.0 21.5
Aerator surface cm2
107 322 534
Table 38 Effect of aerator on phosphate recovery and concentrate grade.
Aerator Surface ratio: Air hold up(cm2) column/aerator %
107 0.2 1.7322 0.5 5.4534 0.8 5.8
Recovery GradeBPL % BPL %
49 7092 6893 69
40
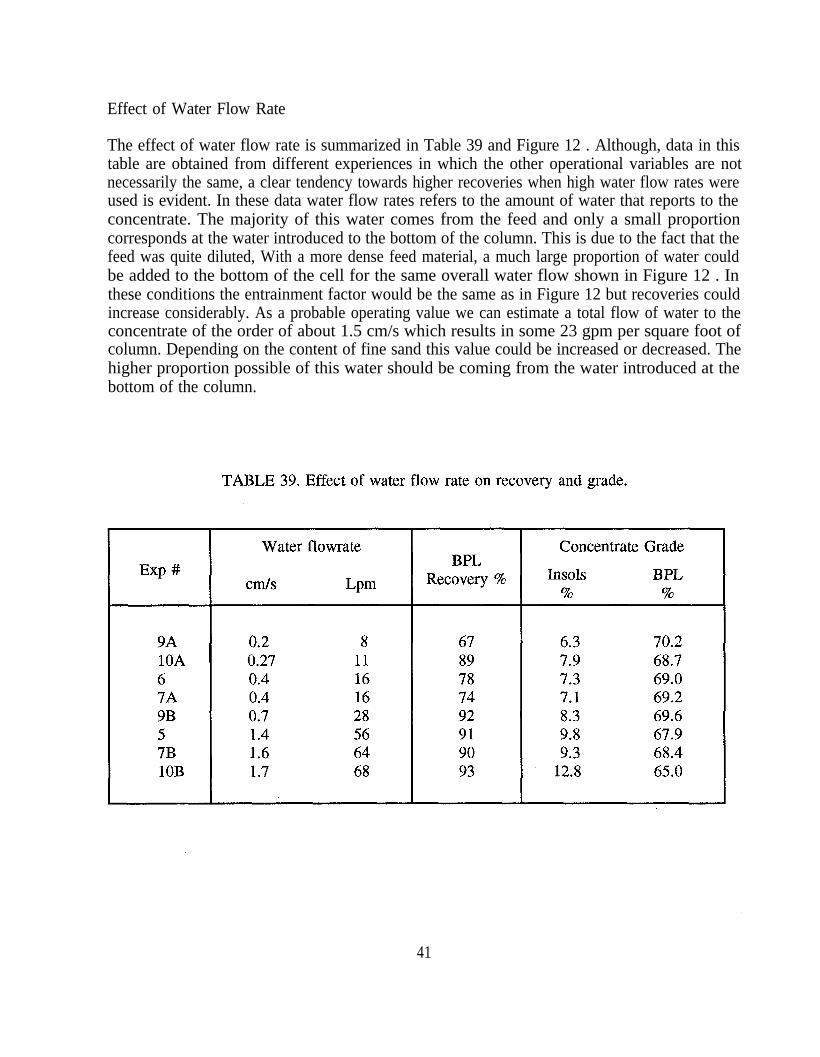
Effect of Water Flow Rate
The effect of water flow rate is summarized in Table 39 and Figure 12 . Although, data in thistable are obtained from different experiences in which the other operational variables are notnecessarily the same, a clear tendency towards higher recoveries when high water flow rates wereused is evident. In these data water flow rates refers to the amount of water that reports to theconcentrate. The majority of this water comes from the feed and only a small proportioncorresponds at the water introduced to the bottom of the column. This is due to the fact that thefeed was quite diluted, With a more dense feed material, a much large proportion of water couldbe added to the bottom of the cell for the same overall water flow shown in Figure 12 . Inthese conditions the entrainment factor would be the same as in Figure 12 but recoveries couldincrease considerably. As a probable operating value we can estimate a total flow of water to theconcentrate of the order of about 1.5 cm/s which results in some 23 gpm per square foot ofcolumn. Depending on the content of fine sand this value could be increased or decreased. Thehigher proportion possible of this water should be coming from the water introduced at thebottom of the column.
41
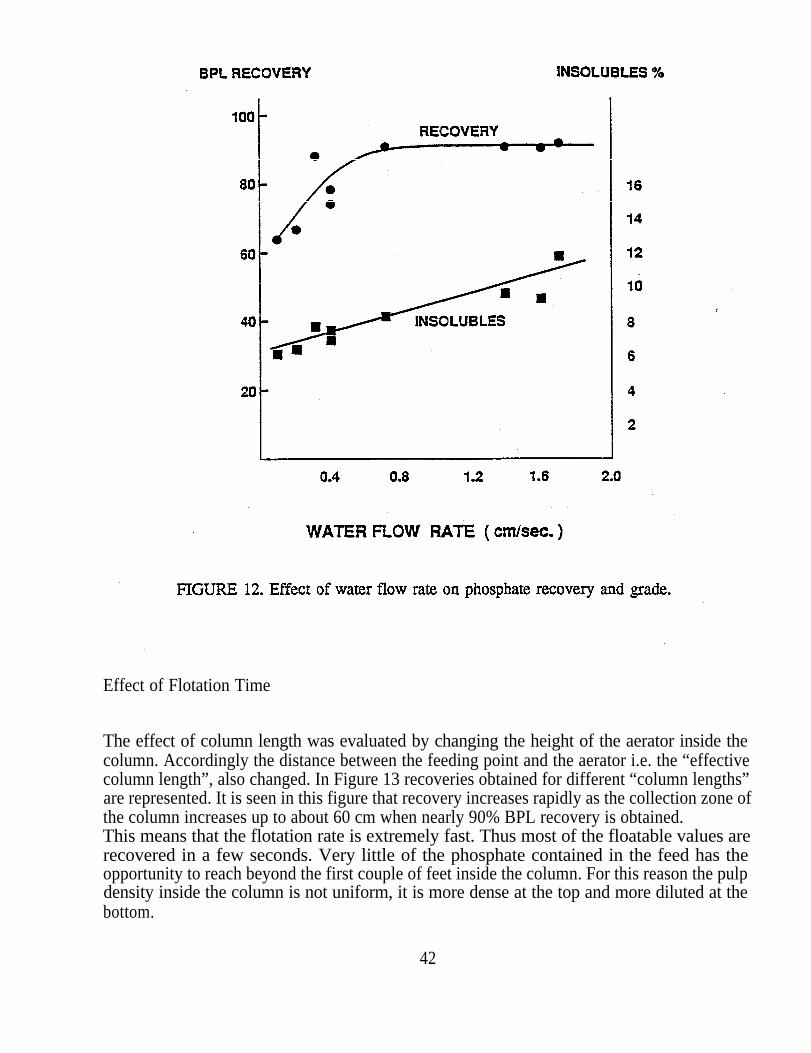
Effect of Flotation Time
The effect of column length was evaluated by changing the height of the aerator inside thecolumn. Accordingly the distance between the feeding point and the aerator i.e. the “effectivecolumn length”, also changed. In Figure 13 recoveries obtained for different “column lengths”are represented. It is seen in this figure that recovery increases rapidly as the collection zone ofthe column increases up to about 60 cm when nearly 90% BPL recovery is obtained.This means that the flotation rate is extremely fast. Thus most of the floatable values arerecovered in a few seconds. Very little of the phosphate contained in the feed has theopportunity to reach beyond the first couple of feet inside the column. For this reason the pulpdensity inside the column is not uniform, it is more dense at the top and more diluted at thebottom.
42
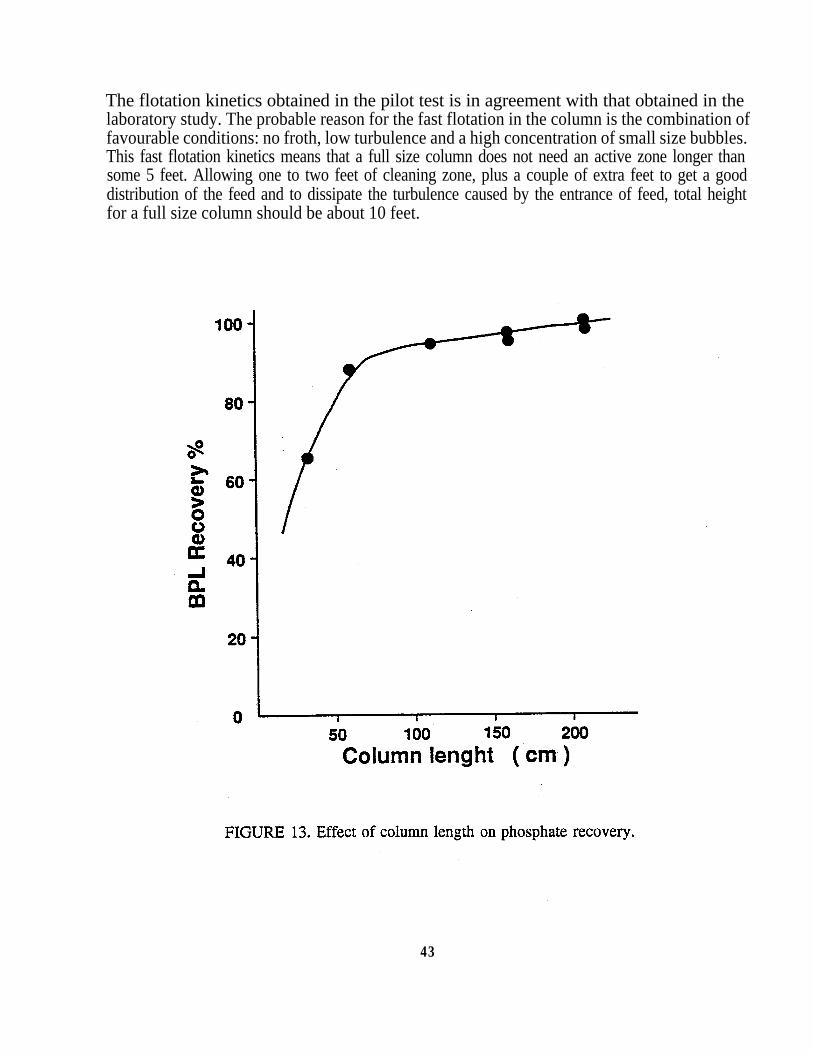
The flotation kinetics obtained in the pilot test is in agreement with that obtained in thelaboratory study. The probable reason for the fast flotation in the column is the combination offavourable conditions: no froth, low turbulence and a high concentration of small size bubbles.This fast flotation kinetics means that a full size column does not need an active zone longer thansome 5 feet. Allowing one to two feet of cleaning zone, plus a couple of extra feet to get a gooddistribution of the feed and to dissipate the turbulence caused by the entrance of feed, total heightfor a full size column should be about 10 feet.
43
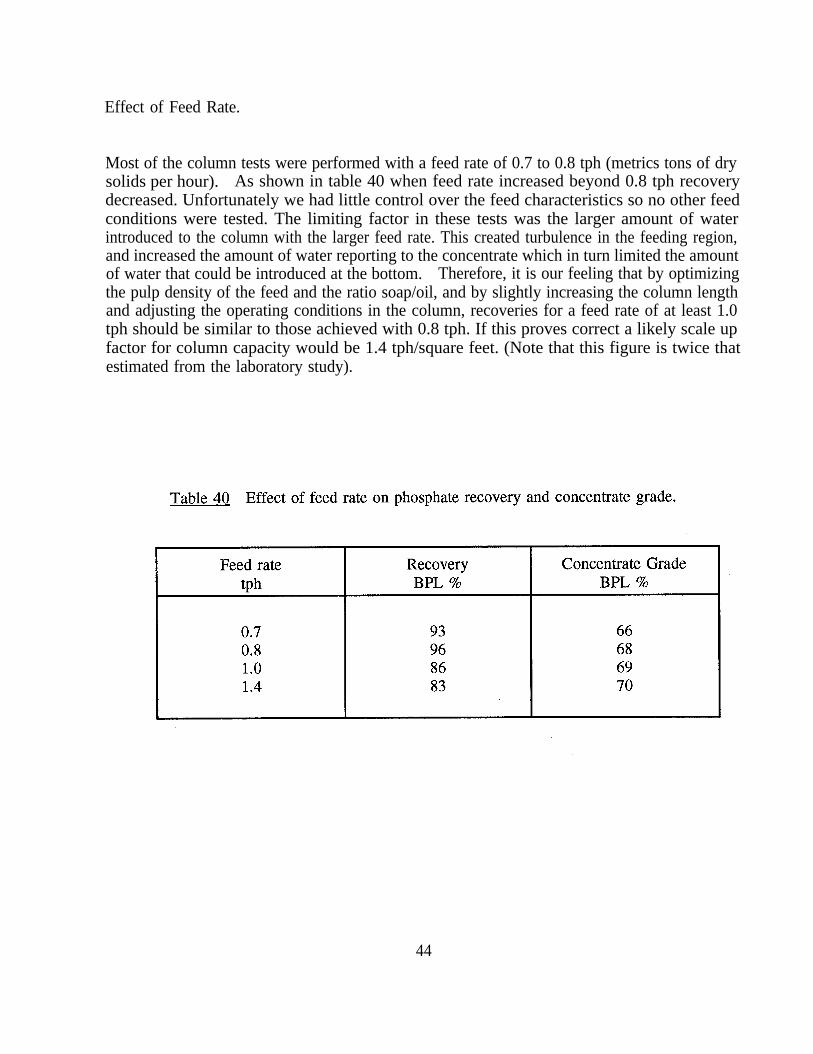
Effect of Feed Rate.
Most of the column tests were performed with a feed rate of 0.7 to 0.8 tph (metrics tons of drysolids per hour). As shown in table 40 when feed rate increased beyond 0.8 tph recoverydecreased. Unfortunately we had little control over the feed characteristics so no other feedconditions were tested. The limiting factor in these tests was the larger amount of waterintroduced to the column with the larger feed rate. This created turbulence in the feeding region,and increased the amount of water reporting to the concentrate which in turn limited the amountof water that could be introduced at the bottom. Therefore, it is our feeling that by optimizingthe pulp density of the feed and the ratio soap/oil, and by slightly increasing the column lengthand adjusting the operating conditions in the column, recoveries for a feed rate of at least 1.0tph should be similar to those achieved with 0.8 tph. If this proves correct a likely scale upfactor for column capacity would be 1.4 tph/square feet. (Note that this figure is twice thatestimated from the laboratory study).
44
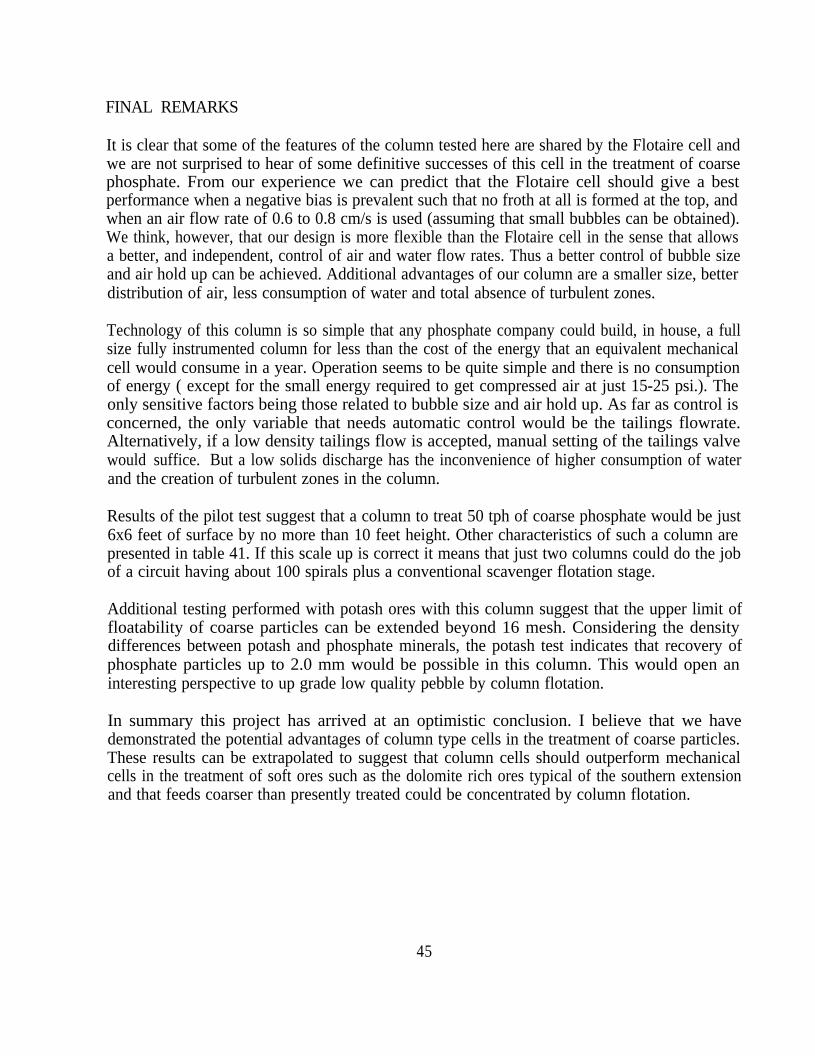
FINAL REMARKS
It is clear that some of the features of the column tested here are shared by the Flotaire cell andwe are not surprised to hear of some definitive successes of this cell in the treatment of coarsephosphate. From our experience we can predict that the Flotaire cell should give a bestperformance when a negative bias is prevalent such that no froth at all is formed at the top, andwhen an air flow rate of 0.6 to 0.8 cm/s is used (assuming that small bubbles can be obtained).We think, however, that our design is more flexible than the Flotaire cell in the sense that allowsa better, and independent, control of air and water flow rates. Thus a better control of bubble sizeand air hold up can be achieved. Additional advantages of our column are a smaller size, betterdistribution of air, less consumption of water and total absence of turbulent zones.
Technology of this column is so simple that any phosphate company could build, in house, a fullsize fully instrumented column for less than the cost of the energy that an equivalent mechanicalcell would consume in a year. Operation seems to be quite simple and there is no consumptionof energy ( except for the small energy required to get compressed air at just 15-25 psi.). Theonly sensitive factors being those related to bubble size and air hold up. As far as control isconcerned, the only variable that needs automatic control would be the tailings flowrate.Alternatively, if a low density tailings flow is accepted, manual setting of the tailings valvewould suffice. But a low solids discharge has the inconvenience of higher consumption of waterand the creation of turbulent zones in the column.
Results of the pilot test suggest that a column to treat 50 tph of coarse phosphate would be just6x6 feet of surface by no more than 10 feet height. Other characteristics of such a column arepresented in table 41. If this scale up is correct it means that just two columns could do the jobof a circuit having about 100 spirals plus a conventional scavenger flotation stage.
Additional testing performed with potash ores with this column suggest that the upper limit offloatability of coarse particles can be extended beyond 16 mesh. Considering the densitydifferences between potash and phosphate minerals, the potash test indicates that recovery ofphosphate particles up to 2.0 mm would be possible in this column. This would open aninteresting perspective to up grade low quality pebble by column flotation.
In summary this project has arrived at an optimistic conclusion. I believe that we havedemonstrated the potential advantages of column type cells in the treatment of coarse particles.These results can be extrapolated to suggest that column cells should outperform mechanicalcells in the treatment of soft ores such as the dolomite rich ores typical of the southern extensionand that feeds coarser than presently treated could be concentrated by column flotation.
45
46
CHAPTER 3REPORT ON WORK DEVELOPED DURING THE FIRST YEAR
This chapter includes experimental results and discussion of the test work developed during theproject’s first year that was not included in Chapter 1. Section 1 contains results and discussionof some exploratory tests performed in a small laboratory column just 2.5 cm diameter. Giventhe encouraging results obtained at this stage a larger (7 cm diameter) laboratory column wasbuilt. The most relevant results obtained in this column were already discussed in Chapter 1. Therest of the experimental results obtained in the 7 cm laboratory column are presented in thesecond section of Chapter 3. The next section contains results of theoretical studies that includeresidence time determinations of bubbles and particles as well as air hold up measurements.
Materials and methods were described in Chapter 1. Phosphate products from the flotation testswere dissolved in hot concentrated aqua regia during 30 min. After dissolution, insolubles werefiltered, dried and weighed directly in fritted funnels. Phosphate was analyzed in the acid liquorby a colorimetric method involving the formation of a coloured molybdo-vanadate phosphatecomplex. However, for routine analysis only insolubles were determined and BPL content wascalculated from the insolubles assay. This procedure was calibrated and checked with analysisperformed in analytical laboratories of Florida phosphate plants. Differences in BPL assays areless than 0.8 % BPL which is precise enough for most of the flotation testing. A key factor toachieve this precision level was the use of relatively large samples during analysis. Flotationproducts were sampled in a riffle to obtain 20-30 grams of material for analysis. This relativelylarge amount of material decreases the sampling error of coarse particles and assures very goodreproducibility of assays.
47
EXPLORATORY FLOTATION TESTS.
Conventional Cell
A number of tests were performed with spiral and coarse flotation feeds in both an Agitair anda Denver laboratory cell. Samples of 1 Kg of ore were conditioned in the cell at 60 % solidsduring one minute with fatty acid (Acintol AF3) and kerosene as extender. Using this procedureno flotation of phosphate was observed even at the highest collector doses added ( 4 Kg/ton).Results are presented in the appendix t the end of the Chapter. It was suspected that this lowfloatability was related to the strong agitation used during conditioning (needed to fully suspendthe solids). Apparently the strong agitation abraded the mineral surface. Therefore theconditioning procedure was modified, and instead, the ore was tumbled for three minutes in aplexiglass container at 70% solids. With this method phosphate recovery increased markedly. Thebest results were obtained with the Agitair cell. By using 4 Kg/ton collector, BPL recovery fromthe spiral feed was 53% with an insols content of 16%. With the coarse flotation feed maximumrecovery was 74%, but insols content of the concentrate was 39%.
Column Cell
Exploratory testing was carried out in a small column 2.8 cm diameter and 50 cm height. Thecolumn was feed continuously at a rate of 50 g/min with a 60% solids pulp from a paddle stirredtank located on top of the column. Before feeding the ore was conditioned as for conventionalflotation. Very good recovery was observed during the fast 2-3 minutes of flotation, but anincreasing deterioration of floatability was evident afterwards. It was suspected that this behaviourwas due to abrasion of the ore in the feeding tank. Subsequent experiments were performedwithout stirring during feeding. In this case extremely encouraging results were obtained. Nearly100% phosphate recovery was obtained with both feeds. Selectivity was higher than in aconventional cell. In Table 42 best results obtained in similar conditions in conventional cellsand in the column are compared.
48
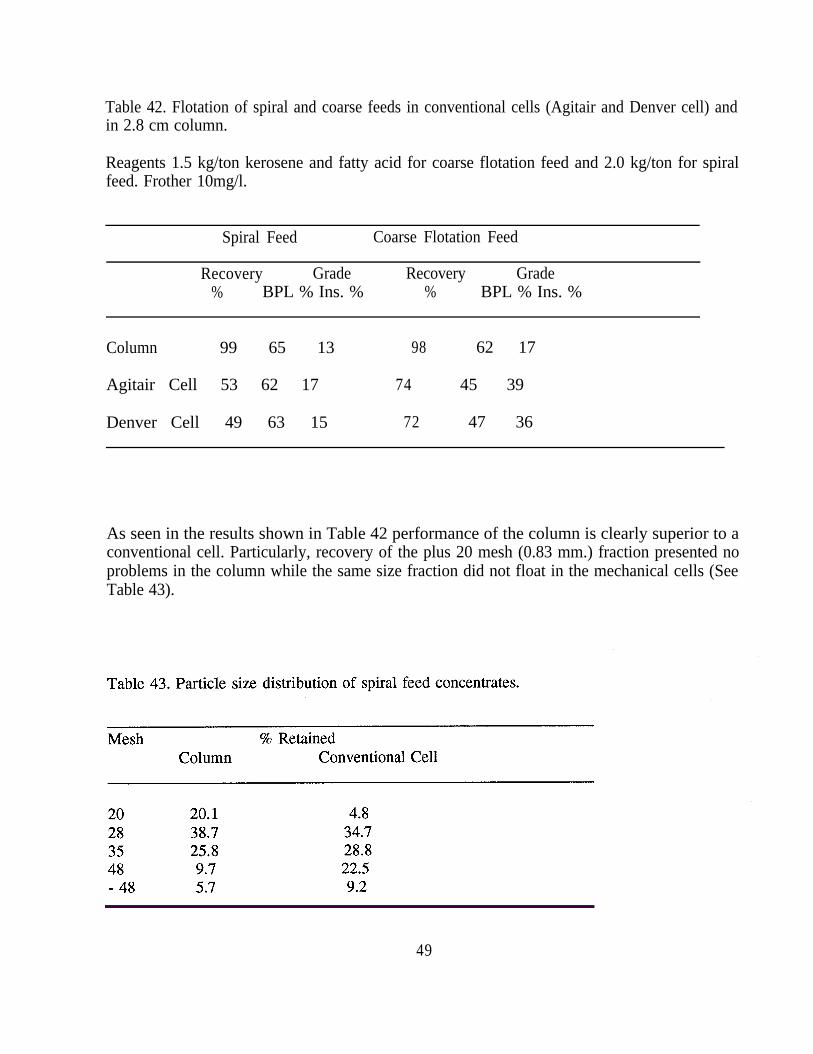
Table 42. Flotation of spiral and coarse feeds in conventional cells (Agitair and Denver cell) andin 2.8 cm column.
Reagents 1.5 kg/ton kerosene and fatty acid for coarse flotation feed and 2.0 kg/ton for spiralfeed. Frother 10mg/l.
Spiral Feed Coarse Flotation Feed
Recovery Grade Recovery Grade% BPL % Ins. % % BPL % Ins. %
Column 99 65 13 98 62 17
Agitair Cell 53 62 17 74 45 39
Denver Cell 49 63 15 72 47 36
As seen in the results shown in Table 42 performance of the column is clearly superior to aconventional cell. Particularly, recovery of the plus 20 mesh (0.83 mm.) fraction presented noproblems in the column while the same size fraction did not float in the mechanical cells (SeeTable 43).
49
Gary Albarelli
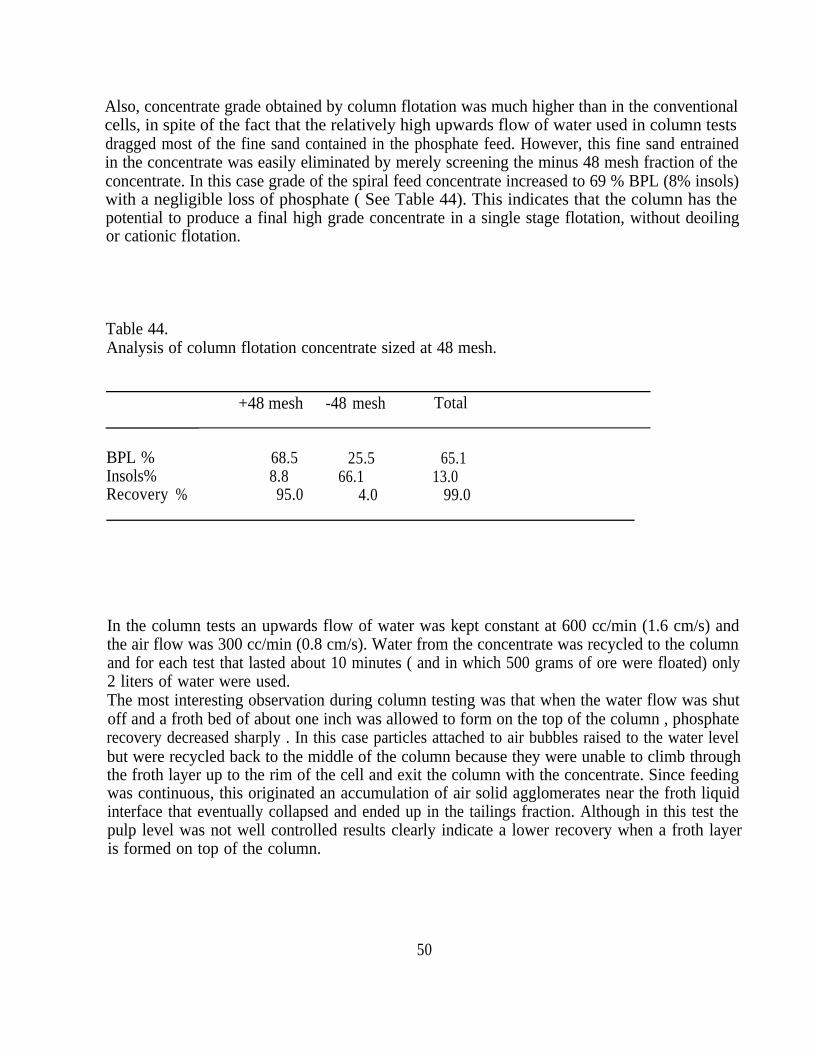
Also, concentrate grade obtained by column flotation was much higher than in the conventionalcells, in spite of the fact that the relatively high upwards flow of water used in column testsdragged most of the fine sand contained in the phosphate feed. However, this fine sand entrainedin the concentrate was easily eliminated by merely screening the minus 48 mesh fraction of theconcentrate. In this case grade of the spiral feed concentrate increased to 69 % BPL (8% insols)with a negligible loss of phosphate ( See Table 44). This indicates that the column has thepotential to produce a final high grade concentrate in a single stage flotation, without deoilingor cationic flotation.
Table 44.Analysis of column flotation concentrate sized at 48 mesh.
+48 mesh -48 mesh Total
BPL % 68.5 25.5 65.1Insols% 8.8 66.1 13.0Recovery % 95.0 4.0 99.0
In the column tests an upwards flow of water was kept constant at 600 cc/min (1.6 cm/s) andthe air flow was 300 cc/min (0.8 cm/s). Water from the concentrate was recycled to the columnand for each test that lasted about 10 minutes ( and in which 500 grams of ore were floated) only2 liters of water were used.The most interesting observation during column testing was that when the water flow was shutoff and a froth bed of about one inch was allowed to form on the top of the column , phosphaterecovery decreased sharply . In this case particles attached to air bubbles raised to the water levelbut were recycled back to the middle of the column because they were unable to climb throughthe froth layer up to the rim of the cell and exit the column with the concentrate. Since feedingwas continuous, this originated an accumulation of air solid agglomerates near the froth liquidinterface that eventually collapsed and ended up in the tailings fraction. Although in this test thepulp level was not well controlled results clearly indicate a lower recovery when a froth layeris formed on top of the column.
50
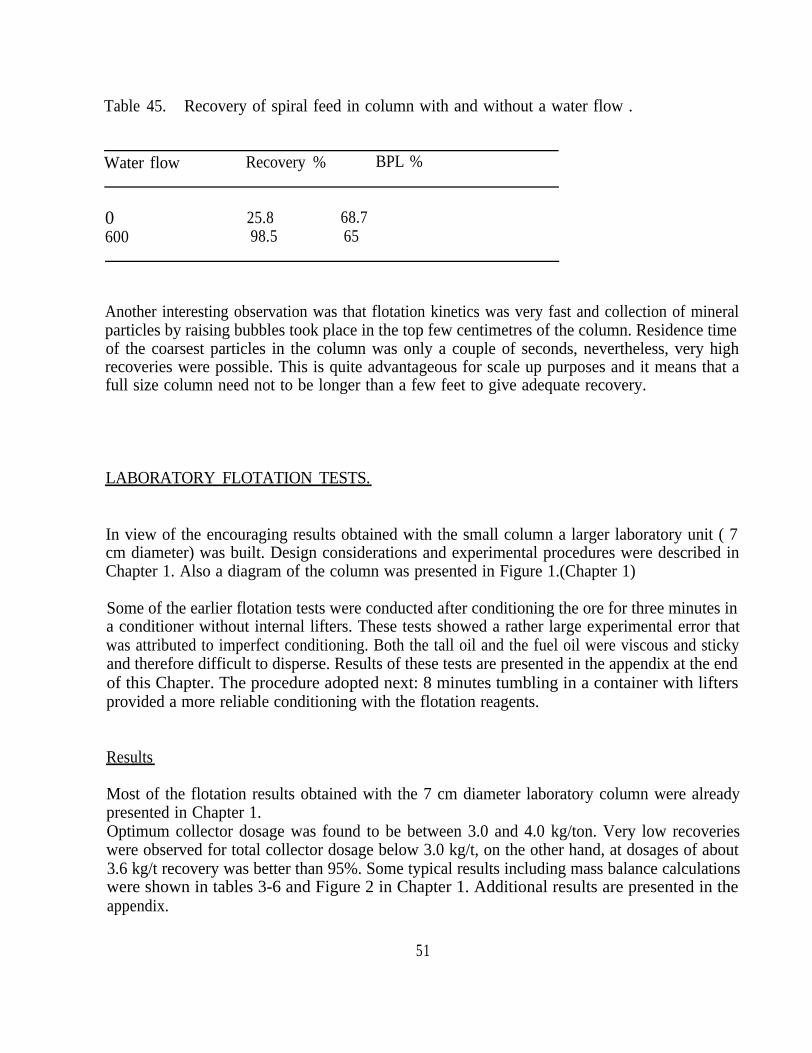
Table 45. Recovery of spiral feed in column with and without a water flow .
Water flow Recovery % BPL %
0 25.8 68.7600 98.5 65
Another interesting observation was that flotation kinetics was very fast and collection of mineralparticles by raising bubbles took place in the top few centimetres of the column. Residence timeof the coarsest particles in the column was only a couple of seconds, nevertheless, very highrecoveries were possible. This is quite advantageous for scale up purposes and it means that afull size column need not to be longer than a few feet to give adequate recovery.
LABORATORY FLOTATION TESTS.
In view of the encouraging results obtained with the small column a larger laboratory unit ( 7cm diameter) was built. Design considerations and experimental procedures were described inChapter 1. Also a diagram of the column was presented in Figure 1.(Chapter 1)
Some of the earlier flotation tests were conducted after conditioning the ore for three minutes ina conditioner without internal lifters. These tests showed a rather large experimental error thatwas attributed to imperfect conditioning. Both the tall oil and the fuel oil were viscous and stickyand therefore difficult to disperse. Results of these tests are presented in the appendix at the endof this Chapter. The procedure adopted next: 8 minutes tumbling in a container with liftersprovided a more reliable conditioning with the flotation reagents.
Results
Most of the flotation results obtained with the 7 cm diameter laboratory column were alreadypresented in Chapter 1.Optimum collector dosage was found to be between 3.0 and 4.0 kg/ton. Very low recoverieswere observed for total collector dosage below 3.0 kg/t, on the other hand, at dosages of about3.6 kg/t recovery was better than 95%. Some typical results including mass balance calculationswere shown in tables 3-6 and Figure 2 in Chapter 1. Additional results are presented in theappendix.
51
These results are quite encouraging and confirmed the preliminary results obtained in the smallercolumn. Recoveries obtained in the column were always higher than recoveries in theconventional cell. Conditioning procedure, collectors, frother, pH and air flow were the samefor both the column and the mechanical cell. Agitation speed in the mechanical cell was theminimum to avoid sedimentation of particles. Tests in a Denver laboratory cell gave slightlylower results than those obtained in the Agitair (See appendix).
Phosphate flotation in the column was extremely fast, about one order of magnitude faster thanin a conventional cell. In the conventional cell flotation time was about 60 to 90 seconds, whilein the column some ten seconds were enough to achieve nearly 100% recovery.
In addition to the effect of collector, recovery and grade obtained during column flotationdepended to a lesser extent on factors such as water and air flowrates, frother concentration,bubble size, and depth of the feeding tube (See Chapter 1 for details). The addition of waterwas essential to avoid a froth layer on the top of the column. In order to float coarse particles
it is necessary to keep a negative bias inside the column (i.e. a net upwards flow of water) totransfer the floating particles to the concentrate without the formation of a froth bed.
Some tests were performed to explore the possibility of recovering the phosphate values byreverse cationic flotation. Exploratory testing in conventional cells and in the small diametercolumn were not encouraging. Early tests in which samples were conditioned by agitating directlyin the cell failed to reduce the insols content when up to 2.0 kg/ton collector (Azamine pluskerosene) were used. Not much improvement was observed when the conditioning procedure waschanged to a mild tumbling during 3 minutes. Results in both conventional cells and in thecolumn indicated low recoveries when high amounts of collector were used, or low grades whensmall concentration of collector were added.
Further testing of the cationic route using azamine and diesel fuel in the 7 cm column gave ratherdisappointing results, no major improvement over the exploratory tests was observed. This aminetype collector was not very selective . If collector dosage is increased in order to float morequartz, fine phosphate starts to float and is lost in the froth product, but coarse quartz remainsin the cell contaminating the phosphate concentrate. This poor performance of the cationic routewas not a problem of the column itself but rather of the poor selectivity exhibited by thecollector. Given its theoretical advantages it seems advisable to pursue this route with othercationic collectors.
52
THEORETICAL STUDIES.
Experiments carried out to characterize a negative bias column are discussed here. Additionaltests in which a single size quartz fraction (14x20 mesh) was floated with Armac T at differentfeed rates showed that up to feed rates as high as 500 g/min the mineral is recovered as fast asit can be fed in the column. At higher feed rates (1000 g/min or more) it is observed that the rateof concentrate becomes smaller than the feed rate indicating loss of particles to the tailings oraccumulation in the column. (See appendix)
Air Hold-up
Air hold-up is an important parameter for modelling and scale-up purposes. We determined theeffect of variables such as air and water flowrates and frother concentration and the possiblesegregation of air hold-up in different zones of the column. The experimental method consistedin determining the difference of hydrostatic pressure between the column and a communicatingvessel free of air bubbles. An alternative method based on the measurement of the void volumeafter suddenly stopping the flows of air and water was also used. Both methods gave similarresults. Figures 14 summarize some results obtained in these determinations, additional data aregiven in the appendix. Main conclusions that can be drawn are as follows: There is animportant relationship between air hold-up and air velocity. In the range of interest, the effect offrother concentration and water velocity is small. Adequate air hold-up is easily achieved evenat the highest water velocity tested. There is also a small vertical segregation of air hold-up thatcould became a factor if a much taller column is used, however results presented above and alsothose in Chapter 1 indicate that a long column would not be necessary.
Residence Time Determinations
Residence time of corse phosphate particles in the 7 cm column were measured experimentallyfor various particle sizes. Typical results obtained for 14x20 mesh particles are given in Figure15. A summary of the results for different sizes was presented in Chapter 1.
53
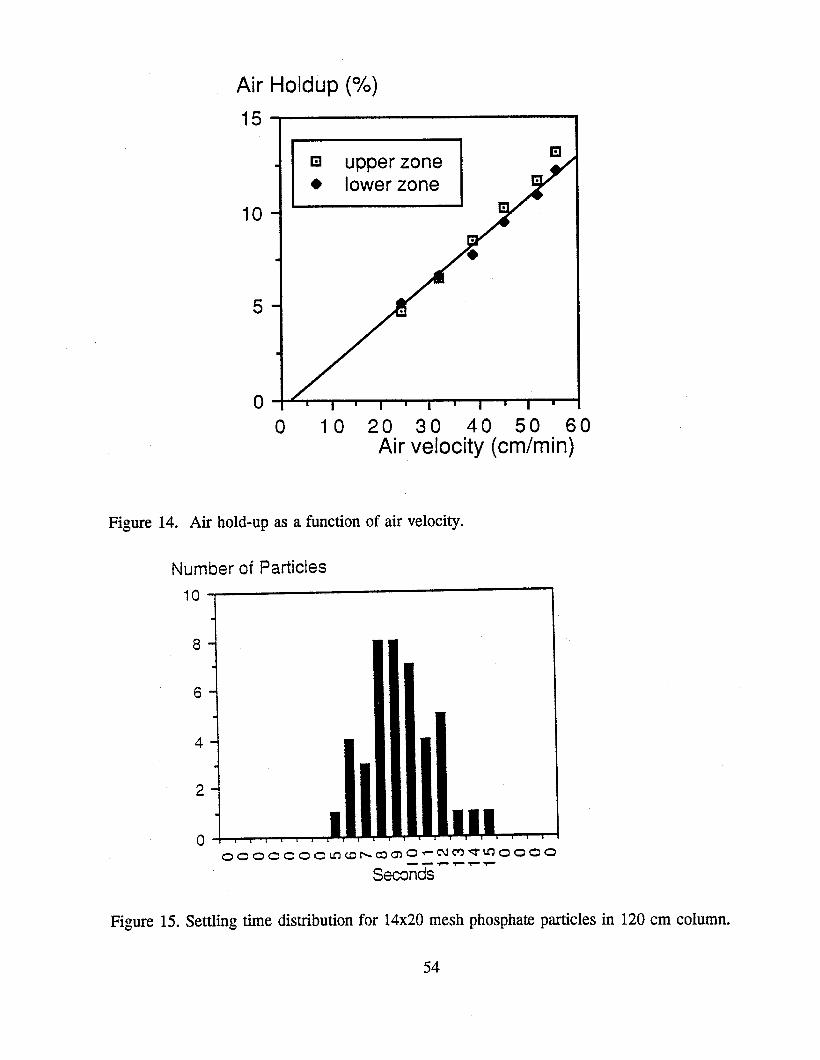
Air Holdup (%)
15
IO
5
0 0 IO 20 30 40 50 60
Air velocity (cm/min)
Figure 14. Air hold-up as a function of air velocity.
Number of Particles
‘Od
8
6
4
2
0 0000000m~b~~0~~0d~0000
----v-r-
Seconds
Figure 15. Settling time distribution for 14x20 mesh phosphate particles in 120 cm column.
54
FINAL REMARKS
Conventional flotation cells are required to perform two inherently contradictory tasks: first toprovide enough agitation to create the turbulence level necessary to suspend the particles, dispersethe air, promote the subsequent bubble-particle collisions and, secondly, to provide quiescenthydrodynamic conditions to avoid disruption of the particle-bubble aggregate and also avoid thetransfer of gangue to the froth layer. With more or less ingenious designs of tanks, impellers andbaffles these tasks can be accomplished fairly well by most mechanical cells when not toocoarse particles (or not too fine) are treated.
The situation is different when flotation of coarse particles is intended, as shown in Chapter 3,a higher level of turbulence is required to keep the particles from settling, but at the same time,less turbulence is required to avoid disrupting particle-bubble aggregates, as a result performanceof the cell is impaired. In the case of phosphate flotation, an additional disadvantage ofmechanical cells is derived from the distinctive softness and tendency to disintegrate and formslimes exhibited by sedimentary phosphorites. The particle-particle interactions prevailing inmechanical cells are strong enough to produce abrasion of soft minerals, this attritioning shouldbe cause of concern because may result in excessive reagent consumption and perhaps some lossof values. This effect is more noticeable in the case of softer ores such as dolomite contaminatedphosphate rock that will be the typical feed in future mining in Florida.
Conventional flotation column have shown definitive industrial success in the flotation ofmolybdenite and zinc in Canada. Presently columns are being seriously considered for differenttasks in countries worldwide. Indeed column flotation is one of the most active research anddevelopment areas in mineral processing. Although primarily used for flotation of fine particlesdue to effective control of fines entrainment by a wash water flow, columns have severaladvantages that can be considered of interest for any application including coarse particles nomechanical parts ( therefore easy maintenance and low energy consumption), easy automatizationand control, low turbulence, easy control of bubble size, simple flow pattern, well definedhydrodynamic conditions (therefore easier to model and scale up) and relatively highthroughput. Since the flow pattern is plug-type there is no short circuiting of particles (orbubbles) and one column could replace an entire bank of cells.
Negative Bias Columns for Coarse Particles Flotation
Two column characteristics are extremely important for coarse particles flotation: a lowturbulence regime and the possibility to control bubble size. The only factors that seem to keepconventional columns from being ideally suitable for coarse particles flotation are the wash waterflow and the thick froth layer. However, as the experimental work discussed in Chapter 1 shows,the simple modification of using a net upwards flow of water (negative bias) countercurrent tothe particles flow (instead of the co-current flow featured by conventional columns) could solvethe problem. This type of column would maintain all the advantages of the flotation column
55
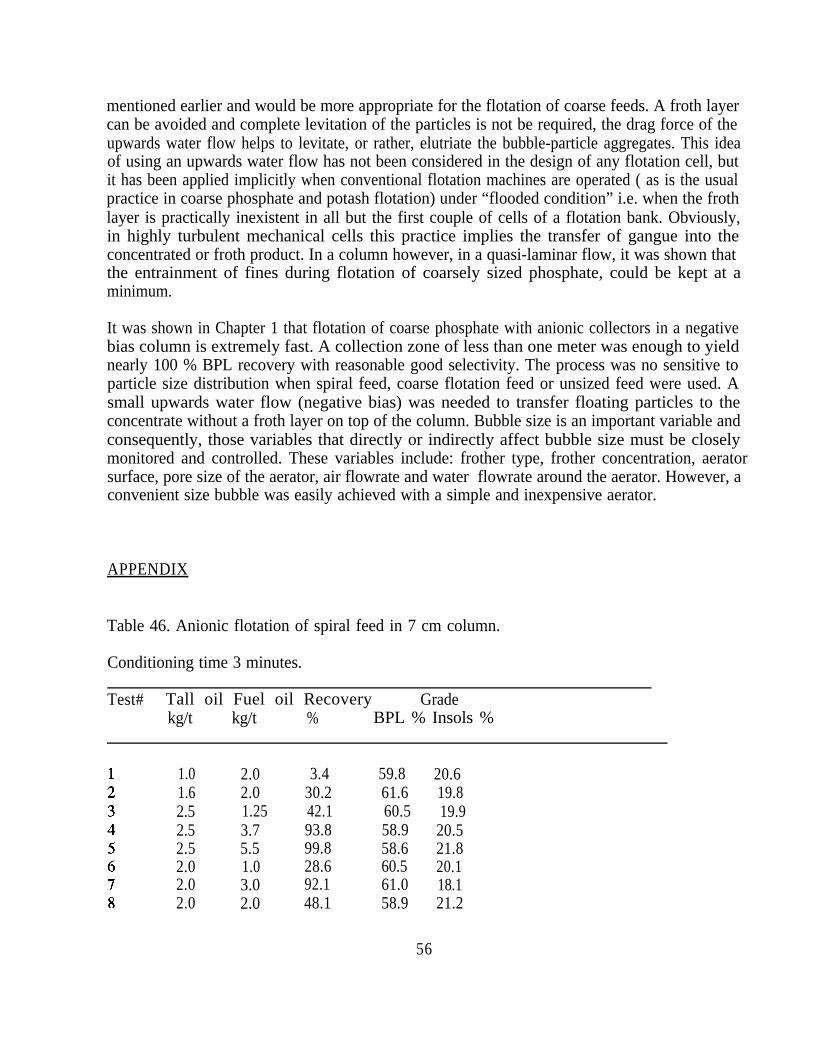
mentioned earlier and would be more appropriate for the flotation of coarse feeds. A froth layercan be avoided and complete levitation of the particles is not be required, the drag force of theupwards water flow helps to levitate, or rather, elutriate the bubble-particle aggregates. This ideaof using an upwards water flow has not been considered in the design of any flotation cell, butit has been applied implicitly when conventional flotation machines are operated ( as is the usualpractice in coarse phosphate and potash flotation) under “flooded condition” i.e. when the frothlayer is practically inexistent in all but the first couple of cells of a flotation bank. Obviously,in highly turbulent mechanical cells this practice implies the transfer of gangue into theconcentrated or froth product. In a column however, in a quasi-laminar flow, it was shown thatthe entrainment of fines during flotation of coarsely sized phosphate, could be kept at aminimum.
It was shown in Chapter 1 that flotation of coarse phosphate with anionic collectors in a negativebias column is extremely fast. A collection zone of less than one meter was enough to yieldnearly 100 % BPL recovery with reasonable good selectivity. The process was no sensitive toparticle size distribution when spiral feed, coarse flotation feed or unsized feed were used. Asmall upwards water flow (negative bias) was needed to transfer floating particles to theconcentrate without a froth layer on top of the column. Bubble size is an important variable andconsequently, those variables that directly or indirectly affect bubble size must be closelymonitored and controlled. These variables include: frother type, frother concentration, aeratorsurface, pore size of the aerator, air flowrate and water flowrate around the aerator. However, aconvenient size bubble was easily achieved with a simple and inexpensive aerator.
APPENDIX
Table 46. Anionic flotation of spiral feed in 7 cm column.
Conditioning time 3 minutes.
Test# Tall oil Fuel oil Recovery Gradekg/t kg/t % BPL % Insols %
1.0 2.0 3.4 59.8 20.61.6 2.0 30.2 61.6 19.82.5 1.25 42.1 60.5 19.92.5 3.7 93.8 58.9 20.52.5 5.5 99.8 58.6 21.82.0 1.0 28.6 60.5 20.12.0 3.0 92.1 61.0 18.12.0 2.0 48.1 58.9 21.2
56
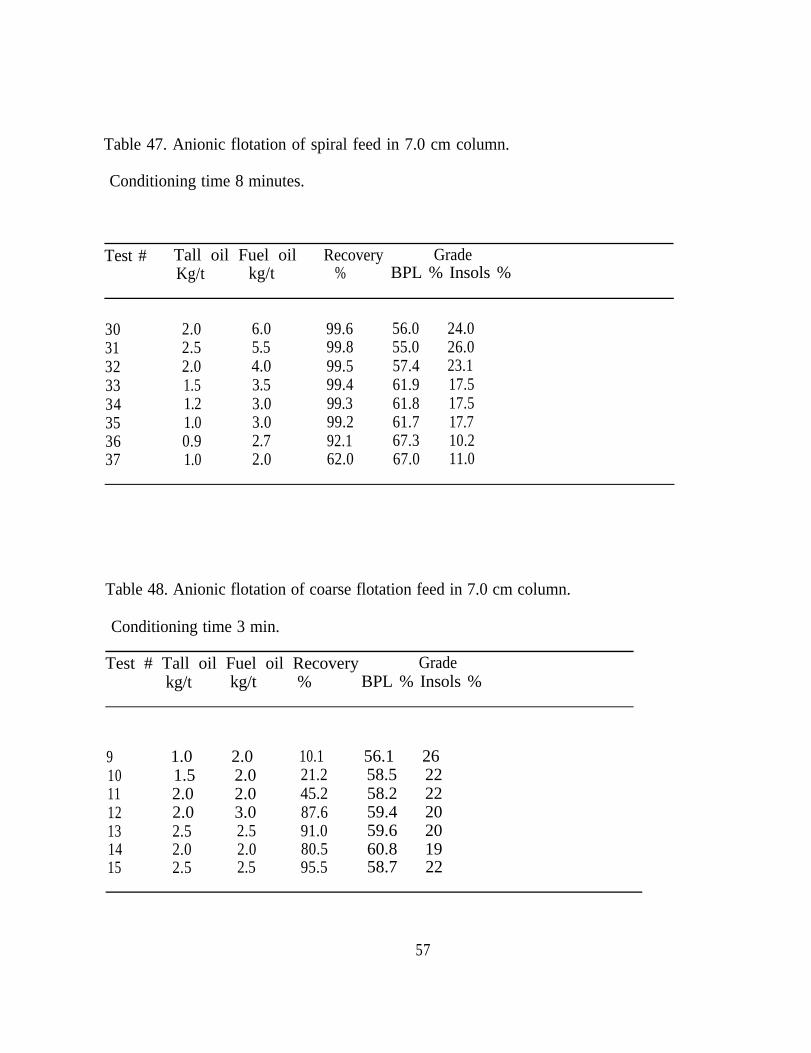
Table 47. Anionic flotation of spiral feed in 7.0 cm column.
Conditioning time 8 minutes.
Test # Tall oil Fuel oil Recovery GradeKg/t kg/t % BPL % Insols %
30 2.0 6.0 99.6 56.0 24.031 2.5 5.5 99.8 55.0 26.032 2.0 4.0 99.5 57.4 23.133 1.5 3.5 99.4 61.9 17.534 1.2 3.0 99.3 61.8 17.535 1.0 3.0 99.2 61.7 17.736 0.9 2.7 92.1 67.3 10.237 1.0 2.0 62.0 67.0 11.0
Table 48. Anionic flotation of coarse flotation feed in 7.0 cm column.
Conditioning time 3 min.
Test # Tall oil Fuel oil Recovery Gradekg/t kg/t % BPL % Insols %
9 1.0 2.0 10.1 56.1 2610 1.5 2.0 21.2 58.5 2211 2.0 2.0 45.2 58.2 2212 2.0 3.0 87.6 59.4 2013 2.5 2.5 91.0 59.6 2014 2.0 2.0 80.5 60.8 1915 2.5 2.5 95.5 58.7 22
57
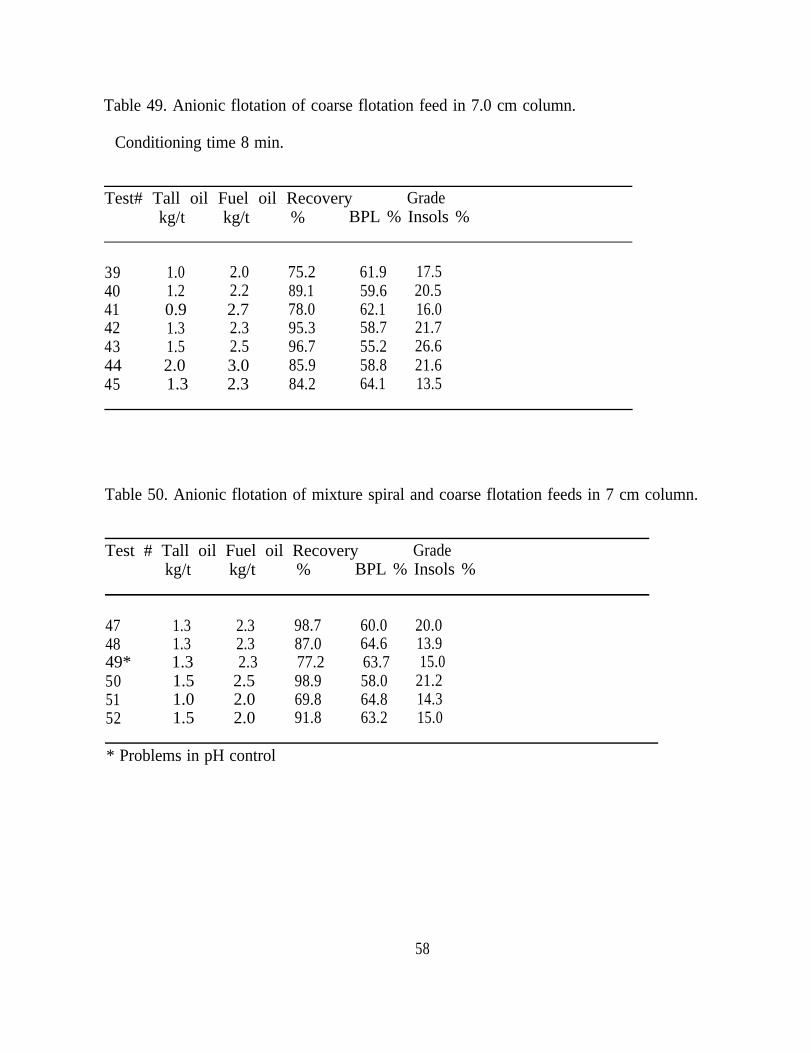
Table 49. Anionic flotation of coarse flotation feed in 7.0 cm column.
Conditioning time 8 min.
Test# Tall oil Fuel oil Recovery Gradekg/t kg/t % BPL % Insols %
39 1.0 2.0 75.2 61.9 17.540 1.2 2.2 89.1 59.6 20.541 0.9 2.7 78.0 62.1 16.042 1.3 2.3 95.3 58.7 21.743 1.5 2.5 96.7 55.2 26.644 2.0 3.0 85.9 58.8 21.645 1.3 2.3 84.2 64.1 13.5
Table 50. Anionic flotation of mixture spiral and coarse flotation feeds in 7 cm column.
Test # Tall oil Fuel oil Recovery Gradekg/t kg/t % BPL % Insols %
47 1.3 2.3 98.7 60.0 20.048 1.3 2.3 87.0 64.6 13.949* 1.3 2.3 77.2 63.7 15.050 1.5 2.5 98.9 58.0 21.251 1.0 2.0 69.8 64.8 14.352 1.5 2.0 91.8 63.2 15.0
* Problems in pH control
58
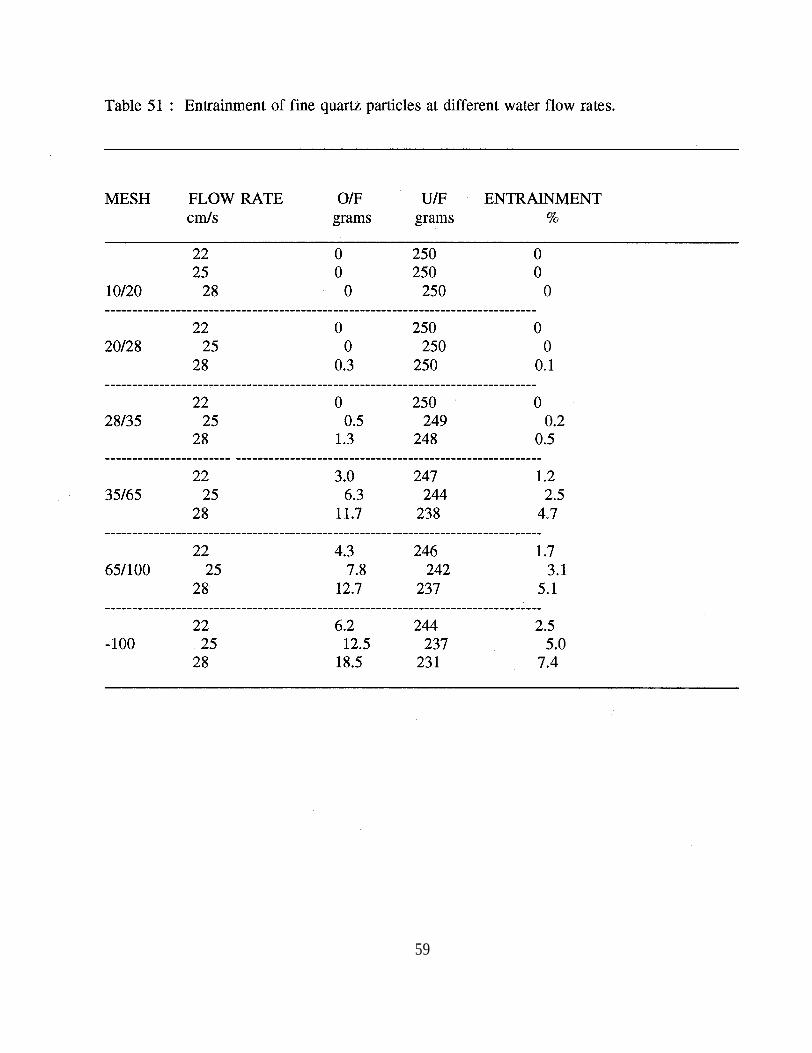
59
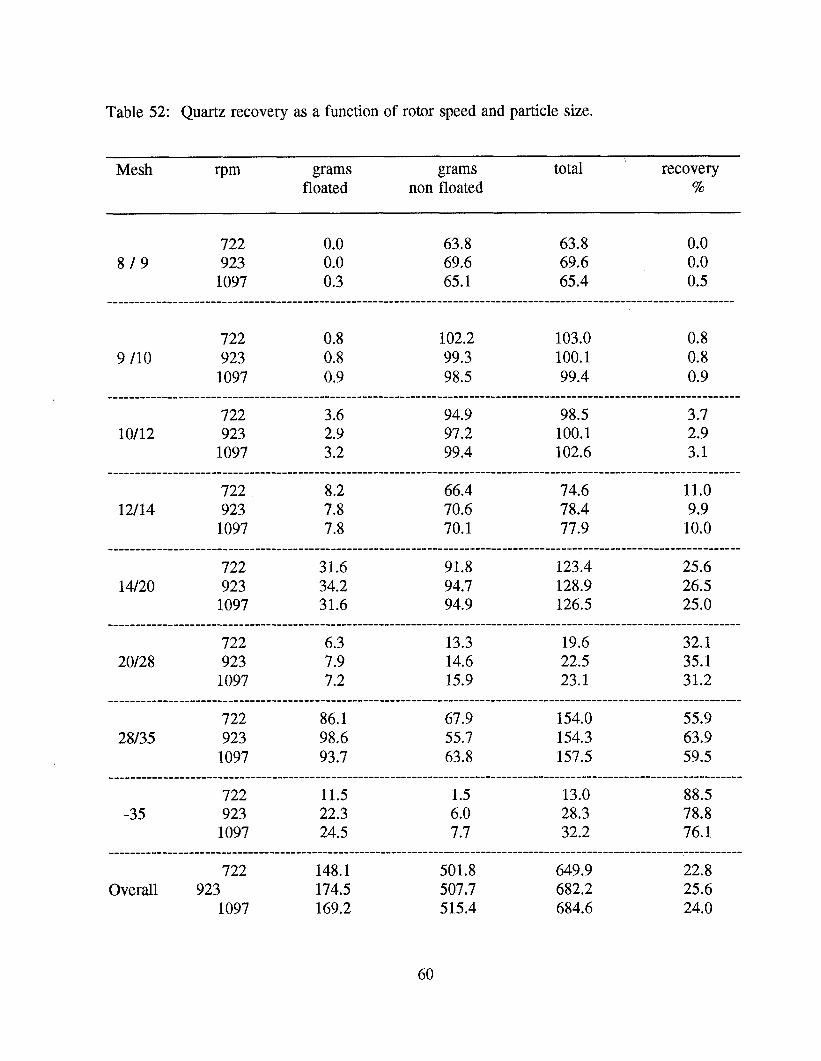
Table 52: Quartz recovery as a function of rotor speed and particle size.
Mesh rpm grams floated
grams non floated
total recovery %
722 0.0 63.8 63.8 0.0 8/9 923 0.0 69.6 69.6 0.0
1097 0.3 65.1 65.4 0.5
722 0.8 102.2 103.0 0.8 9 /lo 923 0.8 99.3 100.1 0.8
1097 0.9 98.5 99.4 0.9
722 3.6 94.9 98.5 3.7 10112 923 2.9 97.2 100.1 2.9
1097 3.2 99.4 102.6 3.1
722 8.2 66.4 74.6 11.0 12/14 923 7.8 70.6 78.4 9.9
1097 7.8 70.1 77.9 10.0 ___________________--------------------------------------------------------------------------------------------------
722 31.6 91.8 123.4 25.6 14/20 923 34.2 94.7 128.9 26.5
1097 31.6 94.9 126.5 25.0 __________________---------------------------------------------------------------------------------------------------
722 6.3 13.3 19.6 32.1 20128 923 7.9 14.6 22.5 35.1
1097 7.2 15.9 23.1 31.2 ____________________--------------------------------------------------------------------------------------------------
722 86.1 67.9 154.0 55.9 28/35 923 98.6 55.7 154.3 63.9
1097 93.7 63.8 157.5 59.5 ____________________--------------------------------------------------------------------------------------------------
722 11.5 1.5 13.0 88.5 -35 923 22.3 6.0 28.3 78.8
1097 24.5 7.7 32.2 76.1 ____________________---------------------------------------------------------------------------------------------------
722 148.1 501.8 649.9 22.8 Overall 923 174.5 507.7 682.2 25.6
1097 169.2 515.4 684.6 24.0
60