Florida Statewide Model Update - FSUTMSOnline 6, 2015. Presentation Outline ... and refined 2010...
26
Florida Statewide Model Update presented by Barry Plath URS Corporation Southern, a subsidiary of AECOM Date May 6, 2015
Transcript of Florida Statewide Model Update - FSUTMSOnline 6, 2015. Presentation Outline ... and refined 2010...

Florida Statewide Model Updatepresented by
Barry PlathURS Corporation Southern, a subsidiary of AECOM
DateMay 6, 2015

Presentation Outline
• FLSWM Overview• FLSWM Phase 1 Efforts
• FLSWM Phase 2 Planned Enhancements

Model Overview
Cube/Voyager Model
Model Overview
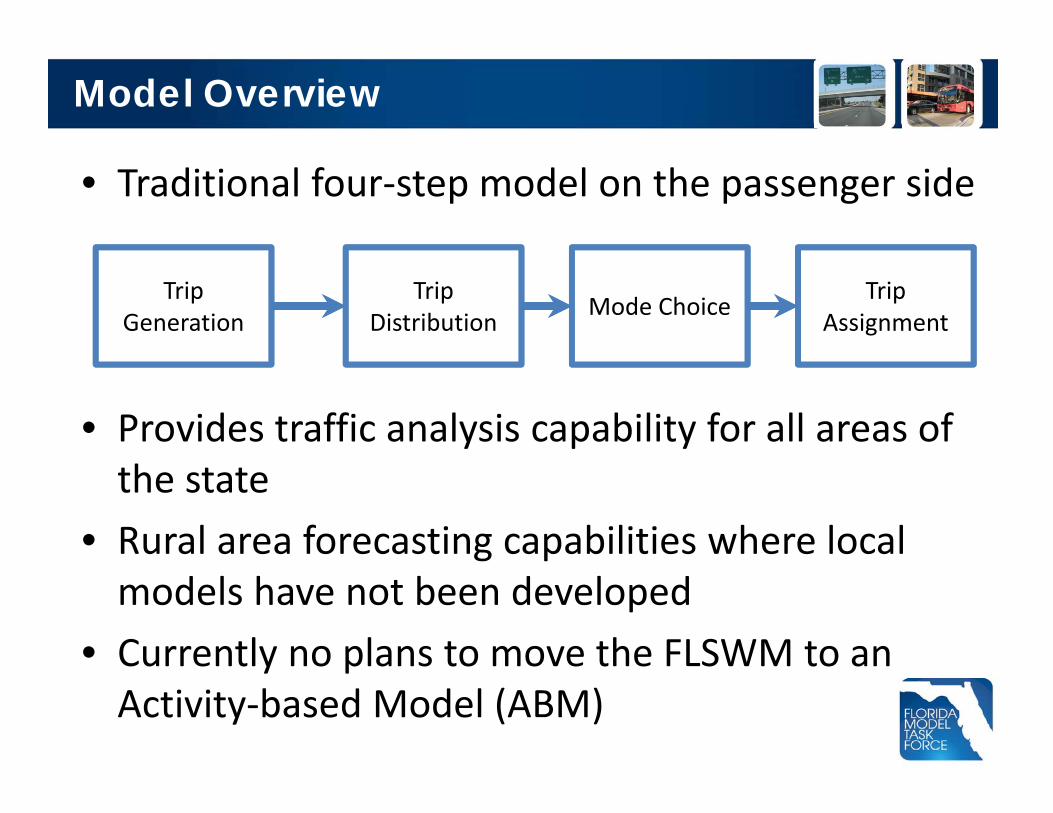
• Traditional four‐step model on the passenger side
• Provides traffic analysis capability for all areas of the state
• Rural area forecasting capabilities where local models have not been developed
• Currently no plans to move the FLSWM to an Activity‐based Model (ABM)
Trip Generation
Trip Distribution Mode Choice Trip
Assignment

Model Overview
FLSWM is two models – passenger model and freight model
Trip Distribution
Trip Generation
Auto Occupancy
FreightSIMModel
Passenger Model
Single Network ‐ Blended Assignment Methodology
SingleNetwork
Blended Assignment
Model Overview
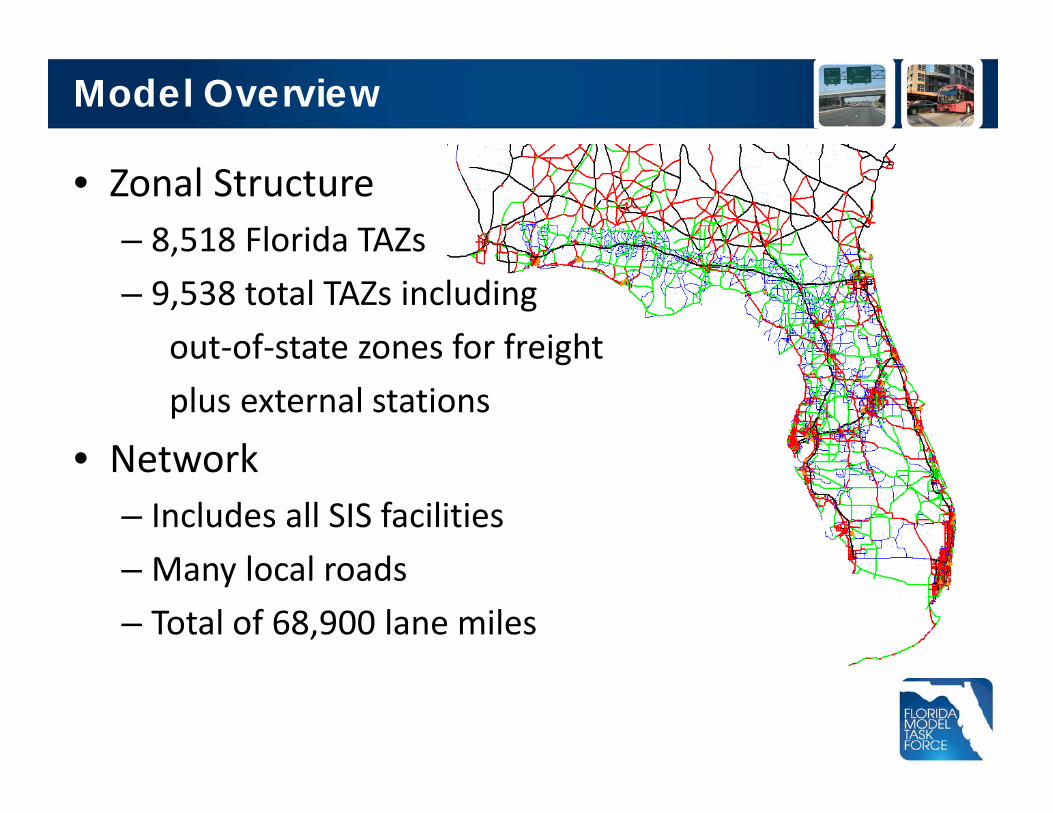
• Zonal Structure– 8,518 Florida TAZs– 9,538 total TAZs including
out‐of‐state zones for freightplus external stations
• Network– Includes all SIS facilities– Many local roads– Total of 68,900 lane miles

Model Overview
FLSWM Analysis Applications Existing corridors Potential corridors

Model Overview
Other potential uses– Regional model EE/EI analysis– Subarea extraction and sub‐region model development
• Rural region model development (i.e. Big Bend)• District model development for those with larger rural areas (i.e. District 2 model)
– Freight analysis

FLSWM Phase 1 Efforts
Overview of 2010 Model Updates
9
Trip GenerationTrip Generation
Trip DistributionTrip Distribution
Truck ComponentTruck Component
– Hypothetical choice scenarios– Which option do you prefer under these
conditions?
– Household demographics
Trip AssignmentTrip Assignment – Transit usage and opinions
Updated friction factor curves, recalibrate gravity model, refined trip distribution
and length by trip type
Updated friction factor curves, recalibrate gravity model, refined trip distribution
and length by trip type
Network UpdatesNetwork Updates
Developed trip rates for each trip purpose by county
Developed trip rates for each trip purpose by county
Updated speeds, area and facility types and refined 2010 count database
Updated speeds, area and facility types and refined 2010 count database
Updated/refined volume-delay curves by area type and facility type
Updated/refined volume-delay curves by area type and facility type
Incorporated freight model; removed the QRFM components and replaced with standard FSUTMS truck/taxi purpose
Incorporated freight model; removed the QRFM components and replaced with standard FSUTMS truck/taxi purpose
Zones/SE DataZones/SE Data Updated zone structure and socioeconomic data (Pop, DU, Emp)
Updated zone structure and socioeconomic data (Pop, DU, Emp)

FLSWM Phase 1 Efforts
Network updates– Posted speeds now used
• Main source is the RCI database for the state system• Many local roads have been updated via Google’s streetview
– Urban/rural area types refined to reflect 2010 definitions– Facility types refined to reflect FDOT functional classifications
– 2010 counts input onto the network• Used 2010 Turnpike State Model count database as a reference to improve on count accuracy in volume and location where necessary

FLSWM Phase 1 Efforts
Trip Generation Rate ChangesPrevious trip generation based on 17 regions
Now trip generation based on 67 areas (county level)

FLSWM Phase 1 Efforts
Trip Distribution Updates
0
1,000,000
2,000,000
3,000,000
4,000,000
5,000,000
6,000,000
7,000,000
8,000,000
0 5 10 15 20 25 30 35 40 45 50 55 60 65 70 75
Person
Trip
s
Miles
FLSWM Trip Length Distribution
Work Shop SocRec Other NHB TT

FLSWM Phase 1 Efforts
Person Trip Purposes Vehicle Trip Purposes
Passenger HBW
Short Urban/Rural
Passenger HBSH
Passenger HBSR
Passenger HBO
Passenger NHB
Passenger Long‐dist. Business Long‐dist. Business
Passenger In‐state Tourist In‐state Tourist
Passenger Out‐of‐state Tourist Out‐of‐state Tourist
External/Internal External/Internal
QRFM Light Truck Light Truck
Freight modelMedium Truck
Heavy Truck
Person Trip Purposes Vehicle Trip Purposes
Passenger HBW
Short Urban/Rural
Passenger HBSH
Passenger HBSR
Passenger HBO
Passenger NHB
External/Internal External/Internal
Truck/Taxi Truck/Taxi
Freight modelMedium Truck
Heavy Truck
Trip Person and Vehicle Trip Purpose ComparisonOld Structure New Structure

FLSWM Phase 1 Efforts
0.000
0.200
0.400
0.600
0.800
1.000
1.200
0.00 0.10 0.20 0.30 0.40 0.50 0.60 0.70 0.80 0.90 1.00 1.10 1.20 1.30 1.40 1.50 1.60 1.70 1.80 1.90 2.00
Congested/Uncon
gested
Spe
ed Ratio
Current FLSW Volume/Delay Curves
BPRorg
Interstate
Div Arterial
Undiv Art.
Collector
Toll
Vol/Cap
Urban
Rural
Volume/Delay Curve Updates

FLSWM Phase 1 Efforts
FLSWM FreightSIM– Only supply chain statewide model in the U.S.
– Captures import/export and domestic freight movements
– Purposes:• Support freight planning• Evaluate potential large‐scale infrastructure investments
• Provide corridor level freight evaluations
• Regional transportation planning tool

FLSWM Phase 1 Efforts
2010 FLSWM Phase 1 Recap
16

FLSWM Phase 2 Efforts
Phase 2 Goals
17
Trip GenerationTrip Generation
Trip DistributionTrip Distribution
Truck ComponentTruck Component
– Hypothetical choice scenarios– Which option do you prefer under these
conditions?
– Household demographics
Trip AssignmentTrip Assignment – Transit usage and opinions
Trip length distribution by purpose in placeTrip length distribution by purpose in place
Network and Land Use UpdatesNetwork and Land Use Updates
Trip generation by purpose and county in place
Trip generation by purpose and county in place
Migrate to NavteqBring in more network and make zone splits Bring in parcel data for SE data refinement
Migrate to NavteqBring in more network and make zone splits Bring in parcel data for SE data refinement
Further refine the volume-delay curves Add in a dynamic area type feature
Improve volume-to-count ratios and RMSEs
Further refine the volume-delay curves Add in a dynamic area type feature
Improve volume-to-count ratios and RMSEs
Improve the truck volume-to-count ratiosImprove the truck volume-to-count ratios
FLSWM Phase 2 Efforts
Key network/database enhancements– Use Navteq network features– Populate all appropriate Navteq segments with modeling network
attributes– Develop zones and zonal data that are true to Navteq line work
and take into account natural feature boundaries such as lakes, rivers, coastal areas, etc.
– Provide an interface that implements a many‐to‐one conversion process
– Develop a product that gives the ability to • warehouse all necessary network attributes in a database • bring in the correct attributes and model year into Cube for processing• output model attributes back to the database for analysis and use by others
• reduce model run times (passenger model under 2 hours with 8‐core system)
– Bring in parcel data for each county to better geo‐reference existing socioeconomic data and provide a mechanism to merge land use modeling with the travel demand forecasting process
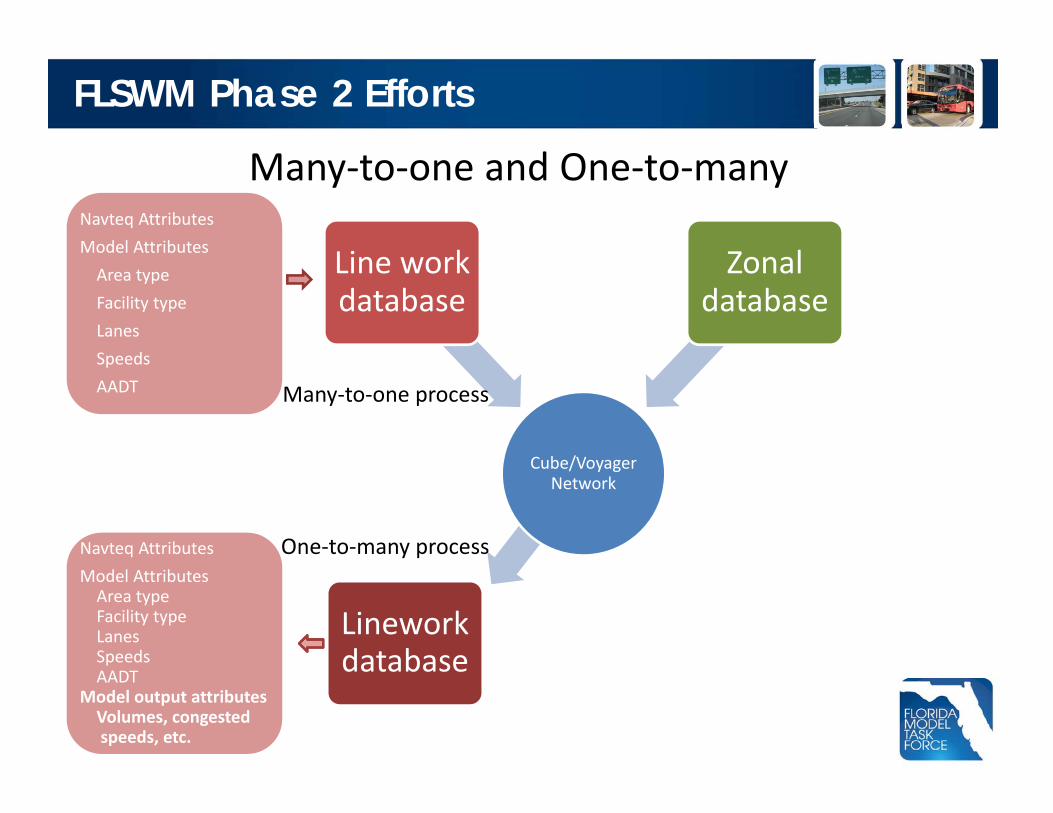
Many‐to‐one and One‐to‐many
Cube/Voyager Network
Line work database
Zonal database
FLSWM Phase 2 Efforts
Lineworkdatabase
Navteq AttributesModel AttributesArea typeFacility typeLanesSpeedsAADT
Navteq AttributesModel AttributesArea typeFacility typeLanesSpeedsAADT
Model output attributesVolumes, congestedspeeds, etc.
Many‐to‐one process
One‐to‐many process
FLSWM Phase 2 Efforts
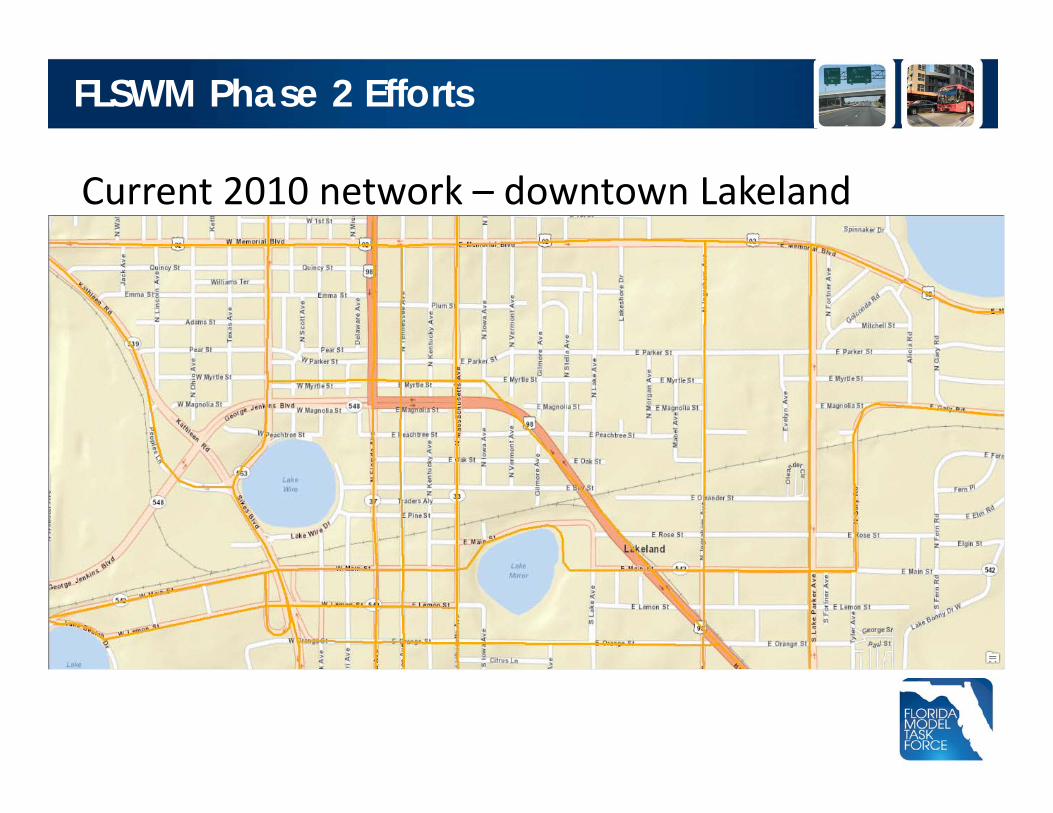
Current 2010 network – downtown Lakeland

FLSWM Phase 2 Efforts
Network adjustments will be made using Navteq

FLSWM Phase 2 Efforts
Advantages of Navteq Network– Navteq more accurately reflects Florida’s road alignments– Florida public agencies have access to Navteq through the state‐wide
contract– FDOT has placed its Linear Referencing System (LRS) on Navteq– Every Navteq segment in the State Highway System or TranStat
basemap has a Roadway ID, Begin Mile Post, End Mile Post

FLSWM Phase 2 Efforts
Because each FLSWM segment will be tagged with LRS and model information….
– FLSWM existing and future year data can be extracted for the Strategic Intermodal System (SIS) by roadway ID/MP and included in Central Office’s SIS Investment Tool (SIT). SIT is used to rank roads in most need of work program dollars
– FLSWM future volumes can be compared to those submitted by the Districts in the LOS submittal to Central Office. The comparisons can be done using the roadway ID/MP definition

FLSWM Phase 2 Efforts – Future Years
Land Use Modeling Integration
– Made possible by• Migration to Navteq• Use of parcel data
– Uses county control total forecasts from other agencies (i.e. BEBR)
– Allocates incremental land use growth amounts within the county based on
• Available land• Accessibility• Other variables

FLSWM Beyond Phase 2 Efforts
• Development of a light truck model based on truck surveys
• Toll Choice Model– Develop toll choice within the mode choice phase– Implement ramp‐to‐ramp tolling
• Tourist Model Development– Need for tourist surveys

FLSWM Update – Question and Answer