Florida National Scenic Trail Visitor Assessment - School of Forest
67
FLORIDA NATIONAL SCENIC TRAIL VISITOR ASSESSMENT DRAFT i ANNUAL REPORT 2007-2008 DRAFT Florida National Scenic Trail Visitor Assessment 2008 Presented to: National Forests in Florida, U.S.D.A. Forest Service Florida Trail Association By: Rachel Albritton Bin Wan Taylor Stein University of Florida, School of Forest Resources and Conservation
Transcript of Florida National Scenic Trail Visitor Assessment - School of Forest
FLORIDA NATIONAL SCENIC TRAIL VISITOR ASSESSMENT DRAFT
i ANNUAL REPORT 2007-2008 DRAFT
Florida National Scenic
Trail Visitor Assessment
2008
Presented to:
National Forests in Florida, U.S.D.A. Forest Service
Florida Trail Association
By:
Rachel Albritton
Bin Wan
Taylor Stein
University of Florida, School of Forest Resources and Conservation

FLORIDA NATIONAL SCENIC TRAIL VISITOR ASSESSMENT DRAFT
ii ANNUAL REPORT 2007-2008 DRAFT
Table of Contents
EXECUTIVE SUMMARY ................................................................................................................................ 6
INTRODUCTION ............................................................................................................................................ 8
Study Purpose and Objectives ................................................................................................................... 8
METHODOLOGY ........................................................................................................................................... 9
Survey Sections ......................................................................................................................................... 9 Counting Visitors on the FNST ................................................................................................................ 9
When ..................................................................................................................................................................... 9 Where .................................................................................................................................................................. 10 How ..................................................................................................................................................................... 10
Defining Visitor Characteristics .............................................................................................................. 12 Visitor Questionnaires ......................................................................................................................................... 13
Data Analysis .......................................................................................................................................... 13 Personal Observations ......................................................................................................................................... 13 Mechanical Pedestrian Counters ......................................................................................................................... 15 Visitor Questionnaires ......................................................................................................................................... 16
RESULTS ..................................................................................................................................................... 16
Visitor Use Estimates .............................................................................................................................. 16 Estimate of Summer Visits.................................................................................................................................. 16 Estimation of Fall/Spring Visits .......................................................................................................................... 19 Estimation of Annual Visits ................................................................................................................................ 21 Comparison of Site Visitation ............................................................................................................................. 22
On-Site Survey ........................................................................................................................................ 22 Visitor Demographics ......................................................................................................................................... 23
CONCLUSION AND TRAIL MANAGEMENT IMPLICATIONS ...................................................................... 31
Visitor Counts ......................................................................................................................................... 31 Visitor Surveys ........................................................................................................................................ 32
REFERENCES .............................................................................................................................................. 32
APPENDIX I: 5 YEAR STUDY SCHEDULE ............................................................................................... 34
APPENDIX II : PROTOCOL FOR CLASSIFYING ACCESS POINTS ........................................................... 36
APPENDIX III: MONITORED ACCESS POINTS 2006-2007 ..................................................................... 38
APPENDIX IV: OBSERVATION LOG ....................................................................................................... 40
APPENDIX V: 2007-2008 COUNTER LOCATIONS .................................................................................. 42
APPENDIX VI : 2007-2008 SEASONAL CALIBRATION FACTORS .......................................................... 66
APPENDIX VII: ON-SITE SURVEY .......................................................................................................... 65
APPENDIX IX: INDIVIDUAL SITE INFORMATION .................................................................................. 65

FLORIDA NATIONAL SCENIC TRAIL VISITOR ASSESSMENT DRAFT
3 ANNUAL REPORT 2007-2008 DRAFT
Cross Florida Greenway .......................................................................................................................... 66 Survey Data Results ............................................................................................................................................ 66 Counter Data Results .......................................................................................................................................... 67
Ocala National Forest .............................................................................................................................. 69 Visitor Survey Data ............................................................................................................................................. 69 Counter Data ....................................................................................................................................................... 70
Goldhead Branch State Park ................................................................................................................... 72 Visitor Survey Data ............................................................................................................................................. 72 Counter Data ....................................................................................................................................................... 73
Little Big Econ State Forest .................................................................................................................... 74 Visitor Survey Data ............................................................................................................................................. 74 Visitor Counter Data ........................................................................................................................................... 75
Big Cypress National Preserve ............................................................................................................... 76 Visitor Counter Data ........................................................................................................................................... 76
Etoniah State Forest ................................................................................................................................ 78 Visitor Counter Data ........................................................................................................................................... 78
Stephen Foster Folk Culture Center State Park ....................................................................................... 80 Visitor Counter Data ........................................................................................................................................... 80
Osceola National Forest .......................................................................................................................... 82 Visitor Counter Data ........................................................................................................................................... 82
Apalachicola National Forest .................................................................................................................. 84 Visitor Counter Data ........................................................................................................................................... 84

FLORIDA NATIONAL SCENIC TRAIL VISITOR ASSESSMENT DRAFT
4 ANNUAL REPORT 2007-2008 DRAFT
List of Tables
Table Page
Table 1. Site use classification ...................................................................................................................... 9
Table 2. Access point classification .............................................................................................................. 9
Table 3. Estimate of summer visitation at 2007-2008 Study Sites ............................................................. 17
Table 4. Estimates of FNST trail-wide visits, summer 2007 Use ............................................................... 18
Table 5. Estimate of fall/spring visitation at 2007-2008 study site ............................................................. 19
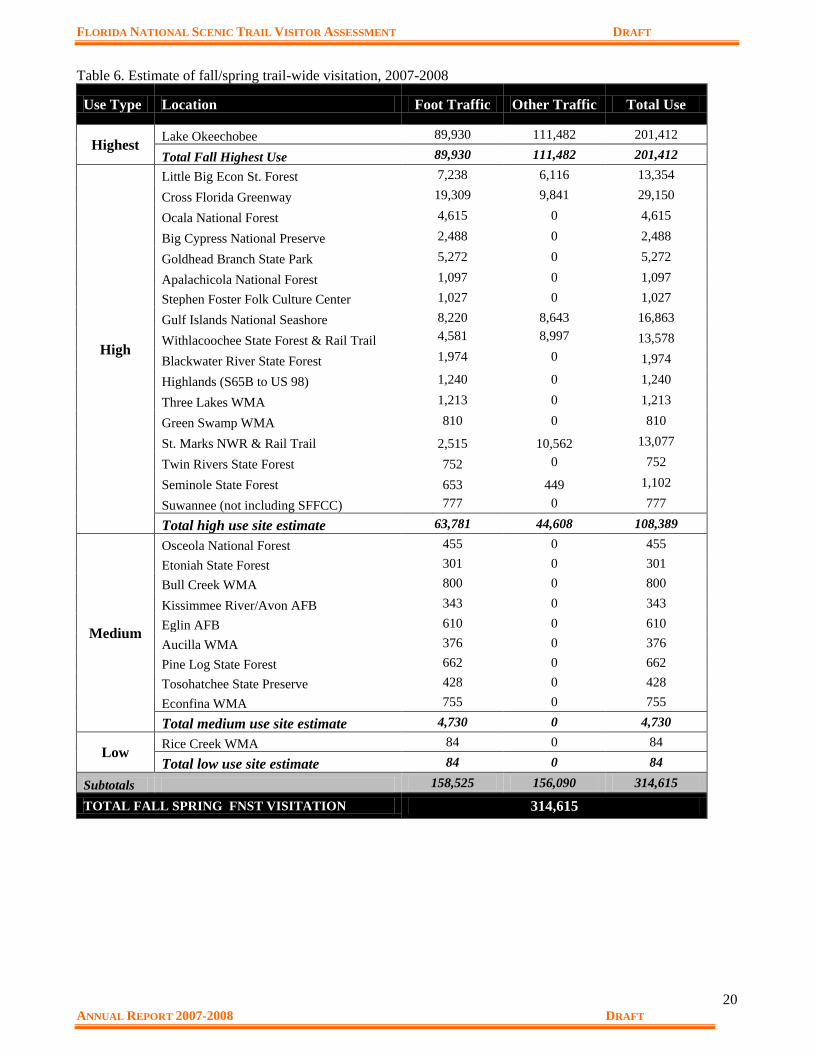
Table 6. Estimate of fall/spring trail-wide visitation, 2007-2008 ............................................................... 20
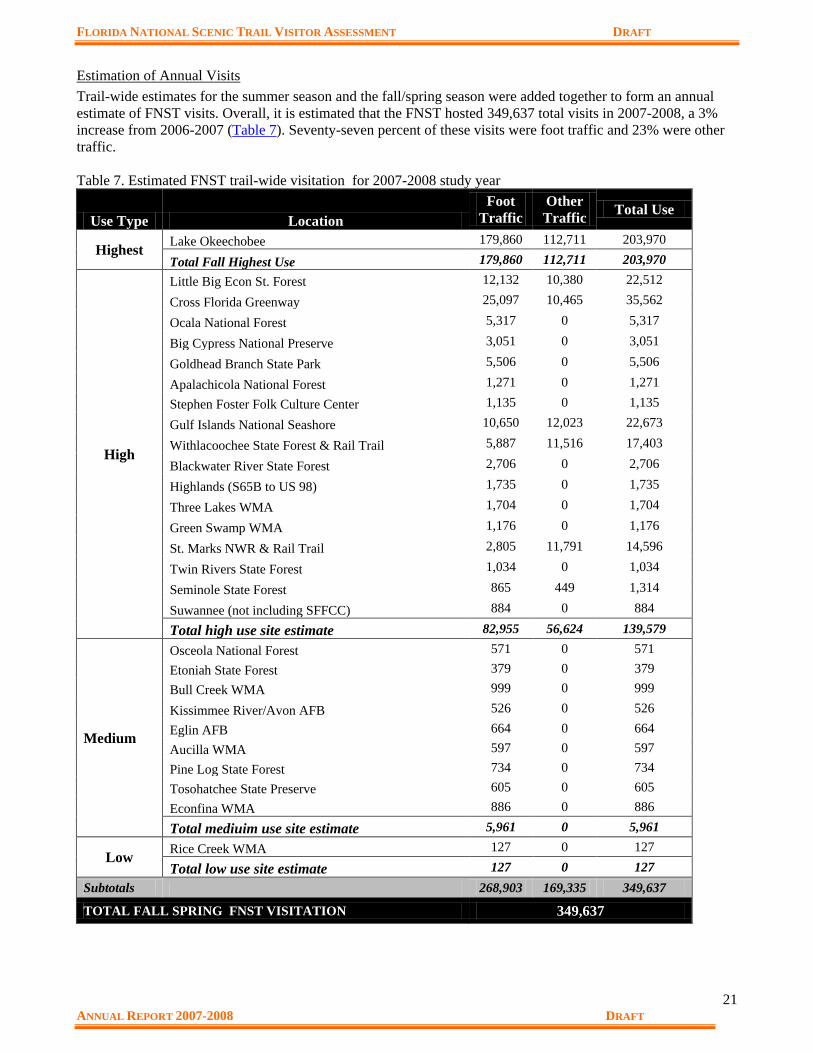
Table 7. Estimated FNST trail-wide visitation for 2007-2008 study year ................................................. 21
Table 8. Socio-Demographic Information .................................................................................................. 24
Table 9. Comparison of distance traveled by site ....................................................................................... 25
Table 10. Trip Characteristics & Knowledge ............................................................................................. 26
Table 11. Comparison of past visits by site ................................................................................................ 26
Table 12. Activities participated in ............................................................................................................. 27
Table 13. Group characteristics .................................................................................................................. 27
Table 14. Trail Experience .......................................................................................................................... 28
Table 15. Motivations ................................................................................................................................. 29
Table 16. Destination attractors .................................................................................................................. 30
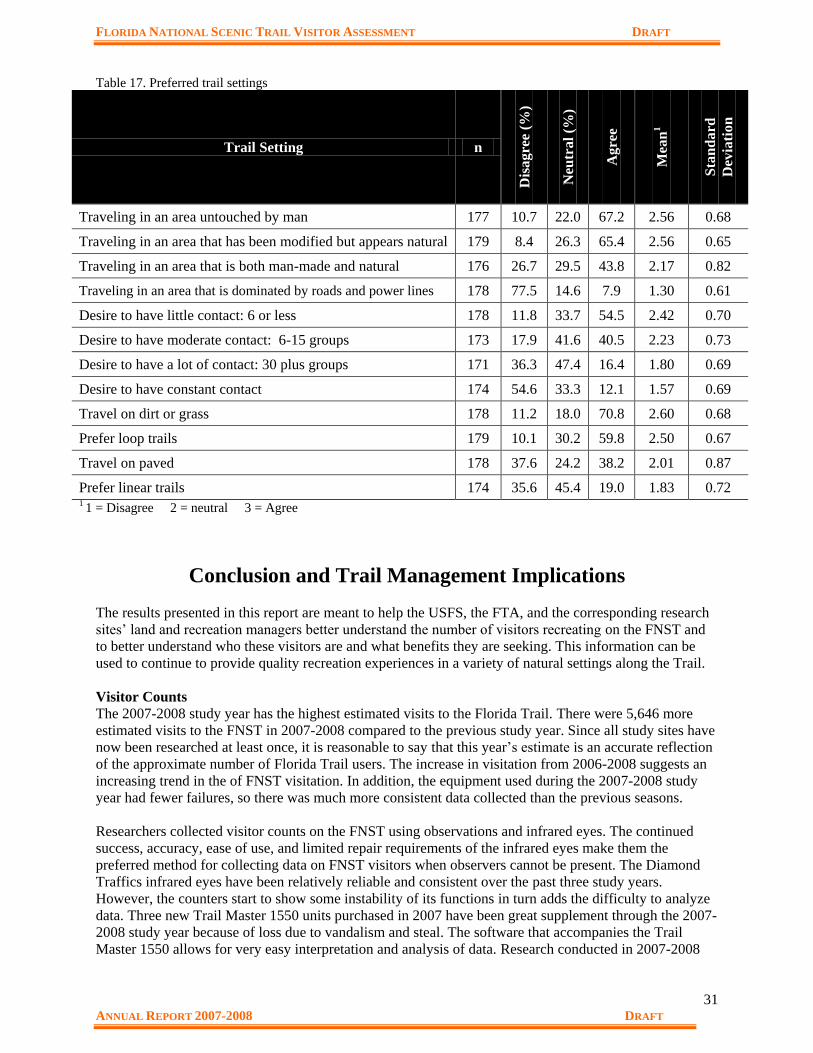
Table 17. Preferred trail settings ................................................................................................................. 31
Table 18. 2007-2008 Calibration Factors ................................................................................................... 65
Table 19. FNST Trail visitation along the CFG 2007-2008 ....................................................................... 67
Table 20. FNST visitation at Goldhead Branch St. Park 2007-2008 .......................................................... 73
Table 21. FNST visitation at Little Big Econ St. Forest 2007-2008 ........................................................... 75
Table 22. FNST Trail Visitation at Big Cypress National Preserve 2007-2008 ......................................... 76
Table 23. Comparison of FNST visitation at Big Cypress 2006-2008 ....................................................... 77
Table 24. FNST visitation within Etoniah St. Forest 2007-2008 ................................................................ 78
Table 25. Comparison of FNST visitation at Etoniah St. Forest ................................................................ 79
Table 26. FNST Visitation at Stephen Foster St. Park 2007-2008 ............................................................. 80
Table 27. Comparison of visitation at Stephen Foster St. Park .................................................................. 80
Table 28. FNST visitation at Osceola National Forest 2007-2008 ............................................................. 82
Table 29. Comparison of visitation at Osceola National Forest 2003-2008 ............................................... 83
Table 30. FNST visitation at Apalachicola National Forest 2007-2008 ..................................................... 84
Table 31. Comparison of FNST visitation at Apalachicola National Forest 2003-2008 ............................ 85
FLORIDA NATIONAL SCENIC TRAIL VISITOR ASSESSMENT DRAFT
5 ANNUAL REPORT 2007-2008 DRAFT
List of Figures
Figure Page
Figure 1. Annual use of the Florida National Scenic Trail 2003-2008 ......................................................... 7
Figure 2. Florida National Scenic Trail 2008 Study Sites .......................................................................... 11
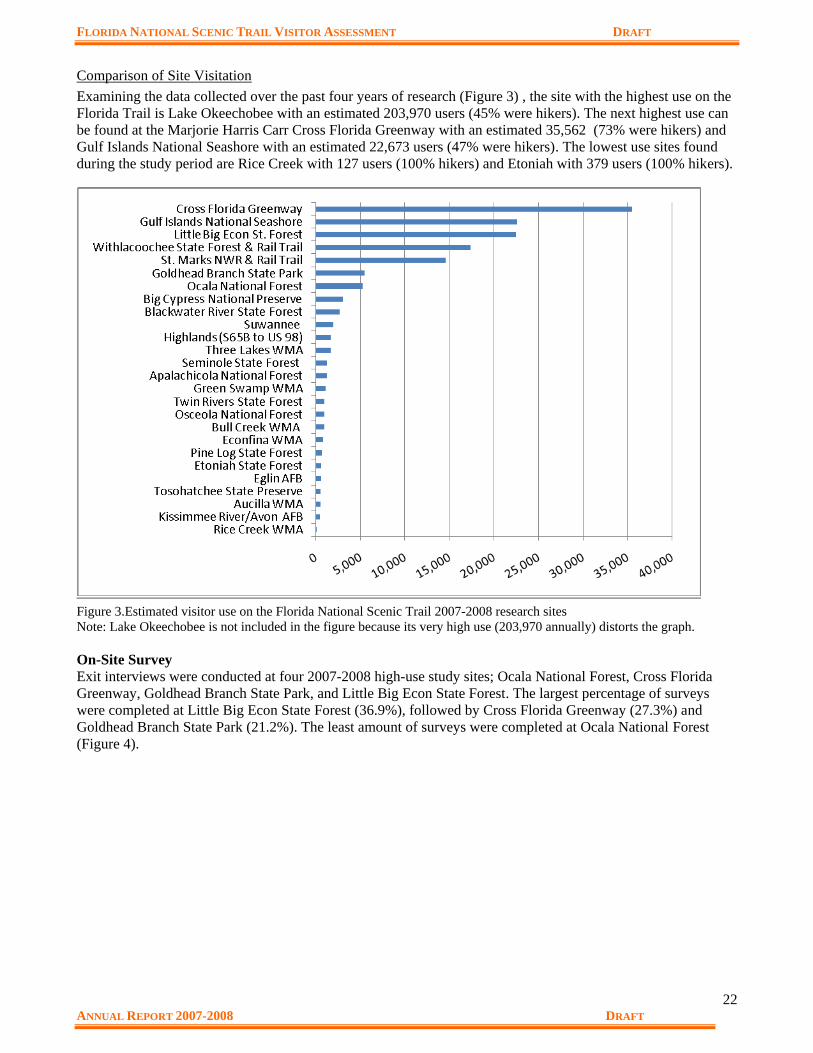
Figure 3.Estimated visitor use on the Florida National Scenic Trail 2007-2008 research sites .................. 22
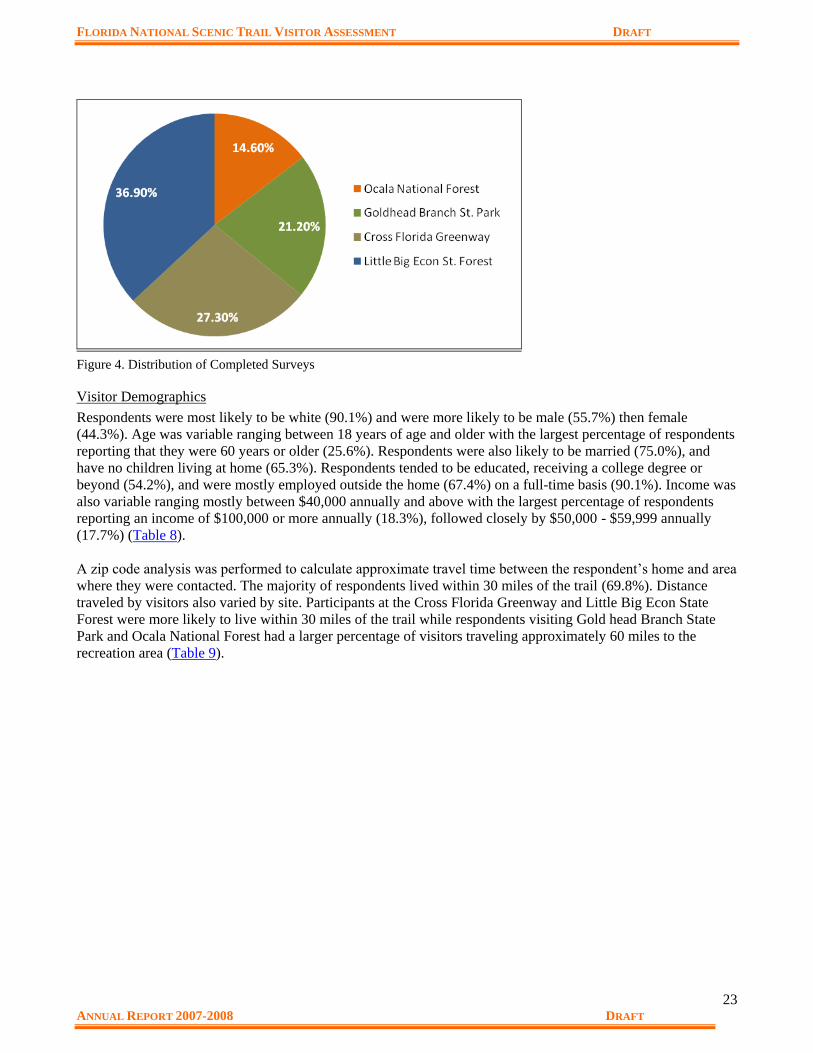
Figure 4. Distribution of Completed Surveys ............................................................................................. 23
Figure 4. FNST Trail visitation along the CFG 2007-2008 ........................................................................ 68
Figure 5. FNST visitation at Goldhead Branch St. Park 2007-2008 ........................................................... 73
Figure 6. FNST visitation at Little Big Econ State Forest 2007-2008 ........................................................ 75
Figure 7. FNST visitation at Big Cypress National Preserve 2007-2008 ................................................... 76
Figure 8. Comparison of FNST visitation at Big Cypress National Preserve 2006-2008 .......................... 77
Figure 9. FNST visitation within Etoniah St. Forest 2007-2008 ................................................................ 78
Figure 10. Comparison of FNST visitation at Etoniah St. Forest ............................................................... 79
Figure 11. FNST visitation at Stephen Foster St. Park 2007-2008 ............................................................. 80
Figure 12. Comparison of visitation at Stephen Foster St. Park ................................................................. 81
Figure 13. FNST visitation at Osceola National Forest 2007-2008 ............................................................ 82
Figure 14. Comparison of visitation at Osceola National Forest 2003-2008 .............................................. 83
Figure 15. FNST visitation at Apalachicola National Forest 2007-2008 .................................................... 84
Figure 16. Comparison of FNST visitation at Apalachicola National Forest 2003-2008 .......................... 85

FLORIDA NATIONAL SCENIC TRAIL VISITOR ASSESSMENT DRAFT
6 ANNUAL REPORT 2007-2008 DRAFT
Executive Summary
The University of Florida’s School of Forest Resources and Conservation (SFRC) began a collaborative
visitor assessment project for the Florida National Scenic Trail (FNST) with the U.S. Forest Service
(USFS) and the Florida Trail Association (FTA) in June of 2003. The purpose of the study is twofold.
First, researchers are striving to determine reliable use estimates of annual trail visits to 27 segments of
the FNST. Second, researchers are also gathering information on who FNST visitors are and develop a
continual understanding of why they visit the trail. Following baseline data collection from 2003-2007,
the visitor counts and visitor information has continued to be gathered in order to evaluate trends in
visitation numbers as well trends in visitor characteristics. This report discusses the results of sites re-
studied from June 1, 2007 – May 31 2008.
Study Methods
Data Collection: Trail Estimations
Three methods are used to collect FNST visitation data at annual survey sites:
Personal Observations
Mechanical Counters
o Infrared Eyes
o Pressure Pads (2003-2006 only)
Supplemental Materials (2003-2004 only)
Data Collection: Visitor Characteristics
In addition, visitor questionnaires are used to gather information on visitor characteristics at annual
survey sites.
2007-2008 Results
Estimation of Trail Visits
The FNST is primarily meant to be a footpath covering the length of Florida; however several segments
of the FNST are multiple use. Therefore, two annual estimates are reported. The first estimate is
pedestrian visits only, which includes hikers, walkers, joggers, and runners. The second estimate includes
those visitors that do not fall into the pedestrian category such as bikers, roller blade users, horseback
riders, etc. and are categorized as other users. These two use categories are then summed together for
both summer and fall/spring seasons to form an annual FNST visitation estimate. For the 2007-2008
study season, the FNST received an estimated 338, 023 visits of which 58% were estimated to be
pedestrian visits and 42% were estimated to be other visits.
Total estimation of annual visits: 349,637
Total pedestrians: 268,903
Total other users: 169,335
Total estimated summer use (June 1- September 30) : 35,022
Total estimated fall/spring use (October-May) : 314,615
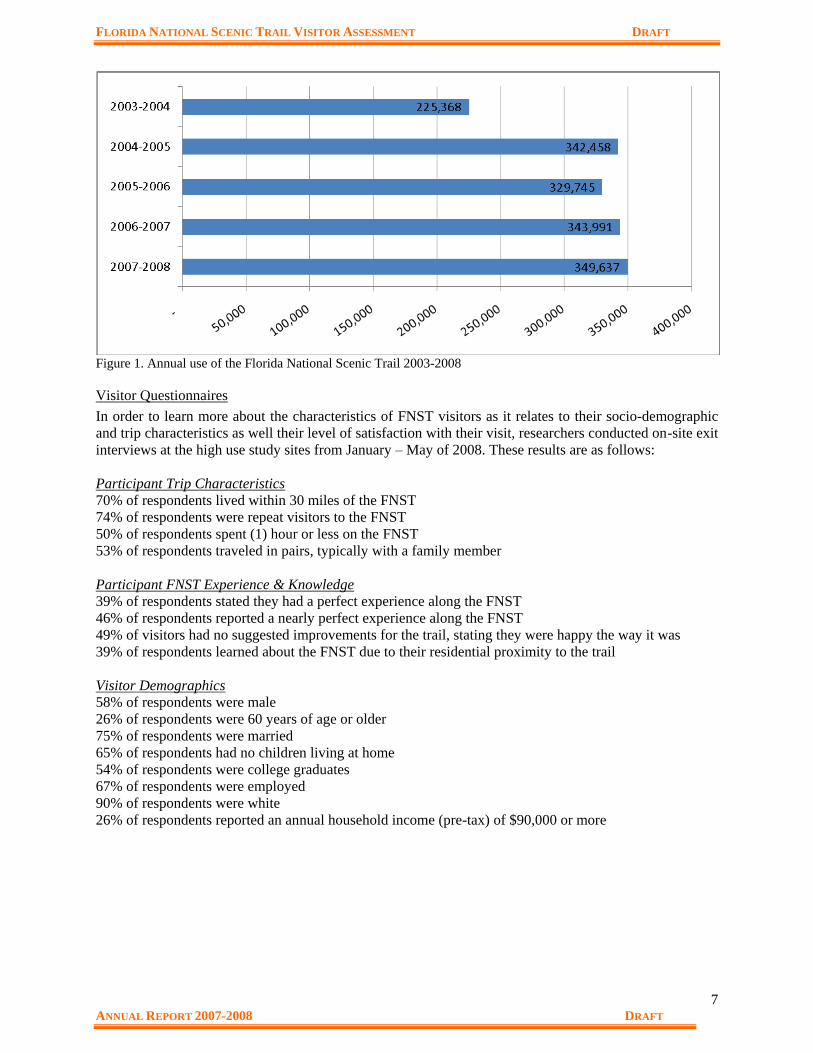
Annual Use of the FNST
The FNST Visitor Assessment has collected data since 2003 on Florida National Scenic Trail visitation.
Results have shown that the FNST receives between 225,000 and 350,500 visits per year (Figure 1).
Survey methodology was modified over the course of the project to improve accuracy, so it is felt that
numbers for the last four study periods most accurately reflect trail usage.
FLORIDA NATIONAL SCENIC TRAIL VISITOR ASSESSMENT DRAFT
7 ANNUAL REPORT 2007-2008 DRAFT
Figure 1. Annual use of the Florida National Scenic Trail 2003-2008
Visitor Questionnaires
In order to learn more about the characteristics of FNST visitors as it relates to their socio-demographic
and trip characteristics as well their level of satisfaction with their visit, researchers conducted on-site exit
interviews at the high use study sites from January – May of 2008. These results are as follows:
Participant Trip Characteristics
70% of respondents lived within 30 miles of the FNST
74% of respondents were repeat visitors to the FNST
50% of respondents spent (1) hour or less on the FNST
53% of respondents traveled in pairs, typically with a family member
Participant FNST Experience & Knowledge
39% of respondents stated they had a perfect experience along the FNST
46% of respondents reported a nearly perfect experience along the FNST
49% of visitors had no suggested improvements for the trail, stating they were happy the way it was
39% of respondents learned about the FNST due to their residential proximity to the trail
Visitor Demographics
58% of respondents were male
26% of respondents were 60 years of age or older
75% of respondents were married
65% of respondents had no children living at home
54% of respondents were college graduates
67% of respondents were employed
90% of respondents were white
26% of respondents reported an annual household income (pre-tax) of $90,000 or more

FLORIDA NATIONAL SCENIC TRAIL VISITOR ASSESSMENT DRAFT
8 ANNUAL REPORT 2007-2008 DRAFT
Introduction
The 1,400 mile Florida National Scenic Trail (FNST) traverses through both urban and rural areas
creating a footpath that stretches almost the entire length of Florida. As a result, the FNST is no more then
120 miles from all Florida residents, with the exception of the Florida Keys. The Trails dynamic location
attracts thousands of visitors annually, and provides various passive recreation opportunities beyond
hiking such as nature study, photography, and bird watching.
A nationwide survey of state and federal trail managers indicated collecting trail use data is of high
importance, and that the collection of this data would be crucial to future management success for trail
planning and other related projects (Lynch, J. et al, 2002). Visitor monitoring is a key component to
effectively managing recreation on a regional scale. This process, which is often limited by resources
(i.e. money, staff, etc), centers around two main procedures: 1) obtaining the number of visitors to an
area, and 2) administering visitor questionnaires (Cope et al., 1999). The necessity for collecting visitor
counts is slowly emerging within recreation and land use agencies. This data helps in justifying budget
requests, and it can provide a direction for appropriate resource distribution (Loomis, 2000). The most
common method for collecting visitor counts has been through the use of mechanical counters. However,
records on visitor counts are also kept through visitor sign in sheets, registration cards, and personal
observations. In addition to obtaining information on the number of visitors to an area, gathering specific
information on visitors themselves such as visitor motivations, visitor preferences, visitor knowledge of
the area, and visitor socio-demographics can help managers and planners create a balance between the
conservation of the surrounding habitat and providing quality recreation experiences.
Baseline monitoring efforts along the Florida National Scenic Trail (FNST) were undertaken by the U.S.
Forest Service with the help of the University of Florida, School of Forest Resources and Conservation
from June 1, 2003-May 31, 2007, in order to gather baseline information on current trail visitation and
current visitor characteristics. Beginning in June 2007, data collection as re-started at previously
monitored sites, allowing an initial investigation of visitor use trends along re-sampled sections of the
Florida Trail. As these monitoring efforts continue over the next several years, management will be
provided with scientifically collected information to assist in monitoring if and how FNST visitation is
changing as well as if and how the characteristics of Trail visitors is changing. As a result, programmers,
managers, and volunteers will be provided with information to assist them in creating and enhancing
recreation opportunities along the FNST, as well as assisting the forest service in justifying the need to
acquire appropriate funding for FNST management (Loomis, 2000).
Study Purpose and Objectives
The purpose of the Florida National Scenic Trail Visitor Assessment study is to generate reliable use
estimates of annual visits to the FNST. A visit is defined as an individual entering and exiting the FNST.
Specifically, study objectives aim to:
1. generate reliable use estimates of each survey site, which can be inferred to all FNST survey
sections of similar categorized use which then can be combined to create a trail-wide visitation
estimate, and
2. to describe pedestrians in terms of their socio-demographic and trip characteristics, as well their
level of satisfaction.
This report presents the visitor estimates for June 1, 2007 through May 31, 2008 at nine identified survey
sites through which the Florida National Scenic Trail traverses. In addition, visitor characteristic
information was collected through the completion of on-site questionnaires at four of the nine study sites.
The results from these on-site questionnaires are reported within as well.

FLORIDA NATIONAL SCENIC TRAIL VISITOR ASSESSMENT DRAFT
9 ANNUAL REPORT 2007-2008 DRAFT
Methodology
Survey Sections
The Florida National Scenic Trail is composed of 42 sections. Using these 42 sections as a foundation for
survey efforts, UF researchers identified 27 survey sites within each section that would likely serve as exit
and/or entrance points for hikers. These areas tended to correspond closely to public lands with
established trailheads, which attract more hikers and serve as efficient survey sites. Preliminary research
then categorized these sites as receiving high, medium, or low use (Table 1). Third, survey sites were
geographically divided into groups, and each group was scheduled to be sampled for one year during the
five year visitor assessment (Appendix I). Fourth, each survey site was further divided into potential
FNST access points (Table 2). Although survey or counter data might not be collected at every access
point within a site, every access point is classified by use type. This classification allows data collected at
similar access points to be inferred to access points without data thereby making the annual visitation
estimate more reflective of actual use (Appendix II).
Table 1. Site use classification
Site Use Type Annual Number of Visits
High 1000 or more
Medium 366-999
Low 0-365
Table 2. Access point classification
Access Point
Type
Monthly Number of
Visits
A 500 or more
B 100-499
C 50-99
D 15-49
E 15 or less
Counting Visitors on the FNST
When
Study years are divided into two seasons:
1. Summer season, June 1st to September 31st
2. Fall/Spring Season, October 1st to May 31st
Beginning the study year during the summer, allows researchers ample time to contact recreation and land
managers at new study sites, install trail counters and work out any kinks that may arise with equipment
or the sampling framework over the summer months without sacrificing the loss of visitor use data. In
addition the advantages of starting in the summer, the use of two survey seasons allows researchers to
account for seasonal differences in Trail visitation.

FLORIDA NATIONAL SCENIC TRAIL VISITOR ASSESSMENT DRAFT
10 ANNUAL REPORT 2007-2008 DRAFT
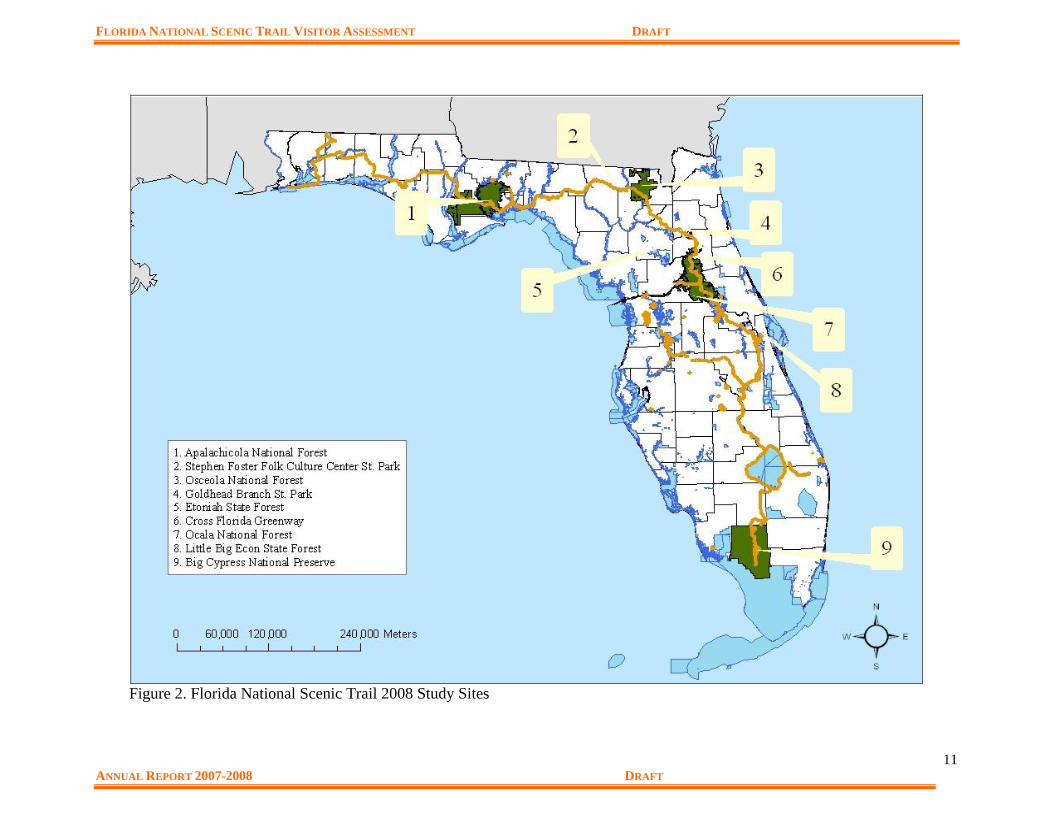
Where
From June 1, 2007 – May 31, 2008, researchers collected visitor use data from nine study sites (Figure 2):
1. Apalachicola National Forest
2. Stephen Foster Folk Culture Center St. Park
3. Osceola National Forest
4. Goldhead Branch State Park
5. Etoniah St. Forest
6. Cross Florida Greenway
7. Ocala National Forest
8. Little Big Econ State Forest
9. Big Cypress National Preserve
Information on individual sites where visitor surveys were gathered can be viewed in Appendix IX. These
nine study sites contained a total of 18 access points (Appendix III) that where monitored throughout the
study year.
How
To obtain reliable use estimates of pedestrians on the FNST, researchers combined four different
methods; (1) personal observations, (2) mechanical counters, (3) supplemental materials, and (4) visitor
questionnaires.
The following sections describe each technique.
Personal Observations
Personal observations are performed at sites were the FNST allows multiple use. This allows researcher to
differentiate between foot use (the predominate focus of the FNST) and other uses. A stratified random
sampling approach was used to assign personal observation times in conjunction with survey periods. The
sampling framework consists of two strata:
1. Day type
a. Weekdays (Monday - Thursday)
b. Weekends (Friday - Sunday)
2. Time of day
a. Morning
b. Afternoon
For the fall/spring season, every survey day contained four possible survey periods: (2) 3-hour survey
shifts in the morning and (2) 3-hour shifts in the afternoon. There are 244 days in the fall/spring season,
139 weekdays and 105 weekend days.
During these personal observation times, surveyors kept a tally of individuals entering and exiting the
FNST, as well as group size, the number of males, the number of females, activity, and direction of travel
(Appendix IV). These observation logs were used to generate an estimate of trail use at sites where
multiple use occurred using the methods outlined within the following section.
For the 2007-2008 study year, Baseline & 64th Street trailhead at the Cross Florida Greenway and the
Black Hammock Trailhead at Little Big Econ State Forest were the only sites in which user estimates
where estimated using the personal observation method.
FLORIDA NATIONAL SCENIC TRAIL VISITOR ASSESSMENT DRAFT
11 ANNUAL REPORT 2007-2008 DRAFT
Figure 2. Florida National Scenic Trail 2008 Study Sites
FLORIDA NATIONAL SCENIC TRAIL VISITOR ASSESSMENT DRAFT
12 ANNUAL REPORT 2007-2008 DRAFT
Mechanical Pedestrian Counters
UF researchers used two types of infrared counters to generate visitor use estimates. While the installation of the
two pieces of equipment differs, the data collection methods are the similar. A total of 18 counters where
installed for the 2007-2008 survey season (Appendix V). Each of these counters are discussed below.
Active Infrared Eyes
The Diamond Traffics TCC-4420 infrared eye trail counter was originally designed by the U.S. Forest Service
equipment center to aid in trail monitoring in remote areas. The counter is cased within water-proof aluminum,
and operates on 4-D batteries that usually last 12-15 months. The counter is installed on a tree or wooden post
and is aligned with a reflector 20-75 feet across the trail creating an invisible beam. When this beam is broken a
hiker, wildlife, or other user is recorded with no differentiation between user types. The counter has an ability to
provide researchers with hourly counts for up to 420 days equating to approximately 25,000 counts.
The TrailMaster 1550 active infrared eye was also installed at several research sites over the course of the study
year. This counter gathers data in the same fashion as the Diamond Traffics eye, however the way in which is
stores data is slightly different. The counter is cased with water proof hard plastic, and operates on 4-C batteries
that usually last 8-10 months. The counter is installed on a tree or wooden post and is aligned with a transmitter
20 to 145 feet across. Unlike the diamond traffics counter that indicates the exact percentage of alignment
between the eye and the reflector, this counter only indicates to the field technician if the counter is aligned or
not, and does not indicate the strength of the alignment. However, the TrailMaster does allow the field
technician to adjust the sensitivity of a counter, unlike the Diamond Traffics Eyes. Although the sensitivity of
the TrailMaster can be adjusted, the TrailMaster still cannot differentiate between user types. Information
gathered from the counter allows researchers to evaluate trail use visits in one minute intervals, and the counter
can store a maximum of 4,000 counts.
Both types of trail counters were calibrated on a monthly basis. Calibration of counters was essential in
obtaining and maintaining counters accuracy. Researchers walked on or across the counter ten times and
compared this number to the number of registered counts on the counter. The number of actual counts was then
divided by the number of registered counts to develop a monthly correction factor (Appendix VI). At the end of
the survey season these monthly correction factors were averaged together, omitting outliers, to develop one
correction factor for an entire season. This correction factor was then applied to each month of data for that
survey site to compensate for a counter over or under counting.
Supplemental Materials
For some areas, additional information regarding visitor numbers is available. This type of information ranges
from formal registration cards to informal visitor logs kept in a mailbox on a nearby kiosk. The information
found in these materials helps supplement the counters and observational counts. Registration cards can be used
to obtain supplemental counts of visitors to the FNST. Visitor compliance is often an issue when depending on
registration cards for visitor counts. There is currently no standardized system for registration cards on the
FNST, so the reliability of this data is site dependent.
For the 2003-2004 study season, researchers only used registration cards from Eglin Air Force Base for
supplemental data. Registration is mandatory at this site, and there is consistency in the card’s dispersal and
collection. Numbers obtained from this site was also used in proceeding study years to help calculates estimates
for similar use areas. There were no additional survey sites in 2007-2008 that contained supplemental materials.
However, trail registers left at kiosks were often consulted in order to compare to known counts to visitor
recorded counts as an anecdotal means of justifying counter data. This most useful when counts were counts
could be perceived as unusually high.
Defining Visitor Characteristics
In order to meet the studies second objective, to describe visitors in terms of their socio-demographic and trip
characteristics, researchers conducted on-site exit interviews during personal observation periods conducted
from January 2008 – April 2008 (highest use season).

FLORIDA NATIONAL SCENIC TRAIL VISITOR ASSESSMENT DRAFT
13 ANNUAL REPORT 2007-2008 DRAFT
Visitor Questionnaires
In order to aid researchers in gathering the most information available on current FNST visitors in the most
efficient way possible, on-site interviews were conducted at previously established high-use study sites only. A
total of 236 visitors were approached to complete the survey of which 17 declined and 20 were incomplete
resulting in199 completed surveys for an 84% response rate.
The on-site exit survey (Appendix VII) differed from previous study years, in that the on-site survey was
extended from 1 page to 4 pages in order to gather more information from visitors on-site, thereby allowing
researchers to discontinue the distribution on the mail back questionnaire used in previous years. This had
several benefits; 1) more useable information was gathered, making the results more representative of FNST
visitors and 2) was less costly in regards to both time and materials.
Similar to previous years, the survey was given to one consenting participant 18 years of age or older within
every group exiting the FNST. For groups that were larger then seven people, one person for every seventh
person in the group was asked to complete a survey. The questionnaire took approximately 8-10 minutes of the
participant’s time to complete, and contained 25 questions pertaining to frequency of trail use, primary
activities, group size, trip length, trip satisfaction, trip motivation, setting preferences, and socio demographic
information.
Data Analysis
Personal Observations
The observation logs completed by researchers during sampling blocks were used to develop seasonal estimates
of visitors to the FNST for areas where mechanical counters could not be installed. For each access point within
every survey site, the following counts were recorded:
TFC = Total Foot Count. Total number of visitors that are considered foot traffic (hikers, walkers, backpackers,
runners) who were observed entering or exiting the FNST.
TOC = Total Other Count. Total number of bikers, horseback riders, roller-bladers, who were observed entering
or exiting the FNST.
TVC = Total Visitor Count. Total number of visitors, including all activities, who were observed entering or
exiting the FNST.
Average seasonal counts of TFC, TOC, and TVC were calculated for each survey site using a four-step process.
For each variable (i.e. TFC, TOC, and TVC), researchers calculated the average sampling period count (am
and pm) for each day type (weekend or weekday) for each access point of each survey site.
Xijkl = 1/Nijk
Nijk
l
ijklX1
Where:
i = access point
j = survey site (1,…,8)
k = weekday (1) and weekend (2)
l = the sampling periods for each day (am or
pm)
m = number of counts for sampling period
on day type k at access point i of site j
Nijk l = number of times counted during shift
l on day type k at access point i of site
j
Xijklm = the count on mth repetition for

FLORIDA NATIONAL SCENIC TRAIL VISITOR ASSESSMENT DRAFT
14 ANNUAL REPORT 2007-2008 DRAFT
sampling period l on day type k at
access point i of site j
Xijkl= average count during sampling period
l on day type k at access point i of site j
Second, researchers calculated the average daily count for each access point of each site by summing the two
sampling periods (calculated above) for both weekend days and weekdays.
Xijk = 3
1k
Xijkl
Where:
i = access point
j = survey site (1,…,8)
k = weekday (1) and weekend (2)
l = the sampling periods for each day (am or
pm)
Xijk = average daily count on day type k at
access point i of site j
Next, the average daily counts of all access points within a site were summed to calculate the average daily
count for a site for both weekdays and weekends.
Xjk = 3
1k
Xijk
Where:
i=access point
j=survey site (1,…,8)
k=weekday (1) and weekend (2)
Xjk=average daily count on day type k at site
J
1. Researchers calculated the average seasonal count for each site, for variables TFC, TOC, TVC.
Researchers multiplied the average daily count for weekends by the number of weekend days in that season.
Then, they multiplied the average daily count for weekdays by the number of weekday days in that season.
Researchers then added the two numbers to find the average seasonal count.
Seasonal Average for each site = )()(8
1
22
8
1
11
i
i
i
i XMXM
Where:
M1 = number of weekend days in the season
M2 = number of weekday days in the season
Xi1 = average daily count for site i for
weekend days.
Xi1 = average daily count for site i for
weekdays
i = site (1,…, 8)

FLORIDA NATIONAL SCENIC TRAIL VISITOR ASSESSMENT DRAFT
15 ANNUAL REPORT 2007-2008 DRAFT
Mechanical Pedestrian Counters
Data collected from mechanical counters provide continuous counts for selected access points within each
survey site. Analyzing counter data is the same regardless of the type of counter being used. A seven-step
protocol was developed to transform raw counter data to final seasonal counts for each installed counter.
Step 1: Adjust Raw Data
Delete data:
1. One hour after sunset to one hour before sunrise, unless there were scheduled night hikes that researchers
were made aware of. This information was obtained at the study sites website, from the study sites
land/recreation manager, from the FTA website, or from the FTA publication Footprints.
2. Unusually high counts, with no explanation from FTA or other group, and unusual patterns of high numbers.
Unusually high counts are site specific. Counts that may be considered “high counts” were not deleted until
reasonable knowledge about the trail section had been obtained.
3. Any data that was our researchers calibrating or working on trail.
Step 2: Adjust Data by Month & Compensating for Missing Data
Counter data was then analyzed by the month, so each month within a season had a total number of counts. This
number was recorded in an Excel spreadsheet. If data was missing within the month, data was estimated by:
[(Total # of hits for x days before missing data + Total # of hits for x days after missing data) / 2
If days were missing between two months (not the whole month) then researchers followed the procedure above.
After dividing by 2, the answer was then divided by the number of missing days. This gave the number of hits
per day. This number was multiplied by the number of missing days within the month. If data was missing for
an entire month (i.e battery died, counter was stolen) an access point average was applied to that particular
month for that particular site.
Step 3: Corrected Monthly Count
In order to better estimate the actual number of users, each access point with a counter had an average correction
factor that was multiplied by the access point’s monthly total. This was done at the end of a season when all the
correction factors were averaged together. Every counter is calibrated regularly, and correction factors were
produced by dividing the actual number of counts by the registered number of counts. The average correction
factor accounts for every time the access point was calibrated since installation. If a counter had to be replaced,
correction factors were averaged as normal unless there are known differences between the counters or
conditions. Outlying correction factors were omitted if the cause of the unusually high/low factor was known.
Step 4: Final Monthly Data
To account for the same entry and exit by pedestrians at a site, an access point’s corrected monthly count was
divided by two.
Step 5: Apply Access Point Averages
Once final monthly counts were formed, all like access points were grouped together from all study years
regardless of location. Next, an average for that type access point was formulated. This average was then applied
to current access points where data was not collected.
Step 6: Final Seasonal Data
All final monthly data was summed up within the season.

FLORIDA NATIONAL SCENIC TRAIL VISITOR ASSESSMENT DRAFT
16 ANNUAL REPORT 2007-2008 DRAFT
Step 7: Trail-Wide Estimate
Final annual data was then added to previous annual data, omitting sites being re-sampled for the current year
report, to formulate a trail-wide visitation estimate.
Visitor Questionnaires
Descriptive statics such as frequencies, means, and standard deviations were relied upon to answer the studies
second objective, to describe visitors in terms of their socio-demographic characteristics, motivations, and
desired settings. In some cases a cross-tabs analysis was consulted to further provide explanation of the
descriptive statistics.
For open ended comments found in the on-site survey, two researchers independently reviewed the comments
and placed them into categories thought to provide a descriptive overview of the comment. These categories and
related comments were then compared. Categories similar in nature were left as defined by the independent
review. In the event that a comment was assigned to a conflicting categories, a third reviewer was asked to
review the comments and the group came to a consensus about the comments appropriate placement. All
analysis for visitor surveys was conducted with SPSS v11.5.
Results
Visitor Use Estimates
This section describes the data collected from mechanical counters and on site observations during the 2007-
2008 study year. Trail visitor estimations were developed through the use of two methods, personal observations
and mechanical counters. Seasonal results were derived by totaling:
Data from previous years’ research (June 2003- May 2007), and
Results from this year’s research (June 2007 – May 2008)
The 2007-2008 study year has the highest estimated visits to the Florida Trail. There were 6,402 more estimated
visits to the FNST in 2007-2008 compared to the previous study year. Since all study sites have now been
researched at least once, it is reasonable to say that this year’s estimate is an accurate reflection of the
approximate number of Florida Trail users.
Six Trail Master 1550 infrared counters and twelve Diamond Traffics infrared counters that were used in 2007-
2008 research season to collect visitation data. All of these counters performed well throughout the year, with
few mechanical issues arising. Of the 18 counters, only two Diamond Traffic counters (located at SR 19 (Ocala
National Forest) and Oasis South (Big Cypress Preserve)) experience mechanical issues in July 2007 and
December 2007 respectively, resulting in approximately one-month of data loss at each location. In addition, the
Trail Master unit at Barr St. (Little Big Econ) was vandalized including both monitor and transmitter, resulting
in data loss from December 1, 2007 to January 15, 2008; and the Trail Master unit’s transmitter at Clearwater
Recreation Area (Ocala National Forest) was stolen in December 2007 from the site resulting in 40-day data
loss. In each case where the counter was vandalized, stolen, or experience mechanical issues, each unit was
replaced immediately when the incidents were noticed during the monthly site visit to avoid further data loss. In
both sites at Clearwater Recreation Area and Little Big Econ, where the vandalism or steal occurred, new units
then were reinstalled at a different location nearby to avoid potential repeat incidents.
Estimate of Summer Visits
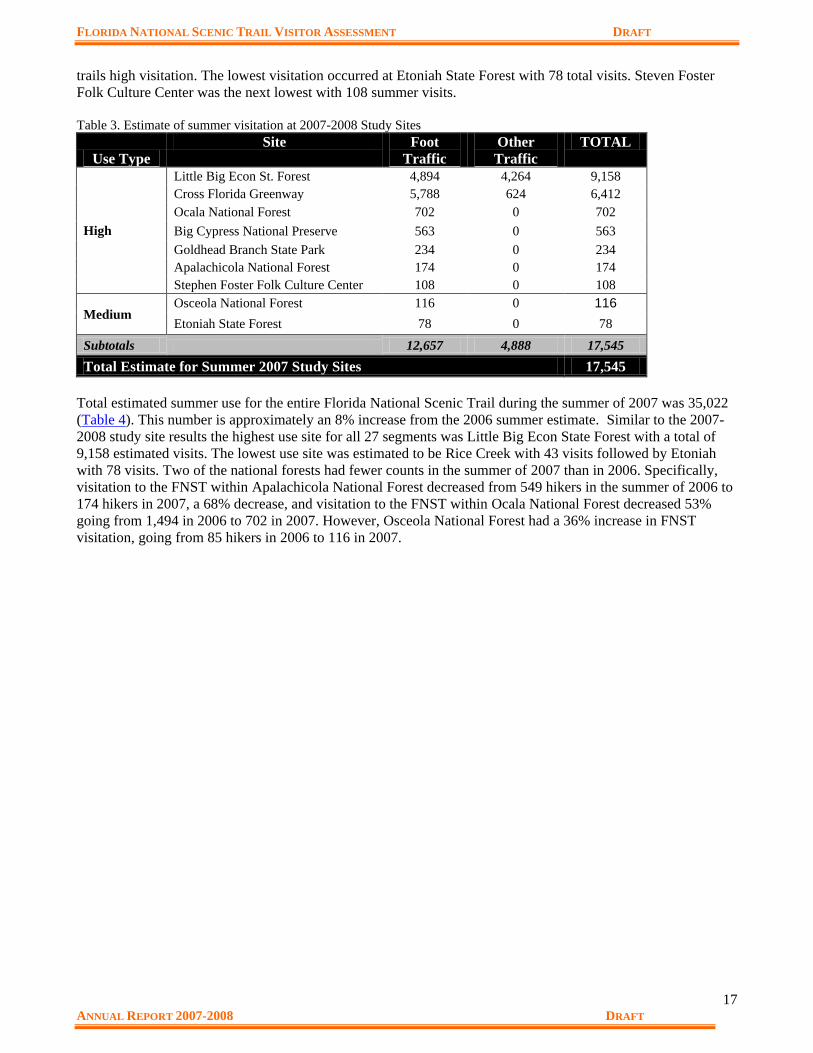
The estimated use for all nine sites studied during the summer of 2007 was 17,545 (Table 3). The sites studied
consisted of seven high-use and two medium-use sites. The highest use occurred at Little Big Econ State Forest
with 9,158 visits of which 4,894 were estimated to be pedestrian traffic and 4,264 visits were estimated to be
other users. The Cross Florida Greenway had the second highest estimated with 6,412 visits. Both of these
recreation sites are adjacent to neighborhoods and populated communities believed to be a contributor to the
FLORIDA NATIONAL SCENIC TRAIL VISITOR ASSESSMENT DRAFT
17 ANNUAL REPORT 2007-2008 DRAFT
trails high visitation. The lowest visitation occurred at Etoniah State Forest with 78 total visits. Steven Foster
Folk Culture Center was the next lowest with 108 summer visits.
Table 3. Estimate of summer visitation at 2007-2008 Study Sites
Use Type
Site Foot
Traffic
Other
Traffic
TOTAL
High
Little Big Econ St. Forest 4,894 4,264 9,158
Cross Florida Greenway 5,788 624 6,412
Ocala National Forest 702 0 702
Big Cypress National Preserve 563 0 563
Goldhead Branch State Park 234 0 234
Apalachicola National Forest 174 0 174
Stephen Foster Folk Culture Center 108 0 108
Medium Osceola National Forest 116 0 116
Etoniah State Forest 78 0 78
Subtotals 12,657 4,888 17,545
Total Estimate for Summer 2007 Study Sites 17,545
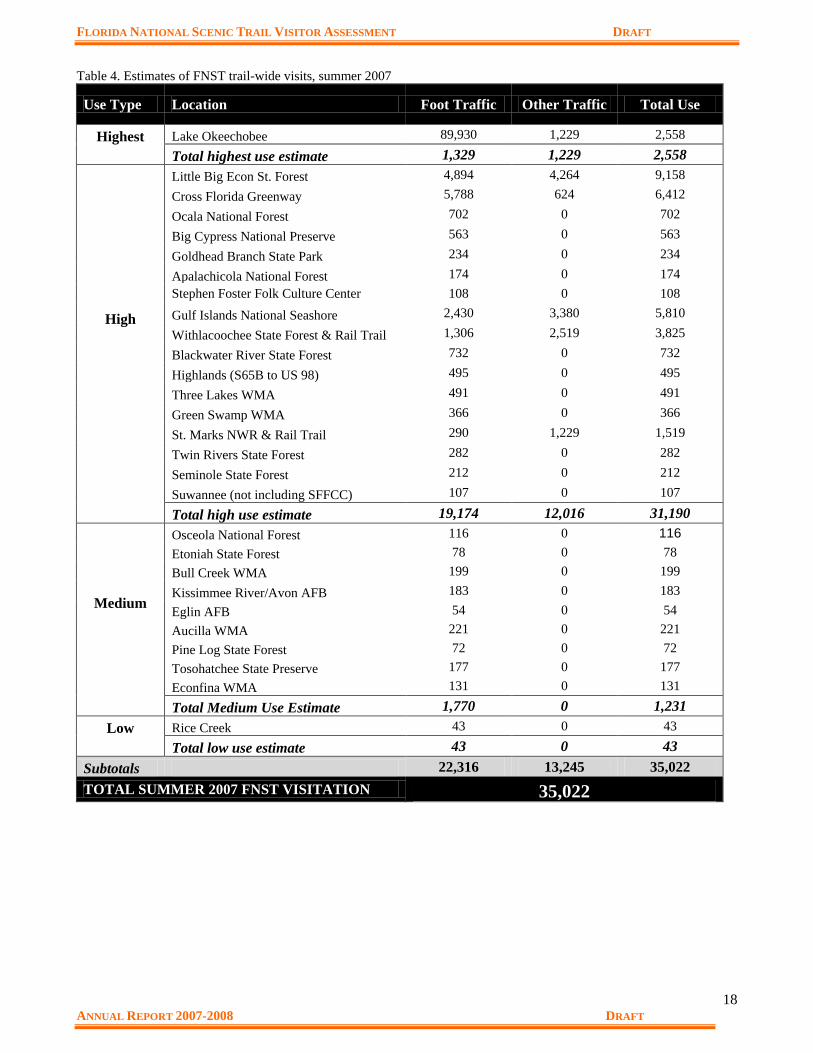
Total estimated summer use for the entire Florida National Scenic Trail during the summer of 2007 was 35,022
(Table 4). This number is approximately an 8% increase from the 2006 summer estimate. Similar to the 2007-
2008 study site results the highest use site for all 27 segments was Little Big Econ State Forest with a total of
9,158 estimated visits. The lowest use site was estimated to be Rice Creek with 43 visits followed by Etoniah
with 78 visits. Two of the national forests had fewer counts in the summer of 2007 than in 2006. Specifically,
visitation to the FNST within Apalachicola National Forest decreased from 549 hikers in the summer of 2006 to
174 hikers in 2007, a 68% decrease, and visitation to the FNST within Ocala National Forest decreased 53%
going from 1,494 in 2006 to 702 in 2007. However, Osceola National Forest had a 36% increase in FNST
visitation, going from 85 hikers in 2006 to 116 in 2007.
FLORIDA NATIONAL SCENIC TRAIL VISITOR ASSESSMENT DRAFT
18 ANNUAL REPORT 2007-2008 DRAFT
Table 4. Estimates of FNST trail-wide visits, summer 2007Use
Use Type Location Foot Traffic Other Traffic Total Use
Highest
Lake Okeechobee 89,930 1,229 2,558
Total highest use estimate 1,329 1,229 2,558
High
Little Big Econ St. Forest 4,894 4,264 9,158
Cross Florida Greenway 5,788 624 6,412
Ocala National Forest 702 0 702
Big Cypress National Preserve 563 0 563
Goldhead Branch State Park 234 0 234
Apalachicola National Forest 174 0 174
Stephen Foster Folk Culture Center 108 0 108
Gulf Islands National Seashore 2,430 3,380 5,810
Withlacoochee State Forest & Rail Trail 1,306 2,519 3,825
Blackwater River State Forest 732 0 732
Highlands (S65B to US 98) 495 0 495
Three Lakes WMA 491 0 491
Green Swamp WMA 366 0 366
St. Marks NWR & Rail Trail 290 1,229 1,519
Twin Rivers State Forest 282 0 282
Seminole State Forest 212 0 212
Suwannee (not including SFFCC) 107 0 107
Total high use estimate 19,174 12,016 31,190
Medium
Osceola National Forest 116 0 116
Etoniah State Forest 78 0 78
Bull Creek WMA 199 0 199
Kissimmee River/Avon AFB 183 0 183
Eglin AFB 54 0 54
Aucilla WMA 221 0 221
Pine Log State Forest 72 0 72
Tosohatchee State Preserve 177 0 177
Econfina WMA 131 0 131
Total Medium Use Estimate 1,770 0 1,231
Low
Rice Creek 43 0 43
Total low use estimate 43 0 43
Subtotals 22,316 13,245 35,022
TOTAL SUMMER 2007 FNST VISITATION 35,022
FLORIDA NATIONAL SCENIC TRAIL VISITOR ASSESSMENT DRAFT
19 ANNUAL REPORT 2007-2008 DRAFT
Estimation of Fall/Spring Visits
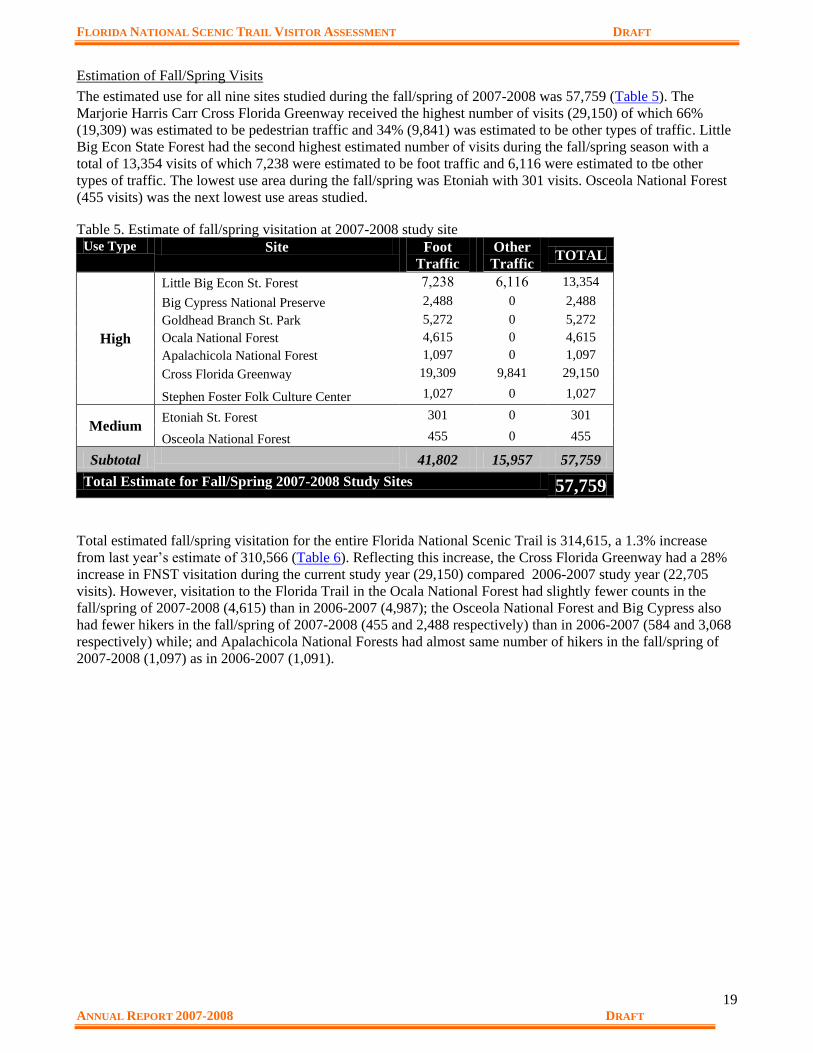
The estimated use for all nine sites studied during the fall/spring of 2007-2008 was 57,759 (Table 5). The
Marjorie Harris Carr Cross Florida Greenway received the highest number of visits (29,150) of which 66%
(19,309) was estimated to be pedestrian traffic and 34% (9,841) was estimated to be other types of traffic. Little
Big Econ State Forest had the second highest estimated number of visits during the fall/spring season with a
total of 13,354 visits of which 7,238 were estimated to be foot traffic and 6,116 were estimated to tbe other
types of traffic. The lowest use area during the fall/spring was Etoniah with 301 visits. Osceola National Forest
(455 visits) was the next lowest use areas studied.
Table 5. Estimate of fall/spring visitation at 2007-2008 study site Use Type Site Foot
Traffic
Other
Traffic TOTAL
High
Little Big Econ St. Forest 7,238 6,116 13,354
Big Cypress National Preserve 2,488 0 2,488
Goldhead Branch St. Park 5,272 0 5,272
Ocala National Forest 4,615 0 4,615
Apalachicola National Forest 1,097 0 1,097
Cross Florida Greenway 19,309 9,841 29,150
Stephen Foster Folk Culture Center 1,027 0 1,027
Medium Etoniah St. Forest 301 0 301
Osceola National Forest 455 0 455
Subtotal 41,802 15,957 57,759
Total Estimate for Fall/Spring 2007-2008 Study Sites 57,759
Total estimated fall/spring visitation for the entire Florida National Scenic Trail is 314,615, a 1.3% increase
from last year’s estimate of 310,566 (Table 6). Reflecting this increase, the Cross Florida Greenway had a 28%
increase in FNST visitation during the current study year (29,150) compared 2006-2007 study year (22,705
visits). However, visitation to the Florida Trail in the Ocala National Forest had slightly fewer counts in the
fall/spring of 2007-2008 (4,615) than in 2006-2007 (4,987); the Osceola National Forest and Big Cypress also
had fewer hikers in the fall/spring of 2007-2008 (455 and 2,488 respectively) than in 2006-2007 (584 and 3,068
respectively) while; and Apalachicola National Forests had almost same number of hikers in the fall/spring of
2007-2008 (1,097) as in 2006-2007 (1,091).
FLORIDA NATIONAL SCENIC TRAIL VISITOR ASSESSMENT DRAFT
20 ANNUAL REPORT 2007-2008 DRAFT
Table 6. Estimate of fall/spring trail-wide visitation, 2007-2008
Use Type Location Foot Traffic Other Traffic Total Use
Highest Lake Okeechobee 89,930 111,482 201,412
Total Fall Highest Use 89,930 111,482 201,412
High
Little Big Econ St. Forest 7,238 6,116 13,354
Cross Florida Greenway 19,309 9,841 29,150
Ocala National Forest 4,615 0 4,615
Big Cypress National Preserve 2,488 0 2,488
Goldhead Branch State Park 5,272 0 5,272
Apalachicola National Forest 1,097 0 1,097
Stephen Foster Folk Culture Center 1,027 0 1,027
Gulf Islands National Seashore 8,220 8,643 16,863
Withlacoochee State Forest & Rail Trail 4,581 8,997 13,578
Blackwater River State Forest 1,974 0 1,974
Highlands (S65B to US 98) 1,240 0 1,240
Three Lakes WMA 1,213 0 1,213
Green Swamp WMA 810 0 810
St. Marks NWR & Rail Trail 2,515 10,562 13,077
Twin Rivers State Forest 752 0 752
Seminole State Forest 653 449 1,102
Suwannee (not including SFFCC) 777 0 777
Total high use site estimate 63,781 44,608 108,389
Medium
Osceola National Forest 455 0 455
Etoniah State Forest 301 0 301
Bull Creek WMA 800 0 800
Kissimmee River/Avon AFB 343 0 343
Eglin AFB 610 0 610
Aucilla WMA 376 0 376
Pine Log State Forest 662 0 662
Tosohatchee State Preserve 428 0 428
Econfina WMA 755 0 755
Total medium use site estimate 4,730 0 4,730
Low Rice Creek WMA 84 0 84
Total low use site estimate 84 0 84
Subtotals 158,525 156,090 314,615
TOTAL FALL SPRING FNST VISITATION 314,615
FLORIDA NATIONAL SCENIC TRAIL VISITOR ASSESSMENT DRAFT
21 ANNUAL REPORT 2007-2008 DRAFT
Estimation of Annual Visits
Trail-wide estimates for the summer season and the fall/spring season were added together to form an annual
estimate of FNST visits. Overall, it is estimated that the FNST hosted 349,637 total visits in 2007-2008, a 3%
increase from 2006-2007 (Table 7). Seventy-seven percent of these visits were foot traffic and 23% were other
traffic.
Table 7. Estimated FNST trail-wide visitation for 2007-2008 study year
Use Type Location
Foot
Traffic
Other
Traffic Total Use
Highest Lake Okeechobee 179,860 112,711 203,970
Total Fall Highest Use 179,860 112,711 203,970
High
Little Big Econ St. Forest 12,132 10,380 22,512
Cross Florida Greenway 25,097 10,465 35,562
Ocala National Forest 5,317 0 5,317
Big Cypress National Preserve 3,051 0 3,051
Goldhead Branch State Park 5,506 0 5,506
Apalachicola National Forest 1,271 0 1,271
Stephen Foster Folk Culture Center 1,135 0 1,135
Gulf Islands National Seashore 10,650 12,023 22,673
Withlacoochee State Forest & Rail Trail 5,887 11,516 17,403
Blackwater River State Forest 2,706 0 2,706
Highlands (S65B to US 98) 1,735 0 1,735
Three Lakes WMA 1,704 0 1,704
Green Swamp WMA 1,176 0 1,176
St. Marks NWR & Rail Trail 2,805 11,791 14,596
Twin Rivers State Forest 1,034 0 1,034
Seminole State Forest 865 449 1,314
Suwannee (not including SFFCC) 884 0 884
Total high use site estimate 82,955 56,624 139,579
Medium
Osceola National Forest 571 0 571
Etoniah State Forest 379 0 379
Bull Creek WMA 999 0 999
Kissimmee River/Avon AFB 526 0 526
Eglin AFB 664 0 664
Aucilla WMA 597 0 597
Pine Log State Forest 734 0 734
Tosohatchee State Preserve 605 0 605
Econfina WMA 886 0 886
Total mediuim use site estimate 5,961 0 5,961
Low Rice Creek WMA 127 0 127
Total low use site estimate 127 0 127
Subtotals 268,903 169,335 349,637
TOTAL FALL SPRING FNST VISITATION 349,637
FLORIDA NATIONAL SCENIC TRAIL VISITOR ASSESSMENT DRAFT
22 ANNUAL REPORT 2007-2008 DRAFT
Comparison of Site Visitation
Examining the data collected over the past four years of research (Figure 3) , the site with the highest use on the
Florida Trail is Lake Okeechobee with an estimated 203,970 users (45% were hikers). The next highest use can
be found at the Marjorie Harris Carr Cross Florida Greenway with an estimated 35,562 (73% were hikers) and
Gulf Islands National Seashore with an estimated 22,673 users (47% were hikers). The lowest use sites found
during the study period are Rice Creek with 127 users (100% hikers) and Etoniah with 379 users (100% hikers).
Figure 3.Estimated visitor use on the Florida National Scenic Trail 2007-2008 research sites
Note: Lake Okeechobee is not included in the figure because its very high use (203,970 annually) distorts the graph.
On-Site Survey
Exit interviews were conducted at four 2007-2008 high-use study sites; Ocala National Forest, Cross Florida
Greenway, Goldhead Branch State Park, and Little Big Econ State Forest. The largest percentage of surveys
were completed at Little Big Econ State Forest (36.9%), followed by Cross Florida Greenway (27.3%) and
Goldhead Branch State Park (21.2%). The least amount of surveys were completed at Ocala National Forest
(Figure 4).
FLORIDA NATIONAL SCENIC TRAIL VISITOR ASSESSMENT DRAFT
23 ANNUAL REPORT 2007-2008 DRAFT
Figure 4. Distribution of Completed Surveys
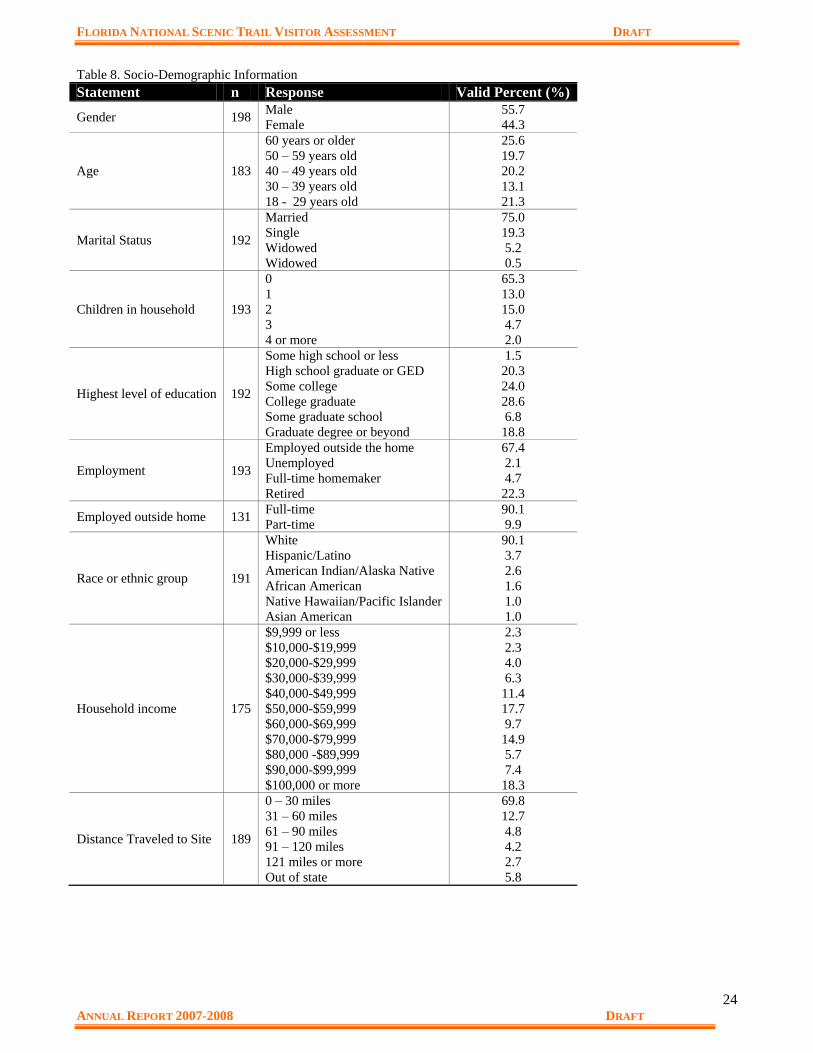
Visitor Demographics
Respondents were most likely to be white (90.1%) and were more likely to be male (55.7%) then female
(44.3%). Age was variable ranging between 18 years of age and older with the largest percentage of respondents
reporting that they were 60 years or older (25.6%). Respondents were also likely to be married (75.0%), and
have no children living at home (65.3%). Respondents tended to be educated, receiving a college degree or
beyond (54.2%), and were mostly employed outside the home (67.4%) on a full-time basis (90.1%). Income was
also variable ranging mostly between $40,000 annually and above with the largest percentage of respondents
reporting an income of $100,000 or more annually (18.3%), followed closely by $50,000 - $59,999 annually
(17.7%) (Table 8).
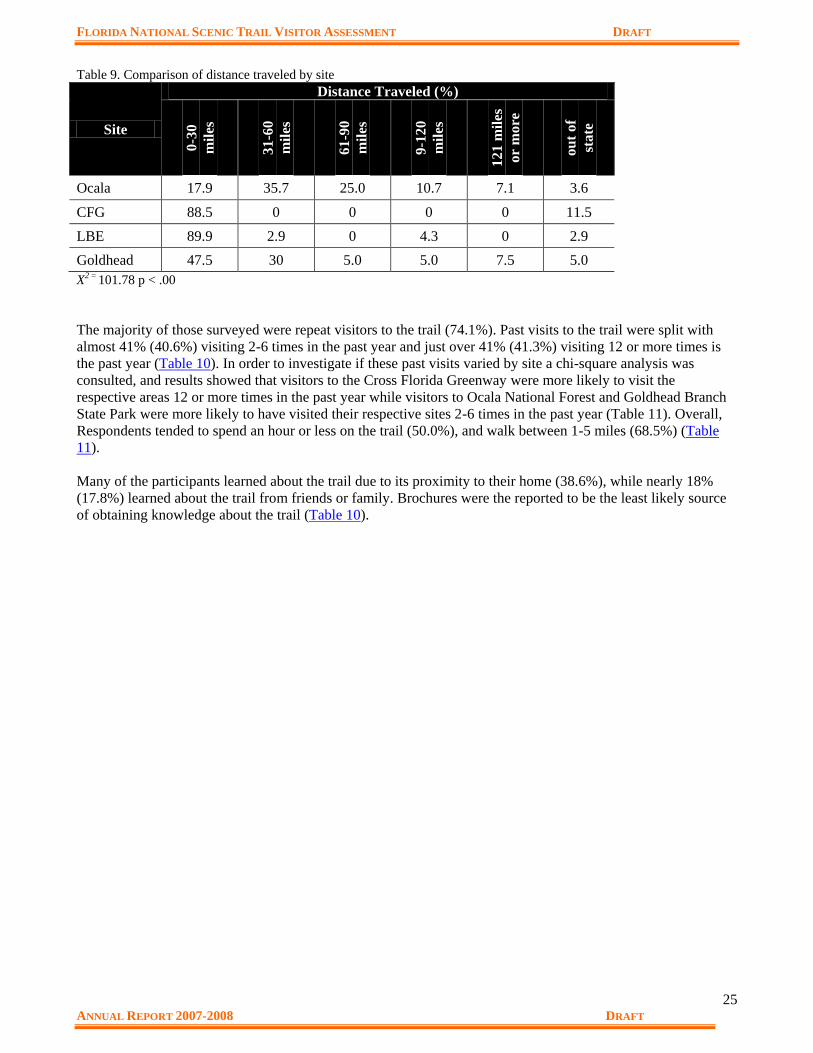
A zip code analysis was performed to calculate approximate travel time between the respondent’s home and area
where they were contacted. The majority of respondents lived within 30 miles of the trail (69.8%). Distance
traveled by visitors also varied by site. Participants at the Cross Florida Greenway and Little Big Econ State
Forest were more likely to live within 30 miles of the trail while respondents visiting Gold head Branch State
Park and Ocala National Forest had a larger percentage of visitors traveling approximately 60 miles to the
recreation area (Table 9).
FLORIDA NATIONAL SCENIC TRAIL VISITOR ASSESSMENT DRAFT
24 ANNUAL REPORT 2007-2008 DRAFT
Table 8. Socio-Demographic Information
Statement n Response Valid Percent (%)
Gender 198 Male
Female
55.7
44.3
Age 183
60 years or older
50 – 59 years old
40 – 49 years old
30 – 39 years old
18 - 29 years old
25.6
19.7
20.2
13.1
21.3
Marital Status 192
Married
Single
Widowed
Widowed
75.0
19.3
5.2
0.5
Children in household 193
0
1
2
3
4 or more
65.3
13.0
15.0
4.7
2.0
Highest level of education 192
Some high school or less
High school graduate or GED
Some college
College graduate
Some graduate school
Graduate degree or beyond
1.5
20.3
24.0
28.6
6.8
18.8
Employment 193
Employed outside the home
Unemployed
Full-time homemaker
Retired
67.4
2.1
4.7
22.3
Employed outside home 131 Full-time
Part-time
90.1
9.9
Race or ethnic group 191
White
Hispanic/Latino
American Indian/Alaska Native
African American
Native Hawaiian/Pacific Islander
Asian American
90.1
3.7
2.6
1.6
1.0
1.0
Household income 175
$9,999 or less
$10,000-$19,999
$20,000-$29,999
$30,000-$39,999
$40,000-$49,999
$50,000-$59,999
$60,000-$69,999
$70,000-$79,999
$80,000 -$89,999
$90,000-$99,999
$100,000 or more
2.3
2.3
4.0
6.3
11.4
17.7
9.7
14.9
5.7
7.4
18.3
Distance Traveled to Site 189
0 – 30 miles
31 – 60 miles
61 – 90 miles
91 – 120 miles
121 miles or more
Out of state
69.8
12.7
4.8
4.2
2.7
5.8
FLORIDA NATIONAL SCENIC TRAIL VISITOR ASSESSMENT DRAFT
25 ANNUAL REPORT 2007-2008 DRAFT
Table 9. Comparison of distance traveled by site
Site
Distance Traveled (%)
0-3
0
mil
es
31
-60
mil
es
61
-90
mil
es
9-1
20
mil
es
12
1 m
iles
or
mo
re
ou
t o
f
state
Ocala 17.9 35.7 25.0 10.7 7.1 3.6
CFG 88.5 0 0 0 0 11.5
LBE 89.9 2.9 0 4.3 0 2.9
Goldhead 47.5 30 5.0 5.0 7.5 5.0
X2 = 101.78 p < .00
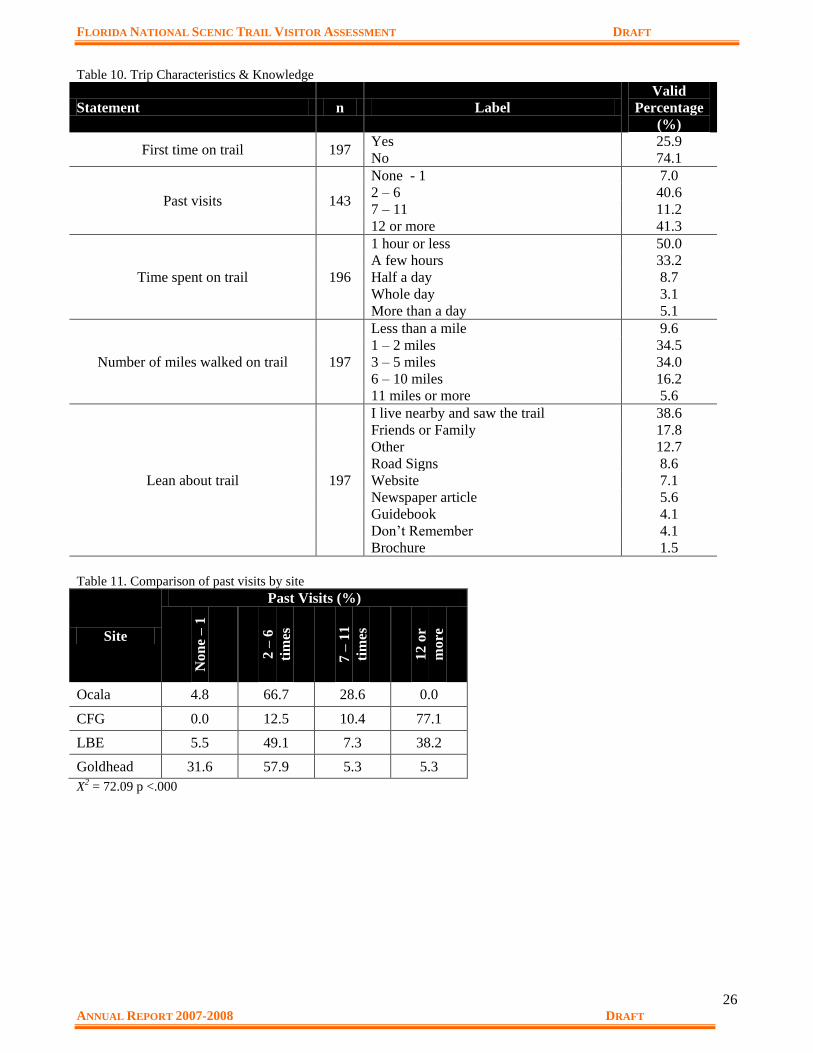
The majority of those surveyed were repeat visitors to the trail (74.1%). Past visits to the trail were split with
almost 41% (40.6%) visiting 2-6 times in the past year and just over 41% (41.3%) visiting 12 or more times is
the past year (Table 10). In order to investigate if these past visits varied by site a chi-square analysis was
consulted, and results showed that visitors to the Cross Florida Greenway were more likely to visit the
respective areas 12 or more times in the past year while visitors to Ocala National Forest and Goldhead Branch
State Park were more likely to have visited their respective sites 2-6 times in the past year (Table 11). Overall,
Respondents tended to spend an hour or less on the trail (50.0%), and walk between 1-5 miles (68.5%) (Table
11).
Many of the participants learned about the trail due to its proximity to their home (38.6%), while nearly 18%
(17.8%) learned about the trail from friends or family. Brochures were the reported to be the least likely source
of obtaining knowledge about the trail (Table 10).
FLORIDA NATIONAL SCENIC TRAIL VISITOR ASSESSMENT DRAFT
26 ANNUAL REPORT 2007-2008 DRAFT
Table 10. Trip Characteristics & Knowledge
Statement n Label
Valid
Percentage
(%)
First time on trail 197 Yes 25.9
No 74.1
Past visits 143
None - 1 7.0
2 – 6 40.6
7 – 11 11.2
12 or more 41.3
Time spent on trail 196
1 hour or less 50.0
A few hours 33.2
Half a day 8.7
Whole day 3.1
More than a day 5.1
Number of miles walked on trail 197
Less than a mile 9.6
1 – 2 miles 34.5
3 – 5 miles 34.0
6 – 10 miles 16.2
11 miles or more 5.6
Lean about trail 197
I live nearby and saw the trail 38.6
Friends or Family 17.8
Other 12.7
Road Signs 8.6
Website 7.1
Newspaper article 5.6
Guidebook 4.1
Don’t Remember 4.1
Brochure 1.5
Table 11. Comparison of past visits by site
Site
Past Visits (%)
Non
e –
1
2 –
6
tim
es
7 –
11
tim
es
12 o
r
more
Ocala 4.8 66.7 28.6 0.0
CFG 0.0 12.5 10.4 77.1
LBE 5.5 49.1 7.3 38.2
Goldhead 31.6 57.9 5.3 5.3
X2 = 72.09 p <.000
FLORIDA NATIONAL SCENIC TRAIL VISITOR ASSESSMENT DRAFT
27 ANNUAL REPORT 2007-2008 DRAFT
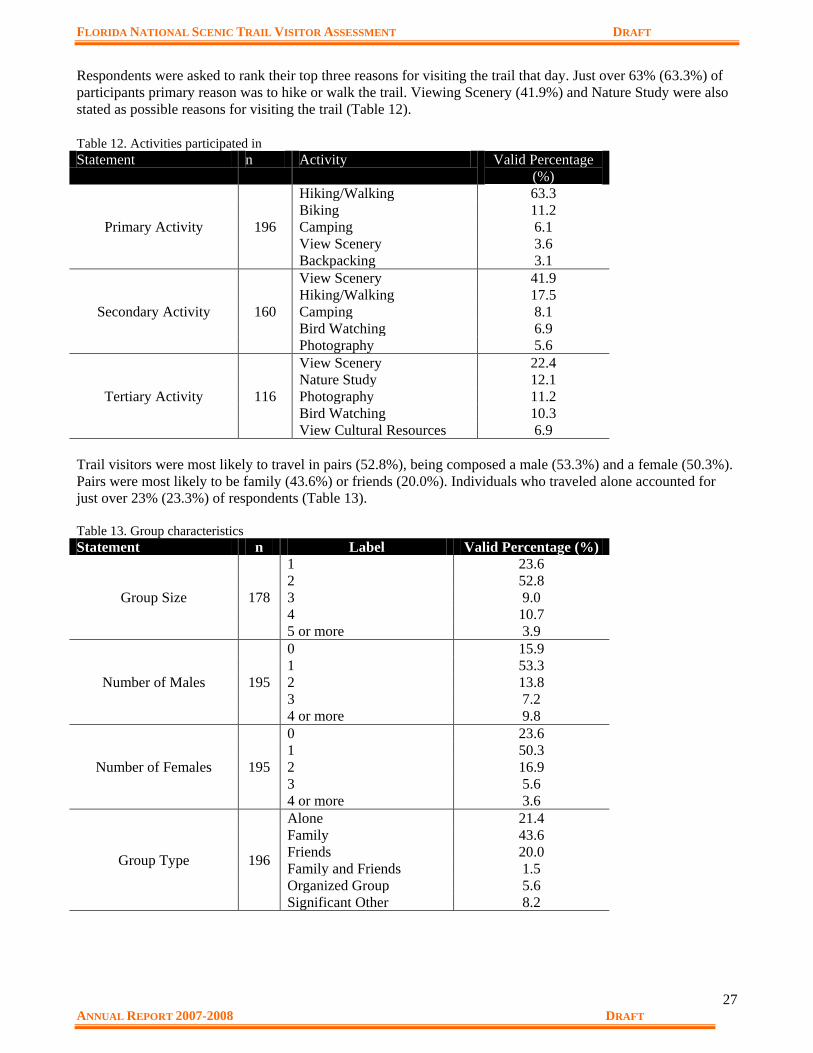
Respondents were asked to rank their top three reasons for visiting the trail that day. Just over 63% (63.3%) of
participants primary reason was to hike or walk the trail. Viewing Scenery (41.9%) and Nature Study were also
stated as possible reasons for visiting the trail (Table 12).
Table 12. Activities participated in
Statement n Activity Valid Percentage
(%)
Primary Activity 196
Hiking/Walking 63.3
Biking 11.2
Camping 6.1
View Scenery 3.6
Backpacking 3.1
Secondary Activity 160
View Scenery 41.9
Hiking/Walking 17.5
Camping 8.1
Bird Watching 6.9
Photography 5.6
Tertiary Activity 116
View Scenery 22.4
Nature Study 12.1
Photography 11.2
Bird Watching 10.3
View Cultural Resources 6.9
Trail visitors were most likely to travel in pairs (52.8%), being composed a male (53.3%) and a female (50.3%).
Pairs were most likely to be family (43.6%) or friends (20.0%). Individuals who traveled alone accounted for
just over 23% (23.3%) of respondents (Table 13).
Table 13. Group characteristics
Statement n Label Valid Percentage (%)
Group Size 178
1 23.6
2 52.8
3 9.0
4 10.7
5 or more 3.9
Number of Males 195
0 15.9
1 53.3
2 13.8
3 7.2
4 or more 9.8
Number of Females 195
0 23.6
1 50.3
2 16.9
3 5.6
4 or more 3.6
Group Type 196
Alone 21.4
Family 43.6
Friends 20.0
Family and Friends 1.5
Organized Group 5.6
Significant Other 8.2

FLORIDA NATIONAL SCENIC TRAIL VISITOR ASSESSMENT DRAFT
28 ANNUAL REPORT 2007-2008 DRAFT
Respondents were asked to rate their trail experience on a scale of one to ten with ten being a perfect experience.
Just over 39% (39.2%) reported that their experience was perfect, and another 46.8% reported having a nearly
perfect experience by rating their trip an 8 or 9. If the respondents did not rate their experience a ten, they were
asked if there was any particular reason why they had a less than perfect experience. The majority of reasons
cited we a result of personal or environmental conditions which are uncontrolled by management or trail
volunteers. Specifically just over 39% (39.2%) stated that there was no particular reason why their experience
was not a ten. Also, environmental or weather conditions such it was too hot, to cold, lots of bugs, it started to
rain etc. was the second most popular statement for an imperfect experience (21.1%). Approximately one-
quarter of the comments received were related directly to trail conditions. Inadequate facilities and/or
maintenance (5.26%) was the most often cited reason for a no perfect experience. These comments were related
to a lack of bathrooms, water fountains or benches found at the trailhead or along the trail itself. The presence of
litter (4.21%) and inadequate trail maps (4.21%) were also possible reasons why the respondent did not have a
perfect experience. Crowding along the trial (2.11%) was likely to be the most uncommon reason why a visitors
experience was not a ten (Table 14).
Next, visitors were asked if there were any improvements they would like to see to the trail. Almost half
(49.2%) stated that no improvements were needed, and that the trail was fine the way it was. Improved or
additional facilities desired were the second most commonly suggested improvements (16.06%). These
comments were mostly relating to the desire for restrooms at trailheads where restrooms were not currently
present, more or better restrooms, installation of water fountains, or more benches along the trail. Improved trail
blazing and or trail signage was the second most often suggestion (8.81%). Suggestions related to trail
maintenance (3.63%) and improved area or facility maintenance (2.07%) were the less common suggestions for
trail improvement (Table 14).
Table 14. Trail Experience
Statement n Label
Valid
Percentage
(%)
Experience/Satisfaction 194
10 39.2
9 21.1
8 25.7
7 10.8
6 2.1
5 1.0
Reasons not a Ten 95
No particular reason 34.74
Environment/Weather 28.42
Not preferred trail/scenery 12.63
Inadequate facilities/Maintenance 5.26
Litter 4.21
Non-useful maps 4.21
Insufficient Signage 3.16
Crowding 2.11
Other 5.26
Suggested Improvements 193
No improvements 49.22
Improved or additional facilities desired 16.06
Improved trail blazing and/or trail signage 8.81
Improved maps and information handouts 5.20
Trail modifications desired 5.18
Provide education of trail etiquette 4.66
Improved trail maintenance 3.63
Improve area and/or facility maintenance 2.07
Improve aesthetics 2.07
Other 3.10

FLORIDA NATIONAL SCENIC TRAIL VISITOR ASSESSMENT DRAFT
29 ANNUAL REPORT 2007-2008 DRAFT
Motivations and Destination Attractors
Motivations differ from destination attractors in that they can be conceptualized as the needs or wants that the
visitor wishes to fulfill. Participants were presented with a list of 16 possible motivations and were asked to rate
the importance of each motivation on a scale of one to five. This five point scale was then collapsed into a three
point scale with one indicating not at all important and three indicating important. A chance to enjoy nature
(mean = 2.95) was reported to be the most important motivation for visiting the trail followed closely by a
chance to escape noise and crowds (mean = 2.92), and reduce stress and tension from everyday life (mean =
2.88). Learning about the history and culture of the area was reported as the least important motivation for
visiting the trail (mean = 1.87) along with a chance to take risks (mean = 1.94) and a chance to meet new people
(mean = 1.98) (Table 15).
Table 15. Motivations
Motivation n Not
Imp
ort
an
t
(%)
Neu
tral
(%)
Imp
ort
an
t
(%)
Mea
n1
Sta
nd
ard
Dev
iati
on
Enjoy nature 176 0.6 4.0 95.5 2.95 0.25
Escape noise/crowds 178 1.1 6.2 92.7 2.92 0.32
Reduce Tensions and Stress from everyday life 178 1.1 9.6 89.3 2.88 0.36
Explore the area and the natural environment 177 2.3 14.1 83.6 2.81 0.44
Promote physical fitness 178 5.6 8.4 86.0 2.80 0.52
Be with friends and family 178 7.1 9.6 73.2 2.74 0.59
Be in an area where I feel safe and secure 176 6.8 18.2 75.0 2.68 0.59
Learn about the natural environment of the area 176 5.7 24.4 69.9 2.64 0.58
Challenge myself and achieve personal goals 178 10.7 20.8 68.5 2.58 0.68
Strengthen family kinship 177 12.4 16.9 70.6 2.58 0.70
Feel a sense of independence 178 8.1 25.3 56.6 2.54 0.66
Depend on my skills and abilities 177 14.1 26.6 59.3 2.45 0.73
Engage in personal/spiritual reflection 177 16.4 27.7 55.9 2.39 0.75
Meet new people 177 31.6 37.6 30.5 1.98 0.79
Take risks 177 36.2 33.3 30.5 1.94 0.82
Learn about the history and culture of the area 177 40.7 31.6 27.7 1.87 0.82
1 1 = not important 2 = neutral 3 = most important
People are attracted to certain recreation areas based on certain features, attributes, or attractions (Klenosky,
2002). In order to gain a better understanding of why the visitor choose the specific recreation destination in
which they were contacted, they were presented with twelve possible attractors of a recreation area and were
asked to rate how important each of attractors were in choosing their destination the day they were contacted.
Importance was measured on a scale of one to five with five representing the most important and one
representing the least important. This five point scale was reduced to a three point scale within the analysis in
order to simplify the interpretation of results. Destination characteristics that represented areas that were more
pristine and natural were reported to be the most important. Specifically, a chance to visit an area that
represented wilderness and undisturbed nature (mean = 2.88) was viewed as the most important, and “a chance
to see wildlife or birds (mean = 2.87) and to be were there was good environmental quality of air, water, ad soil

FLORIDA NATIONAL SCENIC TRAIL VISITOR ASSESSMENT DRAFT
30 ANNUAL REPORT 2007-2008 DRAFT
(mean = 2.87) were also viewed as highly favorable. Visiting areas where hunting was good (mean = 1.35),
where there was a chance to see local crafts and handiwork (mean = 1.43) and where fishing was good (mean =
1.52) were viewed as the least important characteristics for choosing a recreation area to visit (Table 16).
Table 16. Destination attractors
Reasons for Visit n Not
imp
ort
an
t
(%)
Neu
tral
(%)
Imp
ort
an
t
(%)
Mea
n1
Sta
nd
ard
Dev
iati
on
Wilderness and undisturbed nature 178 1.7 7.9 90.4 2.88 0.36
Chance to see wildlife/birds 178 1.7 10.1 88.2 2.87 0.38
Good environmental quality of air, water, and soil 177 1.7 9.0 89.3 2.87 0.38
To see the natural water features 178 11.8 16.3 71.9 2.60 0.69
The park/trail is close to where I live 178 14.0 12.9 73.0 2.59 0.73
Manageable size to see everything 177 15.3 26.0 58.8 2.44 0.74
Availability of campgrounds 178 34.8 33.7 31.5 1.96 0.82
History, military or archeological sites 178 50.6 32.6 16.9 1.66 0.75
Interesting small towns 177 52.0 33.9 14.1 1.62 0.72
Good fishing 177 58.2 31.1 10.7 1.52 0.68
Local crafts or handiwork 178 62.4 32.0 5.6 1.43 0.59
Good hunting 176 68.8 27.3 4.0 1.35 0.56
1 1 = not important 2 = neutral 3 = most important
Lastly, the respondents were asked about specific site characteristics that reflected the physical, social,
and trail design characteristics that they may find along the FNST. Respondents were presented with
twelve characteristics and were asked to rate the extent to which they preferred each setting
characteristics while participating in their primary chosen activity for the day. Preferences were rated on
a scale of one to five, and then collapsed to a three point scale with one represented disagreement and
three representing agreement with the preferred setting.
Overall, respondents reported a similar desire for trail characteristics as they did for destination attractors.
Respondents were most likely to factor settings that were untouched by man (mean = 2.56) or in areas
that were modified but still appeared natural (mean = 2.56). They also preferred little contact outside their
own group, encounter 6 groups or less per day (mean = 2.42), and the preferred t travel on natural,
unpaved (mean = 2.60) loop trails (mean = 2.50) (Table 17).
FLORIDA NATIONAL SCENIC TRAIL VISITOR ASSESSMENT DRAFT
31 ANNUAL REPORT 2007-2008 DRAFT
Table 17. Preferred trail settings
Trail Setting n
Dis
ag
ree
(%)
Neu
tral
(%)
Agre
e
Mea
n1
Sta
nd
ard
Dev
iati
on
Traveling in an area untouched by man 177 10.7 22.0 67.2 2.56 0.68
Traveling in an area that has been modified but appears natural 179 8.4 26.3 65.4 2.56 0.65
Traveling in an area that is both man-made and natural 176 26.7 29.5 43.8 2.17 0.82
Traveling in an area that is dominated by roads and power lines 178 77.5 14.6 7.9 1.30 0.61
Desire to have little contact: 6 or less 178 11.8 33.7 54.5 2.42 0.70
Desire to have moderate contact: 6-15 groups 173 17.9 41.6 40.5 2.23 0.73
Desire to have a lot of contact: 30 plus groups 171 36.3 47.4 16.4 1.80 0.69
Desire to have constant contact 174 54.6 33.3 12.1 1.57 0.69
Travel on dirt or grass 178 11.2 18.0 70.8 2.60 0.68
Prefer loop trails 179 10.1 30.2 59.8 2.50 0.67
Travel on paved 178 37.6 24.2 38.2 2.01 0.87
Prefer linear trails 174 35.6 45.4 19.0 1.83 0.72 1 1 = Disagree 2 = neutral 3 = Agree
Conclusion and Trail Management Implications
The results presented in this report are meant to help the USFS, the FTA, and the corresponding research
sites’ land and recreation managers better understand the number of visitors recreating on the FNST and
to better understand who these visitors are and what benefits they are seeking. This information can be
used to continue to provide quality recreation experiences in a variety of natural settings along the Trail.
Visitor Counts
The 2007-2008 study year has the highest estimated visits to the Florida Trail. There were 5,646 more
estimated visits to the FNST in 2007-2008 compared to the previous study year. Since all study sites have
now been researched at least once, it is reasonable to say that this year’s estimate is an accurate reflection
of the approximate number of Florida Trail users. The increase in visitation from 2006-2008 suggests an
increasing trend in the of FNST visitation. In addition, the equipment used during the 2007-2008 study
year had fewer failures, so there was much more consistent data collected than the previous seasons.
Researchers collected visitor counts on the FNST using observations and infrared eyes. The continued
success, accuracy, ease of use, and limited repair requirements of the infrared eyes make them the
preferred method for collecting data on FNST visitors when observers cannot be present. The Diamond
Traffics infrared eyes have been relatively reliable and consistent over the past three study years.
However, the counters start to show some instability of its functions in turn adds the difficulty to analyze
data. Three new Trail Master 1550 units purchased in 2007 have been great supplement through the 2007-
2008 study year because of loss due to vandalism and steal. The software that accompanies the Trail
Master 1550 allows for very easy interpretation and analysis of data. Research conducted in 2007-2008
FLORIDA NATIONAL SCENIC TRAIL VISITOR ASSESSMENT DRAFT
32 ANNUAL REPORT 2007-2008 DRAFT
utilized both types of infrared eyes to collect data. Observations are a reliable, yet inefficient, method to
find out who is using the FNST.
Visitor Surveys
The continued collection of visitor surveys has aided researchers in better defining who is using the FNST
and why. Thus far results from each study year have been similar, indicating that the typical FNST visitor
is white, married, with no children living at home. Visitors also tend to be employed full-time, and the
population as a whole shows a wide range of household incomes with the largest percentage of
participants making $50-$59 thousand annually.
This year’s results also indicate that the majority of trail visitors live in close proximity to the trail (within
30 miles), and most visitors learned about the FNST due to this close proximity. Although many people
live within these close lying communities, the lack of a larger percentage of trail visitors from the greater
regional area suggests a need to market the trails presence on more regional level. In order to make this
regional marketing effort successful, research efforts focusing on barriers to trail visitation within a
population of non-trail visitors (i.e. those who have not visited any hiking trails or natural areas) is needed
in order to understand what barriers exist to visiting natural areas and hiking trails, and identify
motivations and destination preferences to help draw these non-visitors to the Florida National Scenic
Trail.
Past research of FNST visitors indicates that quality visits to the Trail often lead to word of mouth
recommendations about the Trail. Understanding that work of mouth can be a powerful marketing tool,
increasing awareness of the trails presence and location on a local, regional, and statewide level may
assist in increasing Trail visitation. For example, if someone in Ocala visits the FNST along the Cross
Florida Greenway and has a great experience, they may tell a friend or family member in Tallahassee.
That friend or family member can visit the Florida Trail Association website to see where the closest
place to their home is where they can visit the trail. Over time this has the potential to have a domino
effect across communities and the region. Future research should investigate
Adding to the capability of word-of mouth as a potential marketing tool, marketing the trails opportunities
within various types of settings and types of destination may also increase trail awareness and appeal to
potential visitors. Current and past research has indicated an overall preference for a natural experience
when visiting the FNST. This includes motivations focused on nature enjoyment and exploration, a desire
to visit natural trails with little contact outside one’s own group, and to visit wilderness type areas. Many
current marketing efforts for the FNST capture the essence of this naturalness. In addition to these wild
and scenic places are many developed and urbanized portions of the Trail. These more urbanized areas
tend to be higher in visitation and these sections of Trail are also often utilized to fulfill certain
motivations such a promote physical fitness or reduce stress. However the settings in which these
opportunities are pursued may not always be the most preferred, rather the location of the trail (being
close to home) provides the major the major draw. When planning and marketing recreation opportunities
for these more developed portions of the trail (i.e. Black Hammock, CGF) these efforts could focus on
these desired benefits (improve physical fitness, reduce stress).
References
Cope, A., Doxford, D., and Millar, G. (1999). Counting Users of Informational Recreation Facilities.
Managing Leisure, 4, 229-244.
Klenosky, D.B. (2002). The pull of tourism destinations: A means-end investigation. Journal of Travel
Research, 40, 385-395.

FLORIDA NATIONAL SCENIC TRAIL VISITOR ASSESSMENT DRAFT
33 ANNUAL REPORT 2007-2008 DRAFT
Loomis, J.B. (2000). Counting on Recreation Use Data: A Call for long-Term Monitoring. Journal of
Leisure Research, 21, 93-96.
Lynch, J. (2002). A Spatial Model of Overnight Visitor Behavior in a Wilderness Area in Eastern Sierra
Nevada. Conference proceedings: Monitoring and Management of Visitor Flows in Recreational
and Protected Areas, Vienna, Austria.

FLORIDA NATIONAL SCENIC TRAIL VISITOR ASSESSMENT DRAFT
ANNUAL REPORT 2006-2007 DRAFT
APPENDIX I: 5 Year Study Schedule
2003-2004
Gulf Islands National Seashore (H)
Goldhead Branch State Park (H)
Ocala National Forest (H)
Eglin Air Force Base (M)
Apalachicola National Forest (M)
Osceola National Forest (H)

Five-Year Schedule
35
Little Big Econ State Forest (H)
Includes Cross Seminole Trail (Multi-Use Trail)
Etoniah Creek State Forest (L)
2004-2005
Suwannee (H)
Lake Okeechobee (H)
Seminole State Forest (M)
St. Marks National Wildlife Refuge & Rail Trail (H)
Aucilla River WMA (M)
Pine Log State Forest (M)
Rice Creek (L)
2005-2006
Tosohatchee State Preserve (H)
Withlacoochee State Forest (H)
Blackwater River State Forest (H)
Includes Withlacoochee St. Rail-Trail
Ellaville/Twin Rivers State Forest (M)
Green Swamp East (L)
Green Swamp West (L)
Ecofina Creek WMA (L)
2006-2007
Big Cypress National Preserve (H)
Highlands: S65B to US 98 (H)
Bull Creek WMA (L)
Greenway (H)
Kissimmee River WMA to Avon AFB (L)
Three Lakes WMA (L)
2007-2008
Ocala National Forest
Osceola National Forest
Apalachicola National Forest
Little Big Econ State Forest
Goldhead Branch State Park
Etoniah State Forest
Big Cypress National Preserve
Stephen Foster Folk Culture Center St. Park
Cross Florida Greenway

FLORIDA NATIONAL SCENIC TRAIL VISITOR ASSESSMENT DRAFT
ANNUAL REPORT 2007-2008 DRAFT
APPENDIX II : Protocol for Classifying Access Points

Protocol for Classifying Access Points
Throughout the study year, researchers get to know all the FNST access points within a site regardless of
whether or not a counter is installed. Researchers talk to land managers as well as visitors who know the
area well to get an idea of the type of use at each trailhead. They also randomly visit all access points
throughout the year to take notes on the number of cars in the parking lot and the number of people in the
area. Data collected from mechanical counters provide continuous counts for selected survey sites.
However, there is often more access points within a site then there are mechanical counters. To
compensate for these implications, access points that do have mechanical counters are analyzed via
protocol and then grouped into the following categories:
• Type A – Very high use, well known access point, 500 users/month or more
• Type B – High use, between 100-499 users/month
• Type C – Medium high use, between 50-99 users/month
• Type D – Medium low use, between 15-49 users/month.
• Type E – Low use, trailhead or road crossing with really low numbers, 15 users/ month or less
An average for each type of access point is then formulated. Then based on observations and notes taken
about access points without counters an access point average that seems suitable for the access point is
applied.
FLORIDA NATIONAL SCENIC TRAIL VISITOR ASSESSMENT DRAFT
ANNUAL REPORT 2007-2008 DRAFT
38
APPENDIX III: Monitored Access Points 2006-2007

39
Monitored Access Points
Big Cypress
Oasis Visitors Center (Two counters)
Cross Florida Greenway
Ross Prairie FNST (SR 200)
Land Bridge
Santos
Rodman East
Rodman West
Ocala National Forest
Juniper Springs Recreation Area
Clearwater Recreation Area
Lake Delancy
Osceola National Forest
Turkey Run
Battlefield
Apalachicola National Forest
Camel Lake
Sopchoppy (FR 329)
Etoniah State Forest
Holloway
Stephen Foster Folk Culture Center St. Park
Gazebo
Little Big Econ State Forest
Barr Street
Black Hammock
Goldhead Branch State Park
Entrance

FLORIDA NATIONAL SCENIC TRAIL VISITOR ASSESSMENT DRAFT
ANNUAL REPORT 2007-2008 DRAFT 40
APPENDIX IV: Observation Log

41
Surveyor:________________________________ Notes (include weather and where you sat):
Date:________________ Day: ______________
Time Block:______________________________
Site:_____________________________________
Access Point:_____________________________
Time Number in Group
Gender
(#males/females) Activity
Direction
Heading Starting Point Ending Point Notes
FLORIDA NATIONAL SCENIC TRAIL VISITOR ASSESSMENT DRAFT
ANNUAL REPORT 2007-2008 DRAFT 42
APPENDIX V: 2007-2008 Counter Locations

43
2007-2008 Counter Locations
Big Cypress
Oasis South: Counter located about ¼ mile south of the Oasis Visitors Center.
Oasis North: Counter located about 1 mile north of the Oasis Visitors Center.
.
Cross Florida Greenway
Land Bridge: Counter located about 125’ west of picnic area.
Santos: From parking lot follow blue-blazed trail to FT. Counter located about 30 yards south of
where the blue-blazed spur trail intersects the FT.
Rodman East: Where FT crosses Rodman Dam Rd., go through gate on Berm Rd. and follow Berm
Rd. for about 225 paces.
Rodman West: Turn off Rodman Dam Rd., about 1/4 mile before the spillway, onto the boat ramp
road and look for a gate and FT to the left, about 150’ off main road. Follow FT through the gate.
Counter located 108 paces from the gate.
Etoniah State Forest
Holloway: From the kiosk, walk about ¼ mile on the FT.
Goldhead Branch State Park
Entrance: counter located about ¼ mile from the kiosk on the left side of park entrance on the FT.
Little Big Econ
Barr Street: From Barr Street Trailhead, follow blue-blazed trail, for about 1/2 of a mile to where it
intersects the FNST. Go on the FT on the left about 1/4 mile.
Steven Foster State Park
Gazebo: From the parking area at Boat Launch Ramp, walk on the FT on the left about 100 paces.
Ocala National Forest
Juniper Springs Recreation Area: Counter located about ¼ mile in on the FT section going east from
the Juniper access road.
Clearwater Recreation Area: From parking area take the blue-spur trail to the FT (about ¼ mile). Go
left on the FT for about 115 paces.
State Road 19: From parking area counter located, north, 317 paces from where trail enters the
woods.
Lake Delancy: Go north 320 paces from the FT sign on the north side of FR 75.
Osceola National Forest
Turkey Run: Counter located along FT, 150 feet north of parking lot.
Battlefield: From parking lot follow FT for ¼ mile past Loop A Trail. Counter installed on FT, 100
feet past Loop A Trail.
Apalachicola National Forest
Camel Lake: Counter located ¼ mile east of where FT crosses FR 105 near the campground.
Sopchoppy: Heading east from FR 329, counter located about 200 feet from road

FLORIDA NATIONAL SCENIC TRAIL VISITOR ASSESSMENT DRAFT
ANNUAL REPORT 2007-2008 DRAFT 66
APPENDIX VI : 2007-2008 Seasonal Calibration Factors
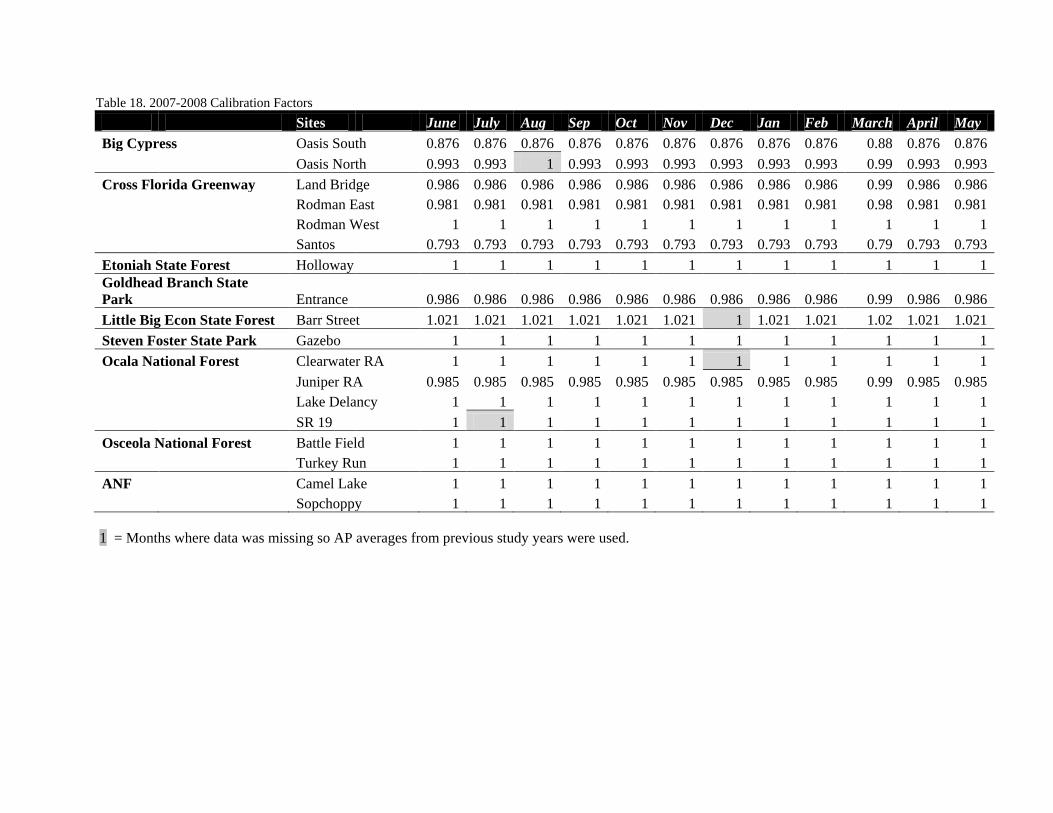
Table 18. 2007-2008 Calibration Factors
Sites June July Aug Sep Oct Nov Dec Jan Feb March April May
Big Cypress Oasis South 0.876 0.876 0.876 0.876 0.876 0.876 0.876 0.876 0.876 0.88 0.876 0.876
Oasis North 0.993 0.993 1 0.993 0.993 0.993 0.993 0.993 0.993 0.99 0.993 0.993
Cross Florida Greenway Land Bridge 0.986 0.986 0.986 0.986 0.986 0.986 0.986 0.986 0.986 0.99 0.986 0.986
Rodman East 0.981 0.981 0.981 0.981 0.981 0.981 0.981 0.981 0.981 0.98 0.981 0.981
Rodman West 1 1 1 1 1 1 1 1 1 1 1 1
Santos 0.793 0.793 0.793 0.793 0.793 0.793 0.793 0.793 0.793 0.79 0.793 0.793
Etoniah State Forest Holloway 1 1 1 1 1 1 1 1 1 1 1 1
Goldhead Branch State
Park Entrance 0.986 0.986 0.986 0.986 0.986 0.986 0.986 0.986 0.986 0.99 0.986 0.986
Little Big Econ State Forest Barr Street 1.021 1.021 1.021 1.021 1.021 1.021 1 1.021 1.021 1.02 1.021 1.021
Steven Foster State Park Gazebo 1 1 1 1 1 1 1 1 1 1 1 1
Ocala National Forest Clearwater RA 1 1 1 1 1 1 1 1 1 1 1 1
Juniper RA 0.985 0.985 0.985 0.985 0.985 0.985 0.985 0.985 0.985 0.99 0.985 0.985
Lake Delancy 1 1 1 1 1 1 1 1 1 1 1 1
SR 19 1 1 1 1 1 1 1 1 1 1 1 1
Osceola National Forest Battle Field 1 1 1 1 1 1 1 1 1 1 1 1
Turkey Run 1 1 1 1 1 1 1 1 1 1 1 1
ANF Camel Lake 1 1 1 1 1 1 1 1 1 1 1 1
Sopchoppy 1 1 1 1 1 1 1 1 1 1 1 1
1 = Months where data was missing so AP averages from previous study years were used.

FLORIDA NATIONAL SCENIC TRAIL VISITOR ASSESSMENT DRAFT
ANNUAL REPORT 2007-2008 DRAFT 65
APPENDIX VII: On-Site Survey

FLORIDA NATIONAL SCENIC TRAIL VISITOR ASSESSMENT DRAFT
ANNUAL REPORT 2007-2008 DRAFT 65
APPENDIX IX: Individual Site Information

FLORIDA NATIONAL SCENIC TRAIL VISITOR ASSESSMENT DRAFT
ANNUAL REPORT 2007-2008 DRAFT
`
Cross Florida Greenway
(n=54)
Survey Data Results
Surveys were conducted at the following areas:
Baseline
64th Street
Socio-Demographics
54% of respondents were female
85% of respondents were married
44% of respondents had a college degree or beyond
52% of respondents were retired
52% of respondents were 60 years or older
83% of respondents were white
31% of respondents reported an annual household income of $50,000 - $59,999 annually
86% of respondents lived within 30 miles of the trail
Trip Characteristics
89% of visitors have been to the site before
63% of visitors had visited the trail 12 or more times in the past year
72% of visitors spend an hour or less on the trail
35% of visitors hike/walk 1-2 miles during their visit
49% of visitors report a 10 out of 10 for their experience that day
63% of visitors stated that hiking/walking was their primary activity
42% of visitors stated that viewing scenery was their secondary activity
39% of visitors visited the trail alone
Motivations
Enjoy Nature mean = 2.97
Escape mean = 2.91
Promote Fitness mean = 2.82
Reduce Stress mean = 2.82
Destination Attractors & Settings
The trail was close to their home mean = 2.95
Good environmental quality of air, water and soil mean = 2.93
Wilderness and undisturbed nature mean = 2.82
Paved Trails mean = 2.40
Loop Trails mean = 2.46
Contact w/fewer than 6 groups mean = 2.60
Travel in areas that are modified but appear natural mean =2.71
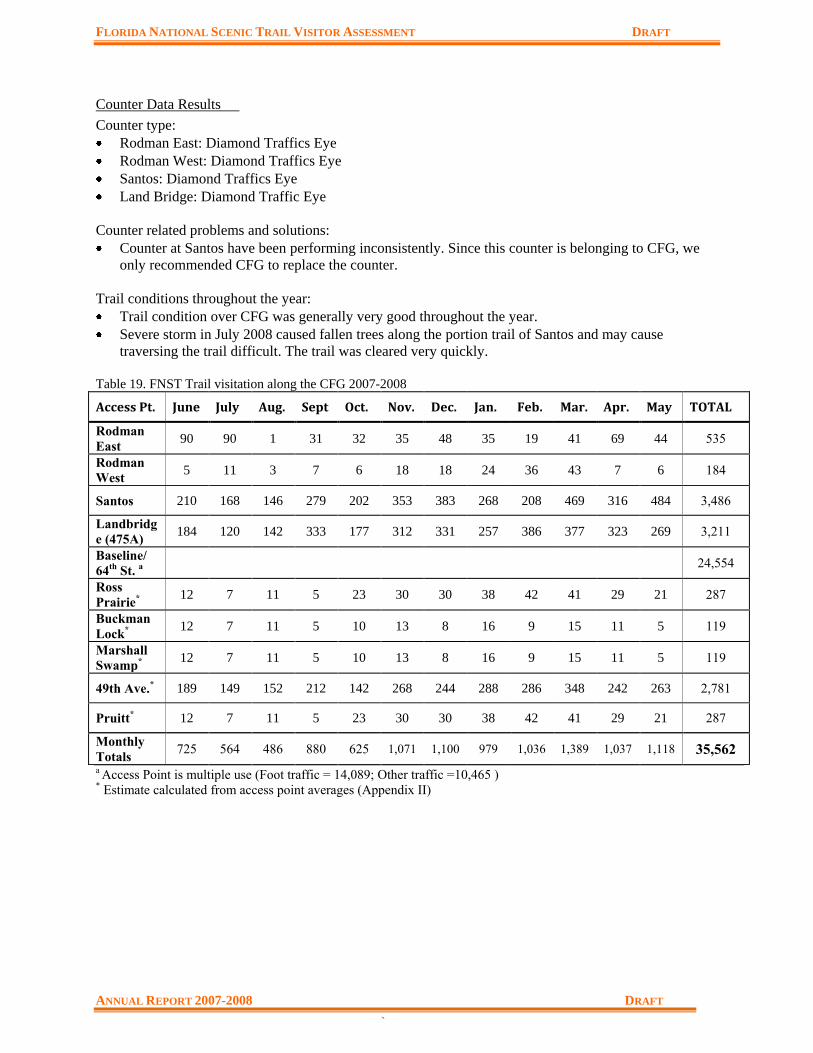
FLORIDA NATIONAL SCENIC TRAIL VISITOR ASSESSMENT DRAFT
ANNUAL REPORT 2007-2008 DRAFT
`
Counter Data Results
Counter type:
Rodman East: Diamond Traffics Eye
Rodman West: Diamond Traffics Eye
Santos: Diamond Traffics Eye
Land Bridge: Diamond Traffic Eye
Counter related problems and solutions:
Counter at Santos have been performing inconsistently. Since this counter is belonging to CFG, we
only recommended CFG to replace the counter.
Trail conditions throughout the year:
Trail condition over CFG was generally very good throughout the year.
Severe storm in July 2008 caused fallen trees along the portion trail of Santos and may cause
traversing the trail difficult. The trail was cleared very quickly.
Table 19. FNST Trail visitation along the CFG 2007-2008
Access Pt. June July Aug. Sept Oct. Nov. Dec. Jan. Feb. Mar. Apr. May TOTAL
Rodman
East 90 90 1 31 32 35 48 35 19 41 69 44 535
Rodman
West 5 11 3 7 6 18 18 24 36 43 7 6 184
Santos 210 168 146 279 202 353 383 268 208 469 316 484 3,486
Landbridg
e (475A) 184 120 142 333 177 312 331 257 386 377 323 269 3,211
Baseline/
64th
St. a 24,554
Ross
Prairie* 12 7 11 5 23 30 30 38 42 41 29 21 287
Buckman
Lock* 12 7 11 5 10 13 8 16 9 15 11 5 119
Marshall
Swamp* 12 7 11 5 10 13 8 16 9 15 11 5 119
49th Ave.* 189 149 152 212 142 268 244 288 286 348 242 263 2,781
Pruitt* 12 7 11 5 23 30 30 38 42 41 29 21 287
Monthly
Totals 725 564 486 880 625 1,071 1,100 979 1,036 1,389 1,037 1,118 35,562
a Access Point is multiple use (Foot traffic = 14,089; Other traffic =10,465 ) * Estimate calculated from access point averages (Appendix II)
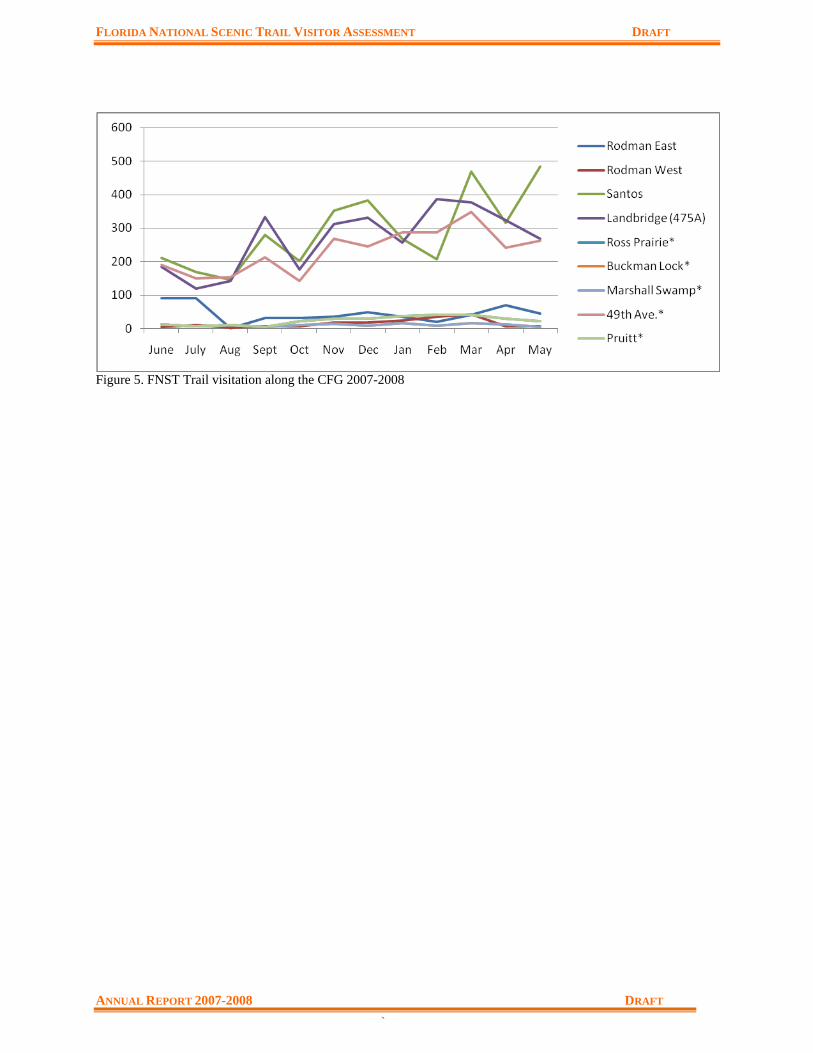
FLORIDA NATIONAL SCENIC TRAIL VISITOR ASSESSMENT DRAFT
ANNUAL REPORT 2007-2008 DRAFT
`
Figure 5. FNST Trail visitation along the CFG 2007-2008

FLORIDA NATIONAL SCENIC TRAIL VISITOR ASSESSMENT DRAFT
ANNUAL REPORT 2007-2008 DRAFT
`
Ocala National Forest
(n=29 )
Visitor Survey Data
Surveys were conducted at the following access points:
Juniper Wilderness (FR10)
Clearwater Recreation Area
Juniper Recreation Area
SR 19
Socio-Demographics
50% of respondents were male
50% of respondents were female
82% of respondents were married
57% of respondents had a college degree or beyond
68% of respondents were employed outside of the home
43% of respondents were between the ages of 40-49 years old
93% of respondents were white
36% of respondents travel between 30-60 miles to get to the trail
25% of respondents traveled between 61-90 miles to get to the trail
Trip Characteristics
79% of visitors had been to the trail before
37% of visitors had visited the trail 2-6 times within the past year
46% of visitors spent a few hours on the trail
54% of visitors hiked/walked 3-5 miles during their trip
39% of visitors rate their experience a 9 out of 10
58% of visitors stated that hiking/walking was their primary activity
34% of visitors stated that viewing scenery was their second activity
61% of visitors were traveling with family
25% of visitors could not remember where they learned about the trail
22% of visitors said they learned about the trail from friends/family
Motivations
Promote physical fitness mean = 3.00
Escape mean = 3.00
Explore the environment mean = 3.00
Destination Attractors & Settings
Wilderness and undisturbed areas mean = 3.00
A chance to see wildlife/birds mean = 2.96
Good environmental quality of air, water, and soil mean = 2.86
Travel on dirt/grass trails mean = 2.92
Travel along loop trails mean = 2.60
Encounter 6 or fewer groups/day mean = 2.85
Travel in areas untouched by man mean = 2.85
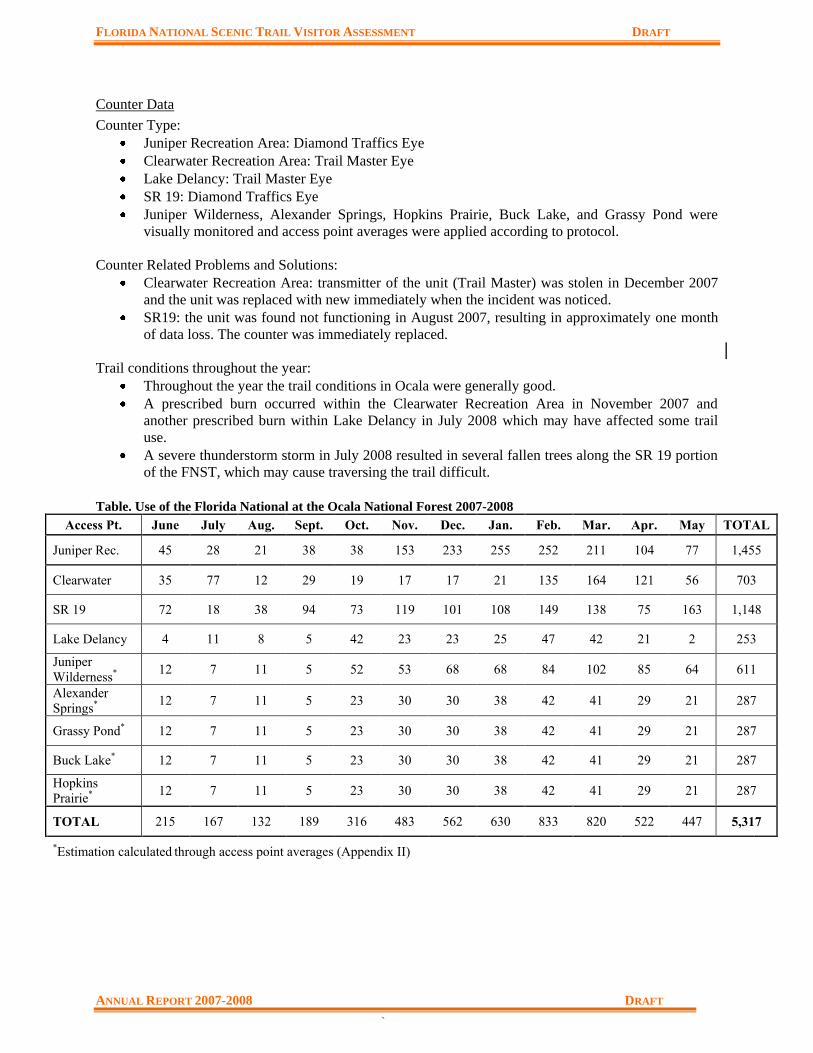
FLORIDA NATIONAL SCENIC TRAIL VISITOR ASSESSMENT DRAFT
ANNUAL REPORT 2007-2008 DRAFT
`
Counter Data
Counter Type:
Juniper Recreation Area: Diamond Traffics Eye
Clearwater Recreation Area: Trail Master Eye
Lake Delancy: Trail Master Eye
SR 19: Diamond Traffics Eye
Juniper Wilderness, Alexander Springs, Hopkins Prairie, Buck Lake, and Grassy Pond were
visually monitored and access point averages were applied according to protocol.
Counter Related Problems and Solutions:
Clearwater Recreation Area: transmitter of the unit (Trail Master) was stolen in December 2007
and the unit was replaced with new immediately when the incident was noticed.
SR19: the unit was found not functioning in August 2007, resulting in approximately one month
of data loss. The counter was immediately replaced.
Trail conditions throughout the year:
Throughout the year the trail conditions in Ocala were generally good.
A prescribed burn occurred within the Clearwater Recreation Area in November 2007 and
another prescribed burn within Lake Delancy in July 2008 which may have affected some trail
use.
A severe thunderstorm storm in July 2008 resulted in several fallen trees along the SR 19 portion
of the FNST, which may cause traversing the trail difficult.
Table. Use of the Florida National at the Ocala National Forest 2007-2008
Access Pt. June July Aug. Sept. Oct. Nov. Dec. Jan. Feb. Mar. Apr. May TOTAL
Juniper Rec. 45 28 21 38 38 153 233 255 252 211 104 77 1,455
Clearwater 35 77 12 29 19 17 17 21 135 164 121 56 703
SR 19 72 18 38 94 73 119 101 108 149 138 75 163 1,148
Lake Delancy 4 11 8 5 42 23 23 25 47 42 21 2 253
Juniper
Wilderness* 12 7 11 5 52 53 68 68 84 102 85 64 611
Alexander
Springs* 12 7 11 5 23 30 30 38 42 41 29 21 287
Grassy Pond* 12 7 11 5 23 30 30 38 42 41 29 21 287
Buck Lake* 12 7 11 5 23 30 30 38 42 41 29 21 287
Hopkins
Prairie* 12 7 11 5 23 30 30 38 42 41 29 21 287
TOTAL 215 167 132 189 316 483 562 630 833 820 522 447 5,317
*Estimation calculated through access point averages (Appendix II)
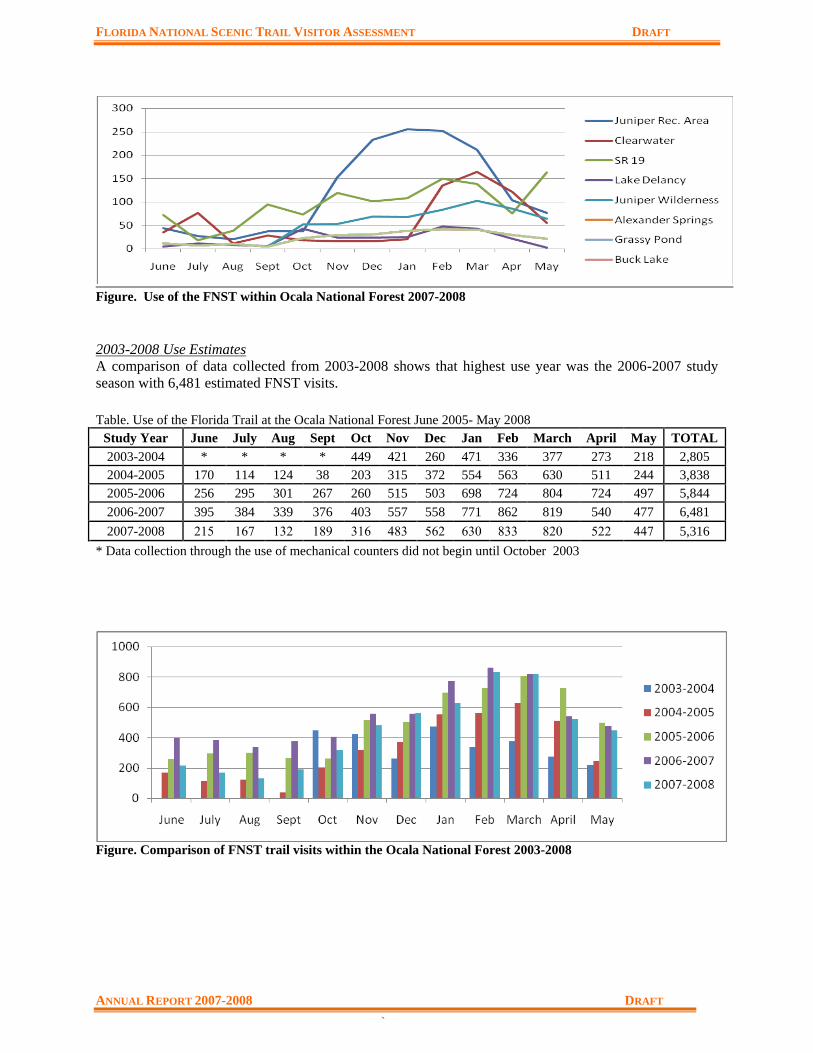
FLORIDA NATIONAL SCENIC TRAIL VISITOR ASSESSMENT DRAFT
ANNUAL REPORT 2007-2008 DRAFT
`
Figure. Use of the FNST within Ocala National Forest 2007-2008
2003-2008 Use Estimates
A comparison of data collected from 2003-2008 shows that highest use year was the 2006-2007 study
season with 6,481 estimated FNST visits.
Table. Use of the Florida Trail at the Ocala National Forest June 2005- May 2008
Study Year June July Aug Sept Oct Nov Dec Jan Feb March April May TOTAL
2003-2004 * * * * 449 421 260 471 336 377 273 218 2,805
2004-2005 170 114 124 38 203 315 372 554 563 630 511 244 3,838
2005-2006 256 295 301 267 260 515 503 698 724 804 724 497 5,844
2006-2007 395 384 339 376 403 557 558 771 862 819 540 477 6,481
2007-2008 215 167 132 189 316 483 562 630 833 820 522 447 5,316
* Data collection through the use of mechanical counters did not begin until October 2003
Figure. Comparison of FNST trail visits within the Ocala National Forest 2003-2008

FLORIDA NATIONAL SCENIC TRAIL VISITOR ASSESSMENT DRAFT
ANNUAL REPORT 2007-2008 DRAFT
`
Goldhead Branch State Park
(n = 42 )
Visitor Survey Data
Surveys were conducted at the following access points:
Millsite trailhead
Socio-Demographics
53% of respondents were male
41% of respondents has a college degree or beyond
83% of respondents are employed outside the home
43% of respondents were between the ages of 18-29 years old
95% of respondents were white
Household income was variable. The two largest percentage represents were $100,000 or more (15.4%)
and $70,000-$79,999 annually (15.4%).
Trip Characteristics
52% of visitors had never been to Goldhead Branch St. Park before
68% of visitors that had been to the park before, had visited 2-6 times in the past year
68% of visitors spent an hour or less on the trail
45% of visitors hiked/walked 1-2 miles during their visit
29% of visitors rated their experience a 10 out of 10
64% of visitors stated that hiking/walking was their primary reason for visiting the trail
31% of visitors stated that viewing scenery was the secondary reason for visiting the trail
45% of visitors were traveling with family
21% of visitors said they knew about the tail because they lived near by
48% of visitors lived within 30 miles of the park
Motivations
Enjoy nature mean = 2.91
Reduce Stress mean = 2.86
Escape mean = 2.86
Destination Attractors & Settings
A chance to see wildlife/birds mean = 2.80
A chance to see natural water features mean = 2.88
Wilderness and undisturbed nature mean = 2.88
Travel along dirt or grass trails mean = 2.80
Travel along loop trails mean = 2.52
Encounter few than 6 groups per day mean = 2.36
Travel in areas untouched by man mean = 2.75
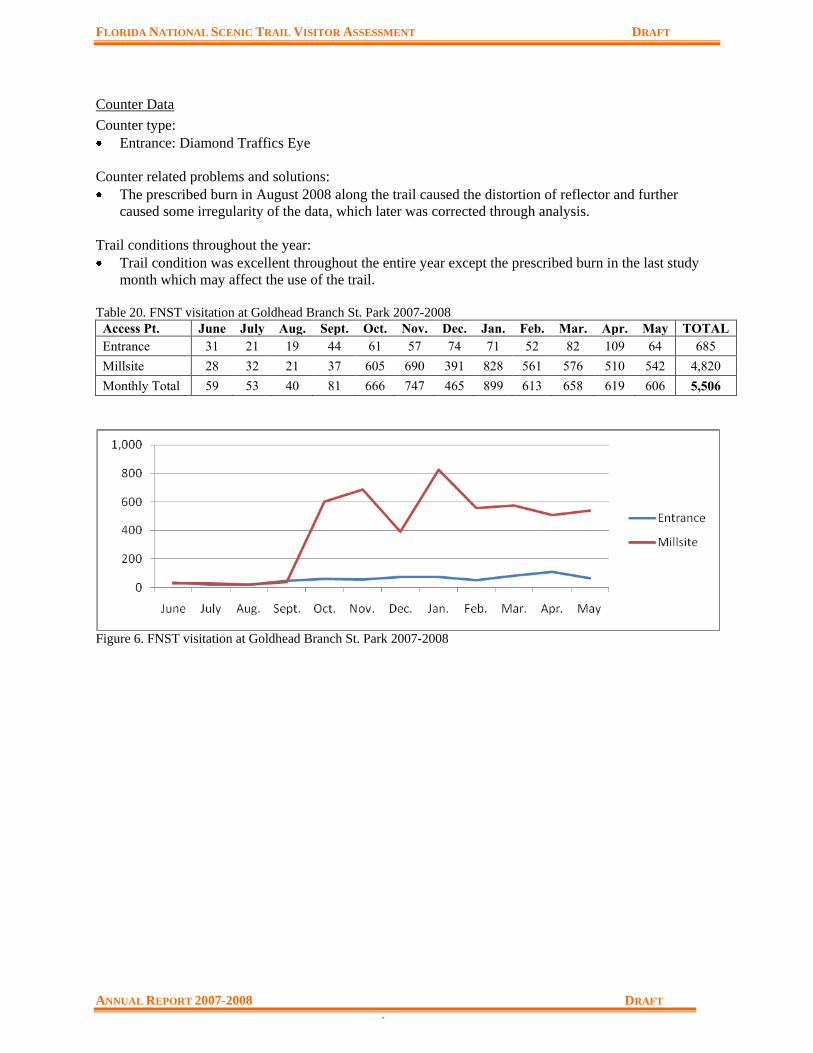
FLORIDA NATIONAL SCENIC TRAIL VISITOR ASSESSMENT DRAFT
ANNUAL REPORT 2007-2008 DRAFT
`
Counter Data
Counter type:
Entrance: Diamond Traffics Eye
Counter related problems and solutions:
The prescribed burn in August 2008 along the trail caused the distortion of reflector and further
caused some irregularity of the data, which later was corrected through analysis.
Trail conditions throughout the year:
Trail condition was excellent throughout the entire year except the prescribed burn in the last study
month which may affect the use of the trail.
Table 20. FNST visitation at Goldhead Branch St. Park 2007-2008
Access Pt. June July Aug. Sept. Oct. Nov. Dec. Jan. Feb. Mar. Apr. May TOTAL
Entrance 31 21 19 44 61 57 74 71 52 82 109 64 685
Millsite 28 32 21 37 605 690 391 828 561 576 510 542 4,820
Monthly Total 59 53 40 81 666 747 465 899 613 658 619 606 5,506
Figure 6. FNST visitation at Goldhead Branch St. Park 2007-2008

FLORIDA NATIONAL SCENIC TRAIL VISITOR ASSESSMENT DRAFT
ANNUAL REPORT 2007-2008 DRAFT
`
Little Big Econ State Forest
(n=73)
Visitor Survey Data
Surveys were conducted at the following access points:
Barr Street
Black Hammock (Cross Seminole Trail)
Socio-Demographics
67% of the respondents were male
77% of the respondents were married
67% of respondents had a college degree or beyond
80% were employed outside of the home
23% of respondents were between 40-49 years old
22% of respondents were between 50-59 years old
91% of respondents were white
32% of respondents reported an annual household income of $100,000 or more annually
Trip Characteristics
77% of visitors had visited the trail before
49% of visitors had visited the trail 2-6 times within the past year
46% of visitors spent a few hours along the trail
37% of visitors traveled 1-2 miles along the trail
36% of visitors traveled 3-5 miles along the trail
44% of visitors rated their experience a 10 out of 10
58% of visitors stated that hiking/walking was their primary activity for the day
34% of visitors stated that viewing scenery was their secondary reason for visiting the trail
40% of visitors were with family
44% of visitors learned about the trial because they lived nearby and saw it
90% of visitors lived within 30 miles of the trail
Motivations
Enjoy Nature mean = 2.92
Escape mean = 2.91
Reduce Stress mean = 2.89
Destination Attractors & Settings
Good environmental quality of air, water, and soils mean = 2.85
Wilderness and undisturbed nature mean = 2.82
A chance to see wildlife/birds mean = 2.78
Travel on dirt/grass trails mean = 2.68
Travel on loop trials mean = 2.45
Encounter fewer than 6 groups per day mean = 2.43
Travel in areas untouched by man mean = 2.63
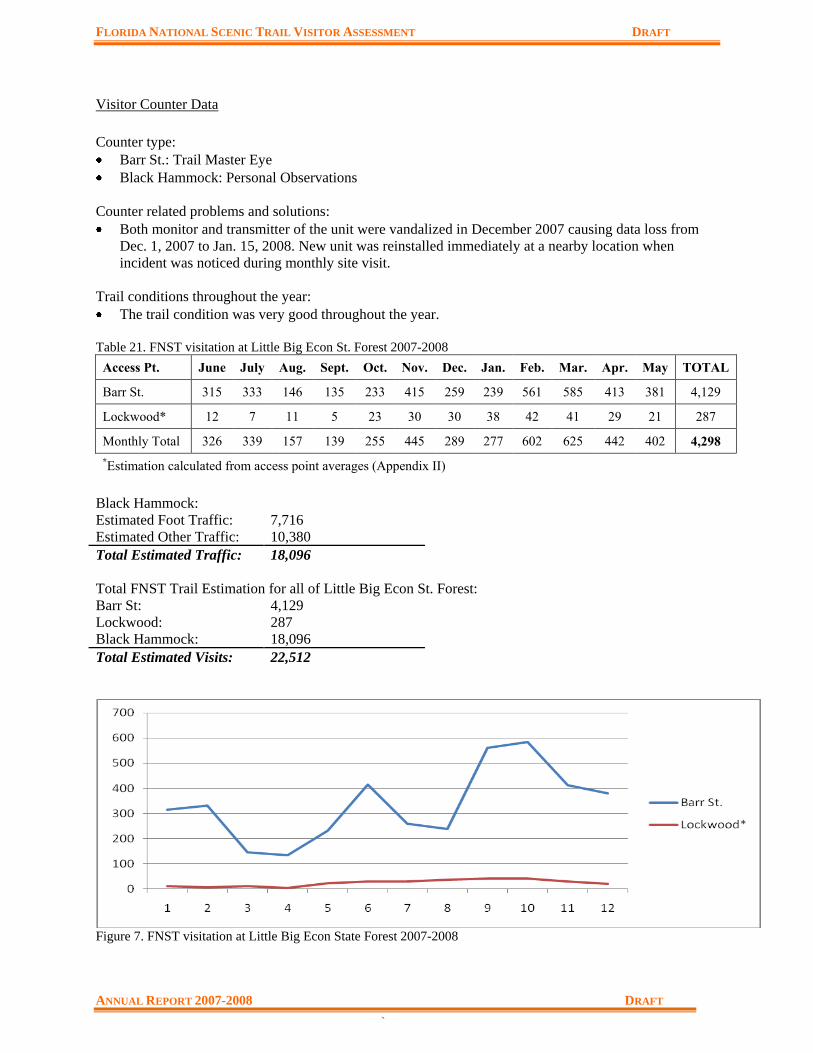
FLORIDA NATIONAL SCENIC TRAIL VISITOR ASSESSMENT DRAFT
ANNUAL REPORT 2007-2008 DRAFT
`
Visitor Counter Data
Counter type:
Barr St.: Trail Master Eye
Black Hammock: Personal Observations
Counter related problems and solutions:
Both monitor and transmitter of the unit were vandalized in December 2007 causing data loss from
Dec. 1, 2007 to Jan. 15, 2008. New unit was reinstalled immediately at a nearby location when
incident was noticed during monthly site visit.
Trail conditions throughout the year:
The trail condition was very good throughout the year.
Table 21. FNST visitation at Little Big Econ St. Forest 2007-2008
Access Pt. June July Aug. Sept. Oct. Nov. Dec. Jan. Feb. Mar. Apr. May TOTAL
Barr St. 315 333 146 135 233 415 259 239 561 585 413 381 4,129
Lockwood* 12 7 11 5 23 30 30 38 42 41 29 21 287
Monthly Total 326 339 157 139 255 445 289 277 602 625 442 402 4,298
*Estimation calculated from access point averages (Appendix II)
Black Hammock:
Estimated Foot Traffic: 7,716
Estimated Other Traffic: 10,380
Total Estimated Traffic: 18,096
Total FNST Trail Estimation for all of Little Big Econ St. Forest:
Barr St: 4,129
Lockwood: 287
Black Hammock: 18,096
Total Estimated Visits: 22,512
Figure 7. FNST visitation at Little Big Econ State Forest 2007-2008
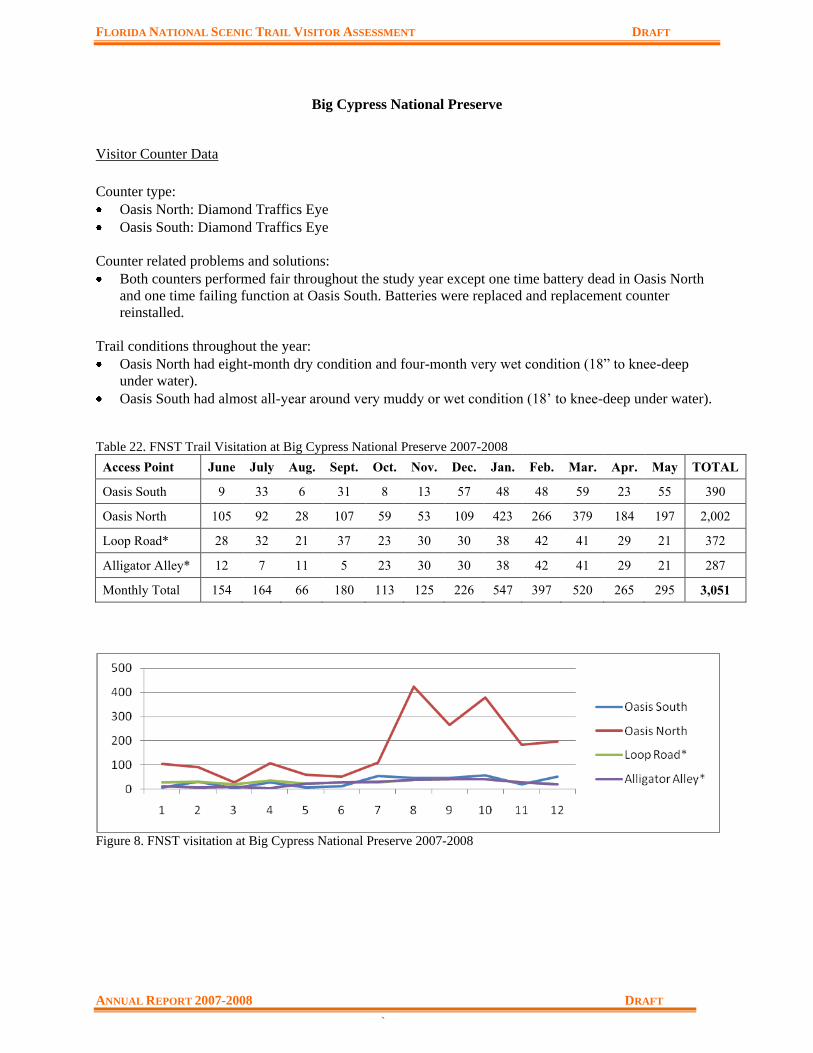
FLORIDA NATIONAL SCENIC TRAIL VISITOR ASSESSMENT DRAFT
ANNUAL REPORT 2007-2008 DRAFT
`
Big Cypress National Preserve
Visitor Counter Data
Counter type:
Oasis North: Diamond Traffics Eye
Oasis South: Diamond Traffics Eye
Counter related problems and solutions:
Both counters performed fair throughout the study year except one time battery dead in Oasis North
and one time failing function at Oasis South. Batteries were replaced and replacement counter
reinstalled.
Trail conditions throughout the year:
Oasis North had eight-month dry condition and four-month very wet condition (18” to knee-deep
under water).
Oasis South had almost all-year around very muddy or wet condition (18’ to knee-deep under water).
Table 22. FNST Trail Visitation at Big Cypress National Preserve 2007-2008
Access Point June July Aug. Sept. Oct. Nov. Dec. Jan. Feb. Mar. Apr. May TOTAL
Oasis South 9 33 6 31 8 13 57 48 48 59 23 55 390
Oasis North 105 92 28 107 59 53 109 423 266 379 184 197 2,002
Loop Road* 28 32 21 37 23 30 30 38 42 41 29 21 372
Alligator Alley* 12 7 11 5 23 30 30 38 42 41 29 21 287
Monthly Total 154 164 66 180 113 125 226 547 397 520 265 295 3,051
Figure 8. FNST visitation at Big Cypress National Preserve 2007-2008
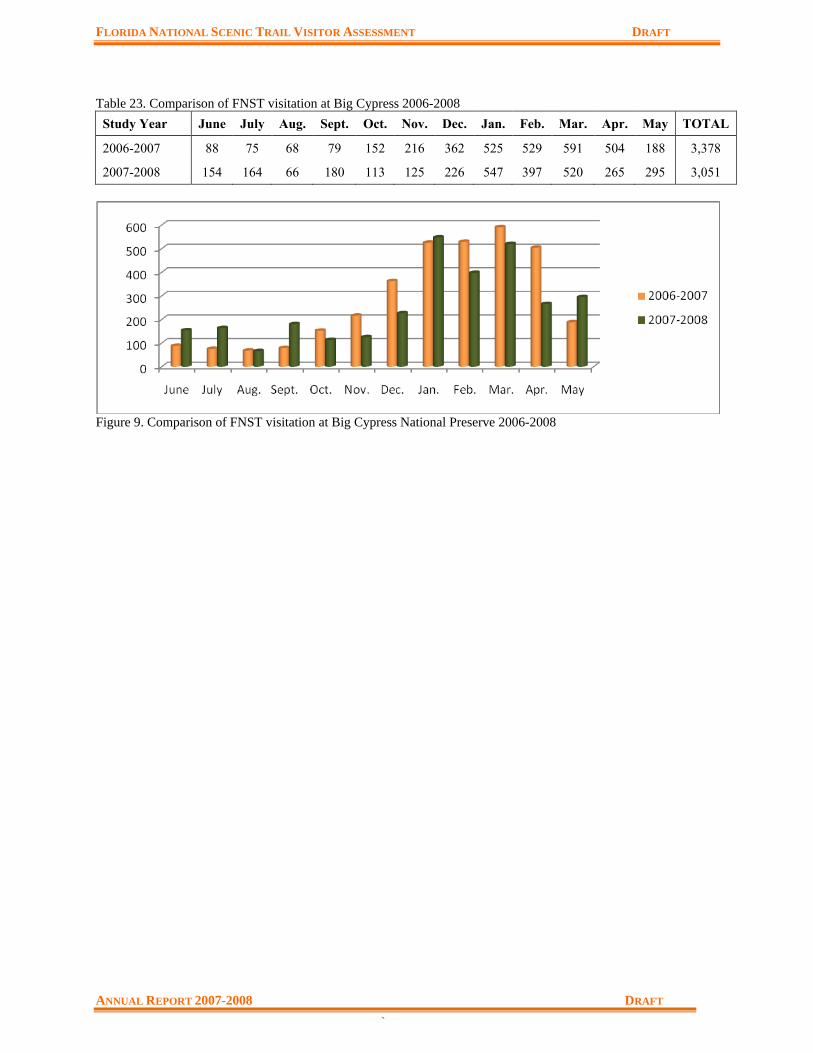
FLORIDA NATIONAL SCENIC TRAIL VISITOR ASSESSMENT DRAFT
ANNUAL REPORT 2007-2008 DRAFT
`
Table 23. Comparison of FNST visitation at Big Cypress 2006-2008
Study Year June July Aug. Sept. Oct. Nov. Dec. Jan. Feb. Mar. Apr. May TOTAL
2006-2007 88 75 68 79 152 216 362 525 529 591 504 188 3,378
2007-2008 154 164 66 180 113 125 226 547 397 520 265 295 3,051
Figure 9. Comparison of FNST visitation at Big Cypress National Preserve 2006-2008
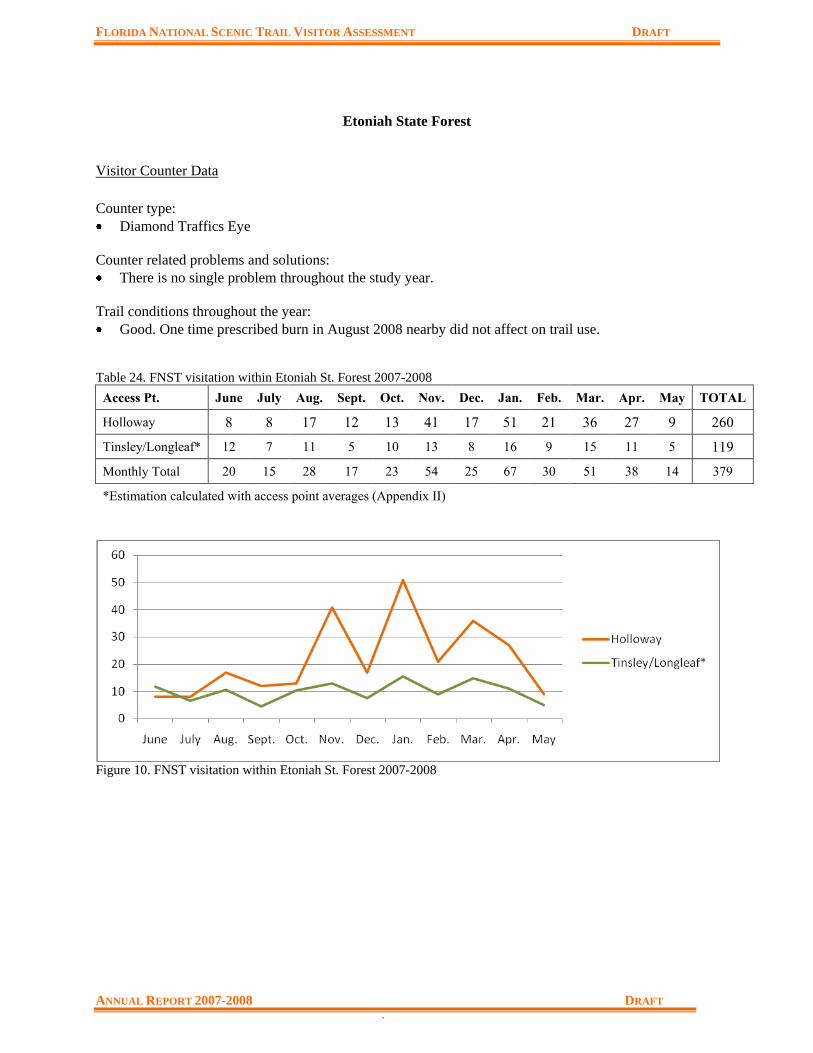
FLORIDA NATIONAL SCENIC TRAIL VISITOR ASSESSMENT DRAFT
ANNUAL REPORT 2007-2008 DRAFT
`
Etoniah State Forest
Visitor Counter Data
Counter type:
Diamond Traffics Eye
Counter related problems and solutions:
There is no single problem throughout the study year.
Trail conditions throughout the year:
Good. One time prescribed burn in August 2008 nearby did not affect on trail use.
Table 24. FNST visitation within Etoniah St. Forest 2007-2008
Access Pt. June July Aug. Sept. Oct. Nov. Dec. Jan. Feb. Mar. Apr. May TOTAL
Holloway 8 8 17 12 13 41 17 51 21 36 27 9 260
Tinsley/Longleaf* 12 7 11 5 10 13 8 16 9 15 11 5 119
Monthly Total 20 15 28 17 23 54 25 67 30 51 38 14 379
*Estimation calculated with access point averages (Appendix II)
Figure 10. FNST visitation within Etoniah St. Forest 2007-2008
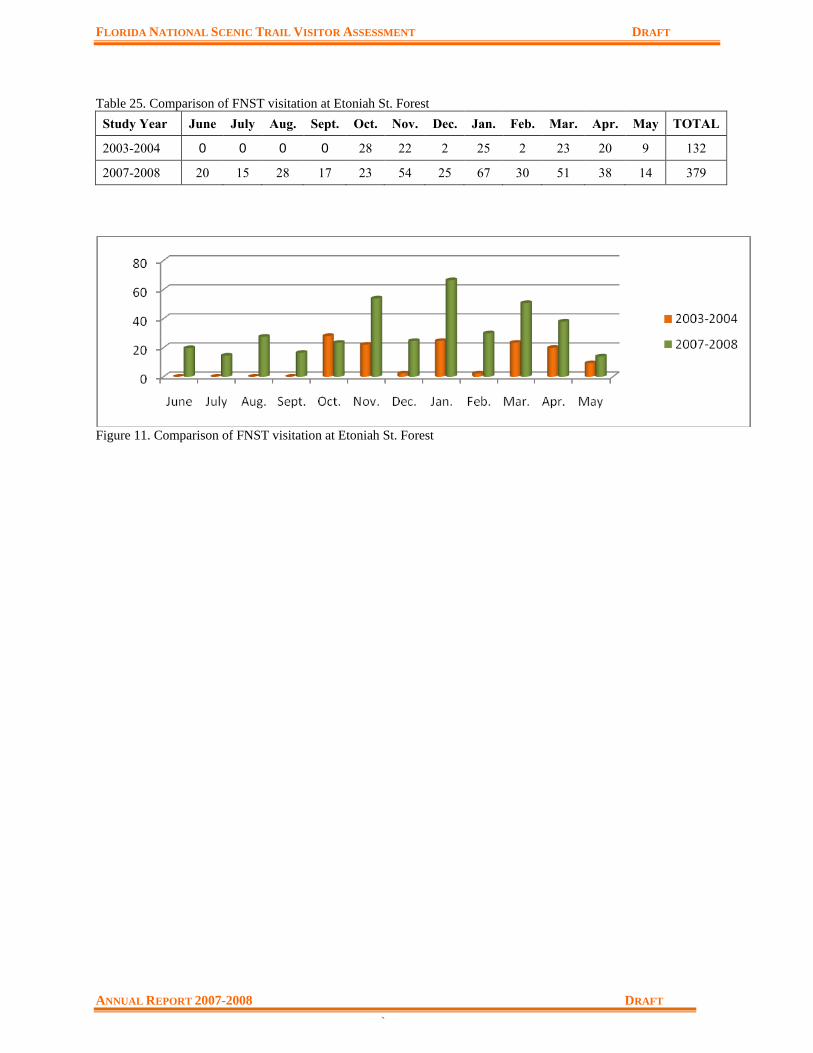
FLORIDA NATIONAL SCENIC TRAIL VISITOR ASSESSMENT DRAFT
ANNUAL REPORT 2007-2008 DRAFT
`
Table 25. Comparison of FNST visitation at Etoniah St. Forest
Study Year June July Aug. Sept. Oct. Nov. Dec. Jan. Feb. Mar. Apr. May TOTAL
2003-2004 0 0 0 0 28 22 2 25 2 23 20 9 132
2007-2008 20 15 28 17 23 54 25 67 30 51 38 14 379
Figure 11. Comparison of FNST visitation at Etoniah St. Forest
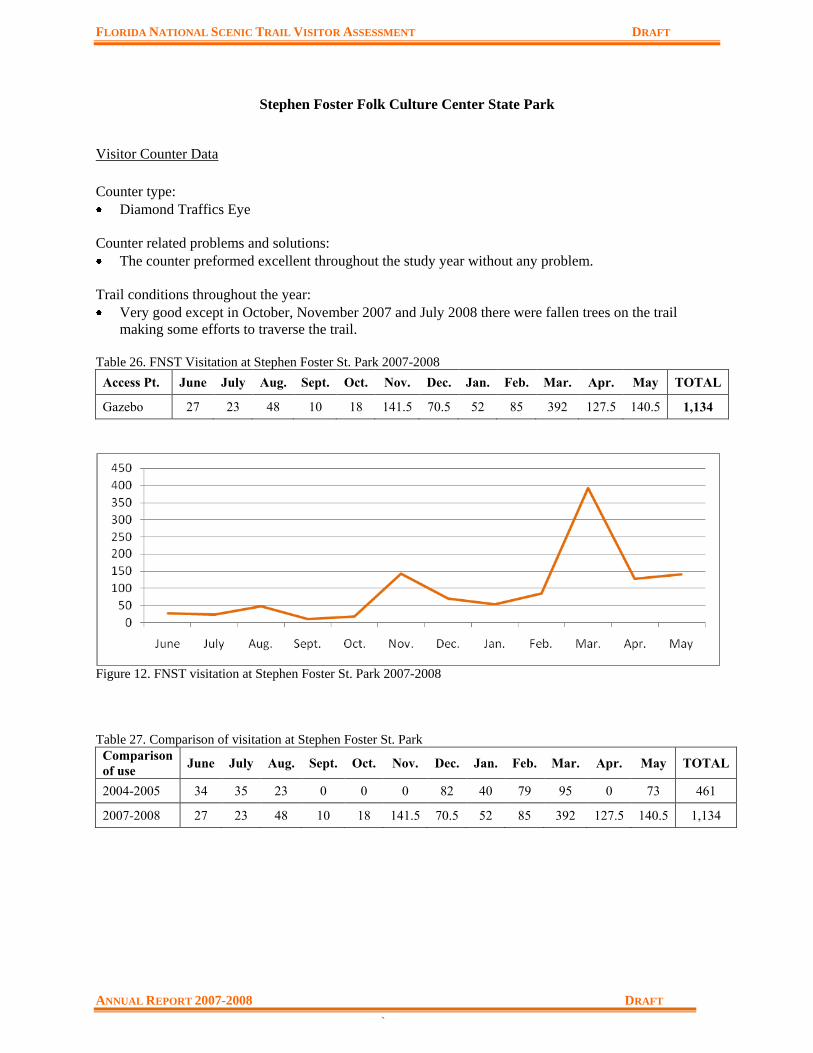
FLORIDA NATIONAL SCENIC TRAIL VISITOR ASSESSMENT DRAFT
ANNUAL REPORT 2007-2008 DRAFT
`
Stephen Foster Folk Culture Center State Park
Visitor Counter Data
Counter type:
Diamond Traffics Eye
Counter related problems and solutions:
The counter preformed excellent throughout the study year without any problem.
Trail conditions throughout the year:
Very good except in October, November 2007 and July 2008 there were fallen trees on the trail
making some efforts to traverse the trail.
Table 26. FNST Visitation at Stephen Foster St. Park 2007-2008
Access Pt. June July Aug. Sept. Oct. Nov. Dec. Jan. Feb. Mar. Apr. May TOTAL
Gazebo 27 23 48 10 18 141.5 70.5 52 85 392 127.5 140.5 1,134
Figure 12. FNST visitation at Stephen Foster St. Park 2007-2008
Table 27. Comparison of visitation at Stephen Foster St. Park
Comparison
of use June July Aug. Sept. Oct. Nov. Dec. Jan. Feb. Mar. Apr. May TOTAL
2004-2005 34 35 23 0 0 0 82 40 79 95 0 73 461
2007-2008 27 23 48 10 18 141.5 70.5 52 85 392 127.5 140.5 1,134
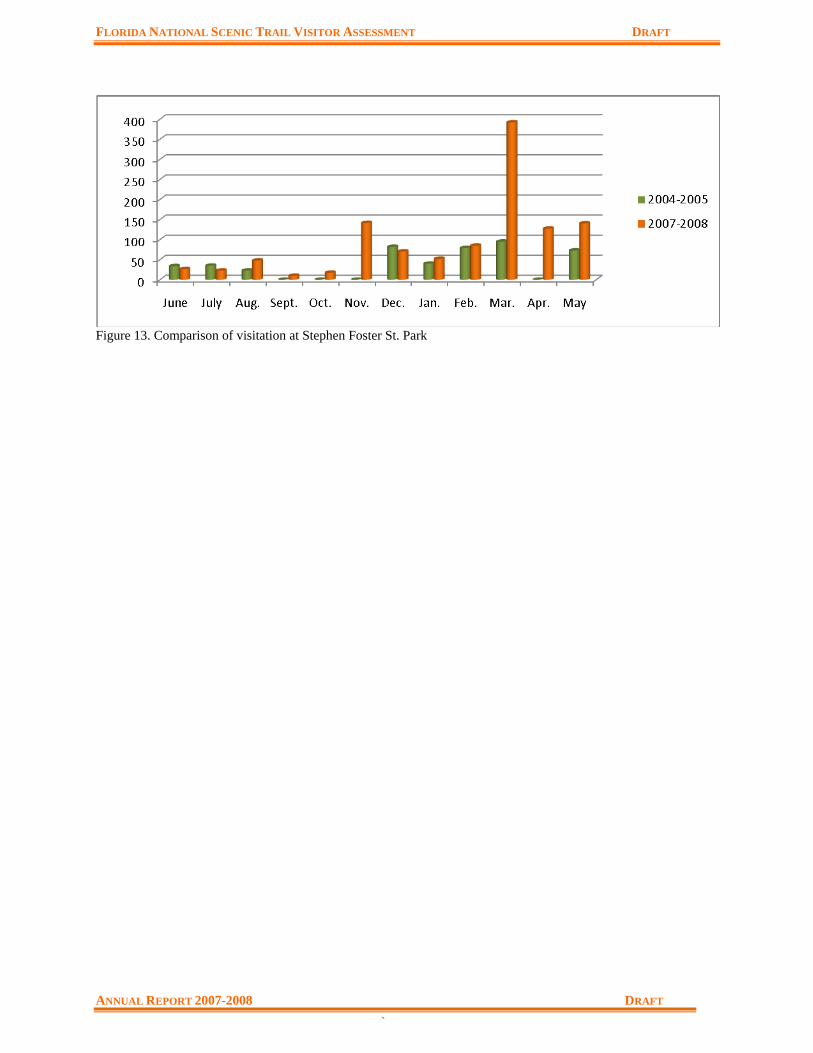
FLORIDA NATIONAL SCENIC TRAIL VISITOR ASSESSMENT DRAFT
ANNUAL REPORT 2007-2008 DRAFT
`
Figure 13. Comparison of visitation at Stephen Foster St. Park
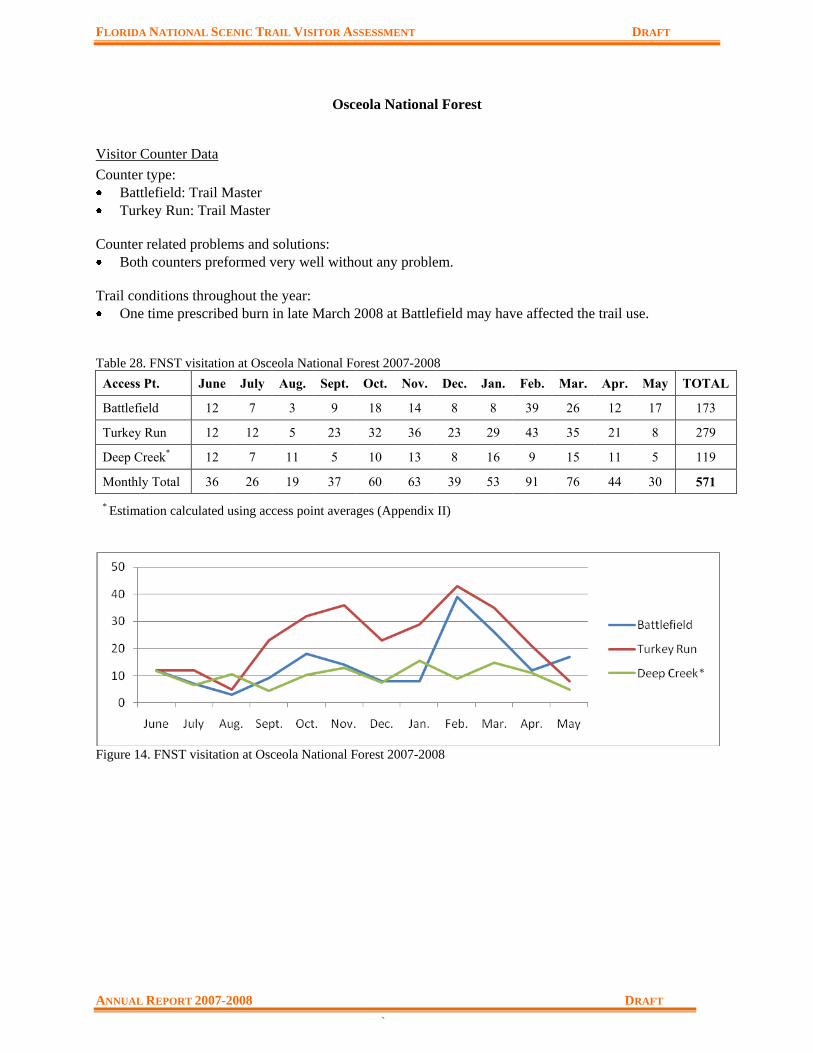
FLORIDA NATIONAL SCENIC TRAIL VISITOR ASSESSMENT DRAFT
ANNUAL REPORT 2007-2008 DRAFT
`
Osceola National Forest
Visitor Counter Data
Counter type:
Battlefield: Trail Master
Turkey Run: Trail Master
Counter related problems and solutions:
Both counters preformed very well without any problem.
Trail conditions throughout the year:
One time prescribed burn in late March 2008 at Battlefield may have affected the trail use.
Table 28. FNST visitation at Osceola National Forest 2007-2008
Access Pt. June July Aug. Sept. Oct. Nov. Dec. Jan. Feb. Mar. Apr. May TOTAL
Battlefield 12 7 3 9 18 14 8 8 39 26 12 17 173
Turkey Run 12 12 5 23 32 36 23 29 43 35 21 8 279
Deep Creek* 12 7 11 5 10 13 8 16 9 15 11 5 119
Monthly Total 36 26 19 37 60 63 39 53 91 76 44 30 571
* Estimation calculated using access point averages (Appendix II)
Figure 14. FNST visitation at Osceola National Forest 2007-2008

FLORIDA NATIONAL SCENIC TRAIL VISITOR ASSESSMENT DRAFT
ANNUAL REPORT 2007-2008 DRAFT
`
Table 29. Comparison of visitation at Osceola National Forest 2003-2008
Study Year June July Aug. Sept. Oct. Nov. Dec. Jan. Feb. Mar. Apr. May TOTAL
2003-2004 * * * * 48 30 18 55 116 71 41 35 414
2004-2005 45 18 24 0 21 212 282 241 277 254 147 88 1609
2005-2006 33 39 68 52 89 200 211 195 176 269 142 30 1504
2006-2007 39 25 26 26 57 26 124 87 190 79 75 24 692
2007-2008 36 26 19 37 60 63 39 53 91 76 44 30 571
*Counter were not installed until October of 2003
Figure 15. Comparison of visitation at Osceola National Forest 2003-2008
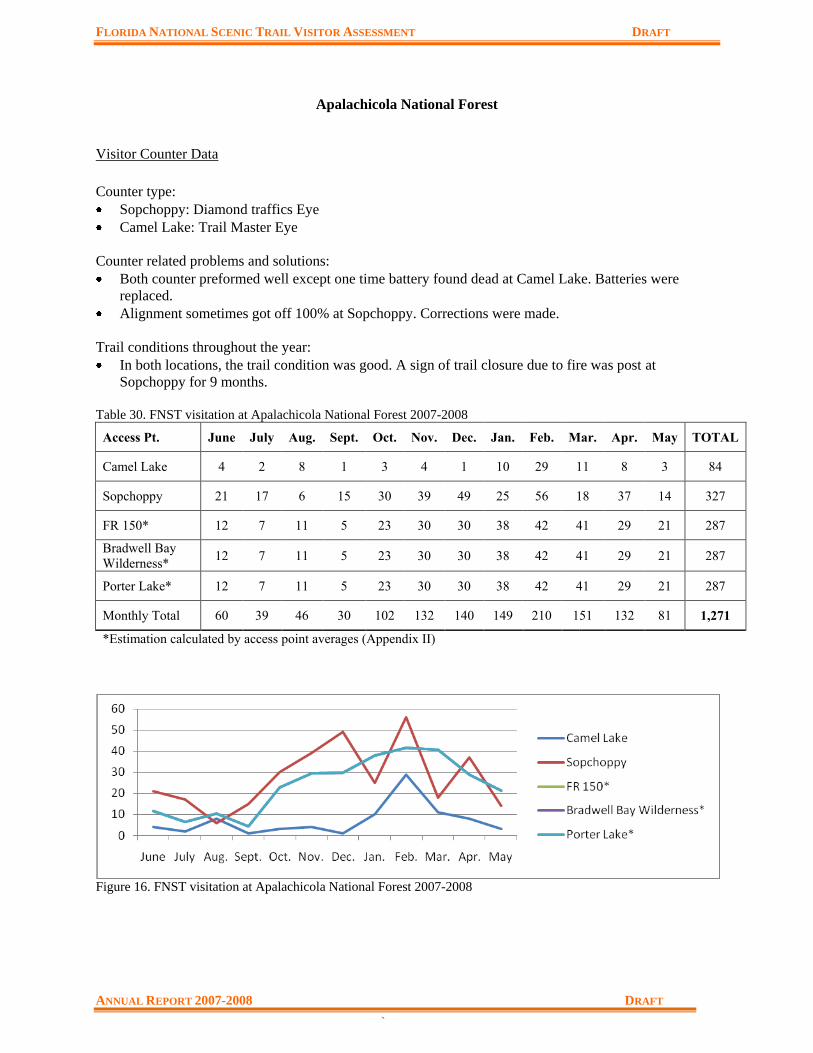
FLORIDA NATIONAL SCENIC TRAIL VISITOR ASSESSMENT DRAFT
ANNUAL REPORT 2007-2008 DRAFT
`
Apalachicola National Forest
Visitor Counter Data
Counter type:
Sopchoppy: Diamond traffics Eye
Camel Lake: Trail Master Eye
Counter related problems and solutions:
Both counter preformed well except one time battery found dead at Camel Lake. Batteries were
replaced.
Alignment sometimes got off 100% at Sopchoppy. Corrections were made.
Trail conditions throughout the year:
In both locations, the trail condition was good. A sign of trail closure due to fire was post at
Sopchoppy for 9 months.
Table 30. FNST visitation at Apalachicola National Forest 2007-2008
Access Pt. June July Aug. Sept. Oct. Nov. Dec. Jan. Feb. Mar. Apr. May TOTAL
Camel Lake 4 2 8 1 3 4 1 10 29 11 8 3 84
Sopchoppy 21 17 6 15 30 39 49 25 56 18 37 14 327
FR 150* 12 7 11 5 23 30 30 38 42 41 29 21 287
Bradwell Bay
Wilderness* 12 7 11 5 23 30 30 38 42 41 29 21 287
Porter Lake* 12 7 11 5 23 30 30 38 42 41 29 21 287
Monthly Total 60 39 46 30 102 132 140 149 210 151 132 81 1,271
*Estimation calculated by access point averages (Appendix II)
Figure 16. FNST visitation at Apalachicola National Forest 2007-2008
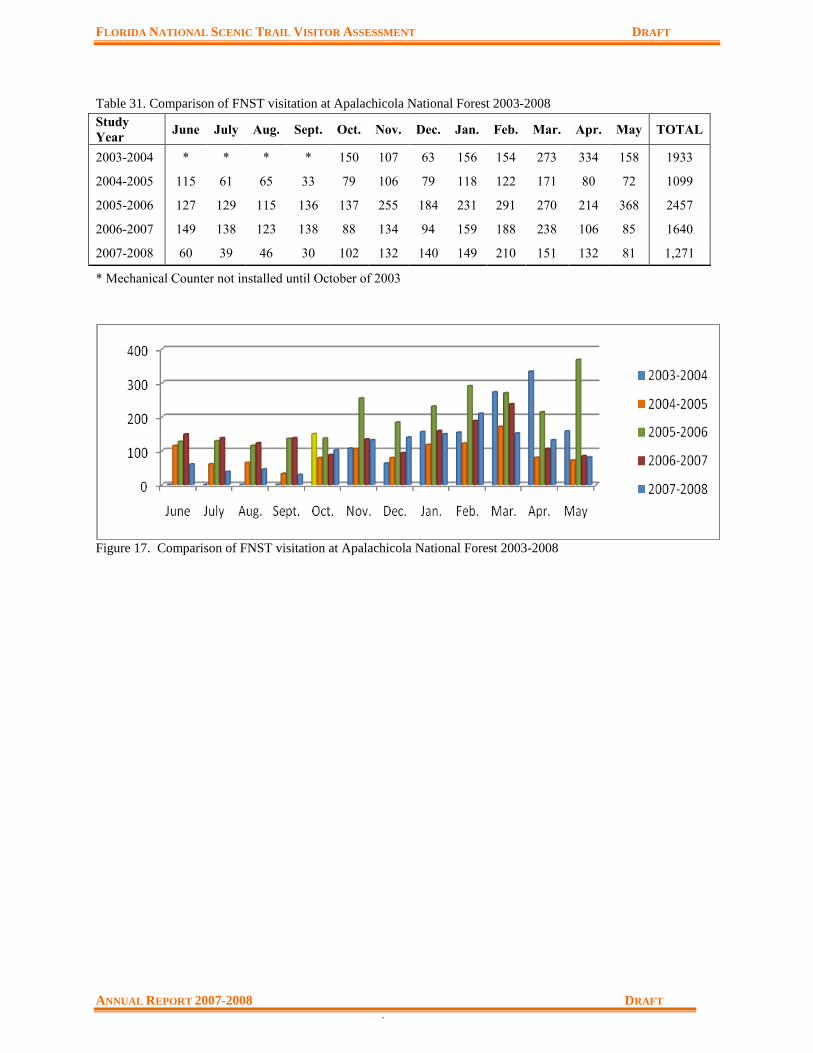
FLORIDA NATIONAL SCENIC TRAIL VISITOR ASSESSMENT DRAFT
ANNUAL REPORT 2007-2008 DRAFT
`
Table 31. Comparison of FNST visitation at Apalachicola National Forest 2003-2008
Figure 17. Comparison of FNST visitation at Apalachicola National Forest 2003-2008
Study
Year June July Aug. Sept. Oct. Nov. Dec. Jan. Feb. Mar. Apr. May TOTAL
2003-2004 * * * * 150 107 63 156 154 273 334 158 1933
2004-2005 115 61 65 33 79 106 79 118 122 171 80 72 1099
2005-2006 127 129 115 136 137 255 184 231 291 270 214 368 2457
2006-2007 149 138 123 138 88 134 94 159 188 238 106 85 1640
2007-2008 60 39 46 30 102 132 140 149 210 151 132 81 1,271
* Mechanical Counter not installed until October of 2003