Florida Medicaid Managed Care · 1/8/2019 · Florida Medicaid Managed Care Beth Kidder, Deputy...
22
Florida Medicaid Managed Care Beth Kidder, Deputy Secretary for Medicaid Agency for Health Care Administration House Health and Human Services Committee January 8, 2019
Transcript of Florida Medicaid Managed Care · 1/8/2019 · Florida Medicaid Managed Care Beth Kidder, Deputy...

Florida Medicaid Managed Care
Beth Kidder, Deputy Secretary for MedicaidAgency for Health Care Administration
House Health and Human Services CommitteeJanuary 8, 2019

The Florida Medicaid Program• Florida Medicaid serves about 4 million of the most vulnerable
Floridians– 1.7 million adults - parents, elderly, and disabled– 47% of children in Florida.– 63% of birth deliveries in Florida.– 61% nursing home days in Florida.
• Florida Medicaid has an effective delivery model that has increased quality and satisfaction program wide– Statewide Medicaid Managed Care program implemented
in 2013-2014• Almost all of Florida’s Medicaid population that receives
Medicaid services gets them through a managed care delivery system.
2

3
Evolution of Florida Medicaid Delivery System1970 1980 1990 2000 2010 2020
1970sFee-for-Service
only/ no Managed
Care
1980sFirst Managed Care: medical services only
(limited counties)
1990sManaged Care:
medical services only
(limited counties)
2006Medicaid
Reform Pilot: Integrates
medical, mental health, dental & transportation into Managed Care (limited
counties)
2014Phase 1:
Statewide Medicaid
Managed Care: Fully integrates
medical, dental,
behavioral and transportation into Managed
Care (statewide)
Integrate Behavioral
Health Services
Integrate Transport.
Services
Integrate Dental
Services
Medical Services
Only
No Managed
Care
Fully Integrated
2019Phase 2:
Statewide Medicaid
Managed Care: Fully integrates medical care,
long-term care, behavioral and transportation into Managed
Care (statewide).
Stand-alone dental plans.
2006 2014 2018 Future
4
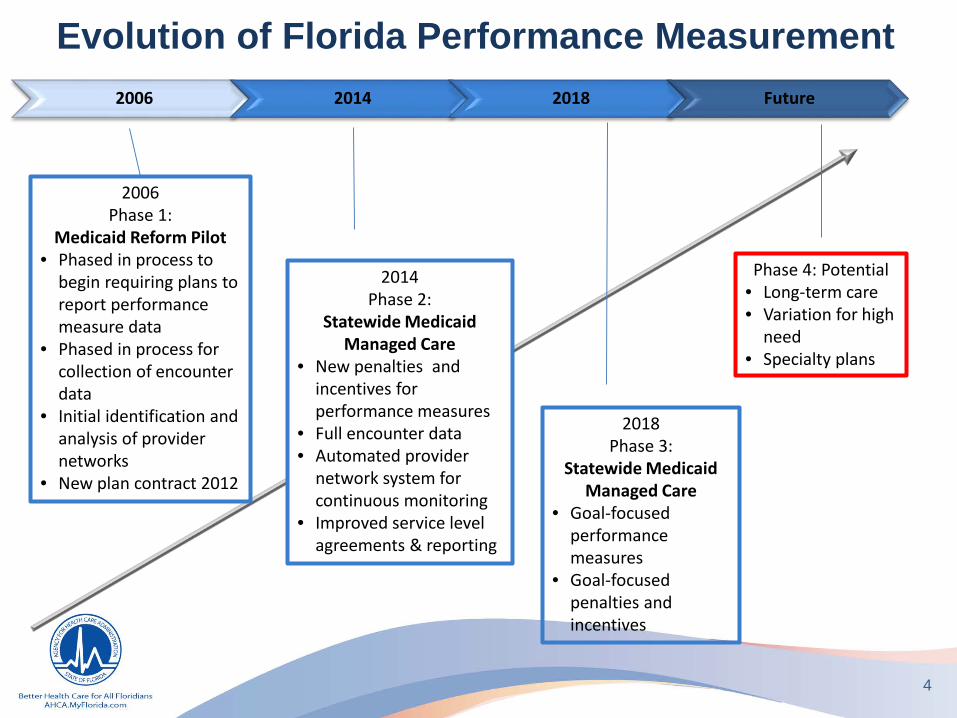
Evolution of Florida Performance Measurement
2006Phase 1:
Medicaid Reform Pilot• Phased in process to
begin requiring plans to report performance measure data
• Phased in process for collection of encounter data
• Initial identification and analysis of provider networks
• New plan contract 2012
2018Phase 3:
Statewide Medicaid Managed Care
• Goal-focused performance measures
• Goal-focused penalties and incentives
Phase 4: Potential• Long-term care • Variation for high
need• Specialty plans
2014Phase 2:
Statewide Medicaid Managed Care
• New penalties and incentives for performance measures
• Full encounter data• Automated provider
network system for continuous monitoring
• Improved service level agreements & reporting

2006 2014 2018
5
Evolution of Florida Health Plan Compliance
2006Phase 1:
Medicaid Reform PilotIntensive iterative engagement with plans
2018Phase 3:
Statewide Medicaid Managed Care
• Goal focused penalties and incentives.
• Contractual compliance and distributed model continued.
• Transparency to public
2014Phase 2:
Statewide Medicaid Managed Care
• Strong contractual compliance levers including sanctions and liquidated damages, routinely applied.
• Distributed compliance model implemented.
• Transparency to public

2006 2014 2018
6
Evolution of Florida Health Plan Provider Networks
2006Phase 1:
Medicaid Reform PilotLimited specific provider ratios; no automated provider network reporting
2018Phase 3:
Statewide Medicaid Managed Care
• Goal focused enhancements to provider network standards
• Negotiated enhanced standards (after hours, emergency)
• Telemedicine• Transparency to public
2014Phase 2:
Statewide Medicaid Managed Care
• Automated, continuous provider network verification
• Enhanced provider network standards across multiple provider types
• Strengthened standards in response to stakeholder input
• Transparency to public

The Statewide Medicaid Managed Care Program
7

The Statewide Medicaid Managed Care Program• Since 2013-2014, most Florida Medicaid recipients have been
required to enroll in the Statewide Medicaid Managed Care program (SMMC) to receive services.
• Three components:
• Managed Medical Assistance: Medical services like doctor visits, hospital care, prescribed drugs, mental health care, and transportation to these services.
• Long-Term Care: LTC services like care in a nursing facility, assisted living facility, or at home.
• Dental: All Medicaid recipients who receive a dental benefit enroll in a dental plan.
8

The Statewide Medicaid Managed Care Program
• During 2017- 2018, the Agency re-procured contracts to provide managed medical assistance (MMA), long-term care (LTC) and dental services in the SMMC program.
– 11 Regions: Phased roll-out from December 2018 through February 2019
• 19 health & dental plans
• Some are specialty plans serving unique populations (i.e., people with serious mental illness or HIV/AIDS, children with serious medical conditions or in child welfare system)
9

SMMC: The First Five Years
10
• The SMMC program started operation in 2013-2014.• The first 5 years of the program have been very
successful.
• Robust Expanded Benefits, Enhanced Provider Networks, and Care Management gave us:
• Improved health quality outcomes• High patient satisfaction• Increased opportunity for individuals needing
long-term care to transition from nursing facilities to their own homes or other community living
• Managed Care Controlled Costs

Quality Scores At or Above the National Average
11
*Calendar Year 2014 was a transition year between Florida’s prior managed care delivery system and the SMMC program implementation. **The HEDIS specifications for the Follow-up After Hospitalization for Mental Illness measure changed for the CY 2017 measurement period. Follow-up visits with a mental health practitioner that occur on the date of discharge are no longer included in the numerator as previously required in the CY 2016 specifications. Florida Medicaid plan rates and statewide weighted means are compared to national means that are calculated using the previous year’s service data. Since the CY 2016 and CY 2017 measure specifications do not align, results are not comparable and the measure was excluded.
0%
10%
20%
30%
40%
50%
60%
70%
Managed CareCalendar Year
2010
Managed CareCalendar Year
2011
Managed CareCalendar Year
2012
Managed CareCalendar Year
2013
*2014 TransitionYear
MMA CalendarYear 2015
MMA CalendarYear 2016
**MMA CalendarYear 2017
35% 35%
45%41%
53%
59%
69%

SMMC Focus on Families: LTC Patient-Centered Care in the Community
• Most people would prefer to receive care in their own home rather than in a nursing home.
• The Long-Term Care program is helping people who want to live in their homes/the community instead of nursing homes.
• The LTC program caused a major reduction in the percent of Medicaid recipients in nursing homes and an increase in those living in their own homes/the community:
– Prior to the SMMC program, 40% were in the community. As of July 2018, 58% are in the community.
12

LTC Transition Incentive Success
13

SMMC Consumer Satisfaction is High
• MMA: In 2018 adult enrollees and parents of child enrollees rated the following aspects of care as an 8 or higher (on a scale of 0 to 10).
• LTC: In 2018 patients or their family/caregivers rated their long-term care as excellent, a 9 or 10 (on a scale of 1-10).
14
Survey Item Adults Parents
Overall Plan Satisfaction 76% 85%
Quality of Care Received 74% 89%
Survey Item Respondents
Staff are reliable, helpful 82%
Rating of case manager 88%

Medicaid Average Annual Cost Per Person
15
$6,564 $6,251
$6,142
$6,252 $6,054
$5,865
$6,288 $6,461
$4,500
$5,000
$5,500
$6,000
$6,500
$7,000
$7,500
$8,000
FY2010-11 FY2011-12 FY2012-13 FY2013-14 FY2014-15 FY2015-16 FY2016-17 FY2017-18
Florida Medicaid: Average Annual Cost Per PersonFlorida Medicaid: Average Annual Cost Per Person

MMA Average Annual Cost Per Person
16
FY 2017-18 and prior data is from the final year end budgets.
$3,201 $3,566
$3,963 $3,855
$1,000
$2,000
$3,000
$4,000
$5,000
FY 14-15 FY 15-16 FY 16-17 FY 17-18
MMA PMPY

LTC Average Annual Cost Per Person
17
$41,710
$42,305 $42,151
$41,739
$40,000
$41,000
$42,000
$43,000
$44,000
FY 14-15 FY 15-16 FY 16-17 FY 17-18
LTC PMPY
FY 2017-18 and prior data is from the final year end budgets.

SMMC Plan Re-procurement: Negotiation Success
18
Major Program Improvements!
• Gains for Recipients• Gains for Providers• Improved Quality• More & Richer
Expanded Benefits

SMMC Plan Negotiation Success: Continued Quality Improvement
19

SMMC Plan Negotiation Success: Recipient and Provider Gains
20
• Gains for Recipients Enrolled in an MMA or Dental Plan:Access to care when you need itAdditional network providersBest benefit package ever (adult dental expanded benefits)Model enrollee handbook
• Gains for Providers:Less administrative burden
• Gains for both Recipients and Providers:Prompt authorization of servicesSmoother process for complaints, grievances and appeals

SMMC Plan Negotiation Success: Richest Benefit Package
• Newly contracted SMMC plans are offering a large number of extra benefits (“expanded benefits”) to their enrollees at NO COST to the state. Examples:
– MMA plans offer extra adult preventive services, substance abuse and mental health services, pain management services.
– LTC plans offer support for caregivers and extra help transitioning from nursing homes to the community.
– Dental plans offer adult preventive and restorative dental services and extra assistance for enrollees with special needs.
21

THANK YOU!
22
QUESTIONS?