INTERGOVERNMENTAL PANEL ON CLIMATE CHANGE (IPCC) THIRD ASSESSMENT

Florida Medicaid
Intergovernmental Transfer
Technical Advisory Panel Report
January 2011
Better Health Care for all Floridians


Intergovernmental Transfer Technical Advisory Panel Report
January 2011 Page i
Table of Contents Executive Summary ........................................................................................................................ 1 Purpose of the Panel ...................................................................................................................... 7 Goals and Alternatives ................................................................................................................... 9 Definition of Intergovernmental Transfers (IGT) ......................................................................... 10 History of IGTs ............................................................................................................................... 10 Current Use of IGTs ...................................................................................................................... 11 Issues of Concern ........................................................................................................................ 13 Other States ................................................................................................................................. 14 Panel Documents ......................................................................................................................... 14 Presented Models ........................................................................................................................ 16 Current Status and Participation ................................................................................................. 18 Physician Supplemental Payments ............................................................................................... 9 Funding Source ............................................................................................................................. 22 Closing Comments ....................................................................................................................... 23 Appendices ................................................................................................................................... 24
1. Appendix A - Panel Charter
2. Appendix B - IGT Deficit Table
3. Appendix C - County Utilization Crosstab Table
4. Appendix D - IGT Proposed Model-Managed Care Association Model
5. Appendix E - Shadow Billing Methodology
6. Appendix F - Broward County IGT Model
7. Appendix G – FAHP Position Letter
Intergovernmental Transfer Technical Advisory Panel Report
January 2011 Page 1
NOTE: Approval of this report by any of the members of the Advisory Panel is not necessarily an endorsement of any methodology for collection of funds or distribution of payment, nor does the inclusion of any methodology in this report ensure that funds to support the methodology will be made available.
Executive Summary
The 2010 Florida Legislature passed Senate Bill 1484 (Chapter 2010-144, Laws of Florida), Section 2, which instructed the Secretary of the Agency for Health Care Administration to “develop a methodology to ensure the availability of intergovernmental transfers (IGTs) in any expansion of prepaid managed care in the Medicaid program”. In addition, the Agency was instructed to appoint and convene a Technical Advisory Panel (Panel). The role of the Panel was “to advise the Agency in the study and development of intergovernmental transfer distribution methods”. The Panel was also to advise the Agency regarding specific issues related to the methodology to be developed. Specifically, the legislation directed the Panel to advise the Agency regarding “negotiations with the Centers for Medicare and Medicaid Services, and appropriate safeguards for appropriate implementation of any developed payment methodologies”.
The legislation required that the Agency submit a report to the Legislature and Governor by January 1, 2011. The legislation also stipulated that the Agency may not implement a methodology using the intergovernmental transfers without legislative authority.
As directed by law, the Agency Secretary selected nine members to serve on the Intergovernmental Transfer Technical Advisory Panel (Panel) and advise the Agency on the development of an IGT distribution methodology. The Members included representatives from hospitals, medical schools, local governments, and managed care plans. The Agency staff served as a facilitator for the Panel.
The Panel convened eleven public meetings via conference call or face-to-face between July 20,
2010 and December 16, 2010. Minutes and documents pertaining to those meetings can be
found on the Agency’s website at the following link:
http://ahca.myflorida.com/Medicaid/igt/index.shtml
Using the advice and information provided by the Panel, the Agency developed this report. This
report contains information and data prepared and provided by members of the Panel as well
as information prepared by the Agency. Not all information or data provided by Panel
members was reviewed in full by the Panel as a whole and as a result discussions regarding
potential issues that impact the viability of the enclosed data and methodologies may not have
occurred due to the time constraints. However, the Panel did advise the Agency to include all
information provided by Panel members in this report, regardless of level of deliberation, in an
Intergovernmental Transfer Technical Advisory Panel Report
January 2011 Page 2
effort to provide the Legislature and Governor’s Office with the most information available at
the time of report submission. Below is an overview of the Panel’s deliberations.
During the initial meetings of the Panel, the Agency provided an overview of the current
processes and methodologies used for rate setting for both the hospital fee-for-service (FFS)
rates and managed care capitation rates. In addition, the Agency explained the current use of
IGTs in the FFS hospital rate setting process.
Currently, IGTs are primary used in hospital FFS rates for the purpose of funding the exempt
portion and authorized buybacks of inpatient and outpatient hospital rates. The General
Appropriations Act (GAA) each year authorizes specifically qualifying hospitals to be exempt
from specific limitations within the rate setting process. This is called the Exemption program.
To be exempt from the limitations, hospitals must meet specific thresholds such as Medicaid
and charity care volume benchmarks provided in the GAA. In addition, beginning July 2008, the
Legislature authorized the use of IGTs to fund buybacks. Buybacks are the process of receiving
local government funded match to fund the state portion of specific rate reductions that had
been adopted to reduce the hospital rates.
Currently, the managed care rate setting process does not use IGTs as a funding source. A
managed care capitation rate is a prospective rate that is determined based on historical data
and is projected based on trends and risk of the population. Under FFS, the hospital receives
direct payment related to the service and individual. Under a capitated methodology, rate
development includes historical utilization of hospital services. However, hospital utilization
can change due to plan negotiations or recipient and provider practices. The methodology
used for calculating capitated managed care rates includes the current value of FFS hospital
inpatient exemptions and buybacks.
Capitated managed care plans are at risk for any changes in utilization. Under an IGT
methodology which includes supplemental payments to managed care organizations (MCOs),
any adjustments made for increased or decreased utilization would change supplemental
payments to all the Managed Care Organizations (MCOs) in that area prospectively, which
would not minimize the impact of shifts in utilization that occurs in a prior period. Therefore a
refined methodology would be needed. Methodologies presented to the Panel for making
adjustments assumed that individual MCOs in the same region could be paid different rates.
Due to the rolling nature of a prospective capitation process in comparison to an actual claims
based FFS approach, there is less precision which prevents any capitation method from having a
one to one comparison with FFS.
There are multiple scenarios where the use of IGTs to fund managed care could be a variable.
This report has been written to provide information regarding a methodology related to IGTs
Intergovernmental Transfer Technical Advisory Panel Report
January 2011 Page 3
and any expansion of prepaid managed care. Scenarios vary based on the population and
policies that would be funded using IGTs. It is possible that a single methodology for calculating
a supplemental capitation payment could be used regardless of the scenario selected.
However, the complexity and the funding level of each scenario could differ significantly. Since
the current value of the exemptions and buybacks are already included in the calculation of the
capitated managed care rates and supported by General Revenue, for the purposes of this
report, the Panel chose to examine in detail the impact of an expansion of managed care as
described in Scenario 2 provided later in the report. Scenario 2 uses IGTs to fund all
exemptions and buybacks for only the expansion population transitioned from FFS into
managed care as managed care expands in the future.
Through the Panel’s deliberations, concerns regarding the viability of the proposed
methodologies were identified from all parties. The primary concern was the counties’
willingness or ability to provide the IGTs as the funding source for the purpose of supporting
managed care.
The implementation of the 1115 Medicaid Reform Demonstration waiver included the
establishment of the Low Income Pool (LIP). The LIP program replaced the Hospital Upper
Payment Limit (UPL) supplemental payment program. The LIP program has an annual limit of
$1 billion and is authorized for the purpose of providing funding to programs and providers for
the uninsured and underinsured. The LIP is primarily funded using IGTs as the state matching
share. This report references the linking of LIP and a supplemental capitation methodology.
The link between the two is specific to providing incentives for IGT sponsors to contribute IGTs
at a level greater than the need for the county or area in which they operate. The actual
payment of exemptions and buybacks are made through adjustments to the individual hospital
inpatient per diems or hospital outpatient encounter rates paid by Medicaid under FFS.
Local governments are expected to contribute in excess of $791,865,205 in FY2010-11 to
support the state share of LIP and other Medicaid payments made by the Agency to providers
in their communities. The Agency, on behalf of the Panel, reached out to the counties through
the Florida Association of Counties to identify the ability and willingness of counties to continue
providing IGTs if the majority of the FFS population is transitioned into capitated managed
care. County funds used as IGTs are typically tax revenues. Based on the Agency’s outreach
effort, some counties expressed hesitation to provide IGTs as a source of funding for managed
care until and unless adequate safeguards can be defined and established to assure local tax
payers that qualified health services will be funded. Other counties stated they would consider
participation if there continued to be incentives for counties to provide funding for their
counties and for others when needed; however, it is not clear whether the incentive payments
can be retained at the same level experienced today under LIP distributions.
Intergovernmental Transfer Technical Advisory Panel Report
January 2011 Page 4
The use of supplemental capitation payments or modifications to a general capitation rate has
been addressed in other states to resolve managed care issues pertaining to hospital payments
and physician supplemental payments for medical schools. The Agency provided information
about changes that South Carolina implemented related to the physician payments.
Information related to the methodology and supplemental payments for hospitals
implemented by the State of Michigan was also provided. The Michigan program does not
address the physician supplemental payments and is specific to hospital payments.
There is currently no mediation process or independent process that addresses payments
between the hospitals and health plans. This issue was addressed in Michigan by the hospital
providers and health plans working together to negotiate a payment agreement to resolve the
concerns.
The Panel was presented two tables that were prepared to help the Panel members understand
the current source of IGTs and the hospital utilization experienced by each county in the FFS
program based on the county of resident of the recipient.
In summary, any methodology considered must continue to provide an incentive to counties to
continue contribution of IGTs at the current rate or identify an alternative source of funding.
Counties that do not currently provide IGTs or that provide only a level to sustain the county’s
provider needs would incur a reduction in reimbursement if certain counties reduce or
eliminate their IGT contribution unless another source of funding is secured to replace lost IGTs.
The reduction in reimbursement would result from the loss of rate exemptions and buyback
currently funded through donor counties’ IGTs. . There are currently 45 counties in which
qualifying and participating hospitals receive the benefit of exemptions and buybacks. Based
on the analysis provided to the Panel, of the 45 counties, there are 28 counties in which no
contributions of IGTs for the purpose of exemptions and buybacks are provided by the county
itself or authorized entity such as a taxing authority within the county. In addition, there are 11
counties in which partial contributions are provided from within and six that have contributions
that meet and exceed the IGT needed for the county for which the IGTs are provided. (See
page 14 and Appendix B for more details.)
Another table provides FFS hospital utilization for each county by the county of residence for
the recipient. This table shows that the county in which the services are rendered is not
necessarily the county in which the recipient resides. Therefore, the funding of hospital
exemptions and buybacks is a cross county issue regardless of managed care or fee-for-service
enrollment. (See page 15 and Appendix C for more details.)
The capitated managed care plans expressed concerns about adequate funding and rate
negotiations for the population in relation to the hospitals in the areas of operation. Managed
Intergovernmental Transfer Technical Advisory Panel Report
January 2011 Page 5
care plans representatives on the Panel expressed a desire to treat any IGT methodology as a
pass through for the purpose of hospital services.
There were three models prepared by Panel members and submitted for purposes of this
report. The first model was discussed among the Panel during multiple meetings. The model
was prepared based on summary information and data presented to the Panel by the Agency.
The model provides a distribution method of the hospital supplemental capitation based on
historical utilization for qualifying hospitals by plan by area of the state. (See page 16 and
Appendix D for more details.)
The second and third models were not reviewed in detail by the Panel and only discussed at a
high level by the Panel members. The second model provides an alternative billing process,
Shadow Billing, which allows for the non-exempt rate to be paid by the managed care
organization and a second FFS payment made by the state for the exempt and buyback portion
of the hospital rate. (See page 15 and Appendix E for more details.) The third model provides
for a county specific program that mirrors the current FFS process and directs any expansion of
managed care within the Medicaid program to the FFS PSNs. (See page 17 and Appendix F for
more details.)
None of the models proposed were approved by the Panel as models that are ready for
implementation, and these models do not address all concerns pertaining to the funding of the
payments. However, the Panel did support including the models in the report. In addition, the
Panel addressed payment and methodology options that could be used to expand the Physician
Upper Payment Limit (Physician UPL) program. This is a payment process that allows the
Medical Schools to provide state certified match and receive increased payment for qualifying
services rendered by approved staff. This payment program currently does not provide
increased payments related to recipients served through Medicaid managed care plans.
In conclusion, the Panel was unable to provide resolution to the issues outlined in the
legislation of “negotiations with the Centers for Medicare and Medicaid Services and
appropriate safeguards for appropriate implementation of any developed payment
methodologies”. However the concerns and discussions of the Panel did provide significant
benefit and insight to the Agency. The Agency has attempted to complete the task provided by
the legislation to “develop a methodology to ensure the availability of intergovernmental
transfers in any expansion of prepaid managed care in the Medicaid program”. Any model or
methodology to implement a hospital supplemental capitation payment or physician
supplement payments would be subject to federal CMS authority prior to implementation. The
Agency is of the opinion that the development of methodologies for managed care payments tp
both the hospital supplemental payments and physician supplemental payments that include
IGTs is possible. However, based on deliberations of the Panel, there were issues about which

Intergovernmental Transfer Technical Advisory Panel Report
January 2011 Page 6
members expressed concerns regarding IGT funding that may be a barrier to implementing a
model. Until this issue is successfully resolved, sufficient funds may not materialize. Therefore,
the model would not be a viable option.
Intergovernmental Transfer Technical Advisory Panel Report
January 2011 Page 7
Purpose of the Panel
The Agency for Health Care Administration was instructed via Senate Bill 1484 (Chapter 2010-144, Laws of Florida), Section 2, to “develop a methodology to ensure the availability of intergovernmental transfers in any expansion of prepaid managed care in the Medicaid program”.
In addition, the Agency was instructed to appoint and convene a Technical Advisory Panel (Panel). The role of the Panel was “to advise the Agency in the study and development of intergovernmental transfer distribution methods”. The Panel was also to advise the Agency regarding specific issues related to the methodology to be developed. Specifically, the legislation directed the panel to advise the Agency regarding “negotiations with the Centers for Medicare and Medicaid Services, and appropriate safeguards for appropriate implementation of any developed payment methodologies”.
The legislation required that the Agency submit a report to the Legislature and Governor by January 1, 2011. The legislation also stipulated that the Agency may not implement a methodology using the intergovernmental transfers without legislative authority.
Section 2 of Senate Bill 1484 reads as follows:
“ Section 2: (1) The Agency for Health Care Administration shall develop a methodology to ensure the availability of intergovernmental transfers in any expansion of prepaid managed care in the Medicaid program. The purpose of this methodology is to support providers that have historically served Medicaid recipients, including, but not limited to, safety net providers, trauma hospitals, children’s hospitals, statutory teaching hospitals, and medical and osteopathic physicians employed by or under contract with a medical school in this state. The agency may develop a supplemental capitation rate, risk pool, or incentive payment to plans that contract with these providers. The agency may develop the supplemental capitation rate to consider rates higher than the fee-for-service Medicaid rate when needed to ensure access and supported by funds provided by a locality. The agency shall evaluate the development of the rate cell to accurately reflect the underlying utilization to the maximum extent possible. The methodology may include interim rate adjustments as permitted under federal regulations. Any such methodology shall preserve federal funding to these entities and must be actuarially sound.
(2) The Secretary of Health Care Administration shall appoint members and convene a technical advisory Panel to advise the agency in the study and development of intergovernmental transfer distribution methods. The Panel shall include representatives from contributing hospitals, medical schools, local governments, and managed care plans. The Panel shall advise the agency regarding the best methods for ensuring the continued availability of intergovernmental transfers, specific issues to resolve in negotiations with the Centers for Medicare and Medicaid, and appropriate safeguards for appropriate implementation of any developed payment methodologies.

Intergovernmental Transfer Technical Advisory Panel Report
January 2011 Page 8
(3) By January 1, 2011, the agency shall provide a report to the Speaker of the House of Representatives, the President of the Senate, and the Governor on the intergovernmental transfer methodologies developed. The agency shall not implement such methodologies without express legislative authority.”
The Panel consisted of nine members appointed by the Secretary of the Agency for Health Care Administration, based on the Legislative authority listed above. Agency staff served as facilitators and resources for, but not members of, the Panel.
Members of the Panel were:
2010 Intergovernmental Transfer Technical Advisory Panel Members
Name Affiliation
Tom Wilfong Chief Operating Officer
Amerigroup
Chris Paterson Plan President
Sunshine State Health Plan
Kevin Kearns President and Chief Executive Officer
Health Choices Network
David Verinder Chief Operating Officer
Sarasota Memorial Health System
Mary Lou Tighe Corporate Director, Governmental Relations
Jackson Memorial Health System
Margaret Brennan Health Services Division Manager
Orange County
Mark Knight Chief Financial Officer
Health Care District of Palm Beach County
Scott Davis Director, Revenue Cycle Management
South Broward Health Care District/ Memorial Regional Hospital
Michael Good, M.D. Dean, University of Florida College of Medicine
Intergovernmental Transfer Technical Advisory Panel Report
January 2011 Page 9
The Panel met eleven times between July 2010 and December 2010 in order to accomplish the duties outlined above. Agency staff worked with Panel members to develop supporting documentation of items for each meeting. All documentation and minutes of each meeting are posted online at:
http://ahca.myflorida.com/Medicaid/igt/index.shtml
Please refer to Appendix A, Panel Charter, for complete details of Panel membership, duties and meetings.
Based on Panel discussions and analysis, the Agency developed this report, for submission to the Speaker of the House of Representatives, the President of the Senate, and the Governor as required by SB 1484.
Goals and Alternatives
Each member of the Panel was given the opportunity to offer what he or she believed were the
most important goals and objectives for the Panel to accomplish by the end of the Panel’s term
and to mention any specific concerns they had regarding possible IGT approaches in Medicaid
managed care. The Panel members agreed on the following list of common goals and concerns:
The need for a base methodology to establish a supplemental payment for managed care
Minimize any potential disruption in IGTs or Certified Public Expenditures (CPEs) that finance Medicaid provider payments to hospitals and physicians if Medicaid managed care is expanded
Create a clear, approvable methodology to establish supplemental payments to hospitals and medical school faculty funded by IGTs/CPEs
Preserve access to care for Medicaid patients, including access to specialty care and access to medical school faculty practice plans
Retain incentives for existing local financing arrangements for Medicaid provider payments
Minimize any potential disruption of use of IGTs that are not bound by specific regional/county geographical constraints today
Consider a retrospective payment process so no party is harmed
Investigate other opportunities for federal matching funds, such as ways to expand the pool of IGT providers, within federal rules
Concern that the supplemental payment would be made to the managed care organizations, and would not be passed on to the safety net providers

Intergovernmental Transfer Technical Advisory Panel Report
January 2011 Page 10
Definition of Intergovernmental Transfer (IGT)
Intergovernmental transfers are the transfer of public funds from different levels of
governmental or governmental entities/taxing districts to the state government, commonly
referred to as IGTs. Use of IGTs is a common mechanism for states to fund the non-federal
share of certain Medicaid payments. Once used as part of the state share of Medicaid funding,
the transferred funds are matched with federal Medicaid dollars and then paid to qualifying
Medicaid providers.
History of Intergovernmental Transfers
Voluntarily transferred IGTs were first used to fund the state's Medicaid disproportionate share
program; funding from three counties was leveraged to draw down federal matching dollars for
the state's largest charity and teaching hospitals in support of their charitable, teaching and
research missions. The use of IGTs was expanded with the advent of the Upper Payment Limit
program (UPL), which enhanced payments to teaching hospitals, trauma centers, and those
hospitals providing significant levels unfunded care. With the approval of the State’s 1115
Medicaid Reform Waiver, the state transitioned from the UPL program to the authorized Low
Income Pool (LIP) funding, which provided a $1 billion a year for care provided to underinsured
and uninsured individuals. As a result, the use of voluntary IGTs increased under the LIP and
even a greater number of hospital providers as well as non-hospital providers such as county
health departments have been afforded supplemental Medicaid payments.
As the Medicaid program transitioned into each of these programs, the state share of these
expansions was voluntarily provided by IGT contributing entities in lieu of being funded through
state General Revenue. With each expansion, accounting for the growing amount of IGTs
became more complex, in part because some entities are able to finance more of the program
than others, and the local governments of some recipient providers are not able to contribute
at all. LIP affords the greatest degree of flexibility in this regard; contributing entities are
incentivized to participate by the IGTs being eligible to receive “credit” as described above.
Multiple Panel members representing the counties and hospital providers stated that the level
of accountability is key, as taxing authorities and public hospital boards have a fiduciary duty to
make sure that IGT dollars raised and earned by these entities are used for their intended
purposes. Reimbursement under LIP, traditional FFS, and FFS Provider Service Networks (PSNs)
allows for a direct link between the IGT and provider payments.
Currently in Florida, IGTs are used primarily for the purpose of providing higher payment rates
or special Medicaid payments for hospital inpatient and outpatient services. Another source of
the state share of Medicaid funding is certified public expenditures (CPEs) made by medical
Intergovernmental Transfer Technical Advisory Panel Report
January 2011 Page 11
school physician practices, which are local expenditures certified as state match in order to
drawn down federal matching funds, rather than transferred.
Qualifying localities such as taxing districts and local governments execute a Letter of
Agreement with the Agency that secures the state share of matching funds required to fund the
levels of exemptions and buybacks for the hospitals in communities around the State. CPEs are
currently used for supplemental payments to teaching faculty physicians at eligible medical
schools.
Current Use of IGTs
Currently, IGTs are primary used in hospital FFS rates for the purpose of funding the exempt
portion and authorized buybacks of inpatient and outpatient hospital rates. The General
Appropriations Act (GAA) each year authorizes specifically qualifying hospitals to be exempt
from specific limitations within the rate setting process. This is called the Exemption program.
To be exempt from the limitations, hospitals must meet specific thresholds such as Medicaid
and charity care volume benchmarks provided in the GAA. In addition, beginning July 2008, the
Legislature authorized the use of IGTs to fund buybacks. Buybacks are the process of receiving
local government funded match to fund the state portion of specific rate reductions that had
been adopted to reduce the hospital rates.
There is currently no use of IGTs in the managed care capitation rates. Hospital exemptions and
buyback amounts that are included in the capitation rates are currently funded using state
General Revenue. If IGTs become a funding source for the managed care capitation rates, it is
undetermined what incremental level would be funded by IGTs. The Panel was provided three
scenarios to consider through the discussions regarding what components the IGTs would be
used to fund as part of the capitation rates.
1) Use IGTs to fund all exemptions and buybacks for all managed care recipients regardless of prior funding of General Revenue (GR) within the managed care capitation rate.
2) Use IGTs to fund all exemptions and buybacks for only the expansion population from FFS into managed care as managed care expands in the future.
3) Use IGTs to fund only the incremental portion for exemptions and buybacks for all managed care recipients regardless of prior process. This scenario is similar to #1 with the exception that the portion that is currently funded by General Revenue would continue as General Revenue and only the growth in current managed care needs is funded by IGTs and all new managed care enrollees from transition are funded by IGTs, not GR.

Intergovernmental Transfer Technical Advisory Panel Report
January 2011 Page 12
For purposes of this report, the Panel focused on Scenario 2.
Intergovernmental transfers are currently used as a funding source for exemptions and buyback
policies within the Hospital Inpatient and Outpatient Fee-For-Service reimbursement rate
methodology.
The implementation of the 1115 Medicaid Reform Demonstration waiver included the
establishment of the Low Income Pool (LIP). The LIP program replaced the Hospital Upper
Payment Limit (UPL) supplemental payment program. The LIP program has an annual limit of
$1 billion and is authorized for the purpose of providing funding to programs and providers for
the uninsured and underinsured. The LIP is primarily funded using IGTs as the state matching
share.
IGT providers today under the authority of the LIP receive “credit” for contributing the required
state share to fund the LIP. The amount of IGT or “credit” determines the level of payment the
eligible providers will receive. Under the current LIP payment distribution method, the funding
of IGTs to support exemptions is eligible for “credit”. The funding of buybacks does not receive
the same “credit”. The “credit” payment is a combination of 100% of the amount provided that
was eligible for credit and 14.6% which is referred to as an allocation factor. IGTs are currently
provided only for FFS reimbursement purposes.
Due to the growth of exemptions and buybacks over the years, the LIP program is unable to
allow for “credit” at the same level as prior years in relation to exemptions. This issue exists in
FFS and would not be specific to expansion of managed care. It is not clear that the issue would
be eliminated or be exacerbated if IGTs were to fund managed care.
The actual payment of the exemption or buyback is not a part of the LIP program. The actual
payment of exemptions and buybacks is made through adjustments to the facility specific
hospital inpatient per diem or hospital outpatient encounter rate for the eligible hospitals.
However, the entities that provide the funding for these payments, to the extent allotted,
receive “credit” and increased payment within the LIP program as an incentive to provide the
IGT for the local community as well as communities around the state that are unable to provide
the local IGT. There is currently additional funding for exemptions and buybacks that are not
eligible to receive “credit” under the LIP program and remain outside of the LIP. A general topic
of discussion throughout all Panel meetings related to the concern that without participation
from existing counties and/or expanding the number of counties willing to contribute, or
finding another source of funding, community hospitals may not receive the same benefit of
being eligible for exemptions or buybacks as they have in the past. Some Panel members
suggested that the LIP payment distribution provide some type of “credit” for IGTs provided for
the purpose of transitioning FFS to managed care. However, the LIP distribution payments and
Intergovernmental Transfer Technical Advisory Panel Report
January 2011 Page 13
methodology is limited and is outside of the scope of this report and the Panel’s scope of
review.
Issues of Concern
As of December 2010, over 1.3 million Medicaid eligible persons are enrolled in managed care
organizations, another 600,000 are enrolled in MediPass, and approximately 935,000 are in
traditional FFS. Many of those under traditional FFS are exempt or voluntary eligibles for
managed care; these include the dually eligible, Medically Needy, and newly eligible persons in
the process of selecting a managed care organization.
Currently, IGTs are only used to support FFS payments, and to the extent eligible persons
remain under a FFS system, the opportunity to voluntarily enhance those payments through
IGTs should be maintained.
For the population that would be eligible for transition into capitated managed care, the members of the Panel identified issues of concern related to the evaluation of alternative reimbursement and payment methodologies for managed care, including prospective payment methodologies.
The primary concern was the counties’ willingness and/or ability to provide the IGTs as the
funding source for the purpose of supporting managed care. In accordance with s. 409.915, F.S.
(County Contributions to Medicaid), counties are required to fund a portion of hospital
inpatient days. In addition, counties can elect to provide IGTs for the purpose of exemptions
and buybacks for hospital FFS reimbursement. Under current authority, IGTs are provided on a
voluntary basis. For clarification only and not intended as a recommendation, new federal
regulations may prohibit the possibility of changing the contributions from voluntary to
mandatory status.
The Agency contracts with capitated managed care plans as risk bearing entities. The contract
includes a prospective capitation payment calculated using an actuarially sound methodology
which is approved by CMS. By accepting the payment, the entity agrees to bear the risk. Under
a risk bearing prospective payment process, there is no reconciliation process at any point.
Changes and realignment of the data and methodology used to set the future prospective rates
are made through the process of rate setting for the prospective period.
Once the Agency makes a capitated payment to a Medicaid plan, the Agency cannot pay
providers directly for the same Medicaid service – thus precluding direct supplemental
payments to contracted providers. Currently, Medicaid plans and providers are able to
negotiate reimbursement rates and payment terms with providers. There is currently no
mediation process or independent process to resolve payment issues between the hospital

Intergovernmental Transfer Technical Advisory Panel Report
January 2011 Page 14
providers and the plans. There are statutory provisions for payments made to non-contracted
providers. Free market principles apply to Medicaid plan and provider negotiations.
Other States
The Agency worked with its contracted actuaries, Milliman and Mercer, to identify other states
that had previously experienced similar issues. There were multiple states that have
experienced or are experiencing issues relating to the same services and managed care. The
State of Michigan however has implemented a supplemental capitation process that appears to
resolve issues between the hospital providers and the managed care plans. The supplemental
capitation is funded by state appropriation and not contingent on voluntary contributions.
Therefore there are no similarities when addressing the concerns related to the funding and
ensuring the availability of IGTs in any expansion of prepaid managed care in the Medicaid
program as the Agency has been instructed in the development of any methodology. In
addition, a key component of the process in Michigan is that the distribution methodology from
the health plan to the hospitals is an agreement that has been entered into by both the
hospitals and the health plans. This is not decided at the State level.
With regards to programs and methodologies related to physician supplemental payments, the
Agency researched programs in place in the South Carolina Medicaid program, which makes
similar payments as part of a managed care methodology. However, the funding source for the
modifications that South Carolina used to address this issue is General Revenue. The state share
of Florida teaching faculty physician supplemental payments for care provided to Medicaid FFS
patients is funded by voluntary Certified Public Expenditures (CPEs) from the faculty practices.
It is uncertain whether CMS would allow the use of CPEs to fund any portion of a Florida
Medicaid prepaid capitation payment.
Panel Documents
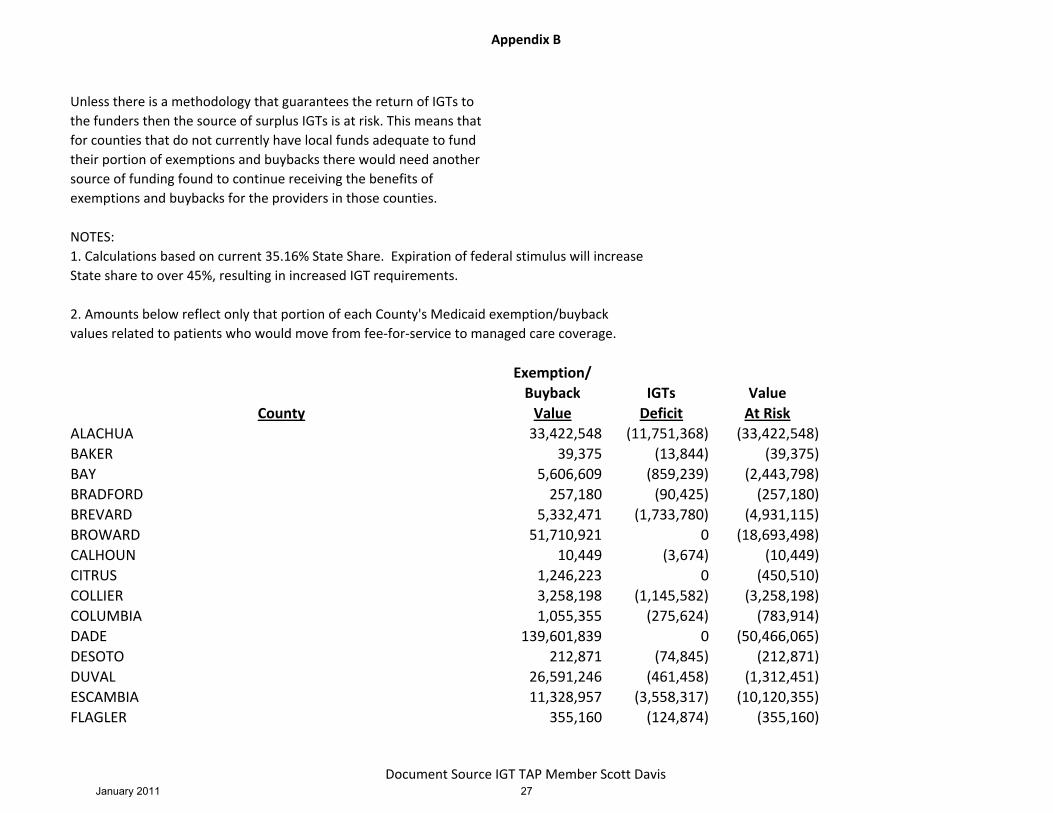
Appendix B, “IGT Deficit Table”, provides a listing of the IGT sponsors and amount they provide.
The table shows which counties could be impacted by a loss to the hospital providers if IGTs
were not maintained in the current process which includes the ability for counties to contribute
money on behalf of other qualifying providers outside of the sponsoring county. This table
shows which sponsors provide less than the IGTs needed to fund the need in the impacted
counties. The goal of the table is to demonstrate that, unless there is a methodology that
guarantees the return of IGTs to the funders, the source of surplus IGTs is at risk. This means
that counties that do not currently have local funds adequate to fund their portion of
exemptions and buybacks would need another source of funding to continue receiving the
benefits of exemptions and buybacks for the providers in those counties.

Intergovernmental Transfer Technical Advisory Panel Report
January 2011 Page 15
It is unknown how many counties would be willing and or able to provide the required funding
if the current funding structure did not exist. There are currently 45 counties in which qualifying
and participating hospitals receive the benefit of exemptions and buybacks. Based on the
analysis provided to the Panel, of the 45 counties there are 28 counties in which no
contributions of IGTs for the purpose of exemptions and buybacks are provided by the county
itself or authorized entity such as a taxing authority within the county. In addition, there are 11
counties in which partial contributions are provided from within and six that have contributions
that meet and exceed the IGT needed for the county for which the IGTs are provided.
In the table, the “County” column is the county eligible for hospital rate adjustments for
exemptions and buybacks. The “Exemption/Buyback Value” column is the amount (state and
federal portion) that is required to fund the exemption and buybacks for the qualifying
hospitals in the county for the impacted population. The “IGT Deficit” is the state portion that
would not be funded unless the counties were able to provide the IGT themselves or another
funding source was provided. If the amount is $0, the county is able to and is currently fully
funding the need in the county. The “Value at Risk” column is the amount that the county
would lose through Medicaid payments or LIP if the IGTs did not flow as they do under today’s
payment methodologies under FFS and LIP. If the amount is equal to the amount in the
“Exemption/Buyback Value” column, the county does not provide funding for the purpose of
exemptions or buybacks. If the amount is less, the county provides some funding and will not
risk the full loss. If the amount is less and the “IGT Deficit” column is $0, the county currently
contributes at a level that funds other counties. The loss is the amount that will not be paid to
the provider in the contributing county as “credit” under the LIP program.
This table is for informational purposes and uses the assumptions of the current process and
funding. The actual impact to counties and which counties would experience a loss or what
level of loss would not be determined until a policy was developed and thoroughly analyzed.
The information in the table is based on current General Appropriations and FMAP for State
Fiscal Year 2010-11. It is anticipated that with the adjustment in FMAP in 2011-12, the need for
additional IGTs will increase. Please refer to Appendix B for more details. The Agency did not
make changes to the submitted documents provided in Appendix B prior to inclusion in the
report.
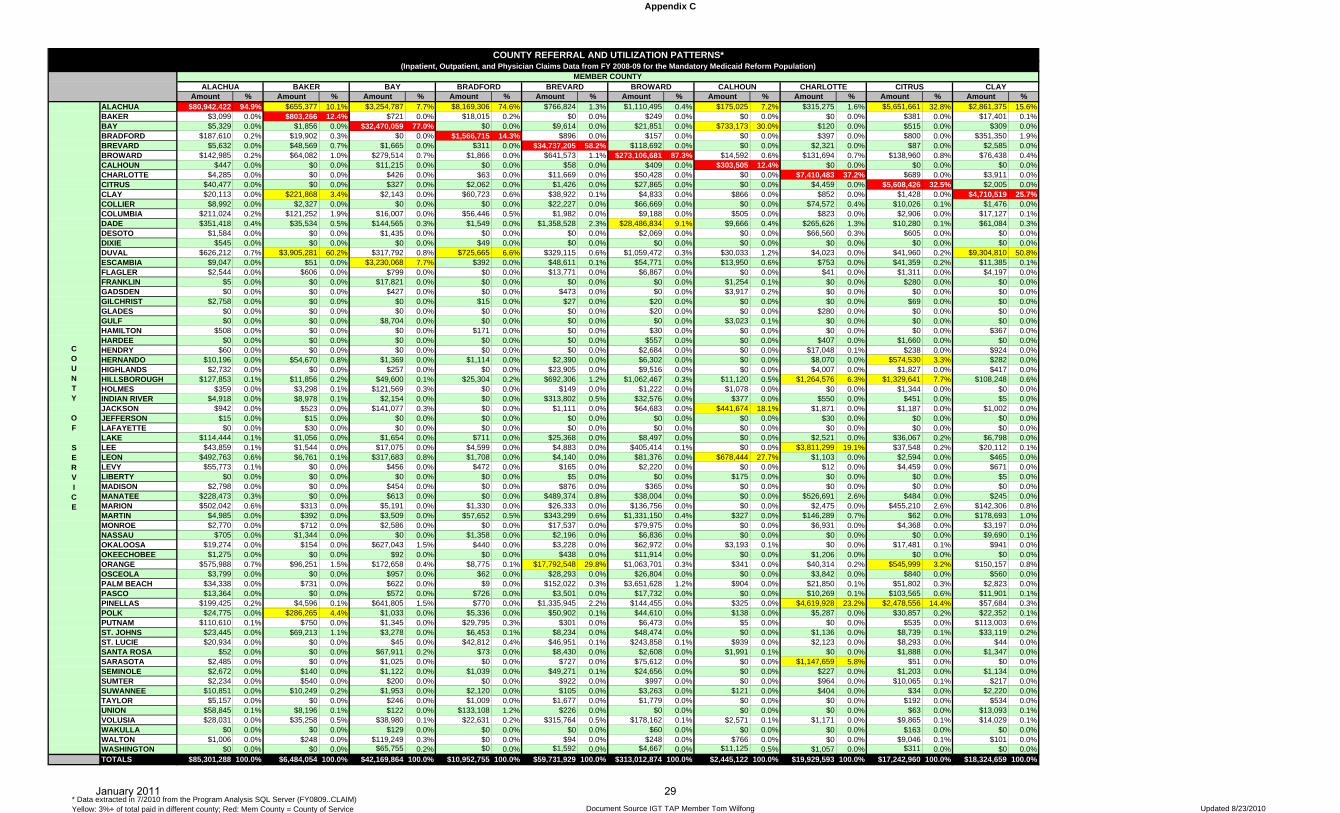
Appendix C, “County Utilization Crosstab Table”, provides FFS hospital utilization for each
county by the county of residence for the recipient. The goal of this table is to show that the
county in which the services are rendered is not necessarily the county in which the recipient
resides. Therefore, the funding of hospital exemptions and buybacks is a cross county issue
regardless of managed care or fee-for-service delivery options.

Intergovernmental Transfer Technical Advisory Panel Report
January 2011 Page 16
The county in which the service is provided is listed on the left hand side of the table. Then moving to the right, the dollar amount for the hospital inpatient, hospital outpatient, and physician services to the population is broken out by the county in with the recipient of the services resides. This table was developed for information purposes not specific to this report. The information within the table is based on SFY 2008-09 FFS claims data. For purposes of this report, it was assumed that the same distribution and processes apply to current practices. The table was modified on the right hand columns to reflect the impact of IGTs required to fund the services within the county of service. Please refer to Appendix C for more details. The Agency did not make changes to the submitted documents provided in Appendix C prior to inclusion in the report.
Presented Models
There were three models prepared and submitted for Panel deliberations and purposes of this
report.
Appendix D:
The first model, Appendix D, was prepared and presented by a Panel member representing the
HMO industry. The model assumed statewide transition for the mandatory managed care
population. An assumption was made that IGTs would be available to fund the payment.
However, the details related to how to secure the IGTs and related policies were not specifically
defined. These issues would need to be resolved prior to determining whether it would be a
methodology that could be approved and fiscally viable. The methodology assumes that the
supplemental payment would be made to the health plans by the Agency and the health plans
would make payments to the hospitals. It is assumed in the model that good faith negotiations
would occur between the two parties. The level of payment to the health plans would be
determined by the state based on historical hospital utilization for the members of the plan and
qualifying hospitals. The managed care supplemental payment would be a county or area rate
and would be adjusted for changes in utilization every six months for the prospective period
using more recent hospital encounter data. This model would be subject to actuarial
certification and federal CMS approval prior to implementation.
The Panel discussed the model during multiple meetings. The model was prepared based on summary information and data presented to the Panel by the Agency. As noted, the model was not approved by the Panel as a model that is ready for implementation and does not address all concerns pertaining to the funding of the payments. However, the Panel did support including the model in the report. Please refer to Appendix D for more details. The Agency did not make changes to the submitted documents provided in Appendix D prior to inclusion in the report.
Intergovernmental Transfer Technical Advisory Panel Report
January 2011 Page 17
Appendix E:
The second model, Appendix E, was prepared and submitted by a Panel member representing
the hospital industry. This model is based on a “Shadow Billing” process that would allow for
the hospital to bill the recipient’s health plan for the non-exempt, non-buyback hospital rate. In
addition, the hospital would also bill the Medicaid program for the exempt and buyback portion
that would be experienced in the FFS environment.
The Panel did not discuss the model in detail during meetings. The model was summarized and a high level discussion occurred among the members. The model was prepared based on information available to the preparer. It is unknown whether the Agency could receive federal CMS authority to implement. The model was not approved by the Panel as a model that is ready for implementation and does not address all concerns pertaining to the funding of the payments. However, the Panel did support including the model in the report. Please refer to Appendix E for more details. The Agency did not make changes to the submitted documents provided in Appendix E prior to inclusion in the report.
Appendix F:
The third model, Appendix F, was prepared and submitted by Panel member Scott Davis. The
model is based on a “Pilot Program, Broward County” methodology that would allow for the
FFS PSN that currently operates in the county to receive all new and transition eligibles as well
as continue to receive the FFS payment. This would allow for the current process to continue
and the local IGTs would not be in question. This methodology is unlikely to be a viable option
for statewide implementation as it would be limited to areas that would have the same
structure and available funds. This option would also diminish the enrollment into capitated
plans. Currently, the Agency assigns to all available plans in a county and does not limit to only
one plan or the type of plan.
Furthermore, it is unknown whether the Agency could receive federal CMS authority to
implement. The Panel did not discuss the model in detail during meetings or conference calls.
The model was not approved by the Panel as a model that is ready for implementation and
does not address all concerns pertaining to the funding of the payments. However, the Panel
did support including the model in the report. Please refer to Appendix F for more details.
The Panel did not vote to recommend a single model and any model authorized would be subject to federal CMS authority prior to implementation. The Agency did not make changes to the submitted documents provided in Appendix F prior to inclusion in the report.
Intergovernmental Transfer Technical Advisory Panel Report
January 2011 Page 18
Current Status and Participation
There are multiple unknowns at the present time regarding use of IGTs to fund managed care
as well as FFS programs impacted by the LIP due to the uncertainty of the extension of Florida's
1115 Waiver. There is no indication that the extension will not be approved. However, if the
waiver is not extended, LIP will cease to exist, and the ability of some entities to contribute IGTs
will be significantly diminished. A second unknown is whether, and what, CMS will approve as
part of the waiver extension. Thirdly, and perhaps most importantly, without express
guarantees and assurances, some IGT contributors noted that they will not be able to partner
with the State in support of managed care under the Medicaid program.
In FY 2010-11, the Agency expects 24 local governments to provide IGTs for the purpose of
funding Medicaid exemptions and buybacks and other programs such as the LIP. The counties
contributed a total of $791,865,205 ($2,252,176,351 total funds) to support the state share of
LIP and exemptions for all participating providers. This funding does not include the amount for
buybacks. Based on the Panel’s focus of developing a supplemental payment methodology to
preserve the use of IGTs to fund all exemptions and buybacks for only the expansion population
from FFS into managed care, current IGTs needed to fund exemptions and buybacks for the
transition population is estimated to be $307,105,233 ($873,450,606 total funds). The analysis
related to the figures stated above assume that the current population percentage exist
between FFS and managed care. This estimate includes the funding for exemptions and
buybacks but does not include funding for LIP or other programs. Specifically, there are
approximately 600,000 Medicaid recipients potentially eligible for transition from FFS to
managed care. This population currently utilizes 112,000 days per month of hospital inpatient
services and 614,000 hospital outpatient encounters per month.
Medical school teaching faculty physicians provide primary care and specialty services to
Medicaid eligible Floridians. They also educate and train Florida’s much needed future
physician workforce. Currently, Florida medical schools provide $57,642,464 in CPEs, which
generate $120,486,284 in federal Medicaid matching dollars that are paid as supplemental
amounts to medical school faculty practices. Supplemental payments are currently only paid to
teaching faculty physicians when providing services to Medicaid patients in Fee-For-Service
(FFS) arrangements. Direct supplemental physician payments from the Agency are presently
not available to teaching faculty physicians when providing services to Medicaid patients
enrolled in capitated managed care plans. Similar to the discussions noted above, medical
schools negotiate payments with managed care plans with which they choose to contract.
Intergovernmental Transfer Technical Advisory Panel Report
January 2011 Page 19
Physician Supplemental Payments
The Panel member representing the medical schools provided the following information for the
Panel’s consideration and discussed via conference call. The Panel did not vote to make a
recommendation but agreed to have the information in the report.
The Florida Medicaid State Plan (Plan) authorizes the Agency to provide supplemental payments
for services provided to Medicaid FFS patients by doctors of medicine and osteopathy employed
by or under contract with either a medical school that is part of the public university system, a
private medical school that places over 50 percent of its residents with a public hospital, or Nova
Southeastern University.
The Plan includes the exact methodology for supplemental physician payments related to services provided via FFS. This methodology does not apply to services provided to Medicaid patients enrolled in capitated managed care plans as payment by the managed care plan is considered payment in full. As Medicaid managed care expands in Florida, teaching physician supplemental payments must be preserved. If the State does not develop a reliable and approvable methodology for making supplemental payments to teaching faculty physicians serving managed care patients, the State could lose millions of dollars in federal Medicaid supplemental payments.
The supplemental physician payments help ensure Medicaid recipients access to quality care, including primary and specialty care. It is vital that any managed care approach be designed to preserve access to care for Medicaid patients and preserve federal Medicaid matching funds available to teaching faculty as a result of CPEs provided by state medical schools.
Florida’s supplemental payments to teaching faculty physicians also support the mission of the state’s Colleges of Medicine by providing funding for essential primary care and specialty services. Without access to the critical mass of patients, the Colleges would not be able to educate medical students or train resident physicians, necessary to meet Florida’s growing physician shortage.
As the State of Florida looks to better manage the care of its Medicaid beneficiaries and move more individuals to managed care, reform solutions must:
Provide a reliable new mechanism for federally-funded teaching physician payments for services provided to Medicaid managed care patients,
Retain existing teaching physician supplemental payments for services provided to Medicaid patients in Fee-For-Service (FFS) under the state plan, and
Allow the continuation and expansion of non-capitated provider-based managed care options, such as cost effective shared savings FFS Provider Service Networks.
Intergovernmental Transfer Technical Advisory Panel Report
January 2011 Page 20
Models to achieve new, reliable mechanisms for supplemental teaching physician payments under managed care must preserve the CPE mechanism as the state share of Medicaid funding. To do otherwise would create an untenable cash-flow crisis at state medical schools.
Before the state could implement a dual track approach for teaching physician supplemental payments for managed care members, the use of CPEs as the state share of Medicaid and other design elements would require express approval by CMS. Due to the complexity of federal policies relating to supplemental provider payments, until CMS approval is obtained, there is no guarantee that vital federal funds being secured by medical school CPEs would continue in a managed care environment. The state and its medical schools cannot afford to put over $120 million in federal funds at risk.
When exploring models for supplemental payments and managed care, it is also important to note that faculty practice plans not only care for persons from the county where the College or Practice Plan operates, but these academic experts typically care for patients from throughout a large region, and in some types of complex cases, statewide. Patient care services provided by medical school faculty are often an essential access point for Medicaid patients throughout the state.
If CPE funds are included in a Medicaid MCO capitation, federal rules will prohibit AHCA from guaranteeing that the funds flow back to any specific providers or that any CPE/IGT providers could be held harmless in terms of even recouping their CPE/IGT payments.
Consequently, teaching faculty payment scenarios that include supplemental payments to MCOs would depend on each individual MCO making timely and accurate voluntary payments to teaching faculty throughout the state. In this type of scenario, the flow of Medicaid funding from numerous MCOs to the medical schools would be uncertain and administratively cumbersome. In addition, medical schools would not be able to seek assistance from the state if an MCO did not make a complete or timely supplemental payment to the teaching faculty. The administration of teaching faculty payments under such an option would be very complex and potentially unworkable. The complexity, time lag, and uncertainty could result in medical schools being unable to provide the CPEs required to secure federal funding for supplemental teaching faculty payments.
Potential models for preserving physician supplemental payments in managed care environment include:
Risk pool for supplemental teaching physician payments, and
Ensuring availability of fee-for-service, shared cost saving alternatives to capitated managed care plans, including but not limited to, FFS Provider Service Networks.
These models are not mutually exclusive. A combination of models may be required to enable
the state to continue to utilize CPEs and retain federal matching funds for teaching physician
supplemental payments despite changes in Medicaid managed care penetration. The concepts
are further explained below:
Intergovernmental Transfer Technical Advisory Panel Report
January 2011 Page 21
1. Risk Pool - A risk pool will be designed and implemented for the purpose of the Physician UPL and will not be included in the base rate [to MCOs] or the supplemental rate [to MCOs].The details on how such a risk pool mechanism might be structured will be critical, including how AHCA calculates teaching physician supplemental payments for managed care members, the process and criteria used for distributing these funds, and the ability to utilize a CPE approach to fund the state share of these teaching physician payments. The criteria and process should be as comparable to the existing criteria and methodology for making teaching faculty supplemental payments for Medicaid patients in FFS as possible in order to retain access for patients and support for state medical school teaching faculty. However, it is not known if CMS would approve this method as there is no comparable, operational risk pool in place at the present time.
2. FFS PSNs – There should be a clear role for provider-based managed care options that do not preclude the state making direct supplemental teaching physician payments to medical school faculty practice plans. Under a managed care expansion, non-capitated provider-based managed care options do not place federal physician supplemental payments in jeopardy and do not create additional new administrative costs for medical schools to attempt to secure voluntary supplemental funding from numerous capitated managed care plans.
Absent legislative action that requires MCOs and faculty payment mechanisms, dangerous reduction in funds supporting access to Florida’s medical school faculty and disruptions in access to care for Medicaid patients could occur.
The information above references FFS PSNs. At this time PSNs may elect to be paid on a
capitation basis. Therefore, FFS PSNs are considered managed care plans and receive
enrollment in the same manner as capitated programs. The fact that they continue to receive
FFS payments maintains the current FFS hospital reimbursement.
Intergovernmental Transfer Technical Advisory Panel Report
January 2011 Page 22
Funding Source
The introduction of IGTs into managed care as a funding source is a requirement of a successful supplemental payment methodology; however, this concept is not supported by all qualifying sources for the IGTs. The Agency, as a part of the IGT TAP, requested feedback from counties and taxing authorities related to the TAP and the prospect of bringing IGTs in as a managed care funding source. The responses varied due to various factors such as ability to provide funding and interest of providing funding to be used for payments to the managed care plans.
If a methodology for distribution of payments is adopted that does not sufficiently address IGT
amounts provided, then a possible consequence is that the State will not be able to obtain
sufficient IGTs to fund payments at the same rates as currently provided. There are currently
six local government entities where IGTs provided exceed the amount required to fund
payments for providers in those geographic areas. If payments back to providers in those areas
do not cover this entire IGT amount, then IGT funders in those areas are likely to furnish no
more that the minimum required just for their providers. Local governments (some that
currently furnish some IGTs and others that fund none) will be hard-pressed to find additional
local tax dollars to support increased IGT requirements to benefit providers in their areas. As a
result, the ability to make supplemental payments to providers in those areas will be
diminished. Appendix F presents the potential effect of a loss of IGT funds.
Intergovernmental Transfer Technical Advisory Panel Report
January 2011 Page 23
Closing Comments
The Panel discussed the tasks asked of them in great detail. Due to the complexities of the
programs and the need for Panel members to speak on behalf of the industry they represent,
the concerns of each industry created circumstances that prevented the Panel from making a
uniform recommendation within the amount of time allotted for the project. Each Panel
member participated in the meetings actively and the Panel as a whole is concerned that a
single workable solution has not been found in time for the report submission. The Panel
members indicated a willingness to continue working on the issues as requested by the State.
The documents in the appendices provide summary information of some of the ideas that were
generated and reviewed by the Panel. None of the ideas presented address all concerns
related to all impacted parties.
In addition, members of the Panel were provided an opportunity to submit a letter related to
the project and activities of the Panel. The Agency did receive a position letter from Panel
member Tom Wilfong. This letter has been attached to the report as Appendix G.
In conclusion, the Panel was unable to provide resolution to the issues outlined in the
legislation of “negotiations with the Centers for Medicare and Medicaid Services and
appropriate safeguards for appropriate implementation of any developed payment
methodologies”. However the concerns and discussions of the Panel did provide significant
benefit to the Agency. The Agency has attempted to complete the task provided by the
legislation to “develop a methodology to ensure the availability of intergovernmental transfers
in any expansion of prepaid managed care in the Medicaid program”. Any model or
methodology to implement a hospital supplemental capitation payment or physician
supplement payments would be subject to federal CMS authority prior to implementation. The
Agency is of the opinion that the development of methodologies for managed care payments to
both the hospital supplemental payments and physician supplemental payments that include
IGTs is possible. However, based on deliberations of the Panel, there were issues about which
members expressed concerns regarding IGT funding that may be a barrier to implementing a
model. Until this issue is successfully resolved, sufficient funds may not materialize. Therefore,
the model would not be a viable option.

Intergovernmental Transfer Technical Advisory Panel Report
Appendices
Appendix A
INTERGOVERNMENTAL TRANSFER
TECHNICAL ADVISORY PANEL
CHARTER
This body shall be known as the Agency for Health Care Administration (AHCA or the Agency) Technical Advisory Panel on Intergovernmental Transfers under the authority of Chapter 2010-144, Laws of Florida. This charter was formally adopted on July 20, 2010.
PURPOSE/SCOPE
The responsibilities of this Panel shall be to advise the Agency in the study and development of intergovernmental transfer distribution methods. The Panel shall advise the Agency regarding the best methods for ensuring the continued availability of intergovernmental transfers, specific issues to resolve in negotiations with the Centers for Medicare and Medicaid services, and appropriate safeguards for appropriate implementation of any developed payment methodologies.
Based on these discussions, the Agency for Health Care Administration will develop a report to be submitted to the Speaker of the House of Representatives, the President of the Senate, and the Governor on the intergovernmental transfer methodologies developed. The agency shall not implement such methodologies without express legislative authority.
Discussions not covered by the description above are outside the scope of the Panel and will not be included as topics of discussion.
MEMBERSHIP
The Panel will be composed of representatives from contributing hospitals, medical schools, local governments, and managed care plans.
Agency staff will be the Facilitator and resources for, but not members of, the Panel.
Members of the Panel shall be appointed by the Secretary of the Agency for Health Care Administration.
Resignation/Vacancies: A member wishing to resign prior to the end of his/her term shall submit a letter of resignation to the Agency Facilitator of the Panel and the Secretary of the Agency for Health Care Administration. The Secretary of the Agency for Health Care Administration shall fill each vacancy on the Panel for the balance of the unexpired term, if
January 2011 24

Intergovernmental Transfer Technical Advisory Panel Report
appropriate. Priority consideration must be given to the appointment of an individual whose primary interest, experience, or expertise lies with clients of the Agency.
Nominations for member vacancies will be submitted to the Agency Facilitator of the Panel. If an appointment is not made within 120 days after a vacancy occurs on the Panel, the vacancy may be eliminated at the will of the Agency.
The Agency shall appoint a Facilitator of this Panel. The term of the Facilitator shall be until the Panel is disbanded. The Facilitator will be an employee of the Agency and selection is at the discretion of the Secretary of the Agency for Health Care Administration.
Five members shall constitute a quorum.
DUTIES OF THE PANEL
The Agency will author a report on the Panel’s findings and retain control of its content.
The duties of the Panel shall include the following:
A. Evaluation of alternative reimbursement and payment methodologies for managed care including prospective payment methodologies.
B. Report findings, including any recommendations, to the Director of Medicaid as to the outcome of their fact finding.
MEETINGS
The Panel shall meet once a month starting in July and August and begin meeting twice a month in September and October. The length of each meeting will be two hours.
Meeting materials shall be coordinated through the Facilitator. The Facilitator will work with the individual members to develop an agenda that is inclusive of their related topics; however the Agency will retain control of the final contents of the agenda. Staff will work with members to develop supporting documentation of their items for each meeting.
As part of the agenda, technical resource persons may present information to the Panel.
Audience participation shall be limited to attendance. The Panel meetings will not be open for public comment. However, items for the Panel’s agenda can be submitted to the Facilitator for consideration by the Agency.
ABSENCES
Members shall inform the Facilitator if they are unable to attend a scheduled meeting. In the event that a quorum will not be met, the Secretary for the Agency for Health Care Administration will determine if the meeting is to be rescheduled or proceed without quorum.
January 2011 25

Intergovernmental Transfer Technical Advisory Panel Report
REMUNERATION
Members shall receive no compensation, or reimbursement for time or travel.
PARLIAMENTARY AUTHORITY
RULES OF ORDER: Except where there is conflict with this document, the rules contained in the current edition of “Robert’s Rules of Order” shall govern the Panel in all cases to which they are applicable. Any special rules of order that the Panel or Agency may promulgate shall take precedence over “Robert’s Rules of Order.”
FACILITATOR
The Facilitator of the Technical Advisory Panel on Intergovernmental Transfers is responsible for providing necessary support to enable the Panel to accomplish its mission. In addition to facilitating the meetings of the Panel, the Facilitator will be responsible for: planning, organizing meetings, processing nomination and appointment papers, assisting in the implementation of plans, preparing status reports, implementation plans and progress reports, preparing summaries of meetings, and other activities as appropriate. The Facilitator shall not be a member of the Panel. The Facilitator shall be an employee of the Agency.
January 2011 26
Appendix B
Unless there is a methodology that guarantees the return of IGTs to the funders then the source of surplus IGTs is at risk. This means that for counties that do not currently have local funds adequate to fund their portion of exemptions and buybacks there would need another source of funding found to continue receiving the benefits of exemptions and buybacks for the providers in those counties.
NOTES:1. Calculations based on current 35.16% State Share. Expiration of federal stimulus will increaseState share to over 45%, resulting in increased IGT requirements.
2. Amounts below reflect only that portion of each County's Medicaid exemption/buybackvalues related to patients who would move from fee‐for‐service to managed care coverage.
Exemption/Buyback IGTs Value
County Value Deficit At RiskALACHUA 33,422,548 (11,751,368) (33,422,548) BAKER 39,375 (13,844) (39,375) BAY 5,606,609 (859,239) (2,443,798) BRADFORD 257,180 (90,425) (257,180) BREVARD 5,332,471 (1,733,780) (4,931,115) BROWARD 51,710,921 0 (18,693,498) CALHOUN 10,449 (3,674) (10,449) CITRUS 1,246,223 0 (450,510) COLLIER 3,258,198 (1,145,582) (3,258,198) COLUMBIA 1,055,355 (275,624) (783,914) DADE 139,601,839 0 (50,466,065) DESOTO 212,871 (74,845) (212,871) DUVAL 26,591,246 (461,458) (1,312,451) ESCAMBIA 11,328,957 (3,558,317) (10,120,355) FLAGLER 355,160 (124,874) (355,160)
Document Source IGT TAP Member Scott DavisJanuary 2011 27

FRANKLIN 74,541 (26,209) (74,541) HARDEE 140,246 (49,311) (140,246) HENDRY 157,916 (55,523) (157,916) HERNANDO 965,790 (339,572) (965,790) HILLSBOROUGH 45,821,778 (7,322,001) (20,824,803) HOLMES 245,562 (86,340) (245,562) JACKSON 345,039 (121,316) (345,039) LEE 10,851,744 (2,171,798) (6,176,900) LEVY 48,514 (17,057) (48,514) MADISON 31,882 (11,210) (31,882) MANATEE 1,690,714 0 (611,193) MARION 4,707,846 (1,229,077) (3,495,670) MONROE 1,607,674 (565,258) (1,607,674) NASSAU 117,893 (41,451) (117,893) OKEECHOBEE 466,570 (164,046) (466,570) ORANGE 59,257,447 (15,854,535) (45,092,534) OSCEOLA 1,464,487 (514,914) (1,464,487) PALM BEACH 19,414,265 (3,363,837) (9,567,226) PASCO 835,319 (293,698) (835,319) PINELLAS 35,729,139 (3,502,485) (9,961,562) POLK 1,885,577 (662,969) (1,885,577) SANTA ROSA 96,524 (33,938) (96,524) SARASOTA 5,943,875 0 (2,148,711) ST. LUCIE 2,812,270 (988,794) (2,812,270) SUWANNEE 274,447 (96,495) (274,447) TAYLOR 258,258 (90,803) (258,258) UNION 64,459 (22,664) (64,459) VOLUSIA 6,441,206 0 (2,328,496) WALTON 424,466 (149,242) (424,466) WASHINGTON 145,212 (51,057) (145,212) GRAND TOTAL 482,350,063 (57,918,630) (239,427,227)
‐50%
Document Source IGT TAP Member Scott DavisJanuary 2011 28
Appendix C
Amount % Amount % Amount % Amount % Amount % Amount % Amount % Amount % Amount % Amount %ALACHUA $80,942,422 94.9% $655,377 10.1% $3,254,787 7.7% $8,169,306 74.6% $766,824 1.3% $1,110,495 0.4% $175,025 7.2% $315,275 1.6% $5,651,661 32.8% $2,861,375 15.6%BAKER $3,099 0.0% $803,266 12.4% $721 0.0% $18,015 0.2% $0 0.0% $249 0.0% $0 0.0% $0 0.0% $381 0.0% $17,401 0.1%BAY $5,329 0.0% $1,856 0.0% $32,470,059 77.0% $0 0.0% $9,614 0.0% $21,851 0.0% $733,173 30.0% $120 0.0% $515 0.0% $309 0.0%BRADFORD $187,610 0.2% $19,902 0.3% $0 0.0% $1,566,715 14.3% $896 0.0% $157 0.0% $0 0.0% $397 0.0% $800 0.0% $351,350 1.9%BREVARD $5,632 0.0% $48,569 0.7% $1,665 0.0% $311 0.0% $34,737,205 58.2% $118,692 0.0% $0 0.0% $2,321 0.0% $87 0.0% $2,585 0.0%BROWARD $142,985 0.2% $64,082 1.0% $279,514 0.7% $1,866 0.0% $641,573 1.1% $273,106,681 87.3% $14,592 0.6% $131,694 0.7% $138,960 0.8% $76,438 0.4%CALHOUN $447 0.0% $0 0.0% $11,215 0.0% $0 0.0% $58 0.0% $409 0.0% $303,505 12.4% $0 0.0% $0 0.0% $0 0.0%CHARLOTTE $4,285 0.0% $0 0.0% $426 0.0% $63 0.0% $11,669 0.0% $50,428 0.0% $0 0.0% $7,410,483 37.2% $689 0.0% $3,911 0.0%CITRUS $40,477 0.0% $0 0.0% $327 0.0% $2,062 0.0% $1,426 0.0% $27,865 0.0% $0 0.0% $4,459 0.0% $5,608,426 32.5% $2,005 0.0%CLAY $20,113 0.0% $221,868 3.4% $2,143 0.0% $60,723 0.6% $38,922 0.1% $4,833 0.0% $866 0.0% $852 0.0% $1,428 0.0% $4,710,519 25.7%COLLIER $8,992 0.0% $2,327 0.0% $0 0.0% $0 0.0% $22,227 0.0% $66,669 0.0% $0 0.0% $74,572 0.4% $10,026 0.1% $1,476 0.0%COLUMBIA $211,024 0.2% $121,252 1.9% $16,007 0.0% $56,446 0.5% $1,982 0.0% $9,188 0.0% $505 0.0% $823 0.0% $2,906 0.0% $17,127 0.1%DADE $351,418 0.4% $35,534 0.5% $144,565 0.3% $1,549 0.0% $1,358,528 2.3% $28,486,834 9.1% $9,666 0.4% $265,626 1.3% $10,280 0.1% $61,084 0.3%DESOTO $1,584 0.0% $0 0.0% $1,435 0.0% $0 0.0% $0 0.0% $2,069 0.0% $0 0.0% $66,560 0.3% $605 0.0% $0 0.0%DIXIE $545 0.0% $0 0.0% $0 0.0% $49 0.0% $0 0.0% $0 0.0% $0 0.0% $0 0.0% $0 0.0% $0 0.0%DUVAL $626,212 0.7% $3,905,281 60.2% $317,792 0.8% $725,665 6.6% $329,115 0.6% $1,059,472 0.3% $30,033 1.2% $4,023 0.0% $41,960 0.2% $9,304,810 50.8%ESCAMBIA $9,047 0.0% $51 0.0% $3,230,068 7.7% $392 0.0% $48,611 0.1% $54,771 0.0% $13,950 0.6% $753 0.0% $41,359 0.2% $11,385 0.1%FLAGLER $2,544 0.0% $606 0.0% $799 0.0% $0 0.0% $13,771 0.0% $6,867 0.0% $0 0.0% $41 0.0% $1,311 0.0% $4,197 0.0%FRANKLIN $5 0.0% $0 0.0% $17,821 0.0% $0 0.0% $0 0.0% $0 0.0% $1,254 0.1% $0 0.0% $280 0.0% $0 0.0%GADSDEN $0 0.0% $0 0.0% $427 0.0% $0 0.0% $473 0.0% $0 0.0% $3,917 0.2% $0 0.0% $0 0.0% $0 0.0%GILCHRIST $2,758 0.0% $0 0.0% $0 0.0% $15 0.0% $27 0.0% $20 0.0% $0 0.0% $0 0.0% $69 0.0% $0 0.0%GLADES $0 0.0% $0 0.0% $0 0.0% $0 0.0% $0 0.0% $20 0.0% $0 0.0% $280 0.0% $0 0.0% $0 0.0%GULF $0 0.0% $0 0.0% $8,704 0.0% $0 0.0% $0 0.0% $0 0.0% $3,023 0.1% $0 0.0% $0 0.0% $0 0.0%HAMILTON $508 0.0% $0 0.0% $0 0.0% $171 0.0% $0 0.0% $30 0.0% $0 0.0% $0 0.0% $0 0.0% $367 0.0%HARDEE $0 0.0% $0 0.0% $0 0.0% $0 0.0% $0 0.0% $557 0.0% $0 0.0% $407 0.0% $1,660 0.0% $0 0.0%HENDRY $60 0.0% $0 0.0% $0 0.0% $0 0.0% $0 0.0% $2,684 0.0% $0 0.0% $17,048 0.1% $238 0.0% $924 0.0%HERNANDO $10,196 0.0% $54,670 0.8% $1,369 0.0% $1,114 0.0% $2,390 0.0% $6,302 0.0% $0 0.0% $8,070 0.0% $574,530 3.3% $282 0.0%HIGHLANDS $2,732 0.0% $0 0.0% $257 0.0% $0 0.0% $23,905 0.0% $9,516 0.0% $0 0.0% $4,007 0.0% $1,827 0.0% $417 0.0%HILLSBOROUGH $127,853 0.1% $11,856 0.2% $49,600 0.1% $25,304 0.2% $692,306 1.2% $1,062,467 0.3% $11,120 0.5% $1,264,576 6.3% $1,329,641 7.7% $108,248 0.6%HOLMES $359 0.0% $3,298 0.1% $121,569 0.3% $0 0.0% $149 0.0% $1,222 0.0% $1,078 0.0% $0 0.0% $1,344 0.0% $0 0.0%INDIAN RIVER $4,918 0.0% $8,978 0.1% $2,154 0.0% $0 0.0% $313,802 0.5% $32,576 0.0% $377 0.0% $550 0.0% $451 0.0% $5 0.0%JACKSON $942 0.0% $523 0.0% $141,077 0.3% $0 0.0% $1,111 0.0% $64,683 0.0% $441,674 18.1% $1,871 0.0% $1,187 0.0% $1,002 0.0%JEFFERSON $15 0.0% $15 0.0% $0 0.0% $0 0.0% $0 0.0% $0 0.0% $0 0.0% $30 0.0% $0 0.0% $0 0.0%LAFAYETTE $0 0.0% $30 0.0% $0 0.0% $0 0.0% $0 0.0% $0 0.0% $0 0.0% $0 0.0% $0 0.0% $0 0.0%LAKE $114,444 0.1% $1,056 0.0% $1,654 0.0% $711 0.0% $25,368 0.0% $8,497 0.0% $0 0.0% $2,521 0.0% $36,067 0.2% $6,798 0.0%LEE $43,859 0.1% $1,544 0.0% $17,075 0.0% $4,599 0.0% $4,883 0.0% $405,414 0.1% $0 0.0% $3,811,299 19.1% $37,548 0.2% $20,112 0.1%LEON $492,763 0.6% $6,761 0.1% $317,683 0.8% $1,708 0.0% $4,140 0.0% $81,376 0.0% $678,444 27.7% $1,103 0.0% $2,594 0.0% $465 0.0%LEVY $55,773 0.1% $0 0.0% $456 0.0% $472 0.0% $165 0.0% $2,220 0.0% $0 0.0% $12 0.0% $4,459 0.0% $671 0.0%LIBERTY $0 0.0% $0 0.0% $0 0.0% $0 0.0% $5 0.0% $0 0.0% $175 0.0% $0 0.0% $0 0.0% $5 0.0%MADISON $2,798 0.0% $0 0.0% $454 0.0% $0 0.0% $876 0.0% $365 0.0% $0 0.0% $0 0.0% $0 0.0% $0 0.0%MANATEE $228,473 0.3% $0 0.0% $613 0.0% $0 0.0% $489,374 0.8% $38,004 0.0% $0 0.0% $526,691 2.6% $484 0.0% $245 0.0%MARION $502,042 0.6% $313 0.0% $5,191 0.0% $1,330 0.0% $26,333 0.0% $136,756 0.0% $0 0.0% $2,475 0.0% $455,210 2.6% $142,306 0.8%MARTIN $4,985 0.0% $392 0.0% $3,509 0.0% $57,652 0.5% $343,299 0.6% $1,331,150 0.4% $327 0.0% $146,289 0.7% $62 0.0% $178,693 1.0%MONROE $2,770 0.0% $712 0.0% $2,586 0.0% $0 0.0% $17,537 0.0% $79,975 0.0% $0 0.0% $6,931 0.0% $4,368 0.0% $3,197 0.0%NASSAU $705 0.0% $1,344 0.0% $0 0.0% $1,358 0.0% $2,196 0.0% $6,836 0.0% $0 0.0% $0 0.0% $0 0.0% $9,690 0.1%OKALOOSA $19,274 0.0% $154 0.0% $627,043 1.5% $440 0.0% $3,228 0.0% $62,972 0.0% $3,193 0.1% $0 0.0% $17,481 0.1% $941 0.0%OKEECHOBEE $1,275 0.0% $0 0.0% $92 0.0% $0 0.0% $438 0.0% $11,914 0.0% $0 0.0% $1,206 0.0% $0 0.0% $0 0.0%ORANGE $575,988 0.7% $96,251 1.5% $172,658 0.4% $8,775 0.1% $17,792,548 29.8% $1,063,701 0.3% $341 0.0% $40,314 0.2% $545,999 3.2% $150,157 0.8%OSCEOLA $3,799 0.0% $0 0.0% $957 0.0% $62 0.0% $28,293 0.0% $26,804 0.0% $0 0.0% $3,842 0.0% $840 0.0% $560 0.0%PALM BEACH $34,338 0.0% $731 0.0% $622 0.0% $9 0.0% $152,022 0.3% $3,651,628 1.2% $904 0.0% $21,850 0.1% $51,802 0.3% $2,823 0.0%PASCO $13,364 0.0% $0 0.0% $572 0.0% $726 0.0% $3,501 0.0% $17,732 0.0% $0 0.0% $10,269 0.1% $103,565 0.6% $11,901 0.1%PINELLAS $199,425 0.2% $4,596 0.1% $641,805 1.5% $770 0.0% $1,335,945 2.2% $144,455 0.0% $325 0.0% $4,619,928 23.2% $2,478,556 14.4% $57,684 0.3%POLK $24,775 0.0% $286,265 4.4% $1,033 0.0% $5,336 0.0% $50,902 0.1% $44,610 0.0% $138 0.0% $5,287 0.0% $30,857 0.2% $22,352 0.1%PUTNAM $110,610 0.1% $750 0.0% $1,345 0.0% $29,795 0.3% $301 0.0% $6,473 0.0% $5 0.0% $0 0.0% $535 0.0% $113,003 0.6%ST. JOHNS $23,445 0.0% $69,213 1.1% $3,278 0.0% $6,453 0.1% $8,234 0.0% $48,474 0.0% $0 0.0% $1,136 0.0% $8,739 0.1% $33,119 0.2%ST. LUCIE $20,934 0.0% $0 0.0% $45 0.0% $42,812 0.4% $46,951 0.1% $243,858 0.1% $939 0.0% $2,123 0.0% $8,293 0.0% $44 0.0%SANTA ROSA $52 0.0% $0 0.0% $67,911 0.2% $73 0.0% $8,430 0.0% $2,608 0.0% $1,991 0.1% $0 0.0% $1,888 0.0% $1,347 0.0%SARASOTA $2,485 0.0% $0 0.0% $1,025 0.0% $0 0.0% $727 0.0% $75,612 0.0% $0 0.0% $1,147,659 5.8% $51 0.0% $0 0.0%SEMINOLE $2,672 0.0% $140 0.0% $1,122 0.0% $1,039 0.0% $49,271 0.1% $24,656 0.0% $0 0.0% $227 0.0% $1,203 0.0% $1,134 0.0%SUMTER $2,234 0.0% $540 0.0% $200 0.0% $0 0.0% $922 0.0% $997 0.0% $0 0.0% $964 0.0% $10,065 0.1% $217 0.0%SUWANNEE $10,851 0.0% $10,249 0.2% $1,953 0.0% $2,120 0.0% $105 0.0% $3,263 0.0% $121 0.0% $404 0.0% $34 0.0% $2,220 0.0%TAYLOR $5,157 0.0% $0 0.0% $246 0.0% $1,009 0.0% $1,677 0.0% $1,779 0.0% $0 0.0% $0 0.0% $192 0.0% $534 0.0%UNION $58,845 0.1% $8,196 0.1% $122 0.0% $133,108 1.2% $226 0.0% $0 0.0% $0 0.0% $0 0.0% $63 0.0% $13,093 0.1%VOLUSIA $28,031 0.0% $35,258 0.5% $38,980 0.1% $22,631 0.2% $315,764 0.5% $178,162 0.1% $2,571 0.1% $1,171 0.0% $9,865 0.1% $14,029 0.1%WAKULLA $0 0.0% $0 0.0% $129 0.0% $0 0.0% $0 0.0% $60 0.0% $0 0.0% $0 0.0% $163 0.0% $0 0.0%WALTON $1,006 0.0% $248 0.0% $119,249 0.3% $0 0.0% $94 0.0% $248 0.0% $766 0.0% $0 0.0% $9,046 0.1% $101 0.0%WASHINGTON $0 0.0% $0 0.0% $65,755 0.2% $0 0.0% $1,592 0.0% $4,667 0.0% $11,125 0.5% $1,057 0.0% $311 0.0% $0 0.0%TOTALS $85,301,288 100.0% $6,484,054 100.0% $42,169,864 100.0% $10,952,755 100.0% $59,731,929 100.0% $313,012,874 100.0% $2,445,122 100.0% $19,929,593 100.0% $17,242,960 100.0% $18,324,659 100.0%
MEMBER COUNTY
COUNTY REFERRAL AND UTILIZATION PATTERNS*(Inpatient, Outpatient, and Physician Claims Data from FY 2008-09 for the Mandatory Medicaid Reform Population)
COUNTY OF SERVICE
ALACHUA BROWARDBREVARDBRADFORDBAYBAKER CALHOUN CITRUSCHARLOTTE CLAY
* Data extracted in 7/2010 from the Program Analysis SQL Server (FY0809..CLAIM)Yellow: 3%+ of total paid in different county; Red: Mem County = County of Service Document Source IGT TAP Member Tom Wilfong Updated 8/23/2010
January 2011 29

Appendix C
ALACHUABAKERBAYBRADFORDBREVARDBROWARDCALHOUNCHARLOTTECITRUSCLAYCOLLIERCOLUMBIADADEDESOTODIXIEDUVALESCAMBIAFLAGLERFRANKLINGADSDENGILCHRISTGLADESGULFHAMILTONHARDEEHENDRYHERNANDOHIGHLANDSHILLSBOROUGHHOLMESINDIAN RIVERJACKSONJEFFERSONLAFAYETTELAKELEELEONLEVYLIBERTYMADISONMANATEEMARIONMARTINMONROENASSAUOKALOOSAOKEECHOBEEORANGEOSCEOLAPALM BEACHPASCOPINELLASPOLKPUTNAMST. JOHNSST. LUCIESANTA ROSASARASOTASEMINOLESUMTERSUWANNEETAYLORUNIONVOLUSIAWAKULLAWALTONWASHINGTONTOTALS
COUNTY OF SERVICE
Amount % Amount % Amount % Amount % Amount % Amount % Amount % Amount % Amount % Amount %$71,954 0.2% $14,704,341 55.8% $340,390 0.0% $50,069 0.6% $4,843,677 92.8% $3,221,750 1.7% $1,727,514 3.0% $304,378 2.6% $378,525 14.2% $784,688 9.6%
$155 0.0% $8,868 0.0% $248 0.0% $0 0.0% $49 0.0% $155,787 0.1% $0 0.0% $288 0.0% $0 0.0% $0 0.0%$952 0.0% $3,160 0.0% $12,195 0.0% $0 0.0% $587 0.0% $20,944 0.0% $227,265 0.4% $69 0.0% $488,212 18.3% $151,285 1.8%
$25 0.0% $4,991 0.0% $2,977 0.0% $0 0.0% $2,703 0.1% $52,479 0.0% $853 0.0% $0 0.0% $0 0.0% $0 0.0%$6,641 0.0% $0 0.0% $168,286 0.0% $11,362 0.1% $119 0.0% $73,847 0.0% $4,010 0.0% $6,967 0.1% $0 0.0% $293 0.0%
$1,009,323 2.4% $33,861 0.1% $41,252,781 5.1% $56,296 0.7% $1,669 0.0% $749,430 0.4% $350,682 0.6% $207,255 1.8% $26,609 1.0% $141,859 1.7%$0 0.0% $395 0.0% $59 0.0% $0 0.0% $171 0.0% $307 0.0% $59 0.0% $0 0.0% $150 0.0% $18,488 0.2%
$23,192 0.1% $835 0.0% $17,532 0.0% $645,834 7.5% $978 0.0% $606 0.0% $3,428 0.0% $0 0.0% $236 0.0% $21,380 0.3%$2,587 0.0% $46,822 0.2% $31,395 0.0% $7,371 0.1% $7,429 0.1% $512 0.0% $169 0.0% $819 0.0% $0 0.0% $0 0.0%
$72 0.0% $21,325 0.1% $3,981 0.0% $1,025 0.0% $4,265 0.1% $2,819,265 1.5% $2,795 0.0% $14,322 0.1% $229 0.0% $1,742 0.0%$19,940,101 46.8% $10,049 0.0% $148,645 0.0% $14,764 0.2% $246 0.0% $639 0.0% $6,525 0.0% $11,679 0.1% $0 0.0% $388 0.0%
$10,618 0.0% $9,543,126 36.2% $26,206 0.0% $13,811 0.2% $61,658 1.2% $82,968 0.0% $5,622 0.0% $649 0.0% $336 0.0% $863 0.0%$4,185,758 9.8% $46,217 0.2% $760,819,663 93.7% $187,821 2.2% $1,431 0.0% $831,705 0.4% $642,423 1.1% $34,140 0.3% $813 0.0% $26,182 0.3%
$15,962 0.0% $0 0.0% $8,479 0.0% $2,815,746 32.6% $869 0.0% $48 0.0% $0 0.0% $957 0.0% $0 0.0% $0 0.0%$0 0.0% $0 0.0% $0 0.0% $0 0.0% $13,763 0.3% $0 0.0% $0 0.0% $0 0.0% $0 0.0% $0 0.0%
$23,915 0.1% $923,839 3.5% $382,893 0.0% $2,333 0.0% $20,855 0.4% $178,568,460 93.3% $964,749 1.7% $1,727,593 14.7% $15,575 0.6% $75,562 0.9%$4,674 0.0% $24,950 0.1% $168,627 0.0% $8,026 0.1% $863 0.0% $228,105 0.1% $50,961,858 88.0% $123 0.0% $16,626 0.6% $50,404 0.6%
$368 0.0% $11 0.0% $5,182 0.0% $0 0.0% $0 0.0% $17,238 0.0% $2,189 0.0% $3,827,476 32.5% $6 0.0% $0 0.0%$0 0.0% $9,594 0.0% $0 0.0% $0 0.0% $10 0.0% $0 0.0% $336 0.0% $0 0.0% $660,853 24.8% $1,748 0.0%
$1,476 0.0% $0 0.0% $73 0.0% $0 0.0% $0 0.0% $155 0.0% $289 0.0% $0 0.0% $574 0.0% $188,026 2.3%$5 0.0% $393 0.0% $0 0.0% $0 0.0% $3,553 0.1% $0 0.0% $41 0.0% $0 0.0% $0 0.0% $0 0.0%
$199 0.0% $0 0.0% $10 0.0% $0 0.0% $0 0.0% $76 0.0% $0 0.0% $0 0.0% $0 0.0% $0 0.0%$0 0.0% $0 0.0% $0 0.0% $0 0.0% $0 0.0% $38 0.0% $77 0.0% $0 0.0% $7,222 0.3% $0 0.0%
$156 0.0% $1,745 0.0% $5 0.0% $0 0.0% $0 0.0% $630 0.0% $0 0.0% $0 0.0% $0 0.0% $40 0.0%$1,273 0.0% $0 0.0% $2,820 0.0% $11,350 0.1% $0 0.0% $1,737 0.0% $0 0.0% $0 0.0% $0 0.0% $0 0.0%$3,424 0.0% $170 0.0% $38,984 0.0% $25 0.0% $0 0.0% $1,338 0.0% $1,022 0.0% $0 0.0% $0 0.0% $5 0.0%
$10,678 0.0% $1,371 0.0% $18,531 0.0% $518 0.0% $521 0.0% $4,163 0.0% $378 0.0% $1,001 0.0% $0 0.0% $525 0.0%$10,921 0.0% $1,280 0.0% $76,160 0.0% $51,096 0.6% $1,999 0.0% $4,223 0.0% $1,681 0.0% $166 0.0% $0 0.0% $0 0.0%
$836,707 2.0% $76,565 0.3% $978,830 0.1% $513,073 5.9% $33,328 0.6% $768,118 0.4% $121,984 0.2% $6,964 0.1% $19,957 0.7% $24,093 0.3%$0 0.0% $0 0.0% $2,124 0.0% $0 0.0% $0 0.0% $1,536 0.0% $8,741 0.0% $0 0.0% $0 0.0% $1,273 0.0%
$459 0.0% $3,564 0.0% $24,023 0.0% $0 0.0% $0 0.0% $12,186 0.0% $5,448 0.0% $2,015 0.0% $0 0.0% $2,037 0.0%$399 0.0% $168 0.0% $80 0.0% $1,006 0.0% $148 0.0% $5,822 0.0% $16,101 0.0% $0 0.0% $890 0.0% $78,126 1.0%
$0 0.0% $0 0.0% $10 0.0% $0 0.0% $44 0.0% $0 0.0% $0 0.0% $0 0.0% $0 0.0% $0 0.0%$30 0.0% $25 0.0% $0 0.0% $0 0.0% $0 0.0% $0 0.0% $30 0.0% $0 0.0% $0 0.0% $0 0.0%
$3,542 0.0% $650 0.0% $10,555 0.0% $346 0.0% $2,331 0.0% $18,373 0.0% $3,338 0.0% $11,922 0.1% $0 0.0% $266 0.0%$14,650,055 34.4% $4,252 0.0% $643,475 0.1% $451,421 5.2% $3,183 0.1% $161,517 0.1% $30,578 0.1% $439 0.0% $172 0.0% $20,451 0.2%
$8,915 0.0% $32,600 0.1% $224,787 0.0% $131,026 1.5% $4,528 0.1% $148,560 0.1% $96,150 0.2% $4,042 0.0% $1,025,888 38.5% $6,288,065 76.8%$48 0.0% $689 0.0% $310 0.0% $7 0.0% $30,559 0.6% $1,300 0.0% $90 0.0% $0 0.0% $14 0.0% $0 0.0%
$0 0.0% $0 0.0% $0 0.0% $0 0.0% $0 0.0% $0 0.0% $0 0.0% $0 0.0% $0 0.0% $50 0.0%$55 0.0% $5,133 0.0% $0 0.0% $0 0.0% $0 0.0% $7,485 0.0% $957 0.0% $0 0.0% $492 0.0% $162 0.0%
$169,404 0.4% $1,881 0.0% $13,026 0.0% $145,841 1.7% $720 0.0% $143,756 0.1% $5,814 0.0% $2,570 0.0% $0 0.0% $0 0.0%$1,282 0.0% $66,481 0.3% $137,824 0.0% $1,243 0.0% $90,928 1.7% $77,467 0.0% $10,625 0.0% $7,204 0.1% $379 0.0% $3,837 0.0%
$60,927 0.1% $107,772 0.4% $1,533,615 0.2% $0 0.0% $149 0.0% $59,361 0.0% $492 0.0% $297 0.0% $0 0.0% $12 0.0%$8,186 0.0% $1,905 0.0% $768,896 0.1% $6,704 0.1% $0 0.0% $6,631 0.0% $0 0.0% $256 0.0% $24 0.0% $0 0.0%
$0 0.0% $3,254 0.0% $2,008 0.0% $0 0.0% $73 0.0% $382,399 0.2% $191 0.0% $195 0.0% $0 0.0% $1,012 0.0%$631 0.0% $4,697 0.0% $1,500 0.0% $0 0.0% $0 0.0% $24,263 0.0% $291,698 0.5% $6,508 0.1% $1,489 0.1% $4,080 0.0%
$1,392 0.0% $0 0.0% $38,721 0.0% $84 0.0% $494 0.0% $7,249 0.0% $0 0.0% $136 0.0% $0 0.0% $0 0.0%$112,917 0.3% $156,360 0.6% $1,374,415 0.2% $22,175 0.3% $2,452 0.0% $1,352,752 0.7% $256,076 0.4% $1,136,157 9.7% $951 0.0% $2,660 0.0%
$4,319 0.0% $2,029 0.0% $134,274 0.0% $343 0.0% $215 0.0% $13,342 0.0% $3,437 0.0% $281 0.0% $42 0.0% $10 0.0%$50,472 0.1% $46,111 0.2% $1,820,589 0.2% $2,823 0.0% $2,143 0.0% $192,844 0.1% $55,586 0.1% $4,628 0.0% $2,153 0.1% $908 0.0%
$2,709 0.0% $3,118 0.0% $6,641 0.0% $927 0.0% $1,227 0.0% $11,778 0.0% $2,133 0.0% $1,377 0.0% $0 0.0% $175,935 2.1%$1,314,515 3.1% $113,992 0.4% $309,067 0.0% $2,627,068 30.4% $13,650 0.3% $492,230 0.3% $660,329 1.1% $531,688 4.5% $0 0.0% $81,709 1.0%
$23,504 0.1% $71,440 0.3% $148,636 0.0% $19,934 0.2% $5,874 0.1% $116,913 0.1% $46,925 0.1% $2,407 0.0% $257 0.0% $31,891 0.4%$0 0.0% $16,067 0.1% $966 0.0% $538 0.0% $1,168 0.0% $93,312 0.0% $858 0.0% $28,774 0.2% $0 0.0% $1,097 0.0%
$1,871 0.0% $10,309 0.0% $6,786 0.0% $189 0.0% $3,220 0.1% $299,606 0.2% $3,045 0.0% $673,340 5.7% $71 0.0% $149 0.0%$8,250 0.0% $12 0.0% $89,787 0.0% $1,229 0.0% $274 0.0% $4,359 0.0% $9,227 0.0% $605 0.0% $0 0.0% $159 0.0%$4,187 0.0% $2,016 0.0% $1,796 0.0% $0 0.0% $65 0.0% $4,670 0.0% $1,341,524 2.3% $0 0.0% $192 0.0% $410 0.0%
$28,824 0.1% $1,525 0.0% $173,942 0.0% $833,393 9.6% $565 0.0% $15,044 0.0% $1,959 0.0% $4,045 0.0% $0 0.0% $0 0.0%$472 0.0% $905 0.0% $12,569 0.0% $0 0.0% $0 0.0% $7,004 0.0% $476 0.0% $9,676 0.1% $0 0.0% $3,589 0.0%$219 0.0% $423 0.0% $29,988 0.0% $0 0.0% $0 0.0% $1,667 0.0% $834 0.0% $290 0.0% $0 0.0% $25 0.0%
$1,053 0.0% $173,733 0.7% $1,727 0.0% $3,644 0.0% $4,711 0.1% $3,717 0.0% $1,452 0.0% $970 0.0% $0 0.0% $0 0.0%$215 0.0% $13,201 0.1% $93 0.0% $0 0.0% $50,444 1.0% $2,084 0.0% $1,697 0.0% $0 0.0% $5,682 0.2% $3,226 0.0%
$0 0.0% $28,590 0.1% $88 0.0% $0 0.0% $0 0.0% $6,767 0.0% $211 0.0% $663 0.0% $0 0.0% $0 0.0%$8,505 0.0% $8,867 0.0% $44,903 0.0% $2,171 0.0% $1,667 0.0% $146,866 0.1% $11,562 0.0% $3,197,589 27.2% $3,693 0.1% $98 0.0%
$0 0.0% $0 0.0% $0 0.0% $0 0.0% $0 0.0% $0 0.0% $58 0.0% $0 0.0% $2,978 0.1% $58 0.0%$21 0.0% $0 0.0% $40 0.0% $0 0.0% $0 0.0% $5,832 0.0% $20,143 0.0% $0 0.0% $400 0.0% $258 0.0%
$0 0.0% $177 0.0% $2,891 0.0% $0 0.0% $0 0.0% $3,815 0.0% $7,546 0.0% $0 0.0% $20 0.0% $441 0.0%$42,628,516 100.0% $26,345,857 100.0% $812,065,102 100.0% $8,642,631 100.0% $5,221,577 100.0% $191,437,075 100.0% $57,921,285 100.0% $11,772,918 100.0% $2,661,712 100.0% $8,189,564 100.0%
COUNTY REFERRAL AND UTILIZATION PATTERNS*(Inpatient, Outpatient, and Physician Claims Data from FY 2008-09 for the Mandatory Medicaid Reform Population)
MEMBER COUNTYDUVALDIXIE GADSDENFRANKLINFLAGLERESCAMBIADESOTODADECOLUMBIACOLLIER
* Data extracted in 7/2010 from the Program Analysis SQL Server (FY0809..CLAIM)Yellow: 3%+ of total paid in different county; Red: Mem County = County of Service Document Source IGT TAP Member Tom Wilfong Updated 8/23/2010
January 2011 30

Appendix C
ALACHUABAKERBAYBRADFORDBREVARDBROWARDCALHOUNCHARLOTTECITRUSCLAYCOLLIERCOLUMBIADADEDESOTODIXIEDUVALESCAMBIAFLAGLERFRANKLINGADSDENGILCHRISTGLADESGULFHAMILTONHARDEEHENDRYHERNANDOHIGHLANDSHILLSBOROUGHHOLMESINDIAN RIVERJACKSONJEFFERSONLAFAYETTELAKELEELEONLEVYLIBERTYMADISONMANATEEMARIONMARTINMONROENASSAUOKALOOSAOKEECHOBEEORANGEOSCEOLAPALM BEACHPASCOPINELLASPOLKPUTNAMST. JOHNSST. LUCIESANTA ROSASARASOTASEMINOLESUMTERSUWANNEETAYLORUNIONVOLUSIAWAKULLAWALTONWASHINGTONTOTALS
COUNTY OF SERVICE
Amount % Amount % Amount % Amount % Amount % Amount % Amount % Amount % Amount % Amount %$4,317,182 91.2% $0 0.0% $157,922 5.8% $2,468,884 55.5% $6,358 0.1% $2,103 0.0% $1,327,243 5.7% $92,869 0.7% $1,275,637 0.8% $198,809 3.8%
$0 0.0% $0 0.0% $0 0.0% $5,771 0.1% $178 0.0% $0 0.0% $121 0.0% $0 0.0% $36 0.0% $110 0.0%$394 0.0% $539 0.0% $1,805,708 66.8% $0 0.0% $27 0.0% $140 0.0% $7,754 0.0% $14,165 0.1% $31,545 0.0% $1,022,158 19.5%
$1,106 0.0% $0 0.0% $266 0.0% $2,167 0.0% $1,988 0.0% $0 0.0% $3,328 0.0% $0 0.0% $11,842 0.0% $2,149 0.0%$8,514 0.2% $0 0.0% $7,291 0.3% $26,321 0.6% $5,477 0.1% $10,511 0.1% $4,351 0.0% $14,684 0.1% $48,631 0.0% $152 0.0%$6,476 0.1% $6,978 0.6% $21,601 0.8% $23,180 0.5% $29,565 0.4% $126,894 1.1% $107,204 0.5% $174,109 1.3% $1,786,600 1.1% $13,737 0.3%
$0 0.0% $0 0.0% $7,678 0.3% $0 0.0% $0 0.0% $0 0.0% $57 0.0% $58 0.0% $8,988 0.0% $1,801 0.0%$0 0.0% $18 0.0% $0 0.0% $32 0.0% $109,248 1.4% $5,733 0.0% $2,483 0.0% $7,237 0.1% $51,671 0.0% $0 0.0%
$2,281 0.0% $0 0.0% $183 0.0% $0 0.0% $633 0.0% $267 0.0% $93,647 0.4% $1,703 0.0% $33,329 0.0% $42 0.0%$130 0.0% $0 0.0% $0 0.0% $3,435 0.1% $0 0.0% $315 0.0% $85 0.0% $820 0.0% $23,351 0.0% $0 0.0%
$0 0.0% $1,130 0.1% $0 0.0% $14,218 0.3% $1,579 0.0% $182,831 1.5% $33,889 0.1% $5,184 0.0% $40,180 0.0% $2,962 0.1%$66,662 1.4% $0 0.0% $5 0.0% $1,114,184 25.0% $1,805 0.0% $345 0.0% $745 0.0% $8,121 0.1% $39,600 0.0% $88 0.0%
$6,496 0.1% $46,418 4.0% $196,401 7.3% $4,780 0.1% $26,909 0.3% $1,240,034 10.4% $55,394 0.2% $172,255 1.3% $4,152,339 2.5% $29,668 0.6%$0 0.0% $0 0.0% $0 0.0% $0 0.0% $355,930 4.4% $7,149 0.1% $7 0.0% $13,141 0.1% $23,830 0.0% $0 0.0%
$1,458 0.0% $0 0.0% $0 0.0% $0 0.0% $227 0.0% $0 0.0% $0 0.0% $0 0.0% $148 0.0% $0 0.0%$30,627 0.6% $51 0.0% $15,688 0.6% $135,691 3.0% $1,519 0.0% $39,619 0.3% $13,106 0.1% $62,377 0.5% $295,324 0.2% $113,491 2.2%
$0 0.0% $9 0.0% $251,277 9.3% $0 0.0% $10 0.0% $0 0.0% $9,426 0.0% $105 0.0% $50,958 0.0% $605,350 11.6%$0 0.0% $0 0.0% $0 0.0% $65 0.0% $5 0.0% $0 0.0% $1,018 0.0% $417 0.0% $4,566 0.0% $0 0.0%$0 0.0% $0 0.0% $56,743 2.1% $0 0.0% $0 0.0% $65 0.0% $0 0.0% $0 0.0% $1,250 0.0% $0 0.0%$0 0.0% $0 0.0% $15 0.0% $0 0.0% $0 0.0% $0 0.0% $69 0.0% $0 0.0% $51 0.0% $0 0.0%
$9,667 0.2% $0 0.0% $0 0.0% $0 0.0% $70 0.0% $0 0.0% $70 0.0% $0 0.0% $130 0.0% $0 0.0%$0 0.0% $10,406 0.9% $0 0.0% $0 0.0% $0 0.0% $8,877 0.1% $0 0.0% $20 0.0% $87 0.0% $0 0.0%$0 0.0% $0 0.0% $55,250 2.0% $0 0.0% $0 0.0% $24 0.0% $0 0.0% $0 0.0% $34 0.0% $751 0.0%$0 0.0% $0 0.0% $0 0.0% $78,992 1.8% $0 0.0% $0 0.0% $0 0.0% $0 0.0% $476 0.0% $0 0.0%
$538 0.0% $0 0.0% $209 0.0% $0 0.0% $1,301,073 16.1% $386 0.0% $0 0.0% $93,072 0.7% $5,345 0.0% $0 0.0%$0 0.0% $267,273 23.3% $0 0.0% $868 0.0% $30 0.0% $1,795,988 15.1% $0 0.0% $5,504 0.0% $5,613 0.0% $433 0.0%
$1,466 0.0% $0 0.0% $1,926 0.1% $606 0.0% $0 0.0% $247 0.0% $9,773,745 42.0% $1,384 0.0% $446,475 0.3% $797 0.0%$681 0.0% $26,032 2.3% $343 0.0% $0 0.0% $1,184,399 14.6% $29,507 0.2% $4,618 0.0% $5,542,727 40.6% $30,851 0.0% $0 0.0%
$10,086 0.2% $28,060 2.4% $25,220 0.9% $15,892 0.4% $862,095 10.7% $181,200 1.5% $3,976,901 17.1% $1,108,817 8.1% $133,413,502 79.3% $3,781 0.1%$0 0.0% $0 0.0% $2,966 0.1% $0 0.0% $0 0.0% $0 0.0% $0 0.0% $430 0.0% $183 0.0% $1,669,255 31.9%
$123 0.0% $304 0.0% $0 0.0% $0 0.0% $681 0.0% $3,229 0.0% $3,376 0.0% $2,783 0.0% $23,188 0.0% $198 0.0%$0 0.0% $0 0.0% $24,887 0.9% $0 0.0% $928 0.0% $116 0.0% $553 0.0% $0 0.0% $2,616 0.0% $393,778 7.5%$0 0.0% $0 0.0% $0 0.0% $5 0.0% $0 0.0% $0 0.0% $0 0.0% $0 0.0% $0 0.0% $0 0.0%$0 0.0% $0 0.0% $0 0.0% $52 0.0% $0 0.0% $0 0.0% $10 0.0% $0 0.0% $0 0.0% $0 0.0%
$22,835 0.5% $0 0.0% $0 0.0% $0 0.0% $489 0.0% $2,552 0.0% $8,302 0.0% $2,031 0.0% $130,996 0.1% $814 0.0%$0 0.0% $419,963 36.6% $562 0.0% $3,120 0.1% $14,217 0.2% $5,827,475 49.0% $68,844 0.3% $98,362 0.7% $483,012 0.3% $734 0.0%
$48,055 1.0% $1,584 0.1% $30,625 1.1% $181,866 4.1% $5,588 0.1% $1,774 0.0% $14,993 0.1% $61,156 0.4% $387,994 0.2% $57,346 1.1%$23,859 0.5% $0 0.0% $0 0.0% $0 0.0% $0 0.0% $79 0.0% $26 0.0% $226 0.0% $772 0.0% $0 0.0%
$0 0.0% $0 0.0% $0 0.0% $0 0.0% $0 0.0% $0 0.0% $0 0.0% $0 0.0% $15 0.0% $0 0.0%$0 0.0% $0 0.0% $0 0.0% $14,064 0.3% $5 0.0% $0 0.0% $984 0.0% $0 0.0% $674 0.0% $0 0.0%
$1,281 0.0% $70 0.0% $0 0.0% $0 0.0% $69,509 0.9% $6,504 0.1% $114,384 0.5% $28,647 0.2% $1,413,254 0.8% $0 0.0%$51,394 1.1% $464 0.0% $0 0.0% $555 0.0% $3,916 0.0% $721 0.0% $106,419 0.5% $5,167 0.0% $204,463 0.1% $472 0.0%
$0 0.0% $1,732 0.2% $0 0.0% $0 0.0% $706 0.0% $7,598 0.1% $2,968 0.0% $3,594 0.0% $19,417 0.0% $52,965 1.0%$0 0.0% $50 0.0% $686 0.0% $0 0.0% $748 0.0% $164 0.0% $99,022 0.4% $12,327 0.1% $10,533 0.0% $0 0.0%$0 0.0% $0 0.0% $0 0.0% $96 0.0% $0 0.0% $0 0.0% $0 0.0% $0 0.0% $3,474 0.0% $892 0.0%$0 0.0% $0 0.0% $9,365 0.3% $0 0.0% $121 0.0% $1,091 0.0% $5,617 0.0% $762 0.0% $9,623 0.0% $445,470 8.5%$0 0.0% $67,585 5.9% $0 0.0% $2,695 0.1% $2,645 0.0% $13,299 0.1% $1,313 0.0% $7,666 0.1% $10,910 0.0% $0 0.0%
$65,447 1.4% $1,159 0.1% $21,739 0.8% $42 0.0% $844,012 10.4% $12,677 0.1% $210,729 0.9% $2,762,779 20.3% $2,062,443 1.2% $5,338 0.1%$428 0.0% $0 0.0% $0 0.0% $0 0.0% $105 0.0% $246 0.0% $1,651 0.0% $3,523 0.0% $30,897 0.0% $42 0.0%$321 0.0% $215,151 18.8% $0 0.0% $695 0.0% $7,349 0.1% $2,117,655 17.8% $4,998 0.0% $13,809 0.1% $267,607 0.2% $95 0.0%
$1,379 0.0% $0 0.0% $2,946 0.1% $10 0.0% $882 0.0% $609 0.0% $1,547,437 6.6% $5,800 0.0% $646,069 0.4% $2,322 0.0%$32,024 0.7% $3,133 0.3% $2,448 0.1% $28,887 0.6% $2,441,984 30.2% $220,627 1.9% $5,410,081 23.2% $2,724,758 20.0% $18,754,683 11.1% $16,333 0.3%
$985 0.0% $1,400 0.1% $0 0.0% $19,420 0.4% $594,690 7.4% $9,516 0.1% $171,766 0.7% $535,456 3.9% $1,664,170 1.0% $0 0.0%$432 0.0% $191 0.0% $0 0.0% $633 0.0% $0 0.0% $247 0.0% $731 0.0% $187 0.0% $9,565 0.0% $0 0.0%
$4,109 0.1% $0 0.0% $0 0.0% $942 0.0% $206 0.0% $550 0.0% $10,882 0.0% $13 0.0% $4,540 0.0% $0 0.0%$65 0.0% $27,480 2.4% $65 0.0% $208 0.0% $5,963 0.1% $9,666 0.1% $37,758 0.2% $10,060 0.1% $107,496 0.1% $1,403 0.0%
$0 0.0% $0 0.0% $1,818 0.1% $0 0.0% $0 0.0% $0 0.0% $1,274 0.0% $0 0.0% $1,078 0.0% $41,707 0.8%$879 0.0% $19,463 1.7% $0 0.0% $0 0.0% $203,104 2.5% $5,213 0.0% $1,005 0.0% $36,777 0.3% $176,111 0.1% $0 0.0%
$26 0.0% $0 0.0% $0 0.0% $0 0.0% $36 0.0% $0 0.0% $877 0.0% $2,498 0.0% $15,307 0.0% $0 0.0%$2,823 0.1% $809 0.1% $0 0.0% $0 0.0% $105 0.0% $0 0.0% $1,413 0.0% $521 0.0% $180 0.0% $0 0.0%
$654 0.0% $0 0.0% $0 0.0% $296,408 6.7% $0 0.0% $333 0.0% $2,575 0.0% $101 0.0% $5,107 0.0% $0 0.0%$11,945 0.3% $0 0.0% $342 0.0% $2,892 0.1% $199 0.0% $0 0.0% $0 0.0% $0 0.0% $4,016 0.0% $396 0.0%
$529 0.0% $0 0.0% $0 0.0% $1,849 0.0% $0 0.0% $0 0.0% $0 0.0% $0 0.0% $236 0.0% $267 0.0%$1,677 0.0% $0 0.0% $0 0.0% $983 0.0% $1,264 0.0% $11,337 0.1% $42,029 0.2% $2,374 0.0% $48,769 0.0% $231 0.0%
$0 0.0% $0 0.0% $65 0.0% $0 0.0% $0 0.0% $0 0.0% $0 0.0% $0 0.0% $75 0.0% $0 0.0%$0 0.0% $0 0.0% $976 0.0% $0 0.0% $106 0.0% $0 0.0% $287 0.0% $0 0.0% $828 0.0% $217,811 4.2%$0 0.0% $0 0.0% $992 0.0% $0 0.0% $0 0.0% $0 0.0% $0 0.0% $0 0.0% $3,372 0.0% $325,276 6.2%
$4,735,033 100.0% $1,147,451 100.0% $2,704,208 100.0% $4,450,506 100.0% $8,088,680 100.0% $11,885,513 100.0% $23,287,562 100.0% $13,640,573 100.0% $168,286,058 100.0% $5,229,422 100.0%
HERNANDOHENDRYHARDEEHAMILTON HOLMESGLADESGILCHRIST
COUNTY REFERRAL AND UTILIZATION PATTERNS*(Inpatient, Outpatient, and Physician Claims Data from FY 2008-09 for the Mandatory Medicaid Reform Population)
MEMBER COUNTYGULF HILLSBOROUGHHIGHLANDS
* Data extracted in 7/2010 from the Program Analysis SQL Server (FY0809..CLAIM)Yellow: 3%+ of total paid in different county; Red: Mem County = County of Service Document Source IGT TAP Member Tom Wilfong Updated 8/23/2010
January 2011 31
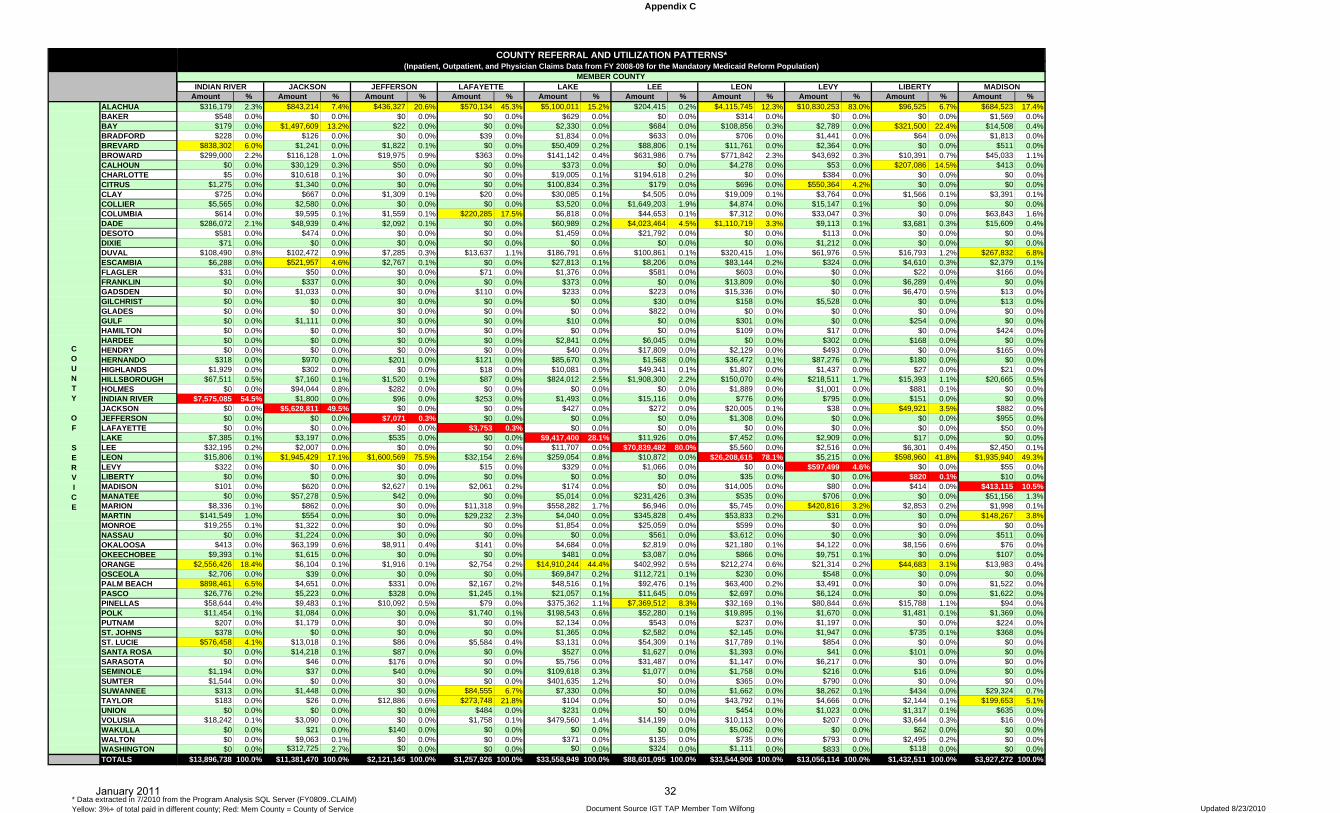
Appendix C
ALACHUABAKERBAYBRADFORDBREVARDBROWARDCALHOUNCHARLOTTECITRUSCLAYCOLLIERCOLUMBIADADEDESOTODIXIEDUVALESCAMBIAFLAGLERFRANKLINGADSDENGILCHRISTGLADESGULFHAMILTONHARDEEHENDRYHERNANDOHIGHLANDSHILLSBOROUGHHOLMESINDIAN RIVERJACKSONJEFFERSONLAFAYETTELAKELEELEONLEVYLIBERTYMADISONMANATEEMARIONMARTINMONROENASSAUOKALOOSAOKEECHOBEEORANGEOSCEOLAPALM BEACHPASCOPINELLASPOLKPUTNAMST. JOHNSST. LUCIESANTA ROSASARASOTASEMINOLESUMTERSUWANNEETAYLORUNIONVOLUSIAWAKULLAWALTONWASHINGTONTOTALS
COUNTY OF SERVICE
Amount % Amount % Amount % Amount % Amount % Amount % Amount % Amount % Amount % Amount %$316,179 2.3% $843,214 7.4% $436,327 20.6% $570,134 45.3% $5,100,011 15.2% $204,415 0.2% $4,115,745 12.3% $10,830,253 83.0% $96,525 6.7% $684,523 17.4%
$548 0.0% $0 0.0% $0 0.0% $0 0.0% $629 0.0% $0 0.0% $314 0.0% $0 0.0% $0 0.0% $1,569 0.0%$179 0.0% $1,497,609 13.2% $22 0.0% $0 0.0% $2,330 0.0% $684 0.0% $108,856 0.3% $2,789 0.0% $321,500 22.4% $14,508 0.4%$228 0.0% $126 0.0% $0 0.0% $39 0.0% $1,834 0.0% $633 0.0% $706 0.0% $1,441 0.0% $64 0.0% $1,813 0.0%
$838,302 6.0% $1,241 0.0% $1,822 0.1% $0 0.0% $50,409 0.2% $88,806 0.1% $11,761 0.0% $2,364 0.0% $0 0.0% $511 0.0%$299,000 2.2% $116,128 1.0% $19,975 0.9% $363 0.0% $141,142 0.4% $631,986 0.7% $771,842 2.3% $43,692 0.3% $10,391 0.7% $45,033 1.1%
$0 0.0% $30,129 0.3% $50 0.0% $0 0.0% $373 0.0% $0 0.0% $4,278 0.0% $53 0.0% $207,086 14.5% $413 0.0%$5 0.0% $10,618 0.1% $0 0.0% $0 0.0% $19,005 0.1% $194,618 0.2% $0 0.0% $384 0.0% $0 0.0% $0 0.0%
$1,275 0.0% $1,340 0.0% $0 0.0% $0 0.0% $100,834 0.3% $179 0.0% $696 0.0% $550,364 4.2% $0 0.0% $0 0.0%$725 0.0% $667 0.0% $1,309 0.1% $20 0.0% $30,085 0.1% $4,505 0.0% $19,009 0.1% $3,764 0.0% $1,566 0.1% $3,391 0.1%
$5,565 0.0% $2,580 0.0% $0 0.0% $0 0.0% $3,520 0.0% $1,649,203 1.9% $4,874 0.0% $15,147 0.1% $0 0.0% $0 0.0%$614 0.0% $9,595 0.1% $1,559 0.1% $220,285 17.5% $6,818 0.0% $44,653 0.1% $7,312 0.0% $33,047 0.3% $0 0.0% $63,843 1.6%
$286,072 2.1% $48,939 0.4% $2,092 0.1% $0 0.0% $60,989 0.2% $4,023,464 4.5% $1,110,719 3.3% $9,113 0.1% $3,681 0.3% $15,609 0.4%$581 0.0% $474 0.0% $0 0.0% $0 0.0% $1,459 0.0% $21,792 0.0% $0 0.0% $113 0.0% $0 0.0% $0 0.0%
$71 0.0% $0 0.0% $0 0.0% $0 0.0% $0 0.0% $0 0.0% $0 0.0% $1,212 0.0% $0 0.0% $0 0.0%$108,490 0.8% $102,472 0.9% $7,285 0.3% $13,637 1.1% $186,791 0.6% $100,861 0.1% $320,415 1.0% $61,976 0.5% $16,793 1.2% $267,832 6.8%
$6,288 0.0% $521,957 4.6% $2,767 0.1% $0 0.0% $27,813 0.1% $8,206 0.0% $83,144 0.2% $324 0.0% $4,610 0.3% $2,379 0.1%$31 0.0% $50 0.0% $0 0.0% $71 0.0% $1,376 0.0% $581 0.0% $603 0.0% $0 0.0% $22 0.0% $166 0.0%
$0 0.0% $337 0.0% $0 0.0% $0 0.0% $373 0.0% $0 0.0% $13,809 0.0% $0 0.0% $6,289 0.4% $0 0.0%$0 0.0% $1,033 0.0% $0 0.0% $110 0.0% $233 0.0% $223 0.0% $15,336 0.0% $0 0.0% $6,470 0.5% $13 0.0%$0 0.0% $0 0.0% $0 0.0% $0 0.0% $0 0.0% $30 0.0% $158 0.0% $5,528 0.0% $0 0.0% $13 0.0%$0 0.0% $0 0.0% $0 0.0% $0 0.0% $0 0.0% $822 0.0% $0 0.0% $0 0.0% $0 0.0% $0 0.0%$0 0.0% $1,111 0.0% $0 0.0% $0 0.0% $10 0.0% $0 0.0% $301 0.0% $0 0.0% $254 0.0% $0 0.0%$0 0.0% $0 0.0% $0 0.0% $0 0.0% $0 0.0% $0 0.0% $109 0.0% $17 0.0% $0 0.0% $424 0.0%$0 0.0% $0 0.0% $0 0.0% $0 0.0% $2,841 0.0% $6,045 0.0% $0 0.0% $302 0.0% $168 0.0% $0 0.0%$0 0.0% $0 0.0% $0 0.0% $0 0.0% $40 0.0% $17,809 0.0% $2,129 0.0% $493 0.0% $0 0.0% $165 0.0%
$318 0.0% $970 0.0% $201 0.0% $121 0.0% $85,670 0.3% $1,568 0.0% $36,472 0.1% $87,276 0.7% $180 0.0% $0 0.0%$1,929 0.0% $302 0.0% $0 0.0% $18 0.0% $10,081 0.0% $49,341 0.1% $1,807 0.0% $1,437 0.0% $27 0.0% $21 0.0%
$67,511 0.5% $7,160 0.1% $1,520 0.1% $87 0.0% $824,012 2.5% $1,908,300 2.2% $150,070 0.4% $218,511 1.7% $15,393 1.1% $20,665 0.5%$0 0.0% $94,044 0.8% $282 0.0% $0 0.0% $0 0.0% $0 0.0% $1,889 0.0% $1,001 0.0% $881 0.1% $0 0.0%
$7,575,085 54.5% $1,800 0.0% $96 0.0% $253 0.0% $1,493 0.0% $15,116 0.0% $776 0.0% $795 0.0% $151 0.0% $0 0.0%$0 0.0% $5,628,811 49.5% $0 0.0% $0 0.0% $427 0.0% $272 0.0% $20,005 0.1% $38 0.0% $49,921 3.5% $882 0.0%$0 0.0% $0 0.0% $7,071 0.3% $0 0.0% $0 0.0% $0 0.0% $1,308 0.0% $0 0.0% $0 0.0% $955 0.0%$0 0.0% $0 0.0% $0 0.0% $3,753 0.3% $0 0.0% $0 0.0% $0 0.0% $0 0.0% $0 0.0% $50 0.0%
$7,385 0.1% $3,197 0.0% $535 0.0% $0 0.0% $9,417,400 28.1% $11,926 0.0% $7,452 0.0% $2,909 0.0% $17 0.0% $0 0.0%$32,195 0.2% $2,007 0.0% $0 0.0% $0 0.0% $11,707 0.0% $70,839,482 80.0% $5,560 0.0% $2,516 0.0% $6,301 0.4% $2,450 0.1%$15,806 0.1% $1,945,429 17.1% $1,600,569 75.5% $32,154 2.6% $259,054 0.8% $10,872 0.0% $26,208,615 78.1% $5,215 0.0% $598,960 41.8% $1,935,940 49.3%
$322 0.0% $0 0.0% $0 0.0% $15 0.0% $329 0.0% $1,066 0.0% $0 0.0% $597,499 4.6% $0 0.0% $55 0.0%$0 0.0% $0 0.0% $0 0.0% $0 0.0% $0 0.0% $0 0.0% $35 0.0% $0 0.0% $820 0.1% $10 0.0%
$101 0.0% $620 0.0% $2,627 0.1% $2,061 0.2% $174 0.0% $0 0.0% $14,005 0.0% $80 0.0% $414 0.0% $413,115 10.5%$0 0.0% $57,278 0.5% $42 0.0% $0 0.0% $5,014 0.0% $231,426 0.3% $535 0.0% $706 0.0% $0 0.0% $51,156 1.3%
$8,336 0.1% $862 0.0% $0 0.0% $11,318 0.9% $558,282 1.7% $6,946 0.0% $5,745 0.0% $420,816 3.2% $2,853 0.2% $1,998 0.1%$141,549 1.0% $554 0.0% $0 0.0% $29,232 2.3% $4,040 0.0% $345,828 0.4% $53,833 0.2% $31 0.0% $0 0.0% $148,267 3.8%
$19,255 0.1% $1,322 0.0% $0 0.0% $0 0.0% $1,854 0.0% $25,059 0.0% $599 0.0% $0 0.0% $0 0.0% $0 0.0%$0 0.0% $1,224 0.0% $0 0.0% $0 0.0% $0 0.0% $561 0.0% $3,612 0.0% $0 0.0% $0 0.0% $511 0.0%
$413 0.0% $63,199 0.6% $8,911 0.4% $141 0.0% $4,684 0.0% $2,819 0.0% $21,180 0.1% $4,122 0.0% $8,156 0.6% $76 0.0%$9,393 0.1% $1,615 0.0% $0 0.0% $0 0.0% $481 0.0% $3,087 0.0% $866 0.0% $9,751 0.1% $0 0.0% $107 0.0%
$2,556,426 18.4% $6,104 0.1% $1,916 0.1% $2,754 0.2% $14,910,244 44.4% $402,992 0.5% $212,274 0.6% $21,314 0.2% $44,683 3.1% $13,983 0.4%$2,706 0.0% $39 0.0% $0 0.0% $0 0.0% $69,847 0.2% $112,721 0.1% $230 0.0% $548 0.0% $0 0.0% $0 0.0%
$898,461 6.5% $4,651 0.0% $331 0.0% $2,167 0.2% $48,516 0.1% $92,476 0.1% $63,400 0.2% $3,491 0.0% $0 0.0% $1,522 0.0%$26,776 0.2% $5,223 0.0% $328 0.0% $1,245 0.1% $21,057 0.1% $11,645 0.0% $2,697 0.0% $6,124 0.0% $0 0.0% $1,622 0.0%$58,644 0.4% $9,483 0.1% $10,092 0.5% $79 0.0% $375,362 1.1% $7,369,512 8.3% $32,169 0.1% $80,844 0.6% $15,788 1.1% $94 0.0%$11,454 0.1% $1,084 0.0% $0 0.0% $1,740 0.1% $198,543 0.6% $52,280 0.1% $19,895 0.1% $1,670 0.0% $1,481 0.1% $1,369 0.0%
$207 0.0% $1,179 0.0% $0 0.0% $0 0.0% $2,134 0.0% $543 0.0% $237 0.0% $1,197 0.0% $0 0.0% $224 0.0%$378 0.0% $0 0.0% $0 0.0% $0 0.0% $1,365 0.0% $2,582 0.0% $2,145 0.0% $1,947 0.0% $735 0.1% $368 0.0%
$576,458 4.1% $13,018 0.1% $86 0.0% $5,584 0.4% $3,131 0.0% $54,309 0.1% $17,789 0.1% $854 0.0% $0 0.0% $0 0.0%$0 0.0% $14,218 0.1% $87 0.0% $0 0.0% $527 0.0% $1,627 0.0% $1,393 0.0% $41 0.0% $101 0.0% $0 0.0%$0 0.0% $46 0.0% $176 0.0% $0 0.0% $5,756 0.0% $31,487 0.0% $1,147 0.0% $6,217 0.0% $0 0.0% $0 0.0%
$1,194 0.0% $37 0.0% $40 0.0% $0 0.0% $109,618 0.3% $1,077 0.0% $1,758 0.0% $216 0.0% $16 0.0% $0 0.0%$1,544 0.0% $0 0.0% $0 0.0% $0 0.0% $401,635 1.2% $0 0.0% $365 0.0% $790 0.0% $0 0.0% $0 0.0%
$313 0.0% $1,448 0.0% $0 0.0% $84,555 6.7% $7,330 0.0% $0 0.0% $1,662 0.0% $8,262 0.1% $434 0.0% $29,324 0.7%$183 0.0% $26 0.0% $12,886 0.6% $273,748 21.8% $104 0.0% $0 0.0% $43,792 0.1% $4,666 0.0% $2,144 0.1% $199,653 5.1%
$0 0.0% $0 0.0% $0 0.0% $484 0.0% $231 0.0% $0 0.0% $454 0.0% $1,023 0.0% $1,317 0.1% $635 0.0%$18,242 0.1% $3,090 0.0% $0 0.0% $1,758 0.1% $479,560 1.4% $14,199 0.0% $10,113 0.0% $207 0.0% $3,644 0.3% $16 0.0%
$0 0.0% $21 0.0% $140 0.0% $0 0.0% $0 0.0% $0 0.0% $5,062 0.0% $0 0.0% $62 0.0% $0 0.0%$0 0.0% $9,063 0.1% $0 0.0% $0 0.0% $371 0.0% $135 0.0% $735 0.0% $793 0.0% $2,495 0.2% $0 0.0%$0 0.0% $312,725 2.7% $0 0.0% $0 0.0% $0 0.0% $324 0.0% $1,111 0.0% $833 0.0% $118 0.0% $0 0.0%
$13,896,738 100.0% $11,381,470 100.0% $2,121,145 100.0% $1,257,926 100.0% $33,558,949 100.0% $88,601,095 100.0% $33,544,906 100.0% $13,056,114 100.0% $1,432,511 100.0% $3,927,272 100.0%
LEELAKE MADISONLIBERTYLEVYLEONLAFAYETTEJEFFERSONJACKSONINDIAN RIVER
COUNTY REFERRAL AND UTILIZATION PATTERNS*(Inpatient, Outpatient, and Physician Claims Data from FY 2008-09 for the Mandatory Medicaid Reform Population)
MEMBER COUNTY
* Data extracted in 7/2010 from the Program Analysis SQL Server (FY0809..CLAIM)Yellow: 3%+ of total paid in different county; Red: Mem County = County of Service Document Source IGT TAP Member Tom Wilfong Updated 8/23/2010
January 2011 32

Appendix C
ALACHUABAKERBAYBRADFORDBREVARDBROWARDCALHOUNCHARLOTTECITRUSCLAYCOLLIERCOLUMBIADADEDESOTODIXIEDUVALESCAMBIAFLAGLERFRANKLINGADSDENGILCHRISTGLADESGULFHAMILTONHARDEEHENDRYHERNANDOHIGHLANDSHILLSBOROUGHHOLMESINDIAN RIVERJACKSONJEFFERSONLAFAYETTELAKELEELEONLEVYLIBERTYMADISONMANATEEMARIONMARTINMONROENASSAUOKALOOSAOKEECHOBEEORANGEOSCEOLAPALM BEACHPASCOPINELLASPOLKPUTNAMST. JOHNSST. LUCIESANTA ROSASARASOTASEMINOLESUMTERSUWANNEETAYLORUNIONVOLUSIAWAKULLAWALTONWASHINGTONTOTALS
COUNTY OF SERVICE
Amount % Amount % Amount % Amount % Amount % Amount % Amount % Amount % Amount % Amount %$83,294 0.2% $33,278,928 53.4% $125,098 1.5% $28,054 0.2% $48,992 0.5% $730,634 3.2% $265,273 2.2% $3,541,204 1.7% $1,397,944 3.2% $860,874 0.6%
$60 0.0% $3,654 0.0% $0 0.0% $0 0.0% $26,413 0.3% $10 0.0% $0 0.0% $665 0.0% $0 0.0% $0 0.0%$7,544 0.0% $12,746 0.0% $84 0.0% $9,468 0.1% $9,151 0.1% $208,339 0.9% $698 0.0% $5,408 0.0% $3,142 0.0% $2,107 0.0%
$165 0.0% $9,629 0.0% $0 0.0% $0 0.0% $4,846 0.1% $2,764 0.0% $0 0.0% $1,838 0.0% $3,425 0.0% $658 0.0%$6,296 0.0% $18,680 0.0% $36,188 0.4% $1,478 0.0% $761 0.0% $3,055 0.0% $12,275 0.1% $955,787 0.5% $204,787 0.5% $106,315 0.1%
$135,216 0.4% $129,085 0.2% $613,841 7.5% $508,640 3.5% $9,725 0.1% $142,080 0.6% $305,311 2.6% $1,408,010 0.7% $525,490 1.2% $9,397,851 6.9%$0 0.0% $576 0.0% $0 0.0% $0 0.0% $0 0.0% $348 0.0% $695 0.0% $61 0.0% $0 0.0% $955 0.0%
$44,854 0.1% $6,197 0.0% $1,814 0.0% $1,033 0.0% $1,133 0.0% $560 0.0% $8,672 0.1% $7,911 0.0% $1,875 0.0% $3,325 0.0%$156 0.0% $822,479 1.3% $548 0.0% $3,740 0.0% $9,875 0.1% $3,490 0.0% $6,851 0.1% $4,194 0.0% $2,722 0.0% $13,148 0.0%$381 0.0% $14,061 0.0% $2,552 0.0% $222 0.0% $43,218 0.5% $133 0.0% $214 0.0% $7,769 0.0% $6,392 0.0% $1,921 0.0%
$28,756 0.1% $5,630 0.0% $245 0.0% $1,743 0.0% $255 0.0% $1,831 0.0% $897 0.0% $13,090 0.0% $17,666 0.0% $24,622 0.0%$461 0.0% $39,834 0.1% $354 0.0% $195 0.0% $17,226 0.2% $245 0.0% $801 0.0% $10,794 0.0% $2,243 0.0% $12,458 0.0%
$53,254 0.2% $330,411 0.5% $510,908 6.2% $6,240,364 43.5% $50,453 0.6% $716,173 3.2% $981,671 8.2% $3,060,746 1.5% $623,933 1.4% $18,329,452 13.4%$10,583 0.0% $739 0.0% $0 0.0% $40 0.0% $0 0.0% $0 0.0% $2,871 0.0% $1,041 0.0% $0 0.0% $130 0.0%
$0 0.0% $0 0.0% $0 0.0% $0 0.0% $0 0.0% $0 0.0% $0 0.0% $0 0.0% $0 0.0% $78 0.0%$95,716 0.3% $327,770 0.5% $2,664 0.0% $62,379 0.4% $6,233,534 68.7% $341,695 1.5% $3,403 0.0% $847,453 0.4% $537,493 1.2% $195,440 0.1%
$1,556 0.0% $27,703 0.0% $188 0.0% $2,379 0.0% $830 0.0% $5,894,813 26.1% $2,354 0.0% $12,055 0.0% $571 0.0% $6,818 0.0%$282 0.0% $1,550 0.0% $2,851 0.0% $4,560 0.0% $878 0.0% $16 0.0% $0 0.0% $130,575 0.1% $428 0.0% $1,499 0.0%
$0 0.0% $0 0.0% $0 0.0% $0 0.0% $0 0.0% $740 0.0% $0 0.0% $0 0.0% $0 0.0% $0 0.0%$5 0.0% $0 0.0% $0 0.0% $0 0.0% $0 0.0% $0 0.0% $0 0.0% $122 0.0% $0 0.0% $25 0.0%
$20 0.0% $50 0.0% $20 0.0% $0 0.0% $5 0.0% $0 0.0% $0 0.0% $15 0.0% $0 0.0% $0 0.0%$316 0.0% $118 0.0% $0 0.0% $0 0.0% $0 0.0% $0 0.0% $100 0.0% $0 0.0% $0 0.0% $187 0.0%
$0 0.0% $0 0.0% $0 0.0% $0 0.0% $477 0.0% $382 0.0% $0 0.0% $0 0.0% $0 0.0% $0 0.0%$0 0.0% $0 0.0% $0 0.0% $0 0.0% $0 0.0% $0 0.0% $0 0.0% $10 0.0% $0 0.0% $0 0.0%
$7,282 0.0% $1,642 0.0% $0 0.0% $0 0.0% $0 0.0% $0 0.0% $270 0.0% $1,584 0.0% $101 0.0% $3,249 0.0%$272 0.0% $1,023 0.0% $5 0.0% $316 0.0% $0 0.0% $1,526 0.0% $8,177 0.1% $644 0.0% $603 0.0% $150,002 0.1%
$5,347 0.0% $61,962 0.1% $0 0.0% $500 0.0% $0 0.0% $152 0.0% $105 0.0% $12,641 0.0% $2,554 0.0% $4,243 0.0%$11,323 0.0% $1,677 0.0% $8,107 0.1% $9,674 0.1% $0 0.0% $347 0.0% $261,740 2.2% $25,804 0.0% $3,293 0.0% $36,937 0.0%
$2,878,093 8.2% $870,077 1.4% $55,043 0.7% $42,956 0.3% $16,697 0.2% $21,224 0.1% $59,826 0.5% $878,216 0.4% $549,223 1.2% $551,387 0.4%$0 0.0% $0 0.0% $0 0.0% $0 0.0% $0 0.0% $2,423 0.0% $496 0.0% $1,821 0.0% $0 0.0% $0 0.0%
$4,161 0.0% $24,128 0.0% $53,828 0.7% $0 0.0% $66 0.0% $24 0.0% $91,221 0.8% $12,275 0.0% $1,964 0.0% $81,680 0.1%$253 0.0% $2,971 0.0% $306 0.0% $0 0.0% $0 0.0% $20,369 0.1% $701 0.0% $83 0.0% $0 0.0% $50,237 0.0%
$0 0.0% $0 0.0% $0 0.0% $0 0.0% $0 0.0% $0 0.0% $0 0.0% $0 0.0% $0 0.0% $0 0.0%$0 0.0% $0 0.0% $0 0.0% $0 0.0% $0 0.0% $0 0.0% $0 0.0% $16 0.0% $0 0.0% $0 0.0%
$30,617 0.1% $686,423 1.1% $1,361 0.0% $277 0.0% $2,515 0.0% $3,420 0.0% $526 0.0% $554,079 0.3% $68,457 0.2% $7,776 0.0%$38,930 0.1% $35,979 0.1% $6,820 0.1% $27,698 0.2% $107,419 1.2% $15,243 0.1% $89,292 0.7% $67,832 0.0% $39,656 0.1% $170,369 0.1%
$171,545 0.5% $68,074 0.1% $461 0.0% $81 0.0% $5,696 0.1% $14,566 0.1% $9 0.0% $102,490 0.0% $72,207 0.2% $138,907 0.1%$30 0.0% $48,023 0.1% $36 0.0% $0 0.0% $0 0.0% $97 0.0% $190 0.0% $3,433 0.0% $379 0.0% $490 0.0%$20 0.0% $0 0.0% $0 0.0% $0 0.0% $0 0.0% $0 0.0% $0 0.0% $0 0.0% $0 0.0% $0 0.0%
$0 0.0% $299 0.0% $0 0.0% $0 0.0% $0 0.0% $0 0.0% $448 0.0% $1,435 0.0% $20 0.0% $1,811 0.0%$12,476,035 35.6% $13,445 0.0% $254 0.0% $1,244 0.0% $0 0.0% $91,535 0.4% $8,331 0.1% $259,986 0.1% $95,459 0.2% $17,587 0.0%
$6,267 0.0% $20,504,224 32.9% $3,204 0.0% $621 0.0% $1,026 0.0% $10,027 0.0% $11,401 0.1% $91,695 0.0% $93,780 0.2% $37,585 0.0%$68,305 0.2% $124,681 0.2% $3,743,714 45.6% $112,462 0.8% $0 0.0% $0 0.0% $391,047 3.3% $6,777 0.0% $4,377 0.0% $2,120,514 1.5%
$1,679 0.0% $2,817 0.0% $889 0.0% $7,167,782 50.0% $0 0.0% $2,195 0.0% $6 0.0% $1,921 0.0% $3,201 0.0% $14,144 0.0%$969 0.0% $1,029 0.0% $0 0.0% $0 0.0% $2,460,760 27.1% $6,467 0.0% $0 0.0% $90 0.0% $654 0.0% $100 0.0%
$4,155 0.0% $3,463 0.0% $467 0.0% $0 0.0% $1,125 0.0% $13,294,168 58.9% $156 0.0% $2,643 0.0% $33 0.0% $3,232 0.0%$40,160 0.1% $1,715 0.0% $60,646 0.7% $366 0.0% $5 0.0% $10 0.0% $5,256,777 44.0% $6,611 0.0% $4,517 0.0% $79,013 0.1%
$286,611 0.8% $1,856,467 3.0% $33,552 0.4% $26,165 0.2% $8,048 0.1% $88,853 0.4% $412,307 3.4% $189,893,331 90.6% $29,405,109 66.7% $1,220,741 0.9%$4,940 0.0% $33,560 0.1% $44,826 0.5% $251 0.0% $84 0.0% $244 0.0% $4,575 0.0% $2,035,981 1.0% $8,510,385 19.3% $49,019 0.0%
$333,409 1.0% $54,496 0.1% $2,125,709 25.9% $10,683 0.1% $0 0.0% $2,207 0.0% $2,053,528 17.2% $229,987 0.1% $83,133 0.2% $102,533,792 74.9%$11,184 0.0% $33,156 0.1% $1,626 0.0% $533 0.0% $128 0.0% $17 0.0% $115 0.0% $19,523 0.0% $6,669 0.0% $3,314 0.0%
$15,506,923 44.2% $1,020,254 1.6% $5,273 0.1% $35,268 0.2% $2,494 0.0% $121,094 0.5% $96,960 0.8% $2,685,707 1.3% $1,106,164 2.5% $307,932 0.2%$17,355 0.0% $53,693 0.1% $5,390 0.1% $41,909 0.3% $33 0.0% $1,492 0.0% $11,880 0.1% $558,902 0.3% $499,850 1.1% $37,582 0.0%
$178 0.0% $97,842 0.2% $0 0.0% $101 0.0% $1,275 0.0% $357 0.0% $242 0.0% $8,031 0.0% $1,676 0.0% $2,482 0.0%$1,000 0.0% $43,695 0.1% $945 0.0% $250 0.0% $2,453 0.0% $202 0.0% $386 0.0% $19,005 0.0% $1,822 0.0% $4,467 0.0%
$55,220 0.2% $8,739 0.0% $746,940 9.1% $1,020 0.0% $2,969 0.0% $155 0.0% $1,596,136 13.3% $26,968 0.0% $2,345 0.0% $246,144 0.2%$846 0.0% $2,387 0.0% $0 0.0% $49 0.0% $242 0.0% $429,720 1.9% $748 0.0% $1,020 0.0% $374 0.0% $6,340 0.0%
$2,606,461 7.4% $11,479 0.0% $0 0.0% $195 0.0% $0 0.0% $1,479 0.0% $2,752 0.0% $99,642 0.0% $21,621 0.0% $4,274 0.0%$1,245 0.0% $24,649 0.0% $798 0.0% $0 0.0% $1,096 0.0% $2,364 0.0% $1,597 0.0% $1,407,029 0.7% $115,130 0.3% $25,877 0.0%
$0 0.0% $1,293,814 2.1% $299 0.0% $1,627 0.0% $0 0.0% $25 0.0% $428 0.0% $7,248 0.0% $0 0.0% $4,866 0.0%$11,282 0.0% $4,503 0.0% $0 0.0% $0 0.0% $741 0.0% $143 0.0% $172 0.0% $2,351 0.0% $0 0.0% $10,883 0.0%$10,754 0.0% $18,216 0.0% $0 0.0% $0 0.0% $1,082 0.0% $2,318 0.0% $717 0.0% $7,241 0.0% $12 0.0% $558 0.0%
$0 0.0% $6,645 0.0% $0 0.0% $0 0.0% $4,762 0.1% $0 0.0% $0 0.0% $658 0.0% $0 0.0% $0 0.0%$8,350 0.0% $224,907 0.4% $7,793 0.1% $3,084 0.0% $414 0.0% $20,677 0.1% $318 0.0% $498,063 0.2% $55,215 0.1% $41,730 0.0%
$51 0.0% $114 0.0% $0 0.0% $0 0.0% $0 0.0% $85 0.0% $0 0.0% $0 0.0% $0 0.0% $121 0.0%$443 0.0% $438 0.0% $0 0.0% $92 0.0% $492 0.0% $373,252 1.7% $0 0.0% $65 0.0% $0 0.0% $1,470 0.0%
$0 0.0% $185 0.0% $0 0.0% $0 0.0% $0 0.0% $6,912 0.0% $495 0.0% $1,389 0.0% $0 0.0% $2,531 0.0%$35,070,612 100.0% $62,272,732 100.0% $8,205,648 100.0% $14,349,497 100.0% $9,079,393 100.0% $22,582,694 100.0% $11,956,159 100.0% $209,542,964 100.0% $44,078,095 100.0% $136,931,246 100.0%
COUNTY REFERRAL AND UTILIZATION PATTERNS*(Inpatient, Outpatient, and Physician Claims Data from FY 2008-09 for the Mandatory Medicaid Reform Population)
MEMBER COUNTYOKEECHOBEE PALM BEACHOSCEOLAORANGEOKALOOSANASSAUMONROEMARTINMARIONMANATEE
* Data extracted in 7/2010 from the Program Analysis SQL Server (FY0809..CLAIM)Yellow: 3%+ of total paid in different county; Red: Mem County = County of Service Document Source IGT TAP Member Tom Wilfong Updated 8/23/2010
January 2011 33

Appendix C
ALACHUABAKERBAYBRADFORDBREVARDBROWARDCALHOUNCHARLOTTECITRUSCLAYCOLLIERCOLUMBIADADEDESOTODIXIEDUVALESCAMBIAFLAGLERFRANKLINGADSDENGILCHRISTGLADESGULFHAMILTONHARDEEHENDRYHERNANDOHIGHLANDSHILLSBOROUGHHOLMESINDIAN RIVERJACKSONJEFFERSONLAFAYETTELAKELEELEONLEVYLIBERTYMADISONMANATEEMARIONMARTINMONROENASSAUOKALOOSAOKEECHOBEEORANGEOSCEOLAPALM BEACHPASCOPINELLASPOLKPUTNAMST. JOHNSST. LUCIESANTA ROSASARASOTASEMINOLESUMTERSUWANNEETAYLORUNIONVOLUSIAWAKULLAWALTONWASHINGTONTOTALS
COUNTY OF SERVICE
Amount % Amount % Amount % Amount % Amount % Amount % Amount % Amount % Amount % Amount %$1,056,595 2.1% $1,335,216 0.9% $1,298,371 1.4% $13,224,957 54.7% $1,762,945 11.0% $652,373 1.4% $1,042,009 6.2% $460,915 1.5% $1,169,424 3.1% $1,706,758 19.0%
$63 0.0% $0 0.0% $20 0.0% $3,225 0.0% $1,379 0.0% $107 0.0% $0 0.0% $1,016 0.0% $0 0.0% $0 0.0%$7,616 0.0% $16,674 0.0% $41,434 0.0% $4,513 0.0% $10,250 0.1% $592 0.0% $67,071 0.4% $12,082 0.0% $7,686 0.0% $331 0.0%
$694 0.0% $0 0.0% $2,009 0.0% $128,900 0.5% $3,983 0.0% $3,473 0.0% $327 0.0% $2,423 0.0% $1,680 0.0% $2,076 0.0%$6,030 0.0% $6,409 0.0% $116,745 0.1% $2,243 0.0% $9,250 0.1% $344,903 0.8% $30,002 0.2% $13,854 0.0% $48,256 0.1% $3,502 0.0%
$460,365 0.9% $826,555 0.6% $1,016,875 1.1% $132,404 0.5% $41,195 0.3% $1,916,388 4.2% $100,739 0.6% $136,587 0.4% $153,429 0.4% $65,233 0.7%$0 0.0% $591 0.0% $147 0.0% $54 0.0% $919 0.0% $2,210 0.0% $0 0.0% $187 0.0% $0 0.0% $210 0.0%
$6,608 0.0% $33,851 0.0% $9,344 0.0% $41 0.0% $4,333 0.0% $7,127 0.0% $116 0.0% $1,304,646 4.2% $993 0.0% $585 0.0%$22,306 0.0% $37,771 0.0% $21,323 0.0% $6,063 0.0% $545 0.0% $1,121 0.0% $1,133 0.0% $222 0.0% $222 0.0% $320,590 3.6%
$1,641 0.0% $15,960 0.0% $5,470 0.0% $284,460 1.2% $87,944 0.5% $547 0.0% $910 0.0% $285 0.0% $23,450 0.1% $717 0.0%$7,742 0.0% $19,356 0.0% $27,612 0.0% $1,023 0.0% $7,951 0.0% $3,933 0.0% $219 0.0% $11,361 0.0% $3,608 0.0% $1,409 0.0%$3,424 0.0% $9,597 0.0% $71,182 0.1% $18,414 0.1% $3,224 0.0% $9,483 0.0% $182 0.0% $1,293 0.0% $1,069 0.0% $1,904 0.0%
$120,677 0.2% $1,350,976 0.9% $354,787 0.4% $1,761,420 7.3% $30,235 0.2% $5,429,588 12.0% $22,281 0.1% $297,288 1.0% $237,843 0.6% $74,003 0.8%$823 0.0% $3,413 0.0% $17,734 0.0% $131 0.0% $0 0.0% $16,683 0.0% $116 0.0% $33,785 0.1% $0 0.0% $0 0.0%
$0 0.0% $0 0.0% $0 0.0% $0 0.0% $0 0.0% $0 0.0% $0 0.0% $0 0.0% $0 0.0% $0 0.0%$92,935 0.2% $246,871 0.2% $182,508 0.2% $2,265,604 9.4% $6,926,553 43.1% $62,340 0.1% $351,205 2.1% $111,323 0.4% $168,002 0.4% $26,649 0.3%$11,251 0.0% $10,379 0.0% $26,439 0.0% $7,766 0.0% $3,509 0.0% $5,639 0.0% $10,493,714 62.1% $5,780 0.0% $2,352 0.0% $37,692 0.4%
$1,642 0.0% $8,257 0.0% $40 0.0% $75,630 0.3% $160,626 1.0% $2,520 0.0% $123 0.0% $1,573 0.0% $7,151 0.0% $45 0.0%$477 0.0% $12 0.0% $0 0.0% $557 0.0% $0 0.0% $0 0.0% $0 0.0% $0 0.0% $0 0.0% $0 0.0%
$0 0.0% $19 0.0% $0 0.0% $0 0.0% $0 0.0% $38 0.0% $62 0.0% $0 0.0% $0 0.0% $0 0.0%$35 0.0% $65 0.0% $28 0.0% $50 0.0% $92 0.0% $15 0.0% $0 0.0% $0 0.0% $20 0.0% $0 0.0%
$0 0.0% $0 0.0% $0 0.0% $0 0.0% $0 0.0% $20 0.0% $0 0.0% $0 0.0% $0 0.0% $0 0.0%$0 0.0% $156 0.0% $0 0.0% $0 0.0% $0 0.0% $0 0.0% $79 0.0% $0 0.0% $0 0.0% $0 0.0%$0 0.0% $110 0.0% $50 0.0% $322 0.0% $10 0.0% $0 0.0% $0 0.0% $77 0.0% $0 0.0% $190 0.0%
$1,369 0.0% $525 0.0% $143,613 0.2% $0 0.0% $0 0.0% $0 0.0% $0 0.0% $609 0.0% $0 0.0% $0 0.0%$65 0.0% $1,588 0.0% $5,406 0.0% $20 0.0% $0 0.0% $2,169 0.0% $122 0.0% $8,033 0.0% $27 0.0% $707 0.0%
$3,063,993 6.1% $276,183 0.2% $116,753 0.1% $49 0.0% $574 0.0% $684 0.0% $0 0.0% $8,889 0.0% $465 0.0% $203,627 2.3%$21,642 0.0% $15,038 0.0% $765,410 0.8% $0 0.0% $4,174 0.0% $11,630 0.0% $394 0.0% $6,075 0.0% $3,110 0.0% $1,063 0.0%
$11,532,199 23.0% $9,982,656 6.9% $13,802,238 14.8% $34,126 0.1% $53,383 0.3% $392,160 0.9% $14,873 0.1% $1,279,453 4.1% $188,950 0.5% $756,427 8.4%$238 0.0% $3,313 0.0% $1,335 0.0% $65 0.0% $0 0.0% $0 0.0% $7,348 0.0% $338 0.0% $56 0.0% $122 0.0%
$5,418 0.0% $1,205 0.0% $20,410 0.0% $192 0.0% $683 0.0% $1,289,497 2.8% $0 0.0% $2,289 0.0% $1,004 0.0% $374 0.0%$1,643 0.0% $1,441 0.0% $15,051 0.0% $0 0.0% $15 0.0% $1,583 0.0% $4,410 0.0% $14 0.0% $0 0.0% $0 0.0%
$0 0.0% $5 0.0% $0 0.0% $0 0.0% $0 0.0% $0 0.0% $0 0.0% $0 0.0% $0 0.0% $0 0.0%$0 0.0% $0 0.0% $0 0.0% $0 0.0% $0 0.0% $0 0.0% $0 0.0% $0 0.0% $5 0.0% $0 0.0%
$24,254 0.0% $81,135 0.1% $70,577 0.1% $12,618 0.1% $1,901 0.0% $105,092 0.2% $5 0.0% $3,637 0.0% $53,191 0.1% $2,466,660 27.5%$90,072 0.2% $190,088 0.1% $75,267 0.1% $12,051 0.0% $9,920 0.1% $34,256 0.1% $6,135 0.0% $643,761 2.1% $6,841 0.0% $438 0.0%$13,133 0.0% $47,672 0.0% $68,424 0.1% $9,786 0.0% $74,308 0.5% $45,876 0.1% $27,385 0.2% $505 0.0% $1,846 0.0% $15,788 0.2%
$2,127 0.0% $78 0.0% $844 0.0% $977 0.0% $15 0.0% $74 0.0% $34 0.0% $0 0.0% $0 0.0% $479 0.0%$0 0.0% $0 0.0% $0 0.0% $0 0.0% $0 0.0% $35 0.0% $0 0.0% $0 0.0% $0 0.0% $0 0.0%$0 0.0% $306 0.0% $0 0.0% $0 0.0% $167 0.0% $248 0.0% $811 0.0% $0 0.0% $189 0.0% $758 0.0%
$408,733 0.8% $500,230 0.3% $457,891 0.5% $1,027 0.0% $432 0.0% $2,521 0.0% $86 0.0% $1,613,406 5.2% $134,595 0.4% $0 0.0%$79,942 0.2% $69,102 0.0% $96,525 0.1% $184,110 0.8% $2,774 0.0% $9,938 0.0% $1,043 0.0% $30,378 0.1% $11,511 0.0% $189,774 2.1%
$2,159 0.0% $63,087 0.0% $3,792 0.0% $3,499 0.0% $439 0.0% $3,319,646 7.3% $148 0.0% $596 0.0% $76,113 0.2% $0 0.0%$3,978 0.0% $23,929 0.0% $15,223 0.0% $77 0.0% $1,306 0.0% $3,821 0.0% $120 0.0% $2,440 0.0% $5,498 0.0% $0 0.0%
$0 0.0% $344 0.0% $1,089 0.0% $2,934 0.0% $8,218 0.1% $894 0.0% $364 0.0% $50 0.0% $1,419 0.0% $0 0.0%$6,141 0.0% $2,859 0.0% $2,337 0.0% $4,895 0.0% $4,648 0.0% $1,412 0.0% $387,191 2.3% $536 0.0% $24 0.0% $70 0.0%
$370 0.0% $4,783 0.0% $5,648 0.0% $1,057 0.0% $432 0.0% $218,370 0.5% $737 0.0% $0 0.0% $96 0.0% $0 0.0%$227,369 0.5% $570,819 0.4% $11,002,215 11.8% $321,665 1.3% $43,737 0.3% $1,104,857 2.4% $217,983 1.3% $75,244 0.2% $31,267,858 81.9% $1,883,349 21.0%
$7,475 0.0% $14,194 0.0% $339,544 0.4% $345 0.0% $1,026 0.0% $20,210 0.0% $82 0.0% $5,572 0.0% $69,012 0.2% $8,948 0.1%$16,084 0.0% $95,085 0.1% $149,767 0.2% $5,181 0.0% $8,877 0.1% $6,113,432 13.5% $7,086 0.0% $17,765 0.1% $68,309 0.2% $23,192 0.3%
$13,390,295 26.7% $862,637 0.6% $136,075 0.1% $422 0.0% $320 0.0% $4,649 0.0% $14,382 0.1% $16,710 0.1% $2,041 0.0% $274,613 3.1%$18,765,211 37.5% $127,184,635 87.8% $10,152,823 10.9% $53,287 0.2% $49,457 0.3% $267,860 0.6% $5,553 0.0% $9,292,969 30.1% $254,925 0.7% $360,096 4.0%
$540,548 1.1% $453,982 0.3% $52,193,349 56.1% $58,496 0.2% $5,452 0.0% $52,475 0.1% $391 0.0% $23,696 0.1% $35,255 0.1% $10,467 0.1%$1,844 0.0% $76 0.0% $1,556 0.0% $4,562,571 18.9% $155,337 1.0% $822 0.0% $0 0.0% $3,762 0.0% $174 0.0% $133 0.0%
$25,058 0.1% $2,908 0.0% $5,888 0.0% $672,501 2.8% $6,443,298 40.1% $3,444 0.0% $5 0.0% $136 0.0% $1,884 0.0% $7,478 0.1%$16,054 0.0% $29,430 0.0% $64,849 0.1% $2,075 0.0% $107 0.0% $23,811,029 52.6% $806 0.0% $12,106 0.0% $5,572 0.0% $0 0.0%
$3,221 0.0% $16,033 0.0% $6,385 0.0% $1,224 0.0% $644 0.0% $5 0.0% $4,050,416 24.0% $444 0.0% $586 0.0% $40 0.0%$21,411 0.0% $311,953 0.2% $89,520 0.1% $460 0.0% $2,344 0.0% $504 0.0% $1,568 0.0% $15,405,586 49.9% $82,201 0.2% $0 0.0%
$2,191 0.0% $8,255 0.0% $18,721 0.0% $1,095 0.0% $3,468 0.0% $8,321 0.0% $279 0.0% $1,802 0.0% $3,526,276 9.2% $3,649 0.0%$2,691 0.0% $2,666 0.0% $1,353 0.0% $0 0.0% $0 0.0% $824 0.0% $36 0.0% $1,063 0.0% $6,986 0.0% $500,816 5.6%$1,793 0.0% $6,997 0.0% $2,322 0.0% $4,539 0.0% $113 0.0% $1,584 0.0% $112 0.0% $2,088 0.0% $657 0.0% $220 0.0%
$568 0.0% $2,225 0.0% $11,799 0.0% $737 0.0% $1,236 0.0% $5,324 0.0% $1,881 0.0% $147 0.0% $0 0.0% $193 0.0%$197 0.0% $0 0.0% $751 0.0% $2,421 0.0% $662 0.0% $459 0.0% $21,591 0.1% $107 0.0% $0 0.0% $0 0.0%
$20,796 0.0% $63,727 0.0% $41,263 0.0% $292,110 1.2% $122,920 0.8% $8,280 0.0% $284 0.0% $2,144 0.0% $522,759 1.4% $18,461 0.2%$0 0.0% $0 0.0% $0 0.0% $0 0.0% $40 0.0% $0 0.0% $0 0.0% $0 0.0% $0 0.0% $0 0.0%
$157 0.0% $13,055 0.0% $1,923 0.0% $0 0.0% $0 0.0% $230 0.0% $15,458 0.1% $0 0.0% $428 0.0% $0 0.0%$1,164 0.0% $2,309 0.0% $316 0.0% $0 0.0% $0 0.0% $0 0.0% $6,849 0.0% $0 0.0% $26 0.0% $133 0.0%
$50,102,526 100.0% $144,828,788 100.0% $93,080,371 100.0% $24,164,387 100.0% $16,057,370 100.0% $45,303,314 100.0% $16,906,254 100.0% $30,857,043 100.0% $38,155,075 100.0% $8,969,970 100.0%
COUNTY REFERRAL AND UTILIZATION PATTERNS*(Inpatient, Outpatient, and Physician Claims Data from FY 2008-09 for the Mandatory Medicaid Reform Population)
MEMBER COUNTYSUMTERSEMINOLESARASOTASANTA ROSAST. LUCIEST. JOHNSPUTNAMPOLKPINELLASPASCO
* Data extracted in 7/2010 from the Program Analysis SQL Server (FY0809..CLAIM)Yellow: 3%+ of total paid in different county; Red: Mem County = County of Service Document Source IGT TAP Member Tom Wilfong Updated 8/23/2010
January 2011 34
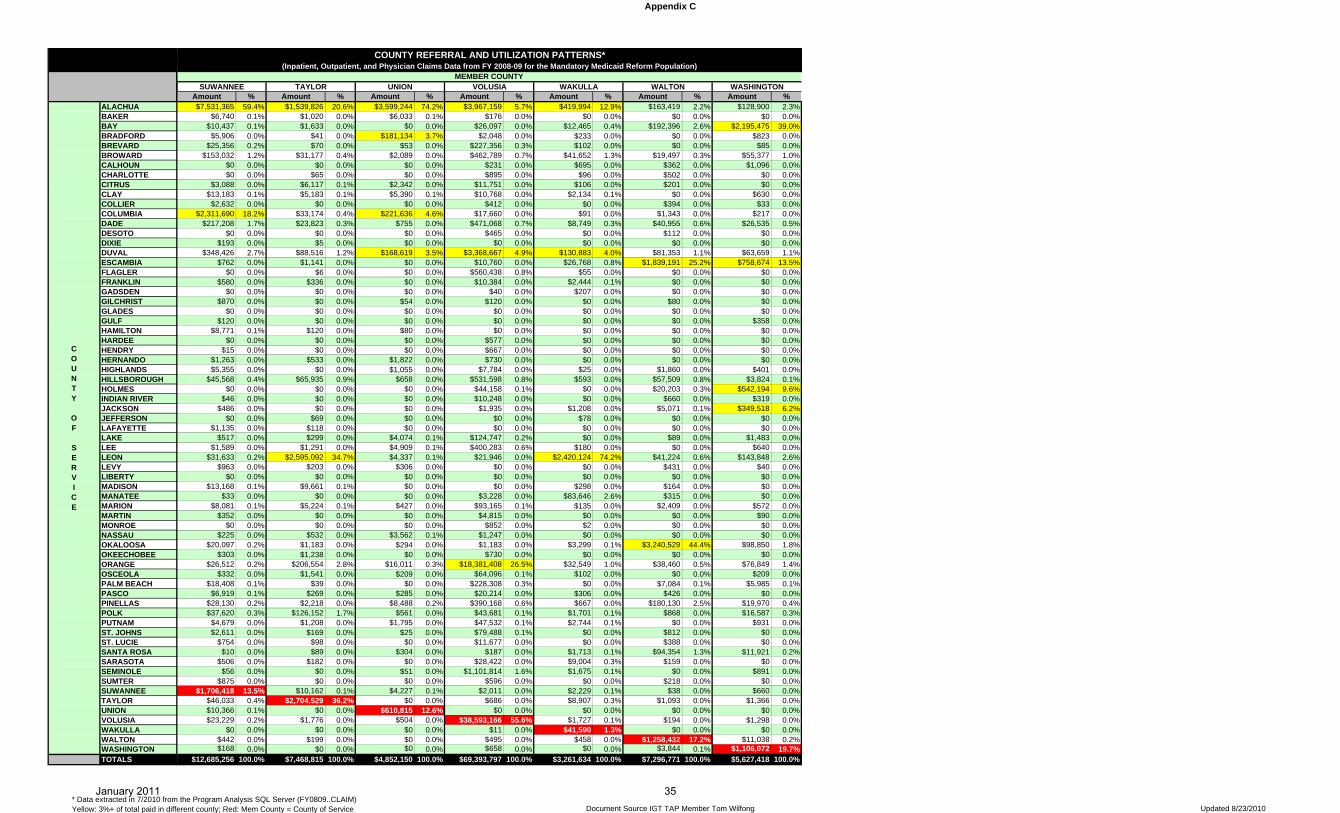
Appendix C
ALACHUABAKERBAYBRADFORDBREVARDBROWARDCALHOUNCHARLOTTECITRUSCLAYCOLLIERCOLUMBIADADEDESOTODIXIEDUVALESCAMBIAFLAGLERFRANKLINGADSDENGILCHRISTGLADESGULFHAMILTONHARDEEHENDRYHERNANDOHIGHLANDSHILLSBOROUGHHOLMESINDIAN RIVERJACKSONJEFFERSONLAFAYETTELAKELEELEONLEVYLIBERTYMADISONMANATEEMARIONMARTINMONROENASSAUOKALOOSAOKEECHOBEEORANGEOSCEOLAPALM BEACHPASCOPINELLASPOLKPUTNAMST. JOHNSST. LUCIESANTA ROSASARASOTASEMINOLESUMTERSUWANNEETAYLORUNIONVOLUSIAWAKULLAWALTONWASHINGTONTOTALS
COUNTY OF SERVICE
Amount % Amount % Amount % Amount % Amount % Amount % Amount %$7,531,365 59.4% $1,539,826 20.6% $3,599,244 74.2% $3,967,159 5.7% $419,994 12.9% $163,419 2.2% $128,900 2.3%
$6,740 0.1% $1,020 0.0% $6,033 0.1% $176 0.0% $0 0.0% $0 0.0% $0 0.0%$10,437 0.1% $1,633 0.0% $0 0.0% $26,097 0.0% $12,465 0.4% $192,396 2.6% $2,195,475 39.0%
$5,906 0.0% $41 0.0% $181,134 3.7% $2,048 0.0% $233 0.0% $0 0.0% $823 0.0%$25,356 0.2% $70 0.0% $53 0.0% $227,356 0.3% $102 0.0% $0 0.0% $85 0.0%
$153,032 1.2% $31,177 0.4% $2,089 0.0% $462,789 0.7% $41,652 1.3% $19,497 0.3% $55,377 1.0%$0 0.0% $0 0.0% $0 0.0% $231 0.0% $695 0.0% $362 0.0% $1,096 0.0%$0 0.0% $65 0.0% $0 0.0% $895 0.0% $96 0.0% $502 0.0% $0 0.0%
$3,088 0.0% $6,117 0.1% $2,342 0.0% $11,751 0.0% $106 0.0% $201 0.0% $0 0.0%$13,183 0.1% $5,183 0.1% $5,390 0.1% $10,768 0.0% $2,134 0.1% $0 0.0% $630 0.0%
$2,632 0.0% $0 0.0% $0 0.0% $412 0.0% $0 0.0% $394 0.0% $33 0.0%$2,311,690 18.2% $33,174 0.4% $221,636 4.6% $17,660 0.0% $91 0.0% $1,343 0.0% $217 0.0%
$217,208 1.7% $23,823 0.3% $755 0.0% $471,068 0.7% $8,749 0.3% $40,955 0.6% $26,535 0.5%$0 0.0% $0 0.0% $0 0.0% $465 0.0% $0 0.0% $112 0.0% $0 0.0%
$193 0.0% $5 0.0% $0 0.0% $0 0.0% $0 0.0% $0 0.0% $0 0.0%$348,426 2.7% $88,516 1.2% $168,619 3.5% $3,368,667 4.9% $130,883 4.0% $81,353 1.1% $63,659 1.1%
$762 0.0% $1,141 0.0% $0 0.0% $10,760 0.0% $26,768 0.8% $1,839,191 25.2% $758,674 13.5%$0 0.0% $6 0.0% $0 0.0% $560,438 0.8% $55 0.0% $0 0.0% $0 0.0%
$580 0.0% $336 0.0% $0 0.0% $10,384 0.0% $2,444 0.1% $0 0.0% $0 0.0%$0 0.0% $0 0.0% $0 0.0% $40 0.0% $207 0.0% $0 0.0% $0 0.0%
$870 0.0% $0 0.0% $54 0.0% $120 0.0% $0 0.0% $80 0.0% $0 0.0%$0 0.0% $0 0.0% $0 0.0% $0 0.0% $0 0.0% $0 0.0% $0 0.0%
$120 0.0% $0 0.0% $0 0.0% $0 0.0% $0 0.0% $0 0.0% $358 0.0%$8,771 0.1% $120 0.0% $80 0.0% $0 0.0% $0 0.0% $0 0.0% $0 0.0%
$0 0.0% $0 0.0% $0 0.0% $577 0.0% $0 0.0% $0 0.0% $0 0.0%$15 0.0% $0 0.0% $0 0.0% $667 0.0% $0 0.0% $0 0.0% $0 0.0%
$1,263 0.0% $533 0.0% $1,822 0.0% $730 0.0% $0 0.0% $0 0.0% $0 0.0%$5,355 0.0% $0 0.0% $1,055 0.0% $7,784 0.0% $25 0.0% $1,860 0.0% $401 0.0%
$45,568 0.4% $65,935 0.9% $658 0.0% $531,598 0.8% $593 0.0% $57,509 0.8% $3,824 0.1%$0 0.0% $0 0.0% $0 0.0% $44,158 0.1% $0 0.0% $20,203 0.3% $542,194 9.6%
$46 0.0% $0 0.0% $0 0.0% $10,248 0.0% $0 0.0% $660 0.0% $319 0.0%$486 0.0% $0 0.0% $0 0.0% $1,935 0.0% $1,208 0.0% $5,071 0.1% $349,518 6.2%
$0 0.0% $69 0.0% $0 0.0% $0 0.0% $78 0.0% $0 0.0% $0 0.0%$1,135 0.0% $118 0.0% $0 0.0% $0 0.0% $0 0.0% $0 0.0% $0 0.0%
$517 0.0% $299 0.0% $4,074 0.1% $124,747 0.2% $0 0.0% $89 0.0% $1,483 0.0%$1,589 0.0% $1,291 0.0% $4,909 0.1% $400,283 0.6% $180 0.0% $0 0.0% $640 0.0%
$31,633 0.2% $2,595,092 34.7% $4,337 0.1% $21,946 0.0% $2,420,124 74.2% $41,224 0.6% $143,848 2.6%$963 0.0% $203 0.0% $306 0.0% $0 0.0% $0 0.0% $431 0.0% $40 0.0%
$0 0.0% $0 0.0% $0 0.0% $0 0.0% $0 0.0% $0 0.0% $0 0.0%$13,168 0.1% $9,661 0.1% $0 0.0% $0 0.0% $298 0.0% $164 0.0% $0 0.0%
$33 0.0% $0 0.0% $0 0.0% $3,228 0.0% $83,646 2.6% $315 0.0% $0 0.0%$8,081 0.1% $5,224 0.1% $427 0.0% $93,165 0.1% $135 0.0% $2,409 0.0% $572 0.0%
$352 0.0% $0 0.0% $0 0.0% $4,815 0.0% $0 0.0% $0 0.0% $90 0.0%$0 0.0% $0 0.0% $0 0.0% $852 0.0% $2 0.0% $0 0.0% $0 0.0%
$225 0.0% $532 0.0% $3,562 0.1% $1,247 0.0% $0 0.0% $0 0.0% $0 0.0%$20,097 0.2% $1,183 0.0% $294 0.0% $1,183 0.0% $3,299 0.1% $3,240,529 44.4% $98,850 1.8%
$303 0.0% $1,238 0.0% $0 0.0% $730 0.0% $0 0.0% $0 0.0% $0 0.0%$26,512 0.2% $206,554 2.8% $16,011 0.3% $18,381,408 26.5% $32,549 1.0% $38,460 0.5% $76,849 1.4%
$332 0.0% $1,541 0.0% $209 0.0% $64,096 0.1% $102 0.0% $0 0.0% $209 0.0%$18,408 0.1% $39 0.0% $0 0.0% $228,308 0.3% $0 0.0% $7,084 0.1% $5,985 0.1%
$6,919 0.1% $269 0.0% $285 0.0% $20,214 0.0% $306 0.0% $426 0.0% $0 0.0%$28,130 0.2% $2,218 0.0% $8,488 0.2% $390,168 0.6% $667 0.0% $180,130 2.5% $19,970 0.4%$37,620 0.3% $126,152 1.7% $561 0.0% $43,681 0.1% $1,701 0.1% $868 0.0% $16,587 0.3%
$4,679 0.0% $1,208 0.0% $1,795 0.0% $47,532 0.1% $2,744 0.1% $0 0.0% $931 0.0%$2,611 0.0% $169 0.0% $25 0.0% $79,488 0.1% $0 0.0% $812 0.0% $0 0.0%
$754 0.0% $98 0.0% $0 0.0% $11,677 0.0% $0 0.0% $388 0.0% $0 0.0%$10 0.0% $89 0.0% $304 0.0% $187 0.0% $1,713 0.1% $94,354 1.3% $11,921 0.2%
$506 0.0% $182 0.0% $0 0.0% $28,422 0.0% $9,004 0.3% $159 0.0% $0 0.0%$56 0.0% $0 0.0% $51 0.0% $1,101,814 1.6% $1,675 0.1% $0 0.0% $891 0.0%
$875 0.0% $0 0.0% $0 0.0% $596 0.0% $0 0.0% $218 0.0% $0 0.0%$1,706,418 13.5% $10,162 0.1% $4,227 0.1% $2,011 0.0% $2,229 0.1% $38 0.0% $660 0.0%
$46,033 0.4% $2,704,529 36.2% $0 0.0% $686 0.0% $8,907 0.3% $1,093 0.0% $1,366 0.0%$10,366 0.1% $0 0.0% $610,815 12.6% $0 0.0% $0 0.0% $0 0.0% $0 0.0%$23,229 0.2% $1,776 0.0% $504 0.0% $38,593,166 55.6% $1,727 0.1% $194 0.0% $1,298 0.0%
$0 0.0% $0 0.0% $0 0.0% $11 0.0% $41,590 1.3% $0 0.0% $0 0.0%$442 0.0% $199 0.0% $0 0.0% $495 0.0% $458 0.0% $1,258,432 17.2% $11,038 0.2%$168 0.0% $0 0.0% $0 0.0% $658 0.0% $0 0.0% $3,844 0.1% $1,106,072 19.7%
$12,685,256 100.0% $7,468,815 100.0% $4,852,150 100.0% $69,393,797 100.0% $3,261,634 100.0% $7,296,771 100.0% $5,627,418 100.0%
MEMBER COUNTY
COUNTY REFERRAL AND UTILIZATION PATTERNS*(Inpatient, Outpatient, and Physician Claims Data from FY 2008-09 for the Mandatory Medicaid Reform Population)
WASHINGTONWALTONWAKULLAVOLUSIAUNIONTAYLORSUWANNEE
* Data extracted in 7/2010 from the Program Analysis SQL Server (FY0809..CLAIM)Yellow: 3%+ of total paid in different county; Red: Mem County = County of Service Document Source IGT TAP Member Tom Wilfong Updated 8/23/2010
January 2011 35

Appendix C
COUNTY
HIGH above 40%ORANGE $337,747,324 $189,893,331 $147,853,994 44% $20,828,994 $11,710,787 $9,118,207ALACHUA $244,793,928 $80,942,422 $163,851,505 67% $11,748,026 $3,884,548 $7,863,479PINELLAS $241,119,421 $127,184,635 $113,934,786 47% $12,576,758 $6,633,934 $5,942,824LEON $49,092,161 $26,208,615 $22,883,546 47% $80,599 $43,029 $37,570MARTIN $14,687,911 $3,743,714 $10,944,197 75% $0 $0 $0OTHER $19,881,773 $10,167,261 $9,714,512 49% $54,715 $31,915 $22,799MIDDLE 20% to 40%HILLSBOROUGH $195,566,265 $133,413,502 $62,152,763 32% $16,106,356 $10,987,608 $5,118,749LEE $100,207,343 $70,839,482 $29,367,861 29% $3,814,388 $2,696,502 $1,117,886ESCAMBIA $75,640,351 $50,961,858 $24,678,493 33% $3,982,129 $2,682,916 $1,299,213BAY $41,843,839 $32,470,059 $9,373,779 22% $1,970,723 $1,529,246 $441,478SARASOTA $21,475,957 $15,405,586 $6,070,371 28% $2,089,272 $1,498,721 $590,552MANATEE $19,916,721 $12,476,035 $7,440,686 37% $594,286 $372,267 $222,019OKALOOSA $18,740,328 $13,294,168 $5,446,160 29% $0 $0 $0PASCO $17,458,475 $13,390,295 $4,068,181 23% $293,615 $225,196 $68,418HERNANDO $14,899,101 $9,773,745 $5,125,356 34% $339,475 $222,694 $116,781COLUMBIA $14,592,590 $9,543,126 $5,049,464 35% $370,957 $242,595 $128,362LAKE $14,173,008 $9,417,400 $4,755,609 34% $0 $0 $0OTHER $92,694,384 $67,390,680 $25,303,704 27% $1,855,080 $1,323,317 $531,763LOW 20% and belowDADE $850,358,165 $760,819,663 $89,538,503 11% $49,552,721 $44,335,065 $5,217,656BROWARD $341,594,682 $273,106,681 $68,488,001 20% $18,176,390 $14,532,116 $3,644,274DUVAL $224,275,840 $178,568,460 $45,707,380 20% $9,346,824 $7,441,943 $1,904,881PALM BEACH $124,029,225 $102,533,792 $21,495,433 17% $6,824,115 $5,641,431 $1,182,683POLK $59,055,618 $52,193,349 $6,862,270 12% $662,780 $585,765 $77,015VOLUSIA $45,287,066 $38,593,166 $6,693,900 15% $2,264,084 $1,929,429 $334,655BREVARD $38,489,576 $34,737,205 $3,752,371 10% $1,874,364 $1,691,631 $182,733OTHER $104,173,390 $89,202,639 $14,970,751 14% $4,720,642 $4,037,221 $683,421
ASSUMPTIONS*ITALICIZED COUNTIES DO NOT CONTRIBUTE ANY IGT DOLLARS*BASED ON AHCA DATA FY 0809*IGT REQUIRED DOLLARS BASED ON 2010 FMAP %*HOSPITAL PAYMENTS DERIVED THROUGH STATEWIDE AVG OF % OVERALL SPEND
To take from this table: The county in which the services are rendered is not necessarily the county in which the recipient resides. Therefore, the funding of Hosptial Exemptions and Buybacks is a cross county issue regardless of managed care of fee-for-service delivery options.
COUNTY OF SERVICE
TOTALTOTAL COUNTY RESIDENTS
RESIDENTS OTHER CNTY
% $$$ FROM OUT OF COUNTY
HOSPITAL PAYMENTS IGTs NEEDED TO FUND PAYMENTS M/C EXPANSION
HOSPITAL PAYMENTS TO PROVIDERS BY PATIENT COUNTY ORIGIN
% CARE PROVIDED TO NON COUNTY RESIDENTS
COUNTY RESIDENTS
RESIDENTS OTHER CNTY
January 2011 36

Appendix D
Assumptions
* Overall value of MediPass to MC change to Hospitals is on average 44% total exempt/IGT $$$ (Mandatory days 64% of total, and transfer rate is 70% leaving 56% in FFS)* MC membership is 70% of MediPass / FFS PSN membership from Sept 2010 annualized* IP Utilization is 70% Mandatory Beddays from AHCA IGT Report* OP Utilization is derived from IP % by hospital using same 70% Mandatory calculation* Goal is to return to hospitals current level of funding +/- 10%* All reimbursements to hospitals based on 100% FFS payment rate* Model focus is on incremental Exempt and BuyBack payments absent LIP distributions* Mc rates would be calculated based on Non Exempt rates, then adjusted individually for Exempt and Buy Back* Hospital rates are subject to unit cost adjustment up or down based on an 80% floor and 120% ceiling on their current FFS rate* Downward adjustment are made to bring rate to 120%of FFS rate, upward adjustment made to bring rate to 80% of current FFS rate* MC rates adjust semi annually to coincide with hospital rate changes* MC rate based on utilization from annualized utilization, completed with 1 Q runout ( ex. utilization July 2010-June 2011 paid through Sept completed)* Rates determined by County; PMPMs calculated based on current membership % and utilization % based on historic data* Utilization trend in base underwriting added to IGT adjustment rate
January 2011 37
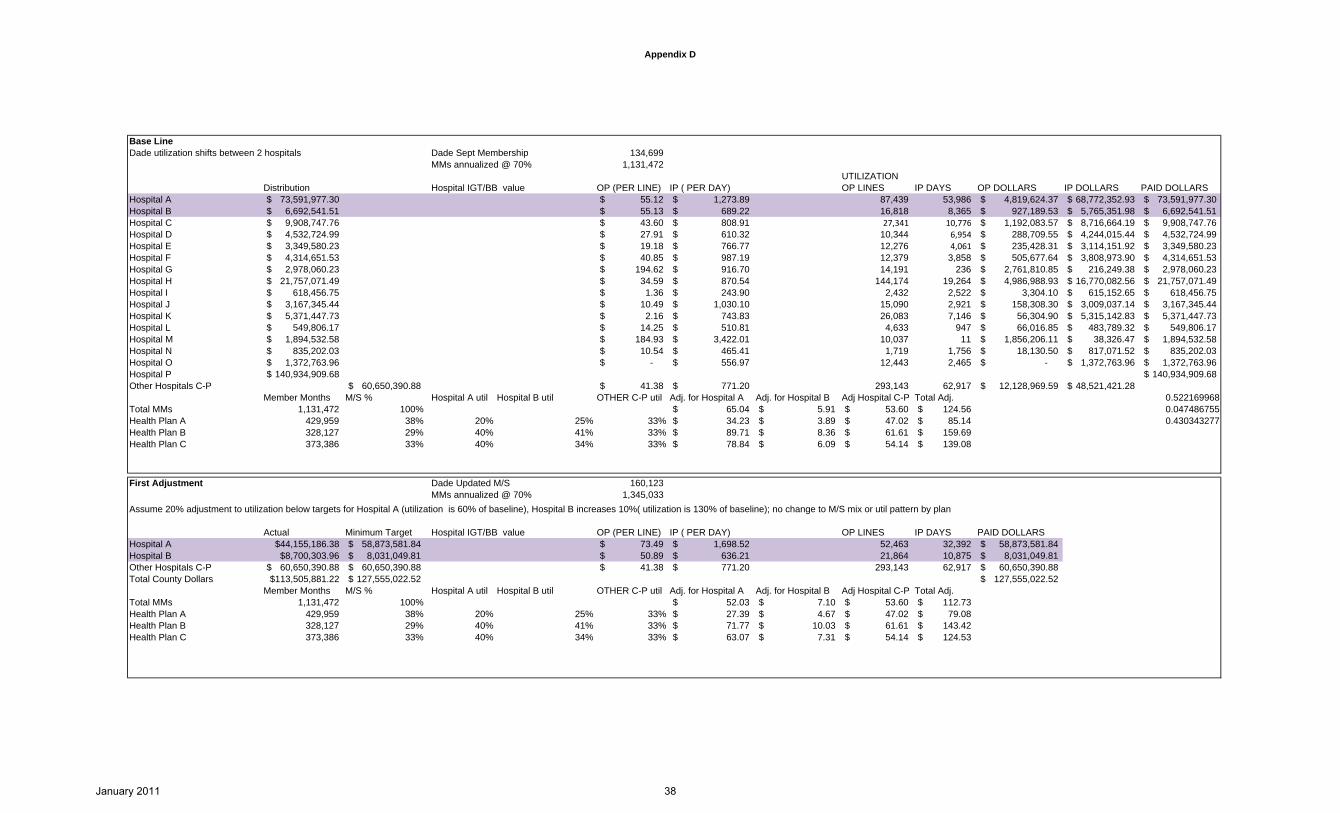
Appendix D
Base LineDade utilization shifts between 2 hospitals Dade Sept Membership 134,699
MMs annualized @ 70% 1,131,472 UTILIZATION
Distribution Hospital IGT/BB value OP (PER LINE) IP ( PER DAY) OP LINES IP DAYS OP DOLLARS IP DOLLARS PAID DOLLARSHospital A 73,591,977.30$ 55.12$ 1,273.89$ 87,439 53,986 4,819,624.37$ 68,772,352.93$ 73,591,977.30$ Hospital B 6,692,541.51$ 55.13$ 689.22$ 16,818 8,365 927,189.53$ 5,765,351.98$ 6,692,541.51$ Hospital C 9,908,747.76$ 43.60$ 808.91$ 27,341 10,776 1,192,083.57$ 8,716,664.19$ 9,908,747.76$ Hospital D 4,532,724.99$ 27.91$ 610.32$ 10,344 6,954 288,709.55$ 4,244,015.44$ 4,532,724.99$ Hospital E 3,349,580.23$ 19.18$ 766.77$ 12,276 4,061 235,428.31$ 3,114,151.92$ 3,349,580.23$ Hospital F 4,314,651.53$ 40.85$ 987.19$ 12,379 3,858 505,677.64$ 3,808,973.90$ 4,314,651.53$ Hospital G 2,978,060.23$ 194.62$ 916.70$ 14,191 236 2,761,810.85$ 216,249.38$ 2,978,060.23$ Hospital H 21,757,071.49$ 34.59$ 870.54$ 144,174 19,264 4,986,988.93$ 16,770,082.56$ 21,757,071.49$ Hospital I 618,456.75$ 1.36$ 243.90$ 2,432 2,522 3,304.10$ 615,152.65$ 618,456.75$ Hospital J 3,167,345.44$ 10.49$ 1,030.10$ 15,090 2,921 158,308.30$ 3,009,037.14$ 3,167,345.44$ Hospital K 5,371,447.73$ 2.16$ 743.83$ 26,083 7,146 56,304.90$ 5,315,142.83$ 5,371,447.73$ Hospital L 549,806.17$ 14.25$ 510.81$ 4,633 947 66,016.85$ 483,789.32$ 549,806.17$ Hospital M 1,894,532.58$ 184.93$ 3,422.01$ 10,037 11 1,856,206.11$ 38,326.47$ 1,894,532.58$ Hospital N 835,202.03$ 10.54$ 465.41$ 1,719 1,756 18,130.50$ 817,071.52$ 835,202.03$ Hospital O 1,372,763.96$ -$ 556.97$ 12,443 2,465 -$ 1,372,763.96$ 1,372,763.96$ Hospital P 140,934,909.68$ 140,934,909.68$ Other Hospitals C-P 60,650,390.88$ 41.38$ 771.20$ 293,143 62,917 12,128,969.59$ 48,521,421.28$
Member Months M/S % Hospital A util Hospital B util OTHER C-P util Adj. for Hospital A Adj. for Hospital B Adj Hospital C-P Total Adj. 0.522169968Total MMs 1,131,472 100% 65.04$ 5.91$ 53.60$ 124.56$ 0.047486755Health Plan A 429,959 38% 20% 25% 33% 34.23$ 3.89$ 47.02$ 85.14$ 0.430343277Health Plan B 328,127 29% 40% 41% 33% 89.71$ 8.36$ 61.61$ 159.69$ Health Plan C 373,386 33% 40% 34% 33% 78.84$ 6.09$ 54.14$ 139.08$
First Adjustment Dade Updated M/S 160,123 MMs annualized @ 70% 1,345,033
Assume 20% adjustment to utilization below targets for Hospital A (utilization is 60% of baseline), Hospital B increases 10%( utilization is 130% of baseline); no change to M/S mix or util pattern by plan
Actual Minimum Target Hospital IGT/BB value OP (PER LINE) IP ( PER DAY) OP LINES IP DAYS PAID DOLLARSHospital A $44,155,186.38 58,873,581.84$ 73.49$ 1,698.52$ 52,463 32,392 58,873,581.84$ Hospital B $8,700,303.96 8,031,049.81$ 50.89$ 636.21$ 21,864 10,875 8,031,049.81$ Other Hospitals C-P 60,650,390.88$ 60,650,390.88$ 41.38$ 771.20$ 293,143 62,917 60,650,390.88$ Total County Dollars $113,505,881.22 127,555,022.52$ 127,555,022.52$
Member Months M/S % Hospital A util Hospital B util OTHER C-P util Adj. for Hospital A Adj. for Hospital B Adj Hospital C-P Total Adj.Total MMs 1,131,472 100% 52.03$ 7.10$ 53.60$ 112.73$ Health Plan A 429,959 38% 20% 25% 33% 27.39$ 4.67$ 47.02$ 79.08$ Health Plan B 328,127 29% 40% 41% 33% 71.77$ 10.03$ 61.61$ 143.42$ Health Plan C 373,386 33% 40% 34% 33% 63.07$ 7.31$ 54.14$ 124.53$
January 2011 38

Appendix D
Base LineOrange utilization shifts between 3 hospitals Orange Sept Membership 23,951
MMs annualized @ 70% 201,188 UTILIZATION
Distribution Hospital IGT/BB value OP (PER LINE) IP ( PER DAY) OP LINES IP DAYS OP DOLLARS IP DOLLARS PAID DOLLARSHospital 1 23,667,039.00$ 37.93$ 894.66$ 81,431 23,001 3,088,695.94$ 20,578,343.06$ 23,667,039.00$ Hospital 2 33,864,511.53$ 53.81$ 892.89$ 66,199 33,937 3,562,146.44$ 30,302,365.09$ 33,864,511.53$ Hospital 3 1,709,047.44$ 35.16$ 678.47$ 8,125 2,098 285,685.23$ 1,423,362.21$ 1,709,047.44$ Total Orange 59,240,597.96$ 44.53$ 885.96$ 155,755 59,037 6,936,528 52,304,070 59,240,598
Member Months M/S % Hospital 1 Util Hospital 2 Util Hospital 3 util Adj. for Hospital 1 Adj. for Hospital 2 Adj for Hospital 3 Total Adj.Total MMs 201,188 100% 117.64$ 168.32$ 8.49$ 294.45$ Health Plan A 76,452 38% 20% 25% 35% 61.91$ 110.74$ 7.82$ 180.48$ Health Plan B 58,345 29% 40% 41% 40% 162.26$ 237.97$ 11.72$ 411.95$ Health Plan C 66,392 33% 40% 34% 25% 142.59$ 173.42$ 6.44$ 322.45$
First Adjustment Orange Updated M/S 23,951 MMs annualized @ 70% 201,188
Assume 10% adjustment to utilization below targets for Hospital 1 (utilization is 70% of baseline), Hospital 2 increases 10%( utilization is 130% of baseline); Hospital 3 to 90% (still in corridor) change to M/S mix no change to util pattern by plan
Actual Minimum Target Hospital IGT/BB value OP (PER LINE) IP ( PER DAY) OP LINES IP DAYS PAID DOLLARSHospital 1 30,767,150.69$ 28,400,446.79$ 35.01$ 825.84$ 105,861 29,902 28,400,446.79$ Hospital 2 23,705,158.07$ 27,091,609.22$ 61.50$ 1,020.45$ 46,339 23,756 27,091,609.22$ Hospital 3 1,538,142.70$ 1,538,142.70$ 35.16$ 678.47$ 7,313 1,888 1,538,142.70$ Total Orange 56,010,451.46$ 57,030,198.71$ 57,030,198.71$
Member Months M/S % Hospital 1 Util Hospital 2 Util Hospital 3 util Adj. for Hospital 1 Adj. for Hospital 2 Adj for Hospital 3 Total Adj.Total MMs 201,188 100% 141.16$ 134.66$ 7.65$ 283.47$ Health Plan A 72,428 36% 20% 25% 30% 78.42$ 93.51$ 6.37$ 178.31$ Health Plan B 74,440 37% 36% 41% 52% 137.35$ 149.22$ 10.74$ 297.31$ Health Plan C 54,321 27% 44% 34% 18% 230.04$ 169.57$ 5.10$ 404.71$
January 2011 39

Appendix D
Corridor +/- 20% Hospital IGT Baseline Lower UpperNew IGT %
Corridor run-off to allocate IP Rate
IP Add-on OP Rate
OP Add-on
County dade 1 Aventura Hospital & Medical Center - - - $645.43 $36.122 Columbia Kendall Medical Center 1,372,782 1,098,226 1,647,338 $1,514.85 $87.793 Healthsouth Larkin Hospital-Miami 835,202 668,162 1,002,242 $1,057.50 $111.874 St.Catherine's Rehabilitation Hospital - - - $513.91 $16.165 Kindred Hospital - Coral Gables - - - $779.62 $16.166 Anne Bates Leach Eye Hospital 1,894,533 1,515,626 2,273,439 $8,569.89 $329.727 Coral Gables Hospital 549,806 439,845 659,767 $1,247.82 $114.858 Palmetto General Hospital 5,371,448 4,297,158 6,445,737 95% $1,446.64 $96.929 Doctors Hospital - - - $1,031.47 $162.36
10 Select Specialty Hospital Miami - - - $800.32 $16.1611 Sister Emmanuel Hospital - - - $827.45 $16.1612 Douglas Gardens Hospital - - - $961.96 $16.1613 HealthSouth Rehabililation Hospital - Miami - - - $423.60 $43.2114 Homestead Hospital 3,167,345 2,533,876 3,800,815 $2,158.14 $172.0615 West Gables Rehabilitation - - - $413.81 $16.1616 Westchester General Hospital 618,457 494,765 742,148 $706.51 $109.9017 Miami Childrens Hospital 21,757,071 17,405,657 26,108,486 79% 217,571 $2,457.25 $8.71 $148.61 $0.3518 South Miami Hospital - - - $1,036.77 $101.9519 Metropolitan Hospital Miami - - - $812.37 $93.5520 Palm Springs General Hospital - - - $633.99 $36.6721 Northshore Medical Center 6,692,542 5,354,033 8,031,050 70% 669,254 $1,414.57 $68.92 $95.86 $5.5122 University Of Miami Hospital 2,978,060 2,382,448 3,573,672 60% 595,612 $2,666.34 $183.34 $309.72 $38.9223 Mt. Sinai Medical Center 4,314,652 3,451,721 5,177,582 $1,987.36 $178.3924 Mercy Hospital, Inc. - - - $879.81 $126.3025 Jackson Memorial Hospital 73,591,977 58,873,582 88,310,373 100% $2,460.43 $214.1226 Hialeah Hospital 3,349,580 2,679,664 4,019,496 99% $1,456.88 $86.7627 Cedars Medical Center, Inc. 4,532,725 3,626,180 5,439,270 101% $1,367.37 $137.7628 Baptist Of Miami 9,908,748 7,926,998 11,890,497 93% $1,783.11 $175.71
Corridor
January 2011 40
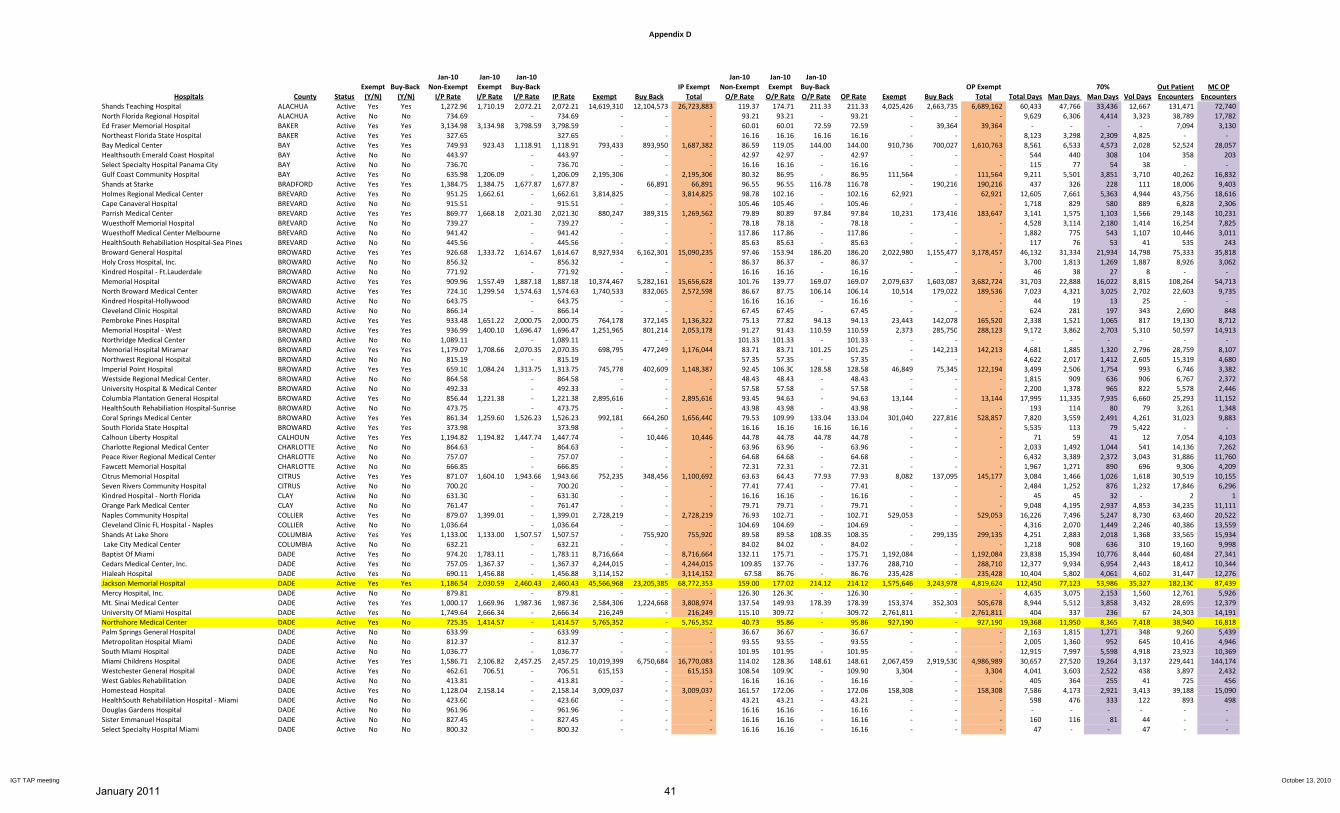
Appendix D
Jan‐10 Jan‐10 Jan‐10 Jan‐10 Jan‐10 Jan‐10Exempt Buy‐Back Non‐Exempt Exempt Buy‐Back IP Exempt Non‐Exempt Exempt Buy‐Back OP Exempt 70% Out Patient MC OP
Hospitals County Status (Y/N) (Y/N) I/P Rate I/P Rate I/P Rate IP Rate Exempt Buy Back Total O/P Rate O/P Rate O/P Rate OP Rate Exempt Buy Back Total Total Days Man Days Man Days Vol Days Encounters EncountersShands Teaching Hospital ALACHUA Active Yes Yes 1,272.96 1,710.19 2,072.21 2,072.21 14,619,310 12,104,573 26,723,883 119.37 174.71 211.33 211.33 4,025,426 2,663,735 6,689,162 60,433 47,766 33,436 12,667 131,471 72,740 North Florida Regional Hospital ALACHUA Active No No 734.69 ‐ 734.69 ‐ ‐ ‐ 93.21 93.21 ‐ 93.21 ‐ ‐ ‐ 9,629 6,306 4,414 3,323 38,789 17,782 Ed Fraser Memorial Hospital BAKER Active Yes Yes 3,134.98 3,134.98 3,798.59 3,798.59 ‐ ‐ ‐ 60.01 60.01 72.59 72.59 ‐ 39,364 39,364 ‐ ‐ ‐ ‐ 7,094 3,130 Northeast Florida State Hospital BAKER Active Yes Yes 327.65 327.65 ‐ ‐ ‐ 16.16 16.16 16.16 16.16 ‐ ‐ ‐ 8,123 3,298 2,309 4,825 ‐ ‐ Bay Medical Center BAY Active Yes Yes 749.93 923.43 1,118.91 1,118.91 793,433 893,950 1,687,382 86.59 119.05 144.00 144.00 910,736 700,027 1,610,763 8,561 6,533 4,573 2,028 52,524 28,057 Healthsouth Emerald Coast Hospital BAY Active No No 443.97 ‐ 443.97 ‐ ‐ ‐ 42.97 42.97 ‐ 42.97 ‐ ‐ ‐ 544 440 308 104 358 203 Select Specialty Hospital Panama City BAY Active No No 736.70 ‐ 736.70 ‐ ‐ ‐ 16.16 16.16 ‐ 16.16 ‐ ‐ ‐ 115 77 54 38 ‐ ‐ Gulf Coast Community Hospital BAY Active Yes No 635.98 1,206.09 ‐ 1,206.09 2,195,306 ‐ 2,195,306 80.32 86.95 ‐ 86.95 111,564 ‐ 111,564 9,211 5,501 3,851 3,710 40,262 16,832 Shands at Starke BRADFORD Active Yes Yes 1,384.75 1,384.75 1,677.87 1,677.87 ‐ 66,891 66,891 96.55 96.55 116.78 116.78 ‐ 190,216 190,216 437 326 228 111 18,006 9,403 Holmes Regional Medical Center BREVARD Active Yes No 951.25 1,662.61 ‐ 1,662.61 3,814,825 ‐ 3,814,825 98.78 102.16 ‐ 102.16 62,921 ‐ 62,921 12,605 7,661 5,363 4,944 43,756 18,616 Cape Canaveral Hospital BREVARD Active No No 915.51 ‐ 915.51 ‐ ‐ ‐ 105.46 105.46 ‐ 105.46 ‐ ‐ ‐ 1,718 829 580 889 6,828 2,306 Parrish Medical Center BREVARD Active Yes Yes 869.77 1,668.18 2,021.30 2,021.30 880,247 389,315 1,269,562 79.89 80.89 97.84 97.84 10,231 173,416 183,647 3,141 1,575 1,103 1,566 29,148 10,231 Wuesthoff Memorial Hospital BREVARD Active No No 739.27 ‐ 739.27 ‐ ‐ ‐ 78.18 78.18 ‐ 78.18 ‐ ‐ ‐ 4,528 3,114 2,180 1,414 16,254 7,825 Wuesthoff Medical Center Melbourne BREVARD Active No No 941.42 ‐ 941.42 ‐ ‐ ‐ 117.86 117.86 ‐ 117.86 ‐ ‐ ‐ 1,882 775 543 1,107 10,446 3,011 HealthSouth Rehabiliation Hospital‐Sea Pines BREVARD Active No No 445.56 ‐ 445.56 ‐ ‐ ‐ 85.63 85.63 ‐ 85.63 ‐ ‐ ‐ 117 76 53 41 535 243 Broward General Hospital BROWARD Active Yes Yes 926.68 1,333.72 1,614.67 1,614.67 8,927,934 6,162,301 15,090,235 97.46 153.94 186.20 186.20 2,022,980 1,155,477 3,178,457 46,132 31,334 21,934 14,798 75,333 35,818 Holy Cross Hospital, Inc. BROWARD Active No No 856.32 ‐ 856.32 ‐ ‐ ‐ 86.37 86.37 ‐ 86.37 ‐ ‐ ‐ 3,700 1,813 1,269 1,887 8,926 3,062 Kindred Hospital ‐ Ft.Lauderdale BROWARD Active No No 771.92 ‐ 771.92 ‐ ‐ ‐ 16.16 16.16 ‐ 16.16 ‐ ‐ ‐ 46 38 27 8 ‐ ‐ Memorial Hospital BROWARD Active Yes Yes 909.96 1,557.49 1,887.18 1,887.18 10,374,467 5,282,161 15,656,628 101.76 139.77 169.07 169.07 2,079,637 1,603,087 3,682,724 31,703 22,888 16,022 8,815 108,264 54,713 North Broward Medical Center BROWARD Active Yes Yes 724.10 1,299.54 1,574.63 1,574.63 1,740,533 832,065 2,572,598 86.67 87.75 106.14 106.14 10,514 179,022 189,536 7,023 4,321 3,025 2,702 22,603 9,735 Kindred Hospital‐Hollywood BROWARD Active No No 643.75 ‐ 643.75 ‐ ‐ ‐ 16.16 16.16 ‐ 16.16 ‐ ‐ ‐ 44 19 13 25 ‐ ‐ Cleveland Clinic Hospital BROWARD Active No No 866.14 ‐ 866.14 ‐ ‐ ‐ 67.45 67.45 ‐ 67.45 ‐ ‐ ‐ 624 281 197 343 2,690 848 Pembroke Pines Hospital BROWARD Active Yes Yes 933.48 1,651.22 2,000.75 2,000.75 764,178 372,145 1,136,322 75.13 77.82 94.13 94.13 23,443 142,078 165,520 2,338 1,521 1,065 817 19,130 8,712 Memorial Hospital ‐ West BROWARD Active Yes Yes 936.99 1,400.10 1,696.47 1,696.47 1,251,965 801,214 2,053,178 91.27 91.43 110.59 110.59 2,373 285,750 288,123 9,172 3,862 2,703 5,310 50,597 14,913 Northridge Medical Center BROWARD Active No No 1,089.11 ‐ 1,089.11 ‐ ‐ ‐ 101.33 101.33 ‐ 101.33 ‐ ‐ ‐ ‐ ‐ ‐ ‐ ‐ ‐ Memorial Hospital Miramar BROWARD Active Yes Yes 1,179.07 1,708.66 2,070.35 2,070.35 698,795 477,249 1,176,044 83.71 83.71 101.25 101.25 ‐ 142,213 142,213 4,681 1,885 1,320 2,796 28,759 8,107 Northwest Regional Hospital BROWARD Active No No 815.19 ‐ 815.19 ‐ ‐ ‐ 57.35 57.35 ‐ 57.35 ‐ ‐ ‐ 4,622 2,017 1,412 2,605 15,319 4,680 Imperial Point Hospital BROWARD Active Yes Yes 659.10 1,084.24 1,313.75 1,313.75 745,778 402,609 1,148,387 92.45 106.30 128.58 128.58 46,849 75,345 122,194 3,499 2,506 1,754 993 6,746 3,382 Westside Regional Medical Center. BROWARD Active No No 864.58 ‐ 864.58 ‐ ‐ ‐ 48.43 48.43 ‐ 48.43 ‐ ‐ ‐ 1,815 909 636 906 6,767 2,372 University Hospital & Medical Center BROWARD Active No No 492.33 ‐ 492.33 ‐ ‐ ‐ 57.58 57.58 ‐ 57.58 ‐ ‐ ‐ 2,200 1,378 965 822 5,578 2,446 Columbia Plantation General Hospital BROWARD Active Yes No 856.44 1,221.38 ‐ 1,221.38 2,895,616 ‐ 2,895,616 93.45 94.63 ‐ 94.63 13,144 ‐ 13,144 17,995 11,335 7,935 6,660 25,293 11,152 HealthSouth Rehabiliation Hospital‐Sunrise BROWARD Active No No 473.75 ‐ 473.75 ‐ ‐ ‐ 43.98 43.98 ‐ 43.98 ‐ ‐ ‐ 193 114 80 79 3,261 1,348 Coral Springs Medical Center BROWARD Active Yes Yes 861.34 1,259.60 1,526.23 1,526.23 992,181 664,260 1,656,440 79.53 109.99 133.04 133.04 301,040 227,816 528,857 7,820 3,559 2,491 4,261 31,023 9,883 South Florida State Hospital BROWARD Active Yes Yes 373.98 373.98 ‐ ‐ ‐ 16.16 16.16 16.16 16.16 ‐ ‐ ‐ 5,535 113 79 5,422 ‐ ‐ Calhoun Liberty Hospital CALHOUN Active Yes Yes 1,194.82 1,194.82 1,447.74 1,447.74 ‐ 10,446 10,446 44.78 44.78 44.78 44.78 ‐ ‐ ‐ 71 59 41 12 7,054 4,103 Charlotte Regional Medical Center CHARLOTTE Active No No 864.63 ‐ 864.63 ‐ ‐ ‐ 63.96 63.96 ‐ 63.96 ‐ ‐ ‐ 2,033 1,492 1,044 541 14,136 7,262 Peace River Regional Medical Center CHARLOTTE Active No No 757.07 ‐ 757.07 ‐ ‐ ‐ 64.68 64.68 ‐ 64.68 ‐ ‐ ‐ 6,432 3,389 2,372 3,043 31,886 11,760 Fawcett Memorial Hospital CHARLOTTE Active No No 666.85 ‐ 666.85 ‐ ‐ ‐ 72.31 72.31 ‐ 72.31 ‐ ‐ ‐ 1,967 1,271 890 696 9,306 4,209 Citrus Memorial Hospital CITRUS Active Yes Yes 871.07 1,604.10 1,943.66 1,943.66 752,235 348,456 1,100,692 63.63 64.43 77.93 77.93 8,082 137,095 145,177 3,084 1,466 1,026 1,618 30,519 10,155 Seven Rivers Community Hospital CITRUS Active No No 700.20 ‐ 700.20 ‐ ‐ ‐ 77.41 77.41 ‐ 77.41 ‐ ‐ ‐ 2,484 1,252 876 1,232 17,846 6,296 Kindred Hospital ‐ North Florida CLAY Active No No 631.30 ‐ 631.30 ‐ ‐ ‐ 16.16 16.16 ‐ 16.16 ‐ ‐ ‐ 45 45 32 ‐ 2 1 Orange Park Medical Center CLAY Active No No 761.47 ‐ 761.47 ‐ ‐ ‐ 79.71 79.71 ‐ 79.71 ‐ ‐ ‐ 9,048 4,195 2,937 4,853 34,235 11,111 Naples Community Hospital COLLIER Active Yes No 879.07 1,399.01 ‐ 1,399.01 2,728,219 ‐ 2,728,219 76.93 102.71 ‐ 102.71 529,053 ‐ 529,053 16,226 7,496 5,247 8,730 63,460 20,522 Cleveland Clinic FL Hospital ‐ Naples COLLIER Active No No 1,036.64 ‐ 1,036.64 ‐ ‐ ‐ 104.69 104.69 ‐ 104.69 ‐ ‐ ‐ 4,316 2,070 1,449 2,246 40,386 13,559 Shands At Lake Shore COLUMBIA Active Yes Yes 1,133.00 1,133.00 1,507.57 1,507.57 ‐ 755,920 755,920 89.58 89.58 108.35 108.35 ‐ 299,135 299,135 4,251 2,883 2,018 1,368 33,565 15,934 Lake City Medical Center COLUMBIA Active No No 632.21 ‐ 632.21 ‐ ‐ ‐ 84.02 84.02 ‐ 84.02 ‐ ‐ ‐ 1,218 908 636 310 19,160 9,998 Baptist Of Miami DADE Active Yes No 974.20 1,783.11 ‐ 1,783.11 8,716,664 ‐ 8,716,664 132.11 175.71 ‐ 175.71 1,192,084 ‐ 1,192,084 23,838 15,394 10,776 8,444 60,484 27,341 Cedars Medical Center, Inc. DADE Active Yes No 757.05 1,367.37 ‐ 1,367.37 4,244,015 ‐ 4,244,015 109.85 137.76 ‐ 137.76 288,710 ‐ 288,710 12,377 9,934 6,954 2,443 18,412 10,344 Hialeah Hospital DADE Active Yes No 690.11 1,456.88 ‐ 1,456.88 3,114,152 ‐ 3,114,152 67.58 86.76 ‐ 86.76 235,428 ‐ 235,428 10,404 5,802 4,061 4,602 31,447 12,276 Jackson Memorial Hospital DADE Active Yes Yes 1,186.54 2,030.59 2,460.43 2,460.43 45,566,968 23,205,385 68,772,353 159.00 177.02 214.12 214.12 1,575,646 3,243,978 4,819,624 112,450 77,123 53,986 35,327 182,130 87,439 Mercy Hospital, Inc. DADE Active No No 879.81 ‐ 879.81 ‐ ‐ ‐ 126.30 126.30 ‐ 126.30 ‐ ‐ ‐ 4,635 3,075 2,153 1,560 12,761 5,926 Mt. Sinai Medical Center DADE Active Yes Yes 1,000.17 1,669.96 1,987.36 1,987.36 2,584,306 1,224,668 3,808,974 137.54 149.93 178.39 178.39 153,374 352,303 505,678 8,944 5,512 3,858 3,432 28,695 12,379 University Of Miami Hospital DADE Active Yes No 1,749.64 2,666.34 ‐ 2,666.34 216,249 ‐ 216,249 115.10 309.72 ‐ 309.72 2,761,811 ‐ 2,761,811 404 337 236 67 24,303 14,191 Northshore Medical Center DADE Active Yes No 725.35 1,414.57 ‐ 1,414.57 5,765,352 ‐ 5,765,352 40.73 95.86 ‐ 95.86 927,190 ‐ 927,190 19,368 11,950 8,365 7,418 38,940 16,818 Palm Springs General Hospital DADE Active No No 633.99 ‐ 633.99 ‐ ‐ ‐ 36.67 36.67 ‐ 36.67 ‐ ‐ ‐ 2,163 1,815 1,271 348 9,260 5,439 Metropolitan Hospital Miami DADE Active No No 812.37 ‐ 812.37 ‐ ‐ ‐ 93.55 93.55 ‐ 93.55 ‐ ‐ ‐ 2,005 1,360 952 645 10,416 4,946 South Miami Hospital DADE Active No No 1,036.77 ‐ 1,036.77 ‐ ‐ ‐ 101.95 101.95 ‐ 101.95 ‐ ‐ ‐ 12,915 7,997 5,598 4,918 23,923 10,369 Miami Childrens Hospital DADE Active Yes Yes 1,586.71 2,106.82 2,457.25 2,457.25 10,019,399 6,750,684 16,770,083 114.02 128.36 148.61 148.61 2,067,459 2,919,530 4,986,989 30,657 27,520 19,264 3,137 229,441 144,174 Westchester General Hospital DADE Active Yes No 462.61 706.51 ‐ 706.51 615,153 ‐ 615,153 108.54 109.90 ‐ 109.90 3,304 ‐ 3,304 4,041 3,603 2,522 438 3,897 2,432 West Gables Rehabilitation DADE Active No No 413.81 ‐ 413.81 ‐ ‐ ‐ 16.16 16.16 ‐ 16.16 ‐ ‐ ‐ 405 364 255 41 725 456 Homestead Hospital DADE Active Yes No 1,128.04 2,158.14 ‐ 2,158.14 3,009,037 ‐ 3,009,037 161.57 172.06 ‐ 172.06 158,308 ‐ 158,308 7,586 4,173 2,921 3,413 39,188 15,090 HealthSouth Rehabililation Hospital ‐ Miami DADE Active No No 423.60 ‐ 423.60 ‐ ‐ ‐ 43.21 43.21 ‐ 43.21 ‐ ‐ ‐ 598 476 333 122 893 498 Douglas Gardens Hospital DADE Active No No 961.96 ‐ 961.96 ‐ ‐ ‐ 16.16 16.16 ‐ 16.16 ‐ ‐ ‐ ‐ ‐ ‐ ‐ ‐ ‐ Sister Emmanuel Hospital DADE Active No No 827.45 ‐ 827.45 ‐ ‐ ‐ 16.16 16.16 ‐ 16.16 ‐ ‐ ‐ 160 116 81 44 ‐ ‐ Select Specialty Hospital Miami DADE Active No No 800.32 ‐ 800.32 ‐ ‐ ‐ 16.16 16.16 ‐ 16.16 ‐ ‐ ‐ 47 ‐ ‐ 47 ‐ ‐
IGT TAP meeting October 13, 2010
January 2011 41
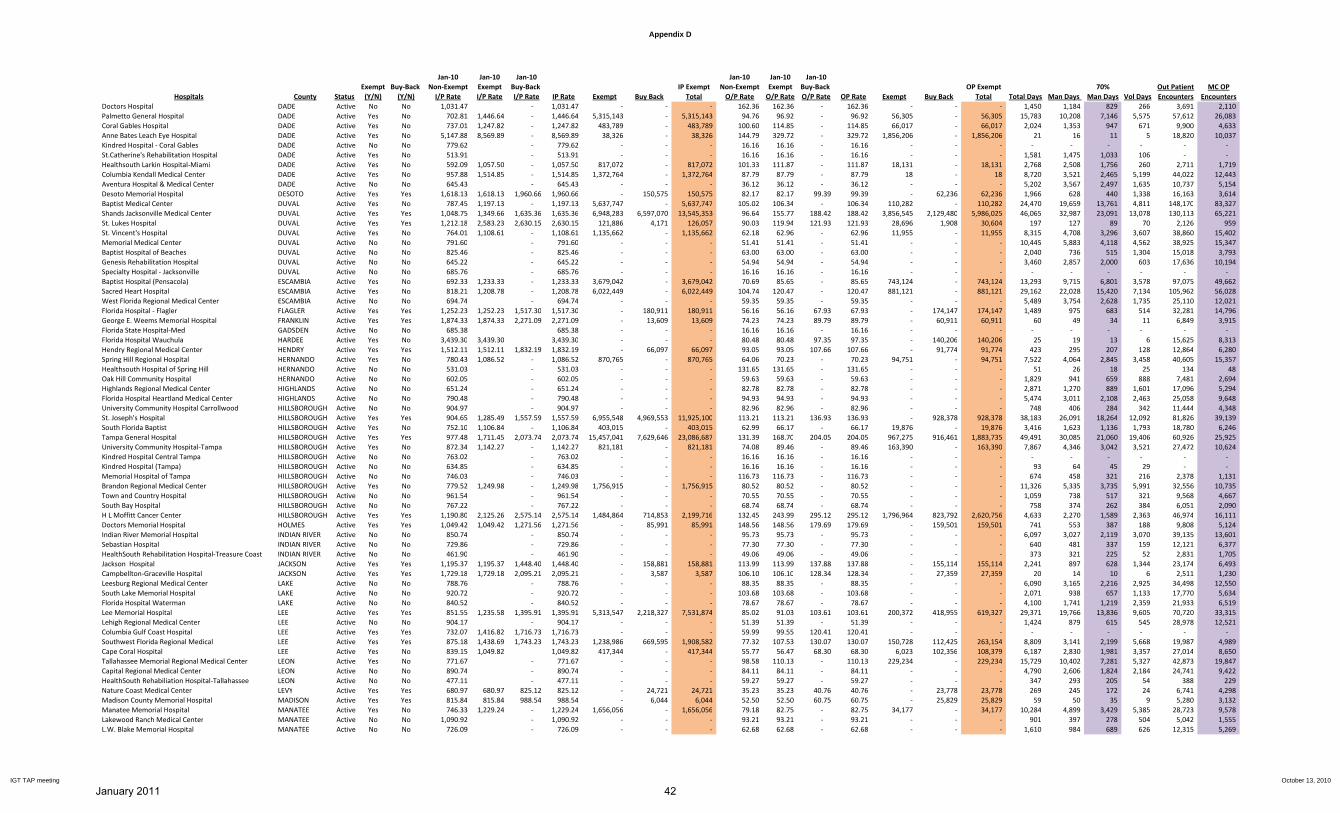
Appendix D
Jan‐10 Jan‐10 Jan‐10 Jan‐10 Jan‐10 Jan‐10Exempt Buy‐Back Non‐Exempt Exempt Buy‐Back IP Exempt Non‐Exempt Exempt Buy‐Back OP Exempt 70% Out Patient MC OP
Hospitals County Status (Y/N) (Y/N) I/P Rate I/P Rate I/P Rate IP Rate Exempt Buy Back Total O/P Rate O/P Rate O/P Rate OP Rate Exempt Buy Back Total Total Days Man Days Man Days Vol Days Encounters EncountersDoctors Hospital DADE Active No No 1,031.47 ‐ 1,031.47 ‐ ‐ ‐ 162.36 162.36 ‐ 162.36 ‐ ‐ ‐ 1,450 1,184 829 266 3,691 2,110 Palmetto General Hospital DADE Active Yes No 702.81 1,446.64 ‐ 1,446.64 5,315,143 ‐ 5,315,143 94.76 96.92 ‐ 96.92 56,305 ‐ 56,305 15,783 10,208 7,146 5,575 57,612 26,083 Coral Gables Hospital DADE Active Yes No 737.01 1,247.82 ‐ 1,247.82 483,789 ‐ 483,789 100.60 114.85 ‐ 114.85 66,017 ‐ 66,017 2,024 1,353 947 671 9,900 4,633 Anne Bates Leach Eye Hospital DADE Active Yes No 5,147.88 8,569.89 ‐ 8,569.89 38,326 ‐ 38,326 144.79 329.72 ‐ 329.72 1,856,206 ‐ 1,856,206 21 16 11 5 18,820 10,037 Kindred Hospital ‐ Coral Gables DADE Active No No 779.62 ‐ 779.62 ‐ ‐ ‐ 16.16 16.16 ‐ 16.16 ‐ ‐ ‐ ‐ ‐ ‐ ‐ ‐ ‐ St.Catherine's Rehabilitation Hospital DADE Active Yes No 513.91 ‐ 513.91 ‐ ‐ ‐ 16.16 16.16 ‐ 16.16 ‐ ‐ ‐ 1,581 1,475 1,033 106 ‐ ‐ Healthsouth Larkin Hospital‐Miami DADE Active Yes No 592.09 1,057.50 ‐ 1,057.50 817,072 ‐ 817,072 101.33 111.87 ‐ 111.87 18,131 ‐ 18,131 2,768 2,508 1,756 260 2,711 1,719 Columbia Kendall Medical Center DADE Active Yes No 957.88 1,514.85 ‐ 1,514.85 1,372,764 ‐ 1,372,764 87.79 87.79 ‐ 87.79 18 ‐ 18 8,720 3,521 2,465 5,199 44,022 12,443 Aventura Hospital & Medical Center DADE Active No No 645.43 ‐ 645.43 ‐ ‐ ‐ 36.12 36.12 ‐ 36.12 ‐ ‐ ‐ 5,202 3,567 2,497 1,635 10,737 5,154 Desoto Memorial Hospital DESOTO Active Yes Yes 1,618.13 1,618.13 1,960.66 1,960.66 ‐ 150,575 150,575 82.17 82.17 99.39 99.39 ‐ 62,236 62,236 1,966 628 440 1,338 16,163 3,614 Baptist Medical Center DUVAL Active Yes No 787.45 1,197.13 ‐ 1,197.13 5,637,747 ‐ 5,637,747 105.02 106.34 ‐ 106.34 110,282 ‐ 110,282 24,470 19,659 13,761 4,811 148,170 83,327 Shands Jacksonville Medical Center DUVAL Active Yes Yes 1,048.75 1,349.66 1,635.36 1,635.36 6,948,283 6,597,070 13,545,353 96.64 155.77 188.42 188.42 3,856,545 2,129,480 5,986,025 46,065 32,987 23,091 13,078 130,113 65,221 St. Lukes Hospital DUVAL Active Yes Yes 1,212.18 2,583.23 2,630.15 2,630.15 121,886 4,171 126,057 90.03 119.94 121.93 121.93 28,696 1,908 30,604 197 127 89 70 2,126 959 St. Vincent's Hospital DUVAL Active Yes No 764.01 1,108.61 ‐ 1,108.61 1,135,662 ‐ 1,135,662 62.18 62.96 ‐ 62.96 11,955 ‐ 11,955 8,315 4,708 3,296 3,607 38,860 15,402 Memorial Medical Center DUVAL Active No No 791.60 ‐ 791.60 ‐ ‐ ‐ 51.41 51.41 ‐ 51.41 ‐ ‐ ‐ 10,445 5,883 4,118 4,562 38,925 15,347 Baptist Hospital of Beaches DUVAL Active No No 825.46 ‐ 825.46 ‐ ‐ ‐ 63.00 63.00 ‐ 63.00 ‐ ‐ ‐ 2,040 736 515 1,304 15,018 3,793 Genesis Rehabilitation Hospital DUVAL Active No No 645.22 ‐ 645.22 ‐ ‐ ‐ 54.94 54.94 ‐ 54.94 ‐ ‐ ‐ 3,460 2,857 2,000 603 17,636 10,194 Specialty Hospital ‐ Jacksonville DUVAL Active No No 685.76 ‐ 685.76 ‐ ‐ ‐ 16.16 16.16 ‐ 16.16 ‐ ‐ ‐ ‐ ‐ ‐ ‐ ‐ ‐ Baptist Hospital (Pensacola) ESCAMBIA Active Yes No 692.33 1,233.33 ‐ 1,233.33 3,679,042 ‐ 3,679,042 70.69 85.65 ‐ 85.65 743,124 ‐ 743,124 13,293 9,715 6,801 3,578 97,075 49,662 Sacred Heart Hospital ESCAMBIA Active Yes No 818.21 1,208.78 ‐ 1,208.78 6,022,449 ‐ 6,022,449 104.74 120.47 ‐ 120.47 881,121 ‐ 881,121 29,162 22,028 15,420 7,134 105,962 56,028 West Florida Regional Medical Center ESCAMBIA Active No No 694.74 ‐ 694.74 ‐ ‐ ‐ 59.35 59.35 ‐ 59.35 ‐ ‐ ‐ 5,489 3,754 2,628 1,735 25,110 12,021 Florida Hospital ‐ Flagler FLAGLER Active Yes Yes 1,252.23 1,252.23 1,517.30 1,517.30 ‐ 180,911 180,911 56.16 56.16 67.93 67.93 ‐ 174,147 174,147 1,489 975 683 514 32,281 14,796 George E. Weems Memorial Hospital FRANKLIN Active Yes Yes 1,874.33 1,874.33 2,271.09 2,271.09 ‐ 13,609 13,609 74.23 74.23 89.79 89.79 ‐ 60,911 60,911 60 49 34 11 6,849 3,915 Florida State Hospital‐Med GADSDEN Active No No 685.38 685.38 ‐ ‐ ‐ 16.16 16.16 ‐ 16.16 ‐ ‐ ‐ ‐ ‐ ‐ ‐ ‐ ‐ Florida Hospital Wauchula HARDEE Active Yes No 3,439.30 3,439.30 3,439.30 ‐ ‐ ‐ 80.48 80.48 97.35 97.35 ‐ 140,206 140,206 25 19 13 6 15,625 8,313 Hendry Regional Medical Center HENDRY Active Yes Yes 1,512.11 1,512.11 1,832.19 1,832.19 ‐ 66,097 66,097 93.05 93.05 107.66 107.66 ‐ 91,774 91,774 423 295 207 128 12,864 6,280 Spring Hill Regional Hospital HERNANDO Active Yes No 780.43 1,086.52 ‐ 1,086.52 870,765 ‐ 870,765 64.06 70.23 ‐ 70.23 94,751 ‐ 94,751 7,522 4,064 2,845 3,458 40,605 15,357 Healthsouth Hospital of Spring Hill HERNANDO Active No No 531.03 ‐ 531.03 ‐ ‐ ‐ 131.65 131.65 ‐ 131.65 ‐ ‐ ‐ 51 26 18 25 134 48 Oak Hill Community Hospital HERNANDO Active No No 602.05 ‐ 602.05 ‐ ‐ ‐ 59.63 59.63 ‐ 59.63 ‐ ‐ ‐ 1,829 941 659 888 7,481 2,694 Highlands Regional Medical Center HIGHLANDS Active No No 651.24 ‐ 651.24 ‐ ‐ ‐ 82.78 82.78 ‐ 82.78 ‐ ‐ ‐ 2,871 1,270 889 1,601 17,096 5,294 Florida Hospital Heartland Medical Center HIGHLANDS Active No No 790.48 ‐ 790.48 ‐ ‐ ‐ 94.93 94.93 ‐ 94.93 ‐ ‐ ‐ 5,474 3,011 2,108 2,463 25,058 9,648 University Community Hospital Carrollwood HILLSBOROUGH Active No No 904.97 ‐ 904.97 ‐ ‐ ‐ 82.96 82.96 ‐ 82.96 ‐ ‐ ‐ 748 406 284 342 11,444 4,348 St. Joseph's Hospital HILLSBOROUGH Active Yes Yes 904.65 1,285.49 1,557.59 1,557.59 6,955,548 4,969,553 11,925,100 113.21 113.21 136.93 136.93 ‐ 928,378 928,378 38,183 26,091 18,264 12,092 81,826 39,139 South Florida Baptist HILLSBOROUGH Active Yes No 752.10 1,106.84 ‐ 1,106.84 403,015 ‐ 403,015 62.99 66.17 ‐ 66.17 19,876 ‐ 19,876 3,416 1,623 1,136 1,793 18,780 6,246 Tampa General Hospital HILLSBOROUGH Active Yes Yes 977.48 1,711.45 2,073.74 2,073.74 15,457,041 7,629,646 23,086,687 131.39 168.70 204.05 204.05 967,275 916,461 1,883,735 49,491 30,085 21,060 19,406 60,926 25,925 University Community Hospital‐Tampa HILLSBOROUGH Active Yes No 872.34 1,142.27 ‐ 1,142.27 821,181 ‐ 821,181 74.08 89.46 ‐ 89.46 163,390 ‐ 163,390 7,867 4,346 3,042 3,521 27,472 10,624 Kindred Hospital Central Tampa HILLSBOROUGH Active No No 763.02 ‐ 763.02 ‐ ‐ ‐ 16.16 16.16 ‐ 16.16 ‐ ‐ ‐ ‐ ‐ ‐ ‐ ‐ ‐ Kindred Hospital (Tampa) HILLSBOROUGH Active No No 634.85 ‐ 634.85 ‐ ‐ ‐ 16.16 16.16 ‐ 16.16 ‐ ‐ ‐ 93 64 45 29 ‐ ‐ Memorial Hospital of Tampa HILLSBOROUGH Active No No 746.03 ‐ 746.03 ‐ ‐ ‐ 116.73 116.73 ‐ 116.73 ‐ ‐ ‐ 674 458 321 216 2,378 1,131 Brandon Regional Medical Center HILLSBOROUGH Active Yes No 779.52 1,249.98 ‐ 1,249.98 1,756,915 ‐ 1,756,915 80.52 80.52 ‐ 80.52 ‐ ‐ ‐ 11,326 5,335 3,735 5,991 32,556 10,735 Town and Country Hospital HILLSBOROUGH Active No No 961.54 ‐ 961.54 ‐ ‐ ‐ 70.55 70.55 ‐ 70.55 ‐ ‐ ‐ 1,059 738 517 321 9,568 4,667 South Bay Hospital HILLSBOROUGH Active No No 767.22 ‐ 767.22 ‐ ‐ ‐ 68.74 68.74 ‐ 68.74 ‐ ‐ ‐ 758 374 262 384 6,051 2,090 H L Moffitt Cancer Center HILLSBOROUGH Active Yes Yes 1,190.80 2,125.26 2,575.14 2,575.14 1,484,864 714,853 2,199,716 132.45 243.99 295.12 295.12 1,796,964 823,792 2,620,756 4,633 2,270 1,589 2,363 46,974 16,111 Doctors Memorial Hospital HOLMES Active Yes Yes 1,049.42 1,049.42 1,271.56 1,271.56 ‐ 85,991 85,991 148.56 148.56 179.69 179.69 ‐ 159,501 159,501 741 553 387 188 9,808 5,124 Indian River Memorial Hospital INDIAN RIVER Active No No 850.74 ‐ 850.74 ‐ ‐ ‐ 95.73 95.73 ‐ 95.73 ‐ ‐ ‐ 6,097 3,027 2,119 3,070 39,135 13,601 Sebastian Hospital INDIAN RIVER Active No No 729.86 ‐ 729.86 ‐ ‐ ‐ 77.30 77.30 ‐ 77.30 ‐ ‐ ‐ 640 481 337 159 12,121 6,377 HealthSouth Rehabilitation Hospital‐Treasure Coast INDIAN RIVER Active No No 461.90 ‐ 461.90 ‐ ‐ ‐ 49.06 49.06 ‐ 49.06 ‐ ‐ ‐ 373 321 225 52 2,831 1,705 Jackson Hospital JACKSON Active Yes Yes 1,195.37 1,195.37 1,448.40 1,448.40 ‐ 158,881 158,881 113.99 113.99 137.88 137.88 ‐ 155,114 155,114 2,241 897 628 1,344 23,174 6,493 Campbellton‐Graceville Hospital JACKSON Active Yes Yes 1,729.18 1,729.18 2,095.21 2,095.21 ‐ 3,587 3,587 106.10 106.10 128.34 128.34 ‐ 27,359 27,359 20 14 10 6 2,511 1,230 Leesburg Regional Medical Center LAKE Active No No 788.76 ‐ 788.76 ‐ ‐ ‐ 88.35 88.35 ‐ 88.35 ‐ ‐ ‐ 6,090 3,165 2,216 2,925 34,498 12,550 South Lake Memorial Hospital LAKE Active No No 920.72 ‐ 920.72 ‐ ‐ ‐ 103.68 103.68 ‐ 103.68 ‐ ‐ ‐ 2,071 938 657 1,133 17,770 5,634 Florida Hospital Waterman LAKE Active No No 840.52 ‐ 840.52 ‐ ‐ ‐ 78.67 78.67 ‐ 78.67 ‐ ‐ ‐ 4,100 1,741 1,219 2,359 21,933 6,519 Lee Memorial Hospital LEE Active Yes Yes 851.55 1,235.58 1,395.91 1,395.91 5,313,547 2,218,327 7,531,874 85.02 91.03 103.61 103.61 200,372 418,955 619,327 29,371 19,766 13,836 9,605 70,720 33,315 Lehigh Regional Medical Center LEE Active No No 904.17 ‐ 904.17 ‐ ‐ ‐ 51.39 51.39 ‐ 51.39 ‐ ‐ ‐ 1,424 879 615 545 28,978 12,521 Columbia Gulf Coast Hospital LEE Active Yes Yes 732.07 1,416.82 1,716.73 1,716.73 ‐ ‐ ‐ 59.99 99.55 120.41 120.41 ‐ ‐ ‐ ‐ ‐ ‐ ‐ ‐ ‐ Southwest Florida Regional Medical LEE Active Yes Yes 875.18 1,438.69 1,743.23 1,743.23 1,238,986 669,595 1,908,582 77.32 107.53 130.07 130.07 150,728 112,425 263,154 8,809 3,141 2,199 5,668 19,987 4,989 Cape Coral Hospital LEE Active Yes No 839.15 1,049.82 1,049.82 417,344 ‐ 417,344 55.77 56.47 68.30 68.30 6,023 102,356 108,379 6,187 2,830 1,981 3,357 27,014 8,650 Tallahassee Memorial Regional Medical Center LEON Active Yes No 771.67 ‐ 771.67 ‐ ‐ ‐ 98.58 110.13 ‐ 110.13 229,234 ‐ 229,234 15,729 10,402 7,281 5,327 42,873 19,847 Capital Regional Medical Center LEON Active No No 890.74 ‐ 890.74 ‐ ‐ ‐ 84.11 84.11 ‐ 84.11 ‐ ‐ ‐ 4,790 2,606 1,824 2,184 24,741 9,422 HealthSouth Rehabiliation Hospital‐Tallahassee LEON Active No No 477.11 ‐ 477.11 ‐ ‐ ‐ 59.27 59.27 ‐ 59.27 ‐ ‐ ‐ 347 293 205 54 388 229 Nature Coast Medical Center LEVY Active Yes Yes 680.97 680.97 825.12 825.12 ‐ 24,721 24,721 35.23 35.23 40.76 40.76 ‐ 23,778 23,778 269 245 172 24 6,741 4,298 Madison County Memorial Hospital MADISON Active Yes Yes 815.84 815.84 988.54 988.54 ‐ 6,044 6,044 52.50 52.50 60.75 60.75 ‐ 25,829 25,829 59 50 35 9 5,280 3,132 Manatee Memorial Hospital MANATEE Active Yes No 746.33 1,229.24 ‐ 1,229.24 1,656,056 ‐ 1,656,056 79.18 82.75 ‐ 82.75 34,177 ‐ 34,177 10,284 4,899 3,429 5,385 28,723 9,578 Lakewood Ranch Medical Center MANATEE Active No No 1,090.92 ‐ 1,090.92 ‐ ‐ ‐ 93.21 93.21 ‐ 93.21 ‐ ‐ ‐ 901 397 278 504 5,042 1,555 L.W. Blake Memorial Hospital MANATEE Active No No 726.09 ‐ 726.09 ‐ ‐ ‐ 62.68 62.68 ‐ 62.68 ‐ ‐ ‐ 1,610 984 689 626 12,315 5,269
IGT TAP meeting October 13, 2010
January 2011 42

Appendix D
Jan‐10 Jan‐10 Jan‐10 Jan‐10 Jan‐10 Jan‐10Exempt Buy‐Back Non‐Exempt Exempt Buy‐Back IP Exempt Non‐Exempt Exempt Buy‐Back OP Exempt 70% Out Patient MC OP
Hospitals County Status (Y/N) (Y/N) I/P Rate I/P Rate I/P Rate IP Rate Exempt Buy Back Total O/P Rate O/P Rate O/P Rate OP Rate Exempt Buy Back Total Total Days Man Days Man Days Vol Days Encounters EncountersMunroe Regional Medical Center MARION Active Yes Yes 839.92 1,602.58 1,941.82 1,941.82 2,835,359 1,261,174 4,096,534 83.67 90.23 109.14 109.14 157,112 452,862 609,973 10,989 5,311 3,718 5,678 70,789 23,949 Kindred Hospital Ocala MARION Active No No 792.81 ‐ 792.81 ‐ ‐ ‐ 16.16 16.16 ‐ 16.16 ‐ ‐ ‐ 42 40 28 2 ‐ ‐ Ocala Regional Medical Center MARION Active No No 708.21 ‐ 708.21 ‐ ‐ ‐ 79.33 79.33 ‐ 79.33 ‐ ‐ ‐ 5,018 3,107 2,175 1,911 33,263 14,417 Martin Memorial Hospital MARTIN Active No No 846.19 ‐ 846.19 ‐ ‐ ‐ 100.58 100.58 ‐ 100.58 ‐ ‐ ‐ 5,455 2,375 1,663 3,080 47,278 14,409 Lower Florida Keys Hospital MONROE Active Yes No 702.25 1,381.15 ‐ 1,381.15 1,197,102 ‐ 1,197,102 62.05 87.32 ‐ 87.32 190,696 ‐ 190,696 3,644 2,519 1,763 1,125 15,595 7,546 Fishermen's Hospital MONROE Active Yes Yes 2,677.13 2,677.13 3,243.83 3,243.83 ‐ 29,355 29,355 96.57 96.57 111.74 111.74 ‐ 34,184 34,184 126 74 52 52 5,482 2,254 Mariners Hospital MONROE Active Yes Yes 3,670.86 3,670.86 4,447.91 4,447.91 ‐ 66,360 66,360 233.90 233.90 282.92 282.92 ‐ 89,521 89,521 143 122 85 21 3,058 1,826 Baptist Medical Center ‐ Nassau NASSAU Active Yes Yes 2,273.57 2,273.57 2,743.24 2,743.24 ‐ 87,453 87,453 80.84 80.84 97.78 97.78 ‐ 30,406 30,406 878 266 186 612 8,463 1,795 North Okaloosa Medical Center OKALOOSA Active No No 821.99 ‐ 821.99 ‐ ‐ ‐ 88.35 88.35 ‐ 88.35 ‐ ‐ ‐ 2,478 1,608 1,126 870 31,328 14,230 Ft. Walton Beach Medical Center OKALOOSA Active No No 667.16 ‐ 667.16 ‐ ‐ ‐ 39.92 39.92 ‐ 39.92 ‐ ‐ ‐ 7,768 4,953 3,467 2,815 32,618 14,558 Columbia Twin Cities Hospital OKALOSSA Active No No 934.49 ‐ 934.49 ‐ ‐ ‐ 69.00 69.00 ‐ 69.00 ‐ ‐ ‐ 337 227 159 110 9,191 4,334 H.H. Raulerson OKEECHOBEE Active Yes Yes 1,228.00 1,228.00 1,487.94 1,487.94 ‐ 246,192 246,192 81.56 81.56 98.65 98.65 ‐ 220,246 220,246 1,881 1,353 947 528 25,592 12,886 Florida Hospital ORANGE Active Yes Yes 881.77 1,485.83 1,776.43 1,776.43 13,894,247 6,684,096 20,578,343 92.71 108.01 130.64 130.64 1,245,514 1,843,182 3,088,696 51,453 32,859 23,001 18,594 182,159 81,431 Orlando Regional Medical Center ORANGE Active Yes Yes 1,064.01 1,644.36 1,956.90 1,956.90 19,695,625 10,606,740 30,302,365 113.57 146.33 167.38 167.38 2,168,428 1,393,719 3,562,146 76,937 48,482 33,937 28,455 150,074 66,199 Health Central ORANGE Active Yes Yes 881.18 1,287.18 1,559.65 1,559.65 851,747 571,615 1,423,362 76.88 92.63 112.04 112.04 127,956 157,729 285,685 5,861 2,997 2,098 2,864 22,700 8,125 Select Specialty Hospital ‐ Orlando ORANGE Active No No 1,158.18 ‐ 1,158.18 ‐ ‐ ‐ 16.16 16.16 ‐ 16.16 ‐ ‐ ‐ 88 56 39 32 ‐ ‐ Columbia Medical Center‐Osceola OSCEOLA Active Yes No 800.64 1,293.53 ‐ 1,293.53 1,282,786 ‐ 1,282,786 83.27 102.29 ‐ 102.29 181,285 ‐ 181,285 9,052 3,718 2,603 5,334 33,146 9,530 St. Cloud Regional Center OSCEOLA Active No No 915.63 ‐ 915.63 ‐ ‐ ‐ 30.51 30.51 ‐ 30.51 ‐ ‐ ‐ 824 420 294 404 13,751 4,906 Bethesda Mem. Hosp. PALM BEACH Active Yes No 895.20 1,227.72 ‐ 1,227.72 2,157,470 ‐ 2,157,470 91.38 91.38 ‐ 91.38 ‐ ‐ ‐ 19,159 9,269 6,488 9,890 49,576 16,789 Boca Raton Community Hospital PALM BEACH Active No No 815.85 ‐ 815.85 ‐ ‐ ‐ 83.48 83.48 ‐ 83.48 ‐ ‐ ‐ 1,774 829 580 945 7,635 2,498 Glades General Hospital PALM BEACH Active Yes Yes 1,411.35 1,411.35 1,710.10 1,710.10 ‐ 472,628 472,628 67.69 67.69 78.32 78.32 ‐ 121,509 121,509 3,249 2,260 1,582 989 23,473 11,429 Columbia JFK Medical Center PALM BEACH Active Yes No 721.27 1,183.56 ‐ 1,183.56 2,096,963 ‐ 2,096,963 115.14 113.71 ‐ 115.14 ‐ ‐ ‐ 11,213 6,480 4,536 4,733 22,940 9,280 St. Mary's Hospital PALM BEACH Active Yes Yes 901.57 1,292.26 1,493.84 1,493.84 5,798,084 2,991,617 8,789,701 76.75 108.77 123.79 123.79 855,370 401,430 1,256,800 34,852 21,201 14,841 13,651 62,744 26,718 Good Samaritan Hospital PALM BEACH Active No No 901.59 ‐ 901.59 ‐ ‐ ‐ 92.00 92.00 ‐ 92.00 ‐ ‐ ‐ 3,166 1,408 986 1,758 16,691 5,196 Palm Beach Gardens Medical Center PALM BEACH Active No No 880.31 ‐ 880.31 ‐ ‐ ‐ 77.71 77.71 ‐ 77.71 ‐ ‐ ‐ 1,651 964 675 687 4,440 1,815 Wellington Regional Medical Center PALM BEACH Active Yes No 874.46 1,028.96 ‐ 1,028.96 396,478 ‐ 396,478 83.38 97.16 ‐ 97.16 91,304 ‐ 91,304 7,332 3,666 2,566 3,666 18,931 6,626 A.G. Holley State Hospital PALM BEACH Active Yes No 477.61 677.18 677.18 262,080 ‐ 262,080 16.16 16.16 16.16 16.16 ‐ ‐ ‐ 1,948 1,876 1,313 72 ‐ ‐ Delray Comm. Hospital PALM BEACH Active No No 697.62 ‐ 697.62 ‐ ‐ ‐ 86.52 86.52 ‐ 86.52 ‐ ‐ ‐ 3,906 2,081 1,457 1,825 7,173 2,675 West Boca Medical Center. PALM BEACH Active No No 907.71 ‐ 907.71 ‐ ‐ ‐ 80.04 80.04 ‐ 80.04 ‐ ‐ ‐ 5,704 3,102 2,171 2,602 17,765 6,763 Pinecrest Rehabilitation Hospital PALM BEACH Active No No 579.87 ‐ 579.87 ‐ ‐ ‐ 101.61 101.61 ‐ 101.61 ‐ ‐ ‐ ‐ ‐ ‐ ‐ ‐ ‐ Columbia Palms West Hospital PALM BEACH Active Yes No 815.09 1,333.21 ‐ 1,333.21 2,373,027 ‐ 2,373,027 66.73 109.15 ‐ 109.15 629,305 ‐ 629,305 9,510 6,543 4,580 2,967 30,800 14,834 Jupiter Hospital PALM BEACH Active No No 957.62 ‐ 957.62 ‐ ‐ ‐ 82.81 82.81 ‐ 82.81 ‐ ‐ ‐ 1,754 703 492 1,051 7,442 2,088 Columbia Hospital PALM BEACH Active Yes No 545.94 885.80 ‐ 885.80 579,059 ‐ 579,059 50.88 127.86 ‐ 127.86 182,421 ‐ 182,421 3,969 2,434 1,704 1,535 5,520 2,370 Florida Hospital Zephyrhills PASCO Active No No 805.88 ‐ 805.88 ‐ ‐ ‐ 70.53 70.53 ‐ 70.53 ‐ ‐ ‐ 2,683 1,164 815 1,519 18,593 5,647 North Bay Medical Center PASCO Active No No 808.70 ‐ 808.70 ‐ ‐ ‐ 80.21 80.21 ‐ 80.21 ‐ ‐ ‐ 1,203 772 540 431 9,269 4,164 Columbia New Port Richey Hospital PASCO Active Yes No 637.96 1,199.62 ‐ 1,199.62 835,082 ‐ 835,082 37.69 37.69 ‐ 37.69 ‐ ‐ ‐ 4,967 2,124 1,487 2,843 16,160 4,837 Pasco Community Hospital PASCO Active No No 864.21 ‐ 864.21 ‐ ‐ ‐ 73.62 73.62 ‐ 73.62 ‐ ‐ ‐ 1,221 504 353 717 12,312 3,557 Bayonet Point/Hudso PASCO Active No No 783.43 ‐ 783.43 ‐ ‐ ‐ 79.52 79.52 ‐ 79.52 ‐ ‐ ‐ 3,330 2,121 1,485 1,209 9,402 4,192 All Children's Hospital PINELLAS Active Yes Yes 1,494.48 1,966.88 2,383.23 2,383.23 11,089,023 9,773,317 20,862,340 138.08 164.62 199.12 199.12 2,100,898 2,731,009 4,831,907 35,908 33,534 23,474 2,374 121,091 79,160 Mease Hospital Clinic PINELLAS Active No No 838.80 ‐ 838.80 ‐ ‐ ‐ 87.73 87.73 ‐ 87.73 ‐ ‐ ‐ 1,787 1,148 804 639 6,943 3,122 Bayfront Medical Center PINELLAS Active Yes No 846.76 1,326.91 ‐ 1,326.91 2,603,463 ‐ 2,603,463 66.43 67.53 ‐ 67.53 13,974 ‐ 13,974 15,877 7,746 5,422 8,131 37,103 12,671 Morton F. Plant Hospital PINELLAS Active Yes No 589.17 1,760.29 ‐ 1,760.29 3,662,800 ‐ 3,662,800 86.50 146.51 ‐ 146.51 494,194 ‐ 494,194 9,739 4,468 3,128 5,271 25,645 8,236 Sun Coast Hospital PINELLAS Active Yes No 666.30 1,145.01 ‐ 1,145.01 ‐ ‐ ‐ 97.06 103.04 ‐ 103.04 ‐ ‐ ‐ ‐ ‐ ‐ ‐ ‐ ‐ Helen Ellis Memorial Hospital PINELLAS Active No No 807.23 ‐ 807.23 ‐ ‐ ‐ 95.64 95.64 ‐ 95.64 ‐ ‐ ‐ 1,205 385 270 820 12,886 2,882 HealthSouth Rehabilitation Hospital‐Largo PINELLAS Active No No 468.59 ‐ 468.59 ‐ ‐ ‐ 44.55 44.55 ‐ 44.55 ‐ ‐ ‐ 517 362 253 155 410 201 Edward White Hospital PINELLAS Active No No 868.43 ‐ 868.43 ‐ ‐ ‐ 90.24 90.24 ‐ 90.24 ‐ ‐ ‐ 1,119 822 575 297 3,303 1,698 Kindred Hospital‐St. Petersburg PINELLAS Active No No 639.19 ‐ 639.19 ‐ ‐ ‐ 16.16 16.16 ‐ 16.16 ‐ ‐ ‐ 45 45 32 ‐ ‐ ‐ Northside Hospital PINELLAS Active Yes no 594.06 1,302.65 ‐ 1,302.65 1,048,578 ‐ 1,048,578 80.25 83.77 ‐ 83.77 11,081 ‐ 11,081 3,373 2,114 1,480 1,259 7,185 3,152
IGT TAP meeting October 13, 2010
January 2011 43
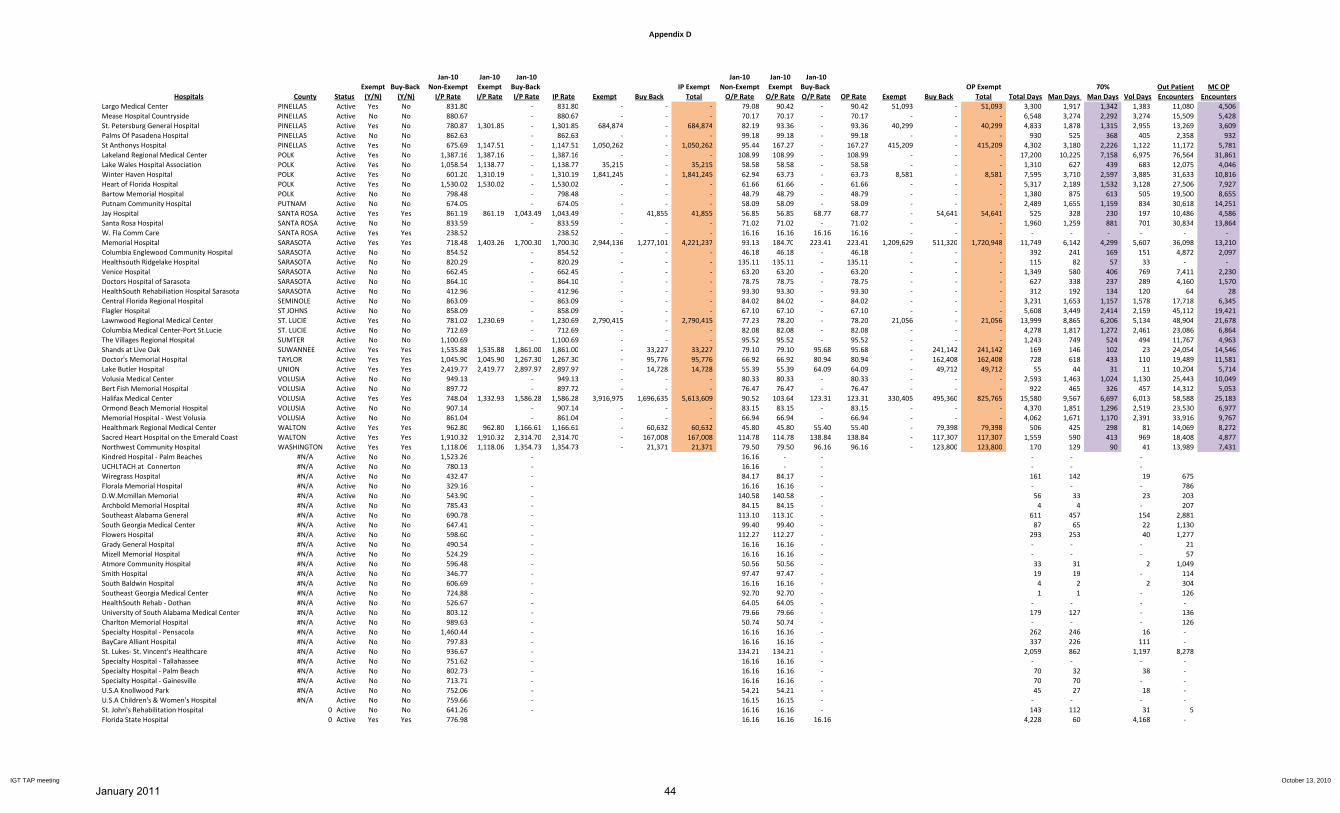
Appendix D
Jan‐10 Jan‐10 Jan‐10 Jan‐10 Jan‐10 Jan‐10Exempt Buy‐Back Non‐Exempt Exempt Buy‐Back IP Exempt Non‐Exempt Exempt Buy‐Back OP Exempt 70% Out Patient MC OP
Hospitals County Status (Y/N) (Y/N) I/P Rate I/P Rate I/P Rate IP Rate Exempt Buy Back Total O/P Rate O/P Rate O/P Rate OP Rate Exempt Buy Back Total Total Days Man Days Man Days Vol Days Encounters EncountersLargo Medical Center PINELLAS Active Yes No 831.80 ‐ 831.80 ‐ ‐ ‐ 79.08 90.42 ‐ 90.42 51,093 ‐ 51,093 3,300 1,917 1,342 1,383 11,080 4,506 Mease Hospital Countryside PINELLAS Active No No 880.67 ‐ 880.67 ‐ ‐ ‐ 70.17 70.17 ‐ 70.17 ‐ ‐ ‐ 6,548 3,274 2,292 3,274 15,509 5,428 St. Petersburg General Hospital PINELLAS Active Yes No 780.87 1,301.85 ‐ 1,301.85 684,874 ‐ 684,874 82.19 93.36 ‐ 93.36 40,299 ‐ 40,299 4,833 1,878 1,315 2,955 13,269 3,609 Palms Of Pasadena Hospital PINELLAS Active No No 862.63 ‐ 862.63 ‐ ‐ ‐ 99.18 99.18 ‐ 99.18 ‐ ‐ ‐ 930 525 368 405 2,358 932 St Anthonys Hospital PINELLAS Active Yes No 675.69 1,147.51 ‐ 1,147.51 1,050,262 ‐ 1,050,262 95.44 167.27 ‐ 167.27 415,209 ‐ 415,209 4,302 3,180 2,226 1,122 11,172 5,781 Lakeland Regional Medical Center POLK Active Yes No 1,387.16 1,387.16 ‐ 1,387.16 ‐ ‐ ‐ 108.99 108.99 ‐ 108.99 ‐ ‐ ‐ 17,200 10,225 7,158 6,975 76,564 31,861 Lake Wales Hospital Association POLK Active Yes No 1,058.54 1,138.77 ‐ 1,138.77 35,215 ‐ 35,215 58.58 58.58 ‐ 58.58 ‐ ‐ ‐ 1,310 627 439 683 12,075 4,046 Winter Haven Hospital POLK Active Yes No 601.20 1,310.19 ‐ 1,310.19 1,841,245 ‐ 1,841,245 62.94 63.73 ‐ 63.73 8,581 ‐ 8,581 7,595 3,710 2,597 3,885 31,633 10,816 Heart of Florida Hospital POLK Active Yes No 1,530.02 1,530.02 ‐ 1,530.02 ‐ ‐ ‐ 61.66 61.66 ‐ 61.66 ‐ ‐ ‐ 5,317 2,189 1,532 3,128 27,506 7,927 Bartow Memorial Hospital POLK Active No No 798.48 ‐ 798.48 ‐ ‐ ‐ 48.79 48.79 ‐ 48.79 ‐ ‐ ‐ 1,380 875 613 505 19,500 8,655 Putnam Community Hospital PUTNAM Active No No 674.05 ‐ 674.05 ‐ ‐ ‐ 58.09 58.09 ‐ 58.09 ‐ ‐ ‐ 2,489 1,655 1,159 834 30,618 14,251 Jay Hospital SANTA ROSA Active Yes Yes 861.19 861.19 1,043.49 1,043.49 ‐ 41,855 41,855 56.85 56.85 68.77 68.77 ‐ 54,641 54,641 525 328 230 197 10,486 4,586 Santa Rosa Hospital SANTA ROSA Active No No 833.59 ‐ 833.59 ‐ ‐ ‐ 71.02 71.02 ‐ 71.02 ‐ ‐ ‐ 1,960 1,259 881 701 30,834 13,864 W. Fla Comm Care SANTA ROSA Active Yes Yes 238.52 238.52 ‐ ‐ ‐ 16.16 16.16 16.16 16.16 ‐ ‐ ‐ ‐ ‐ ‐ ‐ ‐ ‐ Memorial Hospital SARASOTA Active Yes Yes 718.48 1,403.26 1,700.30 1,700.30 2,944,136 1,277,101 4,221,237 93.13 184.70 223.41 223.41 1,209,629 511,320 1,720,948 11,749 6,142 4,299 5,607 36,098 13,210 Columbia Englewood Community Hospital SARASOTA Active No No 854.52 ‐ 854.52 ‐ ‐ ‐ 46.18 46.18 ‐ 46.18 ‐ ‐ ‐ 392 241 169 151 4,872 2,097 Healthsouth Ridgelake Hospital SARASOTA Active No No 820.29 ‐ 820.29 ‐ ‐ ‐ 135.11 135.11 ‐ 135.11 ‐ ‐ ‐ 115 82 57 33 ‐ ‐ Venice Hospital SARASOTA Active No No 662.45 ‐ 662.45 ‐ ‐ ‐ 63.20 63.20 ‐ 63.20 ‐ ‐ ‐ 1,349 580 406 769 7,411 2,230 Doctors Hospital of Sarasota SARASOTA Active No No 864.10 ‐ 864.10 ‐ ‐ ‐ 78.75 78.75 ‐ 78.75 ‐ ‐ ‐ 627 338 237 289 4,160 1,570 HealthSouth Rehabiliation Hospital Sarasota SARASOTA Active No No 412.96 ‐ 412.96 ‐ ‐ ‐ 93.30 93.30 ‐ 93.30 ‐ ‐ ‐ 312 192 134 120 64 28 Central Florida Regional Hospital SEMINOLE Active No No 863.09 ‐ 863.09 ‐ ‐ ‐ 84.02 84.02 ‐ 84.02 ‐ ‐ ‐ 3,231 1,653 1,157 1,578 17,718 6,345 Flagler Hospital ST JOHNS Active No No 858.09 ‐ 858.09 ‐ ‐ ‐ 67.10 67.10 ‐ 67.10 ‐ ‐ ‐ 5,608 3,449 2,414 2,159 45,112 19,421 Lawnwood Regional Medical Center ST. LUCIE Active Yes No 781.02 1,230.69 ‐ 1,230.69 2,790,415 ‐ 2,790,415 77.23 78.20 ‐ 78.20 21,056 ‐ 21,056 13,999 8,865 6,206 5,134 48,904 21,678 Columbia Medical Center‐Port St.Lucie ST. LUCIE Active No No 712.69 ‐ 712.69 ‐ ‐ ‐ 82.08 82.08 ‐ 82.08 ‐ ‐ ‐ 4,278 1,817 1,272 2,461 23,086 6,864 The Villages Regional Hospital SUMTER Active No No 1,100.69 ‐ 1,100.69 ‐ ‐ ‐ 95.52 95.52 ‐ 95.52 ‐ ‐ ‐ 1,243 749 524 494 11,767 4,963 Shands at Live Oak SUWANNEE Active Yes Yes 1,535.88 1,535.88 1,861.00 1,861.00 ‐ 33,227 33,227 79.10 79.10 95.68 95.68 ‐ 241,142 241,142 169 146 102 23 24,054 14,546 Doctor's Memorial Hospital TAYLOR Active Yes Yes 1,045.90 1,045.90 1,267.30 1,267.30 ‐ 95,776 95,776 66.92 66.92 80.94 80.94 ‐ 162,408 162,408 728 618 433 110 19,489 11,581 Lake Butler Hospital UNION Active Yes Yes 2,419.77 2,419.77 2,897.97 2,897.97 ‐ 14,728 14,728 55.39 55.39 64.09 64.09 ‐ 49,712 49,712 55 44 31 11 10,204 5,714 Volusia Medical Center VOLUSIA Active No No 949.13 ‐ 949.13 ‐ ‐ ‐ 80.33 80.33 ‐ 80.33 ‐ ‐ ‐ 2,593 1,463 1,024 1,130 25,443 10,049 Bert Fish Memorial Hospital VOLUSIA Active No No 897.72 ‐ 897.72 ‐ ‐ ‐ 76.47 76.47 ‐ 76.47 ‐ ‐ ‐ 922 465 326 457 14,312 5,053 Halifax Medical Center VOLUSIA Active Yes Yes 748.04 1,332.93 1,586.28 1,586.28 3,916,975 1,696,635 5,613,609 90.52 103.64 123.31 123.31 330,405 495,360 825,765 15,580 9,567 6,697 6,013 58,588 25,183 Ormond Beach Memorial Hospital VOLUSIA Active No No 907.14 ‐ 907.14 ‐ ‐ ‐ 83.15 83.15 ‐ 83.15 ‐ ‐ ‐ 4,370 1,851 1,296 2,519 23,530 6,977 Memorial Hospital ‐ West Volusia VOLUSIA Active No No 861.04 ‐ 861.04 ‐ ‐ ‐ 66.94 66.94 ‐ 66.94 ‐ ‐ ‐ 4,062 1,671 1,170 2,391 33,916 9,767 Healthmark Regional Medical Center WALTON Active Yes Yes 962.80 962.80 1,166.61 1,166.61 ‐ 60,632 60,632 45.80 45.80 55.40 55.40 ‐ 79,398 79,398 506 425 298 81 14,069 8,272 Sacred Heart Hospital on the Emerald Coast WALTON Active Yes Yes 1,910.32 1,910.32 2,314.70 2,314.70 ‐ 167,008 167,008 114.78 114.78 138.84 138.84 ‐ 117,307 117,307 1,559 590 413 969 18,408 4,877 Northwest Community Hospital WASHINGTON Active Yes Yes 1,118.06 1,118.06 1,354.73 1,354.73 ‐ 21,371 21,371 79.50 79.50 96.16 96.16 ‐ 123,800 123,800 170 129 90 41 13,989 7,431 Kindred Hospital ‐ Palm Beaches #N/A Active No No 1,523.26 ‐ 16.16 ‐ ‐ ‐ ‐ ‐ UCHLTACH at Connerton #N/A Active No No 780.13 ‐ 16.16 ‐ ‐ ‐ ‐ ‐ Wiregrass Hospital #N/A Active No No 432.47 ‐ 84.17 84.17 ‐ 161 142 19 675 Florala Memorial Hospital #N/A Active No No 329.16 ‐ 16.16 16.16 ‐ ‐ ‐ ‐ 786 D.W.Mcmillan Memorial #N/A Active No No 543.90 ‐ 140.58 140.58 ‐ 56 33 23 203 Archbold Memorial Hospital #N/A Active No No 785.43 ‐ 84.15 84.15 ‐ 4 4 ‐ 207 Southeast Alabama General #N/A Active No No 690.78 ‐ 113.10 113.10 ‐ 611 457 154 2,881 South Georgia Medical Center #N/A Active No No 647.41 ‐ 99.40 99.40 ‐ 87 65 22 1,130 Flowers Hospital #N/A Active No No 598.60 ‐ 112.27 112.27 ‐ 293 253 40 1,277 Grady General Hospital #N/A Active No No 490.54 ‐ 16.16 16.16 ‐ ‐ ‐ ‐ 21 Mizell Memorial Hospital #N/A Active No No 524.29 ‐ 16.16 16.16 ‐ ‐ ‐ ‐ 57 Atmore Community Hospital #N/A Active No No 596.48 ‐ 50.56 50.56 ‐ 33 31 2 1,049 Smith Hospital #N/A Active No No 346.77 ‐ 97.47 97.47 ‐ 19 19 ‐ 114 South Baldwin Hospital #N/A Active No No 606.69 ‐ 16.16 16.16 ‐ 4 2 2 304 Southeast Georgia Medical Center #N/A Active No No 724.88 ‐ 92.70 92.70 ‐ 1 1 ‐ 126 HealthSouth Rehab ‐ Dothan #N/A Active No No 526.67 ‐ 64.05 64.05 ‐ ‐ ‐ ‐ ‐ University of South Alabama Medical Center #N/A Active No No 803.12 ‐ 79.66 79.66 ‐ 179 127 ‐ 136 Charlton Memorial Hospital #N/A Active No No 989.63 ‐ 50.74 50.74 ‐ ‐ ‐ ‐ 126 Specialty Hospital ‐ Pensacola #N/A Active No No 1,460.44 ‐ 16.16 16.16 ‐ 262 246 16 ‐ BayCare Alliant Hospital #N/A Active No No 797.83 ‐ 16.16 16.16 ‐ 337 226 111 ‐ St. Lukes‐ St. Vincent's Healthcare #N/A Active No No 936.67 ‐ 134.21 134.21 ‐ 2,059 862 1,197 8,278 Specialty Hospital ‐ Tallahassee #N/A Active No No 751.62 ‐ 16.16 16.16 ‐ ‐ ‐ ‐ ‐ Specialty Hospital ‐ Palm Beach #N/A Active No No 802.73 ‐ 16.16 16.16 ‐ 70 32 38 ‐ Specialty Hospital ‐ Gainesville #N/A Active No No 713.71 ‐ 16.16 16.16 ‐ 70 70 ‐ ‐ U.S.A Knollwood Park #N/A Active No No 752.06 ‐ 54.21 54.21 ‐ 45 27 18 ‐ U.S.A Children's & Women's Hospital #N/A Active No No 759.66 ‐ 16.15 16.15 ‐ ‐ ‐ ‐ ‐ St. John's Rehabilitation Hospital 0 Active No No 641.26 ‐ 16.16 16.16 ‐ 143 112 31 5 Florida State Hospital 0 Active Yes Yes 776.98 16.16 16.16 16.16 4,228 60 4,168 ‐
IGT TAP meeting October 13, 2010
January 2011 44

Appendix D
Provider Name CountyIGTs for SWI &
DSH PMA Tax
Exemptions & Liver Global Fee
IGTs TOTAL LIP &
Exemption IGTs Total All IGTs
State Only Funds, Direct
AllocationTotal ALL LIP PAYMENTS DSH Payments
Exemptions & Liver Global Fee
Medicaid Trend Adjustment Restoration Total All Payments
ORIGINAL Projected Net Payments SFY
0910 PROJECTED Nets
AG HOLLEY PALM BEACH 145,889 145,889 398,345 145,889 ALL CHILDREN'S HOSPITAL PINELLAS 7,847,990 420,395 25,908,513 8,305,837 42,482,735 37,109,388 42,482,735 ANN BATES LEACH EYE HOSPITAL DADE 62,841 3,093,315 3,156,156 1,257,891 3,156,156 AVENTURA HOSPITAL & MEDICAL CEN DADE 285,648 285,648 174,482 285,648 BAPTIST MEDICAL CENTER - BEACHES DUVAL 126,091 126,091 77,020 126,091 BAPTIST HOSPITAL OF MIAMI DADE 989,039 20,864,291 21,853,330 604,132 21,853,330 BAPTIST HOSPITAL OF PENSACOLA ESCAMBIA 1,177,554 6,476,216 1,334,217 8,987,987 7,451,385 8,987,987 BAPTIST MEDICAL CENTER DUVAL 1,354,214 9,925,199 11,279,413 11,360,843 11,279,413 BAPTIST MEDICAL CENTER - NASSAU NASSAU 248,152 244,556 529,853 1,022,562 719,692 1,022,562 BARTOW REGIONAL MEDICAL CENTER POLK 133,974 133,974 81,835 133,974 BAY MEDICAL CENTER BAY 5,800,000 4,722,360 4,722,360 6,695,705 4,091,985 5,091,138 15,878,828 10,352,490 11,156,468 BAYFRONT MEDICAL CENTER PINELLAS 562,377 4,598,679 9,379,928 9,942,305 11,947,134 1,650,000 7,597,168 1,807,668 23,001,970 11,179,936 13,059,665 BERT FISH MEDICAL CENTER VOLUSIA 105,719 105,719 64,576 105,719 BETHESDA HEALTHCARE SYSTEM PALM BEACH 1,135,077 922,916 922,916 2,162,556 5,556,633 7,719,189 7,969,873 6,796,273 BLAKE MEDICAL CENTER MANATEE - - BOCA RATON COMMUNITY HOSPITAL PALM BEACH - - BRANDON REGIONAL HOSPITAL HILLSBOROUGH 973,013 5,413,516 6,386,529 337,928 6,386,529 BROOKS REHABILITATION HOSPITAL DUVAL - - BROOKSVILLE REGIONAL HOSPITAL HERNANDO 569,307 2,252,150 2,821,457 1,089,817 2,821,457 BROWARD HEALTH - BROWARD GENERAL MEDICAL CENTER BROWARD 18,304,412 24,293,183 69,524,862 87,829,274 90,598,796 26,168,701 18,329,856 3,455,879 138,553,233 51,697,936 50,723,959 CALHOUN LIBERTY HOSPITAL CALHOUN 184,124 439,125 71,105 694,354 539,323 694,354 CAMPBELLTON-GRACEVILLE HOSPITAL JACKSON 180,163 508,962 61,647 750,772 608,487 750,772 CAPE CANAVERAL HOSPITAL BREVARD 100,917 100,917 61,643 100,917 CAPE CORAL HOSPITAL LEE 910,758 910,758 504,967 1,678,139 2,183,106 237,106 1,272,348 UNIVERSITY OF MIAMI HOSPITAL DADE 449,290 16,320 4,870,623 5,336,233 6,431,811 5,336,233 CENTRAL FLORIDA REGIONAL HOSPITAL SEMINOLE 175,237 175,237 107,040 175,237 CHARLOTTE REGIONAL MEDICAL CENTER CHARLOTTE - - CITRUS MEMORIAL HEALTH SYSTEM CITRUS 3,099,963 6,127,800 6,127,800 7,178,283 707,715 7,885,998 1,224,106 1,758,199 CLEARWATER COMMUNITY HOSPITAL PINELLAS - - CLEVELAND CLINIC FLORIDA WESTON BROWARD - - COLUMBIA HOSPITAL PALM BEACH 314,026 461,832 461,832 1,049,794 1,589,733 2,639,527 2,110,685 2,177,694 COMMUNITY HOSPITAL PASCO 238,354 238,354 145,593 238,354 CORAL GABLES HOSPITAL DADE 90,578 1,303,621 1,394,199 1,926,331 1,394,199 BROWARD HEALTH - CORAL SPRINGS MEDICAL CENTER BROWARD 1,246,769 3,048,451 7,803,402 9,050,170 9,256,380 2,297,264 1,362,999 12,916,642 3,177,825 3,866,472 PASCO REGIONAL MEDICAL CENTER PASCO 56,721 56,721 34,647 56,721 ATLANTIC MEDICAL CENTER VOLUSIA - - JACKSON SOUTH COMMUNITY HOSPITAL DADE - - DELRAY MEDICAL CENTER PALM BEACH 285,614 3,664,536 3,664,536 4,680,225 241,020 4,921,245 525,174 1,256,710 DESOTO MEMORIAL HOSPITAL DESOTO 435,088 349,913 991,443 1,776,444 1,274,173 1,776,444 DOCTORS' HOSPITAL - CORAL GABLES DADE - - DOCTORS HOSPITAL OF SARASOTA SARASOTA - - DOCTORS MEMORIAL HOSPITAL HOLMES 252,791 390,381 371,542 1,014,714 850,576 1,014,714 DOCTORS MEMORIAL HOSPITAL TAYLOR 427,067 365,850 463,729 1,256,647 967,909 1,256,647 MIAMI JEWISH HOME & HOSPITAL DADE - - ED FRASER MEMORIAL HOSPITAL BAKER 1,213,508 3,964,505 155,589 5,333,602 3,425,332 5,333,602 EDWARD WHITE HOSPITAL PINELLAS 65,822 65,822 40,206 65,822
IGTs Provider Access System Distributions
for SFY 2010-2011
Anticipated IGTs and payments by providerAnticipated Net Payments for LIP, DSH, and Exemption IGTs
IGT TAP, September 22, 2010 Appendix D - IGT 1 6 11January 2011 45

Appendix D
Provider Name CountyIGTs for SWI &
DSH PMA Tax
Exemptions & Liver Global Fee
IGTs TOTAL LIP &
Exemption IGTs Total All IGTs
State Only Funds, Direct
AllocationTotal ALL LIP PAYMENTS DSH Payments
Exemptions & Liver Global Fee
Medicaid Trend Adjustment Restoration Total All Payments
ORIGINAL Projected Net Payments SFY
0910 PROJECTED Nets
IGTs Provider Access System Distributions
for SFY 2010-2011
Anticipated IGTs and payments by providerAnticipated Net Payments for LIP, DSH, and Exemption IGTs
HEALTHSOUTH EMERALD COAST REHABILITATION HOSPITAL BAY - - ENGLEWOOD COMMUNITY HOSPITAL SARASOTA - - EVERGLADES REGIONAL MEDICAL CENTER PALM BEACH - - FAWCETT MEMORIAL HOSPITAL CHARLOTTE - - FISHERMEN'S HOSPITAL MONROE 192,473 449,100 110,330 751,903 551,687 751,903 FLAGLER HOSPITAL ST JOHNS 146,865 290,314 290,314 606,336 606,336 220,628 316,022 FLORIDA HOSPITAL ORANGE 2,689,475 3,769,189 3,769,189 7,843,024 1,650,000 35,455,052 7,569,343 52,517,418 42,130,767 48,748,230 FLORIDA HOSPITAL HEARTLAND MED. CTR. HIGHLANDS 219,058 219,058 133,806 219,058 FLORIDA HOSPITAL - WAUCHULA HARDEE 224,019 378,012 227,323 829,355 744,291 829,355 FLORIDA HOSPITAL FLAGLER FLAGLER 305,508 393,252 698,760 768,103 698,760 FLORIDA HOSPITAL WATERMAN LAKE 2,250,724 5,212,962 5,212,962 6,232,394 6,232,394 1,118,184 1,019,431 FLORIDA HOSPITAL ZEPHYRHILLS PASCO 201,147 201,147 122,866 201,147 FLORIDA MEDICAL CENTER BROWARD 146,954 - FLORIDA MEDICAL CENTER SOUTH BROWARD - - FLORIDA STATE HOSPITAL 1,090,789 1,090,789 1,033,554 1,090,789 FLORIDA STATE HOSPITAL - MED SURG. GADSDEN 3,902 3,902 10,179 3,902 FORT WALTON BEACH MEDICAL CENTER OKALOOSA 247,400 247,400 151,119 247,400 G. PIERCE WOOD HOSPITAL DESOTO - - GADSDEN COMMUNITY HOSPITAL GADSDEN - - BROOKS HEALTH SYSTEM DUVAL - - GEORGE E. WEEMS MEMORIAL HOSPITAL FRANKLIN 214,693 512,766 94,178 821,637 680,575 821,637 GLADES GENERAL HOSPITAL PALM BEACH 979,444 2,153,980 2,153,980 2,989,850 907,507 1,071,326 4,968,683 2,346,205 2,814,703 PARKWAY REGIONAL MEDICAL CENTER WEST DADE - - GOOD SAMARITAN MEDICAL CENTER PALM BEACH 562,110 640,931 640,931 904,267 904,267 274,333 263,335 GULF COAST MEDICAL CENTER BAY 223,944 4,952,334 5,176,278 5,186,900 5,176,278 GULF COAST HOSPITAL - FT. MYERS LEE 243,023 243,023 290,890 447,788 3,236,649 3,975,327 3,460,972 3,732,304 GULF PINES HOSPITAL GULF - - H. LEE MOFFIT CANCER CENTER HILLSBOROUGH 249,781 4,139,275 4,389,056 3,764,480 4,389,056 H.H. RAULERSON OKEECHOBEE 307,080 465,278 784,516 1,556,874 282,936 1,556,874 HALIFAX HEALTH VOLUSIA 4,387,288 11,823,473 24,377,176 28,764,464 29,001,390 8,294,342 9,156,834 1,603,264 48,055,830 17,473,556 19,291,365 HEALTH CENTRAL ORANGE 2,570,558 2,092,949 2,092,949 3,021,453 2,590,141 2,129,383 7,740,977 3,484,506 5,648,028 HEALTHMARK REGIONAL MEDICAL CENTER WALTON 187,413 357,394 199,218 744,025 550,800 744,025 HEALTHSOUTH REHAB HOSPITAL OF MIAMI DADE - - LARKIN COMMUNITY HOSPITAL DADE 100,599 1,440,331 1,540,930 108,508 1,540,930 HEALTHSOUTH REHAB HOSPITAL - TALLAHASSEE LEON 38,231 38,231 23,352 38,231 HEALTHSOUTH REHAB OF SPRING HILL HERNANDO - - HEALTHSOUTH REHAB. HOSPITAL - LARGO PINELLAS - - HEALTHSOUTH SEA PINES REHABILITATION HOSPITAL BREVARD - - HEALTHSOUTH SUNRISE REHAB. HOSPITAL BROWARD - - HEALTHSOUTH REHAB. HOSPITAL TREAS COAST INDIAN RIVER - - HEALTHSOUTH REHAB. INSTITUTE - SARASOTA SARASOTA - - HEALTHSOUTH RIDGELAKE HOSPITAL SARASOTA - - HEART OF FLORIDA REGIONAL MEDICAL CENTER POLK 265,274 3,391,800 3,657,074 162,037 3,657,074 HELEN ELLIS MEMORIAL HOSPITAL PINELLAS 94,518 94,518 57,734 94,518 HENDRY REGIONAL MEDICAL CENTER HENDRY 228,376 536,945 246,579 1,011,900 683,428 1,011,900 HIALEAH HOSPITAL DADE 351,151 9,001 7,890,891 8,251,043 10,168,670 8,251,043
IGT TAP, September 22, 2010 Appendix D - IGT 1 6 11January 2011 46
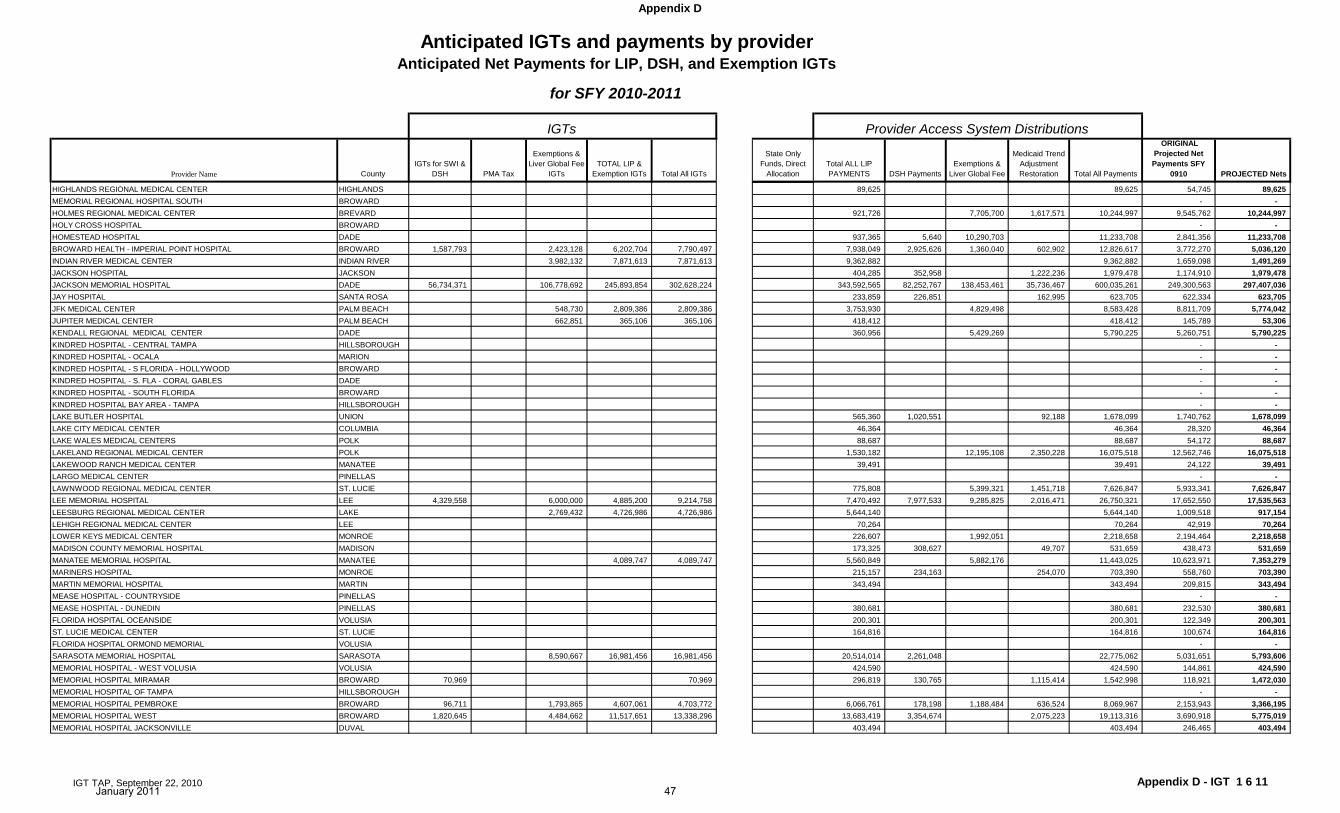
Appendix D
Provider Name CountyIGTs for SWI &
DSH PMA Tax
Exemptions & Liver Global Fee
IGTs TOTAL LIP &
Exemption IGTs Total All IGTs
State Only Funds, Direct
AllocationTotal ALL LIP PAYMENTS DSH Payments
Exemptions & Liver Global Fee
Medicaid Trend Adjustment Restoration Total All Payments
ORIGINAL Projected Net Payments SFY
0910 PROJECTED Nets
IGTs Provider Access System Distributions
for SFY 2010-2011
Anticipated IGTs and payments by providerAnticipated Net Payments for LIP, DSH, and Exemption IGTs
HIGHLANDS REGIONAL MEDICAL CENTER HIGHLANDS 89,625 89,625 54,745 89,625 MEMORIAL REGIONAL HOSPITAL SOUTH BROWARD - - HOLMES REGIONAL MEDICAL CENTER BREVARD 921,726 7,705,700 1,617,571 10,244,997 9,545,762 10,244,997 HOLY CROSS HOSPITAL BROWARD - - HOMESTEAD HOSPITAL DADE 937,365 5,640 10,290,703 11,233,708 2,841,356 11,233,708 BROWARD HEALTH - IMPERIAL POINT HOSPITAL BROWARD 1,587,793 2,423,128 6,202,704 7,790,497 7,938,049 2,925,626 1,360,040 602,902 12,826,617 3,772,270 5,036,120 INDIAN RIVER MEDICAL CENTER INDIAN RIVER 3,982,132 7,871,613 7,871,613 9,362,882 9,362,882 1,659,098 1,491,269 JACKSON HOSPITAL JACKSON 404,285 352,958 1,222,236 1,979,478 1,174,910 1,979,478 JACKSON MEMORIAL HOSPITAL DADE 56,734,371 106,778,692 245,893,854 302,628,224 343,592,565 82,252,767 138,453,461 35,736,467 600,035,261 249,300,563 297,407,036 JAY HOSPITAL SANTA ROSA 233,859 226,851 162,995 623,705 622,334 623,705 JFK MEDICAL CENTER PALM BEACH 548,730 2,809,386 2,809,386 3,753,930 4,829,498 8,583,428 8,811,709 5,774,042 JUPITER MEDICAL CENTER PALM BEACH 662,851 365,106 365,106 418,412 418,412 145,789 53,306 KENDALL REGIONAL MEDICAL CENTER DADE 360,956 5,429,269 5,790,225 5,260,751 5,790,225 KINDRED HOSPITAL - CENTRAL TAMPA HILLSBOROUGH - - KINDRED HOSPITAL - OCALA MARION - - KINDRED HOSPITAL - S FLORIDA - HOLLYWOOD BROWARD - - KINDRED HOSPITAL - S. FLA - CORAL GABLES DADE - - KINDRED HOSPITAL - SOUTH FLORIDA BROWARD - - KINDRED HOSPITAL BAY AREA - TAMPA HILLSBOROUGH - - LAKE BUTLER HOSPITAL UNION 565,360 1,020,551 92,188 1,678,099 1,740,762 1,678,099 LAKE CITY MEDICAL CENTER COLUMBIA 46,364 46,364 28,320 46,364 LAKE WALES MEDICAL CENTERS POLK 88,687 88,687 54,172 88,687 LAKELAND REGIONAL MEDICAL CENTER POLK 1,530,182 12,195,108 2,350,228 16,075,518 12,562,746 16,075,518 LAKEWOOD RANCH MEDICAL CENTER MANATEE 39,491 39,491 24,122 39,491 LARGO MEDICAL CENTER PINELLAS - - LAWNWOOD REGIONAL MEDICAL CENTER ST. LUCIE 775,808 5,399,321 1,451,718 7,626,847 5,933,341 7,626,847 LEE MEMORIAL HOSPITAL LEE 4,329,558 6,000,000 4,885,200 9,214,758 7,470,492 7,977,533 9,285,825 2,016,471 26,750,321 17,652,550 17,535,563 LEESBURG REGIONAL MEDICAL CENTER LAKE 2,769,432 4,726,986 4,726,986 5,644,140 5,644,140 1,009,518 917,154 LEHIGH REGIONAL MEDICAL CENTER LEE 70,264 70,264 42,919 70,264 LOWER KEYS MEDICAL CENTER MONROE 226,607 1,992,051 2,218,658 2,194,464 2,218,658 MADISON COUNTY MEMORIAL HOSPITAL MADISON 173,325 308,627 49,707 531,659 438,473 531,659 MANATEE MEMORIAL HOSPITAL MANATEE 4,089,747 4,089,747 5,560,849 5,882,176 11,443,025 10,623,971 7,353,279 MARINERS HOSPITAL MONROE 215,157 234,163 254,070 703,390 558,760 703,390 MARTIN MEMORIAL HOSPITAL MARTIN 343,494 343,494 209,815 343,494 MEASE HOSPITAL - COUNTRYSIDE PINELLAS - - MEASE HOSPITAL - DUNEDIN PINELLAS 380,681 380,681 232,530 380,681 FLORIDA HOSPITAL OCEANSIDE VOLUSIA 200,301 200,301 122,349 200,301 ST. LUCIE MEDICAL CENTER ST. LUCIE 164,816 164,816 100,674 164,816 FLORIDA HOSPITAL ORMOND MEMORIAL VOLUSIA - - SARASOTA MEMORIAL HOSPITAL SARASOTA 8,590,667 16,981,456 16,981,456 20,514,014 2,261,048 22,775,062 5,031,651 5,793,606 MEMORIAL HOSPITAL - WEST VOLUSIA VOLUSIA 424,590 424,590 144,861 424,590 MEMORIAL HOSPITAL MIRAMAR BROWARD 70,969 70,969 296,819 130,765 1,115,414 1,542,998 118,921 1,472,030 MEMORIAL HOSPITAL OF TAMPA HILLSBOROUGH - - MEMORIAL HOSPITAL PEMBROKE BROWARD 96,711 1,793,865 4,607,061 4,703,772 6,066,761 178,198 1,188,484 636,524 8,069,967 2,153,943 3,366,195 MEMORIAL HOSPITAL WEST BROWARD 1,820,645 4,484,662 11,517,651 13,338,296 13,683,419 3,354,674 2,075,223 19,113,316 3,690,918 5,775,019 MEMORIAL HOSPITAL JACKSONVILLE DUVAL 403,494 403,494 246,465 403,494
IGT TAP, September 22, 2010 Appendix D - IGT 1 6 11January 2011 47

Appendix D
Provider Name CountyIGTs for SWI &
DSH PMA Tax
Exemptions & Liver Global Fee
IGTs TOTAL LIP &
Exemption IGTs Total All IGTs
State Only Funds, Direct
AllocationTotal ALL LIP PAYMENTS DSH Payments
Exemptions & Liver Global Fee
Medicaid Trend Adjustment Restoration Total All Payments
ORIGINAL Projected Net Payments SFY
0910 PROJECTED Nets
IGTs Provider Access System Distributions
for SFY 2010-2011
Anticipated IGTs and payments by providerAnticipated Net Payments for LIP, DSH, and Exemption IGTs
MEMORIAL REGIONAL HOSPITAL BROWARD 13,067,874 31,049,190 44,747,728 57,815,602 58,737,192 18,990,933 22,449,275 6,213,877 106,391,277 41,094,767 48,575,675 MERCY HOSPITAL DADE - - METHODIST MEDICAL CENTER DUVAL - - MIAMI CHILDRENS HOSPITAL DADE 7,383,401 423,486 20,652,143 8,055,450 36,514,481 43,973,239 36,514,481 Mt. SINAI MEDICAL CENTER & MIAMI HEART INSTITUTE DADE - - MORTON F. PLANT HOSPITAL PINELLAS 562,377 2,299,339 4,689,962 5,252,339 5,870,934 1,650,000 11,729,496 19,250,430 11,035,856 13,998,090 MT. SINAI MEDICAL CENTER DADE 7,063,801 4,801,810 5,827,045 1,302,514 18,995,170 17,453,406 18,995,170 MUNROE REGIONAL MEDICAL CENTER MARION 1,129,937 910,970 1,752,668 2,882,605 2,446,904 2,536,334 4,983,238 674,772 2,100,634 N.E. FLORIDA STATE HOSPITAL BAKER 892,618 892,618 949,853 892,618 NCH DOWNTOWN NAPLES HOSPITAL COLLIER 923,974 10,227,499 11,151,473 623,232 11,151,473 NATURE COAST REGIONAL HEALTH NETWORK LEVY 217,257 256,528 66,334 540,119 619,630 540,119 MORTON PLANT NORTH BAY HOSPITAL PASCO 124,521 124,521 76,061 124,521 BROWARD HEALTH - NORTH BROWARD MEDICAL CENTER BROWARD 5,456,691 6,748,839 16,006,977 21,463,669 19,478,426 10,054,359 3,466,824 1,090,838 34,090,447 11,943,154 12,626,778 NORTH DADE HEALTH CENTER (JMH) DADE - - NORTH FLORIDA REGIONAL MEDICAL CENTER ALACHUA 219,323 219,323 133,968 219,323 NORTH OKALOOSA MEDICAL CENTER OKALOOSA 102,837 102,837 62,816 102,837 NORTH SHORE MEDICAL CENTER DADE 596,781 11,619 10,432,181 11,040,581 10,759,180 11,040,581 NORTH RIDGE MEDICAL CENTER BROWARD - - NORTHSIDE HOSPITAL & HEART INST. PINELLAS 245,706 2,874,442 3,120,148 2,539,889 3,120,148 NORTHWEST FLORIDA COMMUNITY HOSPITAL WASHINGTON 255,999 508,700 298,090 1,062,789 1,485,595 1,062,789 NORTHWEST MEDICAL CENTER BROWARD 187,537 187,537 114,553 187,537 OAK HILL HOSPITAL HERNANDO - - OCALA REGIONAL MEDICAL CENTER MARION 698,515 1,343,913 1,343,913 1,760,911 1,760,911 298,327 416,998 ORANGE PARK MEDICAL CENTER CLAY 275,666 275,666 168,384 275,666 ORLANDO REGIONAL MEDICAL CENTER ORANGE 2,759,128 1,126,225 3,769,189 6,528,317 12,020,388 5,215,470 38,697,859 8,699,656 64,633,373 39,755,664 58,105,056 OSCEOLA REGIONAL MEDICAL CENTER OSCEOLA 400,440 4,584,938 4,985,378 4,449,844 4,985,378 PALM BEACH GARDENS MEDICAL CENTER PALM BEACH 441,684 302,034 302,034 346,131 346,131 104,605 44,097 PALM BEACH REGIONAL HOSPITAL PALM BEACH - - PALM SPRINGS GENERAL HOSPITAL DADE - - PALMETTO GENERAL HOSPITAL DADE 568,387 1,662,040 10,958,793 13,189,220 11,068,939 13,189,220 PALMS OF PASADENA HOSPITAL PINELLAS - - PALMS WEST HOSPITAL PALM BEACH 635,641 507,066 507,066 902,360 4,670,745 5,573,105 3,348,104 5,066,040 PAN AMERICAN HOSPITAL DADE 256,968 256,968 156,963 256,968 PARK MEDICAL CENTER - -
PARKWAY REGIONAL (merged JMH) DADE - - PARRISH MEDICAL CENTER BREVARD 932,319 932,319 1,548,583 1,127,918 2,676,501 1,453,738 1,744,182 PHYSICAN'S REGIONAL MEDICAL CENTER COLLIER 1,148,820 2,270,911 2,270,911 2,696,484 2,696,484 475,800 425,573 PINECREST REHABILITATION HOSPITAL PALM BEACH - - PLANTATION GENERAL HOSPITAL BROWARD 2,492,285 11,255 6,579,679 9,083,219 7,267,994 9,083,219 POLK GENERAL HOSPITAL POLK - - POMPANO BEACH MEDICAL CENTER BROWARD - - PRINCETON HOSPITAL ORANGE - - PUTNAM COMMUNITY MEDICAL CENTER PUTNAM 147,987 147,987 90,395 147,987 REGIONAL MEDICAL CENTER AT BAYONET POINT PASCO - - SACRED HEART HOSPITAL ESCAMBIA 814,200 814,200 2,764,105 17,989 11,002,059 2,909,186 16,693,339 12,242,911 15,879,139 SACRED HEART OF THE EMERALD COAST WALTON 41,413 270,754 312,167 116,364 312,167
IGT TAP, September 22, 2010 Appendix D - IGT 1 6 11January 2011 48
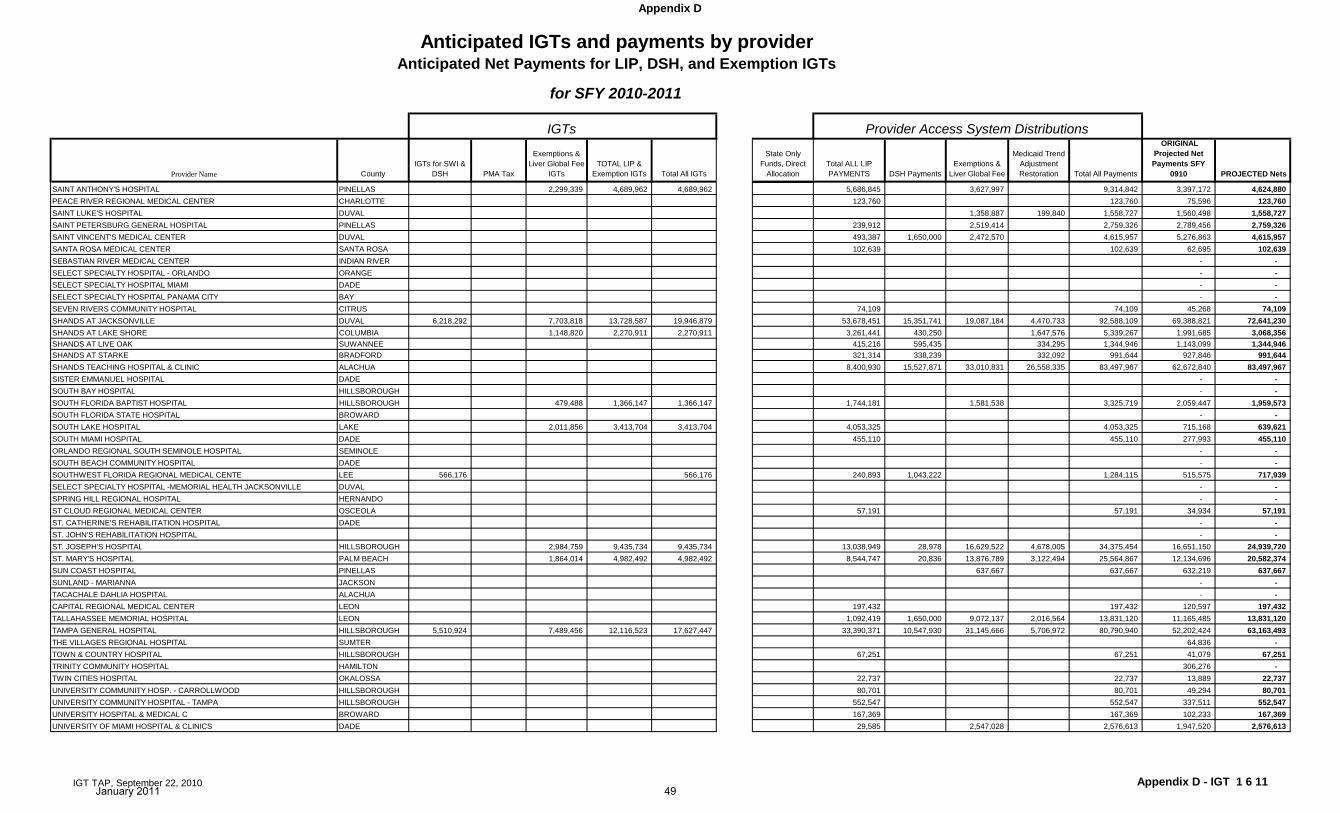
Appendix D
Provider Name CountyIGTs for SWI &
DSH PMA Tax
Exemptions & Liver Global Fee
IGTs TOTAL LIP &
Exemption IGTs Total All IGTs
State Only Funds, Direct
AllocationTotal ALL LIP PAYMENTS DSH Payments
Exemptions & Liver Global Fee
Medicaid Trend Adjustment Restoration Total All Payments
ORIGINAL Projected Net Payments SFY
0910 PROJECTED Nets
IGTs Provider Access System Distributions
for SFY 2010-2011
Anticipated IGTs and payments by providerAnticipated Net Payments for LIP, DSH, and Exemption IGTs
SAINT ANTHONY'S HOSPITAL PINELLAS 2,299,339 4,689,962 4,689,962 5,686,845 3,627,997 9,314,842 3,397,172 4,624,880 PEACE RIVER REGIONAL MEDICAL CENTER CHARLOTTE 123,760 123,760 75,596 123,760 SAINT LUKE'S HOSPITAL DUVAL 1,358,887 199,840 1,558,727 1,560,498 1,558,727 SAINT PETERSBURG GENERAL HOSPITAL PINELLAS 239,912 2,519,414 2,759,326 2,789,456 2,759,326 SAINT VINCENT'S MEDICAL CENTER DUVAL 493,387 1,650,000 2,472,570 4,615,957 5,276,863 4,615,957 SANTA ROSA MEDICAL CENTER SANTA ROSA 102,639 102,639 62,695 102,639 SEBASTIAN RIVER MEDICAL CENTER INDIAN RIVER - - SELECT SPECIALTY HOSPITAL - ORLANDO ORANGE - - SELECT SPECIALTY HOSPITAL MIAMI DADE - - SELECT SPECIALTY HOSPITAL PANAMA CITY BAY - - SEVEN RIVERS COMMUNITY HOSPITAL CITRUS 74,109 74,109 45,268 74,109 SHANDS AT JACKSONVILLE DUVAL 6,218,292 7,703,818 13,728,587 19,946,879 53,678,451 15,351,741 19,087,184 4,470,733 92,588,109 69,388,821 72,641,230 SHANDS AT LAKE SHORE COLUMBIA 1,148,820 2,270,911 2,270,911 3,261,441 430,250 1,647,576 5,339,267 1,991,685 3,068,356 SHANDS AT LIVE OAK SUWANNEE 415,216 595,435 334,295 1,344,946 1,143,099 1,344,946 SHANDS AT STARKE BRADFORD 321,314 338,239 332,092 991,644 927,846 991,644 SHANDS TEACHING HOSPITAL & CLINIC ALACHUA 8,400,930 15,527,871 33,010,831 26,558,335 83,497,967 62,672,840 83,497,967 SISTER EMMANUEL HOSPITAL DADE - - SOUTH BAY HOSPITAL HILLSBOROUGH - - SOUTH FLORIDA BAPTIST HOSPITAL HILLSBOROUGH 479,488 1,366,147 1,366,147 1,744,181 1,581,538 3,325,719 2,059,447 1,959,573 SOUTH FLORIDA STATE HOSPITAL BROWARD - - SOUTH LAKE HOSPITAL LAKE 2,011,856 3,413,704 3,413,704 4,053,325 4,053,325 715,168 639,621 SOUTH MIAMI HOSPITAL DADE 455,110 455,110 277,993 455,110 ORLANDO REGIONAL SOUTH SEMINOLE HOSPITAL SEMINOLE - - SOUTH BEACH COMMUNITY HOSPITAL DADE - - SOUTHWEST FLORIDA REGIONAL MEDICAL CENTE LEE 566,176 566,176 240,893 1,043,222 1,284,115 515,575 717,939 SELECT SPECIALTY HOSPITAL -MEMORIAL HEALTH JACKSONVILLE DUVAL - - SPRING HILL REGIONAL HOSPITAL HERNANDO - - ST CLOUD REGIONAL MEDICAL CENTER OSCEOLA 57,191 57,191 34,934 57,191 ST. CATHERINE'S REHABILITATION HOSPITAL DADE - - ST. JOHN'S REHABILITATION HOSPITAL - - ST. JOSEPH'S HOSPITAL HILLSBOROUGH 2,984,759 9,435,734 9,435,734 13,038,949 28,978 16,629,522 4,678,005 34,375,454 16,651,150 24,939,720 ST. MARY'S HOSPITAL PALM BEACH 1,864,014 4,982,492 4,982,492 8,544,747 20,836 13,876,789 3,122,494 25,564,867 12,134,696 20,582,374 SUN COAST HOSPITAL PINELLAS 637,667 637,667 632,219 637,667 SUNLAND - MARIANNA JACKSON - - TACACHALE DAHLIA HOSPITAL ALACHUA - - CAPITAL REGIONAL MEDICAL CENTER LEON 197,432 197,432 120,597 197,432 TALLAHASSEE MEMORIAL HOSPITAL LEON 1,092,419 1,650,000 9,072,137 2,016,564 13,831,120 11,165,485 13,831,120 TAMPA GENERAL HOSPITAL HILLSBOROUGH 5,510,924 7,489,456 12,116,523 17,627,447 33,390,371 10,547,930 31,145,666 5,706,972 80,790,940 52,202,424 63,163,493 THE VILLAGES REGIONAL HOSPITAL SUMTER 64,836 - TOWN & COUNTRY HOSPITAL HILLSBOROUGH 67,251 67,251 41,079 67,251 TRINITY COMMUNITY HOSPITAL HAMILTON 306,276 - TWIN CITIES HOSPITAL OKALOSSA 22,737 22,737 13,889 22,737 UNIVERSITY COMMUNITY HOSP. - CARROLLWOOD HILLSBOROUGH 80,701 80,701 49,294 80,701 UNIVERSITY COMMUNITY HOSPITAL - TAMPA HILLSBOROUGH 552,547 552,547 337,511 552,547 UNIVERSITY HOSPITAL & MEDICAL C BROWARD 167,369 167,369 102,233 167,369 UNIVERSITY OF MIAMI HOSPITAL & CLINICS DADE 29,585 2,547,028 2,576,613 1,947,520 2,576,613
IGT TAP, September 22, 2010 Appendix D - IGT 1 6 11January 2011 49
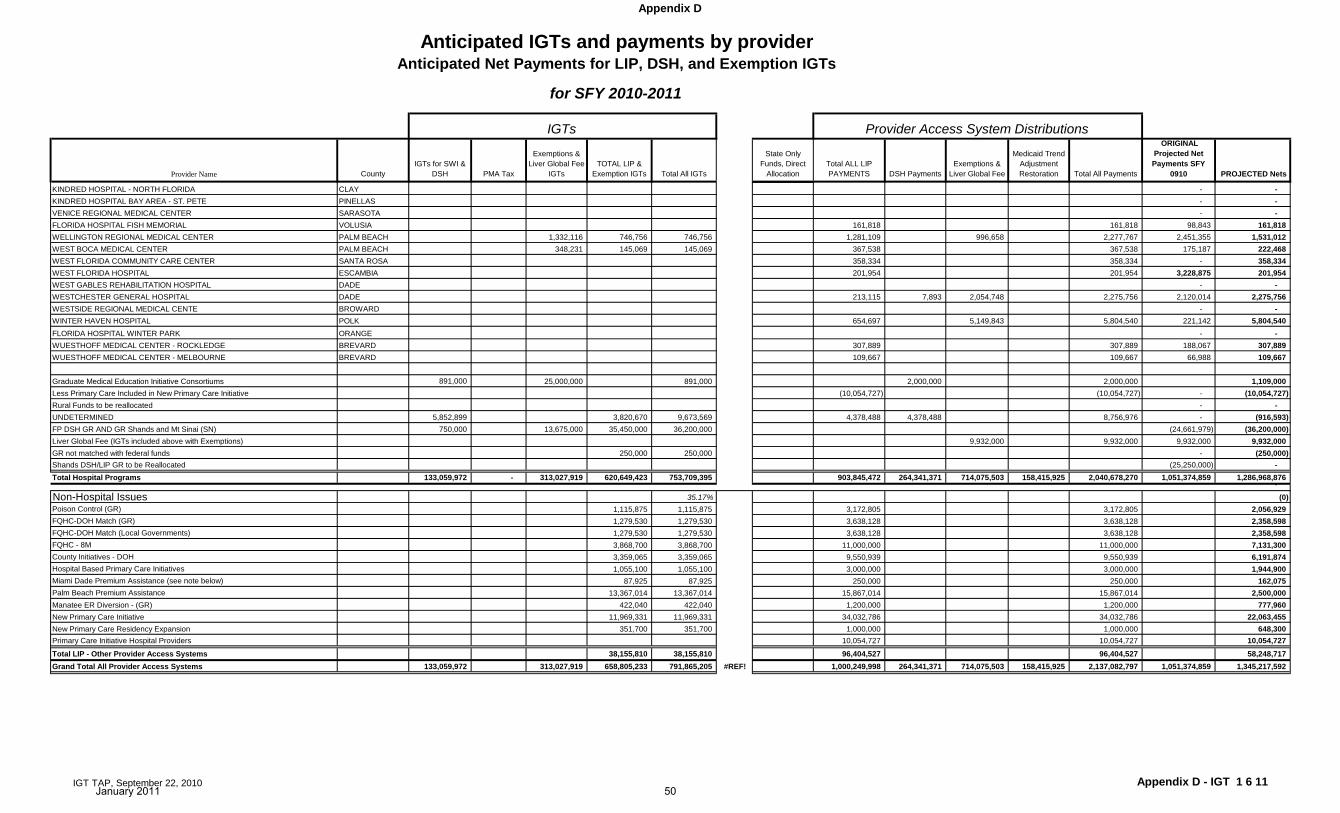
Appendix D
Provider Name CountyIGTs for SWI &
DSH PMA Tax
Exemptions & Liver Global Fee
IGTs TOTAL LIP &
Exemption IGTs Total All IGTs
State Only Funds, Direct
AllocationTotal ALL LIP PAYMENTS DSH Payments
Exemptions & Liver Global Fee
Medicaid Trend Adjustment Restoration Total All Payments
ORIGINAL Projected Net Payments SFY
0910 PROJECTED Nets
IGTs Provider Access System Distributions
for SFY 2010-2011
Anticipated IGTs and payments by providerAnticipated Net Payments for LIP, DSH, and Exemption IGTs
KINDRED HOSPITAL - NORTH FLORIDA CLAY - - KINDRED HOSPITAL BAY AREA - ST. PETE PINELLAS - - VENICE REGIONAL MEDICAL CENTER SARASOTA - - FLORIDA HOSPITAL FISH MEMORIAL VOLUSIA 161,818 161,818 98,843 161,818 WELLINGTON REGIONAL MEDICAL CENTER PALM BEACH 1,332,116 746,756 746,756 1,281,109 996,658 2,277,767 2,451,355 1,531,012 WEST BOCA MEDICAL CENTER PALM BEACH 348,231 145,069 145,069 367,538 367,538 175,187 222,468 WEST FLORIDA COMMUNITY CARE CENTER SANTA ROSA 358,334 358,334 - 358,334 WEST FLORIDA HOSPITAL ESCAMBIA 201,954 201,954 3,228,875 201,954 WEST GABLES REHABILITATION HOSPITAL DADE - - WESTCHESTER GENERAL HOSPITAL DADE 213,115 7,893 2,054,748 2,275,756 2,120,014 2,275,756 WESTSIDE REGIONAL MEDICAL CENTE BROWARD - - WINTER HAVEN HOSPITAL POLK 654,697 5,149,843 5,804,540 221,142 5,804,540 FLORIDA HOSPITAL WINTER PARK ORANGE - - WUESTHOFF MEDICAL CENTER - ROCKLEDGE BREVARD 307,889 307,889 188,067 307,889 WUESTHOFF MEDICAL CENTER - MELBOURNE BREVARD 109,667 109,667 66,988 109,667
Graduate Medical Education Initiative Consortiums 891,000 25,000,000 891,000 2,000,000 2,000,000 1,109,000 Less Primary Care Included in New Primary Care Initiative (10,054,727) (10,054,727) - (10,054,727) Rural Funds to be reallocated - - UNDETERMINED 5,852,899 3,820,670 9,673,569 4,378,488 4,378,488 8,756,976 - (916,593) FP DSH GR AND GR Shands and Mt Sinai (SN) 750,000 13,675,000 35,450,000 36,200,000 (24,661,979) (36,200,000) Liver Global Fee (IGTs included above with Exemptions) 9,932,000 9,932,000 9,932,000 9,932,000 GR not matched with federal funds 250,000 250,000 - (250,000) Shands DSH/LIP GR to be Reallocated (25,250,000) - Total Hospital Programs 133,059,972 - 313,027,919 620,649,423 753,709,395 903,845,472 264,341,371 714,075,503 158,415,925 2,040,678,270 1,051,374,859 1,286,968,876
-
Non-Hospital Issues 35.17% (0) Poison Control (GR) 1,115,875 1,115,875 3,172,805 3,172,805 2,056,929 FQHC-DOH Match (GR) 1,279,530 1,279,530 3,638,128 3,638,128 2,358,598 FQHC-DOH Match (Local Governments) 1,279,530 1,279,530 3,638,128 3,638,128 2,358,598 FQHC - 8M 3,868,700 3,868,700 11,000,000 11,000,000 7,131,300 County Initiatives - DOH 3,359,065 3,359,065 9,550,939 9,550,939 6,191,874 Hospital Based Primary Care Initiatives 1,055,100 1,055,100 3,000,000 3,000,000 1,944,900 Miami Dade Premium Assistance (see note below) 87,925 87,925 250,000 250,000 162,075 Palm Beach Premium Assistance 13,367,014 13,367,014 15,867,014 15,867,014 2,500,000 Manatee ER Diversion - (GR) 422,040 422,040 1,200,000 1,200,000 777,960 New Primary Care Initiative 11,969,331 11,969,331 34,032,786 34,032,786 22,063,455 New Primary Care Residency Expansion 351,700 351,700 1,000,000 1,000,000 648,300 Primary Care Initiative Hospital Providers 10,054,727 10,054,727 10,054,727 Total LIP - Other Provider Access Systems 38,155,810 38,155,810 96,404,527 96,404,527 58,248,717Grand Total All Provider Access Systems 133,059,972 313,027,919 658,805,233 791,865,205 #REF! 1,000,249,998 264,341,371 714,075,503 158,415,925 2,137,082,797 1,051,374,859 1,345,217,592
IGT TAP, September 22, 2010 Appendix D - IGT 1 6 11January 2011 50
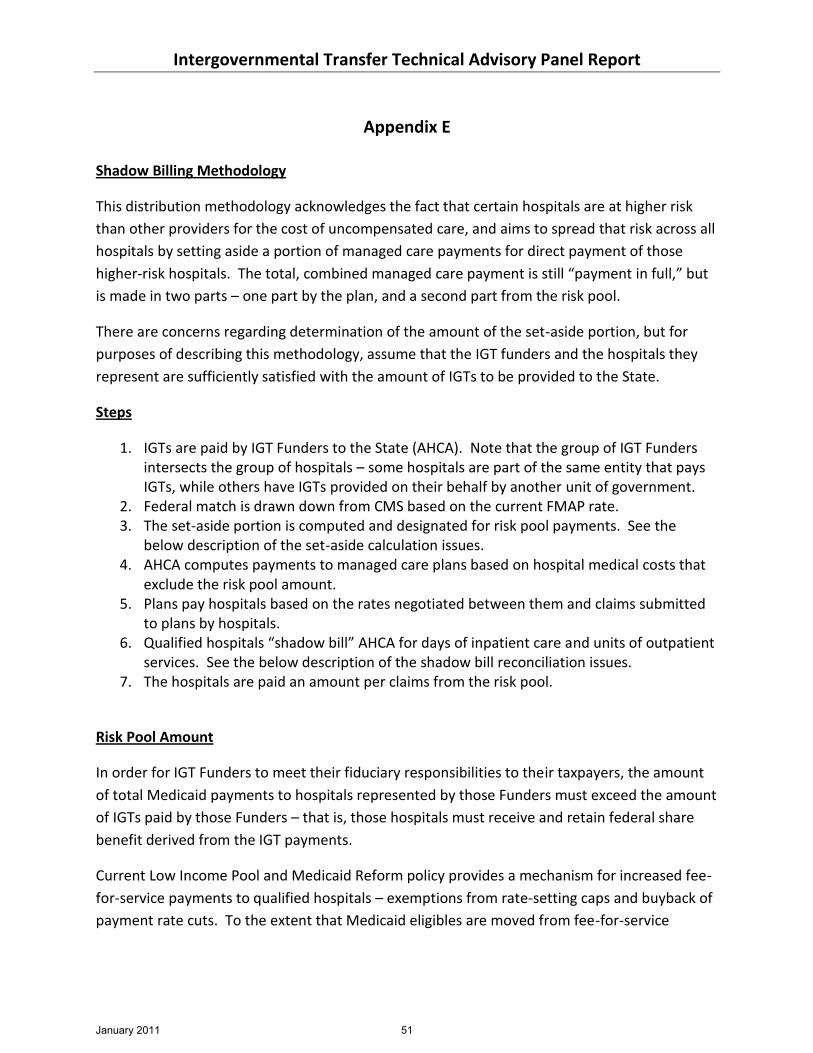
Intergovernmental Transfer Technical Advisory Panel Report
Appendix E
Shadow Billing Methodology
This distribution methodology acknowledges the fact that certain hospitals are at higher risk
than other providers for the cost of uncompensated care, and aims to spread that risk across all
hospitals by setting aside a portion of managed care payments for direct payment of those
higher-risk hospitals. The total, combined managed care payment is still “payment in full,” but
is made in two parts – one part by the plan, and a second part from the risk pool.
There are concerns regarding determination of the amount of the set-aside portion, but for
purposes of describing this methodology, assume that the IGT funders and the hospitals they
represent are sufficiently satisfied with the amount of IGTs to be provided to the State.
Steps
1. IGTs are paid by IGT Funders to the State (AHCA). Note that the group of IGT Funders intersects the group of hospitals – some hospitals are part of the same entity that pays IGTs, while others have IGTs provided on their behalf by another unit of government.
2. Federal match is drawn down from CMS based on the current FMAP rate. 3. The set-aside portion is computed and designated for risk pool payments. See the
below description of the set-aside calculation issues. 4. AHCA computes payments to managed care plans based on hospital medical costs that
exclude the risk pool amount. 5. Plans pay hospitals based on the rates negotiated between them and claims submitted
to plans by hospitals. 6. Qualified hospitals “shadow bill” AHCA for days of inpatient care and units of outpatient
services. See the below description of the shadow bill reconciliation issues. 7. The hospitals are paid an amount per claims from the risk pool.
Risk Pool Amount
In order for IGT Funders to meet their fiduciary responsibilities to their taxpayers, the amount
of total Medicaid payments to hospitals represented by those Funders must exceed the amount
of IGTs paid by those Funders – that is, those hospitals must receive and retain federal share
benefit derived from the IGT payments.
Current Low Income Pool and Medicaid Reform policy provides a mechanism for increased fee-
for-service payments to qualified hospitals – exemptions from rate-setting caps and buyback of
payment rate cuts. To the extent that Medicaid eligibles are moved from fee-for-service
January 2011 51

Intergovernmental Transfer Technical Advisory Panel Report
coverage to managed care coverage, the related amount of exemptions and buybacks becomes
the base amount for a risk pool.
Because the risk pool depends upon IGTs, and Funders will provide IGTs only if total payments
exceed total IGTs, then there must be a mechanism for either sufficiently increasing the risk
pool payment rates or making additional payments to providers (represented by those Funders)
outside of the risk pool (e.g., LIP 4 payments or a similar mechanism).
The shadow-billing process must apply to all Medicaid managed care patients, because there is
no mechanism for differentiating claims related to existing managed care enrollees and those
moved from current fee-for-service coverage. Therefore, the amount designated for risk pool
payments would have to include amounts for all Medicaid managed care eligible recipients.
However, the IGT amount required from Funders would be based on the proportion of total
enrollees newly added to managed care plans.
Shadow Billing Reconciliation
The intent of shadow billing is to ensure that the risk pool payments are made (1) only to
qualified hospitals, and (2) only for the covered services furnished by those hospitals.
Therefore, shadow billing requires mechanisms that identify those qualified hospitals, identify
the risk pool rate applicable to each hospital, and reconcile the units paid from the risk pool to
units paid at the contracted base rate by managed care plans.
Shadow claims submitted by hospitals to AHCA would require an identifier to note that it is a
shadow claim submitted for risk pool payments, rather than a fee-for-service claim. The
Medicare program identifies information only bills using condition code 04, and uses condition
code 69 to identify claims for IME/GME and allied health education costs. There is no specific
condition code that describes the precise needs of this Medicaid shadow billing process, but
use of condition code 04 would not be unreasonable.
The risk pool claim payment process would need to maintain a rate list to associate specific
payment rates with each qualified hospital.
Finally, there would need to be a reconciliation process to ensure that total units paid from the
risk pool for each qualified provider equal the total number of units paid for (at the base
contracted rate) by managed care plans.
Such a reconciliation could be done concurrently by requiring that the managed care claims be
paid before the shadow bill is submitted, but that would require concurrent reporting by
managed care plans to AHCA.
January 2011 52

Intergovernmental Transfer Technical Advisory Panel Report
Another mechanism would be a retrospective reconciliation that compiles the total managed
care claims data by provider and compares those totals to the total risk pool payments made on
an interim basis to each provider, and a lump-sum adjustment made (to or from the provider).
Both of these reconciliation methods are complicated by issues of timing of claims submission
and claims payment by plans, appeals of non-coverage, and enrollee plan changes.
Document Source IGT TAP Member Scott Davis
January 2011 53

Intergovernmental Transfer Technical Advisory Panel Report
CMS
AHCA
PLANS IGT
FUNDERS
HOSPITALS
RISK POOL
1. IGT paid to State
2. Federal Match
3. AHCA funds risk pool
4. AHCA payment to plans at base rate
5. Plans payment to hospitals at contracted rates
6. Hospitals “shadow bill” AHCA for risk
component
7. Risk pool payment to
hospitals = exemption +
buyback + ???
Document Source IGT TAP Member Scott Davis
January 2011 54

Appendix F
Broward County IGT Model
Assumptions:
1. Rates per AHCA data, including exemption and buyback portions
2. Voluntary Medicaid population per AHCA data3. IGTs provided by South Broward Hospital District and North Broward Hospital District for Broward residents onlya. Includes portion attributable to Columbia Plantation general Hospital4. Enhancement of 15% of IGTs provided5. Any addition to Medicaid enrollment is directed to a PSN
Considerations:
1. By directing population to a PSN and retaining fee‐for‐service payment from the State, the hospitals participating in the PSN can be secure in the funds flow.2. By leaving the Medicaid population in a fee‐for‐service model, the cost report used to set rates (and the related exemptions/buybacks) better represents the full Medicaid population, not just the high‐risk and chronically ill patients.3. The State share for fee‐for‐service patients paid out of general revenues is substantially lower than the State share paid out of general revenues for managed care enrollees.4. A fee‐for‐service model retains authority to supplement rates directly, subject to the hospital‐specific limits already in effect.
January 2011 55
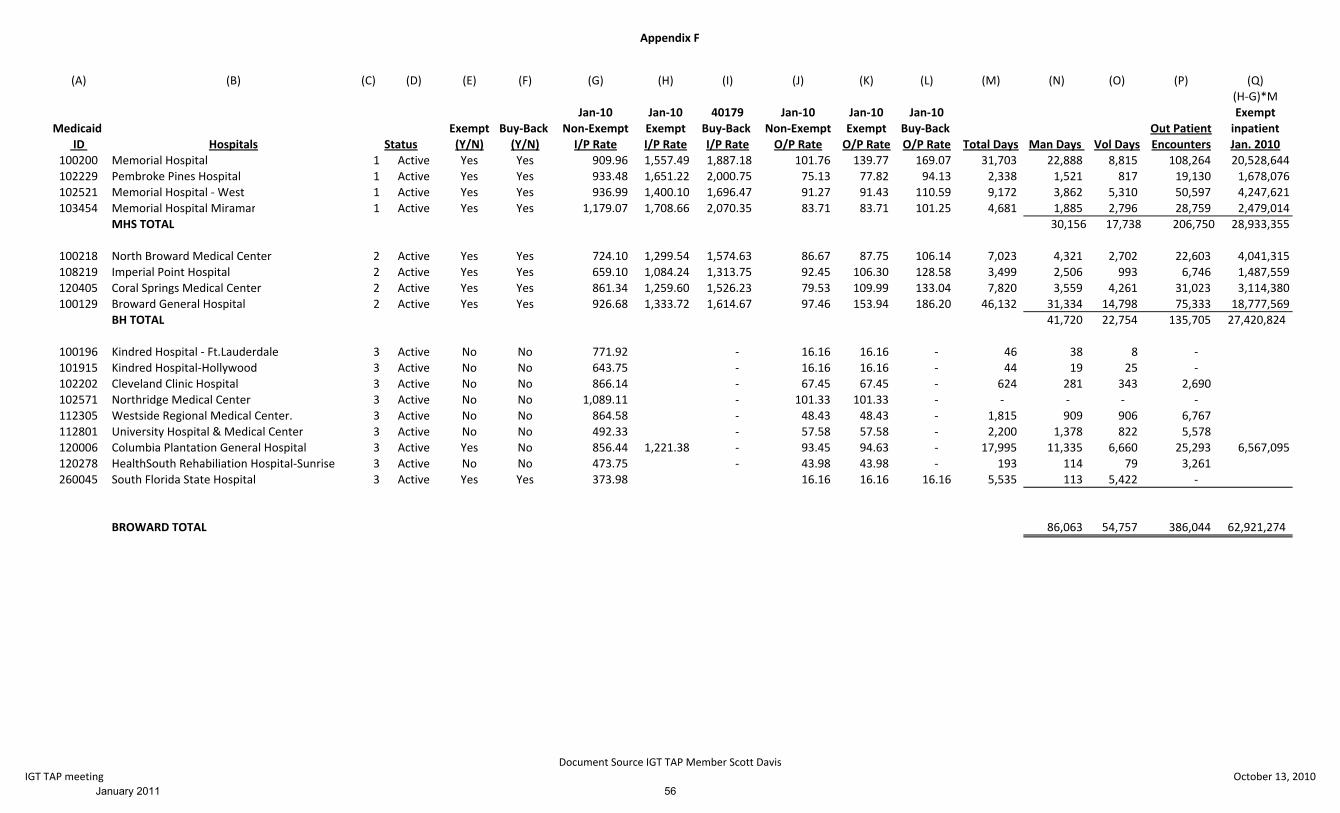
Appendix F
(A) (B) (C) (D) (E) (F) (G) (H) (I) (J) (K) (L) (M) (N) (O) (P) (Q)(H‐G)*M
Jan‐10 Jan‐10 40179 Jan‐10 Jan‐10 Jan‐10 ExemptMedicaid Exempt Buy‐Back Non‐Exempt Exempt Buy‐Back Non‐Exempt Exempt Buy‐Back Out Patient inpatient
ID Hospitals Status (Y/N) (Y/N) I/P Rate I/P Rate I/P Rate O/P Rate O/P Rate O/P Rate Total Days Man Days Vol Days Encounters Jan. 2010100200 Memorial Hospital 1 Active Yes Yes 909.96 1,557.49 1,887.18 101.76 139.77 169.07 31,703 22,888 8,815 108,264 20,528,644102229 Pembroke Pines Hospital 1 Active Yes Yes 933.48 1,651.22 2,000.75 75.13 77.82 94.13 2,338 1,521 817 19,130 1,678,076102521 Memorial Hospital ‐ West 1 Active Yes Yes 936.99 1,400.10 1,696.47 91.27 91.43 110.59 9,172 3,862 5,310 50,597 4,247,621103454 Memorial Hospital Miramar 1 Active Yes Yes 1,179.07 1,708.66 2,070.35 83.71 83.71 101.25 4,681 1,885 2,796 28,759 2,479,014
MHS TOTAL 30,156 17,738 206,750 28,933,355
100218 North Broward Medical Center 2 Active Yes Yes 724.10 1,299.54 1,574.63 86.67 87.75 106.14 7,023 4,321 2,702 22,603 4,041,315108219 Imperial Point Hospital 2 Active Yes Yes 659.10 1,084.24 1,313.75 92.45 106.30 128.58 3,499 2,506 993 6,746 1,487,559120405 Coral Springs Medical Center 2 Active Yes Yes 861.34 1,259.60 1,526.23 79.53 109.99 133.04 7,820 3,559 4,261 31,023 3,114,380100129 Broward General Hospital 2 Active Yes Yes 926.68 1,333.72 1,614.67 97.46 153.94 186.20 46,132 31,334 14,798 75,333 18,777,569
BH TOTAL 41,720 22,754 135,705 27,420,824
100196 Kindred Hospital ‐ Ft.Lauderdale 3 Active No No 771.92 ‐ 16.16 16.16 ‐ 46 38 8 ‐ 101915 Kindred Hospital‐Hollywood 3 Active No No 643.75 ‐ 16.16 16.16 ‐ 44 19 25 ‐ 102202 Cleveland Clinic Hospital 3 Active No No 866.14 ‐ 67.45 67.45 ‐ 624 281 343 2,690 102571 Northridge Medical Center 3 Active No No 1,089.11 ‐ 101.33 101.33 ‐ ‐ ‐ ‐ ‐ 112305 Westside Regional Medical Center. 3 Active No No 864.58 ‐ 48.43 48.43 ‐ 1,815 909 906 6,767 112801 University Hospital & Medical Center 3 Active No No 492.33 ‐ 57.58 57.58 ‐ 2,200 1,378 822 5,578 120006 Columbia Plantation General Hospital 3 Active Yes No 856.44 1,221.38 ‐ 93.45 94.63 ‐ 17,995 11,335 6,660 25,293 6,567,095120278 HealthSouth Rehabiliation Hospital‐Sunrise 3 Active No No 473.75 ‐ 43.98 43.98 ‐ 193 114 79 3,261 260045 South Florida State Hospital 3 Active Yes Yes 373.98 16.16 16.16 16.16 5,535 113 5,422 ‐
BROWARD TOTAL 86,063 54,757 386,044 62,921,274
IGT TAP meetingDocument Source IGT TAP Member Scott Davis
October 13, 2010January 2011 56
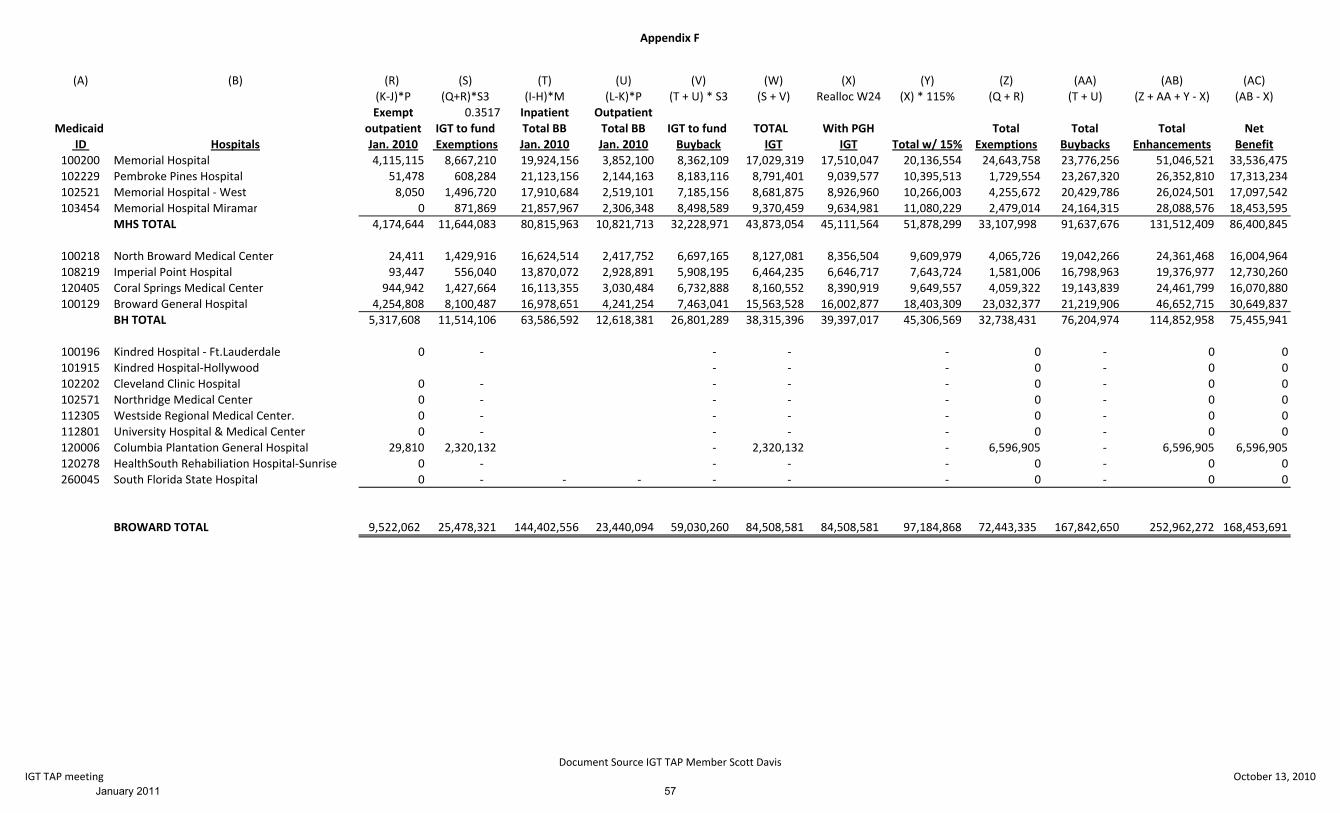
Appendix F
(A) (B)
Medicaid ID Hospitals
100200 Memorial Hospital102229 Pembroke Pines Hospital102521 Memorial Hospital ‐ West103454 Memorial Hospital Miramar
MHS TOTAL
100218 North Broward Medical Center108219 Imperial Point Hospital120405 Coral Springs Medical Center100129 Broward General Hospital
BH TOTAL
100196 Kindred Hospital ‐ Ft.Lauderdale101915 Kindred Hospital‐Hollywood102202 Cleveland Clinic Hospital102571 Northridge Medical Center112305 Westside Regional Medical Center.112801 University Hospital & Medical Center120006 Columbia Plantation General Hospital120278 HealthSouth Rehabiliation Hospital‐Sunrise260045 South Florida State Hospital
BROWARD TOTAL
(R) (S) (T) (U) (V) (W) (X) (Y) (Z) (AA) (AB) (AC)(K‐J)*P (Q+R)*S3 (I‐H)*M (L‐K)*P (T + U) * S3 (S + V) Realloc W24 (X) * 115% (Q + R) (T + U) (Z + AA + Y ‐ X) (AB ‐ X)Exempt 0.3517 Inpatient Outpatient
outpatient IGT to fund Total BB Total BB IGT to fund TOTAL With PGH Total Total Total NetJan. 2010 Exemptions Jan. 2010 Jan. 2010 Buyback IGT IGT Total w/ 15% Exemptions Buybacks Enhancements Benefit4,115,115 8,667,210 19,924,156 3,852,100 8,362,109 17,029,319 17,510,047 20,136,554 24,643,758 23,776,256 51,046,521 33,536,475
51,478 608,284 21,123,156 2,144,163 8,183,116 8,791,401 9,039,577 10,395,513 1,729,554 23,267,320 26,352,810 17,313,2348,050 1,496,720 17,910,684 2,519,101 7,185,156 8,681,875 8,926,960 10,266,003 4,255,672 20,429,786 26,024,501 17,097,542
0 871,869 21,857,967 2,306,348 8,498,589 9,370,459 9,634,981 11,080,229 2,479,014 24,164,315 28,088,576 18,453,5954,174,644 11,644,083 80,815,963 10,821,713 32,228,971 43,873,054 45,111,564 51,878,299 33,107,998 91,637,676 131,512,409 86,400,845
24,411 1,429,916 16,624,514 2,417,752 6,697,165 8,127,081 8,356,504 9,609,979 4,065,726 19,042,266 24,361,468 16,004,96493,447 556,040 13,870,072 2,928,891 5,908,195 6,464,235 6,646,717 7,643,724 1,581,006 16,798,963 19,376,977 12,730,260
944,942 1,427,664 16,113,355 3,030,484 6,732,888 8,160,552 8,390,919 9,649,557 4,059,322 19,143,839 24,461,799 16,070,8804,254,808 8,100,487 16,978,651 4,241,254 7,463,041 15,563,528 16,002,877 18,403,309 23,032,377 21,219,906 46,652,715 30,649,8375,317,608 11,514,106 63,586,592 12,618,381 26,801,289 38,315,396 39,397,017 45,306,569 32,738,431 76,204,974 114,852,958 75,455,941
0 ‐ ‐ ‐ ‐ 0 ‐ 0 0‐ ‐ ‐ 0 ‐ 0 0
0 ‐ ‐ ‐ ‐ 0 ‐ 0 00 ‐ ‐ ‐ ‐ 0 ‐ 0 00 ‐ ‐ ‐ ‐ 0 ‐ 0 00 ‐ ‐ ‐ ‐ 0 ‐ 0 0
29,810 2,320,132 ‐ 2,320,132 ‐ 6,596,905 ‐ 6,596,905 6,596,9050 ‐ ‐ ‐ ‐ 0 ‐ 0 00 ‐ ‐ ‐ ‐ ‐ ‐ 0 ‐ 0 0
9,522,062 25,478,321 144,402,556 23,440,094 59,030,260 84,508,581 84,508,581 97,184,868 72,443,335 167,842,650 252,962,272 168,453,691
IGT TAP meetingDocument Source IGT TAP Member Scott Davis
October 13, 2010January 2011 57

Intergovernmental Transfer Technical Advisory Panel Report
Appendix G
Florida Association of Health Plans
Position Paper in response to Report of the Intergovernmental Transfer
Technical Advisory Panel
January 1, 2011
Executive Summary
During last year’s discussion around Medicaid Reform, the issue of enhanced Medicaid
payments to hospitals and their funding became a major issue of debate. The Medicaid HMO
industry argued that several states had developed methodologies to keep local tax dollars in
the system to meet the state obligation for federal Medicaid match. Hospital stakeholders
argued that Florida’s financing system was unique and no agreement could be reached. As a
result, the Legislature required that the Agency for Health Care Administration (AHCA) establish
a workgroup to consider possible methodologies.
Pursuant to legislative direction (Chapter 2010-144, Laws of Florida, Section 2), the charge of
the Intergovernmental Transfer Technical Advisory Panel (IGT TAP) was to advise AHCA in the
study and development of intergovernmental transfer (IGT) distribution methods to ensure
“the continued availability of intergovernmental transfers, specific issues to resolve in
negotiations with the Centers for Medicare and Medicaid Services (CMS), and appropriate
safeguards for appropriate implementation of any developed payment methodologies.”
Unfortunately, the appointed Panel members were unable, during the course of the IGT TAP
deliberations, to reach consensus on how to accomplish their charge. As such, the final IGT TAP
Report does not offer a recommendation for a mechanism to preserve IGT funding if there is an
expansion of Managed Medicaid.
As part of the Medicaid HMO industry’s participation in the IGT TAP, we presented the group
with a viable model that will allow IGT funds to flow through to hospitals from the managed
care plans. The model is described in the report, but was not supported by the group as a
whole. The industry, through the Florida Association of Health Plans, is appreciative of the
opportunity to offer a more in-depth explanation of the model. This position paper describes
the factors and assumptions considered in developing the recommended model.
January 2011 58

Intergovernmental Transfer Technical Advisory Panel Report
Background
Intergovernmental transfers consist of local government funds from counties and hospital
taxing districts, primarily funded from ad valorem taxes. Since the late 1990’s, a number of
states have leveraged IGT funds for the purpose of matching available federal funds in the
Medicaid program under the Upper Payment Limit Program (UPL). This has been used to a large
extent to provide enhanced payments to specified Medicaid participating hospitals over and
above what the state would normally pay. Under the UPL program, states are limited in the use
of matching funds to fee-for-service claims only. As Florida moves away from fee-for-service to
managed care, this reduces the amount of available funds to support enhanced payments to
hospitals. To facilitate the expansion of Medicaid managed care in Florida, former Governor
Jeb Bush and the Florida Legislature created the Low Income Pool (LIP) as part of the overall
Medicaid Reform initiative in 2005.
Although the LIP program has been successful in keeping enhanced funds in the system, three
basic problems currently exist:
1. IGT funding is inadequate to cover projected Medicaid hospital costs; 2. In a transition to more managed care, a methodology is needed to ensure IGTs are
returned to the local governments/taxing authorities from whom the funding was derived to ensure their continued voluntary participation in the program; and
3. A methodology is needed to preserve federal Medicaid matching funds which are currently available to teaching faculty as a result of certified public expenditures (CPEs) provided by state medical schools.
Florida Current IGTs
Florida has used intergovernmental transfers for many years – to fund hospitals, physicians and,
most recently, nursing homes. These IGTs are comprised of local tax dollars that substitute for
state general revenue when drawing down federal Medicaid matching dollars. Specifically for
hospitals, IGTs help fund:
Exempt/rebasing of hospital county billing rates;
“Buy-backs” of cuts in Medicaid payments to hospitals; and
Low Income Pool matching dollars
Over the years the amount of dollars that have been used for these activities has grown
substantially. A significant portion of the funding in the Medicaid budget for hospitals for
inpatient and outpatient services is funded by IGT’s in lieu of state general revenue funds. For
FY 2009-2010, there was $880,351,951 in IGTs in the Florida Medicaid budget. These IGTs
support increased payments to Florida hospitals and are needed if the Legislature decides on a
January 2011 59

Intergovernmental Transfer Technical Advisory Panel Report
policy to continue funding these enhanced payments to hospitals and other entities such as
federally qualified health centers and county health departments.
Whether or not additional managed care expansion occurs in Florida, increased need and IGT
deficits require the Legislature to adopt a new IGT methodology or the state will most likely
have to return to the more traditional Upper Payment Limit (UPL) program.
Florida Low Income Pool (LIP)
Florida received a Medicaid Reform 1115 Research and Demonstration Waiver in 2005 to
transition Medicaid fee-for-service recipients to managed care, as well as to address the issue
of protecting hospital funding received under the UPL program. This was accomplished by
replacing the UPL program with the Low Income Pool (LIP) program – a program intended, not
as a barrier, but to facilitate the expansion of managed care. The waiver contained the
provisions for how the LIP would operate in a full managed care environment and has a five
year term which expires in 2011.
LIP ensures continued government support for the provision of health care services to
Medicaid, underinsured and uninsured populations. It consists of a capped annual allotment of
$1 billion combined state and federal dollars for each year of the 5 year demonstration period
(ending June 30, 2011). Local governments, such as counties, hospital taxing districts and other
state agencies (e.g. Florida Department of Health) provide funding for the non-federal share of
the $1 billion LIP distribution. LIP, as opposed to UPL, is not based on fee-for-service claims.
Since implementation of LIP, the UPL methodology used in the rest of the country has changed.
AHCA and hospital representatives conducted studies last year which indicated that returning
to a UPL program would result in a more restrictive distribution of funds.
Specific Florida IGT Issues
The question for the state becomes how do we maintain enhanced Medicaid payments to
hospitals and other entities if LIP discontinues or IGTs are not available in an amount sufficient
to meet need?
A significant portion of the state funding in the Medicaid budget for hospitals for both inpatient
and outpatient services is funded by IGT’s. Since IGTs are voluntary, the issue of their
continuing must be considered as Medicaid eligibles are moved from fee-for-service into
managed care options. Continued use of IGT’s to fund LIP and for the Disproportionate Share
Hospital program (DSH) should not be in question as neither of those programs is tied to FFS
payments. The benefits to hospitals are significant and paid directly to the hospitals.
January 2011 60

Intergovernmental Transfer Technical Advisory Panel Report
As previously noted, one use of IGTs is to allow qualifying hospitals to “buy back” required rate
reductions which results in increased reimbursement paid by Medicaid. The other major use of
IGT’s in the Medicaid budget for hospitals is the incremental payments to exempt hospitals.
Exempt hospitals are those hospitals that are exempt from certain reimbursement targets and
ceilings that most hospitals are subject to. For FFS payments, the state portion of the
incremental payment to these exempt hospitals is funded from IGT’s. If more Medicaid
eligibles are moved into managed care, the HMO’s would be paying hospitals for days which are
currently FFS and the issue of the continued payment of this incremental amount must be
addressed. Federal rules do not allow states to make this payment outside managed care
payments, so the incremental payments will need to come from the managed care entities.
The bottom line is that IGT’s are still needed to fund these incremental payments, and they
need to be paid by the managed care entities to the hospitals.
Use of Intergovernmental Transfers in Other States
As other states have moved more of their Medicaid population into managed care, they have
developed workable solutions that Florida can look to as a model to ensure that IGTs continue,
even with a movement into more managed care. For example, California and Michigan have
each approached a problem similar to Florida’s and have reached a successful resolution. While
Medicaid programs vary from state to state, there are enough common elements between
Florida and these other states that a successful solution is also achievable for Florida.
California
California sends the IGTs to the managed care plans. The managed care plans then pay the
hospitals. The state Medicaid program actuaries calculate and certify a managed care capitation
rate with a low and a high range. The state funds the low range amount through its normal or
non-IGT sources. The counties who voluntary pay IGTs can fund the difference between the low
and high range and the difference is paid in the managed care capitation rate. Managed care
plans then, on a scheduled basis, send the difference to the hospitals.
California also establishes the hospital and supplemental hospital rates and requires the
managed care companies to pay that rate to the hospitals.
California sought and received a comprehensive health reform waiver and fundamentally
altered the way it paid hospitals for medical payments. California established the Safety Net
Care Pool which is similar to Florida’s Low Income Pool, although it is funded by certified public
expenditures rather than IGTs.
January 2011 61

Intergovernmental Transfer Technical Advisory Panel Report
Michigan
Michigan has a Medicaid program of capitated risk-bearing managed care for its TANF and SSI
populations. They have developed a program in which the state calculates a Hospital Rate
Adjustment (HRA). The HRA is paid to participating managed care organizations as a distinct
component of their overall capitated rate. While Michigan is using this adjustment to return a
tax back to hospitals, the same method could be used to send IGTs back to hospitals.
The HRA is a separately identified per member per month (pmpm) amount within each of the
rate cells and is also a separate amount in the maternity care rate that is paid to HMOs for each
delivery. Each month, the Medicaid agency computes the exact HRA amount that was included
in that month’s capitation payments for each of the State’s 13 Medicaid HMOs. Under a
formula, the amount paid to HMO is allocated to individual hospitals and the State issues
“guidance” to the HMOs on how the HRA funds are to be distributed among Michigan hospitals.
Concurrently, the Medicaid agency computes the tax necessary to support the HRA payments
and tax bills are issued to hospitals. There are periodic reconciliations of the HRA amount to
account for retroactive enrollment changes, recoveries, and claim lag issues with maternity
case rate payments.
Factors and Assumptions Supporting the HMO Model Presented to the IGT TAP
Representatives from the Medicaid HMOs who were appointed to serve on the Panel came
forward with the only viable model to address each of the issues discussed above – a model
that AHCA has indicated is operationally workable with CMS approval. The managed care
model does not distribute LIP funds in totality, but, rather, distributes only the exempt and buy-
back portions of the funds. It utilizes the existing framework and keeps all parties whole to the
extent there is no reduction in utilization in the program – with no changes to the current
hospital or physician reimbursement process. The Low Income Pool remains intact, counties
can continue to contribute, and, perhaps most importantly, no new funding is required to make
this model work. It simply offers an alternative method of allocating funding that is currently in
the system.
January 2011 62

Intergovernmental Transfer Technical Advisory Panel Report
IGT HMO Distribution Model
1
Determine incremental
exempt/buyback value for
hospitals in County
2
Determine prior 12
months HMO utilization of
hospitals by MCO
3
Divide dollars by plan –
AHCA pays prospective
payment to individual plans
to pay hospitals at the
published exempt buyback
rate
4
Determine values of
exempt/buyback at
new rates for all hospitals
5
Look at overall MCO
utilization of hospitals
compared to Baseline to see
if in Target Range
(ex. ± 20%)
6
Follow step 3 above
6
Adjust exempt/buyback
perdiem values for
hospitals to bring overall
payment to ± 20% of
baseline
Baseline
At 6 Months
At 12 Months
Follow steps 4-6 refreshing data by dropping off earliest 6 months
Yes
No
Development of the IGT HMO Distribution Model incorporated the following:
Define the amount of current utilization in hospitals and medical schools that would transition to managed care based on AHCA’s assumptions of the mandatory population (MediPass) that would migrate to managed care by county.
Define the baseline. Utilizing current actual county IGT distribution data for exemptions and buy-backs for hospitals and medical schools, managed care expansion values were determined by applying current inpatient and outpatient data by hospital by county.
Create a model that allowed for shifting utilization between hospitals in a given county.
Build a flexible model that could adjust the hospital payments based on the shifting utilization. For example, we selected a model with a corridor of 80% minimum and 120% maximum and determined whether the original distribution adjusted for changes in utilization is below, above, or within the 20% + corridor. That calculation results in a percentage by which new outpatient and inpatient per diem is derived. It is important to note that corridors are flexible. The 20% + corridor was utilized for illustrative purposes, but could be changed to any desired range.
January 2011 63
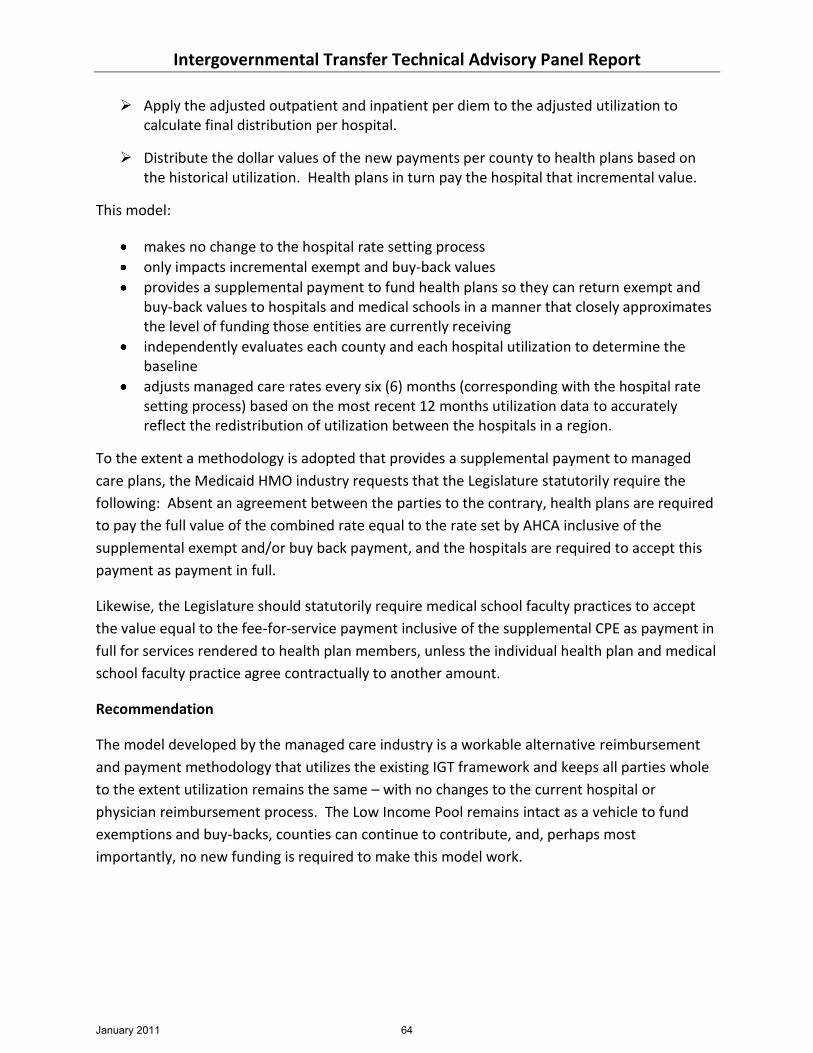
Intergovernmental Transfer Technical Advisory Panel Report
Apply the adjusted outpatient and inpatient per diem to the adjusted utilization to
calculate final distribution per hospital.
Distribute the dollar values of the new payments per county to health plans based on the historical utilization. Health plans in turn pay the hospital that incremental value.
This model:
makes no change to the hospital rate setting process
only impacts incremental exempt and buy-back values
provides a supplemental payment to fund health plans so they can return exempt and buy-back values to hospitals and medical schools in a manner that closely approximates the level of funding those entities are currently receiving
independently evaluates each county and each hospital utilization to determine the baseline
adjusts managed care rates every six (6) months (corresponding with the hospital rate setting process) based on the most recent 12 months utilization data to accurately reflect the redistribution of utilization between the hospitals in a region.
To the extent a methodology is adopted that provides a supplemental payment to managed
care plans, the Medicaid HMO industry requests that the Legislature statutorily require the
following: Absent an agreement between the parties to the contrary, health plans are required
to pay the full value of the combined rate equal to the rate set by AHCA inclusive of the
supplemental exempt and/or buy back payment, and the hospitals are required to accept this
payment as payment in full.
Likewise, the Legislature should statutorily require medical school faculty practices to accept
the value equal to the fee-for-service payment inclusive of the supplemental CPE as payment in
full for services rendered to health plan members, unless the individual health plan and medical
school faculty practice agree contractually to another amount.
Recommendation
The model developed by the managed care industry is a workable alternative reimbursement
and payment methodology that utilizes the existing IGT framework and keeps all parties whole
to the extent utilization remains the same – with no changes to the current hospital or
physician reimbursement process. The Low Income Pool remains intact as a vehicle to fund
exemptions and buy-backs, counties can continue to contribute, and, perhaps most
importantly, no new funding is required to make this model work.
January 2011 64

Intergovernmental Transfer Technical Advisory Panel Report
Alternatively, the state could re-characterize the LIP to convert the existing FFS exemptions and
buy-backs, which are drawn from the LIP, to “Medicaid uncompensated care costs.” Under this
option, the State would be able to make direct Medicaid uncompensated care payments to
hospitals under the authority of the 1115 waiver demonstration, which could be funded by IGTs
or CPEs. This option is effectively the same thing the State does under the existing 1115 waiver.
Irrespective of these options, we believe these models simply offer alternative methods of
allocating funding that is currently in the system. The industry respectfully offers these models
as viable solutions to ensure the continued availability of intergovernmental transfers as Florida
moves to expand Medicaid managed care.
January 2011 65