Flooding Resilience Plan for Bus Operations
90
Flooding Resilience Plan for Bus Operations Project Report Prepared for the Regional Transportation Authority of Northeast Illinois May 18, 2018
Transcript of Flooding Resilience Plan for Bus Operations

Flooding Resilience Plan for Bus Operations
Project Report Prepared for the Regional Transportation Authority of Northeast Illinois
May 18, 2018

Flooding Resilience Plan for Bus Operations
May 18, 2018
Prepared for: RTA
AECOM
Prepared for:
The Regional Transportation Authority of Northeast Illinois (RTA)
Prepared by:
AECOM 303 East Wacker Drive Chicago IL, 60601 USA aecom.com

Flooding Resilience Plan for Bus Operations
May 18, 2018
Prepared for: RTA
AECOM
Quality Management
Prepared by Checked by Approved by
Jen McNeil Dhadwal (AECOM) Katrina Lewis (AECOM) Dolan McMillan (AECOM) Hilary Page (AECOM) Sarah Pasquesi (AECOM Kevin Polk (AECOM) Josh Shane (AECOM) Nick Tomizawa (AECOM) John Morgan (2IM Group) Chris Nimmo (UG)
Andrew Ittigson (AECOM) Mike Mak (AECOM) Ricky Torres-Cooban (AECOM) Julia Suprock (AECOM) Bill Weaver (AECOM)
Jen McNeil Dhadwal (AECOM)
Revision History
Version Revision Date Details
1 December 13, 2017 Draft Report for Review
2 February 23, 2018 Comments from Steering Committee
3 March 30, 2018 Comments from RTA
4 May 18, 2018 Final
Distribution List
Name Association / Company Name
Brian Hacker, Heather Tabbert Mullins, Jessica Hector-Tsu RTA
Kate Tomford, Heather Ferguson, Christina Arthur, Beverly Carey, Raymond Chan, Michael Connelly, Tony Coppoletta, Jonathan Czerwinski, Elsa Gutierrez, Marvin Hicks, Jamil Houston, Derrick McFarland, Patricia Thomas-Miller
CTA
Bill Lynch, James Garner, Bob Huffman, John Kokoris, Erik Llewellyn Pace
Nora Beck CMAP
AECOM Project Team AECOM, 2IM Group, Urban GIS

Flooding Resilience Plan for Bus Operations
May 18, 2018
Prepared for: RTA
AECOM

Flooding Resilience Plan for Bus Operations
May 18, 2018
Prepared for: RTA
AECOM
Table of Contents
1. INTRODUCTION ................................................................................................................................... 1
2. TRANSIT IN THE CHICAGO REGION ................................................................................................. 3
2.1 CTA BUS .......................................................................................................................................... 4 2.2 PACE BUS ........................................................................................................................................ 7
3. CLIMATE AND FLOODING IN CHICAGOLAND ................................................................................ 11
3.1 CHICAGO CLIMATE .......................................................................................................................... 11 3.2 UNDERSTANDING WHY, WHERE, AND WHEN FLOODING HAPPENS ..................................................... 11
4. ANALYZING FLOODING IMPACTS IN CHICAGO AREA ................................................................. 15
4.1 DATA .............................................................................................................................................. 15 4.1.1 Contextual Data ..................................................................................................................... 15 4.1.2 CTA Data ............................................................................................................................... 15 4.1.3 Pace Data .............................................................................................................................. 15
4.2 STAKEHOLDER INTERVIEWS ............................................................................................................. 18
5. RISK ASSESSMENT OF SYSTEM ROUTES ..................................................................................... 21
5.1 SCENARIOS .................................................................................................................................... 21 5.2 TOP CTA AND PACE ROUTES AFFECTED BY FLOODING ..................................................................... 21 5.3 SCENARIO SELECTION ..................................................................................................................... 24
6. FUTURE CLIMATE CHANGE IMPACT ON FLOODING .................................................................... 25
6.1 CLIMATE STUDIES IN THE REGION .................................................................................................... 25 6.1.1 Chicago Climate Action Plan ................................................................................................. 25 6.1.2 Center for Neighborhood Technology ................................................................................... 25 6.1.3 Illinois State Water Survey .................................................................................................... 25 6.1.4 CMAP Stormwater Management Strategy Paper.................................................................. 25
6.2 ANALYSIS OF FUTURE AREAS OF RISK FOR BUS OPERATIONS ........................................................... 26 6.2.1 Input data ............................................................................................................................... 26 6.2.2 Methods for evaluating climate change data and potential future flooding patterns ............. 32
7. RESILIENCE PLANNING: TRANSIT SERVICE ................................................................................ 39
7.1 REROUTE PLANS FOR IMPACTED BUS ROUTES ................................................................................. 39 7.1.1 Methodology .......................................................................................................................... 39 7.1.2 CTA ........................................................................................................................................ 39 7.1.3 Pace ...................................................................................................................................... 51
7.2 COMMUNICATIONS AND COORDINATION PLANS ................................................................................. 59 7.2.1 CTA ........................................................................................................................................ 59 7.2.2 Pace ...................................................................................................................................... 61
8. RESILIENCE STRATEGIES: ACTION PLAN .................................................................................... 65
8.1 GENERAL STRATEGIES AND PROJECTS ............................................................................................. 65 8.1.1 Viaducts and Street Flooding ................................................................................................ 65 8.1.2 Green Infrastructure .............................................................................................................. 66 8.1.3 Data Collection and Forecasting ........................................................................................... 68 8.1.4 Smart Cities Implementations ............................................................................................... 69
8.2 CTA RESILIENCE STRATEGIES ......................................................................................................... 70 8.2.1 Projects .................................................................................................................................. 70 8.2.2 Policies and Procedures ........................................................................................................ 74
8.3 PACE RESILIENCE STRATEGIES ........................................................................................................ 76 8.3.1 Projects .................................................................................................................................. 76
8.4 ACTION PLAN MATRIX ..................................................................................................................... 79 8.4.1 CTA ........................................................................................................................................ 79

Flooding Resilience Plan for Bus Operations
May 18, 2018
Prepared for: RTA
AECOM
8.4.2 Pace ...................................................................................................................................... 80
Appendices
Appendix A: Task 2 Technical Memorandum
Appendix B: Task 3 Technical Memorandum
Appendix C: Best Practices
Appendix D: CTA Impact Analysis Tool
Appendix E: Pace Impact Analysis Tool
Appendix F: Project Presentation
Appendix G: Flooding Resilience Plan for CTA Bus Operations - Executive Summary
Appendix H: Flooding Resilience Plan for Pace Bus Operations - Executive Summary

Flooding Resilience Plan for Bus Operations
May 18, 2018
Prepared for: RTA
AECOM
Figures
FIGURE 1: ANNUAL CTA TOTAL SYSTEM RIDERSHIP (IN MILLIONS) ..................................................................... 4 FIGURE 2: SAMPLE CTA WEBSITE BUS SYSTEM ALERTS ................................................................................... 6 FIGURE 3: ANNUAL PACE SYSTEM RIDERSHIP (2005-2015) .............................................................................. 7 FIGURE 4: SAMPLE PACE WEBSITE PASSENGER NOTICES ................................................................................. 9 FIGURE 5: THE EFFECTS OF URBANIZATION ON EVAPOTRANSPIRATION, INFILTRATION, AND RUNOFF .................... 13 FIGURE 6: CHICAGO VIADUCTS ...................................................................................................................... 13 FIGURE 7: INTERSECTION OF BUS ROUTES WITH FLOOD ZONES ...................................................................... 16 FIGURE 8: BUS ROUTES WITH CTA-REPORTED FLOOD INCIDENT HOTSPOTS .................................................... 17 FIGURE 9: CTA SCENARIOS A-E .................................................................................................................... 22 FIGURE 10: PACE SCENARIOS A-E ................................................................................................................. 23 FIGURE 11: CMAP FLOODING SUSCEPTIBILITY INDICES (URBAN AND RIVERINE FLOODING) .............................. 26 FIGURE 12: OEMC STREET FLOOD CALLS, DENSITY OF CTA FLOOD REPORTS, CDOT VIADUCTS, AND CTA
SCENARIO E ROUTES ............................................................................................................................. 28 FIGURE 13: CDOT VIADUCTS, OEMC VIADUCT FLOOD CALLS, CTA FLOOD REPORTS, AND CTA SCENARIO E
ROUTES ................................................................................................................................................. 29 FIGURE 14: CTA ROUTES WITH GREATEST OEMC 3-1-1 CALLS ON STREET & VIADUCT FLOODING .................. 30 FIGURE 15: ALL BUS ROUTES, CDOT VIADUCTS AND OEMC VIADUCT FLOOD CALLS ...................................... 31 FIGURE 16: OEMC 311 CALLS IN MINOR TO MAJOR STORMS .......................................................................... 34 FIGURE 17: DENSITY OF CALLS DURING MINOR STORMS (<1-YEAR RECURRENCE INTERVAL) ........................... 34 FIGURE 18: PACE ROUTES WITH ENHANCED FLOOD ZONES (DES PLAINES) ..................................................... 36 FIGURE 19: PACE ROUTES WITH ENHANCED FLOOD ZONES (MELROSE PARK) ................................................. 37 FIGURE 20: CTA SCENARIO F REROUTES ....................................................................................................... 42 FIGURE 21: CTA SCENARIO F REROUTES (NORTH) ......................................................................................... 43 FIGURE 22: CTA SCENARIO F REROUTES (CENTRAL) ..................................................................................... 43 FIGURE 23: CTA SCENARIO F REROUTES (SOUTH) ......................................................................................... 44 FIGURE 24: RIDERSHIP CHANGE ON MODERATE/MAJOR STORM DAYS ............................................................. 47 FIGURE 25: RIDERSHIP CHANGE ON MINOR STORM DAYS ............................................................................... 47 FIGURE 26: PERCENT RIDERSHIP CHANGE BY STORM TYPE ............................................................................ 47 FIGURE 27: PACE SCENARIO E REROUTES ..................................................................................................... 52 FIGURE 28: PROTOTYPICAL GREEN INFRASTRUCTURE SYSTEM - NEIGHBORHOOD ............................................ 66 FIGURE 29: PROTOTYPICAL GREEN INFRASTRUCTURE SYSTEM - COMMERCIAL ................................................ 67 FIGURE 30: CTA FLOOD INCIDENT CLUSTERS AND FLOOD CLUSTER VIADUCTS ................................................ 70 FIGURE 31: CTA FLOOD INCIDENT CLUSTERS AND CAPITAL IMPROVEMENT PROJECTS ...................................... 72 FIGURE 32: DENSITY OF CTA-REPORTED FLOODING (ALL ROUTES) ................................................................ 73 FIGURE 33: PACE SCENARIO E REROUTES AND MITIGATION PROJECTS ........................................................... 77

Flooding Resilience Plan for Bus Operations
May 18, 2018
Prepared for: RTA
AECOM
Tables
TABLE 1: ANNUAL CTA RIDERSHIP (IN MILLIONS) ............................................................................................... 4 TABLE 2: TOP CTA ROUTES BY RIDERSHIP ....................................................................................................... 5 TABLE 3: ANNUAL PACE SYSTEM RIDERSHIP (IN MILLIONS) ................................................................................ 7 TABLE 4: TOP PACE ROUTES BY AVERAGE DAILY RIDERSHIP (2015) .................................................................. 8 TABLE 5: CTA AND PACE ROUTES SELECTED FOR REROUTE AND IMPACT ANALYSIS ......................................... 24 TABLE 6: MID-CENTURY ADJUSTED RAINFALL ................................................................................................. 32 TABLE 7: LATE-CENTURY ADJUSTED RAINFALL ............................................................................................... 32 TABLE 8: DES PLAINES RIVER ELEVATIONS ..................................................................................................... 34 TABLE 9: CTA REROUTES .............................................................................................................................. 40 TABLE 10: MODERATE/MAJOR STORMS .......................................................................................................... 46 TABLE 11: MINOR STORMS ............................................................................................................................. 46 TABLE 12: CTA REROUTE PHYSICAL AND RIDERSHIP CHARACTERISTICS .......................................................... 48 TABLE 13: CTA REROUTE TRAVEL TIME ESTIMATES ........................................................................................ 49 TABLE 14: CTA REROUTE COST ESTIMATES ................................................................................................... 50 TABLE 15: PACE ROUTE CHANGE ................................................................................................................... 57 TABLE 16: PACE REROUTE TRAVEL TIME ESTIMATES ...................................................................................... 58 TABLE 17: PACE REROUTE COST ESTIMATES ................................................................................................. 59 TABLE 18: GREEN INFRASTRUCTURE ELEMENTS ............................................................................................. 67 TABLE 19: PROPERTIES OF CTA SCENARIO F FLOODING CLUSTERS ................................................................ 71 TABLE 20: PACE SCENARIO E MITIGATION PROJECTS ..................................................................................... 76

Flooding Resilience Plan for Bus Operations May 18, 2018
Prepared for: RTA
AECOM 1
1. Introduction
In Fall 2015, as a continuation of its Green Transit program, the Regional Transportation Authority (RTA) initiated a project to prepare a bus route flooding resilience plan for the RTA service area composed of its six-county jurisdiction in northeastern Illinois, including Cook, DuPage, Kane, Lake, McHenry, and Will Counties. The objective of this project is to identify CTA and Pace bus routes that are prone to flooding during both average rain events and extreme weather events and to develop recommendations to address flooding issues and reroute service during flooding to minimize impacts and inconvenience to riders. Aside from hampering citizens’ mobility, such flooding events can have negative impacts on operating costs and ridership revenues.
The scope of the study, which kicked off in Summer 2016, was organized into four major work tasks:
1. Initiate Project
2. Identify and Map Flooding Impacts
3. Assess Future Climate Change Impacts on Flooding
4. Prepare a Resilience Plan
Flooding Resilience Plan for Bus Operations May 18, 2018
Prepared for: RTA
AECOM 2
Summary of Tasks and Themes
Based on our observations of significant flood events during the last five to 10 years, flood events in the RTA service area are a combination of water body overflows, as well as stormwater runoff and localized drainage issues. Bus transit is most obviously impacted when roads are wholly flooded and impassible, and viaducts and underpasses around the region’s railroad and highway network are particularly vulnerable. As part of the Chicago Climate Action Plan—one of the key precursor studies to the RTA Flooding Resilience for Bus Operations plan—the CTA noted that their bus service is particularly vulnerable to flood events because of the more than 1,500 railway viaducts, of which more than 10 percent are troubled by frequent flooding. After a kickoff meeting in Task 1, the project team in Task 2 identified and reviewed datasets describing the natural systems across the region—primarily the floodplains and floodways—as the starting point for identifying areas that present risk based on riverine and overbank flooding.
In addition to conclusions that can be inferred from an overlay of viaduct locations, conditions and bus routes, we supplemented our understanding of risk with anecdotal reports of flooding from the front lines—the CTA and Pace bus drivers who call in flooded roads and detours. Areas with recurring problems for boarding and alighting were provided by the drivers and operations management, as well as from passengers who make reports of access difficulty. Additionally, insight from emergency management stakeholders and local departments of stormwater management and transportation provided further insight into troubled areas, impact, and the status of mitigation work.
In Task 3, the project team examined the effects of changing climate patterns on the flood risk landscape in the region. Research conducted in 2008 for the Chicago Climate Action Plan indicated that increases in winter and spring precipitation are likely, with projected increases of about 10 percent by the year 2050, and of about 20 to 30 percent by 2099. At present, even minor storms are enough to overwhelm the stormwater system of some parts of the region, and these are expected to occur even more often. For example, today’s two-year storm event is expected to occur every year by mid-century, or phrased differently, an event that has a 50 percent chance of being equaled or exceeded in any given year is expected to have a 100 percent chance by mid-century. Additionally, the intensity of heavy precipitation events (5-, 10-, and 25-year storms) is likely to continue to increase. Effects of these trends will vary across the region according to watershed and sub-watershed hydrological patterns. With input from county and local stormwater management departments, the project team assesses whether these forecasted increases are likely to worsen risk conditions for the bus routes identified in Task 2.
In Task 4, the project team prepared responses to the identified risks in three major categories:
─ Reroute plans for impacted bus routes,
─ Communications strategies for updating impacted stakeholders of service interruptions, and
─ Inventories of potential mitigation projects and recommendations, with suggested next steps for items outside agencies’ control.
The resilience strategies are composed of some projects that fall under the jurisdiction of CTA and Pace, but the majority are located in the public right-of-way or on private property. For these projects, the RTA, CTA, and Pace can influence other entities’ actions but cannot control the outcome of these plans and may be able to participate from a funding or advocacy perspective.
The full Task 2 Technical Memorandum is included as Appendix A. The full Task 3 Technical Memorandum is included as Appendix B. A summary of national and local Best Practices is included as Appendix C, and Impact Analysis Workbooks for CTA and Pace are included as Appendix D and E, respectively.

Flooding Resilience Plan for Bus Operations May 18, 2018
Prepared for: RTA
AECOM 3
2. Transit in the Chicago Region
The Chicago region has several agencies providing public transportation services that make connections within and between municipalities. Service providers include Chicago Transit Authority (CTA), Metra, Pace Suburban Bus, and Northern Indiana Commuter Transportation District (NICTD), commonly known as the South Shore Line.
Regional Transportation Authority (RTA)
The RTA serves as the governing body with financial oversight of the Chicago-area public transportation service providers of the Chicago Transit Authority (CTA), Metra, and Pace Suburban Bus. In addition to providing financial support for the transit agencies, RTA conducts long-range transportation studies and maintains several funding programs for planning transportation improvements. RTA has a jurisdiction that includes six of the seven counties that compose the Chicago region.
Chicago Transit Authority (CTA)
CTA manages the third-largest transit system in the United States, providing public transportation service to the City of Chicago and 35 surrounding suburban communities. CTA operates eight rapid transit rail lines covering 145 rail stations and 130 bus routes serving roughly 11,000 posted bus stops. In 2016, CTA systemwide ridership stood at nearly 500 million boardings. As of June 2017, CTA provided 42.6 million rides a month, roughly equally split between rail and bus.1 On an average weekday, 1.6 million people board CTA trains or buses.2
Pace Suburban Bus
As one of the largest public bus service providers in the US, Pace operates approximately 200 fully accessible bus routes within the six-county area of Cook, DuPage, Kane, Lake, McHenry, and Will, serving more than 220 communities. Besides traditional fixed-route bus service, Pace provides paratransit service via roughly 450 vehicles, as well as vanpool service using a fleet of about 700 vehicles. In 2016, Pace fixed-route bus ridership stood at 28.4 million and other services (paratransit, vanpool, Dial-a-Ride, Taxi Access) added 6.9 million trips to total 35.3 million trips overall.3 Monthly ridership as of June 2017 was 2.4 million on fixed-route bus service, and 0.6 million using other services.4
Commuter Rail
Metra’s commuter passenger rail service spans 11 rail lines linking 241 stations.5 In 2016 Metra provided about 80 million trips annually, many of which originated in collar counties, including those of DuPage, Kane, Lake, McHenry, and Will. As of June 2017, Metra provided just under seven million rides per month. Outside of the New York City metropolitan area, Metra is the busiest commuter rail system in the United States by ridership.
The last remaining interurban railroad—the South Shore Line—is operated by the Northern Indiana Commuter Transportation District (NICTD) and connects northern Indiana with downtown Chicago with 19 stations. This rail service provided 331,000 rides per month as of June 2017.
While commuter rail and CTA heavy rail transit are not the primary focus of this project’s analysis, bus connections to the wider high-capacity network are an important factor in evaluating or prioritizing topics of focus.
1 Chicago Transit Authority (CTA). June 2017 Monthly Ridership Report. http://www.transitchicago.com/performance/ (2017) 2 http://www.transitchicago.com/about/facts.aspx (2017) 3 RTA. 2016 Ridership report. www.rtachicago.org (2017) 4 RTA Mapping and Statistics. Pace Bus Ridership Summary. www.rtams.org (2017) 5 Metra, Frequently Asked Questions, metrarail.com/metra/en/home/utility_landing/riding_metra/faq.html#q2 (2014)

Flooding Resilience Plan for Bus Operations May 18, 2018
Prepared for: RTA
AECOM 4
2.1 CTA Bus
Ridership
CTA accounts for the majority of public transportation ridership numbers in the Chicago metropolitan area. System-wide ridership from 2005 to 2012 increased more than 11 percent, or 1.5 percent each year. Since that 2012 peak, it has fallen to just below 500 million riders, similar to pre-2008 recession levels.
Buses are often cited as the workhorses of the CTA system, as they have historically provided more than half of all CTA transit trips. However, since CTA was forced to implement service cuts in 2010 to meet budgetary constraints, bus ridership fell by approximately 75 million between 2012 and 2016. Rail, on the other hand, has increased significantly nearly every year. Between 2012 to 2016, annual rail ridership increased by about 28 million rides, or 12 percent.
Table 1 and Figure 1 display bus, rail, and total system ridership for each year between 2005 and 2016. Rail ridership has been increasing and bus ridership falling over this period. System ridership as of 2016 is 497 million rides per year, which is above the 2005 total of 490 million, but is down from the 2012 peak of 545 million.
Table 1: Annual CTA Ridership (in millions)
2005 2006 2007 2008 2009 2010 2011 2012 2013 2014 2015 2016
Bus 303.2 298.4 309.3 327.3 318.9 306.1 310.5 314.0 300.3 276.3 274.6 259.1
Rail 186.8 195.2 190.3 197.6 202.8 210.8 221.7 231.0 229.3 238.2 242.0 238.6
Systemwide 490.0 493.6 499.6 524.9 521.7 516.9 532.2 545.0 529.6 514.5 512.6 497.7
Source: CTA Annual Ridership report (2016).
Figure 1: Annual CTA Total System Ridership (in millions)
Source: CTA Annual Ridership report (2016).
Table 2 provides ridership figures for each of the top performing bus routes by ridership, highlighting those routes that had the most average weekday riders in 2015. Ashland and 79th Street routes are the highest performing routes, followed by Chicago and Western. Each of these routes carries about two to three percent of all CTA bus riders each year, and combined they comprise 25 percent of CTA bus ridership.
303 298 309 327 319 306 310 314 300 276 275 239
187 195 190 198 203 211 222 231 229
238 242 259
-
100
200
300
400
500
600
2005 2006 2007 2008 2009 2010 2011 2012 2013 2014 2015 2016
Ann
ual R
ider
ship
(mill
ions
)
Rail Bus

Flooding Resilience Plan for Bus Operations May 18, 2018
Prepared for: RTA
AECOM 5
Table 2: Top CTA Routes by Ridership
Route # Name Avg. Weekday
Riders Annual Ridership (2015)
9 Ashland 27,499 8,856,955
79 79th 26,830 8,716,277
66 Chicago 23,506 7,399,957
49 Western 23,417 7,462,133
77 Belmont 22,150 7,008,072
8 Halsted 22,093 6,820,599
4 Cottage Grove 21,143 6,747,771
53 Pulaski 19,909 6,293,990
3 King Drive 19,235 6,132,991
82 Kimball-Homan 18,939 5,898,214 Source: RTAMS data
Alignments
The CTA operates an integrated transit system designed to provide both access to downtown Chicago (through direct service or connections to rail lines) and comprehensive crosstown local service throughout the service area. The bus system is generally aligned in a grid pattern to provide efficient transportation coverage and maximize connections, requiring most riders to walk less than a half-mile to reach transit. Main functions of bus routes are serving neighborhoods, providing access to downtown Chicago, feeding rapid transit stations, and providing service to major activity centers and local markets.
The #66 Chicago provides north side east-west local service from Chicago’s western border to the lakefront at Navy Pier. It also provides feeder service to Blue, Brown, and Red Line trains at each line’s respective Chicago Avenue stations, and provides service to the River North/ Magnificent Mile neighborhoods, extensions of downtown Chicago. A heavily used south side east-west crosstown route, the #79 79th Street, also serves multiple purposes in that it serves neighborhoods throughout Chicago’s south side from the city’s western boundary to the lakefront. It also connects passengers with the Red Line rail station, from which one can directly access downtown Chicago and other north and south side neighborhoods along the corridor. The route also serves the Ford City Mall at Cicero Avenue and 76th Street, a major activity center at the west end.
Two key north-south crosstown routes include the #9 Ashland and the #49 Western. Both provide critical service to neighborhoods and access to east-west bus routes, as well as providing feeder connections to rail service. Both are also served by CTA and Pace routes at each terminal, which extends services farther into the northern and southern portions of Cook County. Given their length and absence of a parallel rail line in close proximity, both of these routes have limited-stop service (#X9 Ashland Express and #X49 Western Express), providing less on-board travel time for customers traveling longer distances. The heavy usage of these routes is a strong indicator of the demand for service that connects secondary employment and activity centers outside of Chicago’s downtown. The high demand for service, connectivity to multiple rail lines, and access to existing and emerging activity centers outside of downtown was instrumental in recommending Ashland for Bus Rapid Transit investment. Modal Technology
The CTA has a bus fleet of over 1,800 vehicles with modern and advanced passenger amenities and technologies to help track, diagnose, and monitor service in real-time. There are two main types of buses in operation; 40’ standard bus, and 60’ articulated buses. Vehicle types are assigned based on ridership demand, and different vehicles may be used along the same route.
Flooding Resilience Plan for Bus Operations May 18, 2018
Prepared for: RTA
AECOM 6
All CTA buses are also equipped with technology that transmits real-time location data from an on-board computer system which is equipped with a Global Positioning System (GPS) to a CTA database called the Data Communications Controller (DCC). The DCC polls the on-board computer, the Intelligent Vehicle Network (IVN), every 30 seconds for location data. The DCC data in turn feeds into a real-time bus management (RTBM) database system used by CTA to monitor bus service. The DCC also passes data to the Bus Tracker prediction system for creating bus arrival predictions. The CTA control center uses an application called CleverCAD to communicate in real-time two-way with buses, and the DCC facilitates the communication between the Computer Aided Dispatch (CAD) system and the on-board IVN and operator screen.
In addition, all CTA buses are equipped with the Ventra fare collection equipment. The Ventra fare collection equipment is comprised of a Bus Mobile Validator (BMV) that connects via a separate cellular connection to the back office to operate the Open Standards Fare System. The bus also has a farebox used to collect cash fares with data physically probed from the bus once per day. Currently, 97 percent of the CTA bus fleet has automatic passenger counting (APC) sensors at doorways to collect boarding and alighting data as passengers break an infrared beam. The APC data is collected on board the bus and sent to servers once per day and processed twice per day. Raw passenger load data is available in real-time via the CleverCAD application but is not as reliable since cleaning algorithms are not run on the data in real-time. Bus drivers also have direct radio communication with dispatchers and supervisors, again via the CleverCAD system. Each bus is also equipped with several fixed-view cameras to provide video surveillance for security. Buses are also equipped with automated audio announcements of upcoming stop arrivals, also supported through the aforementioned IVN. One technology of particular value to passengers is the CTA’s Bus Tracker system. Bus arrival prediction information is distributed to users of computers, mobile phones, and other electronic devices. The CTA provides an application programming interface (API) so that developers can incorporate the real-time prediction data into smartphone apps and other uses. Users can then find the anticipated arrival times of buses for every stop in the CTA system. This capability has had a significant positive impact on the perceived and actual reliability of CTA services among passengers and the general public.
Communications
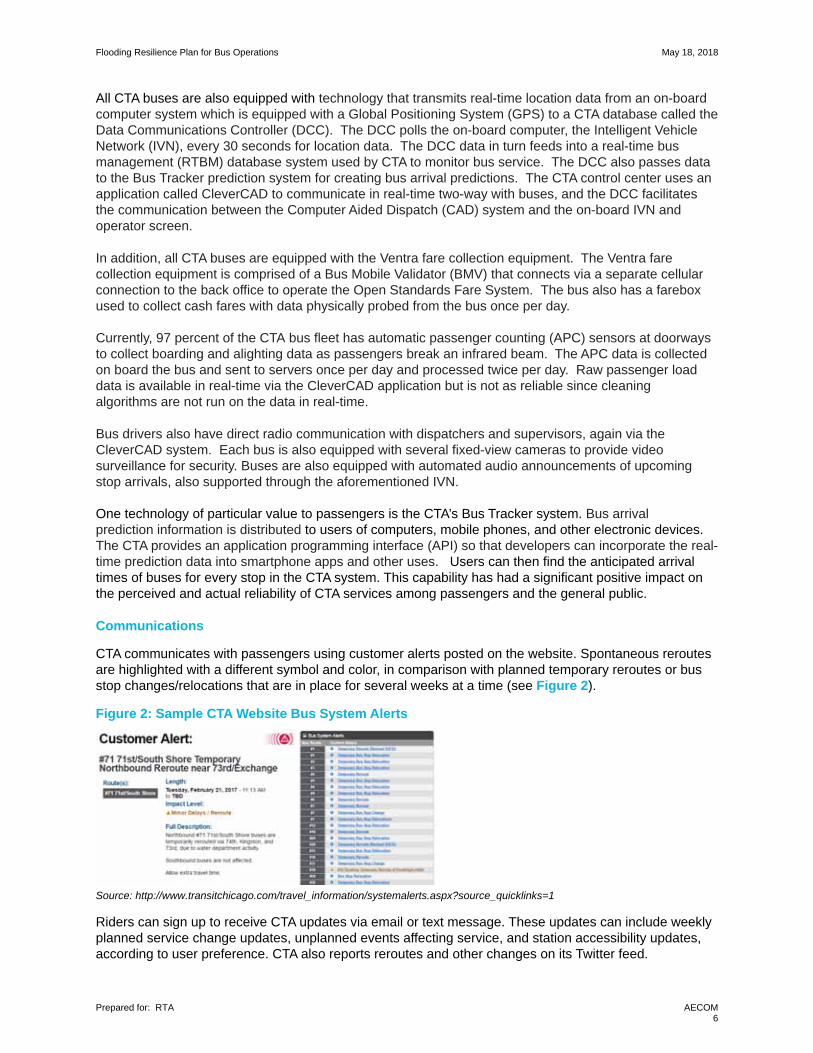
CTA communicates with passengers using customer alerts posted on the website. Spontaneous reroutes are highlighted with a different symbol and color, in comparison with planned temporary reroutes or bus stop changes/relocations that are in place for several weeks at a time (see Figure 2).
Figure 2: Sample CTA Website Bus System Alerts
Source: http://www.transitchicago.com/travel_information/systemalerts.aspx?source_quicklinks=1
Riders can sign up to receive CTA updates via email or text message. These updates can include weekly planned service change updates, unplanned events affecting service, and station accessibility updates, according to user preference. CTA also reports reroutes and other changes on its Twitter feed.

Flooding Resilience Plan for Bus Operations May 18, 2018
Prepared for: RTA
AECOM 7
2.2 Pace Bus
Ridership
As one of the largest public bus service providers in the US, Pace operates 209 fully accessible fixed bus routes within the six-county area of Cook, DuPage, Kane, Lake, McHenry, and Will—a territory which covers 3,446 square miles and includes 284 municipalities. In addition to traditional fixed-route bus service, Pace provides paratransit service via 442 vehicles, as well as vanpool service via 784 vehicles. Ridership stood at 33.1 million in 2015, with Pace ADA ridership at 4.2 million that same year. Pace ADA ridership has been growing steadily since it was inaugurated, while Pace suburban service dropped dramatically in 2009 and has not fully recovered its pre-2009 ridership levels.
The paratransit services are a major distinguishing factor between Pace and the CTA, which only provides fixed-route services. Pace is the only provider of all demand-response service, which includes dial-a-ride, call-n-ride, accessible fixed-route (for elderly and disabilities), and ADA paratransit, filling the needs of Chicago and other CTA-served municipalities that are required by the FTA to provide such services. In this way, the RTA fulfills the metropolitan area’s paratransit needs via its suburban bus division, Pace. Table 3 and Figure 3 display annual Pace ridership including both Pace fixed-route and ADA service.
Table 3: Annual Pace System Ridership (in millions)
2005 2006 2007 2008 2009 2010 2011 2012 2013 2014 2015 2016 Pace Suburban 36.9 36.5 36.5 37.8 32.3 32.3 33.7 35.4 35.9 34.8 33.1 28.4
Pace ADA 1.5 2.6 2.7 2.8 2.8 3.3 3.5 3.8 4.0 4.2 4.2 6.9
System 38.4 39.1 39.2 40.6 35.1 35.6 37.2 39.2 39.9 39.0 37.3 35.3 Source: RTA 2016 Ridership Report
Figure 3: Annual Pace System Ridership (2005-2015)
Source: RTA 2016 Ridership Report
36.9 36.5 36.537.8
32.3 32.333.7
35.4 35.9 34.833.1
28.4
1.5 2.6 2.72.8
2.8 3.3
3.5
3.84.0
4.2
4.2
6.9
20.0
25.0
30.0
35.0
40.0
2005 2006 2007 2008 2009 2010 2011 2012 2013 2014 2015 2016
Rid
ersh
ip in
Mill
ion
s
Pace Suburban Pace ADA

Flooding Resilience Plan for Bus Operations May 18, 2018
Prepared for: RTA
AECOM 8
Alignments
Pace fixed routes fall into four main categories: CTA Connector, Suburban Links, Intra-Community, and Commuter Links. Pace also operates other non-fixed or non-regular services, including Special Event routes. In terms of average daily ridership, the CTA Connector routes carry by far the greatest proportion of riders—71 percent in 2015. This is followed by Suburban Links with 14 percent, Intra-Community with 11 percent, and Commuter Links with four percent.
Table 4 shows the ten routes with the highest average daily ridership in 2015. Of these 10 routes, nine are designated as CTA Connectors, while the tenth, the 159th St Route, is a Suburban Links bus. They are located primarily within three Pace divisions: South, West, and Northwest, with one in the Southwest division.
Table 4: Top Pace Routes by Average Daily Ridership (2015)
Route # Name Route Type Average Daily Riders
352 Halsted CTA Connector 5,612
381 95th Street CTA Connector 3,899
290 Touhy Avenue CTA Connector 3,341
270 Milwaukee Avenue CTA Connector 3,029
307 Harlem CTA Connector 2,879
250 Dempster Street CTA Connector 2,617
349 South Western CTA Connector 2,558
322 Cermak Road - 22nd Street CTA Connector 2,413
318 West North Avenue CTA Connector 2,364
364 159th Street Suburban Links 2,345 Source: Pace data
Many Pace routes operate within the framework of a “pulse” network; in this scenario, buses pick up passengers along the fixed routes and converge at a common location. The schedules of such routes are planned so that buses arrive at or around the same time, and similarly depart around the same time. This type of service scheduling provides passengers with increased opportunities to transfer to other services which can then transport them to their final destination. Pace buses pulse at several locations throughout the metropolitan area, such as the Schaumburg and Aurora transit centers in DuPage County, Elgin transit center in Kane County, and the Chicago Heights Transfer Center and the Harvey Transportation Center in Cook County.6 Pace owns and operates 12 park & ride lots, some of which are located at transit centers, and also provides service to 17 park & ride lots that are not owned by Pace.
Other Pace alignments primarily serve the purpose of circulating passengers in loop-like routes that access various nodes, activity centers, and prominent land uses within communities. These may include shopping centers, schools, municipal centers, hospitals, sporting and entertainment venues, among others. Pace also operates several employment shuttle services that are subsidized by several major employers.
Finally, Pace has been implementing a number of strategies to provide better and faster service to riders. For example, in the “Bus On Shoulder” service, certain bus routes can utilize the shoulder of the I-55 / Stevenson Expressway—an allowance that was coordinated with the Illinois Legislature, IDOT, the Illinois State Police, and RTA. By allowing the bus to drive on a modified shoulder in order to by-pass slow traffic, this pilot program has proved to be an affordable way to keep buses on schedule and reduce customers’ travel time. Pace is expanding this program (implemented in 2011) to other services that currently or could potentially provide service along area expressways. Pace also offers “Pace Express” service, as well as “Express Service to Popular Destinations” to speed up travelers’ journeys. In 2018, Pace will
6 Pace Suburban Bus. www.pacebus.com (2014)

Flooding Resilience Plan for Bus Operations May 18, 2018
Prepared for: RTA
AECOM 9
launch its new rapid transit network, Pulse, to provide riders with fast, frequent, and reliable bus service along heavily traveled corridors. The first Pulse line is along Milwaukee Avenue and will include limited-stop express service, Wi-Fi enabled vehicles, weather-protected stations, and real-time bus arrival signage.
Bus Technologies
Pace has a fleet of over 440 40’ standard buses, as well as over 300 shorter buses.7 100 percent of Pace vehicles are ADA-accessible. In total, Pace operates about 700 fixed-route vehicles and 1,800 smaller transit vehicles through its paratransit and vanpool programs.8 Buses are also equipped with automated vehicle locator devices, boarding / alighting sensor counts, and onboard computers to record and transmit this data wirelessly.
Communications
On the Pace website, visitors can access the Passenger Notices page with information on temporary detours and permanent schedule adjustments to Pace routes (see Figure 4). Customers can sign up for email notifications on the website, specifying the type of information they’d like to receive, including service updates connected to particular Pace routes. Pace also communicates with passengers using customer alerts posted on its Twitter feed and Facebook page.
Figure 4: Sample Pace Website Passenger Notices
Source: https://www.pacebus.com/sub/schedules/route_notices.asp
7 Regional Transportation Authority Mapping and Statistics (RTAMS). (2017). 8 Regional Transportation Authority Mapping and Statistics (RTAMS). (2014).

Flooding Resilience Plan for Bus Operations May 18, 2018
Prepared for: RTA
AECOM 10
This page intentionally left blank

Flooding Resilience Plan for Bus Operations May 18, 2018
Prepared for: RTA
AECOM 11
3. Climate and Flooding in Chicagoland
3.1 Chicago Climate
Historically, the City of Chicago receives about 34 inches of precipitation annually,9 and localized small-scale flooding is frequent. Chicago was built on flat marshland, which makes it difficult for stormwater and runoff to drain from the land. In many areas of the region, urbanization occurred long before modern stormwater management rules were in place. For these reasons, Chicago’s history has no shortage of flood events—NOAA reports 29 significant flood events between 1950 and 2005 in Cook County. In 1954, a foot of rain fell during one week, resulting in $25 million in damage. In 1987, nine inches fell in a day, affecting 15,000 buildings and leaving area roads and expressways under water. A rainy month and one large storm in July 1996 caused $45 million in direct damages. 10 Heavy downpours in 2002 shut down interstates and underpasses of Lake Shore Drive. The remnants of hurricane Ike in 2008 caused flash flooding in many waterways; many streets were closed and thousands were evacuated, not to mention the flooding of the Blue Line near the Des Plaines River and suspension of service between Rosemont and O’Hare. In 2010, interstates and hundreds of streets were flooded as a three-day storm covered the area; FEMA committed over $300 million in assistance in Cook County alone for this event. A 2011 storm event left roadways and basements flooded, water more than 10 feet deep on I-57, and rail tracks on CTA’s Red, Blue, and Pink lines flooded.11 In April 2013, Naperville, Elmhurst, and Aurora saw more than seven inches of rain in two days, and river crests along the Des Plaines, Vermilion, and North Branch of the Chicago River (among others) broke records.12 The list goes on and on.
To handle the precipitation, the City of Chicago and many older suburban Cook County communities / stormwater management districts have combined sewer systems that collect both wastewater and stormwater and are generally designed to accommodate a five-year storm event. This water is then conveyed to interceptor sewers and on to wastewater treatment plants. After treatment, the water is discharged into local waterways. During storms that exceed the sewer system’s capacity, there is often localized flooding and combined sewer overflow that is discharged untreated into area waterways. Some communities have separate sewer systems for wastewater and stormwater, which may still be subject to overflow depending upon capacity and age.
3.2 Understanding Why, Where, and When Flooding Happens
Flooding is a regular, natural process that is nevertheless variable. Spring runoff is cyclical and thus reasonably predictable, while large rainwater events like hurricanes can cause unpredictable flooding. The floodplains adjacent to streams tend to be frequently inundated. Areas in the flood plain fringe are inundated by less frequent floods. The flood fringe is not always immediately recognizable.13 The floodplain functions as a temporary storage space for floodwaters. In our analysis, we highlight as risk areas the FEMA 100- and 500-year floodplain based on the expectation that these areas are more likely to experience flood events that would impact bus transit operations. These events have a one percent and 0.2 percent chance of being equaled or exceeded in any given year, respectively.
9 http://www.usclimatedata.com/climate/chicago/illinois/united-states/usil0225 10 National Weather Service, NOAA. http://www.weather.gov/lot/top20events_1900to1999. 11 National Weather Service, NOAA. http://www.weather.gov/lot/science 12 National Weather Service, NOAA. http://www.weather.gov/lot/2013Apr1718 13 USDA, FISRWG, Stream Corridor Restoration: Principles, Processes, and Practices. (2001).
Source: Steve Miller/WBBM

Flooding Resilience Plan for Bus Operations May 18, 2018
Prepared for: RTA
AECOM 12
The frequency of floods along streams or rivers is estimated by completing statistical analysis of the historical maximum flood discharges in each year for which gage data is available. Where available river flow records are insufficient to estimate flood frequency for a given location, rainfall runoff models are used to estimate the amount and rate of flow generated by the watershed. The frequency of floods is estimated based on the rainfall frequency and duration of the storm. Regional statistical analysis methods are also available to complete these analyses when detailed historic flood discharge information is available from nearby similar watersheds.
The Federal Emergency Management Agency has available Flood Insurance Rate Maps (FIRM) that illustrate flood stage elevations and inundation limits for a variety of flood recurrence intervals and for selected streams within most urban communities. This agency has generated these maps by analyzing river geometry and flow characteristics in computer models. These models estimate flood levels based on river geometry obtained through land and bathymetric surveys and considering the unique characteristics of each stream that influence flood stage. For streams that have not been studied or mapped by FEMA, a stream specific computer model can be used to identify flood stage data once the flood discharges have been estimated. These maps are periodically updated; for example, the current City of Chicago FIRM is from 2008 and the first was produced in 1980. Local agencies, such as the MWRD and county stormwater departments or commissions, also create floodplain maps of different recurrence levels. The major floodplain locations in the Chicago area are chiefly along the Des Plaines River, DuPage River, Chicago River (North Branch watershed) and Salt Creek Watershed.
The Federal FIRM maps and regional flood studies are generally focused on river and stream system flooding. Local flood problems that are often not the focus of federal flood documentation and not always influenced by river or stream flooding is sometimes referred to as hot-spot flooding, This type of flooding can occur in places where the stormwater infrastructure no longer has the capacity to handle the amount of runoff generated by a rainstorm. Undersized storm sewers that are not directly influenced by a larger stream system studied by FEMA can often cause local flood problems.
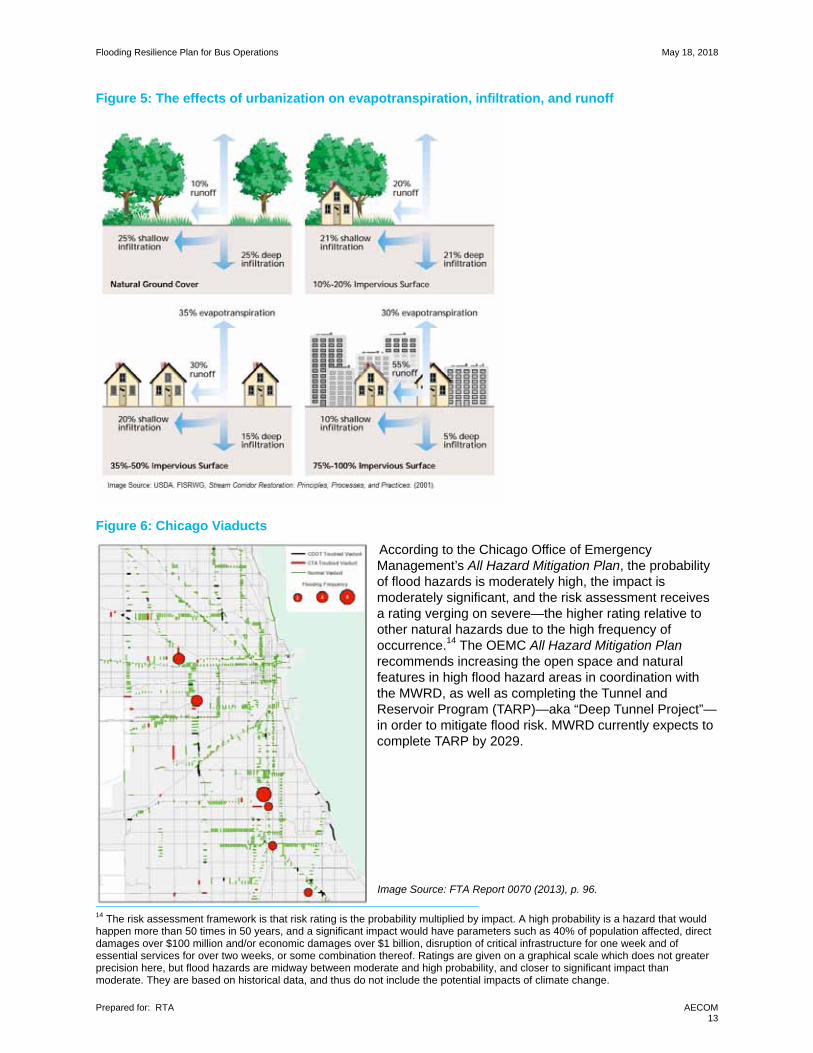
Beyond the issue of riverine flooding, hot-spot flooding can occur in places where the stormwater infrastructure no longer has the capacity to handle the amount of runoff generated. As shown in Figure 5, the amount of impervious surface in an area significantly impacts the amount of water runoff generated. Urban areas like the Chicago region have more impervious surface, which can more than double the amount of runoff in comparison with less urbanized locations. This increased runoff can accumulate in low-lying areas such as viaducts, blocking buses and other vehicles from traversing the location. The City of Chicago alone has over 1,500 viaducts, of which nearly 200 have been identified as “troubled” by frequent flooding in prior CTA analysis (see Figure 6).
Local stormwater system capacity is normally designed to handle rain events that have a 10 to 20 percent chance of exceedance in any given year. System planning needs to compare the likelihood and frequency of flood risk against flood mitigation cost to inform decision making. Local stormwater systems put in place years ago were historically designed for five- or 10- year events. This was likely due to the high cost to build greater capacity and perhaps a lack of understanding of the impact of future urbanization on these flood conveyance systems. The cost to implement systems that could manage events with lesser recurrence intervals, such as 25-to 500-year events, would entail significantly higher costs. As existing stormwater systems age, the amount of runoff increases due to continuing urbanization, and the influences of urbanization on weather patterns and climate change make matters worse, the systems are more frequently overwhelmed. As well, areas that may not have flooded in the past are now experiencing problems.
Flooding Resilience Plan for Bus Operations May 18, 2018
Prepared for: RTA
AECOM 13
Figure 5: The effects of urbanization on evapotranspiration, infiltration, and runoff
Figure 6: Chicago Viaducts
According to the Chicago Office of Emergency Management’s All Hazard Mitigation Plan, the probability of flood hazards is moderately high, the impact is moderately significant, and the risk assessment receives a rating verging on severe—the higher rating relative to other natural hazards due to the high frequency of occurrence.14 The OEMC All Hazard Mitigation Plan recommends increasing the open space and natural features in high flood hazard areas in coordination with the MWRD, as well as completing the Tunnel and Reservoir Program (TARP)—aka “Deep Tunnel Project”—in order to mitigate flood risk. MWRD currently expects to complete TARP by 2029.
14 The risk assessment framework is that risk rating is the probability multiplied by impact. A high probability is a hazard that would happen more than 50 times in 50 years, and a significant impact would have parameters such as 40% of population affected, direct damages over $100 million and/or economic damages over $1 billion, disruption of critical infrastructure for one week and of essential services for over two weeks, or some combination thereof. Ratings are given on a graphical scale which does not greater precision here, but flood hazards are midway between moderate and high probability, and closer to significant impact than moderate. They are based on historical data, and thus do not include the potential impacts of climate change.
Image Source: FTA Report 0070 (2013), p. 96.

Flooding Resilience Plan for Bus Operations May 18, 2018
Prepared for: RTA
AECOM 14
This page intentionally left blank

Flooding Resilience Plan for Bus Operations May 18, 2018
Prepared for: RTA
AECOM 15
4. Analyzing Flooding Impacts in Chicago Area
4.1 Data
A robust set of quantitative data was collected for the project, much of it loaded into the project GIS database. The data are described and presented in tabular format in the Task 2 Technical Memorandum, along with a series of maps in that memorandum’s Appendix A.
4.1.1 Contextual Data
Geospatial data on the location and characteristics of FEMA flood risk zones were gathered to overlay with bus transit route and stop locations. These were supplemented with locally updated maps from Cook County (MWRD), DuPage County, and Will County.
Figure 7 shows where these flood zones intersect bus routes in the RTA service area.
The Chicago Department of Transportation (CDOT) provided geospatial data on the location of viaducts. Viaduct flooding is a major issue for transit operations, as reported by CTA and OEMC. Cook County Department of Homeland Security and Emergency Management (CCDHSEM) also provided locations of road closures on County roads from the April 2013 flood event. Socio-economic geospatial data (including population, employment, and median household income) were gathered for the RTA service area from the US Census, CMAP and RTAMS.
4.1.2 CTA Data
Shapefiles with CTA bus routes and stops were used for mapping and analysis purposes. CTA provided data on average daily and total annual ridership by bus route, as well as boardings by stop. Data on revenue mile and hours by route, as well as existing daily estimated costs and revenue by route, were provided and are used in the reroute planning in 7.1.
In terms of data on historic flooding incidents, data from CTA’s CleverCAD (a computer-aided dispatch technology, in place after 2013) system and prior manual notation (2010-2012) provides information of the date, time, location, and type of event, along with additional notes from the operator, the route number, and the disposition of the event (e.g., whether and how the bus was able to reroute in the event of street or viaduct flooding). These data were plotted in the project team GIS and their density calculated to generate flooding incident hot spots (Figure 8).
4.1.3 Pace Data
GTFS data on Pace bus routes and stops were used for mapping and analysis purposes. Representatives from Pace operating divisions provided information on the location of recurrent flooding areas and typical reroutes, which were used to generate a shapefile with point data of flooding noted by Pace. Ridership information by route from the second quarter of 2016 was used in identifying and sorting bus routes for analysis. The Pace dataset also included information on revenue and costs for use in reroute impact analysis.

Flooding Resilience Plan for Bus Operations May 18, 2018
Prepared for: RTA
AECOM 16
Figure 7: Intersection of Bus Routes with Flood Zones

Flooding Resilience Plan for Bus Operations May 18, 2018
Prepared for: RTA
AECOM 17
Figure 8: Bus Routes with CTA-reported Flood Incident Hotspots

Flooding Resilience Plan for Bus Operations May 18, 2018
Prepared for: RTA
AECOM 18
4.2 Stakeholder Interviews
A series of stakeholder interviews were conducted with agencies or groups responsible for planning for stormwater management and/or transportation infrastructure for the purpose of identifying interesting data sources and providing insight into flood-prone areas and mitigation tactics in place or planned.
Organization Contact Chicago Department of Transportation (CDOT) Joe Alonzo, Transportation Planner
Mike Drake, General Superintendent, Division of In-House Construction
Tony Rainey, Civil Engineer
Chicago Department of Water Management (CDM)
Sid Osakada, Coordinating Engineer
Anupam Verma, PE, Managing Engineer - Water Management
Chicago Metropolitan Agency for Planning (CMAP)
Jason Navota, Director
Nora Beck, Senior Planner
Chicago Office of Emergency Management and Communications (OEMC)
Chris Pettineo, Manager of Emergency Management Services
Peter Raber, Senior Emergency Management Coordinator
Cook County Department of Transportation and Highways (CCDOTH)
Maria Choca-Urban, Director of Strategic Planning and Policy
Cook County Department of Homeland Security and Emergency Management (CCDHSEM)
Dana Curtiss, Operations Information Support Manager, Office of the President
DuPage County Stormwater Management Christine Klepp, Senior Project Engineer, Stormwater Management
Chris Vonnahme, Senior Project Engineer, Dept of Economic Development & Planning
DuPage County Department of Transportation (DCDOT)
John Loper, Director of Transportation Planning
Illinois Department of Transportation (IDOT) Rick Wojcik, IDOT Hydraulics
Metropolitan Water Reclamation District (MWRD)
Joe Kratzer, PE, CFM, Managing Civil Engineer, Engineering Dept/Stormwater Management
Greg Koch, PE, Principal Civil Engineer, Engineering Dept/Stormwater Management
US Army Corps of Engineers (USACE) Sarah Brodcinski
Sue Davis, Planning Division Chief
Will County Division of Transportation (WCDOT)
Christina Kupkowski, PE, Phase I Project Manager
Raymond A. Semplinski, Maintenance Administrator

Flooding Resilience Plan for Bus Operations May 18, 2018
Prepared for: RTA
AECOM 19
Key findings from these interviews include:
─ Documentation of actual, historical flood events is inconsistent among agencies and across the RTA service area. Technology in many agencies for recording incidents is evolving, from paper-based notation and decentralized storage, to GIS records, to sophisticated operations systems that provide access to and collect data from a wide range of agency stakeholders. Understanding where flood incidents are located is a combination of data analysis and discussions with knowledgeable parties.
─ In some instances, urban flooding is caused by adjacency or proximity to river and stream floodplains and floodways. However, within the boundaries of this study area, flooding is more often associated with stormwater infrastructure capacity deficiencies. The systems are not designed to accommodate significant storm event runoff without significant water backups and inundation. Low-lying areas, such as viaducts, are particularly problematic.
─ Many stormwater management departments have projects underway across the region that will serve to either reduce flood risk area or increase stormwater capacity. Analysis presented in this study should be checked with these local experts to ensure changes to the project conclusions as local projects are implemented in the future The current perception of potential risk areas could change as progress is made on these initiatives. Some of these projects are locally/municipally-managed and funded, and some are conducted in coordination with county and state stormwater and transportation agencies.
─ FEMA-compliant All-Hazard Mitigation Plans or Natural Hazard Mitigation Plans contain good sources of information on flood-prone areas and community-specific assessments of risk and priority. Since preparing its last regional comprehensive plan, GO TO 2040, CMAP has undertaken substantial consideration of climate change and stormwater management for inclusion in the ON TO 2050 plan.
─ Many local and regional organizations, with both jurisdictional responsibility as well as advocacy missions, are preparing wide-area stormwater management programs and plans. RTA, CTA, Pace and CMAP project team members should keep informed of activities undertaken these groups to take advantage of their knowledge and analysis, and avoid duplication of work efforts.

Flooding Resilience Plan for Bus Operations May 18, 2018
Prepared for: RTA
AECOM 20
This page intentionally left blank
Flooding Resilience Plan for Bus Operations May 18, 2018
Prepared for: RTA
AECOM 21
5. Risk Assessment of System Routes
5.1 Scenarios
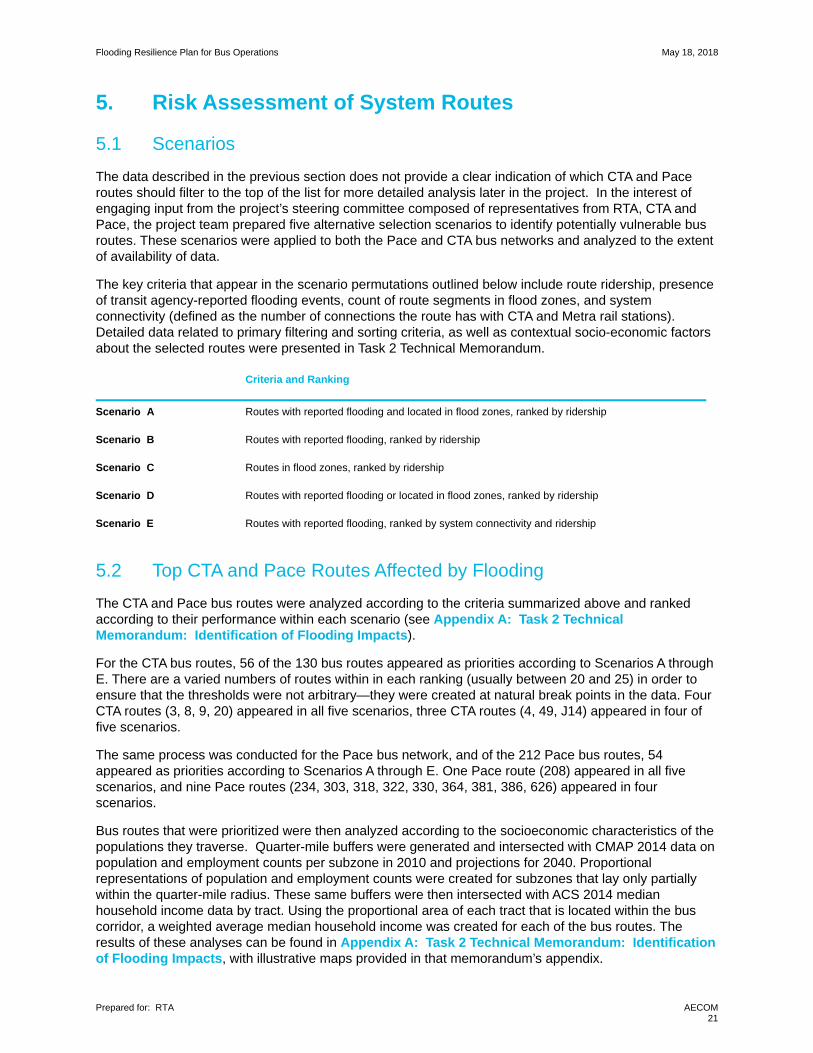
The data described in the previous section does not provide a clear indication of which CTA and Pace routes should filter to the top of the list for more detailed analysis later in the project. In the interest of engaging input from the project’s steering committee composed of representatives from RTA, CTA and Pace, the project team prepared five alternative selection scenarios to identify potentially vulnerable bus routes. These scenarios were applied to both the Pace and CTA bus networks and analyzed to the extent of availability of data.
The key criteria that appear in the scenario permutations outlined below include route ridership, presence of transit agency-reported flooding events, count of route segments in flood zones, and system connectivity (defined as the number of connections the route has with CTA and Metra rail stations). Detailed data related to primary filtering and sorting criteria, as well as contextual socio-economic factors about the selected routes were presented in Task 2 Technical Memorandum.
Criteria and Ranking
Scenario A
Scenario B
Scenario C
Scenario D
Scenario E
Routes with reported flooding and located in flood zones, ranked by ridership
Routes with reported flooding, ranked by ridership
Routes in flood zones, ranked by ridership
Routes with reported flooding or located in flood zones, ranked by ridership
Routes with reported flooding, ranked by system connectivity and ridership
5.2 Top CTA and Pace Routes Affected by Flooding
The CTA and Pace bus routes were analyzed according to the criteria summarized above and ranked according to their performance within each scenario (see Appendix A: Task 2 Technical Memorandum: Identification of Flooding Impacts).
For the CTA bus routes, 56 of the 130 bus routes appeared as priorities according to Scenarios A through E. There are a varied numbers of routes within in each ranking (usually between 20 and 25) in order to ensure that the thresholds were not arbitrary—they were created at natural break points in the data. Four CTA routes (3, 8, 9, 20) appeared in all five scenarios, three CTA routes (4, 49, J14) appeared in four of five scenarios.
The same process was conducted for the Pace bus network, and of the 212 Pace bus routes, 54 appeared as priorities according to Scenarios A through E. One Pace route (208) appeared in all five scenarios, and nine Pace routes (234, 303, 318, 322, 330, 364, 381, 386, 626) appeared in four scenarios.
Bus routes that were prioritized were then analyzed according to the socioeconomic characteristics of the populations they traverse. Quarter-mile buffers were generated and intersected with CMAP 2014 data on population and employment counts per subzone in 2010 and projections for 2040. Proportional representations of population and employment counts were created for subzones that lay only partially within the quarter-mile radius. These same buffers were then intersected with ACS 2014 median household income data by tract. Using the proportional area of each tract that is located within the bus corridor, a weighted average median household income was created for each of the bus routes. The results of these analyses can be found in Appendix A: Task 2 Technical Memorandum: Identification of Flooding Impacts, with illustrative maps provided in that memorandum’s appendix.

Flooding Resilience Plan for Bus Operations May 18, 2018
Prepared for: RTA
AECOM 22
Figure 9: CTA Scenarios A-E

Flooding Resilience Plan for Bus Operations May 18, 2018
Prepared for: RTA
AECOM 23
Figure 10: Pace Scenarios A-E

Flooding Resilience Plan for Bus Operations May 18, 2018
Prepared for: RTA
AECOM 24
5.3 Scenario Selection
After discussion with CTA and Pace staff during the Task 2 Stakeholder Meeting in February 2017 and the Task 3 Stakeholder Meeting in May 2017, followed by further deliberation within each agency internally, final scenario selections were made. CTA decided to focus flooding impact analysis on the routes listed in Table 5, referred to as Scenario F. These routes were selected due to their role as the “workhorses” of the CTA network, moving large volumes of passengers across the city and making vital connections between transit modes, as well as connecting residential communities to downtown and other employment centers. Pace decided that they would most benefit from analysis of the routes in Scenario E.
Table 5: CTA and Pace Routes Selected for Reroute and Impact Analysis
CTA Scenario F Routes Pace Scenario E Routes
4 Cottage Grove 208 Golf Road
8 Halsted 209 Busse Highway
9 Ashland 210 Lincoln Avenue
20 Madison 221 Wolf Road
22 Clark 226 Oakton Street
52 Kedzie/California 230 South Des Plaines
53 Pulaski 234 Wheeling - Des Plaines
55 Garfield 272 Milwaukee Avenue North
62 Archer 302 Ogden - Stanley
66 Chicago 303 Forest Park - Rosemont
77 Belmont 309 Lake Street
79 79th 318 West North Avenue
85 Central 319 Grand Avenue
92 Foster 322 Cermak Road - 22nd Street
147 Outer Drive Express 326 W Irving Park Road / Rosemont CTA to Norridge
J14 Jeffery Jump 330 Mannheim - LaGrange Roads
X49 Western Express 331 Cumberland - 5th Avenue
332 RT 83 / River Road - York Road
356 Harvey - Homewood - Tinley Park
364 159th Street
381 95th Street
386 South Harlem
565 Grand Avenue
572 Washington
619 Des Plaines Station - Willow Road Corridor
620 Yellow Line Dempster - Allstate
626 Skokie Valley Limited
757 Oak Park - Schaumburg Limited
Flooding Resilience Plan for Bus Operations May 18, 2018
Prepared for: RTA
AECOM 25
6. Future Climate Change Impact on Flooding
6.1 Climate Studies in the Region
6.1.1 Chicago Climate Action Plan
The Chicago Climate Action Plan was an important precursor to the RTA’s Green Transit and Resilience planning efforts. This comprehensive program looks to both the past and the future before laying out its action steps for a more resilient metropolis.
This study included extensive analysis (2008) by climate science experts and water resource engineers, who noted that climate change impacts—higher temperatures and greater precipitation in heavier rain events—will have a major impact on Chicago’s infrastructure. Emissions levels will be significant here: under the high-emissions scenario, the projected costs of adaptation for government are nearly four times higher than the low-emissions scenario. Aside from the direct costs of increased maintenance and replacement of hard infrastructure like roadways, bridges, fleet vehicles, etc., there will be less tangible costs such public health problems arising from poor air quality and temperature extremes, more frequent disease outbreaks, crop damage from intense storm events or summer droughts, among other consequences of climate change.
The Chicago Climate Change Action Plan looks at the costs of adapting to more sustainable practices that would reduce emissions and thus climate impacts, and finds that sustainable practices (such as those that would result in resource efficiencies) could generate $400 million to $1.2 billion in savings each year by 2020. It also quantifies the increase in green jobs in order to achieve the plan’s goals, as well as the jobs that would be created by achieving the goals. More detail on action steps for climate change resilience in the Chicago region can be found in Appendix C: Best Practices.
6.1.2 Center for Neighborhood Technology
In 2014, the Center for Neighborhood Technology examined the economic costs of urban flooding in Cook County. This report, “The Prevalence and Cost of Urban Flooding,” found that between 2007 and 2011, 181,000 insurance claims added up to $773 million in damages, and there was no correlation between damage payouts and floodplains, either in number or value of claims. One pattern that was noticeable was that places that had flooded once were likely to flood again—and soon. Of the 115 survey respondents, 70 percent said they had been flooded three times or more in the last five years, and 20 percent had been flooded 10 times or more.
6.1.3 Illinois State Water Survey
A 2016 Illinois State Water Survey report, “Communicating the Impacts of Potential Future Climate Change on the Expected Frequency of Extreme Rainfall Events in Cook County, Illinois” sought to design a framework to translate future climate scenarios into something that local-level engineers and planners can use to quantify the impact of climate change. The output can then be used to inform and plan adaptive strategies for floodplain management. The research found that two of the three data sources (WCRP and ORNL) commonly used for climate change modeling considerably underestimated rainwater extremes in Cook County.
6.1.4 CMAP Stormwater Management Strategy Paper
While the Chicago Metropolitan Agency for Planning (CMAP) created regional indicators and targets related to greenhouse gas reduction in prior planning work, climate resilience is a new policy topic for the agency in the ON TO 2050 plan, not having been included in the GO TO 2040 plan. In support of ON TO 2050, the agency undertook detailed work to identify flooding risk areas across its seven-county region, illustrating the prevalence of flooding in the Chicago region and highlighting that climate change is anticipated to bring more flooding. Its December 2017 Stormwater and Flooding strategy paper notes

Flooding Resilience Plan for Bus Operations May 18, 2018
Prepared for: RTA
AECOM 26
other ongoing efforts to improve stormwater planning that are included in this document, such as MPC’s effort to create a multi-jurisdictional modeling framework, updates to floodplain maps and CNT’s urban flooding analysis. This paper also introduces CMAP’s own urban and riverine flood susceptibility indices (Figure 11) which are complex multivariate algorithms that provide a GIS-driven calculation of risks based on features such as floodplain boundaries, elevation, soil types, drainage, combined sewer service areas, pervious cover, precipitation, development patterns, and other variables. Combining this index with the more vulnerable communities and economically disconnected areas (identified in by CMAP in its Inclusive Growth strategy paper) should serve as a useful prioritization structure moving forward.
Figure 11: CMAP Flooding Susceptibility Indices (Urban and Riverine Flooding)
Source: CMAP Stormwater and Flooding Strategy Paper. (2017)
6.2 Analysis of Future Areas of Risk for Bus Operations
As detailed in previous chapters, the process to identify bus routes of concern used a range of environmental, socio-economic and transit data to flag risks and areas of focus in the present period. In preparing mitigation strategies, it is prudent to look ahead to the extent possible to anticipate future conditions to avoid recommendations that might be short-lived or less relevant under future scenarios of climate change.
6.2.1 Input data
The analysis in this study to understand the potential implications of future climate change, and more-frequent, more severe storm events in the future was divided into two work streams to address the different root causes of flooding in urban vs. suburban / exurban contexts. A full presentation of this methodology, data, and illustrations is available in Appendix B: Task 3 Technical Memorandum: Future Climate Change Impacts on Flooding.

Flooding Resilience Plan for Bus Operations May 18, 2018
Prepared for: RTA
AECOM 27
Analysis of urban flooding – with its origins typically in the built environment and ability of infrastructure to manage large amounts of stormwater – included the following base data:
─ Locations of bus service interruption and route-level comments on typical flood problems reported by CTA staff
─ Locations of bus service interruption and route-level comments on typical flood problems reported by Pace staff
─ Road closures due to flooding reported by Cook County Department of Transportation and Highways
─ Locations of viaducts (and annotation of “problematic” or “flood-prone” viaducts) by CDOT, CTA and Pace
─ City of Chicago 311 reported flood calls, including water on pavement and flooded viaducts
Analysis of riverine flooding – with its origins typically in overbanking of water bodies (rivers, streams, reservoirs, etc.) from large amounts of stormwater – are more often located in suburban / exurban areas and included the following base data:
─ Locations of bus service interruption and route-level comments on typical flood problems reported by CTA staff
─ Locations of bus service interruption and route-level comments on typical flood problems reported by Pace staff
─ FEMA 100-year and 500-year floodplain boundaries
─ Local updates on floodplain boundaries / inundation areas from counties (Cook/MWRD, DuPage, Will)
Flooding Resilience Plan for Bus Operations May 18, 2018
Prepared for: RTA
AECOM 28
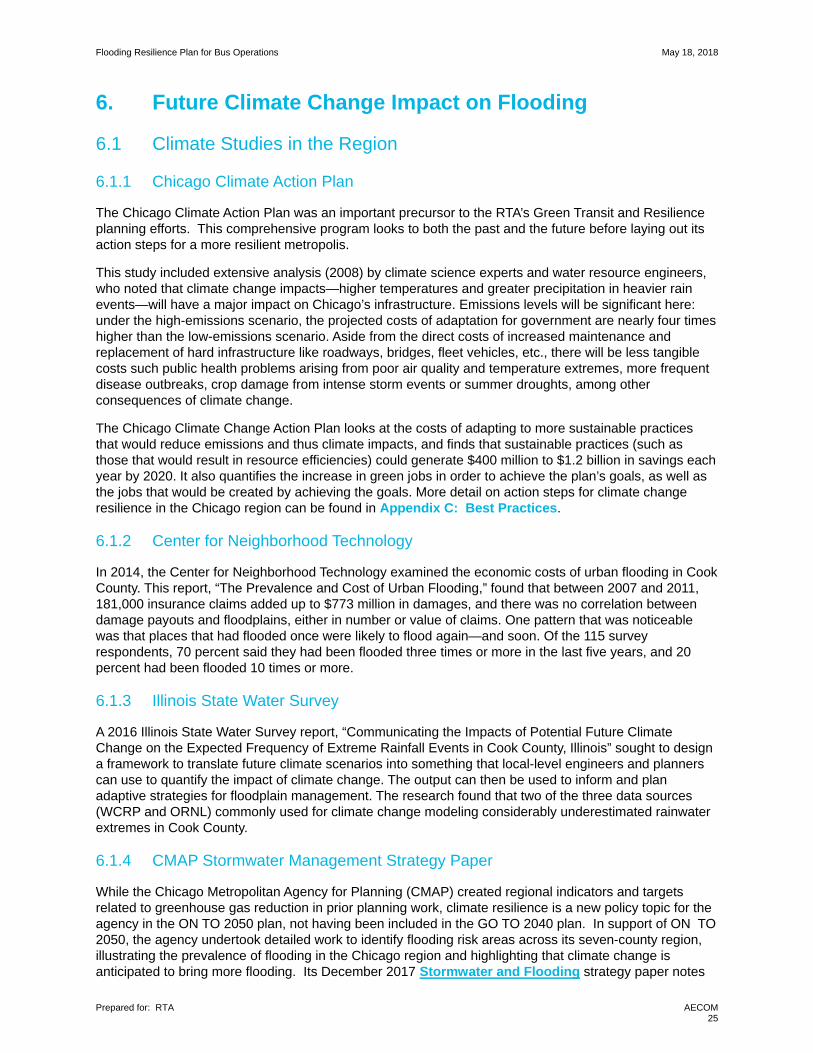
Figure 12: OEMC Street Flood Calls, Density of CTA Flood Reports and CTA Scenario F Routes

Flooding Resilience Plan for Bus Operations May 18, 2018
Prepared for: RTA
AECOM 29
Figure 13: CDOT Viaducts, OEMC Viaduct Flood Calls, CTA Flood Reports, and CTA Scenario E Routes

Flooding Resilience Plan for Bus Operations May 18, 2018
Prepared for: RTA
AECOM 30
Figure 14: CTA Routes with Greatest OEMC 3-1-1 Calls on Street & Viaduct Flooding

Flooding Resilience Plan for Bus Operations May 18, 2018
Prepared for: RTA
AECOM 31
Figure 15: All Bus Routes, CDOT Viaducts and OEMC Viaduct Flood Calls

Flooding Resilience Plan for Bus Operations May 18, 2018
Prepared for: RTA
AECOM 32
6.2.2 Methods for evaluating climate change data and potential future flooding patterns
6.2.2.1 Rainfall Frequency Adjustment for Climate Change
Stormwater and water resource engineers and scientists on this project team evaluated the potential increases in rainfall in the RTA service area by reviewing the climate change scenarios from the Chicago Area Climate Action Plan noted in the previous section and applying the increases for future climate change scenarios B1, A1B, and A2 to the Illinois State Water Survey’s Bulletin 70 24-hr rainfall amounts. Team members interpolated existing and future rainfall frequency curves to identify the equivalent storm frequency for future rainfall events at mid-century 2017 and late-century 2017.
Table 6: Mid-Century Adjusted Rainfall
Bulletin 70 Current Storm Recurrence
Interval (Years)
Current Annual Exceedance
Probability (%) Bulletin 70 24-hr
Rainfall
ISWS Contract Report 2016-05 Mid
Century 24-hr Rainfall Adjustment
(in) Adjusted Rainfall
(in)
Equivalent Bulletin 70 Future Storm
Recurrence Interval (Years)
1 100% 2.51 0.46 2.97 1.9
2 50% 3.04 0.55 3.59 4.3
5 20% 3.80 0.70 4.50 11.0
10 10% 4.47 0.83 5.30 24.0
25 4% 5.51 0.83 6.34 44.0
50 2% 6.46 0.83 7.29 85.0
100 1% 7.58 0.83 8.41 150.0
500* 0.2% 11.10 0.83 11.93 620.0
*Extrapolated Source: Illinois State Water Survey Contract Report 2016-05; ISWS Bulletin 70, AECOM and 2IM Group Table 7: Late-Century Adjusted Rainfall
Bulletin 70 Current Storm Recurrence
Interval (Years)
Current Annual Exceedance
Probability (%) Bulletin 70 24-hr
Rainfall
ISWS Contract Report 2016-05 Mid
Century 24-hr Rainfall Adjustment
(in) Adjusted Rainfall
(in)
Equivalent Bulletin 70 Future Storm
Recurrence Interval (Years)
1 100% 2.51 0.72 3.29 2.5
2 50% 3.04 0.83 3.87 5.4
5 20% 3.80 1.00 4.80 14
10 10% 4.47 1.15 5.62 28
25 4% 5.51 1.27 6.78 60
50 2% 6.46 1.38 7.84 110
100 1% 7.58 1.50 9.08 240
500* 0.2% 11.10 1.77 12.87 915
*Extrapolated Source: Illinois State Water Survey Contract Report 2016-05; ISWS Bulletin 70, AECOM and 2IM Group This generalized modeling of anticipated rainfall suggests storms of greater severity may occur more frequently in the future. That is….
The term “Storm Recurrence Interval” refers to the chance or probability that a storm of a certain magnitude may occur or be exceeded in a given year. For example, a “100-year storm” has a 1 in 100 chance of occurring in any given year, or 1% chance (called the “Annual Exceedance Probability”). It does not mean that such a storm only occurs once every 100 years, and once happened, won’t happen again in the same 100-year period.
Flooding Resilience Plan for Bus Operations May 18, 2018
Prepared for: RTA
AECOM 33
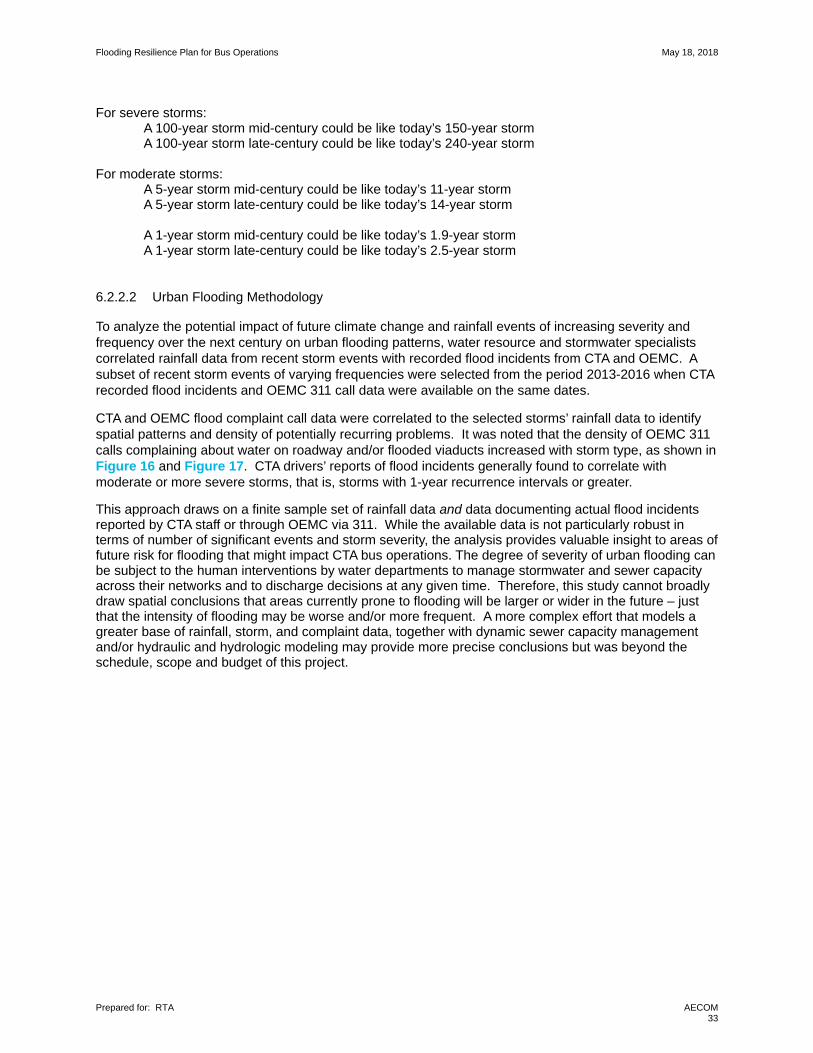
For severe storms:
A 100-year storm mid-century could be like today’s 150-year storm A 100-year storm late-century could be like today’s 240-year storm
For moderate storms:
A 5-year storm mid-century could be like today’s 11-year storm A 5-year storm late-century could be like today’s 14-year storm
A 1-year storm mid-century could be like today’s 1.9-year storm A 1-year storm late-century could be like today’s 2.5-year storm
6.2.2.2 Urban Flooding Methodology
To analyze the potential impact of future climate change and rainfall events of increasing severity and frequency over the next century on urban flooding patterns, water resource and stormwater specialists correlated rainfall data from recent storm events with recorded flood incidents from CTA and OEMC. A subset of recent storm events of varying frequencies were selected from the period 2013-2016 when CTA recorded flood incidents and OEMC 311 call data were available on the same dates.
CTA and OEMC flood complaint call data were correlated to the selected storms’ rainfall data to identify spatial patterns and density of potentially recurring problems. It was noted that the density of OEMC 311 calls complaining about water on roadway and/or flooded viaducts increased with storm type, as shown in Figure 16 and Figure 17. CTA drivers’ reports of flood incidents generally found to correlate with moderate or more severe storms, that is, storms with 1-year recurrence intervals or greater.
This approach draws on a finite sample set of rainfall data and data documenting actual flood incidents reported by CTA staff or through OEMC via 311. While the available data is not particularly robust in terms of number of significant events and storm severity, the analysis provides valuable insight to areas of future risk for flooding that might impact CTA bus operations. The degree of severity of urban flooding can be subject to the human interventions by water departments to manage stormwater and sewer capacity across their networks and to discharge decisions at any given time. Therefore, this study cannot broadly draw spatial conclusions that areas currently prone to flooding will be larger or wider in the future – just that the intensity of flooding may be worse and/or more frequent. A more complex effort that models a greater base of rainfall, storm, and complaint data, together with dynamic sewer capacity management and/or hydraulic and hydrologic modeling may provide more precise conclusions but was beyond the schedule, scope and budget of this project.

Flooding Resilience Plan for Bus Operations May 18, 2018
Prepared for: RTA
AECOM 34
Figure 16: OEMC 311 Calls in Minor to Major Storms
Figure 17: Density of Calls During Minor Storms (<1-Year Recurrence Interval)
6.2.2.3 Suburban/Exurban Flooding Methodology
The potential impact of future climate change over the next century on riverine and suburban/exurban flooding patterns and levels are available from a 2010 report by the US Army Corps of Engineers for several water bodies in the RTA service area. Water resource and stormwater specialists reviewed this information with a particular focus on the general areas through which Pace’s Scenario E priority bus routes run. These include the Des Plaines River, Addison Creek, and Silver Creek. The storm profiles were reviewed to identify incremental surface elevation differences for various storm profiles. Table 8 below presents these differences for the Des Plaines River.
Table 8: Des Plaines River Elevations
Flood Event Water Surface Profile
Elevation Increment (ft)
1- to 2-year 2
2- to 5-year 2
5- to 10-year 1
10- to 25-year 1
50- to 100-year 0.8
100- to 500-year 2.4 Source: USACE, August 2010 Based on these incremental differences and the storm frequency shift identified based on future rainfall amounts in Section 6.2.2.1, revised 100-year floodplain limits were drawn in GIS approximately halfway between the existing FEMA 100- and 500-year flood plain limits. In the absence of complex hydraulic and hydrologic modeling, this broad-brush approach is appropriate for identifying locations impacted by future conditions. This exercise concludes that there was very limited spatial expansion of floodplain areas impacting bus routes. This project’s initial screening of Pace bus routes for risk of flood interruption was based on defining risk areas including both the 100- and 500-year floodplain limits, so adjustments for

Flooding Resilience Plan for Bus Operations May 18, 2018
Prepared for: RTA
AECOM 35
future conditions were already within the zones noted as potentially risk-prone. A sampling of the minor locations where the floodplain limits shifted are in Figures 18 and 19 on the following pages, which appear to be very minor.
Across the RTA service region, there are few areas with 500-year floodplain concerns that intersect with bus routes. The conclusion from this exercise is similar to the conclusion for urban flooding: locations that are currently prone to flooding may have more frequent or severe flooding in the future. Due to the time and resource intensity of the processing required to model and truth-check these estimated boundaries, and the fact that a critical number of Pace routes impacted by flooding are in the Des Plaines River watershed, future 100-year floodplain limit adjustments were only made to that river system.
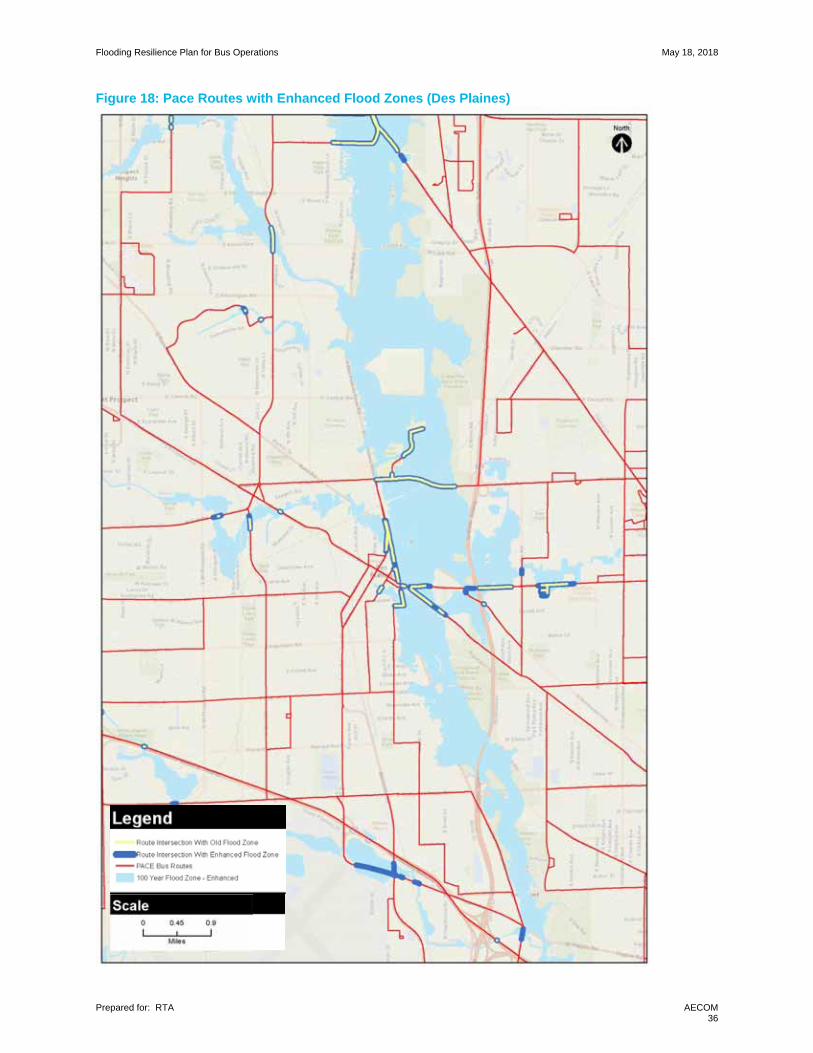
Flooding Resilience Plan for Bus Operations May 18, 2018
Prepared for: RTA
AECOM 36
Figure 18: Pace Routes with Enhanced Flood Zones (Des Plaines)

Flooding Resilience Plan for Bus Operations May 18, 2018
Prepared for: RTA
AECOM 37
Figure 19: Pace Routes with Enhanced Flood Zones (Melrose Park)

Flooding Resilience Plan for Bus Operations May 18, 2018
Prepared for: RTA
AECOM 38
This page intentionally left blank

Flooding Resilience Plan for Bus Operations May 18, 2018
Prepared for: RTA
AECOM 39
7. Resilience Planning: Transit Service
7.1 Reroute Plans for Impacted Bus Routes
7.1.1 Methodology
The objective of the impact analysis task is to quantify the potential impacts on CTA and Pace service and operations due to bus reroutes to avoid impassable flooding on street or under viaducts due to severe rain events. Quantifying the impacts of rain-related reroutes would provide additional arguments regarding the negative impacts of flooding on bus service, and potential benefits from the investment in infrastructure projects that would serve to mitigate/minimize/reduce flooding, now and in the future under expected climate change scenarios.
To understand the potential travel time, cost, and revenue implications of reroutes, AECOM collected a number of datasets to assist in the understanding of ridership and operations characteristics of the selected bus routes; operations characteristics of reroutes; and potential elasticities/ridership change factors under ordinary circumstances as well as actual ridership changes (as available). AECOM also developed a travel time factor that adds a certain percentage to the travel time and cost per trip based on three factors: congestion, storm severity, and operating delay. Each of these three factors can be adjusted from low, moderate, or high to represent a variety of external factors during storm incidents that further impact changes in travel time due strictly to the change in route alignment. A composite of these factors adjusts the Base reroute travel time up by an additional five percent (Low), 15 percent (Moderate), or 30 percent (High).
The presentation of impacts as “cost per trip” metrics allows a clean figure for analyzing the impact of storm activity on the financials of rerouting a bus trip. If CTA or Pace would want to assume a certain number of trips for each route as diverted, the agency could multiply that number of trips by the cost change to get an estimate of the total cost impact. For example, to quantify the impact of a short-duration storm, perhaps only three or fewer trips might be impacted. The agency could multiply each of the cost change metrics by three to derive a total cost per route for that particular storm. To calculate the cost per day, or half-day, this figure would be derived by calculating the per-trip cost by the number of route runs per day or half day; to estimate the cost for a given storm, the agency could then multiply the per-day cost by the number of days that a reroute was implemented.
7.1.2 CTA
As noted in 5.3, a selection of bus routes (“Scenario F”) was defined by CTA stakeholder committee members as a subset of all CTA routes to focus analysis. Features of the analysis that are specific to CTA are outlined below. The full Excel workbook was provided to CTA staff for ongoing use and interactive scenario play, and will be included in Appendix B-1. Results from the analysis using the data collected during the course of this project are summarized below.
7.1.2.1 Reroutes
CTA has defined turn-by-turn reroute directions for numerous routes throughout the city in response to historic flood incidents that have consistently impeded regular operations (Table 9). About half of the Scenario F routes have reroutes in place already, defined by CTA, and used routinely during storm events. Some Scenario F routes are unlikely to need reroute plans due to low risk of intersection with identified flood risk areas. The AECOM team defined reroutes for other routes based on assessment of characteristics of the recent flood incidents as documented by CTA or OEMC. Reroute design principles included minimizing the distance off the main route, avoiding residential neighborhoods, utilizing collector or greater capacity roadways, and avoiding other flood-prone areas. These reroutes are depicted from a citywide perspective in Figure 20, and as enlarged segment views in Figure 21, Figure 22, and Figure 23.

Flooding Resilience Plan for Bus Operations May 18, 2018
Prepared for: RTA
AECOM 40
Table 9: CTA Reroutes
Route Location to Review Turn-by-Turn Reroutes
4 Cottage Grove-61st NB No reroute needed
SB No reroute needed
4 Cottage Grove-71st NB Cottage Grove-73rd Street- St Lawrence- 71st Place- Cottage Grove
SB Reverse of northbound
4 Cottage Grove-93rd NB No reroute needed
EB No reroute needed
4 95th- St Lawrence EB No reroute needed
WB No reroute needed
4 Cottage Grove- 95th
Street
NB Cottage Grove-99th Street-ML King Dr- 95th Street-Cottage Grove
SB Reverse of northbound
8 Halsted-75th NB Halsted-76th-Morgan-74th-Halsted
SB Reverse of northbound
8 Halsted-51st thru
43rd Street
NB Halsted-51st-Racine-Exchange-Halsted
SB Reverse of northbound
8 Halsted-75th NB Halsted-76th-Morgan-74th-Halsted
SB Reverse of northbound
8 Halsted-51st thru 43rd
Street
NB Halsted-51st-Racine-Exchange-Halsted
SB Reverse of northbound
8 Halsted-16th NB Halsted-18th-Morgan-14th-Halsted
SB Reverse of northbound
8 Halsted-Hubbard NB Halsted-Fulton-DesPlaines-Milwaukee-Halsted
SB Reverse of northbound
8 Halsted-Altgeld NB No reroute needed
SB No reroute needed
20 Madison-California EB Madison-California-Washington-Western-Madison
WB Madison-Western-Warren-California-Madison
22 Clark NB No reroute needed
SB No reroute needed
52 California-Diversey
(I90) NB California-Logan-Sacramento-Belmont-California
SB Reverse of northbound
52 California Chicago NB Kedzie-Augusta-California
SB Reverse of northbound
52 Kedzie-Roosevelt Rd
and Cermak Rd NB Kedzie-24th Street – Marshall/Sacramento-Roosevelt-Kedzie
SB Reverse of northbound
52 Kedzie-31st/Sanitary and Ship Canal/ 38th Street / 48th & 49th
NB Begin northbound route from northernmost flooded viaduct – eg 31st street; that is, there will be no service south of 31st from Orange Line / 63rd; (customer alternate is Pink Line or California or Pulaski)
SB
Only provide Service on Kedzie north of flooded viaduct – stop at 31st and do not go off route
around the rail yard to avoid flooded viaducts in the 31st – 48th street range; provide no
service south to Orange Line / typical terminus at 63rd (customer’s alternate is Pink Line rail
or California or Pulaski buses)
55 Garfield-Sacramento EB Garfield-Kedzie-59th Street-California-Garfield
WB No reroute needed
55 Garfield-Stewart EB Garfield-Halsted-59th Street-LaSalle-Garfield

Flooding Resilience Plan for Bus Operations May 18, 2018
Prepared for: RTA
AECOM 41
Route Location to Review Turn-by-Turn Reroutes
WB Garfield-Wells-59th Street-Halsted-Garfield
77 Belmont-Kostner EB Belmont-Kostner-Roscoe-Milwaukee-Pulaski-Belmont
SB Reverse of northbound
77 Belmont-
Kimball/Kedzie
EB Belmont-Kimball-Diversity-Sacramento-Belmont
WB Reverse of northbound
85 Central-Grand (Prosser HS)
NB
Central-North Ave (west)-Narrangansett Ave – Fullerton (east) – Central
(alternates are closer but may also have flooded viaducts at Grand and rr)
Central-North Ave (west) -Austin Blvd – Fullerton – Central Central-North Ave (east) - Laramie Ave – Fullerton – Central
SB Reverse of northbound
147 Michigan Ave –
on/off ramp at Oak
Street to Outer LSD
NB
Michigan to Inner Lake Shore (north) - enter Outer LSD at LaSalle/North
If LaSalle/North entrance is impassible, west on LaSalle Parkway to Stockton (north) to
Fullerton (east) to Outer LSD
SB Outer LSD-LaSalle/North-Inner Lake Shore (south) –Michigan
147 Michigan Ave-
Chicago to Oak
NB
Michigan-Chicago (west) –State (north) –Division (east) – Inner Lake Shore (north) – enter
Outer LSD at LaSalle/North
If LaSalle/North entrance is impassible, west on LaSalle Parkway to Stockton (north) to
Fullerton (east) to Outer LSD
SB Outer LSD-LaSalle-Chicago-Michigan
147 Outer LSD- Foster NB Outer LSD– Lawrence- Sheridan
SB Outer LSD- Lawrence- Outer LSD

Flooding Resilience Plan for Bus Operations May 18, 2018
Prepared for: RTA
AECOM 42
Figure 20: CTA Scenario F Reroutes

Flooding Resilience Plan for Bus Operations May 18, 2018
Prepared for: RTA
AECOM 43
Figure 21: CTA Scenario F Reroutes (North)
Figure 22: CTA Scenario F Reroutes (Central)

Flooding Resilience Plan for Bus Operations May 18, 2018
Prepared for: RTA
AECOM 44
Figure 23: CTA Scenario F Reroutes (South)
7.1.2.2 Analysis
To understand the potential travel time, cost, and revenue implications of reroutes, AECOM collected a number of datasets to assist in the understanding of ridership and operations characteristics of the Scenario F routes; operations characteristics of reroutes; and potential elasticities/ridership change factors under ordinary circumstances as well as actual ridership changes during documented storm events for which we collected hourly rainfall data, 311 flood report data, and ridership by stop and hour.
A travel time factor was developed in order to add a percentage increase to the travel time and cost per trip based on three factors: congestion, storm severity, and operating delay. Each of these three factors can be adjusted from low, moderate, or high to represent a variety of storm incidents.
7.1.2.2.1 Datasets All transit GIS data was provided by CTA, and processed by AECOM and its subconsultant UrbanGIS.
─ Bus stop locations
─ Location of OEMC/311 flood call complaints
─ Driver-reported flooding hot spot locations
─ Ventra boarding location
Flooding Resiliency Plan OPERATIONS 2016-08-31. This table provided annual daily ridership categorized by route and day type, annual revenue miles and hours by route, and estimated operating costs and revenue received by route.
Ventra boarding locations. The Ventra file provided GPS locations of boarding activity. The data was limited to the week prior to nine identified storm day incidents, as well as the nine storm day incidents. There are a few issues identified by CTA staff which may cause the exact GPS location to move away
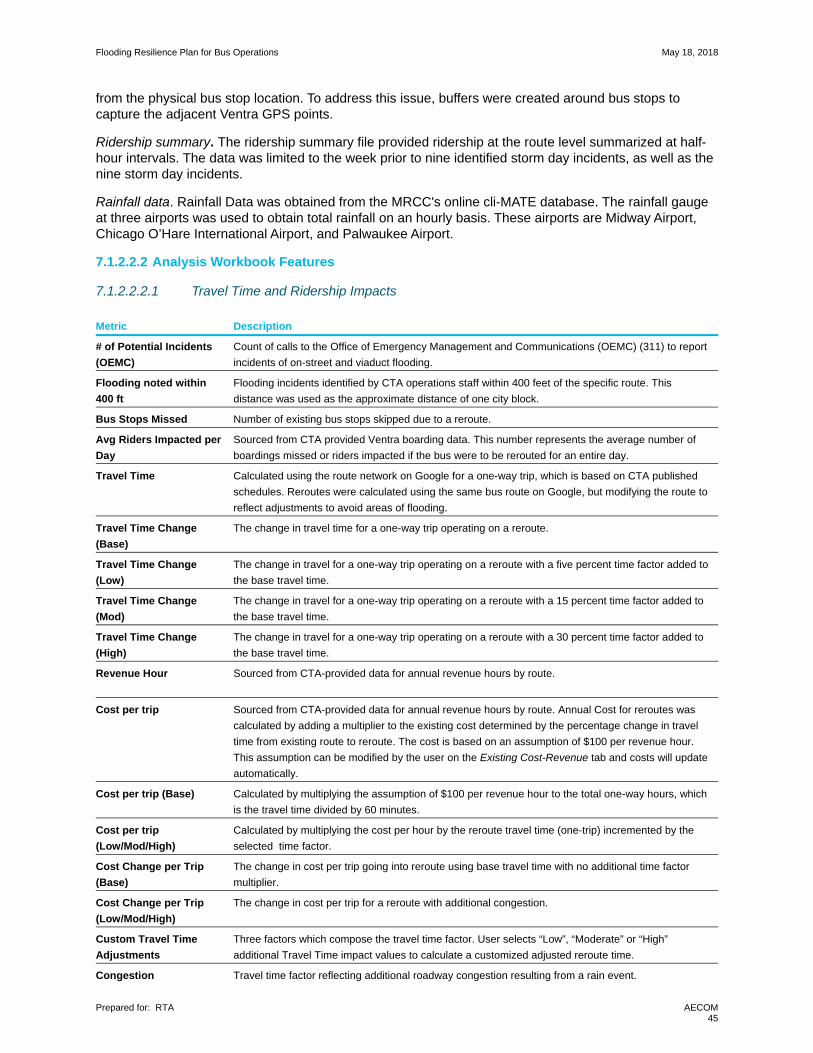
Flooding Resilience Plan for Bus Operations May 18, 2018
Prepared for: RTA
AECOM 45
from the physical bus stop location. To address this issue, buffers were created around bus stops to capture the adjacent Ventra GPS points.
Ridership summary. The ridership summary file provided ridership at the route level summarized at half-hour intervals. The data was limited to the week prior to nine identified storm day incidents, as well as the nine storm day incidents.
Rainfall data. Rainfall Data was obtained from the MRCC's online cli-MATE database. The rainfall gauge at three airports was used to obtain total rainfall on an hourly basis. These airports are Midway Airport, Chicago O’Hare International Airport, and Palwaukee Airport.
7.1.2.2.2 Analysis Workbook Features
7.1.2.2.2.1 Travel Time and Ridership Impacts Metric Description
# of Potential Incidents
(OEMC)
Count of calls to the Office of Emergency Management and Communications (OEMC) (311) to report
incidents of on-street and viaduct flooding.
Flooding noted within
400 ft
Flooding incidents identified by CTA operations staff within 400 feet of the specific route. This
distance was used as the approximate distance of one city block.
Bus Stops Missed Number of existing bus stops skipped due to a reroute.
Avg Riders Impacted per
Day
Sourced from CTA provided Ventra boarding data. This number represents the average number of
boardings missed or riders impacted if the bus were to be rerouted for an entire day.
Travel Time Calculated using the route network on Google for a one-way trip, which is based on CTA published
schedules. Reroutes were calculated using the same bus route on Google, but modifying the route to
reflect adjustments to avoid areas of flooding.
Travel Time Change
(Base)
The change in travel time for a one-way trip operating on a reroute.
Travel Time Change
(Low)
The change in travel for a one-way trip operating on a reroute with a five percent time factor added to
the base travel time.
Travel Time Change
(Mod)
The change in travel for a one-way trip operating on a reroute with a 15 percent time factor added to
the base travel time.
Travel Time Change
(High)
The change in travel for a one-way trip operating on a reroute with a 30 percent time factor added to
the base travel time.
Revenue Hour Sourced from CTA-provided data for annual revenue hours by route.
Cost per trip Sourced from CTA-provided data for annual revenue hours by route. Annual Cost for reroutes was
calculated by adding a multiplier to the existing cost determined by the percentage change in travel
time from existing route to reroute. The cost is based on an assumption of $100 per revenue hour.
This assumption can be modified by the user on the Existing Cost-Revenue tab and costs will update
automatically.
Cost per trip (Base) Calculated by multiplying the assumption of $100 per revenue hour to the total one-way hours, which
is the travel time divided by 60 minutes.
Cost per trip
(Low/Mod/High)
Calculated by multiplying the cost per hour by the reroute travel time (one-trip) incremented by the
selected time factor.
Cost Change per Trip
(Base)
The change in cost per trip going into reroute using base travel time with no additional time factor
multiplier.
Cost Change per Trip
(Low/Mod/High)
The change in cost per trip for a reroute with additional congestion.
Custom Travel Time
Adjustments
Three factors which compose the travel time factor. User selects “Low”, “Moderate” or “High”
additional Travel Time impact values to calculate a customized adjusted reroute time.
Congestion Travel time factor reflecting additional roadway congestion resulting from a rain event.
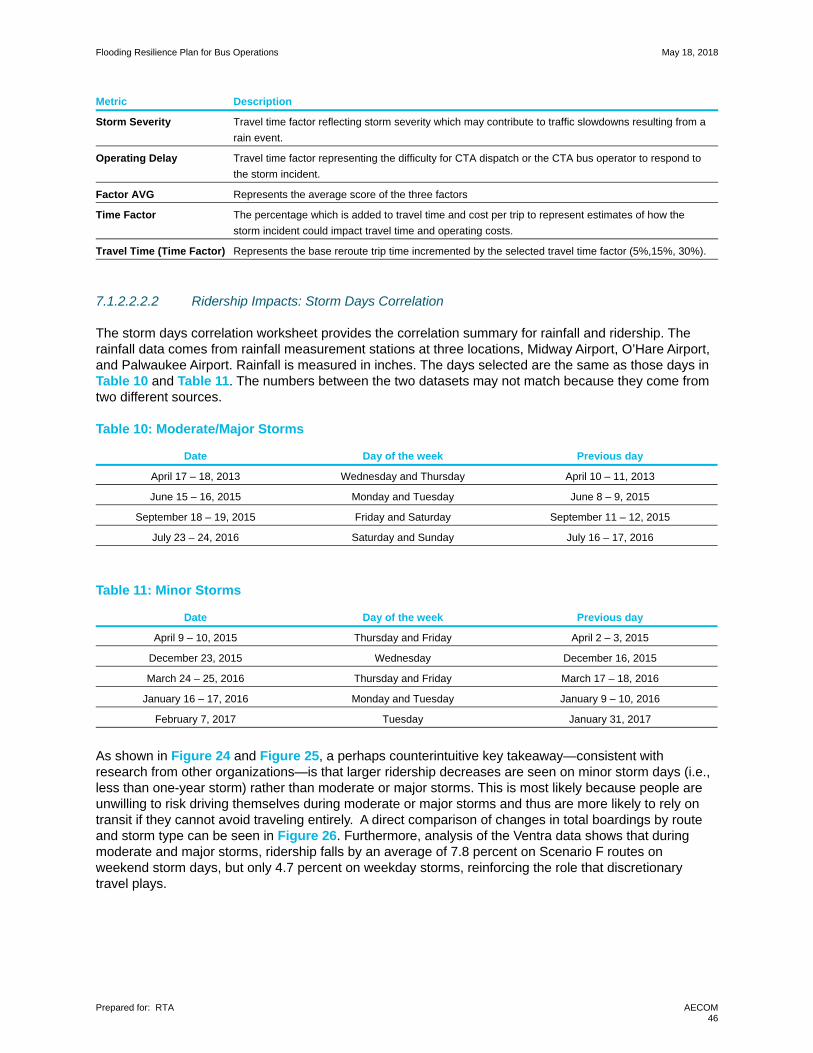
Flooding Resilience Plan for Bus Operations May 18, 2018
Prepared for: RTA
AECOM 46
Metric Description
Storm Severity Travel time factor reflecting storm severity which may contribute to traffic slowdowns resulting from a
rain event.
Operating Delay Travel time factor representing the difficulty for CTA dispatch or the CTA bus operator to respond to
the storm incident.
Factor AVG Represents the average score of the three factors
Time Factor The percentage which is added to travel time and cost per trip to represent estimates of how the
storm incident could impact travel time and operating costs.
Travel Time (Time Factor) Represents the base reroute trip time incremented by the selected travel time factor (5%,15%, 30%).
7.1.2.2.2.2 Ridership Impacts: Storm Days Correlation The storm days correlation worksheet provides the correlation summary for rainfall and ridership. The rainfall data comes from rainfall measurement stations at three locations, Midway Airport, O’Hare Airport, and Palwaukee Airport. Rainfall is measured in inches. The days selected are the same as those days in Table 10 and Table 11. The numbers between the two datasets may not match because they come from two different sources. Table 10: Moderate/Major Storms
Date Day of the week Previous day
April 17 – 18, 2013 Wednesday and Thursday April 10 – 11, 2013
June 15 – 16, 2015 Monday and Tuesday June 8 – 9, 2015
September 18 – 19, 2015 Friday and Saturday September 11 – 12, 2015
July 23 – 24, 2016 Saturday and Sunday July 16 – 17, 2016
Table 11: Minor Storms
Date Day of the week Previous day
April 9 – 10, 2015 Thursday and Friday April 2 – 3, 2015
December 23, 2015 Wednesday December 16, 2015
March 24 – 25, 2016 Thursday and Friday March 17 – 18, 2016
January 16 – 17, 2016 Monday and Tuesday January 9 – 10, 2016
February 7, 2017 Tuesday January 31, 2017
As shown in Figure 24 and Figure 25, a perhaps counterintuitive key takeaway—consistent with research from other organizations—is that larger ridership decreases are seen on minor storm days (i.e., less than one-year storm) rather than moderate or major storms. This is most likely because people are unwilling to risk driving themselves during moderate or major storms and thus are more likely to rely on transit if they cannot avoid traveling entirely. A direct comparison of changes in total boardings by route and storm type can be seen in Figure 26. Furthermore, analysis of the Ventra data shows that during moderate and major storms, ridership falls by an average of 7.8 percent on Scenario F routes on weekend storm days, but only 4.7 percent on weekday storms, reinforcing the role that discretionary travel plays.

Flooding Resilience Plan for Bus Operations May 18, 2018
Prepared for: RTA
AECOM 47
Figure 24: Ridership Change on Moderate/Major Storm Days
Figure 25: Ridership Change on Minor Storm Days
Figure 26: Percent Ridership Change by Storm Type
-10%-10%-8%
-16%
-7% -7%-5%
-7%
-3% -4%-3%
-1% -1% 0% 1%3%
-20.00%
-15.00%
-10.00%
-5.00%
0.00%
5.00%
-10,000
-7,500
-5,000
-2,500
0
2,5009 79 49 85 4 53 66 62 22 147 52 8 77 20 55 92
Routes
Absolute Ridership Change Pct Ridership Change
-18%-17%
-13%
-17%-17%
-11%-11%-11%-12%
-8%
-16%
-14%-15%
-12%
-15%
-6%
-20%
-18%
-16%
-14%
-12%
-10%
-8%
-6%
-4%
-2%
0%
-20,000
-15,000
-10,000
-5,000
09 4 77 49 20 79 8 22 53 66 85 52 55 62 92 147
Absolute Ridership Change Pct Ridership Change
-10%
0%
-7%-8%
-16%
3%1%
-3%-1%
-7% -7%
-3%-1%
-10%
-5%-4%
-20%
-15%
-10%
-5%
0%
5%9 20 4 49 85 92 55 52 77 53 62 22 8 79 66 147
Minor Storms Moderate/Major Storms

Flooding Resilience Plan for Bus Operations May 18, 2018
Prepared for: RTA
AECOM 48
7.1.2.3 Summary of Findings
The tables below summarize the impact analysis of reroutes on the Scenario F routes, including estimates of changes in stops serviced based on the reroute alignment, associated changes in ridership, changes in travel time, and associated operating costs. The estimates presented assume full implementation of reroutes as documented, including situations where a route may have multiple diversions.
7.1.2.3.1 Alignment and Ridership Impacts Table 12 presents the summary of physical and ridership characteristics of the CTA Scenario F routes with reroute alignments, as described in 7.1.2.1. In most cases, the reroute diversions reduce the number of locations where a route alignment encounters flood risk areas; however, there are situations where the reroute touches one or two additional areas. Due to the unpredictable nature of urban flooding and the influence of human design factors on the degree of flooding and speed of drainage or dispersal, this is a point to monitor rather than a concern.
The number of bus stops on the original routing missed by the reroute ranges from nominal to many; from this calculation, estimates of potential Average Daily Ridership (ADR) for the reroute are derived. Only a handful of routes experience substantial riders impacted (and potentially lost or diverted). These estimates do not take into account counteracting communications mechanisms (discussed later in this chapter) which would direct regular riders to alternate stop locations on the reroute or alternate transit routes, thus reducing the potential lost ridership.
Table 12: CTA Reroute Physical and Ridership Characteristics
Route
# of CTA-reported Flooding Incident Areas on Original
Route
Change in # CTA Flooding Incident
Areas with Reroute
Missed Bus Stops with Reroute
Avg Riders Impacted Per
Day from Reroute
4 34 0 16 2
8 21 -7 36 336
9 47 -6 4 63
J14 7 0 0 0
20 8 +1 7 44
22 3 0 0 N/A
49 89 -23 3 11
49a 89 -29 8 98
52 113 -24 98 750
53 36 -9 9 155
53 Alt 1 36 -9 9 155
53 Alt 2 36 -3 9 155
55 10 -6 18 253
62 38 0 15 87 66 Alt 1 22 -1 5 21 66 Alt 2 22 +9 5 21
77 11 -3 14 224
79 24 -3 12 87
85 E 2 +4 14 72
85 W 2 +2 14 72
85 Nar 2 -2 14 72
92 9 +3 15 31
147 Alt 1 21 -3 5 78
147 Alt 2 21 -2 5 78
147 Alt 1& 3 21 -1 2 78
147 Alt 2 & 3 21 +1 2 78
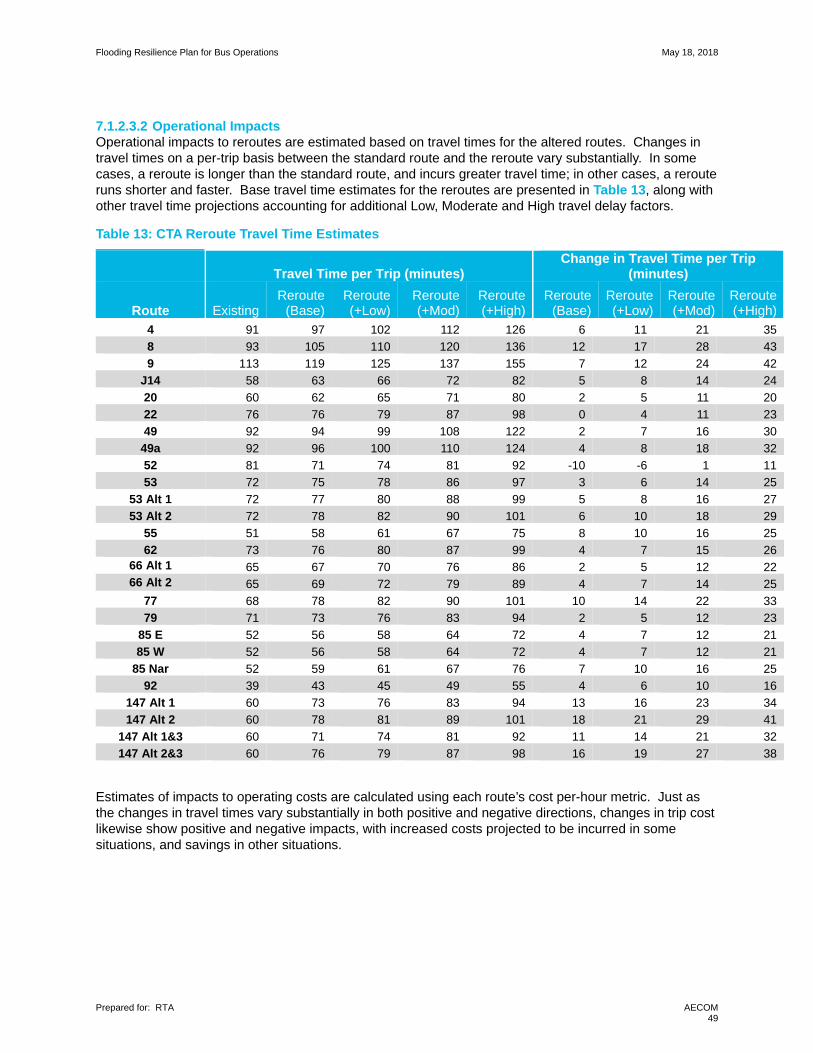
Flooding Resilience Plan for Bus Operations May 18, 2018
Prepared for: RTA
AECOM 49
7.1.2.3.2 Operational Impacts Operational impacts to reroutes are estimated based on travel times for the altered routes. Changes in travel times on a per-trip basis between the standard route and the reroute vary substantially. In some cases, a reroute is longer than the standard route, and incurs greater travel time; in other cases, a reroute runs shorter and faster. Base travel time estimates for the reroutes are presented in Table 13, along with other travel time projections accounting for additional Low, Moderate and High travel delay factors.
Table 13: CTA Reroute Travel Time Estimates
Travel Time per Trip (minutes) Change in Travel Time per Trip
(minutes)
Route Existing Reroute
(Base) Reroute (+Low)
Reroute (+Mod)
Reroute (+High)
Reroute (Base)
Reroute (+Low)
Reroute (+Mod)
Reroute (+High)
4 91 97 102 112 126 6 11 21 35
8 93 105 110 120 136 12 17 28 43
9 113 119 125 137 155 7 12 24 42
J14 58 63 66 72 82 5 8 14 24
20 60 62 65 71 80 2 5 11 20
22 76 76 79 87 98 0 4 11 23
49 92 94 99 108 122 2 7 16 30
49a 92 96 100 110 124 4 8 18 32
52 81 71 74 81 92 -10 -6 1 11
53 72 75 78 86 97 3 6 14 25
53 Alt 1 72 77 80 88 99 5 8 16 27
53 Alt 2 72 78 82 90 101 6 10 18 29
55 51 58 61 67 75 8 10 16 25
62 73 76 80 87 99 4 7 15 26 66 Alt 1 65 67 70 76 86 2 5 12 22 66 Alt 2 65 69 72 79 89 4 7 14 25
77 68 78 82 90 101 10 14 22 33
79 71 73 76 83 94 2 5 12 23
85 E 52 56 58 64 72 4 7 12 21
85 W 52 56 58 64 72 4 7 12 21
85 Nar 52 59 61 67 76 7 10 16 25
92 39 43 45 49 55 4 6 10 16
147 Alt 1 60 73 76 83 94 13 16 23 34
147 Alt 2 60 78 81 89 101 18 21 29 41
147 Alt 1&3 60 71 74 81 92 11 14 21 32
147 Alt 2&3 60 76 79 87 98 16 19 27 38
Estimates of impacts to operating costs are calculated using each route’s cost per-hour metric. Just as the changes in travel times vary substantially in both positive and negative directions, changes in trip cost likewise show positive and negative impacts, with increased costs projected to be incurred in some situations, and savings in other situations.

Flooding Resilience Plan for Bus Operations May 18, 2018
Prepared for: RTA
AECOM 50
In Table 14: CTA Reroute Cost Estimates below, these cost projections are presented as Base costs, along with other scenarios which illustrate the additional Low, Moderate and High travel delay factors which would increase costs.
Table 14: CTA Reroute Cost Estimates
Cost per Trip Change in Cost per Trip
Route Existing Reroute
(Base) Reroute (+Low)
Reroute (+Mod)
Reroute (+High)
Reroute (Base)
Reroute (+Low)
Reroute (+Mod)
Reroute (+High)
4 $152 $162 $170 $186 $210 $10 $18 $34 $59
8 $154 $174 $183 $200 $226 $20 $29 $46 $72
9 $188 $198 $208 $228 $258 $11 $21 $41 $70
J14 $97 $105 $110 $121 $137 $8 $14 $24 $40
20 $99 $70 $73 $80 $91 -$29 -$26 -$19 -$8
22 $126 $126 $132 $145 $164 $- $6 $19 $38
49 $153 $157 $165 $180 $204 $3 $11 $27 $50
49a $153 $159 $167 $183 $207 $6 $14 $30 $54
52 $134 $118 $123 $135 $153 -$17 -$11 $1 $19
53 $120 $124 $130 $143 $161 $4 $10 $23 $41
53 Alt 1 $120 $128 $134 $147 $166 $7 $14 $27 $46
53 Alt 2 $120 $130 $137 $150 $169 $10 $17 $30 $49
55 $84 $97 $102 $111 $126 $13 $17 $27 $42
62 $121 $127 $133 $146 $165 $6 $12 $25 $44
66 Alt 1 $108 $111 $116 $127 $144 $3 $9 $20 $37
66 Alt 2 $108 $114 $120 $131 $148 $7 $12 $24 $41
77 $113 $130 $137 $150 $169 $17 $23 $36 $56
79 $118 $121 $127 $139 $157 $3 $9 $21 $39
85 E $86 $93 $97 $106 $120 $7 $11 $21 $34
85 W $86 $93 $97 $106 $120 $7 $11 $21 $34
85 Nar $86 $98 $102 $112 $127 $12 $17 $26 $41
92 $65 $71 $74 $81 $92 $6 $9 $16 $27
147 Alt 1 $100 $121 $127 $139 $157 $21 $27 $39 $57
147 Alt 2 $100 $129 $136 $149 $168 $29 $36 $49 $68
147 Alt 1&3 $100 $118 $123 $135 $153 $18 $23 $35 $53
147 Alt 2&3 $100 $126 $132 $145 $164 $26 $32 $45 $64

Flooding Resilience Plan for Bus Operations May 18, 2018
Prepared for: RTA
AECOM 51
7.1.3 Pace
As noted in 5.3, a selection of bus routes (Scenario E) was made by Pace stakeholder committee members as a subset of all Pace routes to focus analysis (Figure 27: Pace Scenario E Reroutes). Features of the analysis that are specific to Pace are outlined below. The full Excel workbook was provided to Pace staff for ongoing use and interactive scenario play, and will be included in Appendix B-2. Results from the analysis using the data collected during the course of this project are summarized below.
7.1.3.1 Reroutes
Pace has defined turn-by-turn reroute directions for numerous routes throughout the region in response to historic flood incidents that have impeded regular operations. Most Scenario E routes have reroutes in place already, defined by Pace, and used routinely during storm events. Notably, these reroutes have not required further diversion, even during severe storms experienced in 2013, 2016 and 2017.
7.1.3.1.1 North Division North Division reports that three routes are impacted when the Des Plaines River floods: routes 272, 565 and 572. Des Plaines River flooding occurs occasionally. The detours listed below are used when the Des Plaines River floods. Route Turn-by-turn Reroute
272 Milwaukee Ave NB R-Willow/Palatine, L-Sanders, L-Dundee, R-Milwaukee and resume route
SB R-Dundee, L-Wolf, L-Willow/Palatine, R-Milwaukee and resume route
565 Grand Ave EB R-Riverside/Milwaukee, L-Washington, L-O’Plaine, R-Grand and resume route
WB L-O’Plaine, R-Washington, R-Milwaukee/Riverside, L-Grand and resume route
572 Washington Street EB L-Milwaukee/Riverside, R-Grand, R-O’Plaine, L-Washington and resume route
WB R-O’Plaine, L-Grand, L-Milwaukee/Riverside, R-Washington and resume route
The detours listed below are used when the Des Plaines River floods, and both Grand Avenue and Washington Street are closed simultaneously. Route Turn-by-turn Reroute
565 Grand Ave
EB R-Riverside/Milwaukee, R-to ramp to Belvidere, L-O’Plaine, R-Grand and resume route
WB L-O’Plaine, R-Belvidere, R-to ramp to Milwaukee, L-Milwaukee/Riverside, L-Grand and
resume route
572 Washington Street
EB R-Milwaukee, R-to ramp to Belvidere, L-O’Plaine, R-Washington and resume route
WB L-O’Plaine, R-Belvidere, R-to ramp to Milwaukee, L-Milwaukee, L-Washington and resume
route

Flooding Resilience Plan for Bus Operations May 18, 2018
Prepared for: RTA
AECOM 52
Figure 27: Pace Scenario E Reroutes

Flooding Resilience Plan for Bus Operations May 18, 2018
Prepared for: RTA
AECOM 53
7.1.3.1.2 North Shore Division The North Shore reports rare flooding along four routes. Des Plaines in downtown on Route 619 floods very rarely (there has not been a detour for flooding in the last few years). The detour usually involves using River Road instead of Golf Rd to Sanders; otherwise buses can take NW Hwy past NW garage to Broadway to Wolf to Palatine, etc. The flooding along Edens Expressway in Winnetka on Routes 620, 626 is also very rare and can affect deadheads. Skokie Blvd between Lincoln and Oakton on Route 210 rarely floods Blizzards are also an issue, but even more rare than flooding; when this occurs, Green Bay Road is a very reliable roadway to use. Turn by turn reroutes include: Route Turn-by-turn Reroute
210 Skokie Blvd between
Lincoln & Oakton
NB Detour from Lincoln/Skokie Blvd: continue north on Lincoln Av., R-Niles Center Rd., cross
Oakton St, regular route
SB Detour from Niles Center/Oakton St: continue south on Niles Center Rd., L-Lincoln Av,
resume regular route at Skokie Blvd
619 Des Plaines Downtown
NB
Detour from Des Plaines Metra Station: EB on Miner, L-River RD., continue past Golf Rd.,
R-Euclid/West Lake, L-Milwaukee, R-Sanders, R-Allstate/Astellas.
Alternate detour: from Des Plaines Metra Station, NB on Miner/Northwest Hwy, R-Broadway,
traffic circle to Wolf Rd, NB on Wolf Rd., R-Palatine Rd./Willow Rd. to Allstate/Astellas.
SB
Detour from Allstate/Astellas: Leaving from Astellas, R-Willow Rd., L-Sanders, L-Milwaukee,
R-West Lake/Euclid, L-River Rd., R-Lee St., R-Jefferson, L-Graceland, L-Miner St. to Des
Plaines Metra Station.
alternate detour: from Allstate/Astellas, WB on Willow/Palatine Rds., L-Wolf Rd, traffic circle,
R-State, L-Northwest Hwy/Miner S.t to Des Plaines Metra Station.
620 Edens Expressway in
Winnetka
NB Detour from Skokie Swift Station: WB Dempster St, continue to Harms Rd., R-Harms Rd, L-
Lake Ave., R-Sunset Ridge Rd., L-Willow Rd to Allstate.
SB Detour: EB Willow Rd., R-Sunset ridge Rd., L-Lake Ave., R-Harms Rd., L-Dempster, R-
Skokie Swift station
626 Edens Expressway in
Winnetka SB
From Skokie Blvd/Dundee Rd: continue south on Skokie Blvd, R-Sunset ridge Rd, L-Lake
Av, R-Harms Rd., L-Dempster St.to Skokie Swift Station
7.1.3.1.3 Northwest Division Northwest Division reports that six routes are impacted when the Des Plaines River floods: Routes 230, 208, 226, 209, 221 and 234. Des Plaines River flooding occurs about every three years, sometimes it lasts one to five days and worst case scenario, it can last one to three weeks (happened twice in 25 years). There has also been some short-term local flooding (water standing on roadway) on portions of Route 606 and 616 during heavy rain storms. The detours used when the Des Plaines River floods are listed below: Route Turn-by-turn Reroute
208 River Rd/Golf/OCC
blocked
EB EB Miner/Dempster, L-Potter, R-Golf. Regular Route
WB Golf/River/OCC blocked) WB Golf, L-Potter, R-Dempster, to Des Plaines to Regular Route
209 Busse Hwy closed at
Dempster
EB Dempster , R-Rand, R-Potter, L-Busse Hwy to regular route (all trips doing “B” trips follow
this detour)
WB R- Potter, L- NWHY, L- Dempster to regular route (all trips doing “B” trips follow this detour)
221 Trips begin/end at
Prospect Heights
Metra
NB Regular Route to Prospect Heights Metra
SB From Prospect Height Metra Regular Route
226 Busse Hwy closed at
Dempster
EB Dempster , R-Rand, R-Potter, L-Busse Hwy to regular route
WB R- Potter, L- NWHY, L- Dempster to regular route
230 River Road closed SB R- Pearson R-Thacker L-Center L- Algonquin R- White Regular route

Flooding Resilience Plan for Bus Operations May 18, 2018
Prepared for: RTA
AECOM 54
Route Turn-by-turn Reroute
264 River Road / Golf
Road closed
NB WB Miner/NWHY, R-Broadway (circle) R-state , regular route
SB L –State thru Cumberland Circle, R-State L- NWHY to Des Plaines
7.1.3.1.4 West Division West Division reports flooding-related reroutes for 10 routes, with several of the routes having detours in more than one segment due to multiple instances of street flooding. Turn-by-turn reroutes are provided below.
Route Turn-by-turn Reroute
302 Ogden between
LaGrange/East Ave
WB Westbound on Ogden, left East Ave, right 47th, right LaGrange, LaGrange/Hillgrove end of
line
EB Eastbound on Ogden, left Ashland, left Hillgrove, right LaGrange, left 47th, left East Ave, right
Ogden, regular route
303 25th near Irving Park NB Northbound on 25th, right Belmont, left Des Plaines River Rd to Roasemont CTA
SB Reverse route
309 1st Ave to Thatcher EB
Eastbound on Lake, left 1st Ave, right Chicago Ave, right Thatcher, left Lake St, regular
route
WB Reverse route
309 North Ave at Railroad
Ave
WB Westbound on North Ave, left Hillside Ave, Northlake Wal-Mart service drive to reverse
EB Eastbound on North Ave, right North Ave, right Lake St, Lake westbound I-290, right York
Rd, exit left York Rd, right 2nd Ave, regular route.
318 North Ave near 1st WB North Ave to Thatcher, left Thatcher, right Lake, right 9th Ave, left North Ave, regular route
EB Reverse route
318 25th Ave WB North Ave to 25th Ave, left 25th, right Lake, right Wolf Rd, left North Ave, regular route
EB Reverse route
319 Flooding near
Grand/Belmont
WB Grand Ave, left Thatcher/1st Ave, right North Ave, right 25th, left Grand Ave, regular route
EB Reverse route
322 1st Ave/Des Plaines WB Cermak, left Des Plaines Ave, right 26th, right 1st Ave, left Cermak, regular route
EB Reverse route
330 Washington to St.
Charles
NB Mannheim, right Washington, left Bellwood Ave, left St. Charles, right Mannheim, regular
route
SB Reverse route
330 Irving Park to
Lawrence
NB Mannheim, right Irving Park, left Des Plaines River Road, left Higgens Road, left Mannheim,
right Zemke Blvd, regular route
SB Reverse route
331 River Rd to Grand NB Departing Triton College , right 5th Ave, left North Ave, left 1st Ave, regular route
SB Reverse route
332 Irving Park to
Rosemont CTA
NB Irving Park to River Rd, left Des Plaines River Rd, right Rosemont CTA station
SB Reverse route
757 Standing water on 290 during a downpour.
7.1.3.1.5 Southwest Division The Southwest Division reports occasional flooding on two routes along the same stretch of W 100th Pl. The reroutes are listed below for both routes, though the turn-by-turn directions are identical.
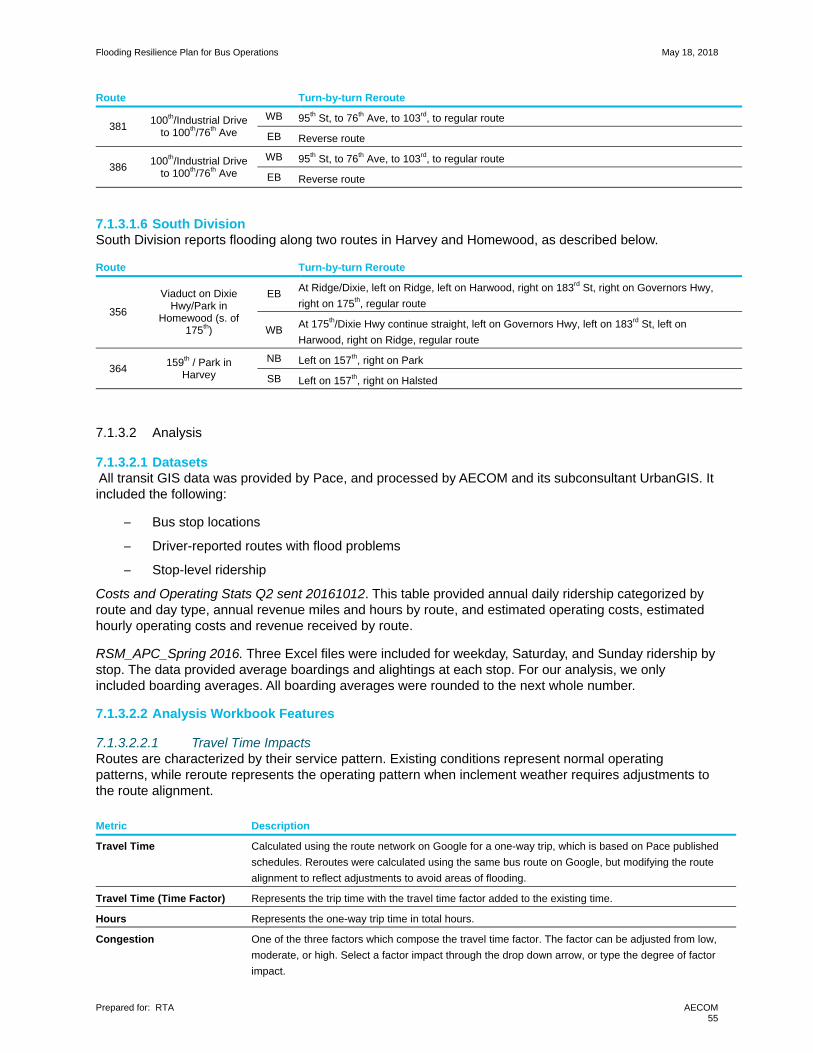
Flooding Resilience Plan for Bus Operations May 18, 2018
Prepared for: RTA
AECOM 55
Route Turn-by-turn Reroute
381 100th/Industrial Drive
to 100th/76th Ave
WB 95th St, to 76th Ave, to 103rd, to regular route
EB Reverse route
386 100th/Industrial Drive
to 100th/76th Ave
WB 95th St, to 76th Ave, to 103rd, to regular route
EB Reverse route
7.1.3.1.6 South Division South Division reports flooding along two routes in Harvey and Homewood, as described below.
Route Turn-by-turn Reroute
356
Viaduct on Dixie Hwy/Park in
Homewood (s. of 175th)
EB At Ridge/Dixie, left on Ridge, left on Harwood, right on 183rd St, right on Governors Hwy,
right on 175th, regular route
WB At 175th/Dixie Hwy continue straight, left on Governors Hwy, left on 183rd St, left on
Harwood, right on Ridge, regular route
364 159th / Park in
Harvey
NB Left on 157th, right on Park
SB Left on 157th, right on Halsted
7.1.3.2 Analysis
7.1.3.2.1 Datasets All transit GIS data was provided by Pace, and processed by AECOM and its subconsultant UrbanGIS. It included the following:
─ Bus stop locations
─ Driver-reported routes with flood problems
─ Stop-level ridership
Costs and Operating Stats Q2 sent 20161012. This table provided annual daily ridership categorized by route and day type, annual revenue miles and hours by route, and estimated operating costs, estimated hourly operating costs and revenue received by route.
RSM_APC_Spring 2016. Three Excel files were included for weekday, Saturday, and Sunday ridership by stop. The data provided average boardings and alightings at each stop. For our analysis, we only included boarding averages. All boarding averages were rounded to the next whole number.
7.1.3.2.2 Analysis Workbook Features
7.1.3.2.2.1 Travel Time Impacts Routes are characterized by their service pattern. Existing conditions represent normal operating patterns, while reroute represents the operating pattern when inclement weather requires adjustments to the route alignment. Metric Description
Travel Time Calculated using the route network on Google for a one-way trip, which is based on Pace published
schedules. Reroutes were calculated using the same bus route on Google, but modifying the route
alignment to reflect adjustments to avoid areas of flooding.
Travel Time (Time Factor) Represents the trip time with the travel time factor added to the existing time.
Hours Represents the one-way trip time in total hours.
Congestion One of the three factors which compose the travel time factor. The factor can be adjusted from low,
moderate, or high. Select a factor impact through the drop down arrow, or type the degree of factor
impact.
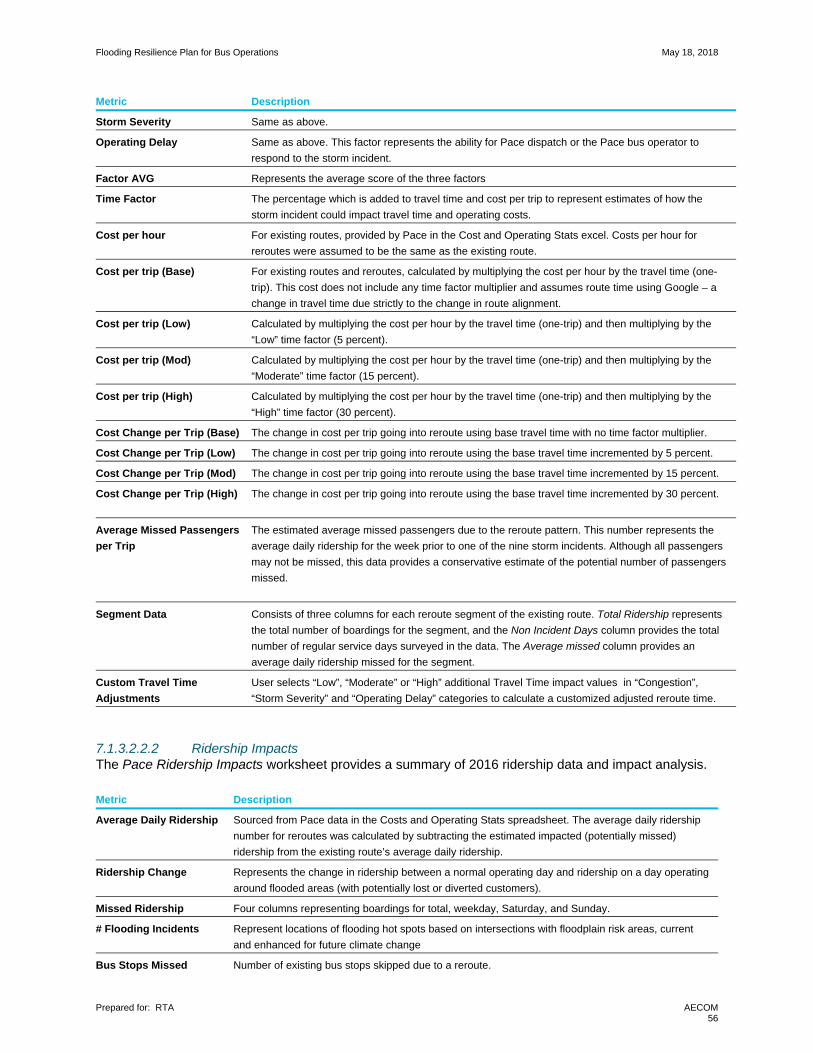
Flooding Resilience Plan for Bus Operations May 18, 2018
Prepared for: RTA
AECOM 56
Metric Description
Storm Severity Same as above.
Operating Delay Same as above. This factor represents the ability for Pace dispatch or the Pace bus operator to
respond to the storm incident.
Factor AVG Represents the average score of the three factors
Time Factor The percentage which is added to travel time and cost per trip to represent estimates of how the
storm incident could impact travel time and operating costs.
Cost per hour For existing routes, provided by Pace in the Cost and Operating Stats excel. Costs per hour for
reroutes were assumed to be the same as the existing route.
Cost per trip (Base) For existing routes and reroutes, calculated by multiplying the cost per hour by the travel time (one-
trip). This cost does not include any time factor multiplier and assumes route time using Google – a
change in travel time due strictly to the change in route alignment.
Cost per trip (Low) Calculated by multiplying the cost per hour by the travel time (one-trip) and then multiplying by the
“Low” time factor (5 percent).
Cost per trip (Mod) Calculated by multiplying the cost per hour by the travel time (one-trip) and then multiplying by the
“Moderate” time factor (15 percent).
Cost per trip (High) Calculated by multiplying the cost per hour by the travel time (one-trip) and then multiplying by the
“High” time factor (30 percent).
Cost Change per Trip (Base) The change in cost per trip going into reroute using base travel time with no time factor multiplier.
Cost Change per Trip (Low) The change in cost per trip going into reroute using the base travel time incremented by 5 percent.
Cost Change per Trip (Mod) The change in cost per trip going into reroute using the base travel time incremented by 15 percent.
Cost Change per Trip (High) The change in cost per trip going into reroute using the base travel time incremented by 30 percent.
Average Missed Passengers
per Trip
The estimated average missed passengers due to the reroute pattern. This number represents the
average daily ridership for the week prior to one of the nine storm incidents. Although all passengers
may not be missed, this data provides a conservative estimate of the potential number of passengers
missed.
Segment Data Consists of three columns for each reroute segment of the existing route. Total Ridership represents
the total number of boardings for the segment, and the Non Incident Days column provides the total
number of regular service days surveyed in the data. The Average missed column provides an
average daily ridership missed for the segment.
Custom Travel Time
Adjustments
User selects “Low”, “Moderate” or “High” additional Travel Time impact values in “Congestion”,
“Storm Severity” and “Operating Delay” categories to calculate a customized adjusted reroute time.
7.1.3.2.2.2 Ridership Impacts The Pace Ridership Impacts worksheet provides a summary of 2016 ridership data and impact analysis. Metric Description
Average Daily Ridership Sourced from Pace data in the Costs and Operating Stats spreadsheet. The average daily ridership
number for reroutes was calculated by subtracting the estimated impacted (potentially missed)
ridership from the existing route’s average daily ridership.
Ridership Change Represents the change in ridership between a normal operating day and ridership on a day operating
around flooded areas (with potentially lost or diverted customers).
Missed Ridership Four columns representing boardings for total, weekday, Saturday, and Sunday.
# Flooding Incidents Represent locations of flooding hot spots based on intersections with floodplain risk areas, current
and enhanced for future climate change
Bus Stops Missed Number of existing bus stops skipped due to a reroute.
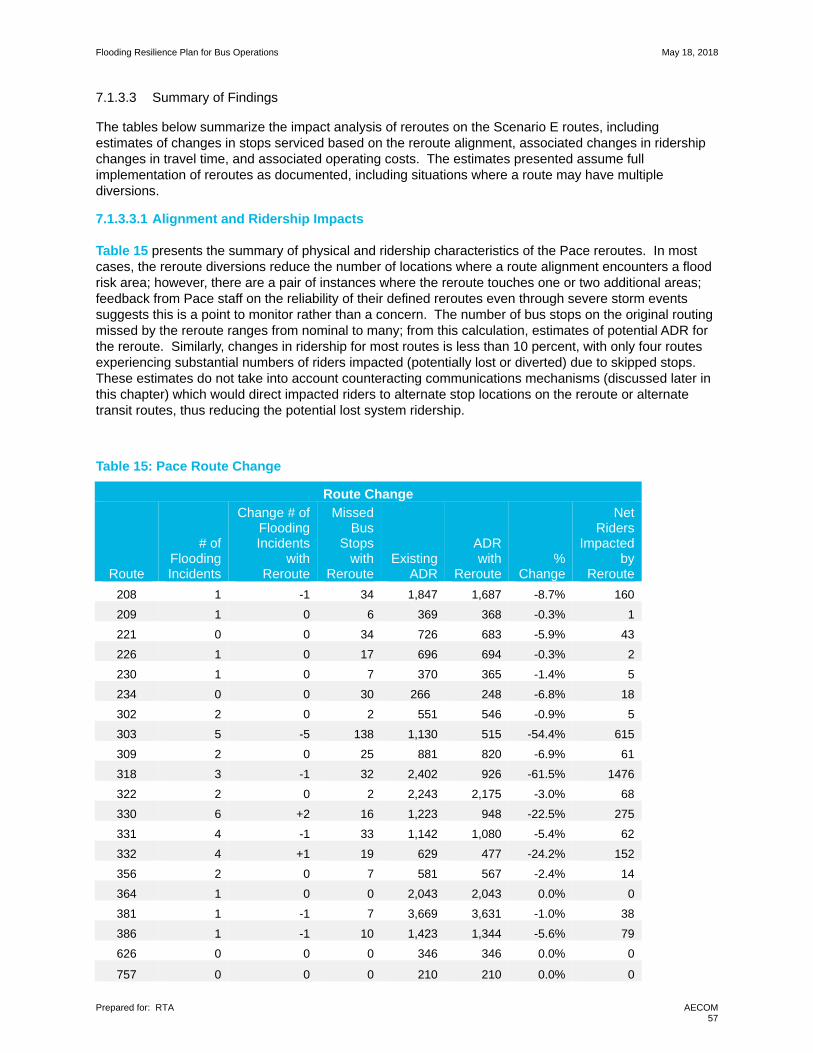
Flooding Resilience Plan for Bus Operations May 18, 2018
Prepared for: RTA
AECOM 57
7.1.3.3 Summary of Findings
The tables below summarize the impact analysis of reroutes on the Scenario E routes, including estimates of changes in stops serviced based on the reroute alignment, associated changes in ridership changes in travel time, and associated operating costs. The estimates presented assume full implementation of reroutes as documented, including situations where a route may have multiple diversions.
7.1.3.3.1 Alignment and Ridership Impacts
Table 15 presents the summary of physical and ridership characteristics of the Pace reroutes. In most cases, the reroute diversions reduce the number of locations where a route alignment encounters a flood risk area; however, there are a pair of instances where the reroute touches one or two additional areas; feedback from Pace staff on the reliability of their defined reroutes even through severe storm events suggests this is a point to monitor rather than a concern. The number of bus stops on the original routing missed by the reroute ranges from nominal to many; from this calculation, estimates of potential ADR for the reroute. Similarly, changes in ridership for most routes is less than 10 percent, with only four routes experiencing substantial numbers of riders impacted (potentially lost or diverted) due to skipped stops. These estimates do not take into account counteracting communications mechanisms (discussed later in this chapter) which would direct impacted riders to alternate stop locations on the reroute or alternate transit routes, thus reducing the potential lost system ridership.
Table 15: Pace Route Change
Route Change
Route
# of Flooding Incidents
Change # of Flooding Incidents
with Reroute
Missed Bus
Stops with
Reroute Existing
ADR
ADR with
Reroute %
Change
Net Riders
Impacted by
Reroute
208 1 -1 34 1,847 1,687 -8.7% 160
209 1 0 6 369 368 -0.3% 1
221 0 0 34 726 683 -5.9% 43
226 1 0 17 696 694 -0.3% 2
230 1 0 7 370 365 -1.4% 5
234 0 0 30 266 248 -6.8% 18
302 2 0 2 551 546 -0.9% 5
303 5 -5 138 1,130 515 -54.4% 615
309 2 0 25 881 820 -6.9% 61
318 3 -1 32 2,402 926 -61.5% 1476
322 2 0 2 2,243 2,175 -3.0% 68
330 6 +2 16 1,223 948 -22.5% 275
331 4 -1 33 1,142 1,080 -5.4% 62
332 4 +1 19 629 477 -24.2% 152
356 2 0 7 581 567 -2.4% 14
364 1 0 0 2,043 2,043 0.0% 0
381 1 -1 7 3,669 3,631 -1.0% 38
386 1 -1 10 1,423 1,344 -5.6% 79
626 0 0 0 346 346 0.0% 0
757 0 0 0 210 210 0.0% 0
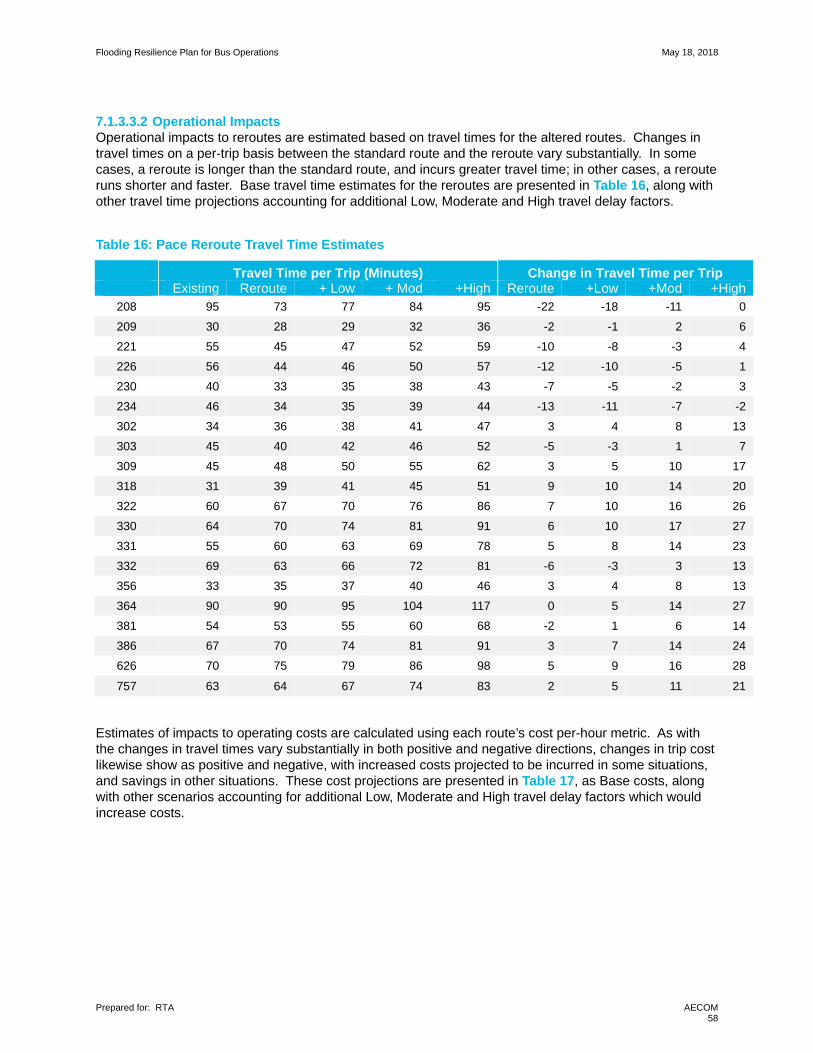
Flooding Resilience Plan for Bus Operations May 18, 2018
Prepared for: RTA
AECOM 58
7.1.3.3.2 Operational Impacts Operational impacts to reroutes are estimated based on travel times for the altered routes. Changes in travel times on a per-trip basis between the standard route and the reroute vary substantially. In some cases, a reroute is longer than the standard route, and incurs greater travel time; in other cases, a reroute runs shorter and faster. Base travel time estimates for the reroutes are presented in Table 16, along with other travel time projections accounting for additional Low, Moderate and High travel delay factors.
Table 16: Pace Reroute Travel Time Estimates
Travel Time per Trip (Minutes) Change in Travel Time per Trip Existing Reroute + Low + Mod +High Reroute +Low +Mod +High
208 95 73 77 84 95 -22 -18 -11 0
209 30 28 29 32 36 -2 -1 2 6
221 55 45 47 52 59 -10 -8 -3 4
226 56 44 46 50 57 -12 -10 -5 1
230 40 33 35 38 43 -7 -5 -2 3
234 46 34 35 39 44 -13 -11 -7 -2
302 34 36 38 41 47 3 4 8 13
303 45 40 42 46 52 -5 -3 1 7
309 45 48 50 55 62 3 5 10 17
318 31 39 41 45 51 9 10 14 20
322 60 67 70 76 86 7 10 16 26
330 64 70 74 81 91 6 10 17 27
331 55 60 63 69 78 5 8 14 23
332 69 63 66 72 81 -6 -3 3 13
356 33 35 37 40 46 3 4 8 13
364 90 90 95 104 117 0 5 14 27
381 54 53 55 60 68 -2 1 6 14
386 67 70 74 81 91 3 7 14 24
626 70 75 79 86 98 5 9 16 28
757 63 64 67 74 83 2 5 11 21
Estimates of impacts to operating costs are calculated using each route’s cost per-hour metric. As with the changes in travel times vary substantially in both positive and negative directions, changes in trip cost likewise show as positive and negative, with increased costs projected to be incurred in some situations, and savings in other situations. These cost projections are presented in Table 17, as Base costs, along with other scenarios accounting for additional Low, Moderate and High travel delay factors which would increase costs.

Flooding Resilience Plan for Bus Operations May 18, 2018
Prepared for: RTA
AECOM 59
Table 17: Pace Reroute Cost Estimates
Cost per Trip Change in Cost per Trip
Route Existing Reroute (Base) Low Mod High
Reroute (Base) Low Mod High
208 $119.78 $92.53 $97.15 $106.41 $120.29 -$27.25 -$22.63 -$13.37 $0.51
209 $38.03 $35.49 $37.26 $40.81 $46.14 -$2.54 -$0.76 $2.79 $8.11
221 $69.71 $57.04 $59.89 $65.59 $74.15 -$12.68 -$9.82 -$4.12 $4.44
226 $70.35 $55.14 $57.89 $63.41 $71.68 -$15.21 -$12.45 -$6.94 $1.33
230 $50.70 $41.83 $43.92 $48.10 $54.38 -$8.87 -$6.78 -$2.60 $3.68
234 $58.31 $42.46 $44.58 $48.83 $55.20 -$15.84 -$13.72 -$9.47 -$3.11
302 $40.84 $43.88 $46.08 $50.46 $57.05 $3.05 $5.24 $9.63 $16.21
303 $54.85 $48.76 $51.20 $56.07 $63.39 -$6.09 -$3.66 $1.22 $8.53
309 $54.85 $58.51 $61.44 $67.29 $76.06 $3.66 $6.58 $12.43 $21.21
318 $37.18 $47.54 $49.92 $54.67 $61.80 $10.36 $12.74 $17.49 $24.62
322 $73.14 $81.06 $85.11 $93.22 $105.38 $7.92 $11.98 $20.08 $32.24
330 $78.01 $85.33 $89.59 $98.13 $110.93 $7.31 $11.58 $20.11 $32.91
331 $67.04 $73.14 $76.79 $84.11 $95.08 $6.09 $9.75 $17.07 $28.04
332 $83.50 $76.18 $79.99 $87.61 $99.04 -$7.31 -$3.50 $4.11 $15.54
356 $47.86 $51.54 $54.12 $59.27 $67.01 $3.68 $6.26 $11.41 $19.14
364 $132.54 $132.54 $139.17 $152.42 $172.30 $0.00 $6.63 $19.88 $39.76
381 $59.96 $58.30 $61.21 $67.04 $75.79 -$1.67 $1.25 $7.08 $15.82
386 $74.40 $77.73 $81.62 $89.39 $101.05 $3.33 $7.22 $14.99 $26.65
626 $81.60 $87.42 $91.80 $100.54 $113.65 $5.83 $10.20 $18.94 $32.06
757 $76.18 $78.01 $81.91 $89.72 $101.42 $1.83 $5.73 $13.53 $25.23
7.2 Communications and Coordination Plans
In the event that severe rain events disrupt regular bus service, communications and coordination plans are critical for notifying the public about service changes, including reroutes. The project team developed the plans below through interviews with interested departments within CTA and Pace, as well as partner agencies such as OEMC with responsibility for public safety, to document current protocols and procedures. Both CTA and Pace have well-established procedures tested and refined over the course of numerous severe rain events as well as other types of service interruptions, weather-related and not. Recommendations from this project include identification for areas of new or deeper collaboration among interested agencies, as well as suggestions for consideration of additional technological resources; both of which are subject to available financial and human resources.
7.2.1 CTA
This CTA Bus Flood Reroute Operations Communications and Coordination Plan outlines internal and external coordination steps to support timely and efficient responses to anticipated and actual flooding along bus routes. Key activities include:
─ Communications/Power Control Center15 (C/PC) preparedness coordination with the Chicago
Office of Emergency Management & Communications (OEMC) prior to and during forecasted heavy rainfall and flooding;
15 The heart of bus service operations management and oversight is in CTA’s Communications/Power Control Center department. This department supervises all bus operations activities, communicating with drivers and field supervisors and connecting as needed to other CTA departments.
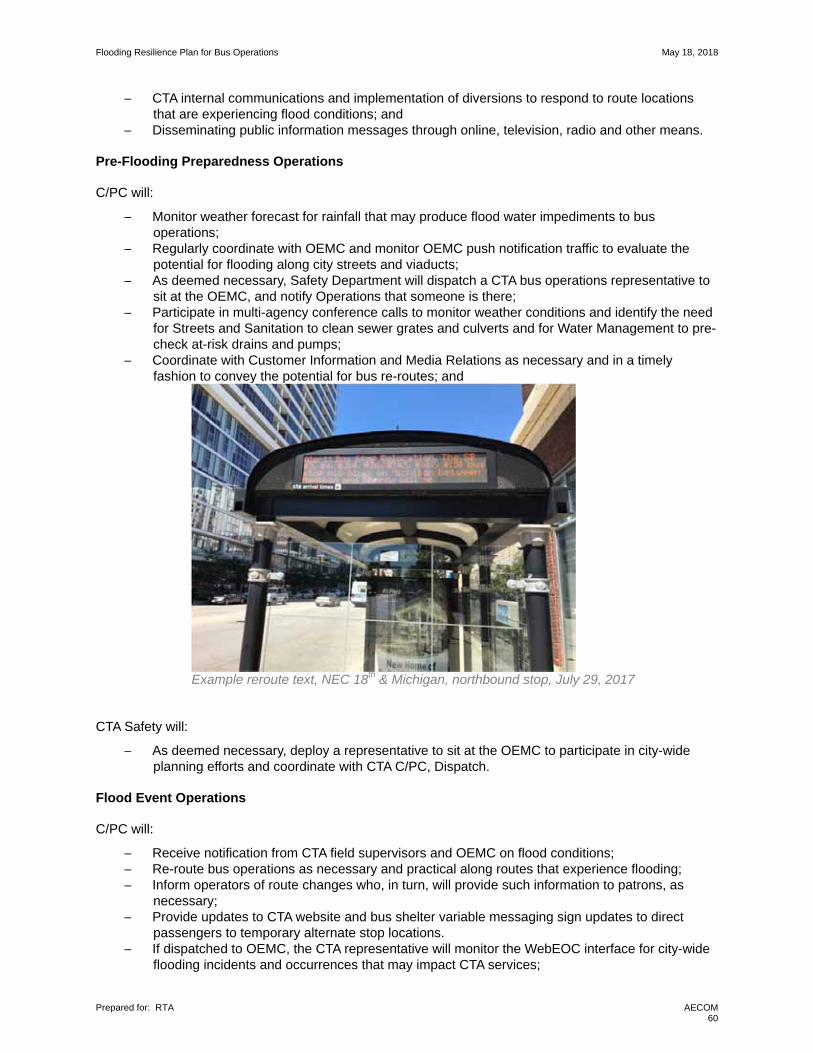
Flooding Resilience Plan for Bus Operations May 18, 2018
Prepared for: RTA
AECOM 60
─ CTA internal communications and implementation of diversions to respond to route locations that are experiencing flood conditions; and
─ Disseminating public information messages through online, television, radio and other means. Pre-Flooding Preparedness Operations
C/PC will:
─ Monitor weather forecast for rainfall that may produce flood water impediments to bus operations;
─ Regularly coordinate with OEMC and monitor OEMC push notification traffic to evaluate the potential for flooding along city streets and viaducts;
─ As deemed necessary, Safety Department will dispatch a CTA bus operations representative to sit at the OEMC, and notify Operations that someone is there;
─ Participate in multi-agency conference calls to monitor weather conditions and identify the need for Streets and Sanitation to clean sewer grates and culverts and for Water Management to pre-check at-risk drains and pumps;
─ Coordinate with Customer Information and Media Relations as necessary and in a timely fashion to convey the potential for bus re-routes; and
Example reroute text, NEC 18th & Michigan, northbound stop, July 29, 2017
CTA Safety will:
─ As deemed necessary, deploy a representative to sit at the OEMC to participate in city-wide planning efforts and coordinate with CTA C/PC, Dispatch.
Flood Event Operations
C/PC will:
─ Receive notification from CTA field supervisors and OEMC on flood conditions; ─ Re-route bus operations as necessary and practical along routes that experience flooding; ─ Inform operators of route changes who, in turn, will provide such information to patrons, as
necessary; ─ Provide updates to CTA website and bus shelter variable messaging sign updates to direct
passengers to temporary alternate stop locations. ─ If dispatched to OEMC, the CTA representative will monitor the WebEOC interface for city-wide
flooding incidents and occurrences that may impact CTA services;

Flooding Resilience Plan for Bus Operations May 18, 2018
Prepared for: RTA
AECOM 61
─ CC/Dispatch will coordinate with field supervisors and OEMC to respond to route flood conditions that are not historically typical; and
─ Coordinate with Customer Information and Media Relations to publish and relay bus service updates to the public.
CTA Safety will:
─ For major rain events, coordinate with city-wide storm/rainfall operations with OEMC; and ─ As deemed necessary, dispatch a representative to sit at OEMC, maintaining coordination with
CC/Dispatch;
CTA Customer Information will:
─ Provide supplemental information beyond standard Customer Alert information on CTA’s website, Twitter, digital signage and other online communication outlets as deemed necessary; and
─ Provide information to RTA, for its Travel Info Center.
CTA Media Relations will:
─ Convey news about CTA implementing service reroutes as flooding circumstances require, to television, radio and other media outlets as deemed necessary.
7.2.2 Pace
This Pace Bus (Pace) Flood Re-Route Operations Communications and Coordination Plan (FCCP) outlines internal and external coordinative steps to ensure timely and efficient responses to anticipated flooding public along bus routes. Such activities include:
─ Preparedness coordination with municipalities prior to the commencement of and during
forecasted heavy rainfall and flooding; ─ Pace internal communications and implementation and of diversions to respond to route
locations that are experiencing flood conditions; and ─ Disseminating public information messages through online, television, radio and other means.
Pre-Flooding Preparedness Operations
Operations will:
─ Monitor weather forecast for rainfall that may produce flood water impediments to bus operations;
─ Coordinate with local partners in anticipation of potential reroutes to confirm the decision-making process; these partners may include municipal, township, county, state, water management, police, and emergency management contacts, among others; and
─ Communicate potential detour recommendations to Service Planning via [email protected] email to Garages.
Service Planning will:
─ Obtain management approvals for service detours; ─ Prepare passenger detour notifications; and ─ Inform Communications about impending service detours to provide patrons with detour
notifications.
Communications will:
─ As informed by Service Planning, prepare to communicate potential service reroutes.

Flooding Resilience Plan for Bus Operations May 18, 2018
Prepared for: RTA
AECOM 62
Flood Operations
Operations will: ─ Garages will re-route bus operations based on information that route sections are impassible,
from drivers, supervisors, or other external sources. ─ Supervisors will coordinate with Dispatch to respond to route flood conditions that are not
historically typical; and ─ Communicate re-route activations to Service Planning via [email protected] ─ Coordinate with Communications to publish and relay bus service updates to the public.
Service Planning will:
─ Obtain management approvals for service detours; ─ Prepare passenger detour notifications; and ─ Send Communications a reroute notice to approve.
Communications will:
─ Approve Service Planning’s reroute notification and relay bus service updates to various
parties. RTA, for its Travel Info Center
Pace Customer Relations, for phone line and phone inquiries
Pace IT team, to post to website on relevant route’s web page.
Social media detour posts have been discontinued, but some service change notices and “extreme” detours – a major last-minute one, or a weather- or safety-related one – will still be posted. This would happen right away if needed.
Example GovDelivery email warnings about storm-related service interruptions, February 9, 2018
─ Send out a GovDelivery blast to passengers who have signed up for updates on a specific route. This could be 400 to 2,000 people, via email and/or text message; this update happens after the online web page post goes live.

Flooding Resilience Plan for Bus Operations May 18, 2018
Prepared for: RTA
AECOM 63
In an extreme event, Communications can put an emergency bulletin on the front page of the Pace website. Communications can then alert people via GovDelivery who have signed up for “What’s New” alerts—a wider group of subscribers than route-specific recipients. In theory, Communications could send an alert out to all subscribers, but Pace does not anticipate using such wide blasts.
Pace Garages will:
─ Either print or receive a shipment of notices to post on the actual buses. This usually happens surprisingly quickly. A detour for one route will be posted on all buses in that route’s division garage, so there are usually several notices in each bus, not all of which will always be relevant to all riders. If there is sufficient time and Pace believes the detour warrants it, laminated copies will be
posted on location. The Garage may also put the notices up at terminals.
Innovations
Pace Communications suggests innovations to enhance communications to the public in a number of areas.
─ Use of real-time information signs up at Transit Centers to display notice text. Some Transit Centers feature these signs, the remainder will have these installed in 2018. There is currently no regular practice to post service notifications, although other information (e.g., annual budget hearing notifications) is posted.
─ Use of real-time web-connected monitors on board buses would be an effective alternative to posting paper notices about planned future detours as well as active reroutes. Electronic media would allow Pace to publicize notices faster, update them frequently, enjoy flexibility in how long the notices are posted, and filter them to only show notices for selected routes (such as current route or intersecting or nearby routes). There are screens on the new Pulse buses but Pace is not quite using the screens to their full potential yet
─ Pace does not submit real-time detour information to Google Maps, Pace’s own mapping engine, or other mapping or trip-planning applications at this time, although this may be desirable in the future for Pace staff or customers to be able to see route changes real-time, if such an effort were not time-intensive or technically burdensome.

Flooding Resilience Plan for Bus Operations May 18, 2018
Prepared for: RTA
AECOM 64
This page intentionally left blank

Flooding Resilience Plan for Bus Operations May 18, 2018
Prepared for: RTA
AECOM 65
8. Resilience Strategies: Action Plan
8.1 General Strategies and Projects
8.1.1 Viaducts and Street Flooding
As documented earlier in this report, flooding under road and rail viaducts or underpasses is a common source of storm event blockage. In many situations over the course of time, roads have been lowered to allow clearance under bridge and viaduct structures to allow sufficient height for vehicles to pass. Gravity naturally can cause water to collect in these low-lying areas, which can accumulate and build if drainage technologies and systems are insufficient or not operating as needed to drain the stormwater. While every situation for blocked viaducts needs to be investigated individually to determine root causes and corrective actions, there are general commonalities that are useful to understand.
Viaduct flooding generally falls under the jurisdiction of a municipal or county water management department or agency, such as the City of Chicago’s Department of Water Management (CDWM). A water department tracks local areas that are prone to flooding, particularly during storm events, and takes steps to minimize the impacts of rain events. They also receive messages from sources such as 311 / emergency services or local government resident service hotlines. Ideally, call services (like the City of Chicago / OEMC’s Open311 service) maintain a history of infrastructure performance and facilitate communication that is open and accountable. In order for the drainage to properly occur, from the lightest rainfall to the heaviest storm event, the infrastructure must be sized properly, and in good working condition. The elements of street and parkway drainage in the public right-of-way include:
─ Street surface (pavement): The pavement must grade toward the drainage structures. If the street is in disrepair or the drainage structures are not located at the low points of the surface grade, flooding will occur.
─ Drainage structures: The drainage structures collect surface runoff and route the water to underground storm sewer pipes. The structures are mostly inlets and catch basins, but other types of structures may be utilized, such as French drains. It is imperative that these structures be kept clear of debris and be vacuumed regularly and as necessary.
─ Storm sewer: Underground pipe may be composed of masonry or metal. Typically, a water department will investigate a poorly performing drain system by televising the pipe. The video capture will show if and where a pipe collapse or blockage has occurred.
─ Pump stations: In some cases low-lying areas require a mechanical means of pumping the water up, out, and into the existing storm sewer system, which lies higher than the viaduct elevation.
Viaduct and street flooding occurs most dramatically following storm events. In most flooding cases, the water will take time to drain completely because the drain system capacity (size of sewer) is insufficient to facilitate the amount of water discharged during a storm event. In cases where one of the elements as described above are in need of repair, a water department may not be able to make the necessary repairs with a local fix, but will require extensive reconstruction. These larger capital improvements require funding, design, inter-agency coordination and time to construct. If a flood-prone area requires a construction project to repair or replace a sewer system or street, a water department will typically reach out to a sister department of transportation or engineering and all affected utilities to coordinate construction.
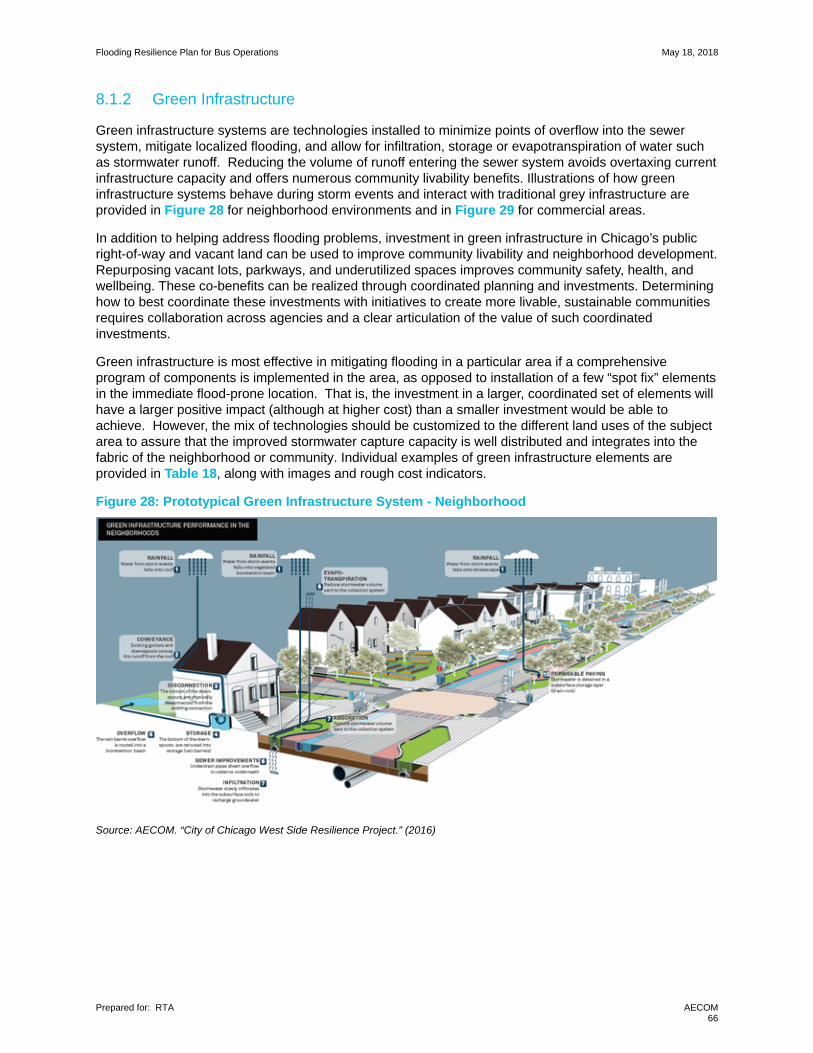
Flooding Resilience Plan for Bus Operations May 18, 2018
Prepared for: RTA
AECOM 66
8.1.2 Green Infrastructure
Green infrastructure systems are technologies installed to minimize points of overflow into the sewer system, mitigate localized flooding, and allow for infiltration, storage or evapotranspiration of water such as stormwater runoff. Reducing the volume of runoff entering the sewer system avoids overtaxing current infrastructure capacity and offers numerous community livability benefits. Illustrations of how green infrastructure systems behave during storm events and interact with traditional grey infrastructure are provided in Figure 28 for neighborhood environments and in Figure 29 for commercial areas.
In addition to helping address flooding problems, investment in green infrastructure in Chicago’s public right-of-way and vacant land can be used to improve community livability and neighborhood development. Repurposing vacant lots, parkways, and underutilized spaces improves community safety, health, and wellbeing. These co-benefits can be realized through coordinated planning and investments. Determining how to best coordinate these investments with initiatives to create more livable, sustainable communities requires collaboration across agencies and a clear articulation of the value of such coordinated investments.
Green infrastructure is most effective in mitigating flooding in a particular area if a comprehensive program of components is implemented in the area, as opposed to installation of a few “spot fix” elements in the immediate flood-prone location. That is, the investment in a larger, coordinated set of elements will have a larger positive impact (although at higher cost) than a smaller investment would be able to achieve. However, the mix of technologies should be customized to the different land uses of the subject area to assure that the improved stormwater capture capacity is well distributed and integrates into the fabric of the neighborhood or community. Individual examples of green infrastructure elements are provided in Table 18, along with images and rough cost indicators.
Figure 28: Prototypical Green Infrastructure System - Neighborhood
Source: AECOM. “City of Chicago West Side Resilience Project.” (2016)
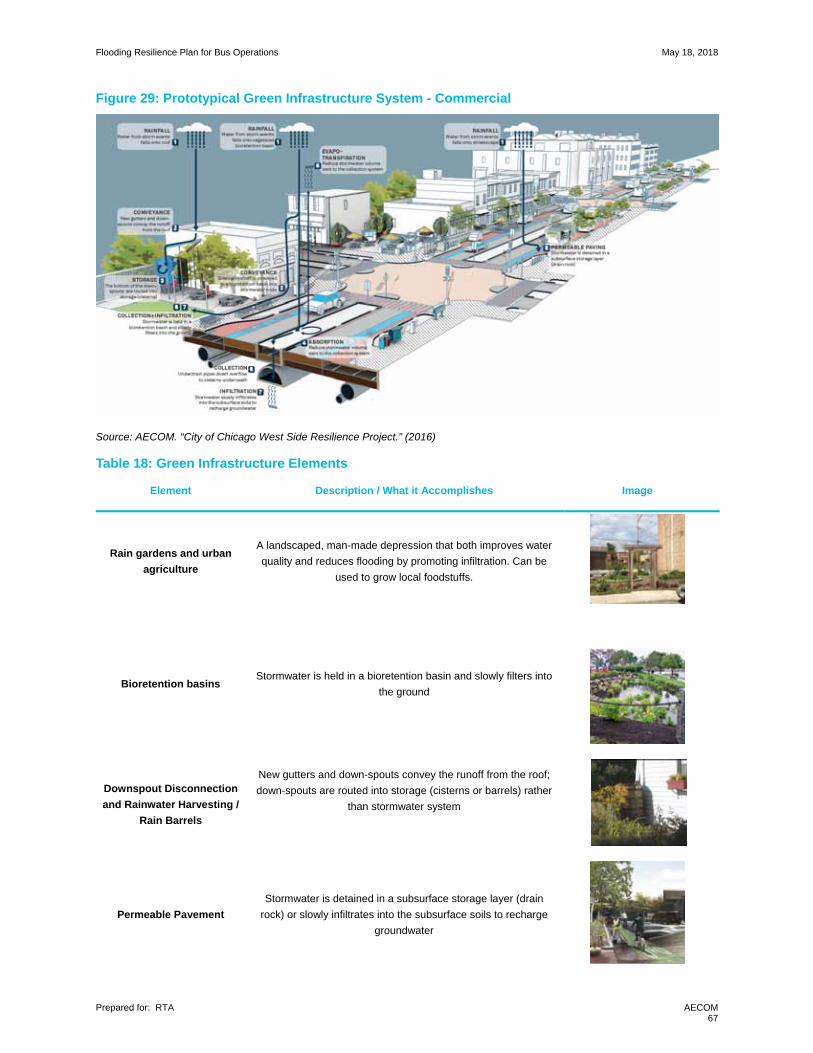
Flooding Resilience Plan for Bus Operations May 18, 2018
Prepared for: RTA
AECOM 67
Figure 29: Prototypical Green Infrastructure System - Commercial
Source: AECOM. “City of Chicago West Side Resilience Project.” (2016)
Table 18: Green Infrastructure Elements
Element Description / What it Accomplishes Image
Rain gardens and urban
agriculture
A landscaped, man-made depression that both improves water
quality and reduces flooding by promoting infiltration. Can be
used to grow local foodstuffs.
Bioretention basins Stormwater is held in a bioretention basin and slowly filters into
the ground
Downspout Disconnection
and Rainwater Harvesting /
Rain Barrels
New gutters and down-spouts convey the runoff from the roof;
down-spouts are routed into storage (cisterns or barrels) rather
than stormwater system
Permeable Pavement
Stormwater is detained in a subsurface storage layer (drain
rock) or slowly infiltrates into the subsurface soils to recharge
groundwater
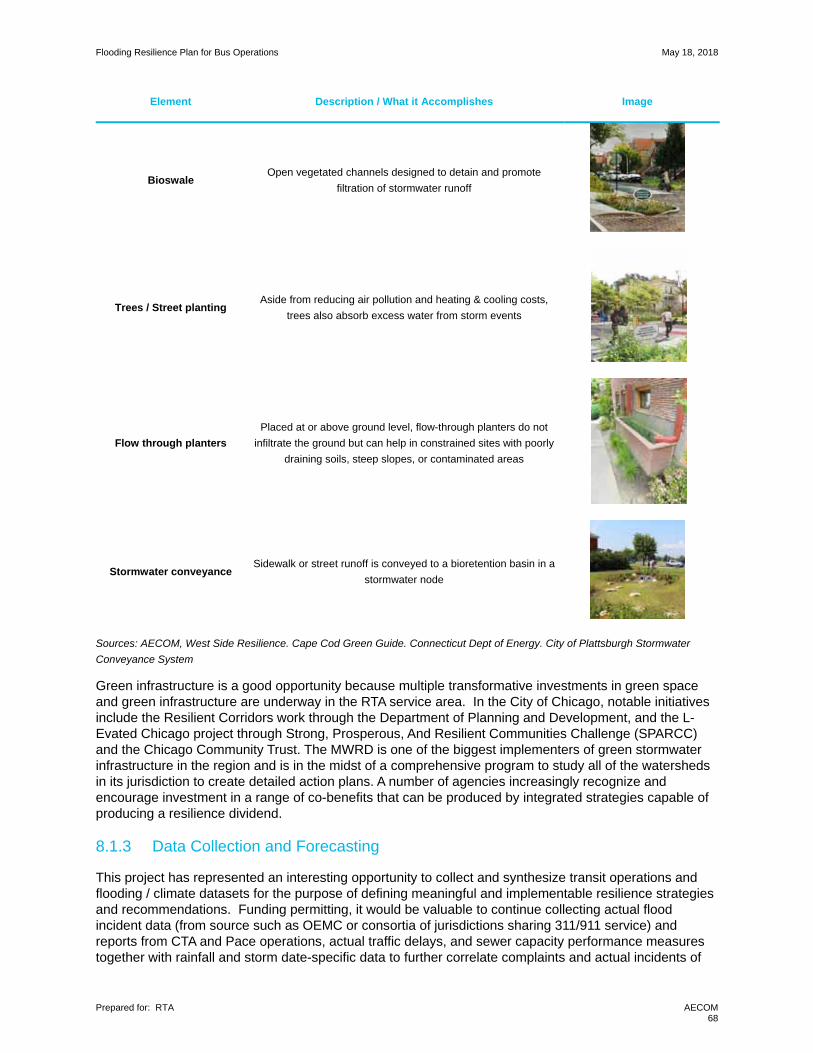
Flooding Resilience Plan for Bus Operations May 18, 2018
Prepared for: RTA
AECOM 68
Element Description / What it Accomplishes Image
Bioswale Open vegetated channels designed to detain and promote
filtration of stormwater runoff
Trees / Street planting Aside from reducing air pollution and heating & cooling costs,
trees also absorb excess water from storm events
Flow through planters
Placed at or above ground level, flow-through planters do not
infiltrate the ground but can help in constrained sites with poorly
draining soils, steep slopes, or contaminated areas
Stormwater conveyance Sidewalk or street runoff is conveyed to a bioretention basin in a
stormwater node
Sources: AECOM, West Side Resilience. Cape Cod Green Guide. Connecticut Dept of Energy. City of Plattsburgh Stormwater
Conveyance System
Green infrastructure is a good opportunity because multiple transformative investments in green space and green infrastructure are underway in the RTA service area. In the City of Chicago, notable initiatives include the Resilient Corridors work through the Department of Planning and Development, and the L-Evated Chicago project through Strong, Prosperous, And Resilient Communities Challenge (SPARCC) and the Chicago Community Trust. The MWRD is one of the biggest implementers of green stormwater infrastructure in the region and is in the midst of a comprehensive program to study all of the watersheds in its jurisdiction to create detailed action plans. A number of agencies increasingly recognize and encourage investment in a range of co-benefits that can be produced by integrated strategies capable of producing a resilience dividend.
8.1.3 Data Collection and Forecasting
This project has represented an interesting opportunity to collect and synthesize transit operations and flooding / climate datasets for the purpose of defining meaningful and implementable resilience strategies and recommendations. Funding permitting, it would be valuable to continue collecting actual flood incident data (from source such as OEMC or consortia of jurisdictions sharing 311/911 service) and reports from CTA and Pace operations, actual traffic delays, and sewer capacity performance measures together with rainfall and storm date-specific data to further correlate complaints and actual incidents of

Flooding Resilience Plan for Bus Operations May 18, 2018
Prepared for: RTA
AECOM 69
bus operations interruption with location-specific problem areas will help to further understand and prioritize flood mitigation priority areas.
8.1.4 Smart Cities Implementations
As cities and regions’ infrastructure ages, an increasing trend is the introduction of technological solutions to manage the increasingly scarce infrastructure resources with strained financial resources, growing populations and increased development, and weak political will to impose new funding sources. Advancing technologies, particularly the networked “internet of things” (IoT) offer techniques for improving the resource management of many assets related to city life, the flow of goods, people, and vehicles, and the perception of improved quality of life. This “Smart City” approach coordinates investment and innovation to improve the function of an area through the use of technology and data. As pertains to flooding that disrupts bus service, Smart Cities investments can include technologies that monitor water levels (especially where there should be little-to-none under regular conditions), traffic congestion, drain system blockages, and transmit such data to a monitoring hub that alerts CTA, Pace and local stakeholders to problems requiring immediate attention.

Flooding Resilience Plan for Bus Operations May 18, 2018
Prepared for: RTA
AECOM 70
8.2 CTA Resilience Strategies
8.2.1 Projects
By analyzing CTA-reported flooding events that were within 100 feet of a Scenario F route, the project team was able to generate a map of dense flood incident clusters in the City of Chicago. In most cases the larger clusters with a higher density of flooding reports (depicted in green in Figure 30) also have a viaduct (red dot) in the vicinity. This information, along with the acreage of the cluster and the number of reported flooding incidents is shown in Table 19.
Figure 30: CTA Flood Incident Clusters and Flood Cluster Viaducts

Flooding Resilience Plan for Bus Operations May 18, 2018
Prepared for: RTA
AECOM 71
As demonstrated in Table 19, all of the largest flooding clusters (more than five CTA-reported incidents) have a rail crossing or facility nearby. They also have 86 percent of the OEMC 311 calls reporting flooding or water on street, and 25 of the 30 viaducts in the sample set. It would be difficult to fully remediate these pervasive problems areas via green infrastructure mitigation—construction projects to address stormwater infrastructure or roadway design are probably needed. Consultation with CDOT planners and engineers suggests that for many of these rail-adjacent and viaduct-adjacent flooding problems, an effective avenue for pursuing mitigation projects is to coordinate such improvements with projects in the Chicago Region Environmental and Transportation Efficiency Program (CREATE). This public-private partnership has completed 29 of its planned 71 freight and passenger rail improvement projects to date, focusing mainly on eliminating at-grade rail crossings, but also including viaduct improvements. For more details on the 50+ viaducts improved between 2005 and 2015, see http://www.createprogram.org/factsheets/viaduct_2015.pdf.
Table 19: Properties of CTA Scenario F Flooding Clusters
Cluster ID Location
Rail nearby Acres
CTA Flood Incidents
Count
OEMC Flood
Incidents Count
Capital Improvement
Projects Nearby Viaducts
Count
1 Belmont @ Kimball 166 4 6 Yes (Dec 2013,
Water) 0
2 Western @ I-90/94 163 4 4 No 3
3 Ashland @ I-90/94 28 0 0 No 1
4 Pulaski @ Cortland Yes 346 8 4 No 2
5 Western @ Hirsch
64 3 6 No 0
6 Sacramento @ Chicago Yes 559 16 6 Yes (Sep 2013,
Arterial Surfacing) 7
7 Western @ Kinzie Yes 516 12 7 Yes (Dec 2015,
Water) 1
8 Ashland @ Kinzie Yes 590 17 5 No 2
9 Pulaski @ Kinzie Yes 481 12 7 No 6
10 Madison @ Rockwell Yes 40 2 1 No 1
11 Ashland @ I-290
69 3 0 No 0
12 Western @ Ogden Yes 752 18 2 Yes (Dec 2013,
Arterial Surfacing) 1
13 Pulaski @ Ogden Yes 45 2 0 No 0
14 Ashland @ W 41st Yes 344 8 2 No 1
15 Archer @ W 48th Yes 549 24 3 No 2
16 Kedzie @ W 48th Yes 136 3 0 Yes (Mar 2015,
Water) 0
17 Garfield @ Shields Yes 316 7 3 Yes (Aug 2014,
Arterial Surfacing) 2
18 W 79th @ Eggleston
65 1 0 No 0
19 E 79th @ Greenwood Yes 330 8 21 Yes (Dec 2013,
Water) 1
20 W 79th @ Hamilton Yes 71 3 0 No 0
21 w 79th @ Western
130 3 0 No 0
Comparing these cluster locations with the 2014-2018 Capital Improvement Plan shows that seven clusters are in proximity of a project completed since 2013 (Figure 31). These projects either involved water infrastructure or arterial surfacing, as noted in the table. There are no future projects nearby at this time, but it is possible that completed projects may already be resolving some of the historical flooding problems in the area (CTA flood incident data from 2011-2016 was used in this analysis). These areas should be monitored for ongoing problems that would be scheduled for future capital projects.

Flooding Resilience Plan for Bus Operations May 18, 2018
Prepared for: RTA
AECOM 72
Figure 31: CTA Flood Incident Clusters and Capital Improvement Projects
Aside from the Scenario F routes selected for risk analysis and mitigation recommendations, there are many other areas of the city that experience repeated flooding. Figure 32 shows the city-wide expanse of highly clustered CTA-reported flooding. This GIS layer can be overlaid with other agency data layers to determine opportunities for co-benefits in capital investment programming (supporting or supplementary to 8.2.2.1 below).
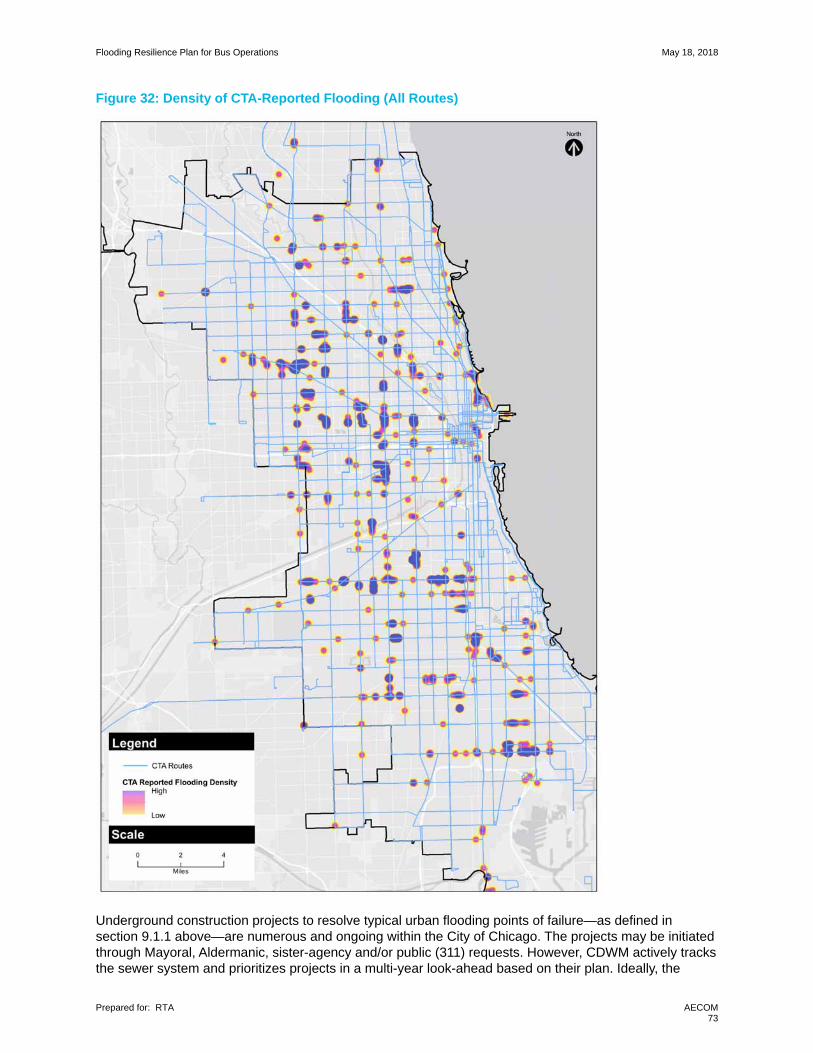
Flooding Resilience Plan for Bus Operations May 18, 2018
Prepared for: RTA
AECOM 73
Figure 32: Density of CTA-Reported Flooding (All Routes)
Underground construction projects to resolve typical urban flooding points of failure—as defined in section 9.1.1 above—are numerous and ongoing within the City of Chicago. The projects may be initiated through Mayoral, Aldermanic, sister-agency and/or public (311) requests. However, CDWM actively tracks the sewer system and prioritizes projects in a multi-year look-ahead based on their plan. Ideally, the

Flooding Resilience Plan for Bus Operations May 18, 2018
Prepared for: RTA
AECOM 74
existing sewer system would facilitate all storm events and run-off; however, due to the age of the infrastructure, or the condition of adjacent areas producing the runoff, it is an ongoing challenge for CDWM to comprehensively correct the flooding issues at once.
8.2.2 Policies and Procedures
8.2.2.1 Construction Coordination
The City of Chicago Department of Transportation’s Division of Infrastructure Management (CDOT’s DOIM) directs the Office of Underground Coordination (OUC). The OUC is composed of members who review new construction and installation work in the public way. As stated in the City of Chicago’s website, “The OUC is responsible for the protection of the City's surface and subsurface infrastructure from damage due to planned and programmed construction, installation and maintenance projects.” The OUC process contains two parts: Information Retrieval (IR) and Existing Facilities Protection (EFP). Typically, an agency or developer proposing a new project will engage the OUC for IR in the beginning of a project in order to obtain existing utility and facility maps, atlases, and other information. The intent is for the proposed plan to work around the existing infrastructure if possible. The next engagement with OUC occurs with an EFP submittal, once the plans are far enough along—typically varying from 60 percent to 90 percent complete. This step will allow the OUC to negotiate as necessary with the permit applicants to determine how conflicts may be resolved. The applicant and OUC member may resolve a conflict by moving existing facilities out of the way of new construction, which may require reimbursement to the OUC member. An OUC member may also reject the proposed impact and not approve the construction permit. This would force the designer to make changes to the plans to clear the existing utility. If possible, the proposed design clears existing utilities, and the EFP review produces no conflict from most if not all members, and the OUC construction permit is issued. The CDOT OUC members include:
─ CDOT Project Development
─ Comcast
─ CTA – Traffic (Dean Pallanti)
─ ComEd
─ RCN
─ Chicago Park District
─ Bureau of Forestry
─ MDE/Thermal Chicago Corporation
─ ComEd Distribution
─ Department of Water Management
─ JC Decaux
─ Chicago Water Partners
─ CTA – Facilities
─ People’s Energy
─ MCI
─ CDOT Infrastructure Management
─ Looking Glass Network
─ CDOT Engineering
─ AT&T – Illinois/SBC
─ Metropolitan Water Reclamation District
─ AT&T Local Network Services
─ Level 3 Communications
─ Bureau of Electricity
The CDOT OUC has developed a GIS-based system, dotMaps, which tracks on-going projects city-wide. The members meet weekly to address outstanding conflicts that are not easily resolved through the above process. Any developer or agency that is not on the above OUC member list is able to submit its project(s) through the IR and EFP process, but is also able to request a special section to the weekly OUC meeting. For example, the CTA presented the Red and Purple Modernization Program to the OUC

Flooding Resilience Plan for Bus Operations May 18, 2018
Prepared for: RTA
AECOM 75
members to provide insight for impending extensive coordination, and to discuss critical potential conflicts. Increasing the coordination of infrastructure investments in the public right-of-way has helped the city save $108 million in duplicative work since 2012, according to CDOT Division of Infrastructure Management.
Office of Underground Coordination Policy Recommendation Infrastructure agencies traditionally consider only the resilience of their own individual systems. However, true infrastructure resilience requires thinking about infrastructure outside of traditional water, sewer, road, energy, and communications silos. By considering the cascading impacts of one infrastructure system on another, targeted and coordinated investments create greater system-wide benefits.
Key to enabling targeted and coordinated investments that benefit multiple infrastructure systems is developing a mutual understanding of infrastructure agencies’ priorities, issues, and opportunities. As demonstrated in this report, in order for CTA and Pace to improve the resilience of their bus systems, region-wide flooding issues need to be addressed. Identifying solutions to these flooding issues is only the first step in creating a more resilient regional bus system. These transit agencies must also communicate their priorities to necessary partner agencies and coordinate with them to capture resilience benefits.
This communication of CTA/Pace priorities can occur through different channels. The first is through DOIM’s use of “hot lists” - DOIM may accept “hot lists” from members and sister agencies for future planned projects or project areas. They will track any potential project against the list to ensure coordination.16 CTA/Pace may be able to negotiate with the OUC to incorporate the Implementation Action Plan zones into dotMaps, and facilitate coordination between any potential construction impact within the zones with CTA or Pace. Ideally, the coordination will lead to extensive synergy. Opportunities may arise, as the OUC considers the hot list, to prioritize work to address flooding issues with severe impact to CTA/Pace operations. The coordination that may occur by attending occasional weekly OUC meetings, as well as encouraging flooding concern areas to be mapped on dotMaps, the CTA/Pace teams will be better able to review potential projects by anyone on the above OUC member list, as well as any developer or new construction. If the Implementation Plan assists in incorporating the hot list of flooding zones into OUC review and coordination, the flooding zones may be improved either by determining priority project by the utilities (such as DWM), or by OUC review to determine whether a proposed project may address an ongoing issue that negatively impacts CTA/Pace operations. CTA/Pace can also align directly with organizations not involved in the DOIM coordination efforts. Groups such as Chicago’s Department of Planning and Development (DPD) have a stated interested in accelerating the implementation of green infrastructure solutions, but do not participate in dotMaps or DOIM’s “hot lists”. Through its Resilient Corridors project, DPD aims to construct stormwater landscapes (i.e., Green Infrastructure) that not only reduce flooding but also create additional co-benefits. As the City of Chicago considers the expansion of this project to additional corridors, CTA’s priority routes can be considered. Reducing flooding on these priority routes creates added co-benefits for DPD’s projects by reducing negative impact on riders and CTA revenues from reroutes.
8.2.2.2 Communication Coordination
As noted in section 7.2.1, CTA participates in some communications and planning activities with OEMC to monitor activity during severe weather and other special events. To the extent that staffing resources and budgets allow, CTA may want to explore access to OEMC data and contact/workflow systems and regular participation in all event monitoring activities.
16 An example of this would be the Street Resurfacing program. If an underground utility proposes a project within a potential street-resurfacing area, the OUC will strive to assist either party with a benefit of restoration. Either the underground utility may restore the street if the schedule dictates, and the Resurfacing program may skip the project site; or the utility may leave behind a restored utility trench for the Resurfacing program to resurface shortly thereafter.

Flooding Resilience Plan for Bus Operations May 18, 2018
Prepared for: RTA
AECOM 76
8.3 Pace Resilience Strategies
8.3.1 Projects
Pace needs to coordinate with 3 primary agencies (MWRDGC, IDOT, and US Army Corps of Engineers) to deal with most of the flood problems identified in Scenario E. In terms of prioritizing projects to mitigate flooding issues, if Pace is having a problem, the County DOTs, County or municipal stakeholders, and stormwater agencies would be best groups to approach first, as they are probably having a problem at that same location. Cost- sharing for studying solutions with these groups may be the most effective approach. Mitigation strategies that have already been brought forward are described in Table 20 and depicted in Figure 33. Table 20: Pace Scenario E Mitigation Projects
Route Mitigation Strategy
209, 226 IDNR-OWR has built two flood control projects in this area in the last decade that should solve most of the
flooding problems shown. It is uncertain whether floodplain maps were ever updated with the results of
these projects; it might be the method of handling the enhanced flood plain in this area that flags these areas
as potential problems. These routes should experience infrequent flooding at the worst.
230 Pace needs to lobby Congress regarding funding for the Corps Des Plaines River Levee 9. The Des Plaines
River project was authorized by Congress in the Water Resources Development Act of 2016. Now Congress
has to include funding for the project in budget.
234 MWRDGC is studying reservoir expansion on Buffalo Creek upstream of this flooding problem. Need to
coordinate with MWRDGC to move this project forward.
303, 309, 330 MWRDGC’s Addison Creek project that is moving into the design phase should reduce the flood frequency
for these routes.
318 MWRDGC’s Addison Creek project and a study by IDOT on North Avenue at Silver Creek should reduce the
flooding frequency along this route.
331 The Corps Des Plaines River Levee 4 with two closure structures should reduce the flood frequency for this
route. The Grand Avenue closure structure would close Grand Avenue but will allow Des Plaines River
Road to remain open, and generally would be closed between the 10 and 50-yr flood event. The closure
structure at Des Plaines River Road and 5th Avenue would close Des Plaines River Road here during the
100-yr events.
332 DuPage County Stormwater did not show the portion of this route on 22nd Street flooding. They will need to
coordinate with Elmhurst regarding solutions for the York Road underpass flooding. The portion of the route
along Irving Park Road and Bensenville Ditch may have been addressed when Irving Park and Bensenville
Ditch were relocated for the O’Hare Airport Expansion.
626 The Aptakisic Creek flooding along a portion of this route should be coordinated with the Lake County
Stormwater Management Commission. The roads are IDOT’s jurisdiction at this location and talks about any
flooding problems here should also be discussed with IDOT.
757 The flooding shown along I-290 portion of this route should be addressed when IDOT reconstructs I-
290. PACE needs to work with IDOT on scheduling this reconstruction.

Flooding Resilience Plan for Bus Operations May 18, 2018
Prepared for: RTA
AECOM 77
Figure 33: Pace Scenario E Reroutes and Mitigation Projects

Flooding Resilience Plan for Bus Operations May 18, 2018
Prepared for: RTA
AECOM 78
This page intentionally left blank
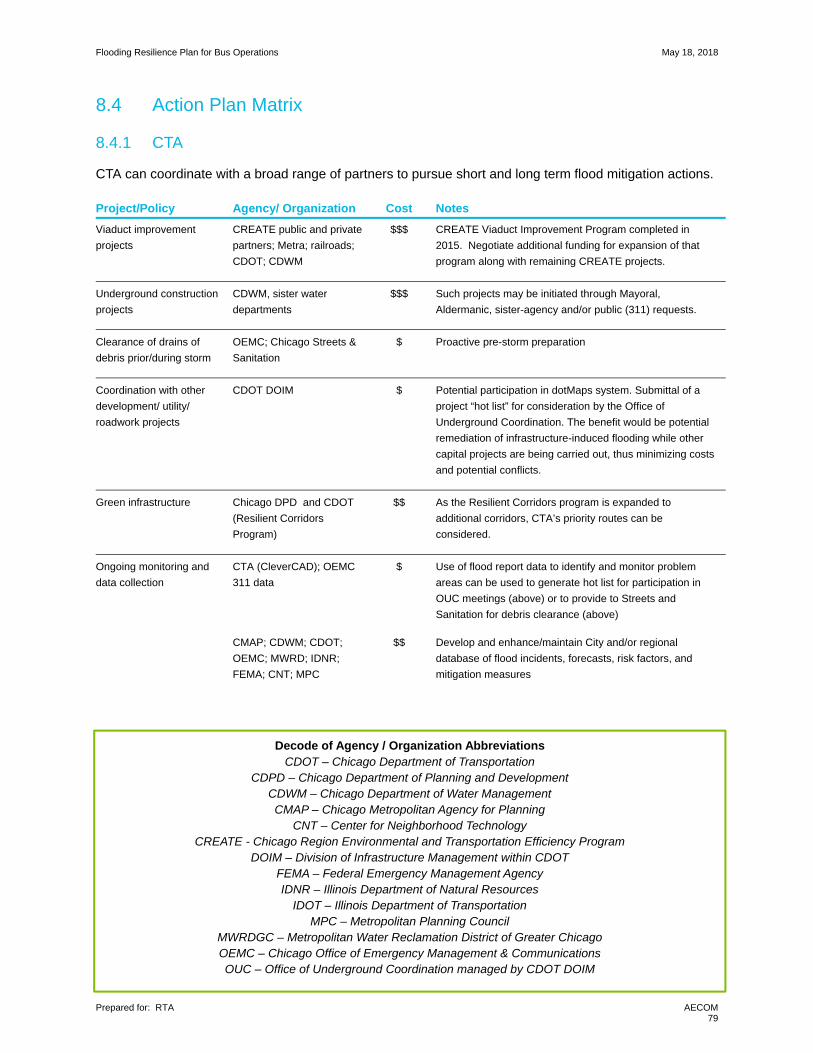
Flooding Resilience Plan for Bus Operations May 18, 2018
Prepared for: RTA
AECOM 79
8.4 Action Plan Matrix
8.4.1 CTA
CTA can coordinate with a broad range of partners to pursue short and long term flood mitigation actions. Project/Policy Agency/ Organization Cost Notes
Viaduct improvement
projects
CREATE public and private
partners; Metra; railroads;
CDOT; CDWM
$$$ CREATE Viaduct Improvement Program completed in
2015. Negotiate additional funding for expansion of that
program along with remaining CREATE projects.
Underground construction
projects
CDWM, sister water
departments
$$$ Such projects may be initiated through Mayoral,
Aldermanic, sister-agency and/or public (311) requests.
Clearance of drains of
debris prior/during storm
OEMC; Chicago Streets &
Sanitation
$ Proactive pre-storm preparation
Coordination with other
development/ utility/
roadwork projects
CDOT DOIM $ Potential participation in dotMaps system. Submittal of a
project “hot list” for consideration by the Office of
Underground Coordination. The benefit would be potential
remediation of infrastructure-induced flooding while other
capital projects are being carried out, thus minimizing costs
and potential conflicts.
Green infrastructure Chicago DPD and CDOT
(Resilient Corridors
Program)
$$ As the Resilient Corridors program is expanded to
additional corridors, CTA’s priority routes can be
considered.
Ongoing monitoring and
data collection
CTA (CleverCAD); OEMC
311 data
CMAP; CDWM; CDOT;
OEMC; MWRD; IDNR;
FEMA; CNT; MPC
$
$$
Use of flood report data to identify and monitor problem
areas can be used to generate hot list for participation in
OUC meetings (above) or to provide to Streets and
Sanitation for debris clearance (above)
Develop and enhance/maintain City and/or regional
database of flood incidents, forecasts, risk factors, and
mitigation measures
Decode of Agency / Organization Abbreviations
CDOT – Chicago Department of Transportation CDPD – Chicago Department of Planning and Development
CDWM – Chicago Department of Water Management CMAP – Chicago Metropolitan Agency for Planning
CNT – Center for Neighborhood Technology CREATE - Chicago Region Environmental and Transportation Efficiency Program
DOIM – Division of Infrastructure Management within CDOT FEMA – Federal Emergency Management Agency IDNR – Illinois Department of Natural Resources
IDOT – Illinois Department of Transportation MPC – Metropolitan Planning Council
MWRDGC – Metropolitan Water Reclamation District of Greater Chicago OEMC – Chicago Office of Emergency Management & Communications OUC – Office of Underground Coordination managed by CDOT DOIM

Flooding Resilience Plan for Bus Operations May 18, 2018
Prepared for: RTA
AECOM 80
8.4.2 Pace
Pace can coordinate with a broad range of partners to pursue short and long term flood mitigation actions. .
Project/Policy Agency/ Organization Cost Notes
Viaduct improvement
projects
CREATE public and private
partners; Metra; railroads;
local DOT
$$$ CREATE Viaduct Improvement Program completed in
2015. Negotiate additional funding for expansion of that
program along with remaining CREATE projects.
Underground construction
projects
Local and county
departments of water
management and
transportation
$$$ Such projects may be initiated through municipal, sister-
agency and/or public (311) requests.
Clearance of drains of
debris prior/during storm
Local DOT and
Departments of Streets &
Sanitation
$ Proactive pre-storm preparation
Coordination with other
development/ utility/
roadwork projects
Local Councils of
Governments
$ Participate in TIP planning process to reinforce priority
hotlist
Watershed planning
councils
MWRD, local departments
of planning, water and
transportation
$
$$
Identify risk areas and problems, with corresponding
mitigation projects and policies
Prepare stormwater master plans to address urban
flooding; five pilot studies under way or complete; expand
to other high-priority / high-flood risk areas
Green infrastructure Local departments of
planning, water and
transportation, MWRD
$$ Implement carefully curated palettes of green infrastructure
for maximum benefit
Ongoing monitoring and
data collection
Pace operating systems;
local 311/911 services;
smart cities service
providers
County and municipal
stormwater departments;
CMAP; IDNR; FEMA; CNT
$
$$
Use of flood report data to identify and monitor problem
areas can be used to generate hot list for participation in
infrastructure planning meetings (above); provide to streets
and sanitation departments for debris clearance (above)
Develop and enhance/maintain county and/or regional
database of flood incidents; rainfall, water level, and flood
forecasts; risk factors; and mitigation measures
Cost-sharing for local
capital improvement
projects to alleviate
flooding issues
County DOTs, County,
municipality, stormwater
agencies
$$ Coordinate problem diagnosis and solution planning among
agencies
Cost-sharing on major
capital improvement
projects pertaining to
riverine flooding
County and municipal
stormwater departments;
MWRDGS, IDOT, US Army
Corps of Engineers
$$$ Projects include reconstruction of a segment of I-290
(IDOT), Des Plaines River Levee 9 (US ACE), Buffalo
Creek reservoir expansion (MWRDGC), Addison Creek (in
design phase, MWRDGC), Silver Creek (IDOT), among
others


aecom.com