Flood Scoping Study - GB CMA - Goulburn Broken CMA
88
Goulburn Broken Catchment Management Authority Corop Lakes Flood Scoping Study Final Report September 2012
Transcript of Flood Scoping Study - GB CMA - Goulburn Broken CMA

Goulburn Broken Catchment Management Authority
Corop Lakes Flood Scoping Study
Final Report September 2012
31/28597/6047 Corop Lakes Flood Scoping Study
This Corop Lakes Flood Scoping Study report:
1. Has been prepared by GHD Pty Ltd for the Goulburn Broken Catchment Management Authority (CMA), Goulburn-Murray Water (G-MW) and the Shire of Campaspe;
2. May only be used and relied on by Goulburn Broken CMA, G-MW or the Shire of Campaspe; and
3. Must not be copied to, used by, or relied on by any person other than Goulburn Broken CMA, G-MW or Shire of Campaspe without the prior written consent of GHD.
GHD and its servants, employees and officers otherwise expressly disclaim responsibility to any person other than the Goulburn Broken CMA arising from or in connection with this Report.
To the maximum extent permitted by law, all implied warranties and conditions in relation to the services provided by GHD and the Report are excluded unless they are expressly stated to apply in this Report.
The services undertaken by GHD in connection with preparing this Report were limited to those described in Section 1 of the report.
The opinions, conclusions and any recommendations in this Report are based on assumptions made by GHD when undertaking services and preparing the Report. GHD expressly disclaims responsibility for any error in, or omission from, this Report arising from or in connection with any of the Assumptions being incorrect.
The opinions, conclusions and any recommendations in this Report are based on conditions encountered and information reviewed at the time of preparation. GHD has no responsibility or obligation to update this Report to account for events or changes occurring subsequent to the date that the Report was prepared.

31/28597/6047 Corop Lakes Flood Scoping Study
Contents
1. Introduction 1
2. Catchment Description 3
2.1 Deakin Drainage Basin 3 2.2 Corop Lakes Study Area Description 3
3. Flood Data Review 8
3.1 Streamflow Data 8 3.2 Rainfall Data 12 3.3 Victorian Flood Database 13 3.4 Other Plans and Reports 14
4. Consultation – Government Agencies 15
4.1 Steering Committee 15 4.2 Goulburn-Murray Water 15 4.3 Campaspe Shire Council 21 4.4 Parks Victoria 22 4.5 VicRoads 22 4.6 VicTrack 23 4.7 Goulburn Valley Water 24
5. Landholder Consultation 25
5.1 Overview of Consultation Activities 25 5.2 Summary of Community Floodplain Management Issues /
Concerns 26
6. Description of Flood Impacts 29
6.1 Flood Impacts - Towns 29 6.2 Flood Impacts – Rural 31 6.3 Discussion of Main Flood Management Issues 34
7. Review of Flood Mapping 39
7.1 Existing Flood Overlay Basis 39 7.2 Hydrology Review – Flood Frequency Analysis 39 7.3 Flood Mapping Review 42

31/28597/6047 Corop Lakes Flood Scoping Study
8. Flood Damages 44
8.1 Overview of Rapid Appraisal Method 44 8.2 Application of RAM to Corop Lakes Study Area 44 8.3 Flood Damage Analysis Results 45
9. Discussion – Future Studies 46
9.1 Future Study Considerations 46 9.2 Rural Drainage (Community Drains) 47 9.3 Identified Issues 47 9.4 Flood Warning 49
10. Summary and Recommendations 51
10.1 Description of Flooding 51 10.2 Flooding Influences 51 10.3 Flood Damages 52 10.4 Flooding Management Issues / Concerns 52 10.5 Future Studies – Flood Mapping 53 10.6 Future Studies – Floodplain Management Issues 53 10.7 Maintain / Further Develop Flood Resilient Communities 55
11. References 56
Table Index Table 3-1 Ten Highest Peak Recorded Streamflows (1960 -
May 2012) 10 Table 3-2 Ten Highest Annual Gauged Runoff Volume Years
(1960 - 2011) 11 Table 3-3 Design Rainfall Data 12 Table 5-1 Floodplain Management Issues within Corop Lakes
Study Area 26 Table 7-1 Wanalta Creek Flood Frequency Peak Design Flow
Estimates (1960-2012 inclusive) 40 Table 7-2 Cornella Creek Flood Frequency Peak Design Flow
Estimates (1960-2012 inclusive) 41 Table 8-1 Summary of Estimated Flood Damages for Corop
Lakes Study Area 45

31/28597/6047 Corop Lakes Flood Scoping Study
Table A1 Cornella Creek – Annual Recorded Peak Flows and Runoff Volume 58
Table A2 Wanalta Creek – Annual Recorded Peak Flows and Runoff Volume 59
Table B1 Miscellaneous Plans Reviewed 61 Table B2 DPI 2011 High Value Wetlands Review – Corop
Lakes Complex 63 Table B3 DPI 2011 High Value Wetlands Review – Wanalta
Woolwash Complex 64 Table D1 Data for Preliminary Flood Damages Assessment 77 Table D2 Data for Preliminary Flood Damages Assessment –
Road Lengths 77 Table D3 Estimated Flood Damages 78
Figure Index Figure 1-1 Study Area Plan 2 Figure 2-1 Catchment Plan above Waranga Western Channel 6 Figure 2-2 Study Area Features 7
Appendices A Streamflow Data B Plans / Maps Reviewed C Flood Mapping D Flood Damages E Landholder Questionnaire

1
31/28597/6047 Corop Lakes Flood Scoping Study
1. Introduction
A series of significant rainfall events from September 2010 through to February 2011 led to extensive and prolonged flooding across parts of Victoria. The Corop Lakes area was one of the regions to experience flooding during this period.
Subsequently in January 2012, the Goulburn Broken Catchment Management Area (CMA) commissioned the Corop Lakes Flood Scoping Study to:
Investigate the extent to which flooding impacts on the study area.
Assess what man made features may be influencing flooding conditions.
Identify whether a floodplain risk management study to further assess possible flood mitigation options is needed.
The study area is shown on the attached Figure 1-1.
The study included a number of community consultation activities including the distribution of a questionnaire and landholder interview sessions held over two days.
Flooding can be categorized as either riverine flooding or from local runoff. In relation to the Corop Lakes study area, riverine flooding is inundation associated with broader catchment runoff which has discharged into the Cornella Creek or Wanalta Creek systems. Broader catchment runoff conveyed by both of these creeks systems discharges into the lake / wetland network to the north of the Bendigo Murchison Road. The Goulburn Broken CMA is the responsible government agency for floodplain management (i.e. the management of land subject to riverine flooding).
Flooding due to local runoff can also be described as rural drainage flooding. Rural drainage programs, in conjunction with the community, may be coordinated by Goulburn Muurray Water (G-MW) or the Goulburn Broken CMA within irrigated and dryland areas respectively. Such programs largely require the willing of the community seeking rural drainage solutions. Within irrigated areas, there are community drains in place. In contrast however, there are no dryland drainage schemes within the Goulburn Broken CMA.
In the case of the Corop Lakes study area, riverine flooding and rural drainage issues overlap. The drainage of floodwater discharged by Cornella Creek and Wanalta Creek into the lake / wetland system relies to a certain extent on the rural drainage network present. Both the Goulburn Broken CMA and G-MW have responsibilities in this regard.

2
31/28597/6047 Corop Lakes Flood Scoping Study
Figure 1-1 Study Area Plan

3
31/28597/6047 Corop Lakes Flood Scoping Study
2. Catchment Description
2.1 Deakin Drainage Basin The Corop Lakes study area is located in what is referred to as the Deakin Drainage Basin. The Basin has a total catchment area of 1,970 km2. It consists of the intervening catchment areas between the Campaspe River catchment to the west and the Goulburn River catchment to the east. It includes the following catchments:
Cornella Creek
Wanalta Creek
Deakin Main Drain
Mosquito Depression
The Cornella and Wanalta Creeks are the two principal streams which discharge into the Corop Lakes system. Both these creeks are ephemeral streams.
The Deakin Main Drain is aligned down the east side of the lake system. The Deakin Main Drain ultimately outfalls into the Murray River, east of Echuca.
The Mosquito Depression drains the western portion of the Basin. It originates south of Tatura and drains into the Deakin Main Drain.
The Deakin Drainage Basin is well defined along its western boundary by the Mount Camel Range. The Basin’s southern boundary is located above the plains within the ranges and as such is also well defined. The eastern catchment boundary is less prominent, however generally parallels the east side of the Mosquito Depression route.
2.2 Corop Lakes Study Area Description
2.2.1 Waterway Features
The Corop Lakes study area is shown on Figure 1-1. It covers an area of approximately 600 km2. The study area is very flat, particularly on the north side of the Waranga Western Channel. The Waranga Western Channel is the main irrigation supply channel which is aligned generally westwards across the southern side of the study area. The channel then deviates northwards parallel to the foot of the Mount Camel Ranges.
Both the Cornella Creek and Wanalta Creek discharge northwards into the study area (refer Figure 2-1 and Figure 2-2). Both creeks discharge into the extensive lake /wetland system which commences approximately 5 km north of the Bendigo Murchison Road.

4
31/28597/6047 Corop Lakes Flood Scoping Study
The headwaters of the catchments draining into Cornella Creek and Wanalta Creek extend beyond the limits of the study area. In the case of Cornella Creek, the catchment boundary is located 32 km south of Colbinabbin within the Central Highlands (refer Figure 2-1). Runoff from the whole of the creek catchments has been taken into account during the Scoping Study.
Cornella Creek has a catchment area of 259 km2 at the streamflow gauging station site at Bakers Bridge Road, 1.5 km south of Colbinabbin. The catchment area at Colbinabbin including the Ryans Floodway is 270 km2. Creek flows are discharged under the Waranga Western Channel at Colbinabbin via a siphon structure. Approximately 5 km north of Colbinabbin, Cornella Creek discharges into the upper reaches of Lake Cooper and the Gaynor Swamp. Further to the north are Horseshoe Lake and Greens Lake.
Wanalta Creek has a catchment area of 108 km2 at the streamflow gauging station site at Cornella Church Road, 2 km south of Groves Weir. The creek crosses the Waranga Western Channel south of Wanalta and then discharges northwards to the One Tree Swamp. There are then a series of further wetlands including Two Tree Swamp, Wallenjoe Swamp and the Mansfield Swamp.
Catchment areas for the Wanalta Creek and its main tributaries at the Waranga Western Channel are as follows:
Wanalta Creek (includes Gobarup Creek catchment) – 114 km2
Nine Mile Creek – 59 km2
Five Mile Creek (also known as the Moora Creek) – 45 km2
Short Gully – 12 km2
The lake system provides substantial attenuation of flood flows. The multiple flood events in the second half of 2010 through to February 2011 is the first time the lake system is understood to have filled since the early 1990s.
The other significant source of floodwater inflows occurs via the Nanneella Depression at the very downstream end of the study area (refer Figure 2-2). This depression is a natural high level breakaway (or effluent stream) from the Campaspe River. It is the only flow connection between the Campaspe River and the study area system. A large siphon structure (three 3300 mm diameter pipes) is located under the Waranga Western Channel at the Nanneella Depression crossing.
2.2.2 Terrain Description
The terrain within the study area is very flat, particularly north of the Bendigo Murchison Road and east of the foot of the Mount Camel Range. Ground surface level elevations change as follows (from recently acquired aerial survey data):
99 m AHD at the Echuca Kyabram Road / Deakin Main Drain (downstream end of the study area)
102 m AHD at the Rochester Kyabram Road / Timmering Drain (10 km south, average grade of 1 in 3,300)
104 m AHD at the Midland Highway on the south side of the Mansfield Swamp (further 11 km south, average grade of 5,500)

5
31/28597/6047 Corop Lakes Flood Scoping Study
107 m AHD at the Old Corop Road adjacent to One Mile Swamp (further 10 km south, average grade of 1 in 3300)
111 m AHD at the Bendigo Murchison Road / Wanalta Creek (further 5 km south, average grade of 1 in 1,250)
117 m AHD at the Cornella Church Road / Wanalta Creek (further 4 km south, average grade of 1 in 660)
132 m AHD at the Tait Hamilton Road / Wanalta Creek (further 6 km upstream close to the upstream end of the study area, average grade of 1 in 400)
The above confirms that the land gradient north of the Old Corop Road remains extremely flat, with the flattest section between the Midland Highway and the Rochester Kyabram Road. With average gradients as flat as 1 in 5,500, it is inevitable that the drainage of floodwater and local rural runoff will be relatively slow leading to protracted inundation following significant flood events.
2.2.3 Other Features
Towns within the Corop Lakes study area are:
Colbinabbin (population 110). Both Cornella Creek and the Waranga Western Channel are aligned through the township.
Corop (population approximately 50). Corop is located adjacent to Lake Cooper and the Waranga Western Channel.
Stanhope (population 500). Stanhope is on the eastern fringe of the study area. It is located in the Deakin Main Drain catchment.
Other local settlement areas include Moora, Wanalta, Mathiesons, Carag Carag and Timmering.
All of the study area north of the Bendigo Murchison Road is located within the Goulburn-Murray Water (G-MW) irrigation district. There are multiple G-MW supply channels and drainage channels located within the study area.
The two major roads through the study area are the Midland Highway and the Bendigo Murchision Road both orientated east-west approximately perpendicular the floodplain. The Murchison East to Colbinabbin Railway parallels the Bendigo Murchision Road. The railway was closed in 1987, however the raised track and waterway structures remain largely in place.

6
31/28597/6047 Corop Lakes Flood Scoping Study
Figure 2-1 Catchment Plan above Waranga Western Channel

7
31/28597/6047 Corop Lakes Flood Scoping Study
Figure 2-2 Study Area Features

8
31/28597/6047 Corop Lakes Flood Scoping Study
3. Flood Data Review
3.1 Streamflow Data
3.1.1 Gauging Stations
There are two operating streamflow gauging stations located within the study area (refer Figure 2.1). Station details are as follows:
Cornella Creek Station Number 405230:
– Located 1.6 km south of Colbinabbin on the downstream side of Bakers Bridge Road
– Catchment area 259 km2
– Commenced operation in 1960
Wanalta Creek Station Number 405229:
– Located 2 km south of Groves Weir on the upstream side of Cornella Church Road
– Catchment area 108 km2
– Commenced operation in 1960
All of the runoff from the catchment above the Wanalta Creek gauging station is discharged via the creek channel and adjoining floodplain at the gauging station site. The flow measured by the Wanalta Creek gauging station therefore reflects all of the runoff from the upstream catchment.
In contrast, the Cornella Creek gauging station may not measure all of the runoff from the upstream catchment. In large events, breakaway flows from the Cornella Creek occur upstream of the Bakers Bridge Road. These breakaway flows discharge to the east of the main Cornella Creek floodplain, crossing the Waranga Western Channel at the Ryans Floodway siphon structure, located approximately 2 km east of where Cornella Creek crosses the Waranga Western Channel. The flow conveyed by the Ryans Creek floodway is unlikely to be accounted for in the rating table for the gauging station. Thiess Services who operate the gauging stations could not definitively confirm this however.
The ‘peak flow’ is the instantaneous flow rate at the height of a flood. It represents the highest point on an event hydrograph. It should not be confused with the total volume of floodwaters for a flood event.
To illustrate the above, the details for the recent Wanalta Creek event on the 1 March 2012 are as follows based on data recorded at the Cornella Church Road gauging station (refer Figure 3.1):
Flow commenced rising from 24 ML/d at 2.00 am on the 1 March 2012
Peak flow of 6,700 ML/d recorded at 9.45 am on the 1 March 2012
Flow rate had receded to 500 ML/d by midnight later the same day
Total volume of floodwaters was 2,280 ML for the 24 hour period on 1 March 2012
The annual peak flow rates and annual runoff volumes recorded for the Cornella Creek and Wanalta Creek gauging stations are included in Appendix A (Tables A1 and A2).

9
31/28597/6047 Corop Lakes Flood Scoping Study
Figure 3.1 Wanalta Creek – Recorded Flows March 2012
3.1.2 Peak Recorded Flows
The ten highest peak flows recorded flows at the Cornella Creek and Wanalta Creek streamflow gauging sites since the stations commenced operation in 1960 are listed in Table 3-1.
In terms of the more recent flood events, the highest peak flows recorded for Cornella Creek at the Bakers Bridge Road gauging station in 2010, 2011 and to date in 2012 are as follows:
March 2012 – 3,700 ML/d
November 2010 – 3,500 ML/d
January 2011 – 3,400 ML/d
February 2011 – 3,100 ML/d
September 2010 – 2,700 ML/d
December 2010 – 2, 600 ML/d
All of the above peak flows are lower than the ten highest peak flows listed in Table 3-1. As previously indicated, the Cornella Creek gauging station does not appear to account for breakaway flows to the east being discharged by the Ryans Floodway. This may be the reason why the Cornella Creek peak gauged flows are not significantly higher than the Wanalta Creek gauged flows, despite the significant difference in catchment area.
0
1000
2000
3000
4000
5000
6000
7000
8000
0 20 40 60 80 100 120
Peak flow 6,700 ML/d (9.45am – 1/3/12
Rising limb starts at 2.00am 1/3/12
Flow receded to 500 ML/d by midnight 1/3/12
Time (hours)
Flow (ML/d)

10
31/28597/6047 Corop Lakes Flood Scoping Study
Table 3-1 Ten Highest Peak Recorded Streamflows (1960 - May 2012)
Rank Cornella Creek (259 km2) Wanalta Creek (108 km2)
Date Peak Flow (ML/d)
Date Peak Flow (ML/d)
1 December 1992 8,570 February 1973 13,700
2 October 1974 7,890 January 1974 6,750
3 August 1973 6,020 March 2012 6,700
4 October 1975 5,580 May 1974 5,250
5 October 1993 5,570 October 1993 4,750
6 September 1983 5,520 December 1992 4,650
7 October 1979 4,970 October 1992 4,310
8 June 1995 4,820 December 2010 4,310
9 September 1964 4,760 June 1995 4,050
10 June 1968 4,290 December 2007 3,550
The highest peak flows recorded for Wanalta Creek at the Cornella Church Road gauging station in 2010, 2011 and to date in 2012 are as follows:
March 2012 – 6,700 ML/d
December 2010 – 4,300 ML/d
November 2010 – 4,200 ML/d
January 2011 – 2,800 ML/d
February 2011 – 1,100 ML/d
September 2010 – 1,000 ML/d
The March 2012 peak for Wanalta Creek is the third highest since records commenced in 1960. The December 2010 peak is the eight highest.
3.1.3 Annual Runoff Volume
The ten highest annual runoff volumes recorded at the Cornella Creek and Wanalta Creek streamflow gauging sites since the stations commenced operation in 1960 are listed in Table 3-2. The volumes given are the total volume of runoff recorded at the gauging station sites for the respective years.
In terms of total annual runoff at the respective gauging stations on each creek, the wettest year for both creeks since the stations commenced operation in 1960 is 1973 followed by 1974.

11
31/28597/6047 Corop Lakes Flood Scoping Study
For comparison purposes, the total runoff volume for the 12 month period from 1 July 2010 to 30 June 2011 is as follows:
Cornella Creek – 29,300 ML
Wanalta Creek – 13,600 ML
Both the above 12 month volumes are lower than the two highest runoff years of 1973 and 1974.
Table 3-2 Ten Highest Annual Gauged Runoff Volume Years (1960 - 2011)
Rank Cornella Creek (259km2) Wanalta Creek (108 km2)
Year Annual Runoff Volume (ML)
Year Annual Runoff Volume (ML)
1 1973 42,000 1973 21,900
2 1974 38,600 1974 16,900
3 1964 27,200 1993 11,300
4 1975 26,900 1981 9,900
5 1992 26,200 2010 9,600
6 1993 25,800 1992 9,300
7 1981 21,200 1964 9,300
8 1986 20,800 1983 9,000
9 1979 20,300 1992 7,700
10 1983 19,500 1975 7,300
12
31/28597/6047 Corop Lakes Flood Scoping Study
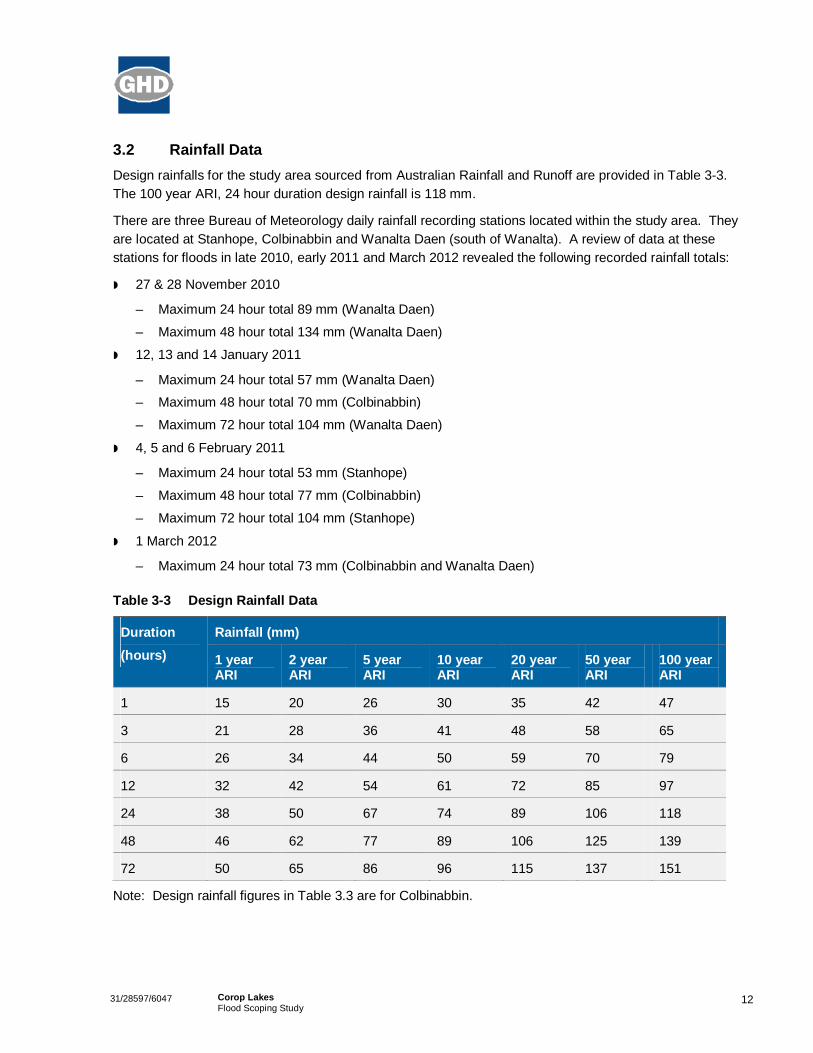
3.2 Rainfall Data Design rainfalls for the study area sourced from Australian Rainfall and Runoff are provided in Table 3-3. The 100 year ARI, 24 hour duration design rainfall is 118 mm.
There are three Bureau of Meteorology daily rainfall recording stations located within the study area. They are located at Stanhope, Colbinabbin and Wanalta Daen (south of Wanalta). A review of data at these stations for floods in late 2010, early 2011 and March 2012 revealed the following recorded rainfall totals:
27 & 28 November 2010
– Maximum 24 hour total 89 mm (Wanalta Daen)
– Maximum 48 hour total 134 mm (Wanalta Daen)
12, 13 and 14 January 2011
– Maximum 24 hour total 57 mm (Wanalta Daen)
– Maximum 48 hour total 70 mm (Colbinabbin)
– Maximum 72 hour total 104 mm (Wanalta Daen)
4, 5 and 6 February 2011
– Maximum 24 hour total 53 mm (Stanhope)
– Maximum 48 hour total 77 mm (Colbinabbin)
– Maximum 72 hour total 104 mm (Stanhope)
1 March 2012
– Maximum 24 hour total 73 mm (Colbinabbin and Wanalta Daen)
Table 3-3 Design Rainfall Data
Duration (hours)
Rainfall (mm)
1 year ARI
2 year ARI
5 year ARI
10 year ARI
20 year ARI
50 year ARI
100 year ARI
1 15 20 26 30 35 42 47
3 21 28 36 41 48 58 65
6 26 34 44 50 59 70 79
12 32 42 54 61 72 85 97
24 38 50 67 74 89 106 118
48 46 62 77 89 106 125 139
72 50 65 86 96 115 137 151
Note: Design rainfall figures in Table 3.3 are for Colbinabbin.

13
31/28597/6047 Corop Lakes Flood Scoping Study
3.3 Victorian Flood Database The Victorian Flood Database (VFD) was originally established in 1998-2000 and involved the systematic collection, collation, analysis and presentation of flood information in GIS format. The VFD data for the Corop Lakes study area was obtained from DSE at the commencement of this scoping study.
The relevant VFD report for the Corop Lakes study area is the river basin report prepared for the Deakin Basin (Sinclair Knight Merz, 2000).
3.3.1 Historic Recorded Spot Flood Heights
The VFD database includes the following recorded spot heights:
1950 flood heights between Winter Road and the Echuca Kyabram Road.
May 1974 flood heights between the Midland Highway and Winter Road.
1981 flood heights at Midland Highway either side of the Carag Road intersection.
January 2011 flood heights scattered throughout most of the study area.
3.3.2 Flood Extents
The VFD flood extents layer includes the following data:
August 1973 flood extent for the intervening area between the Midland Highway and the Bendigo Murchison Road. This flood extent is rated as being of ‘medium’ reliability.
October 1974 flood extent for the intervening area between Winter Road and upstream of the Bendigo Murchison Road. Rated as ‘low’ reliability.
October / November 1975 flood extent for the intervening area between the Kyabram Rochester Road to the upstream side of Lake Cooper. Rated as ‘low’ reliability.
Upstream (south) of Greens Lake, the flood overlay extents are based on the October 1974 aerial flood photography derived flood extent. Downstream (north) of Greens Lake, the land subject to inundation (LSI) delineation is based on both the October 1974 aerial flood photography and other data associated with a 1950 flood. The LSI extent is assessed as having ‘low’ reliability based on the VFD metadata specifications.
3.3.3 Levees
The VFD levee layer includes a number of levees, notably concentrated within the Carag Road area. These include banks constructed to specifically act as levees, but also other earthworks which act as defacto levee banks (e.g. supply channel banks, roads).
Both the landholder consultation interviews and the newly obtained LIDAR data for the study area confirmed that the current VFD levee layer does not include all of the current man made earthworks within the study area having an influence on flooding.
The Deakin Basin report (SKM, 2000) describes the private levees present within the Corop Lakes area as being able to confine minor to moderate floods, but subject to inundation in major floods.

14
31/28597/6047 Corop Lakes Flood Scoping Study
3.4 Other Plans and Reports
3.4.1 Goulburn Broken CMA Supplied Plans
The Goulburn Broken CMA provided maps and plans held by the CMA considered relevant to flooding of the Corop Lakes study area at the commencement of the scoping study. Comments on the maps and plans reviewed are provided in Table B1 of Appendix B. The maps include the following:
Aerial flood photography (September / November 1973, October 1974, November 1975 and August 1981)
Survey data (e.g. levee banks, road culverts)
Recorded spot flood heights (1974 and 1981)
3.4.2 2011 DPI Report
The Department of Primary Industries produced a report in 2011 (DPI, 2011) which identifies optional environmental water (i.e. allocated water from irrigation supply network) delivery points for high value wetlands. The report is aimed at providing information to agencies such as the Northern Victoria Irrigation Renewal Project (NVIRP) who are responsible for irrigation infrastructure modernisation works. The high value wetlands covered by the report are based on the Goulburn Broken CMA’s ‘Priority Wetlands in the Goulburn Broken Catchment’.
A summary of the respective wetlands within the Corop Lakes study area sourced from the 2011 DPI report is provided in Tables B2 and B3 of Appendix B.
3.4.3 G-MW Waranga Western Channel Cross Drainage Structure Details
G-MW supplied details of cross drainage structures on the Waranga Western Drainage Channel route. Information provided for structures included:
Locality plans
Data inventory sheet for each structure (structure dimensions, indicative discharge capacity)
Photographs
15
31/28597/6047 Corop Lakes Flood Scoping Study
4. Consultation – Government Agencies
4.1 Steering Committee A Steering Committee was established by the Goulburn Broken CMA for the Corop Lakes Scoping Study. The Steering Committee was comprised of the following members:
Goulburn Broken CMA (four members)
Community / landholders (six members)
Campaspe Shire Council (two members)
G-MW (one member)
DSE (one member)
Parks Victoria (one member)
Bureau of Meteorology (one member)
SES (one member)
The Steering Committee met on two occasions during the course of the study. An inception meeting was held on the 22 February 2012. The inception meeting included a half day tour of the study area. A second meeting was held on the 27 August 2012. An overview of the Scoping Study draft report was presented to the Steering Committee at this second meeting.
4.2 Goulburn-Murray Water Goulburn-Murray Water (G-MW) is responsible for the operation of the irrigation delivery system within the study area. This includes the management of Lake Cooper and Greens Lake, both of which are located on public land.
The Goulburn Bulk Entitlement states that G-MW can harvest all water from Wanalta Creek and Cornella Creek. Water harvested can be captured where these two creeks intersect with the Waranga Western Channel.
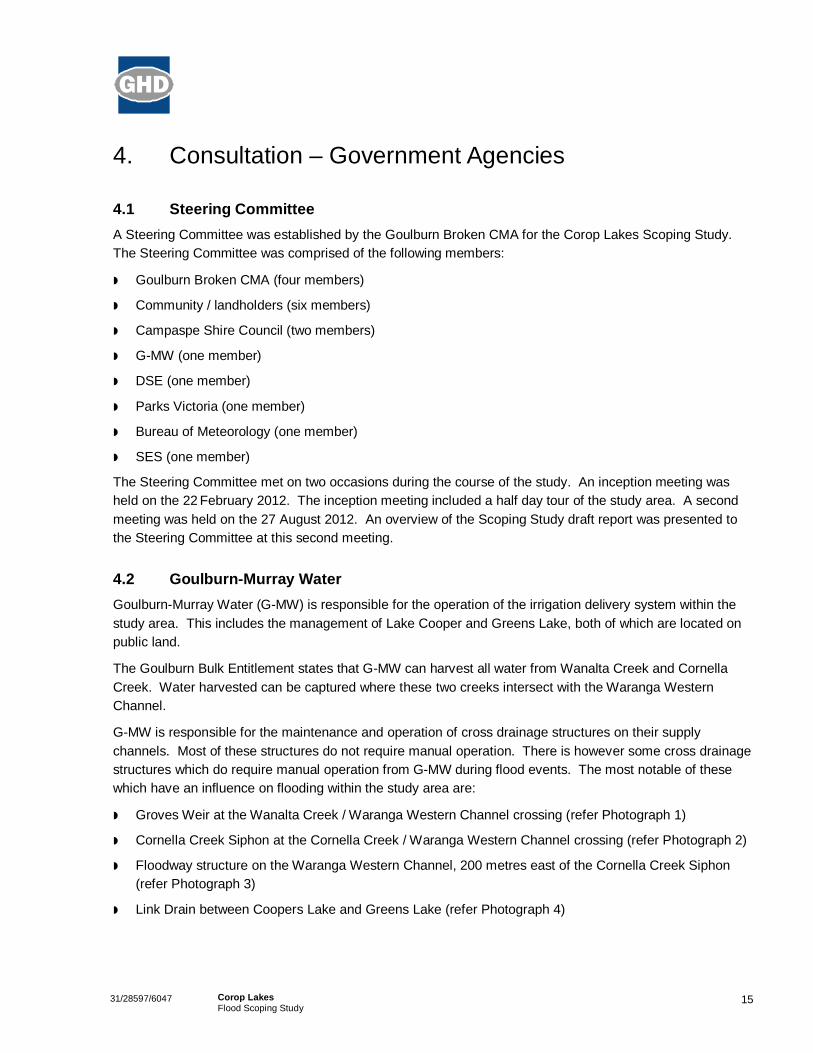
G-MW is responsible for the maintenance and operation of cross drainage structures on their supply channels. Most of these structures do not require manual operation. There is however some cross drainage structures which do require manual operation from G-MW during flood events. The most notable of these which have an influence on flooding within the study area are:
Groves Weir at the Wanalta Creek / Waranga Western Channel crossing (refer Photograph 1)
Cornella Creek Siphon at the Cornella Creek / Waranga Western Channel crossing (refer Photograph 2)
Floodway structure on the Waranga Western Channel, 200 metres east of the Cornella Creek Siphon (refer Photograph 3)
Link Drain between Coopers Lake and Greens Lake (refer Photograph 4)

16
31/28597/6047 Corop Lakes Flood Scoping Study
Photograph 1 Groves Weir – view from west bank on downstream side of weir
Photograph 2 Cornella Creek – view upstream at Waranga Western Channel siphon

17
31/28597/6047 Corop Lakes Flood Scoping Study
Photograph 3 Floodway at Colbinabbin – view looking east on north side of Channel (78 gates)
Photograph 4 Lake Cooper Outfall Drain - view north from regulator

18
31/28597/6047 Corop Lakes Flood Scoping Study
The operation of the Waranga Western Channel itself also has an influence on the operation of the above structures. The capacity of the Waranga Western Channel is approximately 3,000 ML/d.
Further details are provided as follows in relation to G-MW’s operating procedures for the above structures. The details are based on information posted on G-MW’s web site.
4.2.1 Wanalta Creek Floodway (Groves Weir)
Wanalta Creek crosses the Waranga Western Channel at Groves Weir. Groves Weir is a semi-permanent wetland associated with the Wanalta Creek pool created on the upstream side of the Waranga Western Channel. The Wanalta Creek Floodway structure into Wanalta Creek (Groves Weir) consists of a central automated pivot gate with 28 further manual operation undershot doors. Inflows into Groves Weir from Wanalta Creek are generally harvested by G-MW (i.e. passed down the Waranga Western Channel for downstream irrigation use or storage at Greens Lake).
G-MW’s operating procedures for the Wanalta Creek Floodway structure are designed to:
Maintain the physical integrity of the Waranga Western Channel.
Make the Waranga Western Channel as transparent to flood flows as possible.
Where possible pass a portion of flood flows down the Waranga Western Channel where such action will not adversely impact on others downstream.
Minimise the release of irrigation water into the Wanalta Creek.
The ability of G-MW to achieve these objectives is limited by the physical resources at the site. The operating procedures posted on the G-MW website can be summarised as follows:
Monitoring of flows in the upstream Wanalta Creek is able to be done remotely (via the telemetered streamflow gauge 2 km upstream of the Weir). This information is obtained by manually calling the telemark following known rainfall events.
During the irrigation off-season: All doors on the Wanalta Creek Floodway structure are opened to allow Wanalta Creek flows to pass through the Weir into the downstream section of Wanalta Creek. The Wanalta Creek regulator (in-line with the Waranga Western Channel) may also be closed after draining the upstream pool to prevent Wanalta Creek flows being passed down the Channel.
During periods when the Waranga Western Channel has been filled, but water deliveries are not taking place: All doors on the Wanalta Creek Floodway structure are closed and the SCADA controlled central door is set in upstream level control to allow incoming flows from Wanalta Creek to be passed down Wanalta Creek in the first instance.
During periods when the Waranga Western Channel is being used for irrigation deliveries: All doors on the Wanalta Creek Floodway structure are closed and the central SCADA controlled central door is set in upstream level control to allow incoming flows from Wanalta Creek to be passed down Wanalta Creek in the first instance.
During periods of high inflows from Wanalta Creek when the Waranga Western Channel is filled regardless of whether deliveries are taking place or not: Initial inflows will be passed through the

19
31/28597/6047 Corop Lakes Flood Scoping Study
Wanalta Creek Floodway structure via the SCADA controlled central door. The operation of the SCADA door will send an alarm to G-MW operators. G-MW operators will phone the upstream telemark to assess the likely inflows. G-MW operators will then assess the options for reducing flow from Waranga Basin, passing increased inflows down the Waranga Western Channel (subject to constraints), lowering of the water level in the Wanalta pool and/or opening additional doors on the Wanalta Creek Floodway structure.
4.2.2 Cornella Creek Floodway
Cornella Creek crosses the Waranga Western Channel on the eastern side of Colbinabbin, 50 metres upstream of the Bendigo-Murchison Road. There is a five barrel subway under the Waranga Western Channel for the cross drainage of Cornella Creek flows. (Cornella Creek Subway).
A cross drainage floodway structure is located 200 metres east of the Cornella Creek subway consisting of 78 manually operated doors on each side of the Waranga Western Channel.
There is a high level overflow sill to the west of the Cornella Creek subway on the south side of the Waranga Western Channel. A further overflow sill is located on the east side of the Waranga Western Channel, downstream (north) of the Colbinabbin Recreation Reserve.
G-MW’s operating procedures for the Cornella Creek cross drainage structures are designed to:
Maintain the physical integrity of the Waranga Western Channel.
Make the Waranga Western Channel as transparent to flood flows as possible.
Where possible pass a portion of flood flows down the Waranga Western Channel where such action will not adversely impact on others downstream.
Minimise the release of irrigation water into the Cornella Creek.
The ability of G-MW to achieve these objectives is limited by the physical resources at the site. The operating procedures posted on the G-MW website can be summarised as follows:
Monitoring of water / flood levels in Cornella Creek upstream of the Waranga Western Channel is based on manual visual inspections. Data for the streamflow gauge at Bakers Bridge Road cannot be accessed remotely as confirmed by Thiess Services.
During the irrigation off-season: If the Waranga Western Channel has been lowered over winter, the outlet doors on the Cornella Creek subway should be fully open and the 78 floodway doors (both sides) removed to allow Cornella Creek flows to pass into the downstream section of Cornella Creek.
During periods when the Waranga Western Channel has been filled, but water deliveries are not taking place: All outlet doors on the Cornella Creek subway are closed and the 78 floodway doors (both sides) are installed to maintain the Colbinabbin pool level. Cornella Creek flows pass through the Cornella Creek subway remaining within the creek.
During periods when the Waranga Western Channel is being used for irrigation deliveries: All outlet doors on the Cornella Creek subway are closed and the 78 floodway doors (both sides) are installed to
20
31/28597/6047 Corop Lakes Flood Scoping Study
maintain the Colbinabbin pool level. Cornella Creek flows pass through the Cornella Creek subway remaining within the creek.
During periods of high in-flows from Cornella Creek when the Waranga Western Channel is filled regardless of whether deliveries are taking place or not: Waranga Western Channel is closed to flow at the regulator located 1 km north of the Bendigo-Murchison Road. This occurs after the water level in the Waranga Western Channel is lowered to the sill level of the outlet doors at the Cornella Creek subway. The outlet doors on the Cornella Creek subway are opened and the 78 floodway doors (both sides) are removed. The opening of the outlet doors on the Cornella Creek subway allow water that enters the Waranga Western Channel to flow out into the Cornella Creek to the north and also allows water that backs up from obstructions in the creek to enter the Waranga Western Channel.
G-MW may on occasion be able to transfer floodwater from Cornella Creek down the Waranga Western Channel depending on whether certain criteria (described below) are met.
4.2.3 Lake Cooper and Greens Lake
Greens Lake is a G-MW storage used to supplement the Waranga Western Channel. It was previously a natural storage prior to some modifications in 1966 to 1968. It is connected to the Waranga Western Channel via two pipelines. These same pipes are used for diversions from the Channel to the Lake and pumped diversions from the Lake to the Channel. The pump capacity is 500 ML/d.
Lake Cooper is a natural storage located south of Corop. It is on-line with Cornella Creek.
A four km long link channel (Lake Cooper Outfall Drain) was constructed by G-MW in the late 1990s connecting Lake Cooper to Greens Lake. The capacity of the link channel is the same as the capacity of the outlet pumps from Greens Lake (500ML/d). The link drain was constructed to provide a means of lowering the water level in Lake Cooper. Previous periods of sustained high water levels in Lake Cooper had lead to serious foreshore issues and backwater problems in the lower reaches of Cornella Creek and the Gaynor Swamp.
The operating procedures for Lake Cooper and Greens Lake posted on the G-MW website can be summarised as follows:
When possible G-MW, will transfer floodwaters from Cornella Creek to the Campaspe River, Greens Lake or Lake Cooper (in this priority order). This cannot occur if:
– The WWC is being used for water supply or maintenance work is being carried out;
– The Campaspe River is at or above minor flood level; or
– If the Lake Cooper/Greens Lake operational guidelines and trigger levels will be breached.
G-MW can release water from Lake Cooper to Greens Lake via the link channel when the water level in Lake Cooper is above 105.0 m AHD and Greens Lake is below its G-MW target level. G-MW’s target level for Greens Lake varies depending on the time of year.
Releases from Lake Cooper to Greens Lake are limited by G-MW in order to maintain salinity levels in the Waranga Western Channel to 300 EC or less, downstream of pumped flows from Greens Lake.

21
31/28597/6047 Corop Lakes Flood Scoping Study
G-MW can release water from the Waranga Western Channel into Lake Cooper. The same volume of water is then released from Lake Cooper to Greens Lake. This cannot occur if salinity levels in Greens Lake exceed 1000 EC.
If Lake Cooper is about to spill, G-MW may release flow via the link drain to Greens Lake to reduce flooding impacts through Corop. The above guidelines may be exceeded under this circumstance.
4.2.4 Other Issues identified by G-MW
Other issues with links to flooding identified in discussions with G-MW staff are listed as follows:
G-MW was subject to private legal proceedings in the early 1990s associated with the operation of Greens Lake and its impact on an adjoining north side property.
Coliban Water relies on supplying Rochester with water from the WWC.
G-MW has previously managed Lake Cooper, however this has recently been queried and is under review.
4.3 Campaspe Shire Council Council has advised that flood damage to the local road network within the Corop Lakes study area was significant during the 2010 / 2011 / 2012 floods. Council provided details of the road flood damages which are summarized as follows:
Damage to 58 km of Council roads within the Corop Lakes study area, mostly local unsealed gravel roads. Damage typically loss and / or rutting of road surface pavement material.
Damage to culvert structures. Typically loss of cover above pipe, erosion at endwalls.
Other anecdotal accounts provided by Council staff include:
Necessary closure of the Bendigo Murchison Road at Colbinabbin and Wanalta during recent floods perceived as being not particularly well managed.
Numerous local roads needed to be closed during the recent floods.
Photograph of a house located on west side of Wanalta Creek immediately downstream of the Bendigo Murchison Creek Road provided by Council showing the SES pumping water out of the levee enclosed house on the 28 November 2011.

22
31/28597/6047 Corop Lakes Flood Scoping Study
4.4 Parks Victoria Parks Victoria is the land manager for the following wetlands within the study area located on public land:
Gaynor Swamp
One Tree Swamp
Two Tree Swamp
Wallenjoe Swamp
Mansfield Swamp
Parks Victoria provided the following advice in regards to flood management issues associated with the above wetlands:
Gaynor Swamp. Adjoining landholder raised concerns in mid-2011 in regards to the water level in Gaynor Swamp being maintained approximately 0.5 metres above the water level in Lake Cooper and Cornella Creek. The outlet structure from Gaynor Swamp was subsequently lowered to allow the water level to drop to the same level as Cornella Creek.
Two Tree Swamp. The levee within the reserve was breached in several places during the January 2011 flood. Flooding of the privately owned east side property subsequently occurred. Management responsibility for the levee bank is unclear.
Mansfield Swamp. During the 2010 / 2011 flood events, some of the upstream flow bypassed the Mansfield Swamp via a drain down the east side of the swamp. G-M Water and Parks Victoria are planning to investigate this issue with a view to identifying appropriate measures to direct these bypass flows into the Mansfield Swamp.
4.5 VicRoads VicRoads advised that there are five arterial roads for which VicRoads has responsibility within the study area. These roads and the associated flood issues identified by VicRoads are as follows:
Midland Highway:
– In relation to the recent floods (i.e. 2010 to 2012), the Highway was most impacted (i.e. longest duration road closures) in January 2011, commencing on the 14 January 2011
– In January 2011, the highway was closed at two locations within the Corop Lakes study area (12 km section at Corop, and a 4 km section extending either side of the Carag Road)
– Residual inundation of the road side drains adjoining the Wallenjoe Swamp remained for weeks after the main flood in January 2011
– Around 1977 / 1978, following the severe floods of 1973, 1974 and 1975, a series of causeways (floodways) were established on the Midland Highway. The causeways were 0.15 to 0.2 metres lower than the previous existing road level, with the rationale being that traffic access could be maintained at these flow depths whilst providing an increase in cross drainage capacity. Current practice is for road closure before a water depth a 0.15 metres is reached

23
31/28597/6047 Corop Lakes Flood Scoping Study
– Widening and resurfacing of sections of the Midland Highway has occurred since 1990. This has included sections west and east of Wallenjoe Swamp and a section closer to Stanhope. These works may have included some minor culvert works. Previous culverts and bridges were retained
– In 1975, the bridge at chainage 74.2 km was replaced by a new structure with comparable waterway area due to a structural footing issue (this bridge is located 6 km west of Carag Road)
Bendigo Murchison Road:
– In relation to the recent floods (i.e. 2010 to 2012), the road was most impacted in January 2011 (i.e. from 14 January 2011 onwards)
– At one stage, the road was fully closed between Colbinabbin and Rushworth
– Flooding conditions at Colbinabbin would appear to have been influenced by the adjoining channel (Waranga Western Channel), although it is not understood exactly what influence this had
– Road damage recorded at numerous locations
Kyabram Rochester Road:
– In relation to the recent floods (i.e. 2010 to 2012), the road was most impacted in January 2011 (i.e. from 14 January 2011 onwards)
– Road was closed at multiple locations
– Some road damage occurred
Girgarre Rushworth Road:
– VicRoads advised there were no road closures for this road in the 2011 floods
Heathcote Rochester Road:
– Water overtopped the road at a number of locations during the January 2011 flood
– Signage was erected at these locations. Road was able to be kept open as water depths were limited
4.6 VicTrack The East Murchison to Colbinabbin Railway was opened in 1914 and operated until its closure in 1987. Most of the rail track and waterway cross drainage structures between Rushworth and Colbinabbin remain in place.
VicTrack advised of the following:
Bridge structures on lines such as the Murchison Colbinabbin decommissioned lines are subject to regular inspections (e.g. six monthly)
The timber bridge structures will be progressively removed as they deteriorate in condition. VicTrack has a limited annual budget for this type of work ($400,000 per year for all of Victoria)
Other concrete bridge structures and the general track formation / ballast will be retained indefinitely
The Campaspe Shire Council is leasing the Murchison to Rushworth section of the line and has upgraded this line to operate as a Rail Trail (cycle / pedestrian trail)

24
31/28597/6047 Corop Lakes Flood Scoping Study
VicTrack is not aware of any plans by the Shire to extend the Rail Trail to Colbinabbin
4.7 Goulburn Valley Water Goulburn Valley Water advised in a response to the landholder Questionnaire that the only potential flooding issue with direct links to their operations was a previous local stormwater drainage issue at the entrance to their Colbinabbin wastewater treatment plant (WTP). Action associated with clearing and extending a culvert to address this issue has since been taken.

25
31/28597/6047 Corop Lakes Flood Scoping Study
5. Landholder Consultation
5.1 Overview of Consultation Activities Consultation with landholders within the study area encompassed the following:
Representation on the project Steering Committee (six community / landholders on the committee)
Two day landholder interview sessions held in May 2012
Distribution of Questionnaire to all landholders within the study area in April 2012
The purpose of the consultation activities was to develop an understanding of the impacts of flooding within the study area and what may be influencing these impacts. The recent occurrence of significant flooding with the study area, including an event in March 2012, is expected to have elevated the degree of community interest in flooding issues.
5.1.1 Landholder Interviews
Landholder interviews were held on the 8 May 2012 at Corop (Corop Lakes Community Centre) and the 9 May 2012 at Colbinabbin (Bowling Club).
Interviews were by appointment. Notice of the interview sessions was made by way of information provided with the landholder Questionnaire and a notice placed in the local newspaper. Tom O’Dwyer from the Goulburn Broken CMA and Trevor Clark from GHD conducted the interviews.
5.1.2 Landholder Questionnaires
Questionnaires were distributed to 506 addresses within the study area. A copy of the Questionnaire is provided in Appendix E. Questionnaires were not distributed to houses within Stanhope township to limit questionnaire numbers. Flooding issues within Stanhope are from stormwater (local) runoff and are not therefore relevant to this study.
A total of 84 Questionnaire responses were received. Responses were received as follows:
Colbinabbin township residents – 9 responses
Corop township residents – 3 responses
Stanhope township residents (with rural holdings) – 3 responses
Rushworth township residences (with rural holdings) – 3 responses
Rural areas south of the Waranga Western Channel – 9 responses
Rural areas between the Waranga Western Channel and the Midland Highway – 26 responses
Rural areas north of the Midland Highway – 22 responses
9 other responses where location not able to be identified

26
31/28597/6047 Corop Lakes Flood Scoping Study
5.2 Summary of Community Floodplain Management Issues / Concerns A summary of the issues identified through the landholder interview and questionnaire activities is provided in Table 5-1. The Questionnaire responses themselves have not been included in this report in order to retain confidentiality.
Table 5-1 Floodplain Management Issues within Corop Lakes Study Area
Issue Location Issue Description
Colbinabbin / Waranga Western Channel (WWC)
View by many in the community that G-MW’s operating rules can be refined to alleviate the frequency and severity of Cornella Creek flooding.
Cornella Creek upstream of WWC
At least one upstream rural landholder on the south side of Colbinabbin considers that the limited cross drainage capacity exacerbates flooding on the upstream side of the WWC. Need for increased cross drainage capacity queried.
Colbinabbin – Railway line. A number of residents at Colbinabbin consider that the redundant Railway line is exacerbating flooding on the upstream side of the railway and therefore would like it removed. At least one rural landholder downstream of Colbinabbin strongly opposes the removal of the Railway line as they consider it provides them some protection.
Wanalta Creek / WWC / Colbinabbin
Question raised as to whether Wanalta Creek flows transferred via the WWC has exacerbated flooding at Colbinabbin.
Wanalta Creek / Groves Weir
Some landholders on the Wanalta Creek downstream of Groves Weir have queried G-MW’s operation of Groves Weir during previous flood events. There is a view that if the Weir had been operated in a different manner, that the severity of downstream flooding would have been reduced. This view particularly applies to the event on 1 March 2012.
Lake Cooper / Greens Lake Some landholder have queried G-MW’s operation of these two lakes. View that the link channel should be used more frequently to lower water levels in Lake Cooper to mitigate upstream and downstream flood impacts.
Link Drain between Lake Cooper / Greens Lake
Local rural landholder has queried the absence of an access point for discharging local runoff into the link drain.
Midland Highway / Carag Road / Wallenjoe Swamp
View by multiple upstream rural landholders that changes to the Highway in the vicinity of Wallenjoe Swamp / Carag Rd have led to adverse impacts on upstream flooding. View that insufficient cross drainage capacity under or over the Highway leads to more extensive and protracted inundation.
Midland Highway / Carag Road
Suggestion that a rural drain on the south side of Midland Highway needs reinstating (Wallenjoe Swamp / Carag Road area).
Mansfield Swamp / View that the operation of the Timmering Drain (regulators) north of the Midland Highway is impacting adversely on flooding south of the Midland

27
31/28597/6047 Corop Lakes Flood Scoping Study
Issue Location Issue Description Timmering Drain Highway.
Midland Highway / Timmering Drain
Comment made that the Timmering Drain effectively terminates at Midland Highway / Carag Road, with the upstream properties consequently poorly draining. Implication that the rural drainage system needs extending upstream of the Midland Highway.
Wetland management in general
Concerns that government agency proposals to store water in wetlands for extended periods will impact adversely on flooding.
Two Tree Swamp to Wallenjoe Swamp
View that the levees on the north side of Two Tree Road / Two Tree Swamp may be restricting the drainage of floodwater between Two Tree Swamp and Wallenjoe Swamp.
Wanalta Creek / Depot Road.
Area is slow to drain, notably in recent March 2012 flood event. Large areas inundated from Wanalta Creek floodwaters. Possibly exacerbated by downstream levees.
Creeks / floodways in general
Management of vegetation and debris within waterways. Common landholder view that waterways become choked without adequate maintenance (e.g. Cornella Creek in vicinity of Colbinabbin).
Stormwater drainage at Colbinabbin
Issues raised by local residents in relation to driveway culvert arrangements within roadside drains (stormwater issue).
Lack of warning time for landholders
Comment that an effective flood warning system would be beneficial.
Burramboot East School Rd
Bank across flow path is impacting adversely on upstream flooding.
One Tree & Two Tree Swamps
View that a management plan is required for these wetlands which should include summer grazing of the wetlands.
Irrigation runoff General comment that irrigation runoff should always drain into dedicated rural / community drains, and not into the road side drain system. This leads to overgrown / blocked road drains.
Colbinabbin stormwater drain
Reference to a diversion bank which is diverting excess water into the main stormwater drain. Store flooded to above floor level.
Two Tree Swamp View that review of floodway system in this area is required. Review to identify necessary floodway, remove obstructions within this zone, and permit levees on the fringe or outside.
Kyabram Rochester (Webb) Road
Comment that the culverts under Webb Road are too high and are also blocked up. Require lowering.
Levee banks in general View by one questionnaire respondent that all levee banks except those protecting houses / sheds should be removed to allow improved drainage, with the Corop Wanalta Rd levees of particular concern.

28
31/28597/6047 Corop Lakes Flood Scoping Study
Issue Location Issue Description
Flood insurance Issues with obtaining insurance due to insurance companies using unreliable overlays
Community drain extension Support for the community drain to be extended from Two Tree Road to Bedwells Road.
Community drain maintenance in general
View that maintenance of community drains (weeds, other blockages) is somewhat neglected.

29
31/28597/6047 Corop Lakes Flood Scoping Study
6. Description of Flood Impacts
6.1 Flood Impacts - Towns
6.1.1 Colbinabbin
There are a total of approximately 70 houses at Colbinabbin. Of these, there are two known to be subject to above floor flooding.
Grounds flooding does occur at numerous properties at Colbinabbin. This includes the Primary School site.
Resident accounts indicate that flooding at Colbinabbin is influenced by the:
Waranga Western Channel. The Channel’s cross drainage structures have limited capacity leading to a build-up of floodwaters on the south side of the channel which can lead to inundation of parts of the town on the west side of the Channel. A common view held by local residents is that the operation of the WWC could be better managed during creek flood events to mitigate town flooding and downstream rural flooding.
Railway Line. Although decommissioned in 1987, the railway line elevated embankment remains in place. Bridges are present at Cornella Creek and 500 metres further east. A common view of local residents is that the railway line causes elevated upstream flood levels. A rural landholder on the north side of town strongly opposes any removal of the railway line as they consider it provides them a degree of protection against flooding.
Local runoff. Runoff from the hill range on the west side of Colbinabbin can cause the stormwater drains at Colbinabbin to overflow.
An aerial photograph of the recent March 2012 flood event is shown on Photograph 5. The peak recorded Cornella Creek flow for this event was equivalent to 4 to 5 years ARI.
6.1.2 Corop
Questionnaire responses did not reveal serious flood damage impacts at Corop. There are a total of approximately 30 houses at Corop. There are no known houses subject to above floor flooding.
Resident accounts indicate that flooding at Corop is influenced by the operation of Lake Cooper, and in particular the link channel to Greens Lake.
6.1.3 Stanhope
Flooding at Stanhope is thought to be dependent on local runoff from the immediate township area and surrounds. Runoff drains into a network of G-MW community collector drains which feed into the Deakin Main Drain aligned to the south and west of the town.

30
31/28597/6047 Corop Lakes Flood Scoping Study
Photograph 5 Colbinabbin – 1 March 2012 – view south
Cornella Creek gauging station
WWC Floodway (refer Photo 3)
Colbinabbin
Breakaway flows to Ryans Floodway

31
31/28597/6047 Corop Lakes Flood Scoping Study
6.2 Flood Impacts – Rural
6.2.1 South of Waranga Western Channel
The topography south of the Bendigo Murchison Road generally has good natural fall available, in contrast to the flat terrain to the north. Long term protracted inundation following flood events is not therefore generally a problem.
Inundation of farmland does however occur more so towards the Waranga Western Channel. Questionnaire comments also noted that the Channel tends to hold water back, particular at Colbinabbin, which leads to extensive flooding outside the creeks. This is described in questionnaire responses as leading to diminished crop yields rather than crop destruction.
There are no known instances of above floor flooding of houses within rural areas south of the Waranga Western Channel.
6.2.2 Rural Area between Waranga Western Channel and Midland Highway
The topography within this area is very flat. Extensive and protracted flooding occurs for much of this area during and after significant catchment runoff events. This results in significant flood damage including:
Crop losses (crops can typically not survive inundation longer than a few days)
Pasture losses (pasture can typically not survive inundation longer than around a week)
Hay / silage losses
Damage to fencing
Other farm damage (tracks, levee banks, supply channel banks, machinery and material stored in sheds, spreading of weeds, erosion of drains etc)
Damage to local roads
A number of houses at Wanalta would appear to be vulnerable to above floor flooding based on anecdotal accounts (refer Photographs 6 to 9). Two of these have ring levees for protection.
Only one instance of above floor house flooding was identified by the 26 questionnaires returned for this area (house on Weppner Road just out of Colbinabbin).

32
31/28597/6047 Corop Lakes Flood Scoping Study
Photograph 6 Wanalta - 1 March 2012 – view north
Photograph 7 Wanalta (28.11.2010) – house on west side of creek (refer Photograph 6)
Reid Road
Bendigo Murchison Rd
House in Photo 7

33
31/28597/6047 Corop Lakes Flood Scoping Study
Photograph 8 Bendigo Murchison Road – view east towards Wanalta (28.11.2010)
Photograph 9 Flooding at Wanalta (28.11.2010)
34
31/28597/6047 Corop Lakes Flood Scoping Study
Flooding in the area between the Waranga Western Channel and the Midland Highway is influenced by:
Naturally flat and poorly draining terrain conditions
Irrigation supply infrastructure (e.g. raised banks, cross drainage structure influences, operation of Waranga Western Channel)
Condition of the roadside, community and private drain network
Private levee banks
Road network, particularly the east-west roads
Railway line
Management of the wetlands within and downstream of this area, including the height of water stored prior to floods and the operation of regular structures during and post floods
6.2.3 Rural Area north of the Midland Highway
The topography in this area is similar to that south of the Midland Highway. Extensive flood damage on rural properties occurs in large runoff events. All of the area ultimately drains into either the Timmering Depression and / or the Deakin Main Drain.
Flood damage and factors influencing flooding for this area are consistent with that listed above for the area south of the Midland Highway.
Of the 22 responses received for this area, there was one past instance of above floor house flooding reported, thought to have occurred in the 1973 event.
6.3 Discussion of Main Flood Management Issues The recent succession of flood events since September 2010 has prompted a high level of awareness of flood management issues within the community. This recent period followed a lengthy and protracted drought dating back to the 1990s.
Floods within the Corop Lakes area since 1970 have therefore tended to be clustered over periods lasting a few years. These active periods have been:
1973 to 1975. Wettest period since detailed streamflow records commenced in 1960
1992 to 1993
2010 to 2012
6.3.1 Irrigation Infrastructure and Operation
Irrigation infrastructure was established in the early 1900s (e.g. Waranga Basin completed in 1909). Irrigation has since provided enormous benefits for the area in terms of boosting agricultural production. It does however have some largely inevitable side effects. Although supply channels are aligned on higher ground, they need to cross natural drainage lines on occasions. Where this occurs, cross drainage

35
31/28597/6047 Corop Lakes Flood Scoping Study
structures are provided. The limited capacity of these structures, and in some instances how the structures are operated, can impact on flooding characteristics.
The highest profile flood management issue within the Corop Lakes study area at present based on community feedback is the way G-MW operates the Waranga Western Channel during Wanalta Creek and Cornella Creek flood events. This includes the:
Release / shutdown of water from Waranga Basin
Operation of Groves Weir
Operation of cross drainage structures at Colbinabbin
Transfer of floodwater from Cornella Creek and Wanalta Creek via the Waranga Western Channel to either the Campaspe River, Greens Lake or Lake Cooper
During the recent flood event on the 1 March 2012, flows in Wanalta Creek downstream of Groves Weir reached very high levels. A common view held by landholders subject to Wanalta Creek flood impacts is that the operation of Groves Weir by G-MW during this event contributed to the severity of flooding. The general perception is that the manual gates at Groves Weir were only opened after an extensive build-up of floodwater within the Weir. The rapid opening of gates is then perceived as having caused an increase in the peak flow and therefore severity of flooding downstream of the Weir. A meeting of Wanalta Creek landholders was held in April 2012 to discuss this matter.
Similar concerns are held by many in the community in regards to the cross drainage structure operation at Colbinabbin. Interest is currently not quite as high as that for Groves Weir, probably because the water level in Lake Cooper was down prior to the March 2012 flood, and G-MW was consequently able to divert Cornella Creek floodwater to Lake Cooper during the flood, thereby alleviating flooding at Colbinabbin and in the Cornella Creek system upstream of Lake Cooper.
G-MW advises that it has operated the system in accordance with the operating rules established in 1997 following the construction of the link channel between Lake Cooper and Greens Lake. These operating rules are quite complex and take into account multiple considerations and circumstances which vary from event to event. Flood mitigation is not their sole consideration.
6.3.2 Railway Line (Rushworth to Colbinabbin)
The Rushworth to Colbinabbin Railway was opened in 1914 and operated until it closed in 1987. The raised track and waterway structures remain largely intact. Some of the bridge structures along the rail route are in disrepair and no longer trafficable by vehicle or foot (e.g. Cornella Creek bridge).
Some in the community consider that the Railway obstructs the discharge of floodwaters, particularly at Colbinabbin and consequently exacerbates flooding by backing up floodwaters on the upstream side of the Railway.
At least one downstream rural landholder at Colbinabbin would strongly oppose any changes to the Railway as communicated during the Scoping Study consultation activities. They consider the Railway line provides them a degree of protection against flooding, and its removal or part removal would increase the severity of flooding on their property.

36
31/28597/6047 Corop Lakes Flood Scoping Study
6.3.3 Community Drains
Drainage of that part of the study area located south of the Midland Highway is via natural drainage lines and constructed floodways alongside roads and between wetlands. There are no formalised G-MW or community drains in this area except for the link drain between Lake Cooper and Greens Lake.
The main drainage systems to the north of the Midland Highway within the study area are:
G-MW Timmering Depression Drain that is aligned past the eastern side of the Mansfield Swamp and terminates at the northern end of the Woolwash Depression.
G-MW Stanhope Depression Drain that outfalls to the Timmering Drain and picks up high flows from the Harston catchment.
G-MW Deakin Main Drain and G-MW Deakin Drain 11 service the area around Stanhope.
There is a Community Drain (Greens Lake Drain 1P) that provides drainage for the area to the north of Greens Lake.
The following drainage strategy works are shown as proposed on a 2007 G-MW plan of the Corop Lakes Drainage system:
Drainage Course Declaration along Ryans Floodway linking overflows from Cornella Creek to Gaynor Swamp, Horseshoe Lake, Mansfield Swamp to Timmering Depression Drain.
Drainage Course Declaration along Wanalta Creek from Old Corop Road to One Tree Swamp, Two Tree Swamp, Wallenjoe Swamp, Mansfield Swamp and Timmering Depression Drain.
Drainage Course Declaration along Woolwash Depression from Old Corop Road north to the Carag Road and then through to the Timmering Depression Drain.
Completion of the Stanhope Depression Drain.
The surface water management strategy for the Corop Lakes area involves very little in the way of constructed drains and focuses on reinstating the natural carrying capacity of drainage lines through the removal of flow obstructions within the declared drainage courses and improved planning controls.
G-MW drains are designed to provide a limited level of service, typically a 2 year ARI summer rainfall event. The majority of drains within the study area are designed to provide this level of service. The rural drains present cannot be expected to confine surface flows in large flood events.
6.3.4 Levees
Landholders wanting to construct new levee banks or alter existing levee banks within areas covered by a flood overlay are required to obtain a planning permit from the Campaspe Shire Council prior to commencing the works. The Goulburn Broken CMA as a referral authority will assess the acceptability of levee bank applications taking into account any impacts on flooding due to the proposal. Generally the Goulburn Broken CMA would oppose any new levees, or the raising of existing levees, unless such proposals form part of an approved scheme.

37
31/28597/6047 Corop Lakes Flood Scoping Study
The current flood overlays for the Corop Lakes area are based on the outputs from the Flood Data Transfer Project completed in 2000. These were defined using available data, notably aerial flood photography for flood events in the 1970s.
It has been documented that the planning scheme flood overlays are not overly reliable in some areas. Community consultation feedback suggests that some areas shown as being within an overlay are thought not to be subject to flooding and vice versa. This may be due to changes since the 1970s (e.g. new levees).
6.3.5 Waterway Debris and Vegetation Management Issues
A common view expressed by landholders following flood events is a call for debris and vegetation to be removed or thinned out in order to reestablish the discharge capacity of the waterway. A significant number of the questionnaire responses expressed this view in relation to Cornella Creek, Wanalta Creek and its tributaries.
Waterway management by government agencies is based on a balanced approach. Waterway health and stability partly depends on woody debris and riparian vegetation being present. A point can however be reached where the density of debris and vegetation compromises the flood conveyance function of the waterway. A balance therefore needs to be maintained taking into account various considerations.
Further to this, typically a large percentage of the total floodplain flow is conveyed outside the incised waterway channel in major flood events. In these circumstances, the peak height that floodwaters reach is often not sensitive to the density of debris and vegetation within the waterway channel.
Flooding conditions within Cornella Creek and Wanalta Creek are similar to that described above. Extensive clearing / removal of debris and vegetation is unlikely to substantially alleviate flood impacts in large flood events such as the recent March 2012 event. A perception that floodwater can be confined to a narrow corridor on and either side of Wanalta Creek for example through waterway management works and adjustments to the operation of Groves Weir is inaccurate.

38
31/28597/6047 Corop Lakes Flood Scoping Study
6.3.6 Wetland and Lakes
Wetlands include both ephemeral wetlands which may be dry for years at a time (e.g. One Tree Swamp), and also lakes which may hold water semi permanently (e.g. Lake Cooper, Greens Lake).
The Corop Lakes study area has numerous natural wetlands present north of the Bendigo Murchison Road. These wetlands have been present in various forms for thousands of years. Many changes have occurred since European settlement, which have altered the wetting and drying regimes within this wetland system. Changes have included:
Clearing of significant parts of the catchment for agriculture
Establishment of a road network including roadside drains
Establishment of the Rushworth–Colbinabbin railway
Establishment of irrigation infrastructure
Establishment of rural drains
The wetlands influence downstream flooding by filling and absorbing floodwaters as they pass through the wetlands. They provide a dampening effect which reduces the downstream rate of flow. This process is also referred to as retardation, or detention, or attenuation.
The following wetland management issues were brought up during the consultation activities:
Water levels within wetlands should not be maintained at high levels for excessive periods given that this will reduce the active storage available for absorbing floodwaters, thereby increasing the height and duration of flooding.
Regulators and other control structures influencing the flow into and out of wetlands should not be operated in a manner which exacerbates flood impacts.
The highest profile example of the above based on community feedback received is the operation of Lake Cooper and Green Lake. There are also concerns in relation to:
One Tree Swamp and Two Tree Swamp. G-MW and Parks Victoria are currently reviewing options to improve the wetting and drying regime within these two wetlands.
Wallenjoe Swamp and the Mansfield Swamp. Concerns have been raised in regards to flooding impacts associated with the recent management of the Mansfield Swamp and the adjoining upper reaches of the Timmering Main Drain.
Gaynor Swamp although this would appear to have been resolved.
As with the waterway vegetation management issue, a balanced approach needs to be used in relation to the management of the wetlands which takes into account flooding considerations along with environmental health objectives.

39
31/28597/6047 Corop Lakes Flood Scoping Study
7. Review of Flood Mapping
7.1 Existing Flood Overlay Basis The current Campaspe Shire Planning Scheme floodway overlay (FO) and land subject to inundation overlay (LSIO) extents are based on work carried out as part of the Flood Data Transfer Project (SKM, 2000).
A review of the Victorian Flood Database (VFD) and the Deakin Basin FDTP report (SKM, 2000) indicates that the existing overlay extents within the study area were determined as follows:
Available streamflow records assessed using flood frequency analysis to establish the equivalent ARI of the more significant historical floods since records commenced in 1960.
Available aerial flood photography was used to digitize flood extents. The available data was limited to the September / November 1973 event, October 1974 event, November 1975 event and the August 1981 event.
Given the assessed ARI of the events and the quality and coverage of the available aerial flood photography, the October 1974 digitised flood extent was generally used as the basis for the 100 year ARI flood extent within the Corop Lakes area.
The subsequent delineation of the 100 year ARI flood extent into FO and LSIO took into account a range of factors, including estimates of the frequency and severity of flooding, position relative to the major active flood conveyance drainage lines, and connectivity to the broader floodplain
The 100 year ARI flood extent and flood overlay extents as defined by the FDTP mapping were designated as being of ‘low reliability’ based on the VFD metadata specifications.
Discussions with the Goulburn Broken CMA during this scoping study indicate that detailed one foot contour information was also utilised in preparing the existing flood mapping over the northern and eastern parts of the Corop Lakes study area. The existing flood mapping therefore offers good delineation of flood affected areas in comparison to many other areas of Victoria. This was confirmed with the review of the recently obtained LiDAR data as discussed in Section 7.3.
7.2 Hydrology Review – Flood Frequency Analysis
7.2.1 Wanalta Creek
There are 51 years of continuous streamflow records available for the Cornella Church Road gauging station (refer Section 3.1). Annual series flood frequency analysis was undertaken using the available recorded peak flows. The flood frequency analysis results for Wanalta Creek are detailed in in Table 7-1. They include the following outcomes:
100 year ARI peak design flow of 12,600 ML/d
The recent March 2012 flood has an equivalent ARI of 20 years based of the FFA results in Table 6-1

40
31/28597/6047 Corop Lakes Flood Scoping Study
If the 1973 peak recorded flow of 13,700 ML/d is excluded, the 100 year ARI peak design flow estimate reduces to 9,800 ML/d
The 2000 FDTP report estimate for the 100 year ARI peak design flow is 7,500 ML/d
Table 7-1 Wanalta Creek Flood Frequency Peak Design Flow Estimates (1960-2012 inclusive)
Average Recurrence Interval (years)
Peak Design Flow (ML/d)
95% Confidence Intervals (ML/d)
2 850 (840) 600 – 1,200
5 2,500 (2,300) 1,800 – 3,500
10 4,200 (3,600) 2,800 – 6,100
20 6,200 (5,100) 4,000 – 9,800
50 9,600 (7,600) 5,300 – 17,400
100 12,600 (9,800) 6,200 – 25,800
Notes:
1. Peak flow for 1 March 2012 of 6,700 ML/d included in the analysis.
2. ( ) – based on FFA results which exclude the 1973 event peak flow of 13,700 ML/d.
7.2.2 Cornella Creek
There are 51 years of continuous streamflow records available for the Cornella Creek Bakers Bridge Road gauging station (refer Section 3.1). Annual series flood frequency analysis was undertaken using the available recorded peak flows. The results are detailed in in Table 7-2. The FFA results include the following outcomes:
100 year ARI peak design flow of 11,200 ML/d
The highest recorded event in December 1992 has an equivalent ARI of 30 years
The recent March 2012 flood has an equivalent ARI of 5 years based of the FFA results in Table 6-2
The FDTP estimate (SKM, 2000) for the 100 year ARI design flow is 8,800 ML/d

41
31/28597/6047 Corop Lakes Flood Scoping Study
Table 7-2 Cornella Creek Flood Frequency Peak Design Flow Estimates (1960-2012 inclusive)
Average Recurrence Interval (years)
Peak Design Flow (ML/d)
95% Confidence Intervals (ML/d)
2 1,600 1,200 – 2,200
5 4,000 3,000 – 5,200
10 5,700 4,300 – 7,500
20 7,500 5,200 – 10,600
50 9,600 5,800 – 16,000
100 11,200 5,900 – 21,200
Note:
1. Peak flow for 1 March 2012 of 6,700 ML/d included in the analysis.
7.2.3 Discussion
The rating curve for the Cornella Creek station is considered suspect. The station has a catchment area of 259 km2, compared to the 108 km2 catchment for the Wanalta Creek gauging station. The highest peak flow recorded at the Cornella Creek station is 8,570 ML/d (December 1992 event). The highest recorded flow at the Wanalta Creek station is 13,700 ML/d (February 1973).
As indicated in Section 3.1, one possible reason as to why the gauged Cornella Creek stream flows appear low is that breakaway bypass flows to the east of Cornella Creek are unlikely to be accounted for in the station’s rating table. If this is the case, the gauged flows for the larger events will be lower than the actual total floodplain flow.
Flood frequency analysis was also carried out for the recorded annual volumes (refer Tables A1 and A2). This analysis suggests the following:
Wanalta Creek – highest runoff volume year of 1973 equivalent to a 50 year ARI event year based on the annual runoff volume.
Cornella Creek – highest runoff volume year of 1973 equivalent to a 40 year ARI event year based on the annual runoff volume.

42
31/28597/6047 Corop Lakes Flood Scoping Study
7.3 Flood Mapping Review As discussed in Section 7.1, the existing 100 year ARI flood extent delineation within the Corop Lakes study area is based partly on the 1974 flood aerial photography. In light of the flood frequency analysis in the preceding Section 7.2, the October 1974 flood peaks are described as follows:
Cornella Creek – 7,890 ML/d peak which coincides with approximately a 20 year ARI event
Wanalta Creek – 2,210 ML/d peak which coincides with approximately a 5 year ARI event
Although the above recorded peaks, particularly for Wanalta Creek, were not particularly high, they did follow an extremely wet period which commenced in early 1973, with significant creek flood events in February, June, July, August, September and October 1973, and January, May, September and October 1974. The Corop Lake wetlands were therefore likely to be partly full prior to the October event, adding to the impacts of the creek flows.
Other comments on the October 1974 aerial photography are as follows:
Clarity is average only. Imagery is black and white.
Imagery is dated 14 October 1974. The peak flow at the gauging stations occurred on the 5 October 1974. The imagery may therefore have captured the flood near its peak in the lower parts of the Corop Lakes study area. Flooding in the upstream reaches above the wetlands will however have receded in advance of the aerial photography.
There is no new aerial flood photography available for the Corop Lakes study area coinciding with any of the flood events during the period 2010 till now. This therefore represents an information gap as the most recent aerial flood photography known to be available is dated 1981 and is of low quality.
Detailed terrain elevation survey (LiDAR) data has been acquired for the Corop Lakes area. This terrain data is sufficiently accurate to identify relatively low and narrow banks. It therefore allows for the identification of all levee banks at the time of the aerial survey in 2011. The current VFD levee layer does not include all of the levee banks within the Corop Lakes study area.
The existing defined flood mapping (i.e. floodway overlay, LSI overlay and 100 year ARI flood extents) was revised based on the following approach:
Current flood overlays and VFD historic flood extents overlaid onto non flood aerial photographic imagery of the study area supplied by the CMA.
LIDAR data in the form of 0.2 metres contours also overlaid onto the above.
Adjustments made to the FO and LSI extents based on a visual comparison of the above.
Notable changes made to the flood overlays are:
Some refinement of the overlays in the vicinity of the Colbinabbin township. The LSI extent boundary in particular was moved further eastwards on the north side of the town. Overlay over the Cornella Creek route changed from LSI to FO.
Minor adjustment to Ryans Floodway LSI extent on Egans Bridge Road.
Minor adjustment to LSI extent on the western side of Groves Weir.

43
31/28597/6047 Corop Lakes Flood Scoping Study
Minor adjustment to Wanalta Creek LSI extent at Depot Road.
Overlay over the Wanalta Creek route changed from LSI to FO.
Overlay within part of One Tree Swamp changed from LSI to FO (all of One Tree Swamp now FO).
Minor adjustment to FO extent on east side of Two Tree Swamp.
FO extent adjusted on south side of Carag Road in vicinity of Hill Road.
FO extent adjusted to encompass the link channel route between Lake Cooper and Greens Lake.
Minor adjustment to FO extent on the north side of Greens Lake.
Minor adjustment to FO extent on south side of the Mansfield Swamp.
Minor adjustments to the FO extent along the Timmering Main Drain route at six locations between Winter Road and the junction with the Deakin Main Drain to position the Timmering Main Drain route wholly within FO.
The above changes are generally relatively minor. They generally represent some refining of the previous extents as opposed to major changes.
The refined overlay extents within the Corop Lakes study area are still described as being of generally low reliability. The availability of the recently acquired LIDAR data has allowed for some refinement of the previous overlay extents. To produce a more reliable overlay extents would require one or more of the following:
Aerial flood photography or satellite imagery of a major flood close to the peak. This is somewhat problematic given the protracted duration of flooding, particularly north of the Bendigo Murchison Road, with different parts of the study area peaking at substantially different times. Flood peaks at the two stream flow gauging station sites typically occur within 12 hours of the streams starting to rise. Satellite imagery is however likely to be available at different times during recent flood events which could be used to accurately define flood extents based on current conditions.
Detailed hydrologic and hydraulic modelling. This would represent a major task given the very large area involved and the very high degree of hydraulic complexity within the study area (e.g. initial catchment condition assumptions, wetland / lake influences, and flat terrain with numerous bank influences etc).
Given the substantial cost of hydraulic modelling (i.e. several hundred thousand dollars) and the isolated flooding issues identified throughout the study area in terms of built infrastructure, detailed hydraulic modelling would not appear warranted.
44
31/28597/6047 Corop Lakes Flood Scoping Study
8. Flood Damages
8.1 Overview of Rapid Appraisal Method Flood Damages can be grouped into the following categories:
Direct (tangible) damages. These are associated with the physical impacts of the flood and include damage to building structures, the contents of buildings, agricultural damages (e.g. to crops, pasture, stock, farm infrastructure) and regional infrastructure (e.g. roads).
Indirect (tangible damages. These are associated with economic losses due to the disruption of normal day to day activities. The disruption can be due to resources needing to be allocated to emergency response, clean-up and community support or disruption associated with transport issues (e.g. closed roads).
Intangible damages. These cannot be quantified in monetary terms. Intangible damages include increased stress levels for flood affected residents.
The rapid appraisal method (RAM) is a method developed for the rapid and consistent evaluation of flood damages (DNRE, 2000). The RAM produces an indicative estimate of the average annual flood damage (AAD) which takes into account various factors including:
An estimated event up to which the flood induced damage is negligible
The estimated flood damage for at least two flood events above the threshold event
The likely available warning time for the community to prepare for an impending flood and therefore reduce the actual damage incurred
The community’s level of experience in reacting to flood warnings
The likely duration of flooding
8.2 Application of RAM to Corop Lakes Study Area Details of the damage assessment are provided in Appendix D. A summary of the key aspects of the approach is provided as follows:
A flood damages threshold frequency of 5 years ARI was assigned. The computed AAD is sensitive to this figure as discussed in Section 8.3.
Flood damages were calculated for the event coinciding with the Floodway Overlay (FO) extent. The FO has been refined as part of the current study (refer preceding Section 7). The FO was assigned an ARI of 20 years.
Flood damages were calculated for the event coinciding with the Land Subject to Inundation Overlay (LSIO) extent. The LSIO has been refined as part of the current study (refer preceding Section 7). The LSIO was assigned an ARI of 100 years.

45
31/28597/6047 Corop Lakes Flood Scoping Study
Potential direct damages associated with buildings, agriculture and infrastructure were estimated based on data provided within the RAM (DNRE, 2000) and adjusted to produce estimates of actual damage after accounting for available warning times.
Indirect damages were assumed to be equal to 25% of the estimated actual direct damages based on the RAM guidelines.
8.3 Flood Damage Analysis Results The results of the flood damage analysis are detailed in Appendix D. A summary of the estimated damages is provided in Table 8-1. The calculated AAD is $635,000/annum. This is an indicative estimate only.
The calculated AAD is quite sensitive to some of the input data values and assumptions. In particular, it is very sensitive to the assigned threshold flood frequency at which significant flood damages first occur. The AAD in Table 8-1 is based on a 5 year ARI damage threshold. If this is reduced to 2 years ARI, the AAD increases to $1,390,000/annum.
Table 8-1 Summary of Estimated Flood Damages for Corop Lakes Study Area
Damage Category Estimated Flood Damage ($)
20 year ARI event (Floodway Overlay)
100 year ARI event (combined LSIO and FO)
Buildings 150,000 490,000
Agriculture including clean-up costs 2,720,000 3,940,000
Infrastructure (public roads) 1,130,000 1,940,000
Total direct damages 4,000,000 6,370,000
Indirect damages 1,000,000 1,590,000
Total direct and indirect damages 5,000,000 7,960,000
AAD ($/annum) 635,000
Note: Further damage calculation details are provided in Appendix D.

46
31/28597/6047 Corop Lakes Flood Scoping Study
9. Discussion – Future Studies
9.1 Future Study Considerations Flooding conditions within the Corop Lakes study area are extremely complex. This is due to a combination of:
Extremely flat terrain. Even low level obstructions / banks can have a significant obstruction effect on flood flows in flat terrain such as that which exists within the study area to the north of the Bendigo Murchison Road.
Presence of irrigation infrastructure. The network of supply channel extending northwards of the Waranga Western Channel inevitably has an effect on the passage of flood flows.
Regional and local road network. The network of roads influences the rate and distribution of flood flows.
Rural drainage network. These are not designed to cope with major creek flood events. They however influence the rate and distribution of flood flows, particularly the rate of removal of residual ponding floodwater.
Levees. There are numerous levees located within the study area. These levees have been constructed to varying standards. Failure due to overtopping and / or breaching can and does occur during large events.
Wetlands. Floods can occur more or less at any time of the year as reinforced by the recent timing of flood events since 2010. Water levels within the multiple wetlands immediately prior to flood inducing runoff are therefore a further variable influencing flooding conditions.
Detailed terrain elevation data for the study area has recently been acquired which potentially allows for hydraulic modelling. It is noted however that the airborne laser scanning survey was acquired when some of the wetlands were holding water. The survey elevation data will not define the wetland bed geometry below the water surface at the time of the aerial survey.
A major hydraulic modelling study will face the following challenges:
The size of the system. The streamflow gauging station sites are located approximately 40 km south of the northern end of the Corop Lakes study area, with a further 15 km to the Murray River. Needing to account for inflows from the Woolwash Depression, Stanhope Depression and the Deakin Main Drain catchment areas adds to the size of the area to be modelled.
The complexity of the system for the reasons outlined above.
Much of the current community interest based on feedback obtained through the interview and questionnaire activities undertaken as part of this Scoping Study, is focused on the the Waranga Western Channel and its potential influence on downstream Cornella Creek and Wanalta Creek system flooding. There is a strong community perception that the Warange Western Channel, Lake Cooper and Greens Lake could be operated in a refined manner which assists in alleviating downstream flood impacts.

47
31/28597/6047 Corop Lakes Flood Scoping Study
9.2 Rural Drainage (Community Drains) The implementation of the surface water management strategy is not complete. Long term plans include the creation of three Drainage Course Declarations (DCDs) extending south of the Midland Highway. Whether this occurs, and the timeframe that it occurs in would appear to depend on various factors including the level of community support, the role of G-MW and the availability of funding.
The implementation of these DCDs will not eliminate creek flooding impacts however. The DCDs are not designed to cope with major creek flood events but are used to enable flows to move through a catchment in a reasonable timeframe.
Some of the flood impact issues raised during the interview and questionnaire activities conducted during this study can however potentially be alleviated through improvements to existing community drains and further implementation of the surface water management strategy.
The highest priority rural drainage issues would appear to be as follows (based on the interview / questionnaire data):
Improved drainage along the Woolwash Depression, from the Midland Highway up as far as Bedwell Road.
Connection from One Tree and Two Trees Swamps to Wallenjoe Swamp.
Connection from the so called Ryans Floodway between the Bendigo Murchison Road and the Midland Highway.
The capacity of the downstream drainage system (i.e. Timmering Depression Drain, Deakin Main Drain) is limited to its design discharge (which includes the upstream catchment). These drains cannot be expected to confine major creek flooding events.
9.3 Identified Issues
9.3.1 Wanalta Creek Flooding Upstream of the Old Corop Road
There is a very high level of community interest from landholders on the Wanalta Creek floodplain, particularly between Groves Weir and the commencement of the wetland system at the Old Corop Road.
A hydraulic modelling study could be undertaken with the aim of:
Better defining flood levels and flood extents from Wanalta Creek and its tributaries downstream of Groves Weir to the Old Corop Road.
Providing an improved understanding of the influence of the operation of Groves Weir and the Waranga Western Channel on downstream Wanalta Creek flooding.
The study should be able to clarify whether operating rules for Groves Weir and the Warange Western Channel can be refined to alleviate downstream creek flooding. One possible outcome is that it identifies that the operation of the weir and the channel have minimal impact on downstream peak flooding.

48
31/28597/6047 Corop Lakes Flood Scoping Study
The study would need to include modelling of the major tributaries, Nine Mile Creek and Moora (Five Mile) Creek.
Although community interest in Wanalta Creek flooding downstream of Groves Weir is particularly high at the moment, a low to medium priority rating for a hydraulic modelling study is considered appropriate given the limited apparent impacts, and the likely limited scope for effective mitigation measures.
Priority: Low - Medium
9.3.2 Wanalta Creek Flooding Downstream of the Old Corop Road to the Midland Highway
Creek flooding issues in this reach overlap with rural drainage management issues. A study could be undertaken to:
Review the extent of the designated floodway and LSI overlays along this route.
Identify levee banks and other chokes within the revised floodway overlay area impacting adversely on flooding. This would include a review of any existing or newly proposed environmental flow structures.
Consult with relevant landholders in relation to modifying the above levee banks.
There are numerous levees impacting on flooding in this area. The implementation of a Declared Drainage Course would identify all these obstructions and include a comprehensive management plan for their alteration or removal where they impact on the flow of water along the DCD.
Priority: Low
9.3.3 Woolwash Depression – Midland Highway to Bedwell Road
This reach could potentially be assessed similar to the above Wanalta Creek reach downstream of the Old Corop Road. The Woolwash Depression is however very much concerned with rural drainage issues within an irrigation district. Drainage issues should therefore be addressed as part of a surface water management strategy.
Priority: Low
9.3.4 Cornella Creek and Ryans Floodway upstream of Lake Cooper / Gaynor Swamp
There is also considerable community interest in flood management issues at Colbinabbin and the downstream rural properties affected by flooding from either Cornella Creek or Ryans Floodway.
A hydraulic modelling study could be undertaken with the aim of:
Better defining flood levels and flood extents from Cornella Creek and Ryans Floodway.
Assessing the influence of the operation of the Waranga Western Channel, its cross drainage structures, Lake Cooper, and Greens Lake on downstream flooding.
Assessing the influence of the Railway on flooding.

49
31/28597/6047 Corop Lakes Flood Scoping Study
The hydraulic model would need to extend a considerable distance upstream of the Waranga Western Channel to model the break out of flows from Cornella Creek to the Ryans Floodway. The extent to which this occurs is not well understood.
Priority: Low - Medium
9.3.5 Flooding on East Side of Lake Cooper
This area includes Gaynor Swamp, Lake Stewart, Little Wallenjoe Swamp and Horseshoe Lake. No major issues were identified in this area out of the landholder interview and questionnaire activities. On this basis there does not appear to be a strong need for further detailed investigations in this area.
Priority: Low
9.3.6 Flooding North of Midland Highway – Timmering Depression
The main G-MW drain (Timmering Depression Drain) is aligned northwards down the east side of the Mansfield Swamp. It is understood that this drain is operated with a view of passing up to the design flow (2 year ARI event). In major Cornella Creek and Wanalta Creek flood events, the capacity of the Timmering Depression Drain will be exceeded. This results in flooding of properties adjoining the drain route and backwater flooding up the Stanhope Depression in events exceeding the rural drain design capacity.
Implementation of the Timmering Depression Drainage Course Declaration would help improve the system’s capacity to carry greater than design flows from the upper catchment to the Murray River.
Priority: Low
9.4 Flood Warning The available response time for the upper part of the study area (e.g. Colbinabbin, Wanalta) is typically likely to be of the order of three to 12 hours. This amount of warning time is relatively short which suggests that the establishment of a formal flood warning system will have limited benefit to the community.
Notwithstanding the above, it would appear desirable that some actions are taken to improve the information available to the community to better inform them in terms of imminent flood risks. Actions could include:
G-MW to refine their operating procedures where possible to reduce flood impacts.
G-MW to continue to inform the community of aspects of their operations which can influence flooding and to also assist the community in regards to developing improved flood warning arrangements.
Telemetering of the Cornella Creek streamflow gauging station at Bakers Bridge Road.
Addition of the Cornella Creek and Wanalta Creek streamflow gauging stations to the Bureau of Meteorology’s on-line river height network information service.

50
31/28597/6047 Corop Lakes Flood Scoping Study
Establishment of an automatic weather station (AWS) for providing improved rainfall data intelligence within the Cornella and / or Wanalta Creek catchments. Alternatively in the absence of an AWS, VICSES could seek to establish a local community based flood-warden system to assist with improved early flood warning.
Education and awareness activities designed to provide the community with a greater understanding of flood risks resulting in a more flood resilient community (e.g. through distribution of information flyers to the community in line with the VICSES FloodSafe Program).
Heads up information provided by the Bureau of Meteorology in relation to flooding can greatly assist the community in preparing for potential flood events, particularly given the improved accuracy of rainfall forecasting several days or even up to a week out from some types of weather systems.

51
31/28597/6047 Corop Lakes Flood Scoping Study
10. Summary and Recommendations
10.1 Description of Flooding The two major creek systems flowing into the Corop Lakes study area are the Cornella Creek and the Wanalta Creek. Continuous recorded flow data for these two creeks exists from 1960 onwards. Analysis of the recorded flows indicates the following:
Highest runoff volume years were recorded in 1973 and 1974.
Of the recent floods since 2010, the highest peak flow occurred on the 1 March 2012. In relation to Cornella Creek, the March 2012 event was equivalent to a 5 year ARI event and a 20 year ARI event on Wanalta Creek.
The area subject to 100 year ARI inundation within the Corop Lakes study area is 231 km2 (i.e. the combined Floodway Overlay (FO) and Land Subject to Inundation Overlay (LSIO) areas) This equates to 38% of the total 600 km2 Corop Lakes study area.
The total area classified as FO within the Corop Lakes study area is 182 km2.
Flooding durations vary markedly within the study area. The recent March 2012 Wanalta Creek flood upstream of Groves Weir was confined to less than an 18 hour period (i.e. includes rise, peak and fall). Residual inundation from this event further north continued for weeks.
The rural (community) drainage network typically has a capacity equivalent to around a 2 year ARI event. The drains are not designed to cope with major creek runoff events such as those that have occurred since 2010. Widespread protracted flooding is therefore inevitable given the flat terrain conditions (average gradient is less than 1 in 4,000 north of the Midland Highway).
10.2 Flooding Influences Flooding conditions within the Corop Lakes are very complex. The fixed complicating features impacting on flooding include the:
Extremely flat terrain. Flow velocities are therefore very low given the flat land gradient. This results in protracted inundation.
Infrastructure present. This includes the irrigation supply channel network, the rural drainage channel network, the road and rail networks and the levees present. All of these features tend to obstruct and redirect surface flow, therefore having a significant influence on flood levels, distributions and durations.
Wetlands / lakes present. Wetlands store surface runoff which reduces downstream flow rates.
The variable complicating features impacting on flooding include the:
Water levels in the wetlands / lakes prior to the flood event. Higher pre-flood wetland water levels leaves less active storage for floodwater inflows and therefore less impact on reducing downstream flooding.
52
31/28597/6047 Corop Lakes Flood Scoping Study
Status of the irrigation system (i.e. shutdown period, active period). Depending on circumstances at the time of the flood, it may be possible for G-MW to divert Cornella Creek floodwater down the Waranga Western Channel, thereby alleviating flooding at and downstream of Colbinabbin.
Operation of flow regulators within the system (e.g. within the wetland and rural drainage network).
Random failure of levees during flood events due to overtopping and / or breaching.
Blockages in the system (e.g. at cross drainage structures under channels, roads).
10.3 Flood Damages Flood damages for the study area were estimated using the Rapid Appraisal Method (RAM). This method provides an indicative estimate of flood damages accounting for direct damage to buildings, agriculture and infrastructure and indirect damage due to the disruption caused by floods.
The flood damage analysis is documented in Section 8 and Appendix D of this report. The main outcomes are:
Average annual damage estimate of $635,000 for the Corop Lakes study area.
Total estimated flood damage of $5 million in a 20 year ARI event.
Total estimated flood damage of $8 million in a 100 year ARI event.
10.4 Flooding Management Issues / Concerns Community consultation activities were undertaken during the Scoping Study. This included landholder interviews and the distribution of questionnaires to all landholders within the study area. Data derived from these activities suggest that the community is most concerned with the following issues:
Operation of the Waranga Western Channel, Lake Cooper and Greens Lake during significant flood events. Common view that the severity of flooding can be alleviated through the refinement of operating procedures.
Influence of levees. Slowly draining floodwaters are perceived by some to be exacerbated by levees in inappropriate locations.
Inadequate cross drainage structures. The limited capacity of cross drainage structures at supply channels (e.g. Waranga Western Channel) and roads (e.g. Midland Highway) causing an increase in the height, extent and duration of upstream flooding.
Future expansion of the rural (community) drainage network, particularly south of the Midland Highway.
Influence of the decommissioned Railway line, notably at Colbinabbin. There are conflicting views on what should happen to the Railway embankment and its cross drainage waterway structures.

53
31/28597/6047 Corop Lakes Flood Scoping Study
10.5 Future Studies – Flood Mapping The previously defined flood overlay extent delineation was reviewed. These overlays (FO and LSIO) form an important part of the Campaspe Shire Council’s Planning Scheme and are taken into account in the approval process for development applications.
The previous overlays were defined prior to 2000 as part of a statewide mapping project. In relation to the Corop Lakes area, the overlay extents were principally defined using aerial flood photography from 1974. The reliability of the overlay extents was rated as low based on the VFD metadata specifications.
Some refinement of the overlay extents has been carried out as part of the Scoping Study. Changes have been made with the benefit of detailed terrain data which the Goulburn Broken CMA recently acquired. There is no broad coverage aerial flood photography available since 1981.
The refined overlay extents within the Corop Lakes study area are still described as being of generally low reliability. To produce more reliable overlay extents would require one or more of the following:
Aerial flood photography or satellite imagery of a major flood close to the peak. Satellite imagery may be available at different times during recent flood events which could be used to accurately define flood extents based on current conditions.
Detailed hydraulic modelling. This would represent a major task given the very large area involved and the very high degree of hydraulic complexity within the study area (e.g. initial catchment condition assumptions, wetland / lake influences, numerous bank influences etc).
The least cost of the above approaches would lie with the purchase of satellite imagery and the subsequent capture of the flood extent data. The cost of detailed hydraulic modelling will be substantial, although it will provide many benefits including a greater understanding of the influence of features impacting on flooding (e.g. starting water levels in wetlands, cross drainage structures etc).
The cost of detailed hydraulic modelling would not achieve any significant material benefit with respect to refining the current flood mapping overlays that existing within the Campaspe Planning Scheme. This conclusion has been drawn based on reviewing the recently captured LiDAR data against the existing flood mapping. Where the existing flood overlays cross ‘obvious’ high land, the mapping should be amended as part of Campaspe’s correctional Planning Scheme Amendment program.
10.6 Future Studies – Floodplain Management Issues The issues of most interest based on the community feedback received during Scoping Study are listed in Section 10.4. These issues lend themselves to the following potential studies:
Colbinabbin Flood Study. This study would focus on using hydraulic modelling techniques to investigate flood management issues at Colbinabbin and the nearby rural surrounds including:
– Reviewing the effectiveness of the current operating rules for the Waranga Western Channel, Lake Cooper and Greens Lake in terms of their influence on flooding at and surrounding the township. Depending on the results of the review, the study could make recommendations for possible changes to operating rules / procedures.

54
31/28597/6047 Corop Lakes Flood Scoping Study
– Assessing the influence of the Railway line on flooding. Study to make recommendations for its future retention, part removal or full removal.
– Study to include hydraulic modelling of breakaway flows from Cornella Creek to Ryans Floodway. This will require the hydraulic model to extend approximately 7km upstream of Colbinabbin.
– Study could encompass an assessment of stormwater flooding issues within the town (i.e. from local runoff off the Mount Camel Ranges).
Given the high cost of a detailed hydraulic modelling study and the limited apparent creek flooding impacts at Colbinabbin, the need for such a study is considered a Low – Medium priority.
Wanalta Creek Flood Study. This study would focus on using hydraulic modelling techniques to better define flooding conditions along Wanalta Creek between Groves Weir and the Old Corop Road. The study would:
– Review the effectiveness of the current operating rules for the Waranga Western Channel and Groves Weir in terms of their influence on downstream flooding. Make recommendations for possible changes to operating rules / procedures if appropriate.
– Assess the influence of the Railway line on flooding. Make recommendations for its future retention, part removal or full removal.
As for Colbinabbin, given the high cost of a detailed hydraulic modelling study and the limited apparent creek flooding impacts downstream of Groves Weir, the need for such a study is considered a Low – Medium priority.
Further broad coverage or local floodplain management studies for the downstream areas north of the above Colbinabbin and Wanalta potential studies could be considered, however the following points are made:
Need for any detailed hydraulic modelling studies to assess creek flooding impacts is considered a Low priority.
Widespread protracted inundation in major creek flooding events is inevitable once the terrain flattens out north of the Bendigo Murchison Road.
G-MW’s rural drainage network is designed to provide a limited level of service (typically removal of a 2 year ARI summer rainfall event). Flows in excess of design need to be conveyed through the adjoining natural drainage systems. Upgrading of these systems would need to be done in a coordinated manner so that flooding problems are not simply transferred downstream.

55
31/28597/6047 Corop Lakes Flood Scoping Study
10.7 Maintain / Further Develop Flood Resilient Communities One of the primary aims of the Australian and Victorian government’s flood mitigation strategy is to develop communities which are resilient to flooding. The common characteristics of communities which are resilient to flooding and other natural disasters are being able to function well while under stress, successful adaptation to the prevailing flood risk, self-reliance during flood events and the social capacity to recover from flood events.
Further development of the Corop Lakes community’s level of resilience to flooding will benefit from the following activities:
G-MW to review their operational procedures with the aim of identifying any practical opportunities to refine their operations in order to reduce flood impacts, without impacting adversely on G-MW’s business (High Priority).
G-MW to work with the community in relation to providing information and advice with respect to their operations where such operations can influence flooding, and to also assist the community in regards to developing improved flood warning arrangements (High Priority).
Telemetering of the Cornella Creek streamflow gauging station at Bakers Bridge Road (Medium Priority).
Establishment of an automatic weather station (AWS) for providing improved rainfall data intelligence within the Cornella and / or Wanalta Creek catchments. Alternatively VICSES to investigate the viability of establishing a flood-warden system using local residents to assist with improved early flood warning capability (Medium Priority).
Addition of the Cornella Creek and Wanalta Creek streamflow gauging stations, and the proposed new AWS to the Bureau of Meteorology’s on-line flood warning network information service (Medium Priority).
Public education and awareness activities undertaken to provide the community with an improved understanding of flood risks (e.g. through the distribution of information flyers to the community in line with the VICSES FloodSafe Program) (Medium Priority).

56
31/28597/6047 Corop Lakes Flood Scoping Study
11. References
Department of Primary Industries (2011). Optional Environmental Watering Points for High Value Wetlands within the Shepparton Irrigation District.
Sinclair Knight Merz (June 2000). Flood Data Transfer Project – River Basin Report – Deakin Basin. Prepared for Department of Natural Resources and Environment.
Sinclair Knight Merz (2000). Community Surface Drainage Schemes – Guidelines for Design. Prepared for Department of Natural Resources and Environment and G-MW.
Reid Sturgess & Associates Pty Ltd (May 2000). Rapid Appraisal Method (RAM) for Floodplain Management. Prepared for the Department of Natural Resources and Environment.
31/28597/6047 Corop Lakes Flood Scoping Study
Appendix A
Streamflow Data

31/28597/6047 Corop Lakes Flood Scoping Study
Table A1 Cornella Creek – Annual Recorded Peak Flows and Runoff Volume
Year Peak Flow (ML/d)
Annual Runoff Volume (ML)
Year Peak Flow (ML/d
Annual Runoff Volume (ML)
1961 160 520 1987 2,800 10,000
1962 2,630 5,810 1988 1,550 11,600
1963 1,920 8,810 1989 1,710 14,300
1964 4,760 27,200 1990 1,030 2,700
1965 3,110 7,400 1991 2,160 9,000
1966 1,910 3,960 1992 8,570 26,200
1967 1,380 2,620 1993 5,570 25,800
1968 4,290 17,500 1994 30 300
1969 2,550 6,950 1995 4,820 15,800
1970 3,120 7,450 1996 1,560 15,300
1971 770 4,440 1997 420 7,100
1972 2,040 1,810 1998 310 1,600
1973 6,020 42,000 1999 160 5,800
1974 7,890 38,600 2000 1,480 5,900
1975 5,580 27,000 2001 2,730 15,400
1976 170 500 2002 0 0
1977 480 770 2003 660 2000
1978 2,570 11,000 2004 460 940
1979 5,020 16,100 2005 170 3,100
1980 530 1,900 2006 0 0
1981 2,630 20,500 2007 600 660
1982 0 0 2008 0 0
1983 5,520 19,200 2009 0 0
1984 2,380 4,800 2010 3,470 18,400
1985 990 4,920 2011 3,400 11,900
1986 3,710 22,800 2012 3,700 na
Note: 1. The peak flow is the instantaneous peak flow for that year. It is not an average flow over a 24 hour
period.

31/28597/6047 Corop Lakes Flood Scoping Study
Table A2 Wanalta Creek – Annual Recorded Peak Flows and Runoff Volume
Year Peak Flow (ML/d)
Annual Runoff Volume (ML)
Year Peak Flow (ML/d
Annual Runoff Volume (ML)
1961 80 140 1987 970 4,000
1962 1,520 1,670 1988 870 5,600
1963 2,150 4,860 1989 790 5,200
1964 2,490 9,370 1990 1,240 1,600
1965 620 920 1991 1,870 4,500
1966 610 550 1992 4,650 9,400
1967 220 460 1993 4,750 11,300
1968 2,680 6,300 1994 9 30
1969 1,060 2,160 1995 4,050 7,800
1970 260 1,330 1996 1,760 5,000
1971 300 930 1997 380 1,200
1972 310 300 1998 50 160
1973 13,700 21,900 1999 200 600
1974 6,750 16,900 2000 330 3,200
1975 1,700 7,250 2001 10 0
1976 21 17 2002 180 9,000
1977 150 180 2003 850 1,900
1978 790 3,370 2004 630 800
1979 1,630 5,850 2005 720 3,000
1980 650 760 2006 0 0
1981 1,380 8,920 2007 3,550 1,460
1982 0 0 2008 310 240
1983 1,540 7,410 2009 0 0
1984 1,670 2,090 2010 4,300 9,600
1985 950 2,750 2011 2,800 4,300
1986 1,300 5,700 2012 6,700 Na
Note: 1. The peak flow is the instantaneous peak flow for that year. It is not an average flow over a 24 hour
period.

31/28597/6047 Corop Lakes Flood Scoping Study
Appendix B
Plans / Maps Reviewed

31/28597/6047 Corop Lakes Flood Scoping Study
Table B1 Miscellaneous Plans Reviewed
Plan / sheet number
Title Scale Description
108715 – sheets 1 and 2
Sheet 1 – Corop Lakes
Sheet 2 – Stanhope Depression & Wallenjoe Depression
1:19,000 Aerial flood photography - 13 November 1975.
Covers all of lakes area.
10373 Corop Lakes Flooding – October 1975
1:19,000 Aerial flood photography – 29.10.1975.
- Parish of Carag Carag 1:15,800 Hand-drawn spot flood heights – 1950 flood, May 1974 and October 1974.
-
(SR&WSC)
Corop Lakes – Flood Photo Mosaic – August 1981
1:25,000 Aerial flood photography – 20.8.1981.
Cover the lakes area.
100192
(SR&WSC - 1972)
Corop Lakes Planning Scheme Floodway Zones
1:25,000 Levee banks marked, floodway boundaries marked.
100273 (SR&WSC 1972)
Wanalta Creek Flood Zone – Levee Banks Feature Survey
1:2,400 Levee bank survey at Carag Carag / Two Tree Swamp.
100274 (SR&WSC 1972)
Wanalta Creek Flood Zone – Midland Highway Culverts
1:3,600 Survey data for culverts (datum imperial).
100275 (SR&WSC 1972)
Wanalta Creek Flood Zone – Levee Bank Cross Sections (sheets 1 to 3)
1:120 Surveyed cross section plots.
108715 (SR&WSC) Greens Lake to Lake Cooper – Flood Photography Nov 75 (sheets 1 and 2)
1:18,500 Aerial flood photography 13.11.75.
Covers lakes area.
-
(Shire Waranga 1982)
Midland Highway Flooding at Woolwash Floodway Parish of Carag Carag
- Plan showing spot flood levels 6.8.81 and proposed road culverts at corner Midland Highway and Carag Road.

31/28597/6047 Corop Lakes Flood Scoping Study
Plan / sheet number
Title Scale Description
108473 (SR&WSC 1974)
Corop Lakes Project Flooding October 1974 – sheets 1 and 2
1:30,000 Aerial flood photograph on 14.10.74.
Northern end of study area.
108142, 43 &44 (SR&WSC 1973)
Flooding Photography Sept-Nov 1973.
1:30,000 approx.
Aerial flood photography 29.9.73 & 8.11.73.
Covers lakes area.
105516 (SR&WSC 1973)
Flooding – September 1973 in Cornella – Wanalta – Corop Lakes regions & Timmering Depression & Beattie Depression
1:105,00 Schematic plan showing inundation areas and flow paths for lakes area.
Note: Above plans are held by the Goulburn Broken CMA.

31/28597/6047 Corop Lakes Flood Scoping Study
Table B2 DPI 2011 High Value Wetlands Review – Corop Lakes Complex
Wetland Name
Description Size (ha)
Depth (m)
Volume (ML)
Comments (land status, land manager, environmental water supply)
Cornella Creek Wetland
Reedy wetland with fringing river red gums
160 1.5 660 Located on public land. Privately managed. Can be supplied from Waranga Western Channel.
Gaynor Swamp
Ephemeral wetland 300 0.95 2,500 Located on public land, managed by Parks Victoria. Has its own Water Right (40ML). Structure possibly required to divert Cornella Creek flows into wetland.
Lake Stewart Previously permanent water body, now dry.
137 1.5 488 Private land ownership and management. Potential supply from Channel 2/16, 14 or 2/14.
Lake Cooper Previously permanent water body, now dry
1,250 1.5 – 2.0
35,400 Located on public land, managed by G-MW. Can be supplied from Waranga Western Channel.
Horseshoe Lake
Currently dry and degraded.
251 1.5 1,238 Private land ownership and management. Potential supply from Channel 16 or 2/16.
Racecourse Lake
Palaeosaline lake (semi-permanent saline wetland)
50 1.5 244 Private land ownership and management. Supplied by runoff and natural drainage line.
Greens Lake Permanently wet irrigation storage.
830 >1.5 - Located on part public, part private land. Managed by G-MW. No changes proposed.
Note: Above details obtained from 2011 DPI report (Optional Environmental Watering Points for High Value Wetlands within the Shepparton Irrigation District).

31/28597/6047 Corop Lakes Flood Scoping Study
Table B3 DPI 2011 High Value Wetlands Review – Wanalta Woolwash Complex
Wetland Name
Description Size (ha)
Depth (m)
Volume (ML)
Comments (land status, land manager, environmental water supply)
Groves Weir On-line with Wanalta Creek upstream of Waranga Western Channel
41 1.5 - Part public / private land. Managed by G-MW. Supplied by creek flows and overflows from Waranga Western Channel.
One Tree Swamp
Receives inflows from Wanalta Creek.
609 0.65 4,268 Located on public land, managed by Parks Victoria. Concerns that Groves Weir is too high thereby severely limiting downstream Wanalta Creek flows in winter.
Two Tree swamp
Receives inflows from Wanalta Creek.
55 0.65 266 Located on public land, managed by Parks Victoria. Concerns as for One Tree Swamp (lack of creek inflows).
Little Wallenjoe Swamp
Supplied by natural drainage line.
131 0.65 1,034 Located on private land, privately managed. In need of environmental flows.
Wallenjoe Swamp
Supplied by natural drainage line.
492 0.95 5,633 Located on public land, managed by Parks Victoria. In need of environmental flows.
Mansfield Swamp
Currently supplied by natural drainage line and Timmering Drain.
99 (500 reserve)
0.95 992 Located on public land, managed by Parks Victoria. Can be supplied by Channel 7/9. Current project underway to pipe stock & domestic water to wetland.
Timmering Depression
Floodway downstream of Corop and Wanalta lake systems.
1,116 0.5 5,890 Located on private land, privately managed. Could be supplied by Channel 1.
Note: Above details obtained from 2011 DPI report (Optional Environmental Watering Points for High Value Wetlands within the Shepparton Irrigation District).

31/28597/6047 Corop Lakes Flood Scoping Study
Appendix C
Flood Mapping

31/28597/6047 Corop Lakes Flood Scoping Study
Table C1 Summary of Edits to FO and LSI Extents
Edit Number (refer Figure C1)
Description
1
Refer Figure C2
Expansion of LSI area at Colbinabbin, notably on east side of Cornalla Creek downstream of Bendigo Murchison Road.
Addition of FO over Cornella Creek route (previously LSI)
2 Amendment to LSI extent on east side of Egans Bridge Road, 1.8 km north of Cornella Church Road. Previous LSI extent covered homestead.
3
Refer Figure C3
Amendment to LSI extent on west side of Groves Weir. Previous LSI extent covered a number of buildings on high ground.
4
Refer Figure C3
Addition of FO over Wanalta Creek from Groves Weir to One Tree Swamp (previously LSI).
5
Refer Figure C3
Amendment of LSI extent on west side of Wanalta Creek at Depot Road. Previous LSI extent covered a number of buildings on high ground.
6 Deletion of LSI ‘island’ within One Tree Swamp. Area reverts to FO which covers the whole of One Tree Swamp.
7 Adjustment / minor expansion of FO extent at One Tree and Two Tree Swamps. Extent moved to coincide with levee location.
8 Adjustment of FO on north side of Carag Road approximately 2km south east of the Midland Highway. Extent moved to coincide with levee location.
9 Adjustment of FO extent on south side of Mansfield Swamp. Extent moved to coincide with levee location.
10 Expansion of FO to encompass Link Drain route between Lake Cooper and Greens Lake.
11 Amendment to FO extent at north end of Greens Lake. Previous FO extent covered homestead on high ground.
12 Amendment to FO extent to encompass a reach of the Deakin Main Drain at Blamey Road.
13 Amendment of LSI extent opposite the south east corner of the Geodetic Road North and Morrissey Road intersection. Previous LSI extent covered homestead on high ground.
14 Deletion of LSI extent on Watson Road, 300 metres south of Mason Road. Previous LSI extent over homestead and other buildings either side of Watson Road on high ground.
15 Expansion of FO extent to encompass the Timmering Depression Drain route immediately north of White Road.

31/28597/6047 Corop Lakes Flood Scoping Study
Edit Number (refer Figure C1)
Description
16
Refer Figure C4
Expansion of FO extent to encompass the Timmering Depression Drain route immediately north of MacGregor Road.
17
Refer Figure C4
Expansion of FO extent to encompass the Timmering Depression Drain route 500 metres south of Gray Road.
18
Refer Figure C4
Expansion of FO extent to encompass the Timmering Depression Drain route south of Everard Road.
19
Refer Figure C4
Expansion of FO extent on eastern side of Timmering Depression Drain, 500 metres north of Everard Road.
20
Refer Figure C4
Expansion of FO extent to encompass the Timmering Depression Drain route, 500 metres south of Graham+ Road.
21 Deletion of LSI islands within FO extent either side of the Deakin Main Drain on the south side of the Echuca-Kyabram Road.
Note:
1. The location of each ‘Edit Number’ is shown on Figure C1.

31/28597/6047 Corop Lakes Flood Scoping Study
Figure C1 Corop Lakes Study Area – Adjusted FO and LSI Extents

31/28597/6047 Corop Lakes Flood Scoping Study
Figure C2 Colbinabbin – Added FO and Adjusted LSI
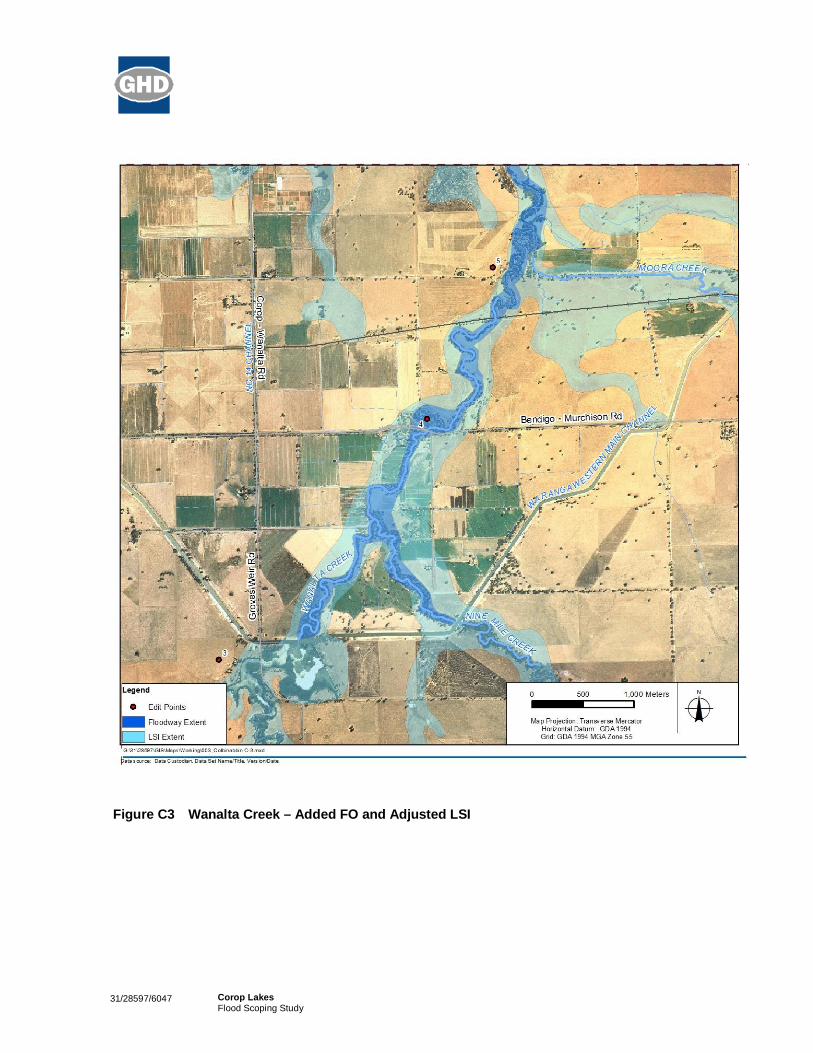
31/28597/6047 Corop Lakes Flood Scoping Study
Figure C3 Wanalta Creek – Added FO and Adjusted LSI

31/28597/6047 Corop Lakes Flood Scoping Study
Figure C4 Timmering Main Drain – Adjusted FO and LSI

31/28597/6047 Corop Lakes Flood Scoping Study
Appendix D
Flood Damages

31/28597/6047 Corop Lakes Flood Scoping Study
D Flood Damages Analysis The flood damage analysis was based on the application of the Rapid Appraisal method (RAM – Reid Sturgess, 2000). The method is based on the following assumptions and procedures.
D1 Approach
The RAM is a simplified approach to determining flood damages. It provides an indicative estimate only. It involves estimating damages for ‘key’ flood events. The approach generally involves the following:
Threshold event at which flood damages first occur. The key issue / assumption here is defining the ARI of this event. Typically an ARI in the vicinity of 2 to 5 years is adopted, although it will vary depending on the flood damage characteristics of the study area.
Flood damages are calculated for at least two events. Given that the RAM is an indicative estimate, there is usually only very limited flood mapping data available. In these circumstances, two events are usually used and often coincide with the two defined flood overlays (FO and LSI). An ARI needs to be assigned to the respective events used. If LSI is being used, then this usually coincides with the 100 year ARI event. If FO is being used, this typically is assigned an ARI of 10 to 20 years.
Once the flood damages have been calculated for the two or more flood events, the average annual damage (AAD) can then be calculated as the area under the damage – probability curve (AAD equals the sum of the product of the event damage multiplied by the event probability).
In the case of the Corop Lakes study area, the following assumptions were made:
Threshold event for damages. An ARI of 5 years was adopted.
The refined floodway overlay (FO) extent was used as the intermediary event. An ARI of 20 years was assigned to the FO extent.
The refined combined LSI and FO extent was used as the high end event. An ARI of 100 years was assigned to the combined LSI / FO extent.
D2 Calculation of Direct and Indirect Damages
Direct damages are based on accounting for damages to the following:
Buildings
Agricultural enterprises
Infrastructure
Details regarding the direct damages calculations are proved as follows.
D2.1 Direct Damage to Buildings
The CMA supplied geo-referenced aerial photography of the study area. The revised flood overlays were overlaid onto the aerial photography. The number of houses located within the FO and LSI overlay areas was subsequently identified.
Although the identified houses / buildings are located within the flood overlays, this does not necessarily mean that they are all subject to above floor flooding. A significant number of the houses are likely to have floor levels elevated above the 100 year ARI flood level. Only a small number of the houses have been

31/28597/6047 Corop Lakes Flood Scoping Study
confirmed as being subject to above floor flooding in the recent flood events between 2010 and 2012 (i.e. through questionnaire responses).
The RAM is based on a simple count of the number of buildings within the flood extent. It does not generally differentiate between buildings which have floor heights above flood level and those below given that this is not generally known. In the case of this study, the following assumptions were adopted:
20 year ARI event – 20% of the houses within the FO assumed to be subject to above floor flooding.
100 year ARI event – 60% of the houses within the combined FO and LSI overlays assumed to be subject to above floor flooding.
Damage assigned to houses was based on the following approach:
Average potential damages of $30,000 per residential dwelling for those dwellings assumed to be subject to 100 year ARI above floor flooding (RAM adopted figure of $20,500/building factored up to allow for inflation since 2000).
Average potential damage of 10,000 per residential dwelling assigned to those dwellings located within the floodplain but assumed not to be subject to 100 year ARI above floor flooding.
Actual damage was reduced to 70% upstream of the Depot Road, 55% between the Depot Road and the Midland Highway, and 40% downstream of the Midland Highway after taking into account the available warning time.
Details of calculated flood damage to houses are provided in Tables D1 and D3.
D2.2 Direct Damage to Agriculture
The area subject to 20 and 100 year ARI inundation was identified based on the refined flood overlay extent mapping defined by this study. This area was then divided as follows:
Wetland and lake areas assumed not to be productive agricultural areas.
25% of the remaining area inundated assumed to be broadacre cropping.
75% of the remaining area inundated assumed to be pasture.
The calculated agricultural damages are based on data given by the RAM and factored up to allow for inflation since 2000). The calculated agricultural damage includes a general allowance for clean-up costs (eg for repair of fences, erosion damage, sediment/gravel deposition etc).
Details of agricultural damages are provided in Table D3.
Direct Damage to Infrastructure The RAM makes an approximate allowance for damage to all infrastructure by applying a damage rate to the length of roads located within the floodplain. Different damage rates are used for major sealed roads, minor sealed roads and unsealed roads.
Road lengths within the 20 and 100 year ARI inundation extents were estimated based on the refined flood overlay extent mapping defined by this study. The calculated road damages are based on data given by the RAM.
Details of infrastructure damages are provided in Table D3.

31/28597/6047 Corop Lakes Flood Scoping Study
Indirect Damages Indirect damages account for losses from the disruption of normal economic and social activities that arise as a consequence of the physical impact of flooding.
The RAM recommends indirect losses be calculated as between 20 and 45% of the total actual direct damages. A rate of 25% was adopted for this study based on the predominantly rural nature of direct damages incurred.
Indirect damages are given in Table D3.
Calculation of Average Annual Damage The RAM uses the following procedure to calculate the AAD:
Adoption of an equivalent flood frequency coinciding with the threshold at which flood damages commence.
Adoption of an equivalent flood frequency coinciding with the inundation of the designated floodway area. Calculation of flood damages for this particular ARI event.
Calculation of flood damages for the 100 year ARI event (100 year ARI event coincides with the inundation of the combined floodway and LSI areas).
A threshold flood damage frequency of 5 years ARI and a floodway inundation frequency of 20 years ARI was adopted. The AAD was then calculated based on the above three identified damage probability points (refer to Table D3). The overall AAD for the whole study area was calculated to be $635,000/annum.
The computed AAD is particularly sensitive to the adopted threshold frequency at which flood damages commence. Adopting a threshold flood damage frequency of 2 years ARI increases the AAD to $1,390,000/annum.

31/28597/6047 Corop Lakes Flood Scoping Study
Figure D1 Flood Damages Data Areas

31/28597/6047 Corop Lakes Flood Scoping Study
Table D1 Data for Preliminary Flood Damages Assessment
Reach Total Area Flooded (km2) Number of houses within Flood Overlays
Combined FO & LSI
FO area only
LSI area only
Combined FO & LSI
FO area only
LSI area only
1 - Cornella Church Road to Depot Road
16 12 4 19 11 8
2 - Depot Road to Midland Highway
105 98 6 7 2 5
3 - Midland Highway to Kyabram Rochester Road
70 54 16 11 5 6
4 - Kyabram Rochester Rd to Echuca Kyabram Rd
38 18 20 3 1 2
Note: Refer to Figure D1 for reach area delineation.
Table D2 Data for Preliminary Flood Damages Assessment – Road Lengths
Reach Road lengths within flood overlay inundation extents (km)
FO Only Combined FO and LSI
Major Minor sealed
Other Major Minor sealed
Other
1 - Cornella Church Road to Depot Road
2 4 6 5 6 10
2 - Depot Road to Midland Highway
5 15 64 9 21 102
3 - Midland Highway to Kyabram Rochester Road
0 6 57 0 13 76
4 - Kyabram Rochester Rd to Echuca Kyabram Rd
0 1 19 0 6 43
Note:
1. Major roads - Midland Highway and Bendigo Murchison Road.
2. Minor sealed roads – Corop Wanalta Road, Heathcote-Moora Road, Old Corop Road, Girgaree-Rushworth Road, Geodetic Road North, Winter Road, Watson Road, Kyabram-Rochester Road, Echuca Kyabram Road.

31/28597/6047 Corop Lakes Flood Scoping Study
Table D3 Estimated Flood Damages
Damage Category Flood Damage ($)
Reach 1 Reach 2 Reach 3 Reach 4
FO (20yr) LSI (100yr) FO (20yr) LSI (100yr) FO (20yr) LSI (100yr) FO (20yr) LSI (100yr)
Direct – Buildings 105,000 287,000 11,000 82,500 28,000 92,000 4,000 28,000
Direct – Agriculture 47,000 102,000 1,398,000 1,627,000 932,000 1,360,000 350,000 850,000
Direct – Roads 131,000 259,000 597,000 956,000 314,000 472,000 92,000 252,000
Total Direct Damage 283,000 648,000 2,006,000 2,665,500 1,274,000 1,924,000 446,000 1,130,000
Indirect Damage (25%) 70,750 162,000 501,500 666,375 318,500 481,000 111,500 282,500
Total Damage 353,750 810,000 2,507,500 3,331,875 1,592,500 2,405,000 557,500 1,412,500
Reach AAD 50,000 305,000 199,000 81,000
Total AAD 635,000
Notes:
1. Refer to Figure D1 for reach areas.
2. Above assumes threshold for commencement of damages is 5 year ARI event.

31/28597/6047 Corop Lakes Flood Scoping Study
Appendix E
Landholder Questionnaire

31/28597/6047 Corop Lakes Flood Scoping Study

31/28597/6047 Corop Lakes Flood Scoping Study

31/28597/6047 Corop Lakes Flood Scoping Study
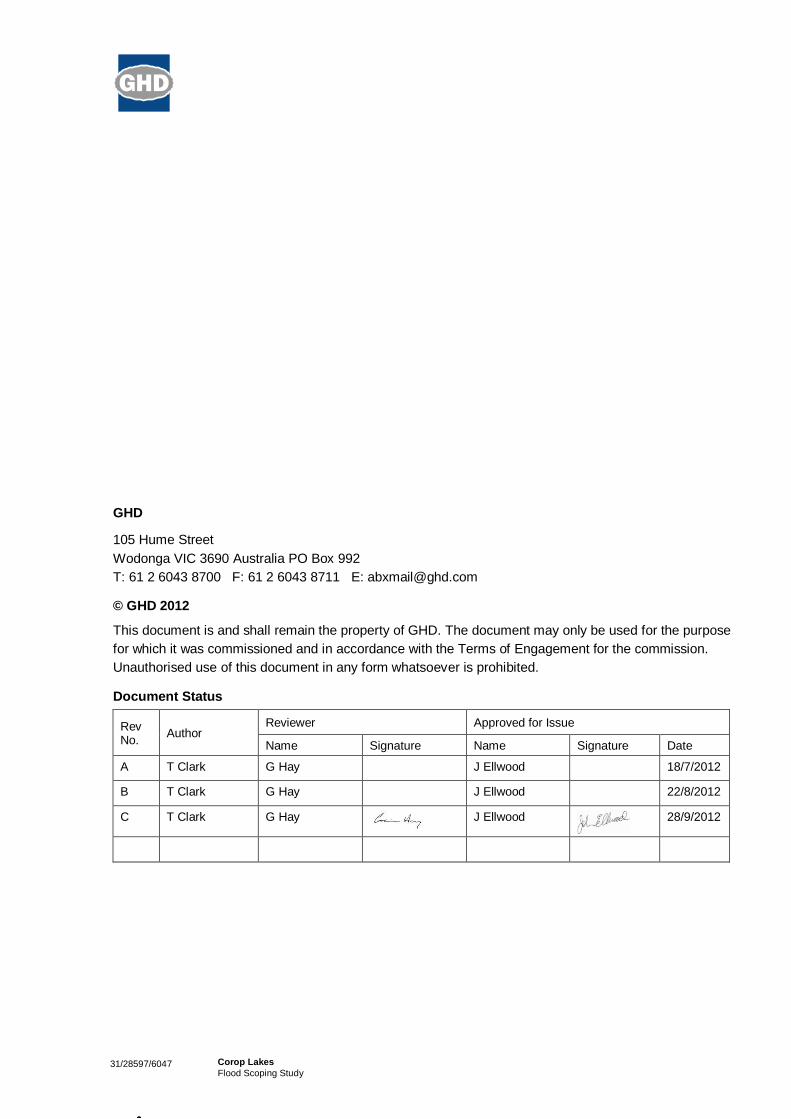
31/28597/6047 Corop Lakes Flood Scoping Study
GHD
105 Hume Street Wodonga VIC 3690 Australia PO Box 992 T: 61 2 6043 8700 F: 61 2 6043 8711 E: [email protected]
© GHD 2012
This document is and shall remain the property of GHD. The document may only be used for the purpose for which it was commissioned and in accordance with the Terms of Engagement for the commission. Unauthorised use of this document in any form whatsoever is prohibited.
Document Status
Rev No. Author
Reviewer Approved for Issue
Name Signature Name Signature Date
A T Clark G Hay J Ellwood 18/7/2012
B T Clark G Hay J Ellwood 22/8/2012
C T Clark G Hay
J Ellwood
28/9/2012