
Flood Management and Woodland Creation - Southwell Case Study · PDF fileManagement and...
59
2016s4178 - Southwell Modelling Appraisal Report_Supplementary report i Flood Management and Woodland Creation - Southwell Case Study Hydraulic Modelling and Economic Appraisal Report March 2017
Transcript of Flood Management and Woodland Creation - Southwell Case Study · PDF fileManagement and...

2016s4178 - Southwell Modelling Appraisal Report_Supplementary report i
Flood Management and Woodland Creation - Southwell Case Study
Hydraulic Modelling and Economic Appraisal Report
March 2017
2016s4178 - Southwell Modelling Appraisal Report_Supplementary report ii
JBA Project Manager Matthew Scott South Barn Broughton Hall SKIPTON North Yorkshire BD23 3AE
Revision History Revision Ref / Date Issued
Amendments Issued to
Draft final report / March 2017
Richard Haw and Pat Snowdon (Forestry Commission
Final Report / April 2017
Revisions discussed with client.
Re-visit of property counts
Richard Haw and Pat Snowdon (Forestry Commission
Final Report (supplementary) / August 2017
Further revisions requested by client
Pat Snowdon (Forestry Commission
Contract This report describes work commissioned by Richard Haw, on behalf of the Forestry Commission, under contract reference CFS 13_15 issued on 22nd April 2016. The Forestry Commission representatives for the contract was Richard Haw and Pat Snowdon. Guy Dixon, Frank O'Connell, Angus Pettit and Matthew Scott of JBA Consulting carried out this work.
Prepared by ................................................ Guy Dixon BSc MSc
Senior Analyst
Angus Pettit BSc MSc CEnv CSci MCIWEM C.WEM
Technical Director
Reviewed by ............................................... Matthew Scott MSc BSc
Senior Analyst
Andrew Gubbin BSc MSc PGDip CEng MICE FCIWEM C.WEM MBCS
Director
Purpose This document has been prepared as a Final Report for the Forestry Commission. JBA Consulting accepts no responsibility or liability for any use that is made of this document other than by the Forestry Commission for the purposes for which it was originally commissioned and prepared.
JBA Consulting has no liability regarding the use of this report except to Forestry Commission.

2016s4178 - Southwell Modelling Appraisal Report_Supplementary report iii
Acknowledgements We gratefully acknowledge Richard Haw, Vince Carter and Pat Snowdon of the Forestry Commission and Dr Tom Nisbet and Huw Thomas of Forest Research for their contributions to the development of the methodology and review of outputs throughout the study.
Copyright © Jeremy Benn Associates Limited 2017.
Carbon Footprint A printed copy of the main text in this document will result in a carbon footprint of 231g if 100% post-consumer recycled paper is used and 294g if primary-source paper is used. These figures assume the report is printed in black and white on A4 paper and in duplex.
JBA is aiming to reduce its per capita carbon emissions.

2016s4178 - Southwell Modelling Appraisal Report_Supplementary report iv
Executive summary Study background
The Forestry Commission (FC) and Forest Research (FR) have been researching ways to use forestry in aid of flood relief for over 15 years. Over time this has naturally progressed to incorporate science into hydraulic modelling studies. Until recently the established modelling software and techniques have not been able to simulate the impact of significant changes to vegetation coverage on catchment hydrological processes such as infiltration and runoff. Recent developments in modelling techniques and particularly the growth in expertise of direct rainfall modelling which allows the modelling of complex pluvial and fluvial overland flow routes has enabled these processes to be modelled more effectively.
Alongside this the project team estimated the value of damages avoided from reduced flood risk and considered the potential wider environmental benefits provided by woodland.
Case study area - Southwell, Nottinghamshire
Southwell is located within a significant flood risk area and has historically been flooded from a number of sources including fluvial, pluvial and surface water components. Given the topography of the upper catchments (referred to as Halam and Potwell) and the significant overland flow routes that are generated, Southwell represents good opportunity for assessing the effectiveness of woodland creation approaches.
Southwell has suffered from repeated flooding within recent history and was severely affected by extensive flooding on the 25th June 2007 and again on the 23rd July 2013.
Modelling approach
Refinements to existing 1D-2D hydraulic model
To allow the impact of woodland creation to be adequately quantified a number of refinements to the baseline model have been applied:
Process Details Model Domain
Soil Infiltration - increased infiltration of soil by
maintaining soil macroporosity
Specification of a soil layer with user defined initial wetness, infiltration rate and soil porosity
2D (TUFLOW) Domain
Rainfall Interception Specific interception rates applied in more detail to upland catchment. Land use classes more
clearly defined in terms of woodland and vegetation types.
Interception rates based on established research (e.g., Calder 2003)
2D (TUFLOW) Domain
Modifications of Topography - increased
hydraulic resistance to runoff caused by presence of tree trunks and woody material.
Results in reduced sediment delivery
Modelling of physical impact of woodland on overland flow processes – stands represented
using flow constriction areas which restrict rate at which flow travels through wooded areas
2D (TUFLOW) Domain
The post afforestation model was then developed to reflect the establishment of 150ha of mature conifer woodland located in areas directly adjacent to all key watercourses in the upper Halam and Potwell catchments.
Model Simulations
The model simulations that have been undertaken are as follows:
(1) Baseline flood scenarios: 5, 25, 50 and 75-year events (1, 4 and 10-hour storm durations)
(2) Post woodland creation scenarios:
• Conifer option 1 - woodland cover increased by 150ha. 5, 25, 50 and 75-year events (1, 4 and 10-hour storm durations).
• Conifer option 2 (sensitivity test) - woodland cover increased by 310ha. 5, 25, 50 and 75-year events (1-hour storm duration only).

2016s4178 - Southwell Modelling Appraisal Report_Supplementary report v
• Broadleaf option 1 - woodland cover increased by 150 ha. 25, 50 and 75-year events (1-hour storm).
(3) Sensitivity runs: Woodland type, rainfall infiltration rates, antecedent soil wetness and extent of woodland planting.
All model runs have been undertaken using a summer profile as this produces the most significant flood risk conditions in the urban area.
Study Findings
Woodland creation - Impact on flood risk
The analysis highlights that during the lower order events (<25-year return period), the largest proportion of properties flooded is due to surface water where factors such as the extent of impermeable surfaces and the capacity of the surface water systems are critical controls on flood risk. These processes are less inhibited by the proposed changes in woodland cover and as a result the impact on the numbers of flooded properties is limited (none removed at 5-year).
For the medium and larger flood events (25 to 75-year return period) the impact of woodland creation is clearer as this corresponds to the activation of several fluvial flooding mechanisms, particularly on the Potwell Dike catchment. This is reflected in the numbers of properties removed from flood risk due to woodland creation which is generally larger in the Potwell Dike catchment across all events. Table 1 summarises the numbers of flooded properties identified by the modelling
Table 1 - Property counts - existing and post scheme
Return Period (years)
No. Properties Flooded - Existing
No. Properties Flooded - Post woodland
creation
No. Properties removed from
flood risk
Halam Catchment
5 55 55 0
25 79 75 4
50 102 93 9
75 119 112 7
Potwell Catchment
5 51 51 0
25 80 71 9
50 108 98 10
75 132 116 16
Note, property assumed to be inundated when the maximum modelled flood depth exceeds 150mm.
The most significant impact on flood risk has been identified on Potwell Dike between Nottingham Road and Newark Road and this area represents the main area where fluvial flooding is the dominant flooding mechanism. This has a significant impact on several high-risk flooding areas, such as Templemens Way (Newark Road) and Church Street, where a large number of properties were inundated during the 2013 event.
Economic viability
The economic viability of using woodland creation to help reduce flood risk has been assessed by undertaking a detailed benefit-cost analysis which compares per hectare costs of woodland planting versus the flood, environmental and total benefits. The benefits are based on the current Southwell site assuming 150ha of additional planting being distributed across the Halam and Potwell catchments.
The analysis suggests that for all scales of planting and the three cost scenarios (low, medium and high), flood benefits outweigh the planting costs with a benefit-costs range between 1.0 to 8.3. This is the same for the environmental benefits (excluding flooding) with a benefit-cost range between

2016s4178 - Southwell Modelling Appraisal Report_Supplementary report vi
4.8 and 40.3. It should be noted however that no land purchase costs nor optimism bias are included in these costs.
While uncertainties exist in terms of availability of grant, land opportunity costs and the inclusion of environmental benefits for the Southwell case study the analysis suggest that woodland creation can provide in this case small but cost-effective reductions in damages from flooding and could play a key role as part of a wider NFM or traditional scheme for appropriate catchments.
In order for this to be cost effective however, land compensation costs need to be minimised as much as possible, or the wider benefits of woodland creation need to be valued and taken into consideration by the appraiser and the regulatory authority.
Implications for use of woodland creation as part of flood defence schemes
The analysis has shown that in catchments where fluvial flooding mechanisms represent the principal source of flooding, such as Potwell Dike, woodland creation should provide an effective contribution to flood risk management either as a stand-alone option or as part of a wider scheme.
For example, the addition of woodland creation may allow more traditional scheme design to utilise smaller flood barriers or require less flood storage which could have a significant impact on overall scheme costs. Woodland creation could also play an important role in the ‘future proofing’ of existing flood alleviation schemes by mitigating the potential impacts of climate change on the effectiveness of the main scheme.
Recommendations for improvements
While the findings of the investigation have identified a clear methodology for the modelling of woodland creation as a potential flood defence option there are areas for improvement which would benefit from further analysis and investigation:
• Apply the methodology to a wider range of catchments to test appropriateness of approach. This would need to be in catchments with comprehensive observed and measured flood event data to allow further calibration of key parameters. This would include assessments in areas with larger annual rainfall rates than in Southwell.
• Further testing of flood events and storm durations - the Southwell investigation has focused on assessing flood risk and catchment response against 1, 4 and 10-hour storm durations only. It is recommended that in order to fully understand the catchment response to woodland creation a more comprehensive analysis covering a wider range of flood events (high and low frequency) in combination with a greater range of storm durations is assessed.
• In the context of the Southwell or similar catchments future investigations should look to isolate the impacts of the fluvial and surface water flooding mechanisms during the modelling exercise. This would allow clearer understanding of the interactions between the individual mechanisms and woodland creation to be established. This could be achieved by further modifying the hydraulic models to capture or intercept specific flooding mechanisms or prevent interactions between catchments e.g., in the case of Southwell, prevent surface flooding from spreading into the Potwell catchment. This would allow the impact of fluvial flood risk in Potwell to be more clearly defined.
• Validation of methodology against observed data from woodland creation catchment studies. This should also include model validation/calibration for winter events as analysis carried out for Southwell has been focused in summer only events.
• This investigation has focused primarily on the impact on hydrological systems in the catchments. In addition to this it would be beneficial to assess the secondary benefits of woodland creation such as the impact on soil and silt transfer rates. For example, the impact of reduced sediment movement could be investigated using sediment transfer modelling software.

Contents
2016s4178 - Southwell Modelling Appraisal Report_Supplementary report
Executive summary ........................................................................................................ iv
1 Introduction ........................................................................................................ 4
1.1 Purpose of study............................................................................................................ 4 1.2 Context of project - Natural Flood Management .............................................................. 4 1.3 Southwell - Case study .................................................................................................. 5 1.4 Report structure ............................................................................................................. 6
2 Modelling approach ........................................................................................... 7
2.1 Southwell existing model................................................................................................ 7 2.2 Modelling methodology .................................................................................................. 7 2.3 Model simulations .......................................................................................................... 10
3 Model results ..................................................................................................... 12
3.1 Introduction ................................................................................................................... 12 3.2 Existing flood risk - baseline ........................................................................................... 13 3.3 Post woodland creation flood risk ................................................................................... 19 3.4 Sensitivity testing ........................................................................................................... 23
4 Southwell afforestation - economic appraisal ...................................................... 27
4.1 Introduction ................................................................................................................... 27 4.2 Guidance ...................................................................................................................... 27 4.3 Methodology.................................................................................................................. 27 4.4 Flood loss approach ...................................................................................................... 27 4.5 Direct property damages ................................................................................................ 28 4.6 Intangible damages ....................................................................................................... 29 4.7 Indirect damages ........................................................................................................... 29 4.8 Environmental benefits .................................................................................................. 30
5 Southwell afforestation - summary of total flood damages .................................. 32
5.1 Flood damage scenarios ................................................................................................ 32 5.2 Results for baseline and conifer planting scenario ........................................................... 32 5.3 Results for sensitivity tests ............................................................................................. 34 5.4 Per hectare benefits....................................................................................................... 35 5.5 Environmental benefits .................................................................................................. 35
6 Southwell afforestation - cost assumptions ......................................................... 37
6.1 Methodology.................................................................................................................. 37 6.2 Optimism bias ............................................................................................................... 39
7 Southwell afforestation - benefit cost analysis .................................................... 40
7.1 Introduction ................................................................................................................... 40 7.2 Guidance and standard data .......................................................................................... 40 7.3 Benefit cost results per hectare ...................................................................................... 40 7.4 Benefit-cost results for Southwell ................................................................................... 41
8 Conclusions and recommendations.................................................................... 44
8.1 Modelling methodology .................................................................................................. 44 8.2 Modelling analysis - Southwell case study - key findings ................................................. 44 8.3 Economic viability .......................................................................................................... 46 8.4 Implications for use of woodland creation as part of flood defence schemes .................... 47 8.5 Recommendations ......................................................................................................... 47
A Appendix A - Economic Analysis - Cost Calculations .......................................... 49
References..................................................................................................................... 50
2016s4178 - Southwell Modelling Appraisal Report_Supplementary report
List of Figures Figure 3.2: Baseline flood risk (5-year) ........................................................................... 14
Figure 3.3: Baseline flood risk (25-year).......................................................................... 15
Figure 3.4: Baseline flood risk (50-year).......................................................................... 16
Figure 3.5: Baseline flood risk (75-year).......................................................................... 17
Figure 3.6 - Pre and Post-scheme modelled stage hydrographs - Upper Halam (5-year) . 19
Figure 3.7 - Pre- and Post-scheme modelled level hydrographs - Upper Halam (75-year)...................................................................................................................... 20
Figure 3.8 - Pre- and Post-scheme modelled event hydrographs - Upper Potwell (25-year)...................................................................................................................... 21
Figure 3.9 - Defended property locations due to simulated woodland creation................. 23
Figure 4.1: Aspects of flood damage.............................................................................. 27
Figure 4.2: Loss probability curve .................................................................................. 28
Figure 5.1: Change in total flood damage with conifer planting ....................................... 33
Figure 5.2: Contribution of flood damages ..................................................................... 34
Figure 5.3: Event damages for each sensitivity test........................................................ 35
Figure 8.1 - Southwell Case Study - Impact on flood risk - Mid Potwell (75-year level hydrograph .................................................................................................... 45
List of Tables Table 1 - Property counts - existing and post scheme ..................................................... v
Table 2.1 – Land use categories and associated scaling factor ....................................... 8
Table 2.2 - Woodland coverage applied to model ........................................................... 10
Table 2.3 - Model simulations - design ............................................................................ 11
Table 3.1 – Modelled flood depths - key areas (baseline / do minimum) .......................... 18
Table 3.2 - Property counts (existing) ............................................................................. 18
Table 3.3 - Modelled flood depths - key areas (post simulated woodland creation) .......... 21
Table 3.4 - Property counts - existing and post scheme .................................................. 22
Table 3.5 - Model sensitivity analysis - woodland type .................................................... 24
Table 3.6 - Model sensitivity analysis - soil infiltration rate ............................................... 25
Table 3.7 - Model sensitivity analysis - antecedent soil wetness ...................................... 25
Table 3.8 - Model sensitivity analysis - Impact on model results ...................................... 26
Table 4.1: Direct flood damage assumptions ................................................................. 29
Table 4.2: Carbon prices and sensitivities for appraisal, 2014 £/tCO2e (source: DECC, 2014) ............................................................................................................. 31
Table 5.1: Baseline flood damages (£m) ........................................................................ 32
Table 5.2: Conifer planted flood damages (£k) ............................................................... 33
Table 5.3: Total flood damages and benefits (£k) ........................................................... 34
Table 5.4: Flood benefits per hectare (£m) .................................................................... 35
Table 5.5: Biodiversity, recreation and aesthetic benefits per hectare (£) ....................... 35
2016s4178 - Southwell Modelling Appraisal Report_Supplementary report
Table 5.6: Carbon sequestration benefits per hectare (£) ............................................... 36
Table 6.1: Costs of woodland planting ........................................................................... 37
Table 6.2: Costs of woodland planting for Southwell ...................................................... 38
Table 6.3: Present Value costs of woodland planting for Southwell (£k) ......................... 39
Table 7.1: Costs of woodland planting (£) ...................................................................... 41
Table 7.2: Cost effectiveness of the options considered ................................................. 42
Table 7.4: Benefit cost ratio for the short duration woodland creation scenarios (k) ........ 43
Table 8.1 - Summary of refinements to existing hydraulic model ..................................... 44
Table 8.2 - Properties removed from flood risk by woodland creation .............................. 46
Abbreviations 1D .................................. 1 Dimensional modelling
2D .................................. 2-Dimensional modelling
AAD ............................... Annual Average Damages
BCA ............................... Benefit Cost Assessment
CFMP ............................ Catchment Flood Management Plans
Defra .............................. Department for Environment, Food and Rural Affairs
EA .................................. Environment Agency
FC .................................. Forestry Commission
FCERM .......................... Flood and Coastal Erosion Risk Management appraisal guidance
FHRC ............................. Flood Hazard Research Centre
FR .................................. Forest Research
FRM ............................... Flood Risk Management
LIDAR ............................ Light Detection and Ranging
MCM .............................. Multi Coloured Manual
NE ................................. Natural England
NFM ............................... Natural Flood Management
NRD ............................... National Receptor Database
NRP ............................... Non-Residential Properties
NTPC ............................. Non-traded price of carbon
OS ................................. Ordnance Survey
PV .................................. Present Value
PVb ................................ Present Value benefits
PVd ................................ Present Value damages
SMP ............................... Shoreline Management Plans
SPH ............................... Density
WTP............................... Willingness to pay
WwNP ............................ Working with Natural Processes

2016s4178 - Southwell Modelling Appraisal Report_Supplementary report
Glossary Direct rainfall model ........ This is where design or observed rainfall depths are applied across a
hydraulic model to identify where flooding may occur.
Flood risk receptor.......... Refers to a location that could be affected by flooding such as people, property, transport and habitats.
Flooding mechanism ...... The identification of the cause of flooding. This can arise from sources such as fluvial, pluvial, tidal or groundwater.
Fluvial flooding ............... Flood risk from rivers.
Hydraulics ...................... This describes the movement of a fluid. It looks at the properties of water and its surrounding environment to determine how water flows.
Hydrodynamic model ...... A hydraulic model which looks at changes in level and flow over time.
Land compensation cost . In the event of having to acquire or use land, there may be a cost to offset the effected individual.
Macroporosity ................ Measure of how soil allows water to infiltrate.
Opportunity cost ............. Refers to the potential loss of benefits after adopting a certain method over alternative options.
Optimism bias ................ Measure of impact of uncertainties or less predictable elements of scheme costs.
Pluvial ............................ Flood risk directly from precipitation.
Routing .......................... Determines the way water flows across an area. It can be used to found areas that flood, and predicts changes in the shape of hydrograph water flows along a watercourse.
Surface water ................. Relates to the flow of water above ground.

2016s4178 - Southwell Modelling Appraisal Report_Supplementary report 4
1 Introduction
1.1 Purpose of study
The Forestry Commission (FC) and Forest Research (FR) have been researching ways to use forestry in aid of flood relief for over 15 years. Over time this has naturally progressed to incorporate science into hydraulic modelling studies.
Until recently the established modelling software and techniques have not been able to simulate the impact of significant changes to upland vegetation coverage on catchment hydrological processes such as infiltration and runoff. Recent developments in modelling techniques and particularly the growth in expertise of direct rainfall modelling which allows the modelling of complex pluvial and fluvial overland flow routes has enabled these processes to be modelled more effectively.
In addition, the economics team at the FC has started to undertake work to estimate the flood relief benefits from establishing newly forested areas in places of flood risk.
In order to bring together both areas of research JBA Consulting was commissioned to derive a methodology for assessing the potential flood risk benefits of upland woodland creation using existing high resolution 1D-2D (one-two dimensional) hydraulic models.
Alongside this the project team estimated the value of damages avoided from reduced flood risk and considered the potential wider environmental benefits provided by woodland.
1.2 Context of project - Natural Flood Management
Natural Flood Management (NFM) represents a range of techniques that aim to reduce flooding by working with natural features and processes to temporarily store or slow down flood waters before they can damage downstream flood risk receptors (e.g. people, property, infrastructure). NFM is an integral part of a Working with Natural Processes (WwNP) approach that involves taking action to sustainably manage flood and coastal erosion risk by protecting, restoring and emulating the natural regulating functions of hillslopes, rivers, floodplains and coasts. It should be noted that the terms NFM and WwNP are used interchangeably in the UK to describe this type of flood risk management.
The Pitt Review (2008) into the major flooding that occurred in summer 2007 across England and Wales concluded that flooding from a range of sources can no longer be managed by building ever higher, lengthier and heavier defences in urban and rural areas. One of the resulting recommendations from this review stated that Department for Environment, Food and Rural Affairs (Defra), the Environment Agency (EA) and Natural England (NE) should work with partners to establish a programme through Catchment Flood Management Plans (CFMPs) and Shoreline Management Plans (SMPs) to achieve greater working with natural processes. NFM should therefore be considered as an important component of the comprehensive flood risk management (FRM) toolkit, where it can also be effectively used to complement more traditional FRM schemes and increase their resilience. A succession of severe flood events in the UK over the last 10 years has led to an increasing awareness and promotion of NFM as an option to explore for any new flood risk management schemes going forwards.
NFM can also help improve the environmental condition of rivers and wetlands, and help to mitigate against and adapt to the projected impacts of climate change. It can also help to deliver the requirements of UK and international environmental legislation and bring about a range of broader environmental and social benefits (often referred to as ‘ecosystem services’). The UK Government is now actively encouraging the implementation of NFM measures within both catchment and coastal areas that can be funded through a range of payment mechanisms and delivered by catchment partnerships. The challenge is to provide the landowners and farmers on whose land these measures would be implemented with the necessary evidence, knowledge and incentives to convince them that changing their practices in this way can bring about the benefits whilst still permitting them to sustain their agricultural/rural businesses into the future.
The creation, restoration and management of woodlands is an integral component of an NFM approach. They can deliver a flood attenuation function in a number of ways:
• Interception of incident rainfall before it reaches the land surface
• Evaporative losses from vegetative surfaces
2016s4178 - Southwell Modelling Appraisal Report_Supplementary report 5
• Increasing infiltration of water into the soil profile by maintaining soil macroporosity
• Increasing hydraulic roughness due to presence of tree trunks and woody material
• Reducing sediment delivery to watercourses by soil protection and slowing surface runoff.
Quantitative evidence that woodlands and woody material can generate a useful flood attenuation function, together with a wide range of other benefits, continues to increase from studies in the UK and elsewhere, although the timescales to collect and analyse this type of evidence can take many years given the time it takes trees to fully mature after initial planting.
Due, in part, to this time dependency there have also been an increasing number of studies that have explored the modelling of woodland and woody material NFM measures in catchments and how this might alter the downstream flood flow (discharge) hydrograph. A wide range of hydrologic and hydraulic models have been applied to this question, each with its own set of data requirements, assumptions and uncertainties.
Of particular interest is the consideration of the scale, configuration and distribution of woodland and woody material measures within a catchment and their combined effect on the downstream flow hydrograph at a flood risk receptor during flood events. Also, within the more formal appraisal of flood risk benefits that is needed for traditional EA flood risk management funding streams, there is a need to assess these benefits in terms of: (i) decreasing flood depths and flood hazard within communities at risk, (ii) reducing the number of properties at risk of flooding, and therefore (iii) decreasing the overall damages as a consequence.
This project provides the formal integration and representation of woodland and woody material NFM measures into an industry standard hydraulic model to explore the effect of these measures on the flood hydrograph and a range of flood risk metrics in Southwell. Our modelling team has worked closely with woodland experts in FR to accurately represent and test the impact of woodland within the confines of the model framework and the model parameters.
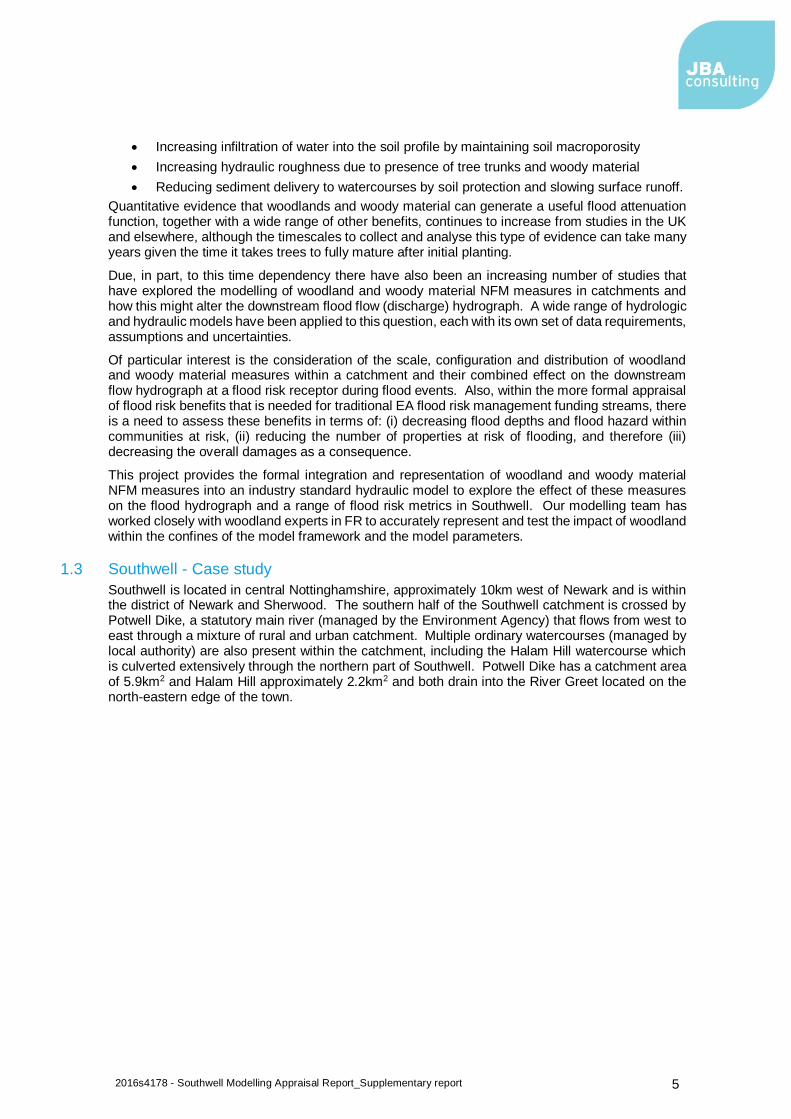
1.3 Southwell - Case study
Southwell is located in central Nottinghamshire, approximately 10km west of Newark and is within the district of Newark and Sherwood. The southern half of the Southwell catchment is crossed by Potwell Dike, a statutory main river (managed by the Environment Agency) that flows from west to east through a mixture of rural and urban catchment. Multiple ordinary watercourses (managed by local authority) are also present within the catchment, including the Halam Hill watercourse which is culverted extensively through the northern part of Southwell. Potwell Dike has a catchment area of 5.9km2 and Halam Hill approximately 2.2km2 and both drain into the River Greet located on the north-eastern edge of the town.

2016s4178 - Southwell Modelling Appraisal Report_Supplementary report 6
Figure 1.1 – Hydrological catchments of Potwell Dike and Halam Hill (not to scale)
Contains Ordnance Survey data. Crown copyright and database right © 2016
Southwell has suffered from repeated flooding within recent history and was severely affected by extensive flooding on the 25th June 2007 and again on the 23rd July 2013.
The 2013 flood event was largest observed in the catchments history with more than two hundred properties flooded during the event. The flooding followed a short period of intense rainfall which quickly overwhelmed the urban surface water systems as well generating significant runoff from the upper catchment. The estimated return period of the event was between 200 and 1000-years.
Potwell Dike has a well-documented history of flooding, with other incidents being recorded in the 1950’s, 1930’s and as early as 1922. The town has recently been affected by a number of smaller surface water flooding incidents, with recent events including (but not limited to) July 2014, January 2014, December 2012 and November 2012.
Southwell is a high flood risk area and has historically been flooded from a number of sources including fluvial, pluvial and surface water components. Given the topography of the upper catchments and the significant overland flow routes that are generated, Southwell represents good opportunity for assessing the effectiveness of woodland creation approaches.
Southwell is also subjected to flooding resulting from urban surface water systems becoming overwhelmed during short intense rainfall events such as what occurred in 2013. Woodland creation programmes would not be expected to significantly impact upon these mechanisms as flooding is more directly attributable to the capacity of the engineered surface water systems.
1.4 Report structure
The report includes the following chapters:
(2) Modelling approach - details the model testing and analysis that has been undertaken as part of the investigation.
(3) Model results - Detailed description of model outputs including the impact on flood risk of woodland creation.
(4) Economic analysis: Description of appraisal process
(5) Economic analysis: Assessment of flood damages
(6) Economic analysis: Costing of woodland creation process
(7) Economic analysis: Cost-benefit analysis
(8) Conclusions and recommendations.

2016s4178 - Southwell Modelling Appraisal Report_Supplementary report 7
2 Modelling approach
2.1 Southwell existing model
The Southwell hydraulic model is a 1D-2D linked ISIS TUFLOW direct rainfall model which has been calibrated to the July 2013 flood event by matching observations across the floodplain and recorded levels at the River Greet gauging station.
1D hydraulic models are used extensively in practical applications for studying levels and flows in river systems, and have been applied successfully to flood routing problems at river reach scales from tens to hundreds of kilometres. One of the most relevant assumptions with this model type is that stage and discharge vary only in the longitudinal direction which is typically valid when flood waters are contained within a channel. River network topology is discretised as a number of 1D branches interconnected at computational nodes, while downstream hydraulic geometry is described as a series of irregularly spaced cross-sections Δx apart and perpendicular to the local direction of flow. ISIS (renamed to Flood Modeller in 2015) is a commercial 1D modelling package that is used extensively throughout the UK.
2D hydraulic models are more capable of simulating lateral spreading of the flood wave as the underlying topography is defined as a continuous surface. 2D approaches typically involve integration of the 3D Navier-Stokes equations over the flow depth to produce depth-averaged values of velocity. The 2D model TUFLOW solves these equations using a finite difference numerical procedure to obtain predictions of the water depth and velocity in both the X and Y directions.
Coupled 1D-2D models aim to reduce the representation of floodplain hydraulics to the minimum required to achieve acceptable, computationally affordable predictions of flood extent. The 1D model being used to describe flow within channels and through hydraulic structures and 2D model being used to describe the later diffusion of shallow water flows in the floodplain. ISIS / TUFLOW models are used extensively throughout the UK which should enable the methodology / parametrisation described in this document to be transferred to many other catchments / models.
2.2 Modelling methodology
2.2.1 Overview
Given the need to model the specific hydrological and hydraulic processes associated with changes to vegetation coverage the existing model has undergone several modifications in order that the impacts of the woodland creation investigation could be more easily identified and measured.
Through discussions with FR it was agreed that the work would focus on representing interception, infiltration and the physical representation of the tree stand within the existing hydraulic model. In addition to representing the effects of tree plantations the modelling was also required to consider the impact from different tree types (broadleaf and conifer) across a range of return periods.
As the Southwell model uses rainfall as an input to the hydraulic model, each return period is simulated for a number of storm durations which in this case were 1, 4 and 10-hour. Storm durations were selected based on the characteristics and size of the Southwell catchment. Selecting one storm duration is unlikely to be representative of all flooding mechanisms as duration is strongly linked to topography. A short duration storm better represents the type of event that leads to surface water flooding, but longer duration storms may be more critical in flatter areas. The maximum flood extent for a given return period is created by overlaying the results from the individual storm duration simulations and extracting the worst-case result in every grid cell.
A further consideration is the storm profile used to generate rainfall hyetographs as this influences how the total rainfall is distributed across the storm duration. Two standard profiles applied are a more distributed winter profile and a peakier summer profile; the latter of which is preferred on urban catchments. The existing Southwell model has inflows for a summer profile only as this produces more significant flooding in the urban area.
2016s4178 - Southwell Modelling Appraisal Report_Supplementary report 8
2.2.2 Interception and infiltration - existing model
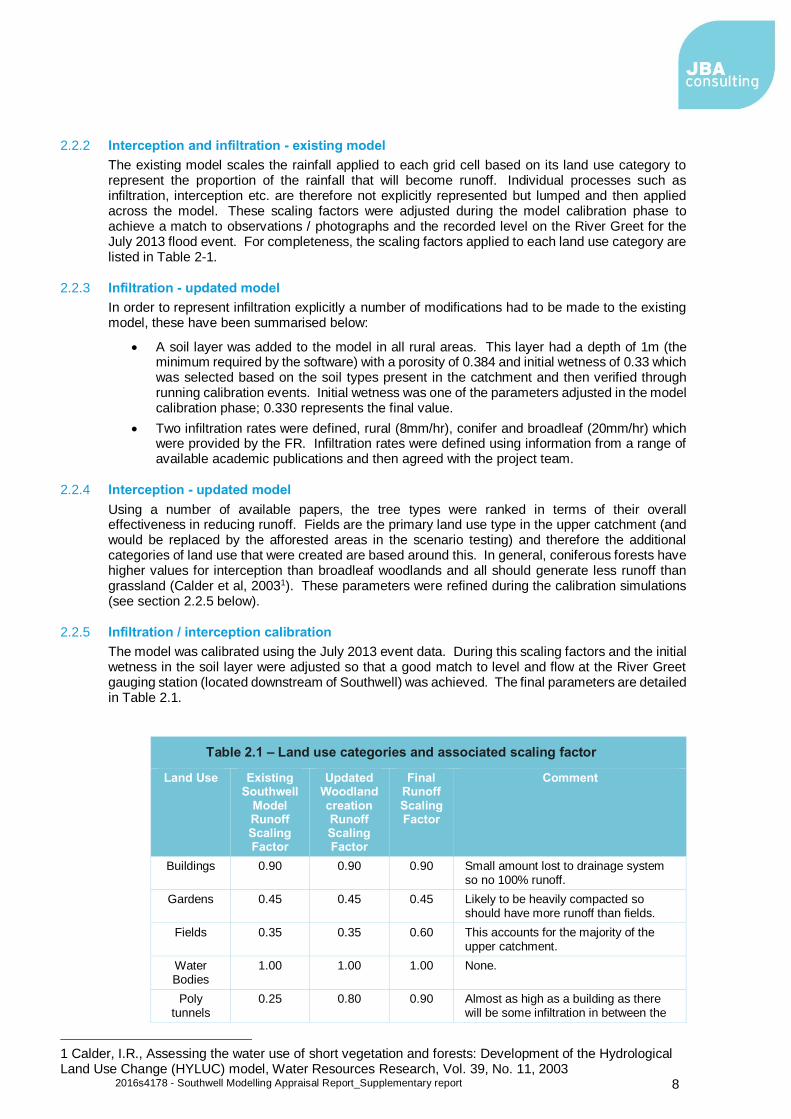
The existing model scales the rainfall applied to each grid cell based on its land use category to represent the proportion of the rainfall that will become runoff. Individual processes such as infiltration, interception etc. are therefore not explicitly represented but lumped and then applied across the model. These scaling factors were adjusted during the model calibration phase to achieve a match to observations / photographs and the recorded level on the River Greet for the July 2013 flood event. For completeness, the scaling factors applied to each land use category are listed in Table 2-1.
2.2.3 Infiltration - updated model
In order to represent infiltration explicitly a number of modifications had to be made to the existing model, these have been summarised below:
• A soil layer was added to the model in all rural areas. This layer had a depth of 1m (the minimum required by the software) with a porosity of 0.384 and initial wetness of 0.33 which was selected based on the soil types present in the catchment and then verified through running calibration events. Initial wetness was one of the parameters adjusted in the model calibration phase; 0.330 represents the final value.
• Two infiltration rates were defined, rural (8mm/hr), conifer and broadleaf (20mm/hr) which were provided by the FR. Infiltration rates were defined using information from a range of available academic publications and then agreed with the project team.
2.2.4 Interception - updated model
Using a number of available papers, the tree types were ranked in terms of their overall effectiveness in reducing runoff. Fields are the primary land use type in the upper catchment (and would be replaced by the afforested areas in the scenario testing) and therefore the additional categories of land use that were created are based around this. In general, coniferous forests have higher values for interception than broadleaf woodlands and all should generate less runoff than grassland (Calder et al, 20031). These parameters were refined during the calibration simulations (see section 2.2.5 below).
2.2.5 Infiltration / interception calibration
The model was calibrated using the July 2013 event data. During this scaling factors and the initial wetness in the soil layer were adjusted so that a good match to level and flow at the River Greet gauging station (located downstream of Southwell) was achieved. The final parameters are detailed in Table 2.1.
Table 2.1 – Land use categories and associated scaling factor
Land Use Existing Southwell
Model Runoff Scaling Factor
Updated Woodland creation Runoff Scaling Factor
Final Runoff Scaling Factor
Comment
Buildings 0.90 0.90 0.90 Small amount lost to drainage system so no 100% runoff.
Gardens 0.45 0.45 0.45 Likely to be heavily compacted so should have more runoff than fields.
Fields 0.35 0.35 0.60 This accounts for the majority of the upper catchment.
Water Bodies
1.00 1.00 1.00 None.
Poly tunnels
0.25 0.80 0.90 Almost as high as a building as there will be some infiltration in between the
1 Calder, I.R., Assessing the water use of short vegetation and forests: Development of the Hydrological Land Use Change (HYLUC) model, Water Resources Research, Vol. 39, No. 11, 2003
2016s4178 - Southwell Modelling Appraisal Report_Supplementary report 9
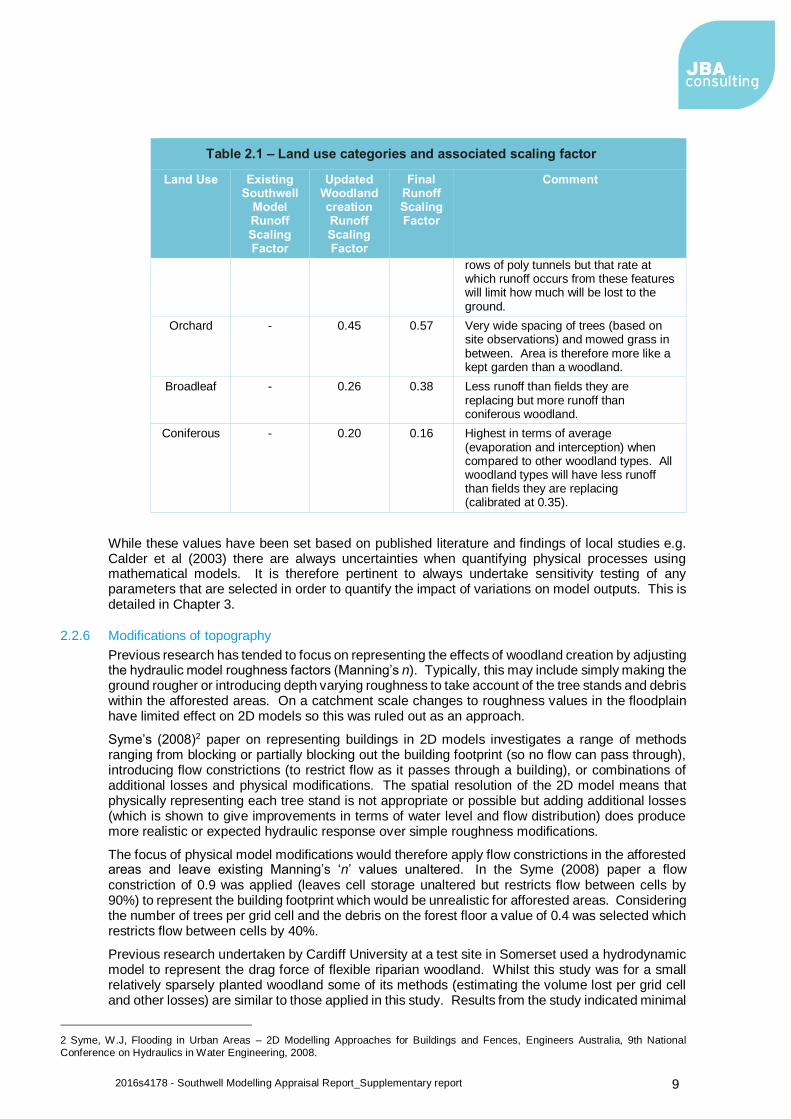
Table 2.1 – Land use categories and associated scaling factor
Land Use Existing Southwell
Model Runoff Scaling Factor
Updated Woodland creation Runoff Scaling Factor
Final Runoff Scaling Factor
Comment
rows of poly tunnels but that rate at which runoff occurs from these features will limit how much will be lost to the ground.
Orchard - 0.45 0.57 Very wide spacing of trees (based on site observations) and mowed grass in between. Area is therefore more like a kept garden than a woodland.
Broadleaf - 0.26 0.38 Less runoff than fields they are replacing but more runoff than coniferous woodland.
Coniferous - 0.20 0.16 Highest in terms of average (evaporation and interception) when compared to other woodland types. All woodland types will have less runoff than fields they are replacing (calibrated at 0.35).
While these values have been set based on published literature and findings of local studies e.g. Calder et al (2003) there are always uncertainties when quantifying physical processes using mathematical models. It is therefore pertinent to always undertake sensitivity testing of any parameters that are selected in order to quantify the impact of variations on model outputs. This is detailed in Chapter 3.
2.2.6 Modifications of topography
Previous research has tended to focus on representing the effects of woodland creation by adjusting the hydraulic model roughness factors (Manning’s n). Typically, this may include simply making the ground rougher or introducing depth varying roughness to take account of the tree stands and debris within the afforested areas. On a catchment scale changes to roughness values in the floodplain have limited effect on 2D models so this was ruled out as an approach.
Syme’s (2008)2 paper on representing buildings in 2D models investigates a range of methods ranging from blocking or partially blocking out the building footprint (so no flow can pass through), introducing flow constrictions (to restrict flow as it passes through a building), or combinations of additional losses and physical modifications. The spatial resolution of the 2D model means that physically representing each tree stand is not appropriate or possible but adding additional losses (which is shown to give improvements in terms of water level and flow distribution) does produce more realistic or expected hydraulic response over simple roughness modifications.
The focus of physical model modifications would therefore apply flow constrictions in the afforested areas and leave existing Manning’s ‘n’ values unaltered. In the Syme (2008) paper a flow constriction of 0.9 was applied (leaves cell storage unaltered but restricts flow between cells by 90%) to represent the building footprint which would be unrealistic for afforested areas. Considering the number of trees per grid cell and the debris on the forest floor a value of 0.4 was selected which restricts flow between cells by 40%.
Previous research undertaken by Cardiff University at a test site in Somerset used a hydrodynamic model to represent the drag force of flexible riparian woodland. Whilst this study was for a small relatively sparsely planted woodland some of its methods (estimating the volume lost per grid cell and other losses) are similar to those applied in this study. Results from the study indicated minimal
2 Syme, W.J, Flooding in Urban Areas – 2D Modelling Approaches for Buildings and Fences, Engineers Australia, 9th National
Conference on Hydraulics in Water Engineering, 2008.
2016s4178 - Southwell Modelling Appraisal Report_Supplementary report 10
impact on the downstream flooding characteristics for extreme floods. There were however, significant reductions in key flow properties, namely velocity within the vegetated area.
2.3 Model simulations
2.3.1 Baseline flood risk - Representation of existing site conditions
As discussed in section 2.2 the assessment of baseline flood risk required a number of refinements to the existing (pre-woodland creation) model to be undertaken in order to allow the hydraulic and hydrological processes of the rural upstream catchment to be more specifically represented. A summary of the key refinements to the baseline model are as follows:
• Refinement of land use zones in the 2D domain to make a clearer distinction between different woodland types and vegetation zones. These areas have been represented by updating and refining the runoff scaling factors detailed in Table 2.3 to reflect the changing land use types.
• Soils - depth and porosity zones specified to represent the impact of varying vegetation cover on soil uptake of runoff.
• Representation of physical constraints to overland flow - areas of existing woodland represented using a series of 2D flow constrictions.
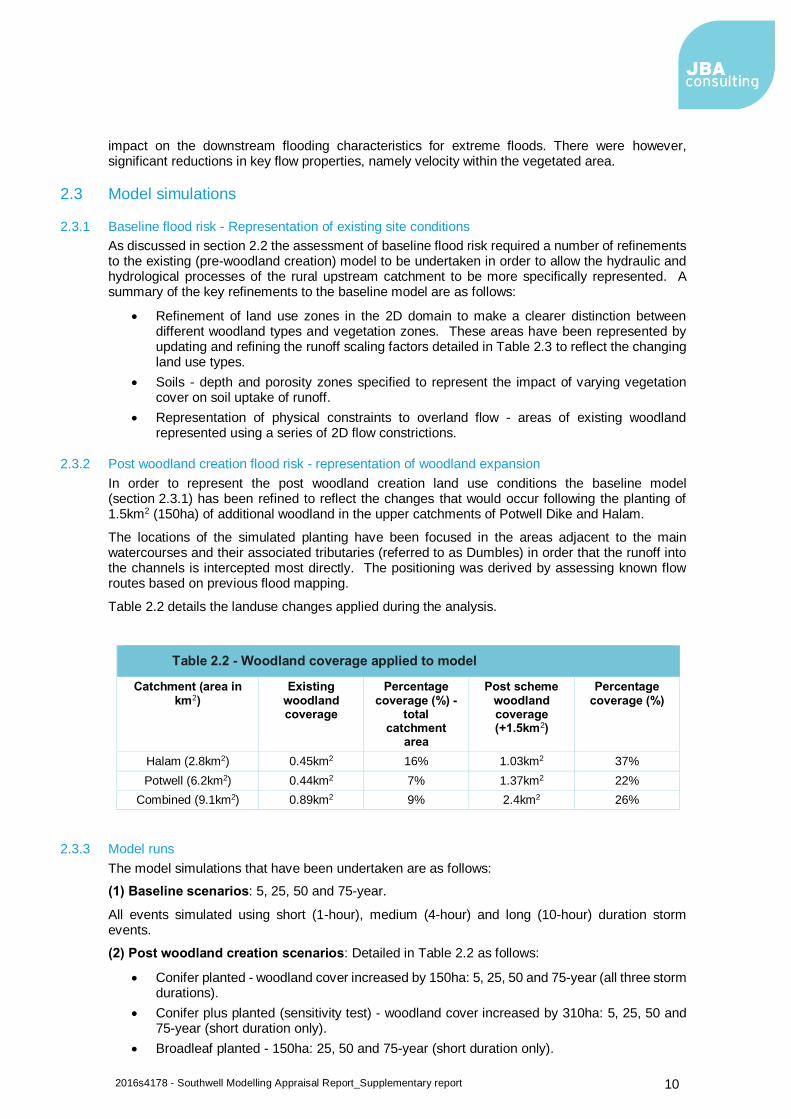
2.3.2 Post woodland creation flood risk - representation of woodland expansion
In order to represent the post woodland creation land use conditions the baseline model (section 2.3.1) has been refined to reflect the changes that would occur following the planting of 1.5km2 (150ha) of additional woodland in the upper catchments of Potwell Dike and Halam.
The locations of the simulated planting have been focused in the areas adjacent to the main watercourses and their associated tributaries (referred to as Dumbles) in order that the runoff into the channels is intercepted most directly. The positioning was derived by assessing known flow routes based on previous flood mapping.
Table 2.2 details the landuse changes applied during the analysis.
Table 2.2 - Woodland coverage applied to model
Catchment (area in km2)
Existing woodland coverage
Percentage coverage (%) -
total catchment
area
Post scheme woodland coverage (+1.5km2)
Percentage coverage (%)
Halam (2.8km2) 0.45km2 16% 1.03km2 37%
Potwell (6.2km2) 0.44km2 7% 1.37km2 22%
Combined (9.1km2) 0.89km2 9% 2.4km2 26%
2.3.3 Model runs
The model simulations that have been undertaken are as follows:
(1) Baseline scenarios: 5, 25, 50 and 75-year.
All events simulated using short (1-hour), medium (4-hour) and long (10-hour) duration storm events.
(2) Post woodland creation scenarios: Detailed in Table 2.2 as follows:
• Conifer planted - woodland cover increased by 150ha: 5, 25, 50 and 75-year (all three storm durations).
• Conifer plus planted (sensitivity test) - woodland cover increased by 310ha: 5, 25, 50 and 75-year (short duration only).
• Broadleaf planted - 150ha: 25, 50 and 75-year (short duration only).
2016s4178 - Southwell Modelling Appraisal Report_Supplementary report 11
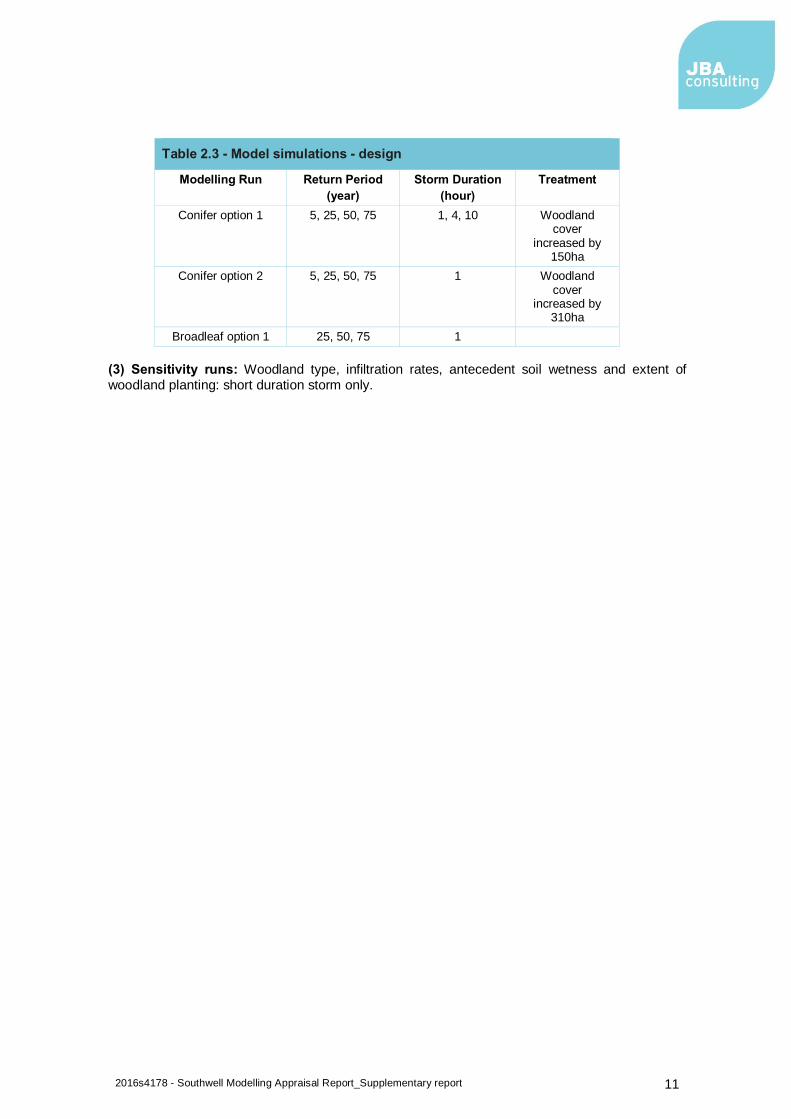
Table 2.3 - Model simulations - design
Modelling Run Return Period
(year)
Storm Duration
(hour)
Treatment
Conifer option 1 5, 25, 50, 75 1, 4, 10 Woodland cover
increased by 150ha
Conifer option 2 5, 25, 50, 75 1 Woodland cover
increased by 310ha
Broadleaf option 1 25, 50, 75 1
(3) Sensitivity runs: Woodland type, infiltration rates, antecedent soil wetness and extent of woodland planting: short duration storm only.

2016s4178 - Southwell Modelling Appraisal Report_Supplementary report 12
3 Model results
3.1 Introduction
This section details the key findings of the modelling investigation. This includes a description of the principle flooding mechanisms in the Southwell district and how they could be impacted upon by woodland creation.
In addition, it details the range of sensitivity tests that have been undertaken on the key model parameters specified in the model development.
3.1.1 Halam Hill
Roughly two thirds of this sub-catchment are heavily urbanised with the lower third of the watercourse completely in culvert. The locations of the key flood risk areas are detailed in Figure 3.1.
Figure 3.1 - Southwell - key areas - Halam Hill and Potwell Dike catchments
Contains Ordnance Survey data. Crown copyright and database right © 2016
• Hopkiln Lane – This marks the lower limit of the rural portion of the Halam Hill catchment. Immediately upstream of this is a small balancing pond which does intercept some overland flow during times of heavy or prolonged rainfall.
• Glenfields – Immediately upstream of this housing estate the watercourse becomes culverted down to Lower Kirklington Road (over 600m). There is limited storage available around the culvert inlet so surcharging flow quickly overtops the culvert and flows overland into Glenfield’s and the adjoin streets.
• Lower Kirklington Road – The Halam Hill watercourse exits from the long culverted section at this location. Many of the properties at this location are lower than road levels or in other topographic low spots. This means that in some circumstances the channel may not be completely full but many houses have been flooded by overland flow from overtopping at Glenfields in combination with surface water accumulation.

2016s4178 - Southwell Modelling Appraisal Report_Supplementary report 13
3.1.2 Potwell Dike
The Potwell Dike catchment is a mixture of dense urban sections intersected by significant rural elements such as the areas between Nottingham Road (Minster School) and Church Street. Flood risk is significant at a number of locations along the study reach and these have been detailed in the following sections and by Figure 3.1.
• Halloughton Road – Topographically low where Potwell Dike passes under the road. With significant flood depths in excess of 1.0m observed during the June 2013 flood event. Whilst the area is heavily urbanised many of the houses are elevated from the road which offers them some protection from smaller magnitude floods.
• Minster School – A number of smaller dumbles meet at this location which is also a topographic low spot. There are a number of properties at flood risk around this location with flood depths of 1.0m observed during the June 2013 event.
• Church Road - Located near the downstream end of Potwell Dike, the majority of properties at risk in this catchment are located on or around Church Street. There are a number of bridges and significant bends in the channel which generate significant head losses and raised water levels in this area.
3.2 Existing flood risk - baseline
Existing flood risk within the Southwell catchment has been established for the 5, 25, 50 and 75-year return period events for short (1hr), medium (4hr) and long (10hr) storm durations (see Figures 3.2-3.5). The testing of the range of storm durations has been adopted so that the key flooding mechanisms that are prevalent in the catchment are captured in the modelling. For example, urban generated surface water flooding generates the biggest flood damages during short duration, high intensity storms. This type of flooding is typically a function of the inadequate capacity of surface water drainage systems and consequently woodland creation would not be expected to mitigate flood risk during such events.
Conversely the fluvial-dominated events can result in higher comparative damages when longer duration, volume dominated events occur.
Once the individual model simulations were completed a composite maximum flood extent has then been produced by analysing which of the three storm durations for a given return period produced the largest flood depths. In addition to flood extents, properties flooded and level / flow plots have also been used to describe the existing flood risk within Southwell.

2016s4178 - Southwell Modelling Appraisal Report_Supplementary report 14
Figure 3.2: Baseline flood risk (5-year)
Halam Catchment:
Limited flooding in upper catchment.
Accumulation of significant volumes of surface water in Lower Kirklington Road area. Most flooding directly related to short duration, intense rainfall event.
Potwell Catchment:
During the 5yr return period event there are only a handful of properties at risk in this sub catchment and any surface water flooding is relatively shallow
Contains Ordnance Survey data. Crown copyright and database right © 2016
Note: Plantation areas represent areas of simulated woodland creation
2016s4178 - Southwell Modelling Appraisal Report_Supplementary report 15
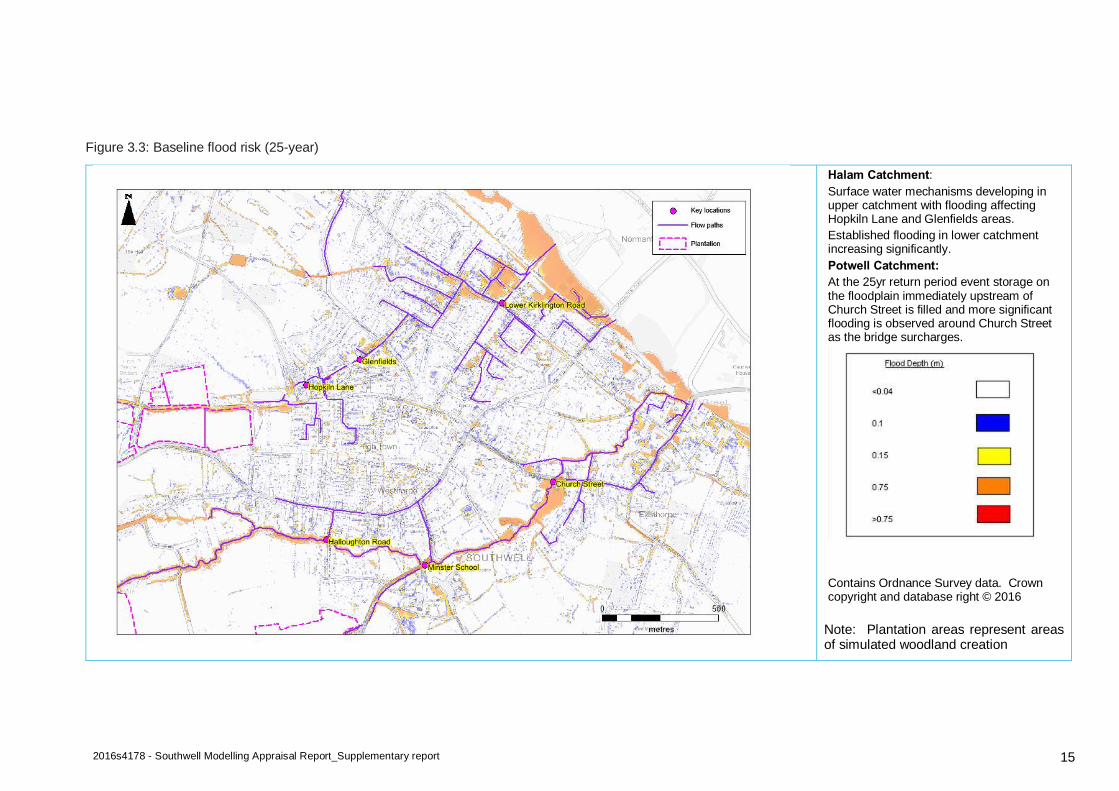
Figure 3.3: Baseline flood risk (25-year)
Halam Catchment:
Surface water mechanisms developing in upper catchment with flooding affecting Hopkiln Lane and Glenfields areas.
Established flooding in lower catchment increasing significantly.
Potwell Catchment:
At the 25yr return period event storage on the floodplain immediately upstream of Church Street is filled and more significant flooding is observed around Church Street as the bridge surcharges.
Contains Ordnance Survey data. Crown copyright and database right © 2016
Note: Plantation areas represent areas of simulated woodland creation

2016s4178 - Southwell Modelling Appraisal Report_Supplementary report 16
Figure 3.4: Baseline flood risk (50-year)
Halam Catchment:
Surface water mechanisms developing further.
Potwell Catchment:
Mid and lower sections of catchment subjected to significant increases in flood risk.
Contains Ordnance Survey data. Crown copyright and database right © 2016.
Note: Plantation areas represent areas of simulated woodland creation

2016s4178 - Southwell Modelling Appraisal Report_Supplementary report 17
Figure 3.5: Baseline flood risk (75-year)
Halam Catchment:
Surface water mechanisms developing further with significant increases in properties flooded in Lower Kirklington Road area.
Potwell Catchment:
Mid and lower sections of catchment subjected to significant increases in flood risk.
Contains Ordnance Survey data. Crown copyright and database right © 2016
Note: Plantation areas represent areas of simulated woodland creation
2016s4178 - Southwell Modelling Appraisal Report_Supplementary report 18
3.2.1 Flood risk areas
Flood depths vary across the catchment with several significant high risk areas occurring where overland flow from a variety of mechanisms can accumulate in significant volumes resulting in flooding to properties and infrastructure.
Table 3.1 summarises the modelled flood depths at the key flood risk locations throughout the catchment.
Table 3.1 – Modelled flood depths - key areas (baseline / do minimum)
Flooding location Max flood depth (mm)
5-year 25-year 50-year 75-year Halam Hill – Glenfields (upper Halam)
n/a n/a 240 280
Halam Hill – Lower Kirklington Road (Crafts Way)
350 380 420 450
Potwell Dike – Minster School (upper Potwell)
50 400 600 800
Potwell Dike – Church Street (lower Potwell)
20 250 350 400
3.2.2 Properties affected - Existing
Limited property threshold level information was provided for some areas of the assessment. This information was used to correct for property flood depths, where applicable, and to derive an appropriate flooding threshold to be used across the study area.
In some areas, it was noted that a number of threshold levels were lower than Light Detection and Ranging (LIDAR) levels (remote sensing technique used to sample topography). The surface water mapping is based on these LIDAR levels. This resulted in properties being highlighted as being at risk when they should not. To correct this, where LIDAR levels were higher than threshold levels, the LIDAR level was used to replace the threshold levels.
In the absence of any other information related to property thresholds a series of checks were undertaken to determine an appropriate threshold level adjustment for remaining properties. The average difference between surveyed threshold levels and surveyed ground levels for those properties surveyed was 185mm.
A series of calculations were undertaken using a range of threshold adjustments. The results were then compared with information gathered from the community for past flood events. The results of these checks suggested that a threshold adjustment of 150mm gave the best fit against this validation dataset.
For the existing site conditions (baseline) flooded property counts were determined for each modelled return period and these are summarised in Table 3.2.
Table 3.2 - Property counts (existing)
Return Period (years)
Properties Flooded - Total
Halam catchment properties flooded
Potwell Dike catchment properties flooded
5 106 55 51
25 159 79 80
50 210 102 108
75 251 119 132
Note, property assumed to be inundated when the maximum modelled flood depth exceeds 150mm.

2016s4178 - Southwell Modelling Appraisal Report_Supplementary report 19
3.3 Post woodland creation flood risk
3.3.1 Introduction
Southwell is affected by flooding from a number of sources (fluvial, pluvial, and surface water systems) and as a result the impact of the woodland creation is not sufficient to remove individual flooding mechanisms completely. The most significant impacts typically involve reducing the impact of established mechanisms by either shrinking the overall volume reaching the flood effected areas or delaying the rate at which the flood peak reaches those areas.
In terms of the impact on flooding mechanisms the analysis has shown, in those areas predominantly flooded by urban generated surface water mechanisms, the benefit of woodland creation is minimal.
The following sections detail the impact of the increased forest cover on the hydraulic and hydrological processes of the model as well providing a quantitative assessment of the actual flood risk benefits that could be achieved.
3.3.2 Impact on catchment hydrology
Halam catchment
The analysis focused on a review of the pre- and post-scheme model hydrographs in the upper part of the Halam catchment close to Glenfields and also at the mid-point of the catchment close to the centre of Halam (Lower Kirklington Road). The locations of these areas are illustrated in Figures 3.2-3.5.
The analysis shows that while the change in woodland cover results in only a minor reduction to the peak level (<0.1m across all events) in the catchment there is a significant change to the catchment response.
Figure 3.6 illustrates the pre- and post-scheme level hydrographs in the upper part of the Halam catchment for the 5-year event and demonstrates how under the existing site conditions for low magnitude events (5-year) the catchment shows a clear double peak hydrograph. This is the result of the urban runoff reaching the river channel quicker than the rural runoff. Residents have described that during observed flood events flood water tends to arrive in two separate stages; (1) flooded by clear water (urban surface water) which is unaffected by woodland creation and (2) secondary flooding by darker, sediment rich water which relates to the flood water from the rural element of the catchment.
Figure 3.6 - Pre and Post-scheme modelled stage hydrographs - Upper Halam (5-year)
Pre-
Scheme (5-year) level
hydrograph
Post- Scheme (5-
year) level hydrograph
Following the simulated woodland creation of the upper catchment (26% of total catchment) the analysis shows that the rural runoff peak (secondary peak) is largely removed as a significant
2016s4178 - Southwell Modelling Appraisal Report_Supplementary report 20
element of the overland flow which feeds the channel network and is delayed as a result of increased woodland cover.
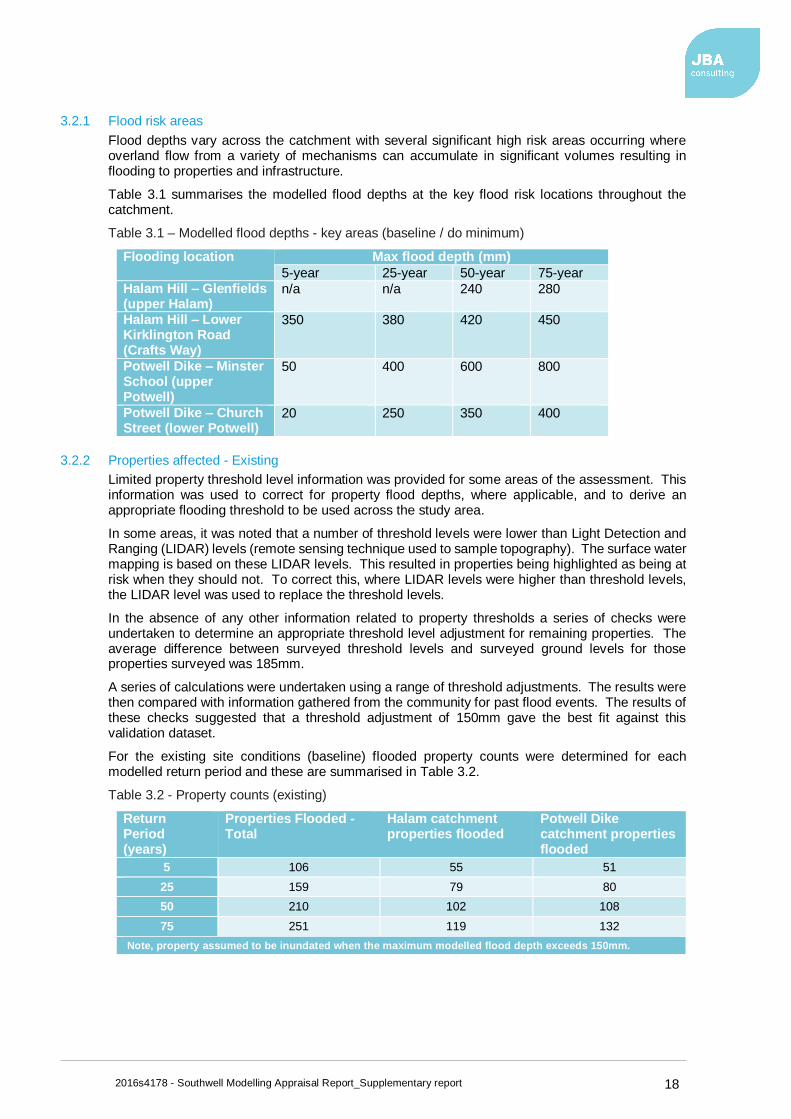
During larger events (>25-year) the dual peak hydrograph is not evident with the urban and rural components combining into a wider, single peaked hydrograph. In terms of the impact of woodland creation there is no significant reduction in the overall peak level however there is a clear reduction in the volume in the receding limb of hydrograph.
The reason for this is because the initial phase or rising limb of the flood hydrograph, which typically generates the largest peak, reflects the faster responding urban generated surface water component of the event. This process is generally unaffected by woodland extent and consequently there is a minimal change in the catchment response.
Conversely the receding limb of the flood hydrograph represents the input from the rural element of the catchment which responds more slowly than the surface water component and is more influenced by woodland creation. Consequently, any changes to landuse, such as woodland creation are only reflected in the receding limb of the hydrograph.
In terms of flood risk this means that while the numbers of properties flooded is not affected significantly the volume of water reaching the flood risk areas is much reduced, which in turn will lead to a reduction in flood damages.
Figure 3.7 illustrates the pre- and post-scheme level hydrograph for the 75-year flood event.
Figure 3.7 - Pre- and Post-scheme modelled level hydrographs - Upper Halam (75-year)
Pre- Scheme
(75-year) level hydrograph
Post- Scheme (75-year)
level hydrograph
Potwell Dike
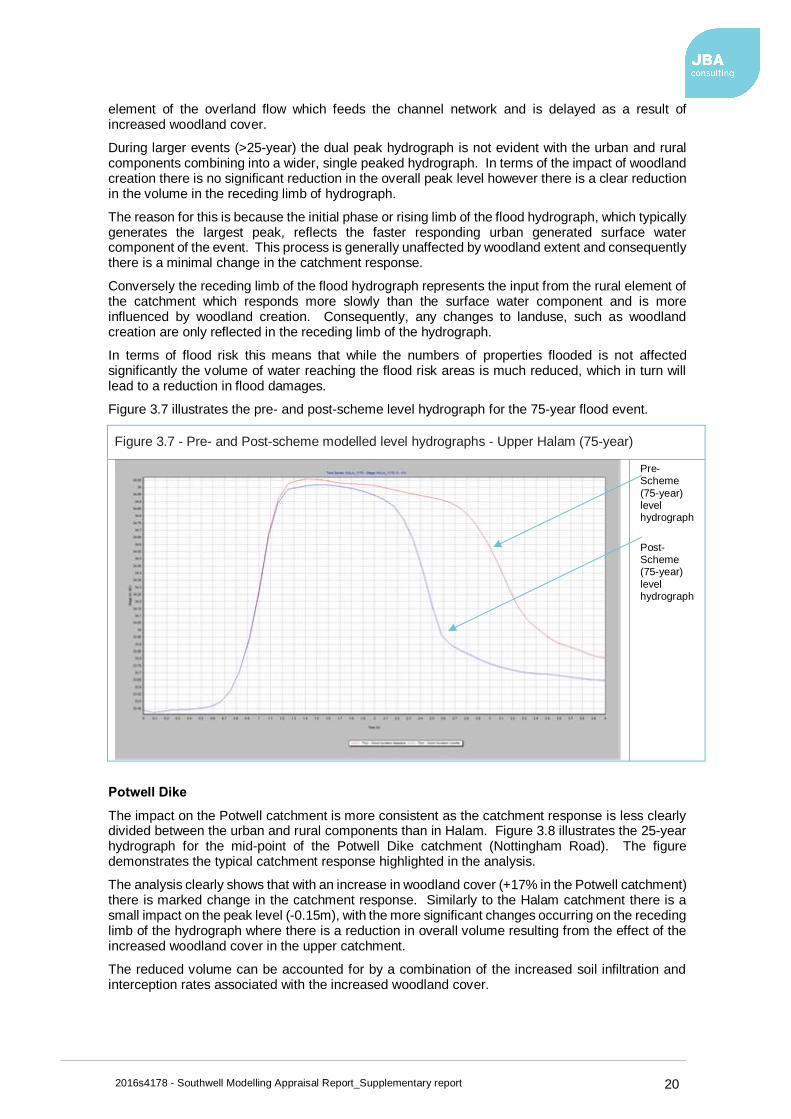
The impact on the Potwell catchment is more consistent as the catchment response is less clearly divided between the urban and rural components than in Halam. Figure 3.8 illustrates the 25-year hydrograph for the mid-point of the Potwell Dike catchment (Nottingham Road). The figure demonstrates the typical catchment response highlighted in the analysis.
The analysis clearly shows that with an increase in woodland cover (+17% in the Potwell catchment) there is marked change in the catchment response. Similarly to the Halam catchment there is a small impact on the peak level (-0.15m), with the more significant changes occurring on the receding limb of the hydrograph where there is a reduction in overall volume resulting from the effect of the increased woodland cover in the upper catchment.
The reduced volume can be accounted for by a combination of the increased soil infiltration and interception rates associated with the increased woodland cover.
2016s4178 - Southwell Modelling Appraisal Report_Supplementary report 21
Figure 3.8 - Pre- and Post-scheme modelled event hydrographs - Upper Potwell (25-year)
Pre-
Scheme (25-year)
level hydrograph
Post-
Scheme (25-year) level
hydrograph
3.3.3 Option 1: Post woodland creation (Conifer planted scenario 150ha) - Impact on flood levels
Table 3.3 summarises the impact of the simulated woodland creation on flood depths at key locations through the study catchments.
Table 3.3 - Modelled flood depths - key areas (post simulated woodland creation)
Flooding Location Max Flood Depth (Reduction in brackets) (mm)
5-year 25-year 50-year 75-year Halam Hill – Glenfields (upper Halam)
n/a n/a 240 (-80)
280 (-80)
Halam Hill – Lower Kirklington Road (Crafts Way)
350 (0)
380 (0)
420 (0)
450 (0)
Potwell Dike – Minster School (upper Potwell)
50 (0)
400 (-100)
600 (-100)
800 (-200)
Potwell Dike – Church Street (lower Potwell)
20 (0)
250 (-125)
350 (-75)
400 (-75)
Note, flood depths based on maximum values derived from short, medium and long storm duration events.
The most significant impacts are generally in the Potwell catchment, particularly around the Church Street area, which is the main source of fluvial flood risk in the catchment. The largest benefits are achieved between the 25 and 50-year events with a reduction in flooding in the highest risk areas (such as Church Street) for more extreme flood events (>50-year). Flooding in this area is generally driven by the accumulation of large volumes of flood water and as a result the impact of woodland creation, which has been demonstrated to reduce flood volumes as well as increasing the rate at which the flood event recedes (demonstrated by Figure 3.8) is significant.
The impact on Halam is less significant with only small reductions identified in the Glenfields area (upper catchment) and with no improvements identified in the highest risk areas on Lower Kirklington Road. As discussed in section 3.3.2 flooding in the Halam catchment is generally dominated by the impact of urban generated surface water mechanisms which are less influenced by landuse changes such as woodland creation.
2016s4178 - Southwell Modelling Appraisal Report_Supplementary report 22
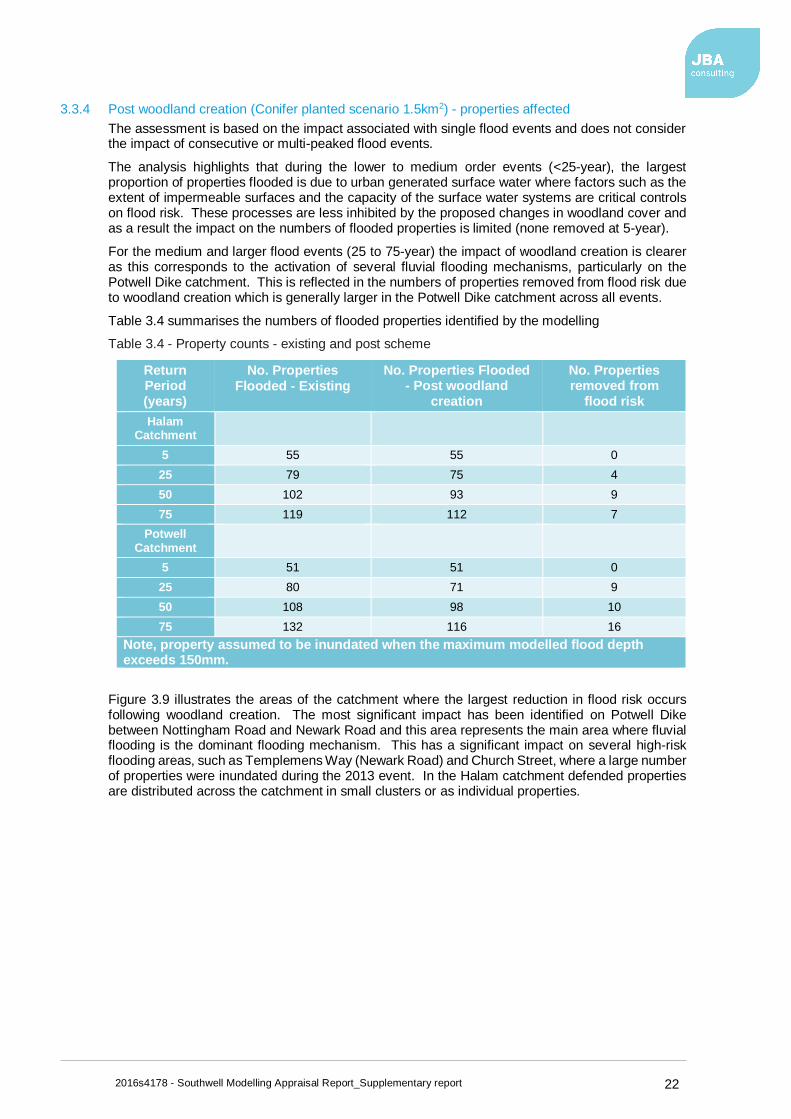
3.3.4 Post woodland creation (Conifer planted scenario 1.5km2) - properties affected
The assessment is based on the impact associated with single flood events and does not consider the impact of consecutive or multi-peaked flood events.
The analysis highlights that during the lower to medium order events (<25-year), the largest proportion of properties flooded is due to urban generated surface water where factors such as the extent of impermeable surfaces and the capacity of the surface water systems are critical controls on flood risk. These processes are less inhibited by the proposed changes in woodland cover and as a result the impact on the numbers of flooded properties is limited (none removed at 5-year).
For the medium and larger flood events (25 to 75-year) the impact of woodland creation is clearer as this corresponds to the activation of several fluvial flooding mechanisms, particularly on the Potwell Dike catchment. This is reflected in the numbers of properties removed from flood risk due to woodland creation which is generally larger in the Potwell Dike catchment across all events.
Table 3.4 summarises the numbers of flooded properties identified by the modelling
Table 3.4 - Property counts - existing and post scheme
Return Period (years)
No. Properties Flooded - Existing
No. Properties Flooded - Post woodland
creation
No. Properties removed from
flood risk
Halam Catchment
5 55 55 0
25 79 75 4
50 102 93 9
75 119 112 7
Potwell Catchment
5 51 51 0
25 80 71 9
50 108 98 10
75 132 116 16
Note, property assumed to be inundated when the maximum modelled flood depth exceeds 150mm.
Figure 3.9 illustrates the areas of the catchment where the largest reduction in flood risk occurs following woodland creation. The most significant impact has been identified on Potwell Dike between Nottingham Road and Newark Road and this area represents the main area where fluvial flooding is the dominant flooding mechanism. This has a significant impact on several high-risk flooding areas, such as Templemens Way (Newark Road) and Church Street, where a large number of properties were inundated during the 2013 event. In the Halam catchment defended properties are distributed across the catchment in small clusters or as individual properties.

2016s4178 - Southwell Modelling Appraisal Report_Supplementary report 23
Figure 3.9 - Defended property locations due to simulated woodland creation
Templemens Way /Newark Road
Church Street
Nottingham Road
Contains Ordnance Survey data. Crown copyright and database right © 2016
3.3.5 Impact on flood risk - concluding remarks
Despite the greater coverage of woodland modelled in the Halam catchment (37% of catchment compared to 22% in Potwell) the flood risk benefits are clearly greater in the Potwell catchment in terms of properties removed from flood risk. This reflects the fact that fluvial mechanisms represent the dominant source of flooding in the Potwell catchment, whereas Halam is dominated by urban generated surface water flooding.
Fluvial mechanisms are more closely related to landuse characteristics such as woodland coverage and the impact of woodland creation is therefore more significant here.
Conversely, for Halam the impact of woodland creation on flood risk is less as the dominant flooding mechanism relates to the surface water management issues in heavily urbanised areas of the town and landuse changes have less of an influence.
3.4 Sensitivity testing
3.4.1 Introduction
Sensitivity testing has been undertaken on several model parameters (for a single return period and storm duration) in order to understand the uncertainties surrounding them and their impact on model results. As the underlying hydraulic model has been extensively tested as part of a separate study the sensitivity testing undertaken has focused on how the simulated woodland planting has been represented in this model. Runs investigating the effects of woodland type, infiltration rates, initial soil wetness and planting area were undertaken using a range of flood events. The short duration event has been chosen as this event generates the most significant flood risk and consequently economic damages. Historic flooding in Southwell has generally been the result of short duration

2016s4178 - Southwell Modelling Appraisal Report_Supplementary report 24
flood events and it was therefore considered appropriate that any scheme is assessed against events of this nature.
The following elements have been assessed:
• woodland type
• rainfall infiltration rates
• antecedent soil wetness
• extent of woodland planting.
3.4.2 Woodland type
For this test the rainfall scaling factor was increased for the woodland planting areas from 0.16 to 0.38 to represent a switch from conifer to broadleaf tree species. The scaling factor values where provided by Dr Tom Nisbet of FR based on local research findings (e.g. Calder et al. (2003)). The impact on model results has been summarised in Table 3.5. The analysis was undertaken using the 25, 50 and 75-year events.
Table 3.5 - Model sensitivity analysis - woodland type
Model Output Impact of Sensitivity Test
Water Levels across the whole catchment
Negligible differences in maximum water levels on both watercourses across all return periods. Broadleaf water levels are slightly higher than conifer which would be expected.
Flows Small increase in flow on falling limb. Property Counts No Difference. Other Comments The impact is more pronounced in the upper catchment in the
areas adjacent to the simulated plantation areas with the broadleaf scenarios generally increasing flood levels by up to 40mm. However, due to the increasing influence of other hydraulically significant factors such as urban runoff, the impact of woodland type changes are less significant in the downstream sections of the catchment.
3.4.3 Soil infiltration rates
Infiltration rates for rural areas and simulated woodland planting were initially classified using values derived from a review of the current publications on soil infiltration rates. Based on the parameterisation of the model the selected infiltration rates will remain constant until there is no more storage within the soil layer where as in reality, infiltration slows as the soil becomes saturated.
To assess the impact on model results the infiltration rate was reduced by 20% and 40% (to 16 and 12mm/hr) within the woodland areas. The impact on model results has been summarised in Table 3.6.

2016s4178 - Southwell Modelling Appraisal Report_Supplementary report 25
Table 3.6 - Model sensitivity analysis - soil infiltration rate
Model Output Impact of Sensitivity Test
Water Levels Small increase in peak / falling limb over baseline conifer runs. Flows As above. Property Counts No change in property counts for 16mm/hr run. Increase (two
properties) for the 12mm/hr run. Halam Hill Sub-Catchment
18-30mm increase in peak water level (more significant in upper catchment).
Potwell Sub-Catchment
5-20mm increase in peak water level (again more significant in the upper catchment). The level hydrograph at Minster School is characterised by a double peak. With the application of the reduced soil infiltration rates described above the secondary peak (rural component) has shown a 50mm increase in peak level.
Other Comments Infiltration rates appear quite high in relation to rain (particularly after scaling factor applied).
3.4.4 Antecedent soil wetness
The modelling software has a number of predefined soil types which gives initial values for porosity and hydraulic conductivity and these have been adopted in the model set up. In addition to this the initial wetness value for the soil (i.e. degree of saturation prior to the flood event) for design conditions was refined during the model calibration phase.
Model sensitivity to this assumption was assessed by adjusting the initial soil wetness by ±10% within the woodland areas. The impact on model results has been summarised in Table 3.7.
Table 3.7 - Model sensitivity analysis - antecedent soil wetness
Model Output Impact of Sensitivity Test
Water Levels Peak water levels largely unaffected. Specific locations discussed below.
Flows Slight increase in flows on falling limb (when wetness increased) which would result in a volume increase in Southwell.
Property Counts No Change. Halam Hill Sub-Catchment
5mm increase on peak water level when initial wetness increased around Hopkiln Lane but no difference at other key locations.
Potwell Sub-Catchment
Falling limb when initial wetness increased shows 20-35mm increase in secondary peak. Negligible difference around lower portion of the model (Church Street).
Other Comments None.
3.4.5 Extent of woodland planting
The percentage of the total catchment planted during the scenario testing was approximately 18%. Given the potential impact of this amount of coverage the FC/FR were interested in understanding how the model results would be affected if the planted area was doubled to 36% and was distributed evenly across the Halam and Potwell catchments. This was simulated for the 50-year short duration return period event. The impact on model results has been summarised in Table 3.8.

2016s4178 - Southwell Modelling Appraisal Report_Supplementary report 26
Table 3.8 - Model sensitivity analysis - Impact on model results
Model Output Impact of Sensitivity Test
Water Levels Sub-catchments respond very differently with Potwell Dike continuing to show reductions in peak water levels / flows for both the 25 and 50-year return period events. Halam Hill no significant differences observed.
Flows n/a Property Counts Two additional properties removed from flooding at both the 25 and
50-year. Halam Hill Sub-Catchment
No difference in max channel water levels but this could be result of local hydraulics.
Potwell Sub-Catchment
Significant reduction in peak water levels (up to 125mm near planted areas) reducing to 90mm in the lower portion of the catchment for the 50-year return period event. 25-year gives a more significant reduction (110mm) in the lower portion of the model.
Other Comments None.

2016s4178 - Southwell Modelling Appraisal Report_Supplementary report 27
4 Southwell afforestation - economic appraisal
4.1 Introduction
An economic appraisal has been undertaken to assess the benefits of the simulated woodland planting on flood risk mitigation and the cost effectiveness of the options assessed. The economic appraisal takes the form of a simple benefit-cost assessment (BCA) using standard flood damage data and methodologies combined with costs provided by the FC.
4.2 Guidance
In accordance with the Environment Agency Flood and Coastal Erosion Risk Management appraisal guidance (FCERM)4, benefits are taken as annual average damages (AAD) avoided by scheme options expressed as their present value using Treasury discount rates.
4.3 Methodology
Flood damage values have been obtained from the Flood Hazard Research Centre's (FHRC) Multi-Coloured Manual5 (MCM) with additional guidance provided by the Multi-Coloured Handbook (MCH)6.
4.3.1 Damage types
Flood damage assessment can include direct, indirect, tangible and intangible aspects of flooding, as shown in the Figure 4.1. Direct damages are the most significant in monetary terms, although the MCM and additional research provide additional methodologies, recommendations and estimates to account for the indirect and intangible aspects of flood damage.
Figure 4.1: Aspects of flood damage
Flood damage estimates have been derived for the following items:
1. Direct damages to residential properties;
2. Direct damages to commercial and industrial properties;
3. Indirect damages (emergency services);
4. Intangible damages associated with the impact of flooding;
5. Indirect damages to commercial properties;
Alongside this Environmental benefits of woodland planting have also been considered. Full details are provided in the following sections.
4.4 Flood loss approach
The process to estimate the benefits of an intervention option is to plot the two loss-probability curves: that for the situation now, and that with the proposed option as shown in Figure 4.2. The scale on the y axis is the event loss (£); the scale on the x axis is the probability of the flood events
4 Environment Agency (March 2010) Flood and Coastal Erosion Risk Management appraisal guidance 5 The benefits of flood and coastal risk management: A Manual of Assessment Techniques - 2013 edition. 6 The benefits of flood and coastal risk management: A Handbook of Assessment Techniques - 2013 edition.
Economic
Damage
Direct
Tangible Intangible
Indirect
Tangible Intangible
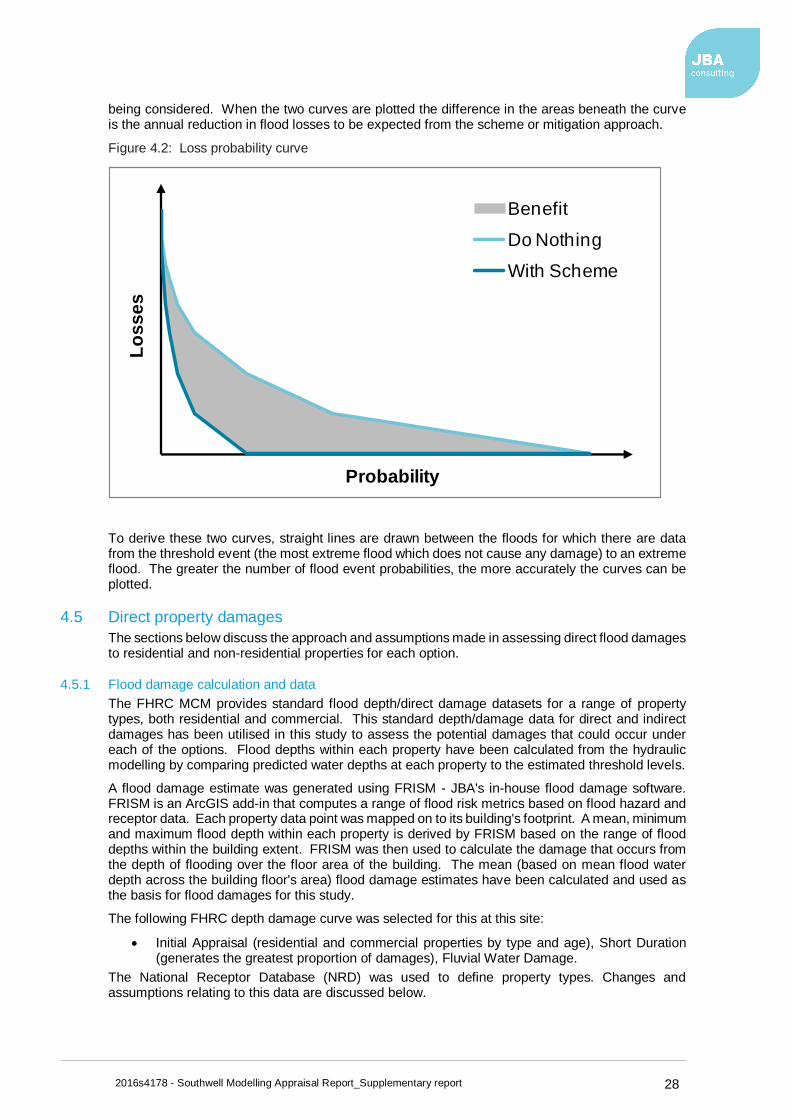
2016s4178 - Southwell Modelling Appraisal Report_Supplementary report 28
being considered. When the two curves are plotted the difference in the areas beneath the curve is the annual reduction in flood losses to be expected from the scheme or mitigation approach.
Figure 4.2: Loss probability curve
To derive these two curves, straight lines are drawn between the floods for which there are data from the threshold event (the most extreme flood which does not cause any damage) to an extreme flood. The greater the number of flood event probabilities, the more accurately the curves can be plotted.
4.5 Direct property damages
The sections below discuss the approach and assumptions made in assessing direct flood damages to residential and non-residential properties for each option.
4.5.1 Flood damage calculation and data
The FHRC MCM provides standard flood depth/direct damage datasets for a range of property types, both residential and commercial. This standard depth/damage data for direct and indirect damages has been utilised in this study to assess the potential damages that could occur under each of the options. Flood depths within each property have been calculated from the hydraulic modelling by comparing predicted water depths at each property to the estimated threshold levels.
A flood damage estimate was generated using FRISM - JBA's in-house flood damage software. FRISM is an ArcGIS add-in that computes a range of flood risk metrics based on flood hazard and receptor data. Each property data point was mapped on to its building's footprint. A mean, minimum and maximum flood depth within each property is derived by FRISM based on the range of flood depths within the building extent. FRISM was then used to calculate the damage that occurs from the depth of flooding over the floor area of the building. The mean (based on mean flood water depth across the building floor's area) flood damage estimates have been calculated and used as the basis for flood damages for this study.
The following FHRC depth damage curve was selected for this at this site:
• Initial Appraisal (residential and commercial properties by type and age), Short Duration (generates the greatest proportion of damages), Fluvial Water Damage.
The National Receptor Database (NRD) was used to define property types. Changes and assumptions relating to this data are discussed below.
Lo
ss
es
Probability
Benefit
Do Nothing
With Scheme
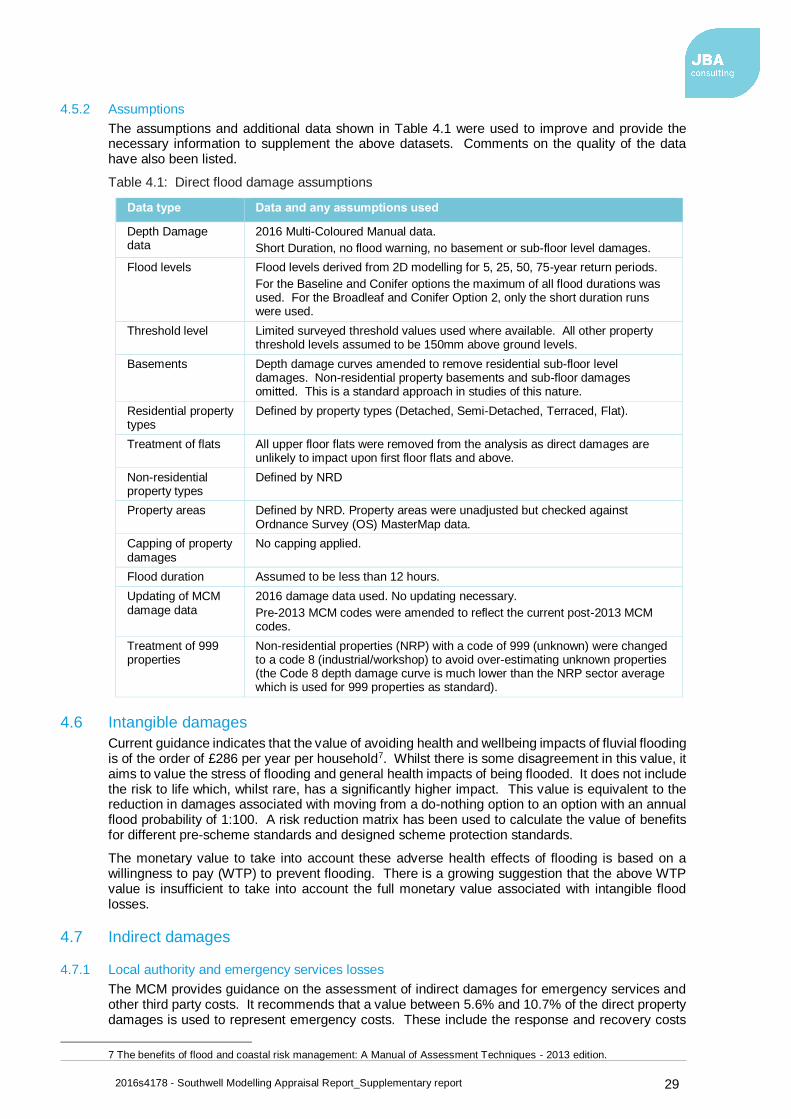
2016s4178 - Southwell Modelling Appraisal Report_Supplementary report 29
4.5.2 Assumptions
The assumptions and additional data shown in Table 4.1 were used to improve and provide the necessary information to supplement the above datasets. Comments on the quality of the data have also been listed.
Table 4.1: Direct flood damage assumptions
Data type Data and any assumptions used
Depth Damage data
2016 Multi-Coloured Manual data.
Short Duration, no flood warning, no basement or sub-floor level damages.
Flood levels Flood levels derived from 2D modelling for 5, 25, 50, 75-year return periods.
For the Baseline and Conifer options the maximum of all flood durations was used. For the Broadleaf and Conifer Option 2, only the short duration runs were used.
Threshold level Limited surveyed threshold values used where available. All other property threshold levels assumed to be 150mm above ground levels.
Basements Depth damage curves amended to remove residential sub-floor level damages. Non-residential property basements and sub-floor damages omitted. This is a standard approach in studies of this nature.
Residential property types
Defined by property types (Detached, Semi-Detached, Terraced, Flat).
Treatment of flats All upper floor flats were removed from the analysis as direct damages are unlikely to impact upon first floor flats and above.
Non-residential property types
Defined by NRD
Property areas Defined by NRD. Property areas were unadjusted but checked against Ordnance Survey (OS) MasterMap data.
Capping of property damages
No capping applied.
Flood duration Assumed to be less than 12 hours.
Updating of MCM damage data
2016 damage data used. No updating necessary.
Pre-2013 MCM codes were amended to reflect the current post-2013 MCM codes.
Treatment of 999 properties
Non-residential properties (NRP) with a code of 999 (unknown) were changed to a code 8 (industrial/workshop) to avoid over-estimating unknown properties (the Code 8 depth damage curve is much lower than the NRP sector average which is used for 999 properties as standard).
4.6 Intangible damages
Current guidance indicates that the value of avoiding health and wellbeing impacts of fluvial flooding is of the order of £286 per year per household7. Whilst there is some disagreement in this value, it aims to value the stress of flooding and general health impacts of being flooded. It does not include the risk to life which, whilst rare, has a significantly higher impact. This value is equivalent to the reduction in damages associated with moving from a do-nothing option to an option with an annual flood probability of 1:100. A risk reduction matrix has been used to calculate the value of benefits for different pre-scheme standards and designed scheme protection standards.
The monetary value to take into account these adverse health effects of flooding is based on a willingness to pay (WTP) to prevent flooding. There is a growing suggestion that the above WTP value is insufficient to take into account the full monetary value associated with intangible flood losses.
4.7 Indirect damages
4.7.1 Local authority and emergency services losses
The MCM provides guidance on the assessment of indirect damages for emergency services and other third party costs. It recommends that a value between 5.6% and 10.7% of the direct property damages is used to represent emergency costs. These include the response and recovery costs
7 The benefits of flood and coastal risk management: A Manual of Assessment Techniques - 2013 edition.
2016s4178 - Southwell Modelling Appraisal Report_Supplementary report 30
incurred by organisations such as the emergency services, the local authority and the EA. A 10.7% value has been specified for the purposes of this assessment as this is a more appropriate option when looking at isolated communities where the cost of responding to flood events tends to be higher.
4.7.2 Indirect dry-out costs
There are a number of additional property drying out costs that are omitted from the standard FHRC MCM depth damage curves, but mentioned and typically included separately in flood loss calculations. These costs include the:
• The electrical cost of running dehumidifiers (rental costs are included in the depth damage curves). The MCM recommends a cost of £604.80 per property for the additional electricity to run dehumidifiers for properties flooded to a depth less than 0.1m. For properties flooded to a depth greater than 0.1m the cost rises to £1,209.60 per property. These costs are based on 2005 estimates and have been uplifted to £770.5 and £1,541 respectively to 2016 values using the CPI index.
• Additional heating costs of £170 per property (uplifted to £217 per property using the CPI index).
4.7.3 Indirect commercial damages
Obtaining accurate data on indirect flood losses is difficult. Indirect losses are of two kinds:
• losses of business to overseas competitors, and
• the additional costs of seeking to respond to the threat of disruption or to disruption itself which fall upon firms when flooded.
Chapter 5, Section 5.7 of the MCM (2013)8 recommends estimating and including potential indirect costs where these are the additional costs associated with trying to minimise indirect losses. This is assessed by calculating total indirect losses as an uplift factor of 3% of estimated total direct NRP losses at each return period included within the damage estimation process.
4.7.4 Vehicle losses
Chapter 4, Section 4.5.7 of the MCM (2013) recommends that the average loss associated with vehicle damage during flood events should be determined using a value of £3,100 per property flooding multiplied by the number of properties at risk and a factor to account for the time of day and the fact that cars can be moved given warning (0.28 is recommended). This calculation has been applied to all properties flooding (above threshold) within the area of interest for each return period flood event assessed, and the AAD and Present Value damage (PVd) calculated as normal.
4.8 Environmental benefits
New woodlands may deliver a wide range of ecosystem services including benefits to biodiversity, landscape, recreation, flood alleviation, air pollution and water quality. Whilst these benefits are highly site and woodland specific and depend in part on the extent of woodland and accessibility by the public, methods to try to monetise them have been researched.
Environmental benefits of woodlands can be broken down into the following categories:
• Recreational and amenity/aesthetic benefits
• Air and water quality benefits
• Biodiversity and habitat benefits
• Carbon sequestration benefits
• Economic employment benefits.
4.8.1 Habitat and recreational benefits
Eftec (2016)9 reviewed the evidence of woodland benefits and concluded that the highest benefits are provided by urban and peri-urban woodlands, high priority biodiversity sites and accessible woods with developed facilities.
8 Penning-Rowsell et al., 2013. Flood and Coastal Erosion Risk Management - A Manual for Economic Appraisal 9 Assessing the wider benefits of the Woodland Carbon Code, October 2016. For Forestry Commission.

2016s4178 - Southwell Modelling Appraisal Report_Supplementary report 31
Non-use biodiversity and cultural benefits (i.e. excluding regulating services, timber and carbon) were estimated to average £300 per ha per year for priority sites. It is generally understood that the closer to a population that woodland is planted, the higher the benefits tend to be in terms of recreation and amenity. Therefore, the benefits from non-priority (rural) sites were around £27 per ha per year.
Aesthetic benefits were considered to average £40 per ha per year, but £10 where woodlands were managed primarily for timber.
Whilst the results suggest a minimum of £10 per ha per year for conifers, and £70 per ha per year for other woodland systems in England, the values could be far higher (in the region of £340 per ha per yr) where planting is carried out in a way to maximum public accessibility (also with a cost associated with this). Therefore, these are broad and uncertain estimates which will vary highly depending on accessibility and location. For the purposes of this assessment we have assumed the planting could generate in the order of £67 per ha per year (figure based on similar studies).
Allowances for air and water quality regulation, the economic benefits of new employment to manage and maintain the woodland and biodiversity benefits are available but have been excluded from this assessment.
4.8.2 Carbon sequestration benefits
Carbon sequestration benefits have been estimated from a number of sources:
• Estimates of the carbon sequestration as a result of woodland planting (in tCO2e per ha)
• Carbon prices based on standard Department of Energy and Climate Change (DECC) values.
Mean net retention of carbon has been estimated over a 100-year period for conifer and broadleaf forestry using estimates of the 5-year cumulative sequestration rates over a 100-year period from values provided by the Carbon Lookup Tables (V1.5 27July2012)10. Annual rates vary over the period assessed, but average 5.77tCO2e per ha per annum for Sitka Spruce and 4.29-5.26 tCO2e per ha per annum for Sycamore/Ash/Birch depending on planting density). The above rates assume thinned management and yield classes of 12 and 8 for conifer and broadleaf woodland respectively.
Emissions arising from FCERM schemes should be valued using the ‘non-traded price of carbon’ (NTPC). DECC carbon valuation guidance is applied to the value of sequestered carbon, using the non-traded price of carbon schedule (DECC, 2014). The NTPC for the three time horizons is given in Table 4.2, although the calculations use the annual values so that these can be applied to the 5-yearly carbon sequestration rates provided by the FC Carbon Lookup Tables. Estimates of carbon sequestration are converted to (CO2e) and used in the calculations. The central estimates have been used for the purposes of this assessment.
Table 4.2: Carbon prices and sensitivities for appraisal, 2014 £/tCO2e (source: DECC, 2014)
Non-traded 2016 2025 2115
Lower (£/t CO2e) 31 36 74
Central (£/t CO2e) 63 72 297
Upper (£/t CO2e) 94 108 520
10 https://www.forestry.gov.uk/forestry/infd-8jue9t

2016s4178 - Southwell Modelling Appraisal Report_Supplementary report 32
5 Southwell afforestation - summary of total flood damages
5.1 Flood damage scenarios
The following scenarios have been assessed in terms of flood damages:
• Baseline scenario
• Conifer Option 1 planted scenario (150ha).
The above scenarios are based on flood depths extracted from the maximum of a number of flood duration model runs. A separate set of woodland planting scenarios was also undertaken using only the short duration model runs. The following scenarios have been assessed:
• Baseline scenario
• Conifer Option 1 planted scenario (150ha)
• Broadleaf Option 1 planted scenario (150ha)
• A Conifer Option 2 plus planted scenario (310ha).
5.1.1 Separation of flood damages between Halam and Potwell catchments
Due to the hydrological interactions between the Halam and Potwell catchments whereby surface water flooding from the Halam catchment is able to flow into the adjoining Potwell catchment during extreme events, it has not been attempted to assess flood damages on an individual catchment basis. The analysis of flood damages has therefore been undertaken across the combined catchments.
5.2 Results for baseline and conifer planting scenario
Total event AAD and PVd for both the baseline and conifer planted options are provided in Table 5.1 and Table 5.2.
Present Values (PV) have been assessed using standard HM Treasury discount rates as recommended by the 2003 revision to the HM Green Book. The following assumptions have been made:
• The life span of the scheme and appraisal period is 100 years.
• Discounting of benefits assume the following values based on the Green book declining rates:
o 3.5% for years 0-30;
o 3.0% for years 31-75 and;
o 2.5% for years 76-99.
Table 5.1: Baseline flood damages (£m)
5-yr 25-yr 50-yr 75-yr AAD PVd
Direct Residential damage
0.95 1.58 2.13 2.65 0.44 13.11
Direct Commercial damage
0.05 0.07 0.12 0.27 0.03 0.75
Indirect damage 0.30 0.45 0.61 0.74 0.13 3.94
Intangible damages - - - - 0.05 1.59
Total damage 1.30 2.11 2.86 3.65 0.65 19.39
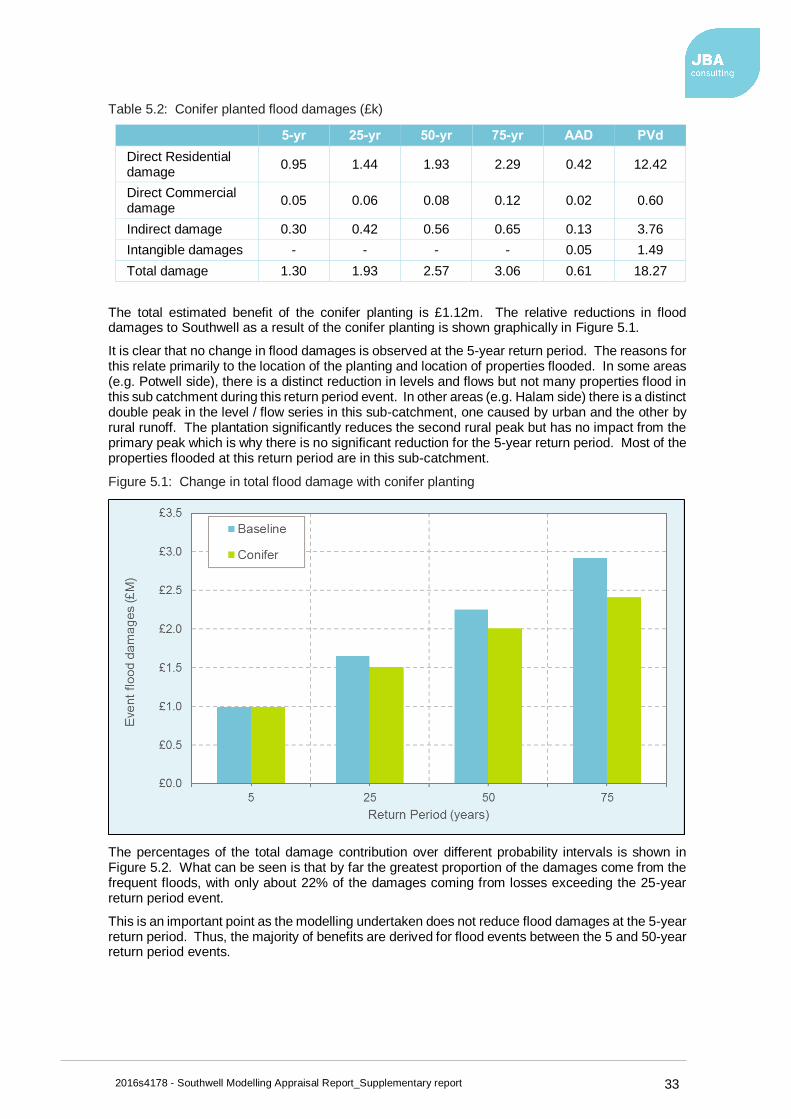
2016s4178 - Southwell Modelling Appraisal Report_Supplementary report 33
Table 5.2: Conifer planted flood damages (£k)
5-yr 25-yr 50-yr 75-yr AAD PVd
Direct Residential damage
0.95 1.44 1.93 2.29 0.42 12.42
Direct Commercial damage
0.05 0.06 0.08 0.12 0.02 0.60
Indirect damage 0.30 0.42 0.56 0.65 0.13 3.76
Intangible damages - - - - 0.05 1.49
Total damage 1.30 1.93 2.57 3.06 0.61 18.27
The total estimated benefit of the conifer planting is £1.12m. The relative reductions in flood damages to Southwell as a result of the conifer planting is shown graphically in Figure 5.1.
It is clear that no change in flood damages is observed at the 5-year return period. The reasons for this relate primarily to the location of the planting and location of properties flooded. In some areas (e.g. Potwell side), there is a distinct reduction in levels and flows but not many properties flood in this sub catchment during this return period event. In other areas (e.g. Halam side) there is a distinct double peak in the level / flow series in this sub-catchment, one caused by urban and the other by rural runoff. The plantation significantly reduces the second rural peak but has no impact from the primary peak which is why there is no significant reduction for the 5-year return period. Most of the properties flooded at this return period are in this sub-catchment.
Figure 5.1: Change in total flood damage with conifer planting
The percentages of the total damage contribution over different probability intervals is shown in Figure 5.2. What can be seen is that by far the greatest proportion of the damages come from the frequent floods, with only about 22% of the damages coming from losses exceeding the 25-year return period event.
This is an important point as the modelling undertaken does not reduce flood damages at the 5-year return period. Thus, the majority of benefits are derived for flood events between the 5 and 50-year return period events.

2016s4178 - Southwell Modelling Appraisal Report_Supplementary report 34
Figure 5.2: Contribution of flood damages
5.3 Results for sensitivity tests
As the 5-year return periods have not been run for the sensitivity tests (woodland type, soil infiltration, soil wetness and extent of planting) the 5-year return period has been assumed to be the same as the baseline scenario (using the maximum from all storm durations).
Total PVd damages for both the four sensitivity tests undertaken are provided in Table 5.3.
Table 5.3: Total flood damages and benefits (£k)
Scenario Present Value damage (PVd)
Present Value benefits* (PVb)
Baseline 19,282 -
Conifer 18,159 1,122 (a – b)
Broadleaf 18,181 1,100 (a – c)
Conifer plus 17,823 1,459 (a – d)
*Present value benefits represent the difference between the baseline damages and the option damages.
All three options generate in excess of £1million benefits. The difference between the broadleaf and conifer modelling scenarios is minimal (broadleaf woodland has a slightly lower benefit based on the modelling results. The conifer plus option increases the benefit by approximately £340k; an increase of 30%. These results are presented graphically in Figure 5.3.

2016s4178 - Southwell Modelling Appraisal Report_Supplementary report 35
Figure 5.3: Event damages for each sensitivity test
5.4 Per hectare benefits
The benefits per hectare have been assessed for all options run using the simulated woodland planting areas of 150ha for the conifer/broadleaf option and 310ha for the conifer plus option. The results are shown in Table 5.4.
The results for this catchment and the planting options proposed suggest that there are approximately £7,500 flood benefits per hectare over the 100-year appraisal period. This equates to an annual benefit in the region of £250 per hectare.
Table 5.4: Flood benefits per hectare (£m)
Scenario Present Value damage (PVd)
Present Value benefits (PVb)
Per hectare benefits (PVb)
Baseline 19.39 - -
Conifer 18.27 1.12 0.00745
Scenario Present Value damage (PVd)
Present Value benefits (PVb)
Per hectare benefits (PVb)
Baseline 19.28 - -
Conifer 18.16 1.12 0.00748
Broadleaf 18.18 1.10 0.00734
Conifer plus 17.82 1.46 0.00471
5.5 Environmental benefits
Environmental benefits have been estimated per hectare are presented in Table 5.5 and 5.6.
Table 5.5: Biodiversity, recreation and aesthetic benefits per hectare (£)
Scenario Annual benefit/ha Total benefit per annum
Present Value benefit
Conifer 67 10,122 301,767
Conifer plus 67 20,919 623,652

2016s4178 - Southwell Modelling Appraisal Report_Supplementary report 36
Table 5.6: Carbon sequestration benefits per hectare (£)
Scenario Annual benefit/ha Total benefit per annum
Present Value benefit
Conifer 1,153 Increases over time 5,154,000
Conifer plus 1,153 Increases over time 10,652,000

2016s4178 - Southwell Modelling Appraisal Report_Supplementary report 37
6 Southwell afforestation - cost assumptions
6.1 Methodology
Costs of woodland planting have been developed by the FC. Costs have been derived for the following options:
• Size (small - 1ha, medium - 9ha and large - 100ha)
• Cost (low, medium, high).
The three size classes have been chosen to reflect square planting schemes with sides measuring 100m, 300m and 1,000m respectively to make fencing cost calculations easy.
The following are the main variables impacting on both cost and grant rates. It is assumed that all other cost items are the same for all options:
• Density - three categories have been used to reflect the Woodland for Water CS Design Guidance. 1,100, 1,600 and 2,500 stems per hectare.
• Protection - 'None' equates to just a tree with a spiral guard. Shelters specified for all options.
• Fencing - lengths reflect the size of planting.
• Capital grants are assumed to cover 80% of the calculated planting costs.
• Maintenance grants are fixed at £200 per hectare and payable for 10 years. These costs have not been discounted in Table 6.1.
There is no distinction between conifer and broadleaf in terms of cost in the Countryside Stewardship Scheme so no differentiation has been made for the purpose of this assessment. The summary costs provided are shown in Table 6.1.
Table 6.1: Costs of woodland planting
Option 1 2 3 4 5 6 7 8 9
Low Cost Standard Cost High Cost
Small (1ha)
Medium (9ha)
Large (100ha)
Small (1ha)
Medium (9ha)
Large (100ha)
Small (1ha)
Medium (9ha)
Large (100ha)
Density (SPH)
1,100 1,100 1,100 1,600 1,600 1,600 2,500 2,500 2,500
Protection None None None Shelters Shelters None Shelters None None
Fencing Stock Sheep Netting Deer
Fencing, Rabbit Netting,
Difficult Site
Sheep
Netting
Sheep
and Rabbit Netting
Deer
Fencing, Rabbit Netting,
Difficult Site
Extras None 1 Gate 2 Gates 1 Gate 2 Gates 4 Gates 2 Gates 4 Gates 8 Gates
Gross costs
(£)
6,302 45,208 451,199 12,155 91,282 568,794 16,421 72,414 718,200
Total grant
(£)
5,042 36,166 360,959 8,800 73,026 455,035 8,800 57,931 574,560
Net cost per hectare
(£)
1,260 1005 902 3,355 2,028 1,138 7,621 1,609 1,436
For the purposes of this assessment two further cost scenarios were made:
• High cost scenario for the 150ha planting proposed at Southwell. The 150ha area is made up of 10 zones with a total perimeter of 18.7km.
• High cost scenario for the 310ha (conifer plus) planting scenario at Southwell. The 310ha area is made up of 11 zones with a total perimeter of 34.1km.
These two cost scenarios use the actual simulated planting areas and the perimeter estimates to refine the costs and provide an appropriate calculation against which to compare the flood damages. Summary costs per hectare for these two scenarios are provided in Table 6.2. Full cost calculations are provided in Appendix A.

2016s4178 - Southwell Modelling Appraisal Report_Supplementary report 38
Table 6.2: Costs of woodland planting for Southwell
Capital Cost
Capital Grant
Net cost Net cost/ha
Net annual maintenance
cost/ha
150ha size 874,186 699,349 174,837 1,166 50
310ha size 1,740,374 1,392,299 348,075 1,123 50
Based on the above costs, whole life (present value) costs have been estimated for the following options:
• Conifer planting (150ha) with grant
• Conifer planting (310ha) with grant
• Conifer planting (150ha) without grant
• Conifer planting (150ha) with grant and land compensation costs.
The following assumptions have been applied:
• A 100-year appraisal period
• HM Treasury standard discount rates
• Maintenance costs only apply for the first 10 years
• Land compensation based on value foregone (see below)
6.1.1 Value of land and compensation
Agricultural land market values for the East Midlands is in the region of £12k to £20k per hectare for poor grassland and Grade 3 arable land respectively11. This is the cost that may need to be used to buy the land for the purpose of planting and NFM. However, most research into the benefits of woodland planting uses the opportunity cost of land, rather than market values.
The opportunity cost of the land (net income foregone) avoids the issues associated with using observed land prices. With decoupling of agricultural support the opportunity cost of land aims to value the land without subsidies. However, estimating the marginal opportunity cost of planting land to society is not straightforward as it may be affected by food security and environmental issues. In the absence of specific research, social opportunity costs are typically based on evidence from farm incomes.
The 'Cost-effectiveness of woodlands for CO2 abatement'12 study for the FC estimated the opportunity cost of land as £220 per hectare per year for England. Assuming standard discount rates this equates to £6,560 over a 100-year appraisal period.
Clearly there is a large difference between this potential opportunity cost and the market value of the plot of land. The lower opportunity costs have been used for the purpose of the benefit-cost assessment, however stakeholders should be aware of this difference and the implications of this.
6.1.2 Summary costs for Southwell
The Present Value costs for each option are presented in Table 6.3.
11 Savills (2012) Market Survey Agricultural Land. 2012 [online] available at:
http://www.savills.co.uk/research/rural-research.aspx 12 CJC Consulting (2014) Assessing the cost-effectiveness of woodlands in the abatement of carbon dioxide emissions. Final report to the Forestry Commission, November 2014.

2016s4178 - Southwell Modelling Appraisal Report_Supplementary report 39
Table 6.3: Present Value costs of woodland planting for Southwell (£k)
Cost element Planting with grant
Planting without grant
Planting with grant and land compensation
Planting (310ha) with
grant
Capital PVc 874 874 874 1,740
O&M PVc 62 62 62 129
Land compensation / income foregone
- - 984 -
Grant contribution* -699 - -699 -1,392
Total PVc 237 937 1,221 477
* Grant contributions are assumed to be negative values
6.2 Optimism bias
An optimism bias is typically added to the whole life costs of a flood mitigation scheme to allow for the demonstrated systematic tendency for appraisers to be over-optimistic about key project parameters, (including capital costs, operating costs and works duration). It is typical to apply general rules of thumb of a 60% uplift for projects at an early stage of appraisal, or 30% at the detailed design stage of a study. As detailed in section 3.4 a range of sensitivity tests have been undertaken to reduce and quantify uncertainties in the model analysis.
An optimism bias has not been used for this study as the costs have been provided by the FC and there is less risk of overspend due to the well understood costs of woodland creation. Some level of contingency or optimism bias should be considered by any authority that proposes woodland creation in the catchment to ensure a suitable factor or safety at least in budgeting terms to account for unforeseen cost implications and risks.

2016s4178 - Southwell Modelling Appraisal Report_Supplementary report 40
7 Southwell afforestation - benefit cost analysis
7.1 Introduction
This section discusses the economic appraisal carried out during this study. The methods of calculating the benefits and costs are outlined together with an assessment of the benefit-cost ratios for the range of options assessed.
Benefit cost analysis looks at a flood risk management strategy or practice and compares all the benefits that will be gained by its implementation to all the costs that will be incurred during the lifetime of the project.
In accordance with the FCERM appraisal guidance, benefits are taken as annual average damages avoided, expressed as their present value using Treasury discount rates. These are compared with the whole life cost of the capital and maintenance costs of selected options, expressed as present value. If the benefits exceed the costs for the option, the scheme is deemed to be cost effective and worthwhile for promotion.
Benefits are assessed as the flood damages that will be avoided by the implementation of a project as well as potential environmental benefits. To calculate the benefits, it is necessary to assess the damages that are likely to occur under both the Do Nothing and Do Something scenarios. The benefits of any particular Do Something option can then be calculated by deducting the Do Something damages from the Do Nothing damages.
7.2 Guidance and standard data
The principles of benefit-cost ratio calculations are summarised as follows:
• Derive the damages associated with do-nothing;
• Derive the damages associated with each scheme option;
• Derive the benefits (damages avoided) associated with each option;
• Derive the costs for each option; and
• Derive the benefit-cost ratios for each option.
Benefit cost results have been given in two ways:
• The cost effectiveness of woodland planting for the nine cost scenarios provided by the Forestry Commission. This assumes that the benefits (calculated using the entire catchment and a 150ha of planting) can be compared against a range of cost scenarios.
• The cost effectiveness of woodland planting for Southwell using representative costs that match the modelled afforestation scenarios.
7.3 Benefit cost results per hectare
The results below compare the per hectare costs of woodland planting versus the flood, environmental and total benefits. The benefits are based on the current Southwell site assuming 150ha of planting. We have compared these against the costs for small, medium and large planting area sizes for completeness.
The appropriateness of comparing a 1ha site with the benefits derived from a 150ha site must be considered carefully as comparison of the two may not be applicable.

2016s4178 - Southwell Modelling Appraisal Report_Supplementary report 41
Table 7.1: Costs of woodland planting (£)
Option 1 2 3 4 5 6 7 8 9
Low Cost Standard Cost High Cost
Small
(1ha)
Medium
(9ha)
Large
(100ha)
Small
(1ha)
Medium
(9ha)
Large
(100ha)
Small
(1ha)
Medium
(9ha)
Large
(100ha)
Net cost per
hectare
1,260 1,005 902 3,355 2,028 1,138 7,621 1,609 1,436
Flood benefits per hectare (assuming
150 ha)
7,455 7,455 7,455 7,455 7,455 7,455 7,455 7,455 7,455
Environmental
benefits per hectare (assuming
150 ha)
36,374 36,374 36,374 36,374 36,374 36,374 36,374 36,374 36,374
Total benefits/ha 43,829 43,829 43,829 43,829 43,829 43,829 43,829 43,829 43,829
Benefit-cost per
hectare (based on flood benefits)
5.9 7.4 8.3 2.2 3.7 6.6 1.0 4.6 5.2
Benefit-cost per hectare (based on
environmental benefits)
28.9 36.2 40.3 10.8 17.9 32.0 4.8 22.6 25.3
Benefit-cost per hectare
(combined benefits)
34.8 43.6 48.6 13.1 21.6 38.5 5.8 27.2 30.5
The results suggest that for all planting sizes and the three cost assumptions, flood benefits outweigh the planting costs with a benefit-costs range between 1.0 to 8.3. This is the same for the environmental benefits with a benefit-cost range between 4.8 and 40.3. It should be noted however that no land payment costs nor optimism bias are included in these costs.
To further refine the analysis and to compare costs and benefits as equally as possible, the analysis has been repeated for the full area of the Southwell catchment based on the 150ha planting zones (58ha Halam, 92ha in Potwell) and the 'conifer plus' scenario representing an area of 310ha.
7.4 Benefit-cost results for Southwell
Tables 7.2 and 7.3 show the costs of implementing the proposed planting zones (150ha and 310ha) using the standard Forestry Commission unit costs uplifted to account for the larger planting areas and an estimate of the actual perimeter fencing lengths. These costs (with and without grant and an allowance for land opportunity costs) are compared against the estimated benefits in terms of flood benefits (estimated using the catchment flood modelling undertaken) and the environmental benefits estimated in the preceding chapter.
The results are varied and depend on a combination of availability of grant, land opportunity costs and the inclusion of environmental benefits. The results have been further summarised in Table 7.4. The results for the conifer planting in the proposed 150ha zone suggests that all options are cost effective to the local authority if environmental benefits are incorporated. If environmental benefits are excluded only the scenarios without land purchase are cost effective. The inclusion of land costs substantially reduces the cost effectiveness of the planting option as shown in the summary table below. Similarly, the exclusion of grant also reduces the overall cost effectiveness.
The above results suggest that woodland creation can provide small but cost-effective reductions in damages from flooding and could play a key role as part of a wider NFM or traditional scheme for appropriate catchments. In order for this to be cost effective however, land compensation costs need to be minimised as much as possible, or the wider benefits of woodland creation need to be valued and taken into consideration by the appraiser and the regulatory authority.
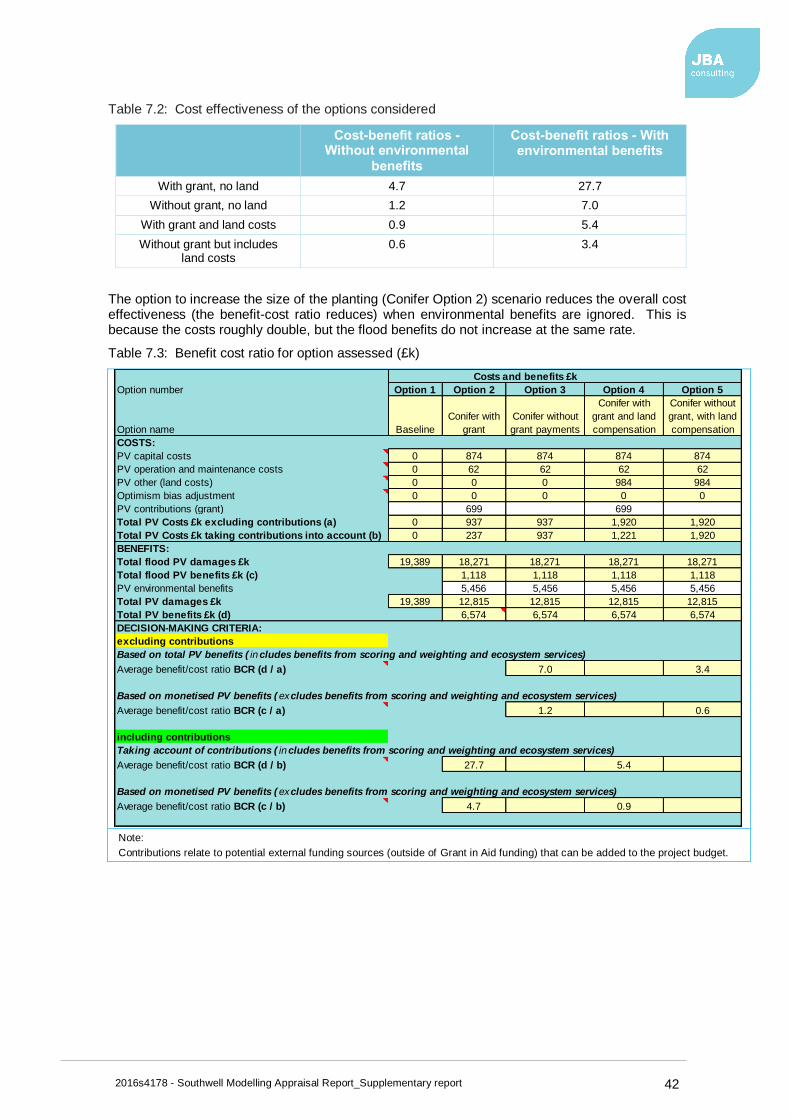
2016s4178 - Southwell Modelling Appraisal Report_Supplementary report 42
Table 7.2: Cost effectiveness of the options considered
Cost-benefit ratios - Without environmental
benefits
Cost-benefit ratios - With environmental benefits
With grant, no land 4.7 27.7
Without grant, no land 1.2 7.0
With grant and land costs 0.9 5.4
Without grant but includes land costs
0.6 3.4
The option to increase the size of the planting (Conifer Option 2) scenario reduces the overall cost effectiveness (the benefit-cost ratio reduces) when environmental benefits are ignored. This is because the costs roughly double, but the flood benefits do not increase at the same rate.
Table 7.3: Benefit cost ratio for option assessed (£k)
Note:
Contributions relate to potential external funding sources (outside of Grant in Aid funding) that can be added to the project budget.
Option number Option 1 Option 2 Option 3 Option 4 Option 5
Option name Baseline
Conifer with
grant
Conifer without
grant payments
Conifer with
grant and land
compensation
Conifer without
grant, with land
compensation
COSTS:
PV capital costs 0 874 874 874 874
PV operation and maintenance costs 0 62 62 62 62
PV other (land costs) 0 0 0 984 984
Optimism bias adjustment 0 0 0 0 0
PV contributions (grant) 699 699
Total PV Costs £k excluding contributions (a) 0 937 937 1,920 1,920
Total PV Costs £k taking contributions into account (b) 0 237 937 1,221 1,920
BENEFITS:
Total flood PV damages £k 19,389 18,271 18,271 18,271 18,271
Total flood PV benefits £k (c) 1,118 1,118 1,118 1,118
PV environmental benefits 5,456 5,456 5,456 5,456
Total PV damages £k 19,389 12,815 12,815 12,815 12,815
Total PV benefits £k (d) 6,574 6,574 6,574 6,574
DECISION-MAKING CRITERIA:
excluding contributions
Based on total PV benefits ( includes benefits from scoring and weighting and ecosystem services)
Average benefit/cost ratio BCR (d / a) 7.0 3.4
Based on monetised PV benefits ( excludes benefits from scoring and weighting and ecosystem services)
Average benefit/cost ratio BCR (c / a) 1.2 0.6
including contributions
Taking account of contributions ( includes benefits from scoring and weighting and ecosystem services)
Average benefit/cost ratio BCR (d / b) 27.7 5.4
Based on monetised PV benefits ( excludes benefits from scoring and weighting and ecosystem services)
Average benefit/cost ratio BCR (c / b) 4.7 0.9
Costs and benefits £k

2016s4178 - Southwell Modelling Appraisal Report_Supplementary report 43
Table 7.4: Benefit cost ratio for the short duration woodland creation scenarios (k)
Note:
Contributions relate to potential external funding sources (outside of Grant in Aid funding) that can be added to the project budget.
Option number Option 1 Option 2 Option 3 Option 4
Option name
Baseline Short
Duration
Conifer Short
Duration
Broadleaf Short
Duration
Conifer Plus
Short Duration
COSTS:
PV capital costs 0 874 874 1,740
PV operation and maintenance costs 0 62 62 129
PV other (land costs) 0 0 0 0
Optimism bias adjustment 0 0 0 0
PV contributions (grant) 699 699 1,392
Total PV Costs £k excluding contributions (a) 0 937 937 1,869
Total PV Costs £k taking contributions into account (b) 0 237 237 477
Total PV costs per ha £ 1.581 1.581 1.539
BENEFITS:
Total flood PV damages 19,282 18,159 18,181 17,823
Total flood PV benefits (c) 1,122 1,100 1,459
PV benefits from ecosystem services 4,574 4,868 10,061
Total PV damages £k 19,282 13,585 13,313 7,762
Total PV benefits £k (d) 5,696 5,969 11,519
DECISION-MAKING CRITERIA:
excluding contributions
Based on total PV benefits ( includes benefits from scoring and weighting and ecosystem services)
Average benefit/cost ratio BCR (d / a) 6.1 6.4 6.2
Average benefit/cost ratio BCR (c / a) 1.2 1.2 0.8
including contributions
Average benefit/cost ratio BCR (d / b) 24.0 25.2 24.2
Average benefit/cost ratio BCR (c / b) 4.7 4.6 3.1
Costs and benefits £k
Taking account of contributions ( includes benefits from scoring and weighting and ecosystem services)
Based on monetised PV benefits ( excludes benefits from scoring and weighting and ecosystem services)
Based on monetised PV benefits ( excludes benefits from scoring and weighting and ecosystem services)

2016s4178 - Southwell Modelling Appraisal Report_Supplementary report 44
8 Conclusions and recommendations
8.1 Modelling methodology
8.1.1 Development of modelling methodology
This study has shown that the current generation of hydraulic models are now capable of representing many of the key processes associated with changes to land use and specifically vegetation cover in rural catchments. The impacts on hydraulic and hydrological processes can be clearly quantified and verified against both anecdotal accounts and understanding of changing catchment responses.
In terms of the methodology the project has identified several key parameters and elements of model schematisation that need to be refined in existing models in order to be able to represent the key processes associated with land use changes in rural catchments. Key model components are detailed in Table 8.1.
Table 8.1 - Summary of refinements to existing hydraulic model
Element Details Model Domain
Soil Infiltration Specification of a soil layer with user defined initial wetness, infiltration rate and
soil porosity.
2D (TUFLOW) Domain
Rainfall Interception Specific interception rates applied in more detail to the catchment. Land use classes more clearly defined in terms of woodland
and vegetation types.
Interception rates based on most recent research from water resources industry.
2D (TUFLOW) Domain
Modifications of Topography
Modelling of physical impact of woodland on overland flow processes – Stands
represented using flow constriction areas which restrict rate at which flow travels
through wooded areas.
2D (TUFLOW) Domain
8.1.2 Recommendations for improvements to modelling methodology
The approach detailed above represents a robust methodology for assessing the impacts of land use changes using a 1D-2D or 2D only model, however it should be highlighted that the approach has been developed and calibrated for the Southwell catchment only and while many of the assumptions and approaches will be transferable to other catchments it would be essential to test the adopted approach and conclusions on a range of catchments which differ in terms of hydrological response, land use and geographic location. Crucially this would allow the model parameters to be calibrated and verified further against more observed event data.
The type of catchments that should be included are as follows:
• Additional highly urbanised catchments
• Low gradient, slowly responding catchments
• Steep, flashy catchments
• Rural catchments.
• Catchments with high rainfall
In addition, model calibration should also be assessed for winter events in order to determine if the model(s) are also able to replicate the hydrological and hydraulic characteristics of these events. The calibration analysis of the Southwell catchment has been undertaken on summer events only.
8.2 Modelling analysis - Southwell case study - key findings
8.2.1 Impact on flood risk
The analysis has looked at the impact on flood risk across both the Halam and Potwell Dike catchments. This has attempted to identify how the impact of woodland creation on flood risk varies depending on catchment type:

2016s4178 - Southwell Modelling Appraisal Report_Supplementary report 45
• Halam (urban) and
• Potwell (mixed urban-rural).
The assessment has focused on two elements, firstly the hydrological catchment response and how this is affected by the changes to landuse in the upper catchment and secondly in terms of the impact on flood risk in populated areas of the catchment (properties affected and flood damages).
Hydrological Response
The analysis of the hydrological catchment response has shown that while woodland creation in the upper catchment does little to reduce the peak water levels reaching the urban areas of the catchment, there is a more significant positive impact on the overall volumes of water reaching the flood risk areas. For Southwell, this has been demonstrated by a reduction in volume of the receding limb of flood hydrographs reaching the flood risk areas as demonstrated by Figure 8.1.
Figure 8.1 - Southwell Case Study - Impact on flood risk - Mid Potwell (75-year level
hydrograph
Pre-
Scheme (75-year) level
hydrograph
Post- Scheme
(75-year) level hydrograph
Flooding Mechanisms
The differing characteristics of the Halam (predominantly urban) and Potwell (mixed urban-rural) catchments has resulted in a marked difference in the responses of the catchments to the effects of woodland creation and this is reflected in both the flooding mechanisms and the numbers of properties flooded in each of the sub-catchments.
Halam
As discussed in section 3.3.4 the principal flooding mechanisms in Halam, which in most cases results in the initial flooding of properties, is generally from urban generated surface water flooding caused by the limited capacity and effectiveness of the surface water systems being overwhelmed by heavy and intense rainfall events. This onset is generally unaffected by runoff from the rural elements of the catchment and as a result the impact of the woodland creation is less significant than in the Potwell catchment.
The contribution from the rural proportion of the catchment to flood risk in Halam tends to present a secondary flood wave which exacerbates the flooding caused initially by surface water. Therefore, reducing the contribution of the rural component of the catchment through woodland creation can lead to a reduction in the overall damages caused by flooding.
In addition, the Halam flooding mechanisms also have an impact on the Potwell catchment as during large magnitude flood events (>25-year) floodwater accumulating in the Kirklington Road area (eastern edge of the Halam catchment) of the Southwell encroaches into the Potwell catchment, increasing flood risk in this area. This mechanism was observed during the 2013 flood event in Southwell. As a result, any measures to reduce flood risk in Halam will also lead to flood risk benefits occurring in Potwell.

2016s4178 - Southwell Modelling Appraisal Report_Supplementary report 46
Potwell
The Potwell catchment is also flooded via surface water mechanisms similar to those occurring in the Halam catchment. However, as the catchment has a larger rural component than Halam the dominant flooding mechanism is from fluvial sources and specifically from overtopping of Potwell Dike in areas such as Church Street.
The varying responses of the catchments to the woodland creation is reflected in the numbers of properties that are removed from flood risk with a larger proportion of properties being removed from flooding in the Potwell catchment than in Halam.
Table 8.2 summarises the numbers of properties removed from flood risk by the simulated woodland creation.
Table 8.2 - Properties removed from flood risk by woodland creation
Return Period (years)
No. Properties removed from flood risk
Halam Catchment
5 0
25 4
50 9
75 7
Potwell Catchment
5 0
25 9
50 10
75 16
8.2.2 Impact of woodland type
The comparison of the impact of broadleaf and coniferous woodland has shown that for the events covered in this the modelling shows no significant difference in terms of catchment response. This may be indicative of the fact the models are less sensitive to changes in runoff factors during high flow events.
8.2.3 Impact during extreme flood events
The analysis has also shown that the effectiveness of the woodland creation generally declines as the magnitude of the flood event increases. For example, the largest reductions in flood levels are achieved between the 25 and 50-year events on Potwell Dike. For events greater than a 75-year event the flooding benefits are likely to decline demonstrating that for extreme events woodland creation is less effective as other flooding mechanisms become more prevalent. For example, in Southwell this may include the increased importance of surface water transferring from the Halam to the Potwell catchment resulting in further flooding on Lower Kirklington Road (Potwell).
8.3 Economic viability
The economic viability of using woodland creation to help reduce flood risk has been assessed by undertaking a detailed benefit-cost analysis which compares the per hectare costs of woodland planting versus the flood, environmental and total benefits. The benefits are based on the current Southwell site assuming 150ha of additional planting being distributed across the Halam and Potwell catchment.
The analysis suggests that for all planting sizes and the three cost assumptions (refer to Table 7-1: low, standard and high), flood benefits outweigh the planting costs with a benefit-costs range between 1.0 to 8.3. This is the same for the environmental benefits with a benefit-cost range between 4.8 and 40.3.

2016s4178 - Southwell Modelling Appraisal Report_Supplementary report 47
8.3.1 Benefit-cost analysis for Southwell
While uncertainties exist in terms of availability of grant, land opportunity costs and the inclusion of environmental benefits for the Southwell case study the analysis suggest that woodland creation can provide small but cost-effective reductions in damages from flooding and could play a key role as part of a wider NFM or traditional scheme for appropriate catchments.
In order for this to be cost effective however, land compensation costs need to be minimised as much as possible, or the wider benefits of woodland creation need to be valued and taken into consideration by the appraiser and the regulatory authority.
8.4 Implications for use of woodland creation as part of flood defence schemes
In terms of the effectiveness of using land use change and management as a flood alleviation strategy, the example of Southwell has demonstrated that woodland can provide small but cost-effective reductions in damages from flooding and could play a role as part of a wider NFM or traditional scheme for appropriate catchments. The wider benefits of woodland creation can further add further value to any scheme looking to make use of such an approach.
The analysis has shown that in catchments where fluvial flooding mechanisms represent the principal source of flooding, such as Potwell Dike, woodland creation should provide an effective contribution to flood risk management either as a stand-alone option or as part of a wider scheme.
For example, the addition of upland woodland creation may allow more traditional scheme design to utilise smaller flood barriers or require less flood storage which would have a significant impact on overall scheme costs. Woodland creation could also play an important role in the ‘future proofing’ of existing flood alleviation schemes by mitigating the potential impacts of climate change on the effectiveness of the main scheme.
8.5 Recommendations
While the findings of the investigation have identified a clear methodology for the modelling of woodland creation as a potential flood defence option there are areas for improvement which would benefit from further analysis and investigation:
• Apply methodology to a wider range of catchments to test appropriateness of approach. This would need to be in catchments with comprehensive observed and measured flood event data to allow further calibration of key parameters.
• Further testing of flood events and storm durations - the Southwell investigation has focused on assessing flood risk and catchment response against 1, 4 and 10-hour storm durations only. It is recommended that to fully understand the catchment response to woodland creation a more comprehensive analysis covering a wider range of flood events (high and low frequency) in combination with a greater range of storm durations is assessed.
• In the context of the Southwell or similar catchments future investigations should look to isolate the impacts of the fluvial and surface water flooding mechanisms during the modelling exercise. This would allow clearer understanding of the interactions between the individual mechanisms and woodland creation to be established. This could be achieved by using topographic modifications or flow abstractions within the models to either capture or intercept specific flooding mechanisms or prevent interactions between catchments e.g., in the case of Southwell, prevent surface flooding from spreading into the Potwell catchment. This would allow the impact of fluvial flood risk in Potwell to be more clearly defined.
• Validation of methodology against observed data from woodland creation catchment studies. This should also include model validation/calibration for winter events as analysis carried out for Southwell has been focused in summer only events.
• This investigation as focused primarily on the impact on hydrological systems in the catchments. In addition to this it would be beneficial to assess the secondary benefits of woodland creation such as the impact on soil and silt transfer rates. For example, the impact of reduced sediment movement could be investigated using sediment transfer modelling software.

2016s4178 - Southwell Modelling Appraisal Report_Supplementary report 48

2016s4178 - Southwell Modelling Appraisal Report_Supplementary report 49
A Appendix A - Economic Analysis - Cost Calculations

2016s4178 - Southwell Modelling Appraisal Report_Supplementary report 50
References Catchment Flood Management Plans
Defra and Environment Agency (2004). Modelling and Decision Support Framework: User Guide.
Defra, Environment Agency and Welsh Assembly (2004). Modelling and Decision Support Framework: Procedures
Environment Agency (2004) Specification for Catchment Flood Management Plans version 0.5
Environment Agency (2004) Catchment Flood Management Plans Volume 1: Policy Guidance
Environment Agency (2005) Catchment Flood Management Plans Volume 2: Processes and Procedures Guidance
Economic Assessment
HM Treasury (2003) THE GREEN BOOK – Appraisal and Evaluation in Central Government, London: TSO
MAFF (2000) FCDPAG3 Flood and Coastal Defence Project Appraisal Guidance – Economic Appraisal
MAFF (2000) FCDPAG4 Flood and Coastal Defence Project Appraisal Guidance – Approaches to Risk
MAFF (2000) FCDPAG5 Flood and Coastal Defence Project Appraisal Guidance – Environmental Appraisal
MAFF (2001) FCDPAG1 Flood and Coastal Defence Appraisal Guidance – Overview
MAFF (2001) FCDPAG2 Flood and Coastal Defence Project Appraisal Guidance – Strategic Planning and Appraisal
Middlesex University Flood Hazard Research Centre (1990) FLAIR (Flood Loss Assessment Information Report)
Parker D J, Green CH & Thompson PM (1987) Urban Flood Protection Benefits: a Project Appraisal Guide, Gower
Penning-Rowsell EC and Chatterton JB (1977) The Benefits of Flood Alleviation: A Manual of Assessment Techniques
Penning - Rowsell et al. (1992) The Economics of Coastal Management – A Manual of Benefit Assessment Techniques
Penning - Rowsell et al. (2003) The Benefits of Flood and Coastal Defence: Techniques & Data for 2003
Penning - Rowsell et al: The Benefits of Flood and Coastal Risk Management: A Manual of Assessment Techniques, 2005
Penning - Rowsell et al: The Benefits of Flood and Coastal Risk Management: A Handbook of Assessment Techniques, 2005
Flood Risk Management
Bye, P. and Horner, M. (1998). Easter 1998 Floods: Report by the independent review team to the Board of the Environment Agency. Bristol, Environment Agency
Defra (2004) Making Space for Water: Developing a new Government Strategy for Flood & Coastal Erosion Risk Management in England – Consultation, London: Defra
Defra (2005) Making Space for Water: Developing a new Government Strategy for Flood & Coastal Erosion Risk Management in England – Consultation, First Government response to the autumn 2004 Making space for water consultation exercise, London: Defra

2016s4178 - Southwell Modelling Appraisal Report_Supplementary report 51
Environment Agency (1998) Environment Agency response to the independent report on the Easter 1998 floods: Action plan. Bristol, Environment Agency
Environment Agency (2003) Strategy for Flood Risk Management. Bristol: Environment Agency
European Union (2000) Water Framework Directive, Brussels: European Union (2000/60/EC)
Evans, E., Ashley, R., Hall, J., Penning-Rowsell, E., Sayers, P., Thorne, C. and Watkinson, A. (2004) Foresight. Future Flooding, London: Office of Science and Technology.
Flood Warning
Environment Agency (2003) Work Instruction for the definition of Flood Risk, Flood Warning and Flood Watch Areas.
Environment Agency (2004) 361_04 Guidance for Adopting the Extreme Flood Outline as the Flood Warning Service Limit: Environment Agency
Environment Agency (2005) 137_05 Flood Warning Levels of Service (FWLOS). Bristol: Environment Agency
Environment Agency (2005) Guidance - Principles and Application of Flood Warning Codes: Environment Agency
Environment Agency (2005) 138_05 Guidance for Flood Warden Schemes: Environment Agency
Environment Agency (2005) 139_05 Guidance for Flood Warning Siren Schemes: Environment Agency
Environment Agency (2005) 140_05 Guidance for Flood Warning Loudhailer Schemes: Environment Agency
Environment Agency (2005) 141_05 Guidance for Flood Warning Interactive Signs: Environment Agency
Environment Agency (2005) 142_05 Guidance for Flood Forecasting level to level correlations: Environment Agency
Tapsell, S., Burton, R., Oakes, S. and Parker, D. (2004) The Social Performance of Flood Warning Communications Technologies. Flood Hazard Research Centre

Offices at Coleshill
Doncaster
Dublin
Edinburgh
Exeter
Glasgow
Haywards Heath
Isle of Man
Limerick
Newcastle upon Tyne
Newport
Peterborough
Saltaire
Skipton
Tadcaster
Thirsk
Wallingford
Warrington
Registered Office South Barn
Broughton Hall
SKIPTON
North Yorkshire
BD23 3AE
United Kingdom
t:+44(0)1756 799919
Jeremy Benn Associates Ltd
Registered in England 3246693
Visit our website
www.jbaconsulting.com