
Flood-Inundation Maps for the Elkhart River at Goshen, Indiana · Flood-Inundation Maps for the...
18
U.S. Department of the Interior U.S. Geological Survey Scientific Investigations Map 3269 Prepared in cooperation with the Indiana Office of Community and Rural Affairs Flood-Inundation Maps for the Elkhart River at Goshen, Indiana Pamphlet to accompany
Transcript of Flood-Inundation Maps for the Elkhart River at Goshen, Indiana · Flood-Inundation Maps for the...

U.S. Department of the InteriorU.S. Geological Survey
Scientific Investigations Map 3269
Prepared in cooperation with the Indiana Office of Community and Rural Affairs
Flood-Inundation Maps for the Elkhart River at Goshen, Indiana
Pamphlet to accompany

Cover. Simulated floods corresponding to a stage of 5.0, 9.0, and 13.0 feet at U.S. Geological Survey streamgage 04100500 on the Elkhart River and image of the Elkhart River downstream from the streamgage. Photograph by Edward Dobrowolski, U.S. Geological Survey.

Flood-Inundation Maps for the Elkhart River at Goshen, Indiana
By Kellan R. Strauch
Prepared in cooperation with the Indiana Office of Community and Rural Affairs
Pamphlet to accompany
Scientific Investigations Map 3269
U.S. Department of the InteriorU.S. Geological Survey

U.S. Department of the InteriorSALLY JEWELL, Secretary
U.S. Geological SurveySuzette M. Kimball, Acting Director
U.S. Geological Survey, Reston, Virginia: 2013
For more information on the USGS—the Federal source for science about the Earth, its natural and living resources, natural hazards, and the environment, visit http://www.usgs.gov or call 1–888–ASK–USGS.
For an overview of USGS information products, including maps, imagery, and publications, visit http://www.usgs.gov/pubprod
To order this and other USGS information products, visit http://store.usgs.gov
Any use of trade, firm, or product names is for descriptive purposes only and does not imply endorsement by the U.S. Government.
Although this information product, for the most part, is in the public domain, it also may contain copyrighted materials as noted in the text. Permission to reproduce copyrighted items must be secured from the copyright owner.
Suggested citation:Strauch, K.R., 2013, Flood-inundation maps for the Elkhart River at Goshen, Indiana: U.S. Geological Survey Scientific Investigations Map 3269, 9 sheets, 7-p. pamphlet, http://dx.doi.org/10.3133/sim3269.
ISSN 2329–132X (online)

iii
Acknowledgments
The author wishes to thank the many local, State, and Federal agencies that have cooperated in the funding for the operation and maintenance of the gages used for this study, especially the Indiana Department of Transportation. Special thanks are given to the City of Goshen and Elkhart County staff for their cooperation in this study by providing data and reviewing flood-inundation maps prior to publication, and to the National Weather Service for their continued support of the U.S. Geological Survey flood-inundation mapping initiative.

iv
Contents
Acknowledgments ........................................................................................................................................iiiAbstract ...........................................................................................................................................................1Introduction.....................................................................................................................................................1
Purpose and Scope ..............................................................................................................................2Study Area Description ........................................................................................................................2Previous Studies ...................................................................................................................................2
Constructing Water-Surface Profiles .........................................................................................................2Hydrologic and Steady-Flow Data .....................................................................................................4Topographic and Bathymetric Data ...................................................................................................4Energy-Loss Factors .............................................................................................................................4Model Calibration and Performance .................................................................................................5Development of Water-Surface Profiles ...........................................................................................5
Inundation Mapping ......................................................................................................................................6Elkhart River, Indiana, Flood-Inundation Maps on the Internet ....................................................6Disclaimer for Flood-Inundation Maps .............................................................................................6Uncertainties and Limitations Regarding Use of Flood-Inundation Maps ..................................6
Summary..........................................................................................................................................................7References Cited............................................................................................................................................7
Sheets[Sheets and additional materials are available online at http://pubs.usgs.gov/sim/3269/]
1–9. Estimated flood-inundation maps for the Elkhart River at Goshen, Indiana, referenced to the U.S. Geological Survey streamgage number 04100500 on the Elkhart River, and corresponding to a stage of:
1. 5.00 ft and an elevation of 774.03 ft (NAVD 88) 2. 6.00 ft and an elevation of 775.03 ft (NAVD 88) 3. 7.00 ft and an elevation of 776.03 ft (NAVD 88) 4. 8.00 ft and an elevation of 777.03 ft (NAVD 88) 5. 9.00 ft and an elevation of 778.03 ft (NAVD 88) 6. 10.00 ft and an elevation of 779.03 ft (NAVD 88) 7. 11.00 ft and an elevation of 780.03 ft (NAVD 88) 8. 12.00 ft and an elevation of 781.03 ft (NAVD 88) 9. 13.00 ft and an elevation of 782.03 ft (NAVD 88)
v
Figures 1. Map showing location of study reach for the Elkhart River, U.S. Geological Survey
streamgage, and National Weather Service forecast site ....................................................3
Tables 1. U.S. Geological Survey streamgage site information for the study area,
Elkhart River at Goshen, Indiana ................................................................................................4 2. Comparison of hydraulic-model output simulated and observed water-surface
elevations at the Elkhart River at Goshen, Indiana, station number 04100500 ...................5 3. Stages and water-surface elevations with corresponding discharge estimates
at selected locations along the Elkhart River at Goshen, Indiana, for simulated water-surface profiles .................................................................................................................5

vi
Conversion Factors
Inch/Pound to SI
Multiply By To obtainLength
foot (ft) 0.3048 meter (m)foot (ft) 30.48 centimeter (cm)mile (mi) 1.609 kilometer (km)
Areasquare foot (ft2) 0.09290 square meter (m2)square mile (mi2) 2.590 square kilometer (km2)
Flow ratecubic foot per second (ft3/s) 0.02832 cubic meter per second (m3/s)cubic foot per second per square
mile [(ft3/s)/mi2]0.01093 cubic meter per second per square
kilometer [(m3/s)/km2]Hydraulic gradient
foot per mile (ft/mi) 0.1894 meter per kilometer (m/km)
Vertical coordinate information is referenced to either (1) stage, the height above an arbitrary datum established at a streamgage, or (2) elevation, the height above North American Vertical Datum of 1988 (NAVD 88).
Horizontal coordinate information is referenced to the North American Datum of 1983 (NAD 83).
Altitude, as used in this report, refers to distance above the vertical datum.

Flood-Inundation Maps for the Elkhart River at Goshen, Indiana
By Kellan R. Strauch
AbstractThe U.S. Geological Survey (USGS), in cooperation with
the Indiana Office of Community and Rural Affairs, created digital flood-inundation maps for an 8.3-mile reach of the Elkhart River at Goshen, Indiana, extending from downstream of the Goshen Dam to downstream from County Road 17. The inundation maps, which can be accessed through the USGS Flood Inundation Mapping Science Web site at http://water.usgs.gov/osw/flood_inundation/, depict estimates of the areal extent and depth of flooding corresponding to nine selected water levels (stages) at the USGS streamgage at Elkhart River at Goshen (station number 04100500). Current conditions for the USGS streamgages in Indiana may be obtained on the Internet at http://waterdata.usgs.gov/. In addition, stream-stage data have been provided to the National Weather Service (NWS) for incorporation into their Advanced Hydrologic Pre-diction Service (AHPS) flood-warning system (http://water.weather.gov/ahps/). The NWS forecasts flood hydrographs at many places that are often collocated with USGS streamgages. NWS-forecasted peak-stage information may be used in conjunction with the maps developed in this study to show predicted areas of flood inundation.
In this study, flood profiles were computed for the stream reach by means of a one-dimensional step-backwater model. The model was calibrated using the most current stage-discharge relation at the Elkhart River at Goshen streamgage. The hydraulic model was then used to compute nine water-surface profiles for flood stages at 1-foot (ft) intervals refer-enced to the streamgage datum and ranging from approxi-mately bankfull (5 ft) to greater than the highest recorded water level (13 ft). The simulated water-surface profiles were then combined with a geographic information system (GIS) digital-elevation model (DEM), derived from Light Detec-tion and Ranging (LiDAR) data having a 0.37-ft vertical accuracy and 3.9-ft horizontal resolution in order to delineate the area flooded at each water level. The availability of these maps, along with Internet information regarding current stage from USGS streamgages and forecasted stream stages from the NWS, provide emergency management personnel and
residents with information that is critical for flood response activities such as evacuations and road closures as well as for postflood recovery efforts.
IntroductionThe City of Goshen in Elkhart County, Indiana (Ind.),
an urban community with a reported population of 31,719, is part of the Elkhart-Goshen Metro Area (pop. 197,561 in 2010; U.S. Census Bureau, 2010). Peak streamflows, since 1925, and continuous stage measurements, since 1931, have been recorded at a U.S. Geological Survey (USGS) streamgage on the Elkhart River at Goshen (station number 04100500). The peak discharge of record, 6,360 cubic feet per second (ft3/s) at a stage of 11.87 feet (ft; gage datum), occurred on Febru-ary 24, 1985. The most recent flood event with approved flow data (stage above 7 ft) occurred April 29, 2011, with a flow of 3,450 ft3/s and a stage of 7.99 ft. Flood plains within Goshen are moderately developed and contain a mix of residential and commercial structures.
Prior to this study, Goshen officials relied on several information sources (all of which are available on the Inter-net) to make decisions on how to best alert the public and mitigate flood damages. One source is the Federal Emer-gency Management Agency (FEMA) Flood Insurance Study (FIS) for Elkhart County, which includes the City of Goshen and is dated August 2, 2011 (Federal Emergency Manage-ment Agency, 2011). A second source of information is the USGS streamgage, Elkhart River at Goshen (station number 04100500), from which current or historical water lev-els (stages) can be obtained. A third source is the National Weather Service’s (NWS) Advanced Hydrologic Prediction Service (AHPS), which also displays current stage data from the USGS gage, as well as river forecasts of stage during times of high water. Although USGS current stage and NWS forecast stage information is particularly useful for residents in the immediate vicinity of a streamgage, it is of limited use to residents farther upstream or downstream because the water-surface elevation is not constant along the entire stream

2 Flood-Inundation Maps for the Elkhart River at Goshen, Indiana
channel. Also, FEMA and State emergency management mitigation teams or property owners typically lack information related to how deep the water is at locations other than near USGS streamgages or NWS flood-forecast points. In 2011–12, the USGS, in cooperation with the Indiana Office of Com-munity and Rural Affairs, conducted a study to produce a library of flood-inundation maps for an 8.3-mile (mi) reach of the Elkhart River at Goshen. The inundation maps depict estimates of the areal extent and depth of flooding correspond-ing to selected water levels (stages) at the USGS streamgage, Elkhart River at Goshen (station number 04100500).
Purpose and Scope
The purpose of this report is to describe the development of a series of maps showing the estimated flood-inundation extent for the Elkhart River at Goshen, Ind. The maps are accessed through the USGS Flood Inundation Mapping Sci-ence Web site at http://water.usgs.gov/osw/flood_inundation/ and the NWS AHPS Web site at http://water.weather.gov/ahps/. Internet users can select estimated inundation maps that correspond to (1) current stage at the USGS streamgage, (2) the NWS-forecasted peak stage, or (3) other stream stages of interest.
The scope of the study was limited to the Elkhart River from downstream of Goshen Dam to a point 5,450 ft down-stream from the County Road 17 bridge (fig. 1). Tasks specific to development of the maps were:1. collection of topographic and bathymetric data for
selected cross sections and geometric data bridges along the study reach,
2. estimation of energy-loss factors (roughness coefficients) in the stream channel and flood plain, and determination of steady-flow data,
3. computation of water-surface profiles using the U.S. Army Corps of Engineers (USACE) HEC–RAS computer program (U.S. Army Corps of Engineers, 2010),
4. production of estimated flood-inundation maps at various stream stages using the USACE’s HEC–GeoRAS com-puter program (U.S. Army Corps of Engineers, 2009) and a geographic information system (GIS), and
5. preparation of the maps, both as polygon shapefiles that depict the areal extent of flood inundation and as depth grids that provide the depth of flood waters, as displayed on the USGS Flood Inundation Mapper web site (http://wim.usgs.gov/FIMI/), which can be accessed through the USGS Flood Inundation Mapping Science Web site at http://water.usgs.gov/osw/flood_inundation/. Methods used were generally cited from previously
published reports. If techniques varied significantly from previously documented methods because of local hydrologic conditions or available data, they are described in detail in
this report. Maps were produced for water levels referenced to the Elkhart River stage at the Goshen streamgage, which ranged from approximately bankfull (5 ft above gage datum) to greater than the maximum observed water level (13 ft) at the streamgage.
Study Area Description
The study reach of the Elkhart River is in Elkhart County in north-central Indiana. The drainage area ranges from 584 square miles (mi2) at the outlet of Goshen Dam Pond to 643 mi2 at the downstream extent of the study reach. The drainage area at the Elkhart River at Goshen streamgage is 594 mi2. The stream’s headwaters originate in Noble County, Ind., and the stream flows generally to the northwest before entering the city limits. One major tributary to the Elkhart River, Rock Run Creek (drainage area 42 mi2), joins the main stem as it flows through Goshen. The basin terrain is generally flat. The study reach is approximately 8.3 mi long and has an average top-of-bank channel width of 186 ft and an average channel slope of 2.38 feet per mile (ft/mi) or 0.00045. About 49 percent of the land contiguous to the study reach is classi-fied as urban or developed, 7 percent as forest, and 4 percent as cropland (Homer and others, 2007). The study area is still undergoing development, and the population has increased 8 percent from 29,383 to 31,719 between 2000 and 2010 (U.S. Bureau of Census, 2010). The main channel within the study reach is bridged by six major roads and a railroad.
Previous Studies
Although the current countywide FIS became effective in 2011 (Federal Emergency Management Agency, 2011), the data contained therein that deals with flooding in the City of Goshen is from the original FIS completed by Clyde E. Williams and Associates in 1977 (Federal Emergency Man-agement Agency, 2011). That study provided information on the 10-, 2-, 1- and 0.2-percent annual exceedance probability water-surface profiles and associated 1- and 0.2-percent flood-plain maps for the Elkhart River and Rock Run Creek. The water-surface profiles and the flood frequencies on which they were based have not been updated since 1977; however, the flood-plain maps in the 2011 FIS do include revised flood-inundation delineations that were based on updated, detailed land-surface elevation data made possible by the use of Light Detection and Ranging (LiDAR).
Constructing Water-Surface ProfilesThe water-surface profiles used to produce the nine
flood-inundation maps in this study were computed using HEC–RAS, version 4.1.0 (U.S. Army Corps of Engineers, 2010). HEC–RAS is a one-dimensional step-backwater model

Constructing Water-Surface Profiles 3
!.
85°50'85°52'30"
41°37'30"
41°35'
0410050004100500
Goshen
33
ELKHART ROAD
WEST WILDEN AVENUE
4WEST LINCOLN AVENUE
COUNTY ROAD 17
119
33
WEST PIKE STREET
15
15
Elkhart
River
Goshen Dam Pond
Hydraulic
Canal
INDIANA
Studyarea
EXPLANATION
15
03363900
33
Levee
Limit of study area
Flow arrow—Indicates directionof water flow
U.S. Geological Survey streamgage and number
State route marker
U.S. route marker
Projection: Indiana State Plane Eastern ZoneHorizontal coordinate information is referenced to the North American Datum of 1983Orthophotography from Esri ArcGIS World Imagery, 2011, available at http://goto.arcgisonline.com/maps/World_Imagery
0 0.5 1 MILE
0 0.5 1 KILOMETER
Figure 1. Location of study reach for the Elkhart River, U.S. Geological Survey streamgage, and National Weather Service forecast site.
4 Flood-Inundation Maps for the Elkhart River at Goshen, Indiana
for simulation of water-surface profiles with gradually varied, steady-state (or unsteady-state) flow computation options. The HEC–RAS analysis for this study was done using the steady-state flow computation option.
Hydrologic and Steady-Flow Data
The study area hydrologic network consists of one streamgage (04100500; fig. 1; table 1). Water level (stage) is measured continuously at the site, and the continuous record of streamflow is computed for the site. All water-surface elevations reported herein are referenced to the North Ameri-can Vertical Datum of 1988 (NAVD 88). The gage is equipped with a satellite radio transmitter that allows these data to be transmitted routinely for posting on the Internet within an hour of collection.
Steady-flow data consisted of flow regime, boundary condition set to normal depth, and peak-discharge information. Because there are no major tributaries from the upstream limit of the study area to the Elkhart River at Goshen streamgage, flow data for the upstream end of the study reach were obtained from the current stage-to-discharge relation, which has been developed from measurements of streamflow at the Elkhart River at Goshen streamgage. For the downstream part of the study reach, discharge recorded at the streamgage was increased proportional to the drainage-area ratio to account for the expected increase in flows from Rock Run Creek, a tributary that enters the study reach about 403 ft downstream from the West Wilden Avenue bridge. These adjusted flow values were used in the model from the confluence of Rock Run Creek and Elkhart River to the downstream limit of the study reach.
Topographic and Bathymetric Data
Channel cross sections were surveyed by USGS per-sonnel during April 2012 for locations. These cross sections provided detailed channel-elevation data below the water surface and were collected using hydroacoustic instrumenta-tion to measure depth and Differential Global Positioning System (DGPS) instrumentation to determine horizontal position. All topographic data used in this study are referenced vertically to NAVD 88 and horizontally to the North American Datum of 1983 (NAD 83). Cross-section elevation data for
flood-plain areas were obtained from a LiDAR-derived digital elevation model (DEM). The LiDAR data were collected during April 2010 by AeroMetric, Inc., Sheboygan, Wiscon-sin, and postprocessing of these data also was completed by AeroMetric, Inc. The original LiDAR data have horizontal accuracy of 1.02 ft (31 centimeters), horizontal resolution of 3.9 ft (1.2 meters), and vertical accuracy of 0.37 ft at a 95-percent confidence level for the “open terrain” land-cover category (root mean squared error of 0.19 ft [5.8 centimeters]). Although a finer horizontal resolution of the DEM was pos-sible given the accuracy of the LiDAR data, the final DEM was resampled to a grid-cell size of 10 square feet (ft2) to decrease GIS processing time.
Seven bridges and roadway embankments, and one levee, in and along the stream affect or have the potential to affect water-surface elevations during floods. To properly account for these features in the model, structural dimensions for three bridges (West Plymouth Avenue, River Avenue, and West Wilden Avenue) were measured and surveyed in the field concurrently with the stream-channel surveys. Dimensions for West Lincoln Avenue, West Pike Street, and the railroad bridges were obtained from input data for a HEC–2 hydraulic model, which was developed in 1977 and is still the basis for the water-surface profiles and flood maps that are presented in the currently effective FIS (Federal Emergency Manage-ment Agency, 2011). Structural dimensions for the County Road 17 bridge were obtained from design plans provided by the Elkhart County Highway Department (Thomas Rushlow, Elkhart County Highway Department, written commun., June 2012 ). A detailed description of the methods used to acquire and process the topographic and bathymetric data can be found in Bales and others (2007). The Roger’s Park Levee runs longitudinally next to the stream between West Lincoln Avenue and West Pike Street. The levee protects the Roger’s Park area from flood waters for water-surface elevations below 776.03 ft NAVD 88, but at water-surface elevations above 776.03 feet the levee is overtopped and the area behind it is inundated with flood waters.
Energy-Loss Factors
Field observations and high-resolution aerial photo-graphs were used to select initial (precalibration) Manning’s roughness coefficients (“n” values) for energy (friction) -loss
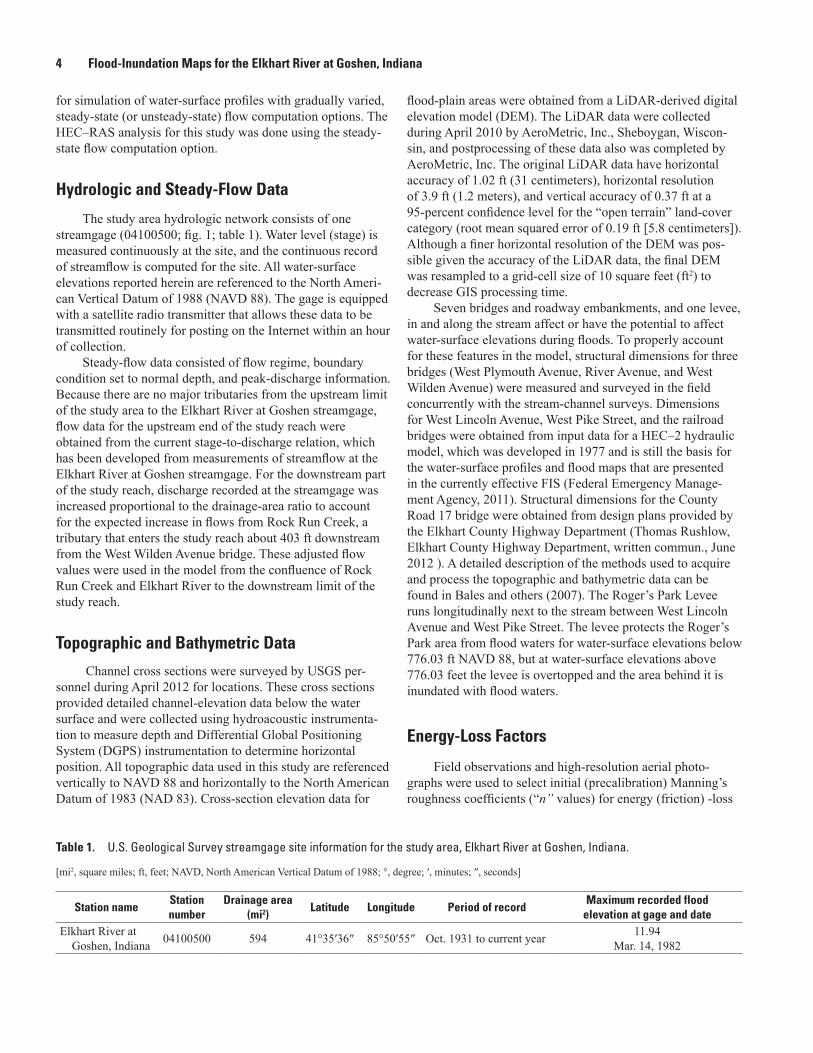
Table 1. U.S. Geological Survey streamgage site information for the study area, Elkhart River at Goshen, Indiana.
[mi2, square miles; ft, feet; NAVD, North American Vertical Datum of 1988; °, degree; ′, minutes; ″, seconds]
Station nameStation number
Drainage area (mi2)
Latitude Longitude Period of recordMaximum recorded flood
elevation at gage and dateElkhart River at
Goshen, Indiana 04100500 594 41°35′36″ 85°50′55″ Oct. 1931 to current year 11.94 Mar. 14, 1982

Constructing Water-Surface Profiles 5
calculations. The final Manning’s n values used ranged from 0.040 to 0.052 for the main channel and 0.088 to 0.165 for the overbank areas modeled in this analysis.
Model Calibration and Performance
The hydraulic model was calibrated to the most current stage-discharge relation at the USGS streamgage 04100500, Elkhart River at Goshen, Ind. Model calibration was accom-plished by adjusting Manning’s n values until the results of the hydraulic computations closely agreed with the measured
flood discharge and stage values. Differences between mea-sured and simulated water levels for measured or rated flows at USGS gaging station 04100500 were equal to or less than 0.02 ft (table 2). Details on techniques used in model develop-ment and calibration can be found in Bales and others (2007).
Development of Water-Surface Profiles
Water-surface profiles were developed for a total of nine discharges corresponding to flood stages at 1-ft intervals between 5 and 13 ft above the gage datum (that is, water-level elevations ranging from 774.03 to 782.03 ft, NAVD 88), as referenced to the USGS streamgage 04100500, Elkhart River at Goshen, Ind. Discharges corresponding to the various index stages were obtained from the most current stage-discharge relation (no. 20.0) for the streamgage and were applied to the upstream half of the modeled reach, that is, from Goshen Dam to the confluence of Rock Run Creek with Elkhart River. For the downstream part of the study reach, discharge recorded at the streamgage was increased proportional to the drainage-area ratio to account for the expected increase in flows from Rock Run Creek. The assumption inherent in this calcula-tion is that runoff in the Elkhart River Basin is distributed uniformly in time and space, and that the unit-area runoff, in cubic feet per second per square mile ((ft3/s)/mi2), in the Rock Run Creek Basin is equal to that in the Elkhart River Basin upstream from the streamgage at Goshen. Discharges for the nine profiles based on the stage-discharge relation at the Goshen gage and the adjusted discharges that were applied for the reach downstream from Rock Run Creek, are listed in table 3. Drainage area for Rock Run Creek was calculated using a USGS web-based GIS application, called StreamStats, which was accessed at http://water.usgs.gov/osw/streamstats/indiana.html.
Table 2. Comparison of hydraulic-model output simulated and observed water-surface elevations at the Elkhart River at Goshen, Indiana, streamgage (station number 04100500).
[ft, feet; NAVD 88, North American Vertical Datum of 1988]
Stage (ft)1
Measured water-surface elevation
(ft, NAVD 88)1
Modeled water-surface elevation
(ft, NAVD 88)
Elevation difference
(ft)
5.0 774.03 774.01 0.026.0 775.03 775.03 0.007.0 776.03 776.04 -0.018.0 777.03 777.04 -0.019.0 778.03 778.02 0.01
10.0 779.03 779.04 -0.0111.0 780.03 780.04 -0.0112.0 781.03 781.04 -0.0113.0 782.03 782.03 0.00
1Values derived from rating curve no. 20 at U.S. Geological Survey gaging station 04100500.
Table 3. Stages and water-surface elevations with corresponding discharge estimates at selected locations along the Elkhart River at Goshen, Indiana, for simulated water-surface profiles.
[mi2, square miles; ft, feet; ft3/s, cubic feet per second; stage, in feet above gage datum; values in parentheses are water-surface elevations, in feet above the North American Vertical Datum of 1988]
LocationDrainage
area (mi2)
Stage (ft)5 6 7 8 9 10 11 12 13
(774.03) (775.03) (776.03) (777.03) (778.03) (779.03) (780.03) (781.03) (782.03)Discharge (ft3/s)
U.S. Geological Survey streamgage 04100500 594 1,460 2,080 2,750 3,450 4,130 4,810 5,500 6,220 7,000
Downstream from confluence with Rock Run Creek 630 1,549 2,206 2,917 3,659 4,380 5,102 5,834 6,597 7,425
Map sheet number 1 2 3 4 5 6 7 8 9

6 Flood-Inundation Maps for the Elkhart River at Goshen, Indiana
Inundation MappingFlood-inundation maps were created for the nine water-
surface profiles simulated for the Elkhart River. The maps were created in a GIS by combining the water-surface profiles and DEM data. The DEM was derived from LiDAR data with 3.9-ft horizontal resolution and a vertical accuracy of 0.37 ft. Although a finer resolution of the DEM was possible given the accuracy of the LiDAR data, the final DEM had a grid-cell size of 10 ft2 to decrease the GIS processing time. Estimated flood-inundation boundaries along each simulated profile were developed using HEC–GeoRAS software (U.S. Army Corps of Engineers, 2009). HEC–GeoRAS is a set of procedures, tools, and utilities that facilitates processing geospatial data in ArcGIS by providing a graphical user interface (Whitehead and Ostheimer, 2009). The interface allows the preparation of geometric data for import into HEC–RAS and processes simulation results exported from HEC–RAS (U.S. Army Corps of Engineers, 2010). USGS personnel then modified the HEC–GeoRAS results to ensure a hydraulically reasonable transition of the boundaries between modeled cross sections relative to the contour data for the land surface (Whitehead and Ostheimer, 2009). The resultant maps were compiled to show estimated flood-inundated areas overlaid onto high-resolution, georeferenced aerial orthophotographs of the study area for each of the water-surface profiles that were simulated by the hydraulic model.
Elkhart River, Indiana, Flood-Inundation Maps on the Internet
The flood-inundation maps and study documentation are available online at the USGS Publications Warehouse (http://pubs.usgs.gov/sim/3269/). Also, a Flood Inundation Mapping Science Web site has been established at http://water.usgs.gov/osw/flood_inundation/ to provide a portal for USGS flood-inundation study information to the public. That Web portal has a link (http://wim.usgs.gov/FIMI/FloodInundationMapper.html) to interactive online map libraries that can be down-loaded in several commonly used electronic file formats for GIS dataset viewers. At the map library site, each stream reach displayed contains further links to NWISWeb graphs of the current stage and streamflow at USGS streamgage 04100500, to which the inundation maps are referenced. A link also is provided to the NWS AHPS site (http://water.weather.gov/ahps/) so that the user can obtain applicable information on forecasted peak stage. The estimated flood-inundation maps are displayed in sufficient detail to note the extent of flood-ing with respect to individual structures so that preparations for flooding and decisions for emergency response can be performed efficiently. Roadways and bridges were closely reviewed and are shown as shaded (inundated and likely impassable) or not shaded (dry and passable) to facilitate
emergency planning and use. However, buildings that are shaded do not reflect inundation but denote that bare earth surfaces in the vicinity of the buildings are inundated. When the simulated water depth (as indicated in the Web Mapping Application by holding the cursor over an inundated area) in the vicinity of a building of interest exceeds that building’s height, the structure can be considered fully submerged.
Disclaimer for Flood-Inundation Maps
Inundated areas shown should not be used for navigation, regulatory, permitting, or other legal purposes. The USGS provides these maps “as is” for a quick reference, emergency planning tool but assumes no legal liability or responsibility resulting from the use of this information.
Uncertainties and Limitations Regarding Use of Flood-Inundation Maps
Although the flood-inundation maps represent the bound-aries of inundated areas with a distinct line, some uncertainty is associated with these maps. The flood boundaries shown were estimated based on water stages and streamflows at USGS streamgage 04100500, Elkhart River at Goshen, Ind. Water-surface elevations along the stream reaches were estimated by steady-state hydraulic modeling, assuming unobstructed flow, and using streamflows and hydrologic conditions anticipated at the USGS streamgage. The hydraulic model reflects the land-cover characteristics and any bridge, dam, levee, or other hydraulic structures existing as of Sep-tember 2011. Unique meteorological factors (timing and dis-tribution of precipitation) may cause actual streamflows along the modeled reach to vary from those assumed during a flood, which may lead to deviations in the water-surface elevations and inundation boundaries shown. Additional areas may be flooded because of unanticipated conditions such as: changes in the streambed elevation or roughness, backwater into major tributaries along a main-stem river, or backwater from local-ized debris or ice jams. The accuracy of the floodwater extent portrayed on these maps will vary with the accuracy of the DEM used to simulate the land surface. Additional uncertain-ties and limitations pertinent to this study may be described elsewhere in this report.
If this series of flood-inundation maps will be used in conjunction with NWS river forecasts, the user should be aware of additional uncertainties that may be inherent or fac-tored into NWS forecast procedures. The NWS uses forecast models to estimate the quantity and timing of water flowing through selected stream reaches in the United States. These forecast models (1) estimate the amount of runoff generated by precipitation and snowmelt, (2) simulate the movement of floodwater as it proceeds downstream, and (3) predict the flow and stage (and water-surface elevation) for the stream at

References Cited 7
a given location (AHPS forecast point) throughout the forecast period (every 6 hours and 3 to 5 days out in many locations). In the case of Elkhart River at Goshen, forecasts are issued as needed during times of high water, but are not routinely avail-able at the time of this report (2013). For more information on AHPS forecasts, please see: http://water.weather.gov/ahps/pcpn_and_river_forecasting.pdf.
SummaryThe U.S. Geological Survey (USGS), in cooperation with
the Indiana Office of Community and Rural Affairs, produced digital flood-inundation maps for an 8.3-mile reach of the Elkhart River at Goshen, Indiana, extending from downstream of the Goshen Dam to 5,450 feet (ft) downstream from the County Road 17 bridge. The inundation maps, which can be accessed at the USGS Flood Inundation Mapping Science Web site at http://water.usgs.gov/osw/flood_inundation/, depict estimates of the areal extent and depth of flooding correspond-ing to selected water levels (stages) at the USGS streamgage 04100500, Elkhart River at Goshen, Ind. The nine flood stages selected range from approximately bankfull (5 ft above gage datum) to greater than the maximum observed water level (13 ft) at the streamgage. Current conditions for the USGS streamgages in Indiana may be obtained on the Internet at http://waterdata.usgs.gov/nwis/. In addition, stream stage data have been provided to the National Weather Service (NWS) for incorporation into their Advanced Hydrologic Prediction Service (AHPS) flood warning system (http://water.weather.gov/ahps/). The NWS forecasts flood hydrographs at many places that are often collocated with USGS streamgages. NWS-forecasted peak-stage information may be used in conjunction with the maps developed in this study to show predicted areas of flood inundation.
In this study, nine flood profiles were computed for the stream reach by means of a one-dimensional step-backwater model. The model was calibrated using the most current stage-discharge relation at the Elkhart River at Goshen streamgage. The hydraulic model generated water-surface profiles for flood stages at 1-ft intervals referenced to the streamgage datum and ranging from approximately bankfull (5 ft, gage datum) to greater than the highest recorded water level. The simulated water-surface profiles were then combined with a geographic information system digital-elevation model (derived from Light Detection and Ranging (LiDAR) data having a 0.37-ft vertical and 3.9-ft horizontal resolution) in order to delineate the area flooded at each water level. The availability of these maps, along with Internet information regarding current stage from USGS streamgages and forecasted stream stages from the NWS, provide emergency management personnel and residents with information that is critical for flood response activities such as evacuations and road closures as well as for postflood recovery efforts.
References Cited
Bales, J.D., Wagner, C.R., Tighe, K.C., and Terziotti, Silvia, 2007, LiDAR-derived flood-inundation maps for real-time flood-mapping applications, Tar River Basin, North Carolina: U.S. Geological Survey Scientific Investigations Report 2007–5032, 42 p.
Federal Emergency Management Agency, 2011, Flood insur-ance study, Elkhart County, Indiana, and incorporated areas: Washington D.C., Federal Emergency Management Agency, 40 p., 17 pl.
Homer, C., Dewitz, J., Fry, J., Coan, M., Hossain, N., Larson, C., Herold, N., McKerrow, A., VanDriel, J.N., and Wick-ham, J., 2007, Completion of the 2001 National Land Cover Database for the Conterminous United States, Photogram-metric Engineering and Remote Sensing, v. 73, no. 4, p. 337–341.
U.S. Army Corps of Engineers, 2009, HEC–GeoRAS, GIS tools for support of HEC–RAS using ArcGIS—User’s manual, version 4.2: Davis, California, U.S. Army Corps of Engineers, Hydrologic Engineering Center, [variously paged].
U.S. Army Corps of Engineers, 2010, HEC–RAS River Analy-sis System hydraulic reference manual, version 4.1: Davis, California, U.S. Army Corps of Engineers, Hydrologic Engineering Center, [variously paged].
U.S. Census Bureau, 2010, American FactFinder: accessed September 27, 2012, at http://factfinder2.census.gov.
Whitehead, M.T., and Ostheimer, C.J., 2009, Development of a flood-warning system and flood-inundation mapping for the Blanchard River in Findlay, Ohio: U.S. Geological Survey Scientific Investigations Report 2008–5234, 9 p.


Publishing support provided by: Columbus and West Trenton Publishing Service Centers
For more information concerning this publication, contact:Director, Indiana Water Science CenterU.S. Geological Survey5957 Lakeside Blvd.Indianapolis, IN 46278(317) 290–3333
Or visit the Indiana Water Science Center Web site at:http://in.water.usgs.gov/

Strauch—Flood-Inundation M
aps for the Elkhart River at Goshen, Indiana—
Scientific Investigations Map 3269
ISSN 2329–132X (online)
http://dx.doi.org/10.3133/sim3269


