
Flight-to-liquidity flows in the euro area sovereign debt ... · FLIGHT TO LIQUIDITY FLOWS IN THE...
35
FLIGHT TO LIQUIDITY FLOWS IN THE EURO AREA SOVEREIGN DEBT CRISIS Juan Ángel García and Ricardo Gimeno Documentos de Trabajo N.º 1429 2014
Transcript of Flight-to-liquidity flows in the euro area sovereign debt ... · FLIGHT TO LIQUIDITY FLOWS IN THE...

FLIGHT)TO)LIQUIDITY FLOWS IN THE EURO AREA SOVEREIGN DEBT CRISIS
Juan Ángel García and Ricardo Gimeno
Documentos de Trabajo N.º 1429
2014

FLIGHT-TO-LIQUIDITY FLOWS IN THE EURO AREA SOVEREIGN DEBT CRISIS
FLIGHT-TO-LIQUIDITY FLOWS IN THE EURO AREA
SOVEREIGN DEBT CRISIS (*)
Juan Ángel García (**) EUROPEAN CENTRAL BANK
Ricardo Gimeno (***)
BANCO DE ESPAÑA
(*) We are grateful to Hans Dewachter, Simone Manganelli, Daisuke Miyakawa, Juan Nave, Paolo Pasquariello, Fulvio Pegoraro, Gabriel Pérez-Quirós, Marcello Pericolli, Marti Subrahmanyam and numerous colleagues and seminar participants at the Banco de España, the 2013 Finance Forum, the 1st International Conference on Sovereign Bond Markets at Waseda University in Tokio, the Third Joint Bank of Canada Banco de España Workshop on “International Financial markets” and an anonymous referee for comments and suggestions on earlier drafts. All remaining errors are our responsibility. We are also grateful to Francisco Alonso and Eduardo Maqui for their research assistance. The views expressed are those of the authors and do not necessarily reflects those of the ECB or the Banco de España. (**) Capital Markets Division, European Central Bank, Kaiserstrasse 29, D-60311 Frankfurt am Main, Germany. Contact: [email protected] (***) Corresponding author, Servicio de Estudios, Banco de España, Alcalá 48, 28014 Madrid, Spain. Contact: [email protected]
Documentos de Trabajo. N.º 1429 2014

The Working Paper Series seeks to disseminate original research in economics and fi nance. All papers have been anonymously refereed. By publishing these papers, the Banco de España aims to contribute to economic analysis and, in particular, to knowledge of the Spanish economy and its international environment.
The opinions and analyses in the Working Paper Series are the responsibility of the authors and, therefore, do not necessarily coincide with those of the Banco de España or the Eurosystem.
The Banco de España disseminates its main reports and most of its publications via the Internet at the following website: http://www.bde.es.
Reproduction for educational and non-commercial purposes is permitted provided that the source is acknowledged.
© BANCO DE ESPAÑA, Madrid, 2014
ISSN: 1579-8666 (on line)
Abstract
In periods of market stress, portfolio reallocations in bond markets reflect both safety and
liquidity concerns. Using sovereign and national agency bonds, we construct indicators
of liquidity premia in major euro area bond markets; we document the weakening of the
correlation between core and periphery market liquidity during the euro area sovereign bond
crisis; and we identify several episodes of significant flight-to-liquidity (FTL) flows above and
beyond flight-to-safety (FTS) spells in the period 2009-13. We show that FTL flows led to
significant inverse moves in sovereign bond yields in euro area core and periphery markets.
Moreover, FTL flows triggered declines in core and periphery stock markets and are
associated with lower macroeconomic confidence in the euro area as a whole, which
underscores the importance of FTL episodes for investors and policymakers alike.
Keywords: liquidity premia, flight to liquidity, flight to safety, sovereign debt crisis.
JEL Classification: G01, G12, H63.
Resumen
En períodos de tensión en los mercados financieros, recomposiciones en las carteras de
renta fija pueden generarse por la preocupación no solo por el riesgo de crédito, sino
también por el riesgo de liquidez. Usando información de bonos emitidos por Gobiernos y
agencias públicas, construimos indicadores de las primas de liquidez en los principales
mercados de bonos de la zona del euro, mostrando el debilitamiento de la correlación en
la liquidez de los mercados de los países del núcleo y de la periferia durante la crisis de la
deuda soberana europea, e identificando varios episodios de significativos flujos de huida a
la liquidez (flight-to-liquidity, FTL), además de los flujos de huida a la seguridad (flight-to-
safety, FTS), durante el período 2009-2013. El análisis demuestra que los flujos FTL
provocaron movimientos significativos en direcciones opuestas en los rendimientos de los
bonos soberanos entre los mercados de los países centrales y de la periferia de la zona del
euro. Por otra parte, los flujos de FTL produjeron descensos en todos los mercados de
valores de la zona del euro y están asociados, a escala macroeconómica, con una menor
confianza económica en el conjunto de la zona del euro, lo que pone de relieve la
importancia de los episodios FTL tanto para los inversores como para la toma de
decisiones de política económica.
Palabras clave: prima de liquidez, huida a la liquidez, huida a la seguridad, crisis de deuda
soberana.
Códigos JEL: G01, G12, H63.
BANCO DE ESPAÑA 7 DOCUMENTO DE TRABAJO N.º 1429
1 Introduction
In periods of market stress, extreme and inverse market movements in the bond and equity
markets are often referred to as “flights to safety” or “flights to quality”. Such episodes were
relatively frequent during the sovereign debt crisis in the euro area. The decrease in value of
periphery sovereign debt was undoubtedly related to changes in perceived default
probabilities and thereby in the increase in the required premium for bearing that credit risk.
Under those circumstances, some market participants were willing to decrease their portfolio
exposure to securities bearing the perceived higher credit risk triggering sudden swings in
bond prices. In an influential paper, Baele et al. (2013) document flight-to-safety episodes in
more than 20 bond markets and show that such episodes are important to understand
developments in major bond markets.
Flights to safety episodes may be however related not only to flights to quality but
also about flights to liquidity. In periods of market turbulence, the liquidity of the bonds, i.e.
the capacity to undo positions at reasonable costs, is also an important concern for bond
market investors. Abrupt changes in bond prices may therefore be the result of flight to
liquidity episodes when market participants suddenly prefer to hold highly liquid securities
rather than less liquid ones, thereby requesting a higher premium for holding the less liquid
bonds, in addition to or even regardless their credit risk.
Developments in euro area bond markets in the period 2009-13 are an important
example of the relevance of flight to safety and flight to liquidity episodes. As an illustration,
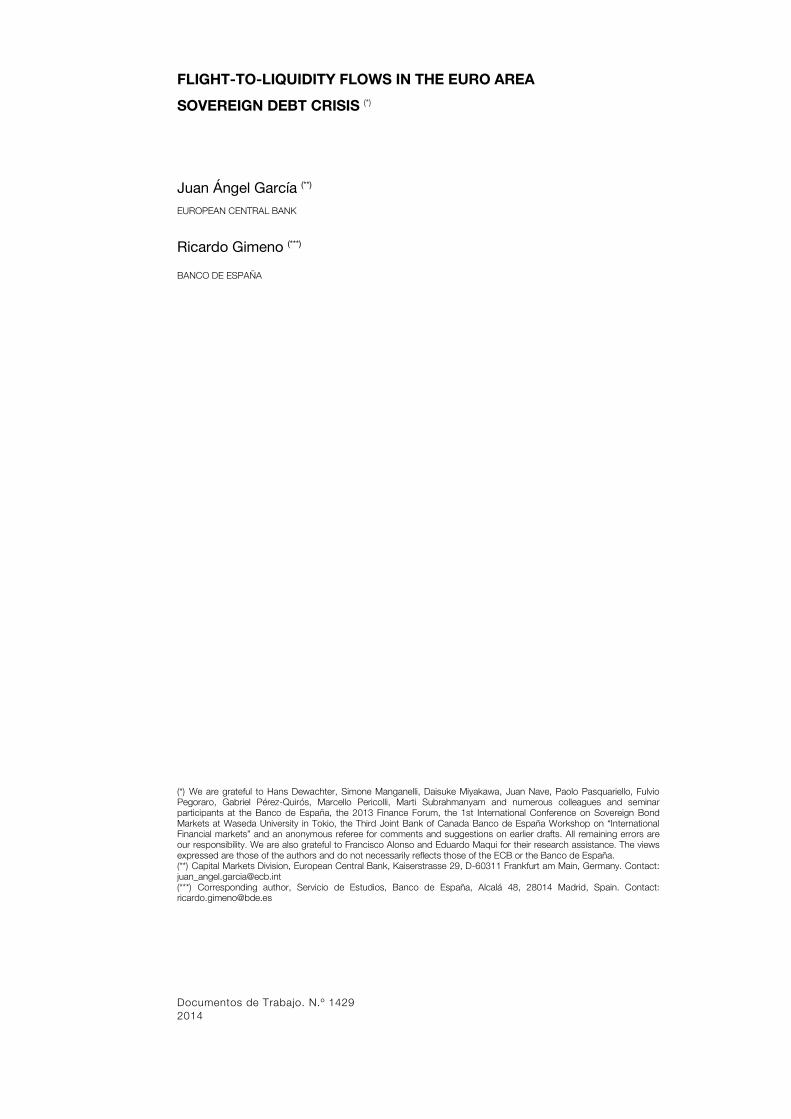
Figures 1 depict a simple decomposition of sovereign bond yields in three major euro area
countries (Germany, Spain and France) using OIS rates as proxy for risk-free interest rates
and CDS premia as proxy for credit risk compensation.
Figure 1: Five-year sovereign bond yields compared to the sum of OIS rates and CDS premia
Note: 5-year spot yield of the sovereign (blue line) and the sum of the 5-year Overnight Interest Rate Swap (OIS) rate and the 5-year CDS (percentage points, red line), as well as the difference between both series (green line). Left chart represent data for Spain, centre chart for France, and right one for Germany.
While the combined effect of monetary policy expectations and credit risk
compensation help mimic quite well developments in observed sovereign yields in those
markets, it is also evident that both effects are insufficient to fully explain the observed bond
yields, leaving more than 100 basis points unaccounted for at times and stressing the role of
flight to liquidity flows.
-2
-1
0
1
2
3
4
5
6
7
8
08 09 10 11 12 13 14
Sovereign (Spain) OIS+CDS (Spain) Difference
-1
0
1
2
3
4
5
6
08 09 10 11 12 13 14
Sovereign (France) OIS+CDS (France) Difference
-1
0
1
2
3
4
5
6
08 09 10 11 12 13 14
Sovereign (Germany) OIS+CDS (Germany) Difference
BANCO DE ESPAÑA 8 DOCUMENTO DE TRABAJO N.º 1429
Against this background, the goal of this paper is to investigate the dynamics of
liquidity premium in euro area bond markets during the financial and sovereign debt crisis. In
particular, we show that flight to liquidity flows were an important dimension of the
turbulences experienced in bond markets during the global financial crisis and in particular in
the euro area bond markets, beyond and above flight to safety episodes.
A major challenge to analyse the impact of liquidity considerations in sovereign bond
yields is that the liquidity premium is unobservable, so its identification relies on the use of some
proxies that imperfectly capture some aspects of liquidity (e.g.: traded volumes, bid-ask
spreads). Unfortunately, such measures are not always available or their reliability differs across
bond markets, which makes it difficult drawing sound conclusions for multi-country analysis.
In this paper, we take a more direct approach by looking at more direct proxies of
liquidity premium. To measure changes in liquidity premium in individual bond markets, we
calculate yield spreads between sovereign bonds and equivalent bonds issued by government
sponsored agencies of Germany (Kreditanstalt fur Wiederaufbau, KfW), France (Caisse
d’Amortissement de la Dette Sociale, CADES) and Spain (Instituto de Crédito Oficial, ICO).
Specifically, we estimate both sovereign and agency zero-coupon term structures of bond yields
and calculate the spreads at the five year maturity for three of the largest bond markets in the
euro area: Germany, France and Spain. The rationale is that, being fully guaranteed by the
governments, the bonds issued by such agencies have the same credit risk as the bonds
issued by the respective treasuries, and yield spreads, therefore, provide evidence of the liquidity
premium in each bond market. Longstaff (2004) indeed showed that agency spreads capture a
substantial part of the flight to safety episodes in the US bond market using yield spreads
between US Treasuries and bonds issued by the Resolution Funding Corporation (Refcorp).
We analyse the time-varying co-movement of liquidity premium across those three
euro area bond markets in recent years and document significant swings in liquidity premium
in euro area bond markets between 2008 and 2013. Following the collapse of Lehman
Brothers, liquidity premium rose across all bond markets as a result of strong flight-to safety
flows. Later on, however, the unfolding of the sovereign debt crisis in some euro area
countries led to a gradual increase in the market discrimination across sovereign issuers with
strong episodes of flight-to-liquidity since late 2009 between Spanish and AAA-rated
sovereign bonds (French and German ones) and from 2011 even between AAA-rated bonds.
To isolate pure flight to liquidity effects from those associated with more general flight
to safety episodes in sovereign bond markets, we estimate a dynamic two-factor model using
the liquidity spreads for Germany, France and Spain. Since one of the factors is strongly
related to stock market volatility and therefore helps account for the influence to flight to
safety flows, the second factor allows us to identify liquidity effects more directly linked to
flight to liquidity flows.
We show that flight to liquidity was an important element of the financial turbulences
during the euro area debt crisis. The reaction in euro area sovereign bond markets was clearly
asymmetric: while sovereign yields from “stressed” countries (Spain, Italy, Greece, Portugal
and Ireland) increased as a result of flight to liquidity flows, yields of “core” countries
(Germany, France, Austria, Belgium, Finland and The Netherlands) decreased significantly.
Moreover the yield impact of flight to liquidity flows was sizeable: our estimates suggest a
variation in Spanish five-year sovereign bond yield of around 80 basis points during the crisis
solely as a result of flight to liquidity pressure.

BANCO DE ESPAÑA 9 DOCUMENTO DE TRABAJO N.º 1429
The importance of flight to liquidity flows is further underscored by the fact that their
effects extended well beyond sovereign bond markets. We show that euro area stock
markets were negatively affected by flight to liquidity flows. In stark contrast to bond markets,
stock markets in both core and stressed countries exhibited significant declines in returns
during flight to liquidity episodes, even after controlling for a potential simultaneous flight to
safety effects. Furthermore, we also find evidence of deterioration in economic confidence
associated to flight to liquidity episodes, which suggest that such episodes were perceived
not only by financial market investors but by economic agents in general as an important
element of the euro area crisis that should be taken into account.
Our results provide strong evidence in support of market liquidity playing an
important role to understand movements in sovereign yield spreads in the euro area in recent
years. Beber et al. (2009) already showed that even before the financial and debt crisis in
times of market stress, investors in the Euro-area sovereign bond market demand liquidity
rather than credit quality in their portfolios. Our evidence based on the available agency
spreads for three different countries suggests that such practices are likely to have intensified
in recent years as a result of the financial and sovereign debt crisis. Schwarz (2010) also uses
KfW spreads as proxies for liquidity in euro area bond markets. There is also an ample
theoretical literature arguing in favour of the presence of significant effects of liquidity in asset
pricing (e.g.: Vayanos, 2004; Caballero and Krishnamurthy, 2008; Brunnermeier and
Pedersen, 2009, among others).
The rest of the paper is organised as follows. Section 2 introduces the computation
of the liquidity spreads for Germany France and Spain. In Section 3 we describe our
identification strategy for flight to liquidity flows and their characteristics during the euro area
debt crisis. We then investigate the quantitative impact of flight to liquidity flows in all euro
area sovereign bond and stock markets, as well as on economic confidence in Section 4.
Finally, Section 5 concludes.
BANCO DE ESPAÑA 10 DOCUMENTO DE TRABAJO N.º 1429
2 Measuring liquidity premia in euro area bond markets
From a practical point of view, the yield of a given bond (𝑖𝑡(𝑠)) can be decomposed into risk-
free interest rates (𝑟𝑡), credit risk compensation (ct(s)) and liquidity risk compensation (lt(s)):
𝑖𝑡(𝑠) = 𝑟𝑡 + 𝑐𝑡(𝑠) + 𝑙𝑡(𝑠) (1)
For this reason, when considering a sovereign spread (the difference between the
yields of two sovereign bonds issued, for instance, by Spain and Germany), their spread will
include the difference in the credit risk premia as well as differences in the liquidity premia.
[𝑖𝑡(𝑠1) − 𝑖𝑡(𝑠2)] = [𝑐𝑡(𝑠1) − 𝑐𝑡(𝑠2)] + [𝑙𝑡(𝑠1) − 𝑙𝑡(𝑠2)] (2)
By contrast, an agency bond spread (the yield spread between a bond issued by an
agency owned by the government and the corresponding sovereign bond) will allow cancelling out the credit risk and therefore isolating the liquidity premia (Longstaff, 2004):
1
𝑋𝑡𝑠1 = [𝑖𝑡(𝑠1) − 𝑖𝑡(𝑎1)] = [𝑙𝑡(𝑠1) − 𝑙𝑡(𝑎1)] (3)
Clean measures of liquidity premium in each bond market can therefore be obtained
by computing the yield spread between standard sovereign and agency bonds. We would
however need bonds with exactly the same maturity and structure of payments (frequency
and size of coupons, as well as principal) or the spreads would be affected by differences in
term premia and changes in the benchmarks.
We therefore compute yield spreads on daily zero-coupon term structures estimated
using a Nelson Siegel parametric specification (Nelson and Siegel, 1987) for Spanish, French
and German government bonds, as well as for their respective agency bonds (ICO, CADES
and KfW), between January 2008 and December 2013. Our choice of the Nelson Siegel
specification is motivated by the limited number of agency bonds in some markets. Despite
its simplicity, the Nelson Siegel specification is widely used among central banks (see, BIS
2005). To ensure the stability of the estimated parameters we employed the genetic algorithm
introduced in Gimeno and Nave (2009).2
Within the estimated term structures, in the light of the available agency market
structures, we focus on five year spreads as benchmark maturity (see Figure 2). Moving
beyond the five-year maturity reduces the number of available bonds and lowers the reliability
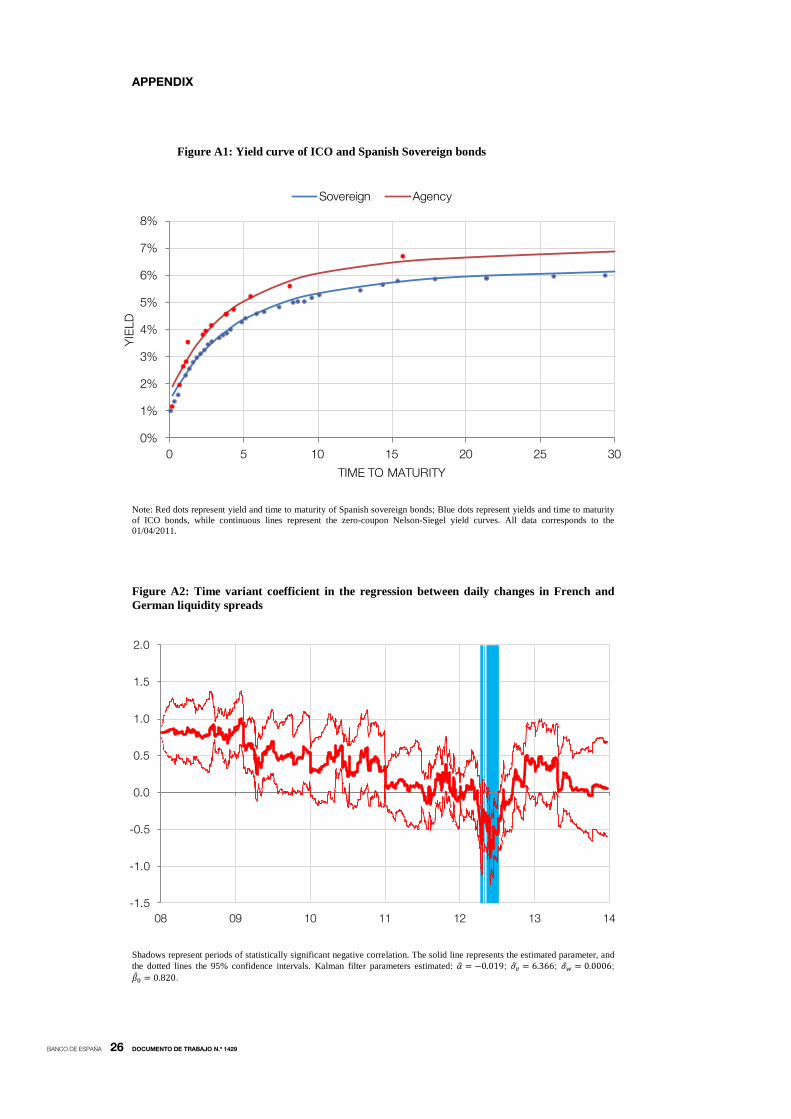
of the zero-coupon term structures (see Figure A1 in the Appendix).
3
We will nonetheless
show that our main findings hold for two and ten-year maturities, too.
1. The analyses in Schwarz (2010) and Ejsing et al. (2012) are also based on the assumption that KfW and CADES bond yields have the same level of credit risk as their government counterparts. 2. The procedure involves a heuristic search of the optimum that mimics the process of natural evolution and explores the whole parameter universe, and including random perturbations around solutions to avoid local minima. 3. The Appendix also includes a list and the main characteristics of the bonds used in our estimation.
BANCO DE ESPAÑA 11 DOCUMENTO DE TRABAJO N.º 1429
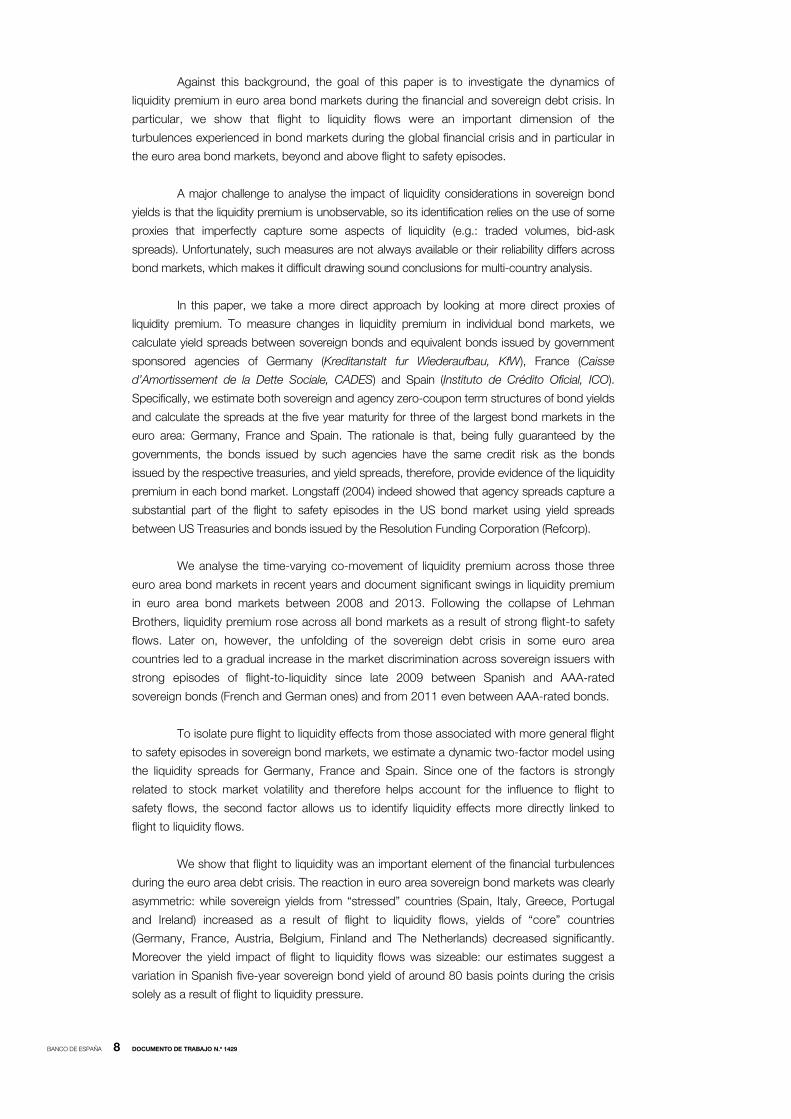
Figure 2: 5-year zero-coupon bond yields
Note: Yields are computed from a Nelson-Siegel yield curve estimated daily with Gimeno and Nave (2009) algorithm. The left hand side chart represents the 5-year rate for the Spanish (red), German (black), and French (blue) Sovereign (Government) bonds. The right hand side chart represents the 5-year rate for the ICO (Spanish, red), KfW (German, black), and CADES (French, blue) Agency bonds. Below are the same series but represented by country (Spain, left; France, centre; and Germany, right), with agency rates in red and sovereign rates in blue.
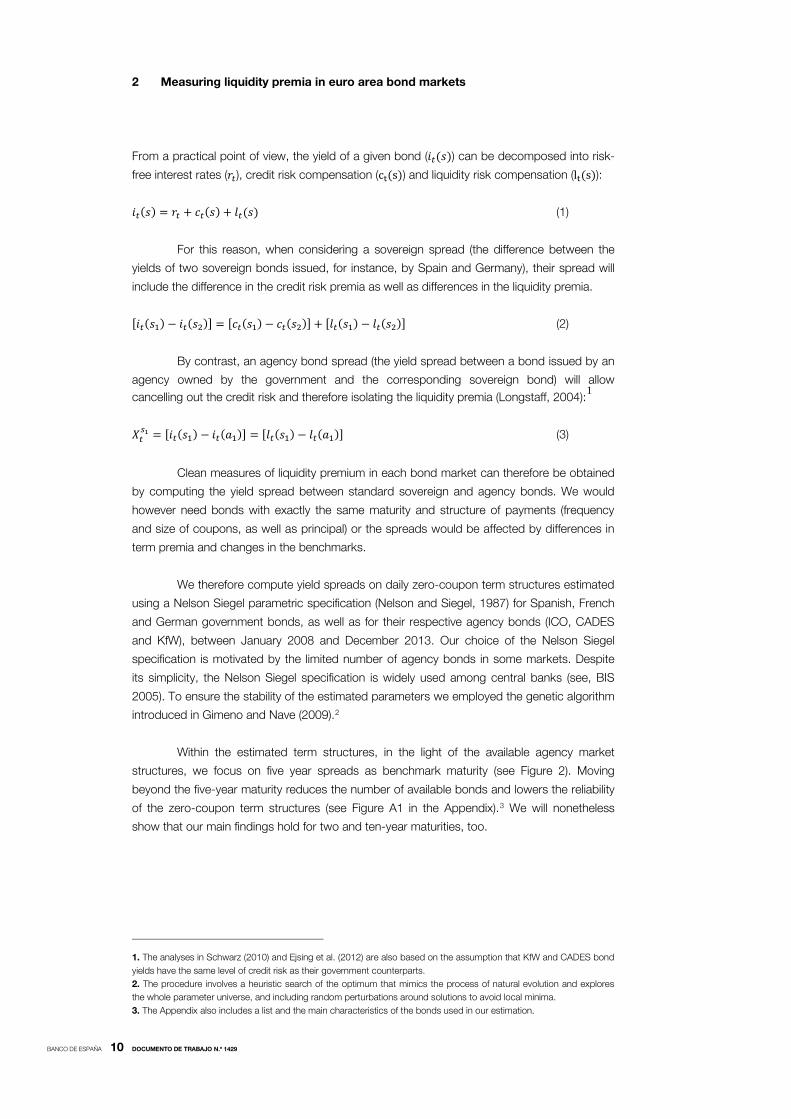
Figure 2 shows that in some periods (e.g. late 2008-early 2009) there is a higher
variation in government bonds than in agency bonds. Once we recover the corresponding
agency spreads (agency rate minus the sovereign bond yield, see Figure 3), it is apparent that
liquidity premia dynamics played an important role in the widening of the intra-euro area
sovereign yield spreads.
Table 1 provides descriptives statistics for both our sovereign and agency yields as
well as country- specific agency spreads, both for levels and first differencies. As yields and
agency spreads are highly persistent, we below specify our models in terms of first
differences to work with stationary time series. We can also observe that, as a consequence
of the crisis, Spanish yields, both sovereign and agency, have extreme values, as the kurtosis
coefficients highlights (this also produce some correlation with the first lag).
0%
1%
2%
3%
4%
5%
6%
7%
8%
08 09 10 11 12 13 14
France Sovereign Spain Sovereign Germany Sovereign
0%
1%
2%
3%
4%
5%
6%
7%
8%
08 09 10 11 12 13 14
France Agency Spain Agency Germany Agency
2%
3%
4%
5%
6%
7%
8%
08 09 10 11 12 13 14
Spain Sovereign Spain Agency
0%
1%
2%
3%
4%
5%
6%
08 09 10 11 12 13 14
France Sovereign France Agency
0%
1%
2%
3%
4%
5%
6%
08 09 10 11 12 13 14
Germany Sovereign Germany Agency
BANCO DE ESPAÑA 12 DOCUMENTO DE TRABAJO N.º 1429
Figure 3: Agency Spreads for five-year maturity bond yields
Note: Computed as the difference of the 5-year spot yield of the agency minus the 5-year spot yield of the corresponding sovereign (percentage points). For France (blue line), the agency is CADES; for Spain (red line), the agency is ICO; and for Germany (black line), the agency is KfW.
Table 1: Descriptive statistics for the involved variables
ean STDev. Skewness Kurtosis Corr(1) Corr(2) Corr(3)
Level ICO (Spain) 4.17 0.96 0.63 2.79 .994 .986 .978
KfW (Germany) 2.29 1.12 0.35 2.19 .998 .996 .994
CADES (France) 2.48 0.99 0.24 2.39 .997 .995 .992
ES sovereign 3.84 0.83 0.73 3.37 .992 .981 .971
DE sovereign 1.87 1.11 0.48 2.33 .997 .994 .992
FR sovereign 2.27 0.96 0.38 2.53 .997 .994 .991
ES agency spread 0.33 0.23 0.86 3.41 .982 .974 .966
DE agency spread 0.41 0.18 0.93 2.71 .990 .981 .973
FR agency spread 0.22 0.12 0.61 2.82 .972 .948 .926
Mean STDev. Skewness Kurtosis Corr(1) Corr(2) Corr(3)
First Difference ICO (Spain) -.001 .097 -1.34 17.46 .212 .015 -.079
KfW (Germany) -.002 .044 0.20 7.34 .034 -.006 -.019
CADES (France) -.002 .048 0.15 7.32 .062 .043 -.055
ES sovereign -.001 .100 -1.29 16.23 .183 -.004 -.087
DE sovereign -.002 .055 0.05 5.22 .004 -.035 -.021
FR sovereign -.002 .054 0.22 6.74 .030 -.010 -.021
ES agency spread .000 .043 1.32 35.12 -.263 -.017 -.062
DE agency spread .000 .024 -0.26 13.11 -.086 -.045 .018
FR agency spread -.000 .027 -0.18 11.55 -.086 -.040 -.048
Note: Yields for each issuer are 5-year zero-coupon rates obtained by daily estimating Nelson-Siegel yield curves using Gimeno and Nave (2009) algorithm. Sample: from January 4th 2008 to December 31st 2013.
-0.4%
-0.2%
0.0%
0.2%
0.4%
0.6%
0.8%
1.0%
1.2%
08 09 10 11 12 13 14
France Spread Spain Spread Germany Spread
BANCO DE ESPAÑA 13 DOCUMENTO DE TRABAJO N.º 1429
3 Identifying flight to liquidity episodes
In the case of the European debt crisis, episodes of flight to liquidity have been often proxied
in the literature as a widening in the KfW yield spread over the German bund (e.g. Schwartz,
2010). While such a yield spread is easy to compute, its simplicity may unfortunately come at
a cost in terms of economic interpretation of such episodes.4
This paper argues that a major shortcoming of focusing exclusively on the German
bond market to identify FTL episodes over the last few years is that the nature of those
FTS/FTL flows may have varied substantially as the sovereign debt crisis unfolded in euro
area bond markets. Specifically, while in the early stages of the crisis FTS episodes involved a
portfolio relocation between the then-considered riskier assets (equity, corporate bonds) and
sovereign bonds, a crucial characteristic of the sovereign debt crisis in the euro area is that it
also involved important portfolio reallocations within the euro area sovereign bond asset class.
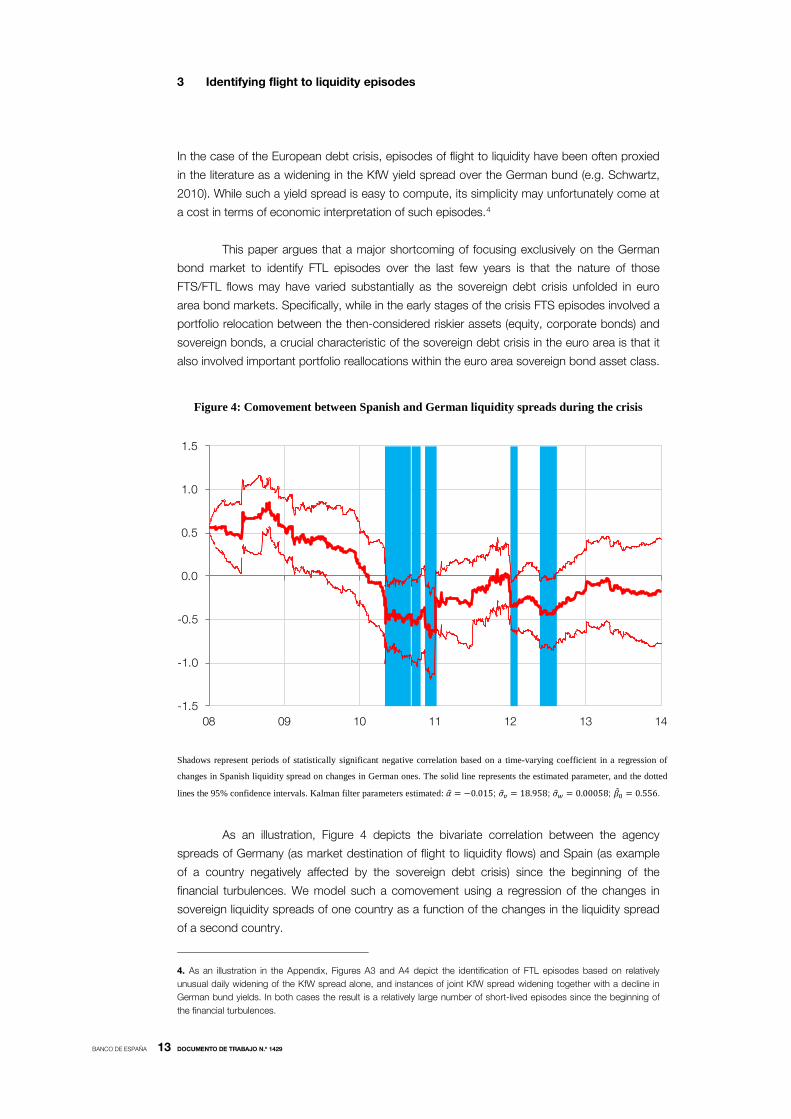
Figure 4: Comovement between Spanish and German liquidity spreads during the crisis
Shadows represent periods of statistically significant negative correlation based on a time-varying coefficient in a regression of
changes in Spanish liquidity spread on changes in German ones. The solid line represents the estimated parameter, and the dotted
lines the 95% confidence intervals. Kalman filter parameters estimated: 𝛼� = −0.015; 𝜎�𝑣 = 18.958; 𝜎�𝑤 = 0.00058; �̂�0 = 0.556.
As an illustration, Figure 4 depicts the bivariate correlation between the agency
spreads of Germany (as market destination of flight to liquidity flows) and Spain (as example
of a country negatively affected by the sovereign debt crisis) since the beginning of the
financial turbulences. We model such a comovement using a regression of the changes in
sovereign liquidity spreads of one country as a function of the changes in the liquidity spread
of a second country.
4. As an illustration in the Appendix, Figures A3 and A4 depict the identification of FTL episodes based on relatively unusual daily widening of the KfW spread alone, and instances of joint KfW spread widening together with a decline in German bund yields. In both cases the result is a relatively large number of short-lived episodes since the beginning of the financial turbulences.
-1.5
-1.0
-0.5
0.0
0.5
1.0
1.5
08 09 10 11 12 13 14
BANCO DE ESPAÑA 14 DOCUMENTO DE TRABAJO N.º 1429
∆𝑋𝑡𝑠1 = 𝛼 + 𝛽𝑡∆𝑋𝑡
𝑠2 + 𝑣𝑡 𝑣𝑡~𝑁[0,𝜎𝑣] (4)
where the relationship between both spreads (βt) is time varying, with the coefficients
behaving as a random walk,
𝛽𝑡 = 𝛽𝑡−1 + 𝑤𝑡 𝑤𝑡~𝑁[0,𝜎𝑤] (5)
The resulting system is estimated by using standard Kalman filtering techniques.
Although the correlation started declining since late 2008, it remained significantly
positive until late 2009. The intensification of the sovereign debt crisis in the euro area
however pushed it into negative territory in early 2010 and a negative co-movement between
German and Spanish agency spreads has remained broadly negative since then. Indeed, in
statistical terms, this analysis suggests three protracted episodes of significant negative co-
movement in liquidity premium in German and Spanish bond markets between 2010 and
2013, only attenuated by the introduction of the Eurosystem long-term refinancing operations
in late 2011 and thereafter by President Draghi’s “whatever it takes to save the euro” pledge
in the summer of 2012 (Draghi, 2012).
Those episodes of negative co-movement between German and Spanish agency
spreads do suggest significant liquidity flows between both bond markets. Yet, it has to be
taken into account that there was also a strong deterioration in Spanish public finances with
the financial and economic crisis following the collapse of Lehman Brothers, and a FTS
portfolio relocation from Spanish into German bonds would be observationally equivalent to a
flight-to-liquidity episode.
The evolution of the co-movement between French and German agency spreads is
also very telling about the deepening of the euro area debt crisis (see Figure A2). Indeed,
although French sovereign bonds were not affected by the crisis to the same extend as the
Spanish bonds in the early stages of the crisis, there was a protracted decline in the strength
of the correlation between German and French agency spreads since early 2009, to the
extent that by the Spring of 2012 it become significantly negative and only recovered after
President Draghi’s “whatever it takes” policy statement.
3.1 Identifying flight to liquidity using a multivariate model
Models where one of the agency spreads is a function of other of the agency spreads are
necessarily descriptive and suffer from endogeneity problems, especially during the crisis, since
both agency spreads are affected by what is happening to the other. Here we propose a more
structural analysis where the three agency spreads are determined by a set of latent factors.
To better identify FTL episodes in euro area sovereign bond markets, we first look at
the statistical properties of the three agency spreads available for the euro area. A principal
component analysis suggests that two factors are enough to explain more than 95% of the
variation in those three agency spreads (see Table 2). The principal-component analysis
indicates that only one of the components has an eigenvalue greater than one. However, the
second component retains a high level of explanatory power. Therefore, we have opted for a
model with two latent factors that have the potential of explaining up to a 95% of the
variability of the series.
BANCO DE ESPAÑA 15 DOCUMENTO DE TRABAJO N.º 1429
Table 2: Principal Component Eigenvalues and explained Variance of Spanish, German and French agency spreads
Component Eigenvalue Difference Proportion Cumulative
Comp1 2.157 1.451 0.719 0.719 Comp2 0.706 0.568 0.235 0.954 Comp3 0.138 0.046 1.000
Table 2b: Eigenvectors for the Principal Component analysis Variable Comp1 Comp2 Comp3 Unexplained
ES 0.462 0.872 0.164 0 DE 0.609 -0.446 0.656 0 FR 0.645 -0.203 -0.737 0
Note: Variables used in the Principal Component Analysis are daily time series (from January 4th 2008 to December 31st 2013) of the ICO Spread (ES, the difference between the 5-year zero-coupon rate of ICO and the equivalent Spanish Sovereign), KfW Spread (DE, the difference between the 5-year zero-coupon rate of KfW and the equivalent German Sovereign) and CADES Spread (the difference between the 5-year zero-coupon rate of CADES and the equivalent French Sovereign).
The eigenvectors of the principal components (Table 2b) suggests an important
characteristic of the two components. The first one has similar loadings for all agency spreads and can be considered as the level factor, while the second one accounts for the heterogeneity among them. Therefore, we propose a two latent factors model, where the measurement equation is equal to:
�𝑋𝑡𝐸𝑆
𝑋𝑡𝐷𝐸
𝑋𝑡𝐹𝑅� = �
𝜇𝐸𝑆𝜇𝐷𝐸𝜇𝐹𝑅
� + �𝛾1𝐸𝑆 𝛾2𝐸𝑆
𝛾1𝐷𝐸 𝛾2𝐷𝐸
𝛾1𝐹𝑅 𝛾2𝐹𝑅� �𝐿1𝑡𝐿2𝑡
� + �𝜎𝑚 0 00 𝜎𝑚 00 0 𝜎𝑚
��𝑢𝑡𝐸𝑆
𝑢𝑡𝐷𝐸
𝑢𝑡𝐹𝑅� (6)
In this model, there are two latent factors. We have imposed the error terms 𝑢𝑡𝑗 to be
uncorrelated, so shocks affecting more than one market would come from movements on the
latent factors, while differences in agency spreads variability would rise from different
sensibility to movements in the latent factors. In order to identify factors we have chosen that
the coefficients for the German spread to be equal to 1 (𝛾1𝐷𝐸 = 𝛾2𝐷𝐸 = 1), so the magnitude for
both factors can be interpreted as the basis point impact of each factor into the German
agency spread. If coefficients for the same factor are all positive (as we will show is the case
for the first one, 𝐿1𝑡), the factor can be interpreted as a common liquidity component,
governing their joint behaviour, and therefore as a general preference for sovereign versus
agency bonds. If the coefficients have values both positive and negatives, (as is the case of
the second component, 𝐿2𝑡), the corresponding factor would reflect the transfer of liquidity
between sovereigns (liquidity premium changes that affects asymmetrically the different
markets). Lastly, we let noise components (𝑢𝑡𝑗) to be uncorrelated, so common shocks to
agency spreads will come through the noise components of the state equation.
We set the state equation for the latent factors to be equal to:
�𝐿1𝑡𝐿2𝑡� = �1 0
0 1� �𝐿1𝑡−1𝐿2𝑡−1
� + �𝜎𝑙1 00 𝜎𝑙2
� �𝑣𝑙1𝑡𝑣𝑙2𝑡
� (7)
The model can therefore be considered as a filtering tool to isolate movements in
agency spreads not (or at least less) related to market fears or sovereign credit risk that
should be strongly associated to FTS flows captured by the first factor. The second factor
would more directly capture the effects of FTL episodes. Specifically, as this factor moves
German and Spanish liquidity spreads in opposite directions, its negative realisations capture
a simultaneous widening of German spreads and a narrowing of Spanish spreads, consistent
with the common understanding of a FTL away from Spanish sovereigns and into German
bunds. Interestingly, the loadings of the second factor suggest that FTL episodes away from
BANCO DE ESPAÑA 16 DOCUMENTO DE TRABAJO N.º 1429
the Spanish bond market also took place in the early stages of the financial crisis, following
the collapse of Bear Stearns in early 2008 and following Lehman collapse into the first months
of 2009, well ahead of the intensification of the sovereign debt crisis in the euro area in 2010
and the downgrading of Spanish sovereign debt.
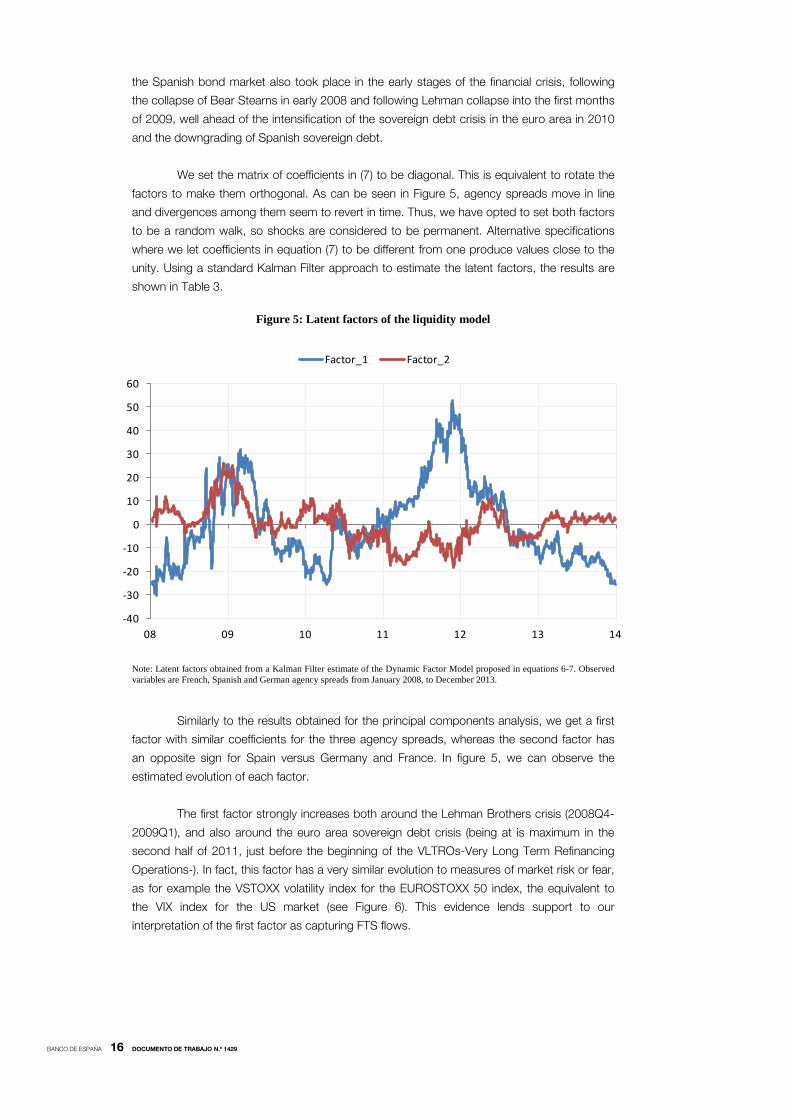
We set the matrix of coefficients in (7) to be diagonal. This is equivalent to rotate the
factors to make them orthogonal. As can be seen in Figure 5, agency spreads move in line
and divergences among them seem to revert in time. Thus, we have opted to set both factors
to be a random walk, so shocks are considered to be permanent. Alternative specifications
where we let coefficients in equation (7) to be different from one produce values close to the
unity. Using a standard Kalman Filter approach to estimate the latent factors, the results are
shown in Table 3.
Figure 5: Latent factors of the liquidity model
Note: Latent factors obtained from a Kalman Filter estimate of the Dynamic Factor Model proposed in equations 6-7. Observed variables are French, Spanish and German agency spreads from January 2008, to December 2013.
Similarly to the results obtained for the principal components analysis, we get a first
factor with similar coefficients for the three agency spreads, whereas the second factor has
an opposite sign for Spain versus Germany and France. In figure 5, we can observe the
estimated evolution of each factor.
The first factor strongly increases both around the Lehman Brothers crisis (2008Q4-
2009Q1), and also around the euro area sovereign debt crisis (being at is maximum in the
second half of 2011, just before the beginning of the VLTROs-Very Long Term Refinancing
Operations-). In fact, this factor has a very similar evolution to measures of market risk or fear,
as for example the VSTOXX volatility index for the EUROSTOXX 50 index, the equivalent to
the VIX index for the US market (see Figure 6). This evidence lends support to our
interpretation of the first factor as capturing FTS flows.
-40
-30
-20
-10
0
10
20
30
40
50
60
08 09 10 11 12 13 14
Factor_1 Factor_2
BANCO DE ESPAÑA 17 DOCUMENTO DE TRABAJO N.º 1429
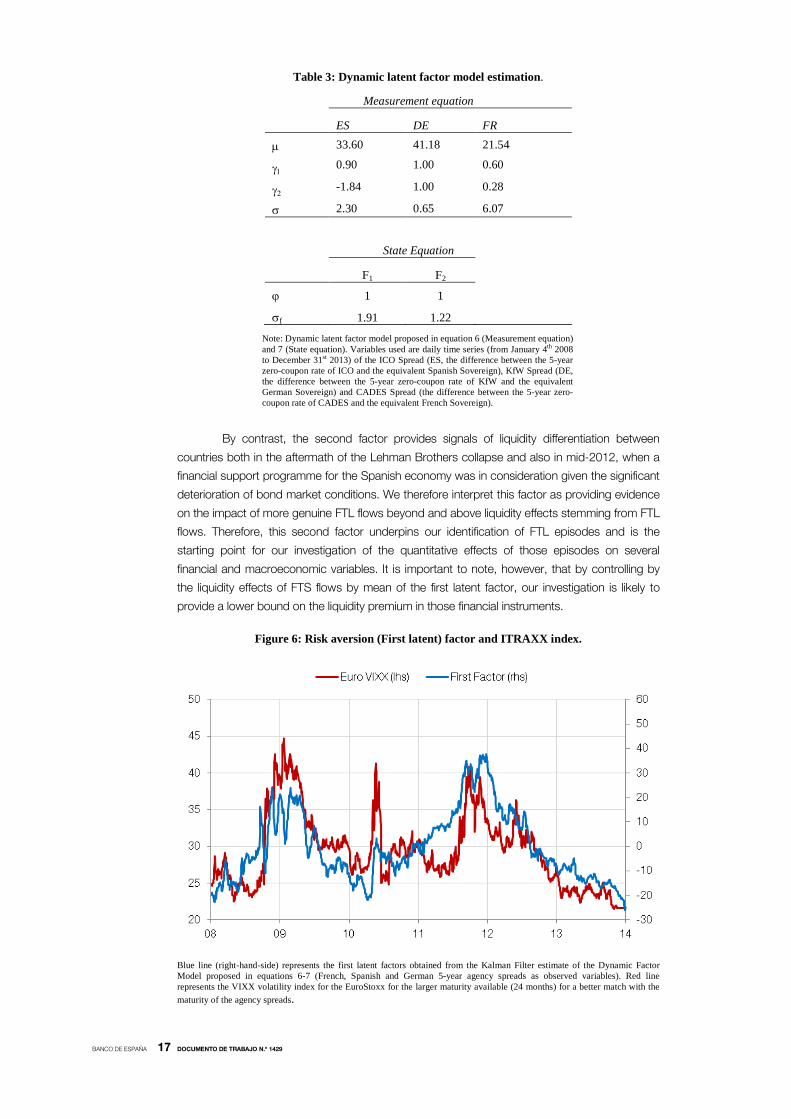
Table 3: Dynamic latent factor model estimation.
Measurement equation
ES DE FR
µ 33.60 41.18 21.54
γ1 0.90 1.00 0.60
γ2 -1.84 1.00 0.28
σ 2.30 0.65 6.07
State Equation
F1 F2
ϕ 1 1 σf 1.91 1.22 Note: Dynamic latent factor model proposed in equation 6 (Measurement equation)
and 7 (State equation). Variables used are daily time series (from January 4th 2008 to December 31st 2013) of the ICO Spread (ES, the difference between the 5-year zero-coupon rate of ICO and the equivalent Spanish Sovereign), KfW Spread (DE, the difference between the 5-year zero-coupon rate of KfW and the equivalent German Sovereign) and CADES Spread (the difference between the 5-year zero-coupon rate of CADES and the equivalent French Sovereign).
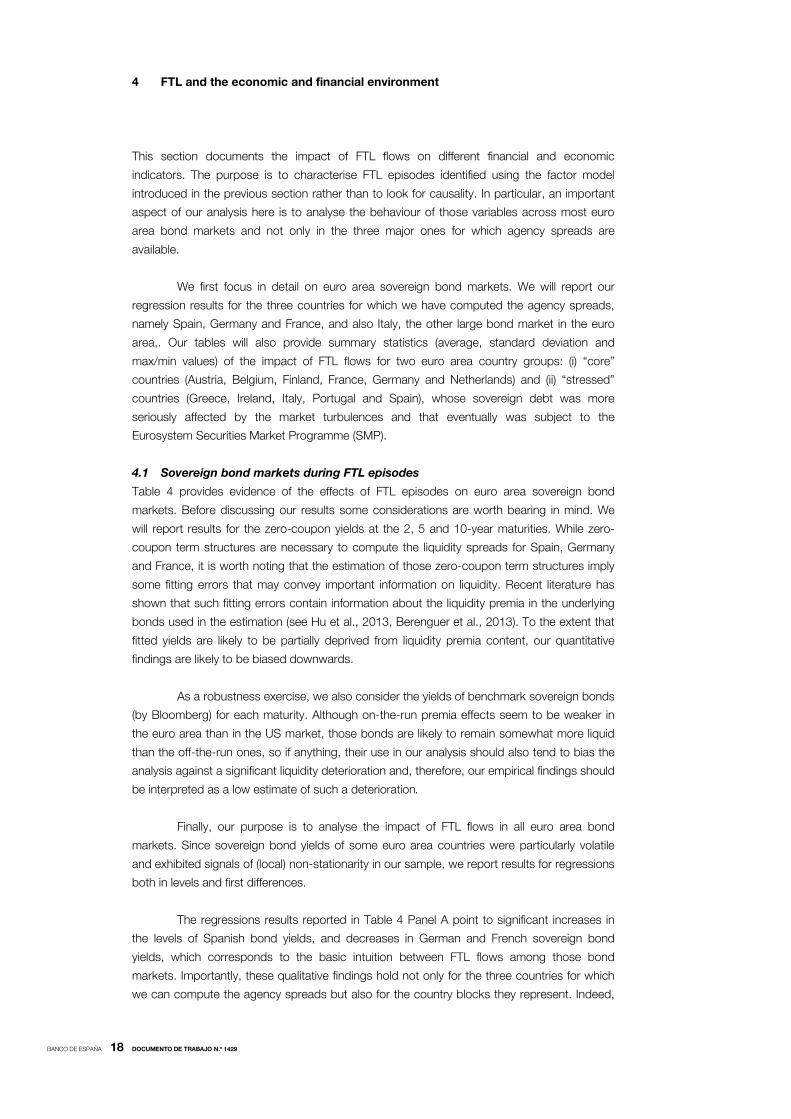
By contrast, the second factor provides signals of liquidity differentiation between
countries both in the aftermath of the Lehman Brothers collapse and also in mid-2012, when a
financial support programme for the Spanish economy was in consideration given the significant
deterioration of bond market conditions. We therefore interpret this factor as providing evidence
on the impact of more genuine FTL flows beyond and above liquidity effects stemming from FTL
flows. Therefore, this second factor underpins our identification of FTL episodes and is the
starting point for our investigation of the quantitative effects of those episodes on several
financial and macroeconomic variables. It is important to note, however, that by controlling by
the liquidity effects of FTS flows by mean of the first latent factor, our investigation is likely to
provide a lower bound on the liquidity premium in those financial instruments.
Figure 6: Risk aversion (First latent) factor and ITRAXX index.
Blue line (right-hand-side) represents the first latent factors obtained from the Kalman Filter estimate of the Dynamic Factor Model proposed in equations 6-7 (French, Spanish and German 5-year agency spreads as observed variables). Red line represents the VIXX volatility index for the EuroStoxx for the larger maturity available (24 months) for a better match with the maturity of the agency spreads.
BANCO DE ESPAÑA 18 DOCUMENTO DE TRABAJO N.º 1429
4 FTL and the economic and financial environment
This section documents the impact of FTL flows on different financial and economic
indicators. The purpose is to characterise FTL episodes identified using the factor model
introduced in the previous section rather than to look for causality. In particular, an important
aspect of our analysis here is to analyse the behaviour of those variables across most euro
area bond markets and not only in the three major ones for which agency spreads are
available.
We first focus in detail on euro area sovereign bond markets. We will report our
regression results for the three countries for which we have computed the agency spreads,
namely Spain, Germany and France, and also Italy, the other large bond market in the euro
area,. Our tables will also provide summary statistics (average, standard deviation and
max/min values) of the impact of FTL flows for two euro area country groups: (i) “core”
countries (Austria, Belgium, Finland, France, Germany and Netherlands) and (ii) “stressed”
countries (Greece, Ireland, Italy, Portugal and Spain), whose sovereign debt was more
seriously affected by the market turbulences and that eventually was subject to the
Eurosystem Securities Market Programme (SMP).
4.1 Sovereign bond markets during FTL episodes
Table 4 provides evidence of the effects of FTL episodes on euro area sovereign bond
markets. Before discussing our results some considerations are worth bearing in mind. We
will report results for the zero-coupon yields at the 2, 5 and 10-year maturities. While zero-
coupon term structures are necessary to compute the liquidity spreads for Spain, Germany
and France, it is worth noting that the estimation of those zero-coupon term structures imply
some fitting errors that may convey important information on liquidity. Recent literature has
shown that such fitting errors contain information about the liquidity premia in the underlying
bonds used in the estimation (see Hu et al., 2013, Berenguer et al., 2013). To the extent that
fitted yields are likely to be partially deprived from liquidity premia content, our quantitative
findings are likely to be biased downwards.
As a robustness exercise, we also consider the yields of benchmark sovereign bonds
(by Bloomberg) for each maturity. Although on-the-run premia effects seem to be weaker in
the euro area than in the US market, those bonds are likely to remain somewhat more liquid
than the off-the-run ones, so if anything, their use in our analysis should also tend to bias the
analysis against a significant liquidity deterioration and, therefore, our empirical findings should
be interpreted as a low estimate of such a deterioration.
Finally, our purpose is to analyse the impact of FTL flows in all euro area bond
markets. Since sovereign bond yields of some euro area countries were particularly volatile
and exhibited signals of (local) non-stationarity in our sample, we report results for regressions
both in levels and first differences.
The regressions results reported in Table 4 Panel A point to significant increases in
the levels of Spanish bond yields, and decreases in German and French sovereign bond
yields, which corresponds to the basic intuition between FTL flows among those bond
markets. Importantly, these qualitative findings hold not only for the three countries for which
we can compute the agency spreads but also for the country blocks they represent. Indeed,
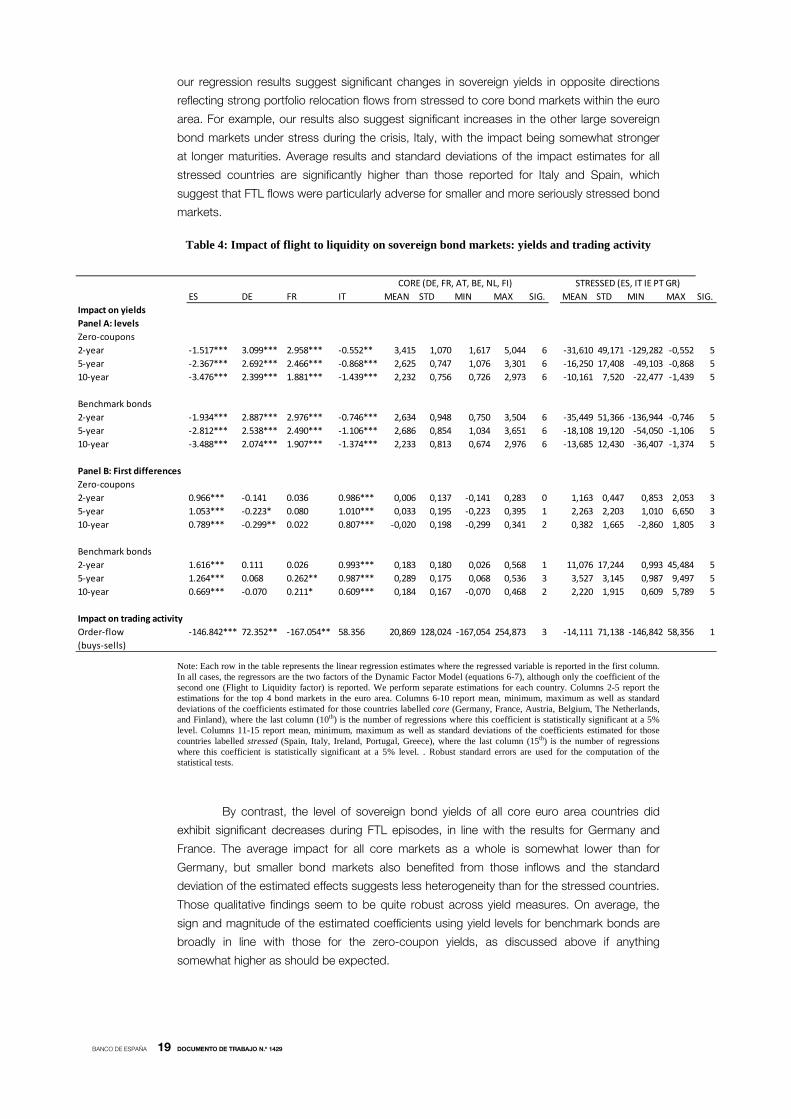
BANCO DE ESPAÑA 19 DOCUMENTO DE TRABAJO N.º 1429
our regression results suggest significant changes in sovereign yields in opposite directions
reflecting strong portfolio relocation flows from stressed to core bond markets within the euro
area. For example, our results also suggest significant increases in the other large sovereign
bond markets under stress during the crisis, Italy, with the impact being somewhat stronger
at longer maturities. Average results and standard deviations of the impact estimates for all
stressed countries are significantly higher than those reported for Italy and Spain, which
suggest that FTL flows were particularly adverse for smaller and more seriously stressed bond
markets.
Table 4: Impact of flight to liquidity on sovereign bond markets: yields and trading activity
Note: Each row in the table represents the linear regression estimates where the regressed variable is reported in the first column. In all cases, the regressors are the two factors of the Dynamic Factor Model (equations 6-7), although only the coefficient of the second one (Flight to Liquidity factor) is reported. We perform separate estimations for each country. Columns 2-5 report the estimations for the top 4 bond markets in the euro area. Columns 6-10 report mean, minimum, maximum as well as standard deviations of the coefficients estimated for those countries labelled core (Germany, France, Austria, Belgium, The Netherlands, and Finland), where the last column (10th) is the number of regressions where this coefficient is statistically significant at a 5% level. Columns 11-15 report mean, minimum, maximum as well as standard deviations of the coefficients estimated for those countries labelled stressed (Spain, Italy, Ireland, Portugal, Greece), where the last column (15th) is the number of regressions where this coefficient is statistically significant at a 5% level. . Robust standard errors are used for the computation of the statistical tests.
By contrast, the level of sovereign bond yields of all core euro area countries did
exhibit significant decreases during FTL episodes, in line with the results for Germany and
France. The average impact for all core markets as a whole is somewhat lower than for
Germany, but smaller bond markets also benefited from those inflows and the standard
deviation of the estimated effects suggests less heterogeneity than for the stressed countries.
Those qualitative findings seem to be quite robust across yield measures. On average, the
sign and magnitude of the estimated coefficients using yield levels for benchmark bonds are
broadly in line with those for the zero-coupon yields, as discussed above if anything
somewhat higher as should be expected.
ES DE FR IT MEAN STD MIN MAX SIG. MEAN STD MIN MAX SIG.Impact on yieldsPanel A: levelsZero-coupons2-year -1.517*** 3.099*** 2.958*** -0.552** 3,415 1,070 1,617 5,044 6 -31,610 49,171 -129,282 -0,552 55-year -2.367*** 2.692*** 2.466*** -0.868*** 2,625 0,747 1,076 3,301 6 -16,250 17,408 -49,103 -0,868 510-year -3.476*** 2.399*** 1.881*** -1.439*** 2,232 0,756 0,726 2,973 6 -10,161 7,520 -22,477 -1,439 5
Benchmark bonds2-year -1.934*** 2.887*** 2.976*** -0.746*** 2,634 0,948 0,750 3,504 6 -35,449 51,366 -136,944 -0,746 55-year -2.812*** 2.538*** 2.490*** -1.106*** 2,686 0,854 1,034 3,651 6 -18,108 19,120 -54,050 -1,106 510-year -3.488*** 2.074*** 1.907*** -1.374*** 2,233 0,813 0,674 2,976 6 -13,685 12,430 -36,407 -1,374 5
Panel B: First differencesZero-coupons2-year 0.966*** -0.141 0.036 0.986*** 0,006 0,137 -0,141 0,283 0 1,163 0,447 0,853 2,053 35-year 1.053*** -0.223* 0.080 1.010*** 0,033 0,195 -0,223 0,395 1 2,263 2,203 1,010 6,650 310-year 0.789*** -0.299** 0.022 0.807*** -0,020 0,198 -0,299 0,341 2 0,382 1,665 -2,860 1,805 3
Benchmark bonds2-year 1.616*** 0.111 0.026 0.993*** 0,183 0,180 0,026 0,568 1 11,076 17,244 0,993 45,484 55-year 1.264*** 0.068 0.262** 0.987*** 0,289 0,175 0,068 0,536 3 3,527 3,145 0,987 9,497 510-year 0.669*** -0.070 0.211* 0.609*** 0,184 0,167 -0,070 0,468 2 2,220 1,915 0,609 5,789 5
Impact on trading activityOrder-flow -146.842*** 72.352** -167.054** 58.356 20,869 128,024 -167,054 254,873 3 -14,111 71,138 -146,842 58,356 1(buys-sells)
CORE (DE, FR, AT, BE, NL, FI) STRESSED (ES, IT IE PT GR)

BANCO DE ESPAÑA 20 DOCUMENTO DE TRABAJO N.º 1429
Table 4 Panel B results on first differences also suggest strong significant increases
in sovereign bond yields for stressed countries, in theory those whose behaviour tends to
exhibit a stronger upward trend and more symptoms of non-stationarity. The influence of FTL
flows during the financial crisis in the euro area is also quantitatively important: for Spain it
suggests a variation in 5-year sovereign yields of almost 80 basis points and around 60 basis
points for Italian bond yields. In contrast, overall, the significance of the estimates drops for
daily changes in the more stable bond yields of the core countries.
4.1.1 TRADING ACTIVITY IN BOND MARKETS.
Finally, we investigate the extent to which our FTL episodes also have an impact in bond
trading activity that justifies those effects in sovereign bond yields. Unfortunately global trading
activity in euro area bond markets is not available at daily frequency. We therefore employ
order-flow (buy minus sell volumes) of transactions within the MTS interdealer market, by far
the largest electronic trading system for the euro area bond market and has been already
employed in several studies of the euro area bond market (e.g. Beber et al., 2009). 5
We find that trading activity is also significantly affected by FTL episodes, as reflected
in order-flow activity in bond markets. FTL episodes are associated to negative changes in
order-flow for stressed bond markets, for example Spain, suggesting an asymmetry in trading
activity towards sell orders in those markets which is consistent with the upward pressure on
bond yields we reported above. Furthermore, we also find a negative impact of FTL on order-
flow in all stressed countries. In this regard, the significance and magnitude of the coefficient
for Italy is particularly important, for, as discussed above, the MTS share of overall trading
activity in Italian bonds is particularly high. In contrast, the FTL impact on order-flow in core
bond markets is, on average, positive although results do reflect some heterogeneity probably
related to the differences in MTS share across countries that may explain the low significance
of the estimated impacts.
Bond
trading through the MTS system can take place on two different platforms, the pan-European
EuroMTS and the domestic (national) ones. In its early years, the EuroMTS was the reference
electronic market for euro benchmark bonds and those with a minimum outstanding value of
EUR5bn, while the domestic (national) MTS platforms allowed for trading of all remaining
sovereign bonds of euro area countries, but MTS gradually evolved to a symmetric dual-
platform trading system from 2006. Our empirical work is based on trading statistics
consolidated across platforms. Despite those considerations, it has to be borne in mind that
MTS market share differs across euro area countries, ranging even within the largest ones
from being very high for Italy but much lower for Germany for instance, which may influence
our results.
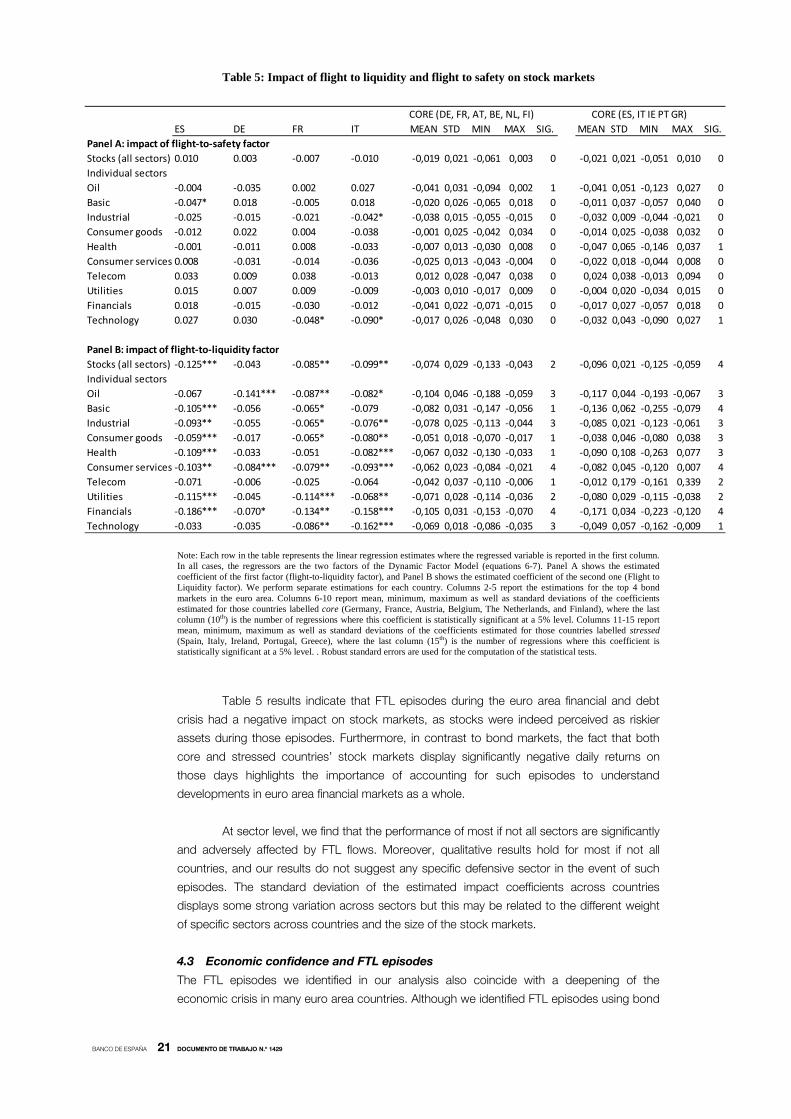
4.2 Stock market performance during FTL episodes
To assess the behaviour of stock markets during FTL episodes, we regress daily returns of
the overall market and 10 different industry-specific portfolios (using the Datastream industry
classification) on the two factors in our model, the FTS factor and our FTL factor. In addition,
as stressed in Baele et al. (2013) it is important to note that the coefficient on FTL must be
interpreted as an abnormal return during FTL episodes, but it does not indicate which
portfolios perform best or worst during FTL episodes spells, as portfolios with positive
(negative) FTL betas may have also high (low) market betas.
5. MTS-system market share among the electronic trading systems in Europe was already 74% of daily average turnover in 2003, and has been further developed since them.
BANCO DE ESPAÑA 21 DOCUMENTO DE TRABAJO N.º 1429
Table 5: Impact of flight to liquidity and flight to safety on stock markets
Note: Each row in the table represents the linear regression estimates where the regressed variable is reported in the first column. In all cases, the regressors are the two factors of the Dynamic Factor Model (equations 6-7). Panel A shows the estimated coefficient of the first factor (flight-to-liquidity factor), and Panel B shows the estimated coefficient of the second one (Flight to Liquidity factor). We perform separate estimations for each country. Columns 2-5 report the estimations for the top 4 bond markets in the euro area. Columns 6-10 report mean, minimum, maximum as well as standard deviations of the coefficients estimated for those countries labelled core (Germany, France, Austria, Belgium, The Netherlands, and Finland), where the last column (10th) is the number of regressions where this coefficient is statistically significant at a 5% level. Columns 11-15 report mean, minimum, maximum as well as standard deviations of the coefficients estimated for those countries labelled stressed (Spain, Italy, Ireland, Portugal, Greece), where the last column (15th) is the number of regressions where this coefficient is statistically significant at a 5% level. . Robust standard errors are used for the computation of the statistical tests.
Table 5 results indicate that FTL episodes during the euro area financial and debt
crisis had a negative impact on stock markets, as stocks were indeed perceived as riskier
assets during those episodes. Furthermore, in contrast to bond markets, the fact that both
core and stressed countries’ stock markets display significantly negative daily returns on
those days highlights the importance of accounting for such episodes to understand
developments in euro area financial markets as a whole.
At sector level, we find that the performance of most if not all sectors are significantly
and adversely affected by FTL flows. Moreover, qualitative results hold for most if not all
countries, and our results do not suggest any specific defensive sector in the event of such
episodes. The standard deviation of the estimated impact coefficients across countries
displays some strong variation across sectors but this may be related to the different weight
of specific sectors across countries and the size of the stock markets.
4.3 Economic confidence and FTL episodes
The FTL episodes we identified in our analysis also coincide with a deepening of the
economic crisis in many euro area countries. Although we identified FTL episodes using bond
ES DE FR IT MEAN STD MIN MAX SIG. MEAN STD MIN MAX SIG.Panel A: impact of flight-to-safety factorStocks (all sectors) 0.010 0.003 -0.007 -0.010 -0,019 0,021 -0,061 0,003 0 -0,021 0,021 -0,051 0,010 0Individual sectorsOil -0.004 -0.035 0.002 0.027 -0,041 0,031 -0,094 0,002 1 -0,041 0,051 -0,123 0,027 0Basic -0.047* 0.018 -0.005 0.018 -0,020 0,026 -0,065 0,018 0 -0,011 0,037 -0,057 0,040 0Industrial -0.025 -0.015 -0.021 -0.042* -0,038 0,015 -0,055 -0,015 0 -0,032 0,009 -0,044 -0,021 0Consumer goods -0.012 0.022 0.004 -0.038 -0,001 0,025 -0,042 0,034 0 -0,014 0,025 -0,038 0,032 0Health -0.001 -0.011 0.008 -0.033 -0,007 0,013 -0,030 0,008 0 -0,047 0,065 -0,146 0,037 1Consumer services 0.008 -0.031 -0.014 -0.036 -0,025 0,013 -0,043 -0,004 0 -0,022 0,018 -0,044 0,008 0Telecom 0.033 0.009 0.038 -0.013 0,012 0,028 -0,047 0,038 0 0,024 0,038 -0,013 0,094 0Utilities 0.015 0.007 0.009 -0.009 -0,003 0,010 -0,017 0,009 0 -0,004 0,020 -0,034 0,015 0Financials 0.018 -0.015 -0.030 -0.012 -0,041 0,022 -0,071 -0,015 0 -0,017 0,027 -0,057 0,018 0Technology 0.027 0.030 -0.048* -0.090* -0,017 0,026 -0,048 0,030 0 -0,032 0,043 -0,090 0,027 1
Panel B: impact of flight-to-liquidity factorStocks (all sectors) -0.125*** -0.043 -0.085** -0.099** -0,074 0,029 -0,133 -0,043 2 -0,096 0,021 -0,125 -0,059 4Individual sectorsOil -0.067 -0.141*** -0.087** -0.082* -0,104 0,046 -0,188 -0,059 3 -0,117 0,044 -0,193 -0,067 3Basic -0.105*** -0.056 -0.065* -0.079 -0,082 0,031 -0,147 -0,056 1 -0,136 0,062 -0,255 -0,079 4Industrial -0.093** -0.055 -0.065* -0.076** -0,078 0,025 -0,113 -0,044 3 -0,085 0,021 -0,123 -0,061 3Consumer goods -0.059*** -0.017 -0.065* -0.080** -0,051 0,018 -0,070 -0,017 1 -0,038 0,046 -0,080 0,038 3Health -0.109*** -0.033 -0.051 -0.082*** -0,067 0,032 -0,130 -0,033 1 -0,090 0,108 -0,263 0,077 3Consumer services -0.103** -0.084*** -0.079** -0.093*** -0,062 0,023 -0,084 -0,021 4 -0,082 0,045 -0,120 0,007 4Telecom -0.071 -0.006 -0.025 -0.064 -0,042 0,037 -0,110 -0,006 1 -0,012 0,179 -0,161 0,339 2Utilities -0.115*** -0.045 -0.114*** -0.068** -0,071 0,028 -0,114 -0,036 2 -0,080 0,029 -0,115 -0,038 2Financials -0.186*** -0.070* -0.134** -0.158*** -0,105 0,031 -0,153 -0,070 4 -0,171 0,034 -0,223 -0,120 4Technology -0.033 -0.035 -0.086** -0.162*** -0,069 0,018 -0,086 -0,035 3 -0,049 0,057 -0,162 -0,009 1
CORE (DE, FR, AT, BE, NL, FI) CORE (ES, IT IE PT GR)
BANCO DE ESPAÑA 22 DOCUMENTO DE TRABAJO N.º 1429
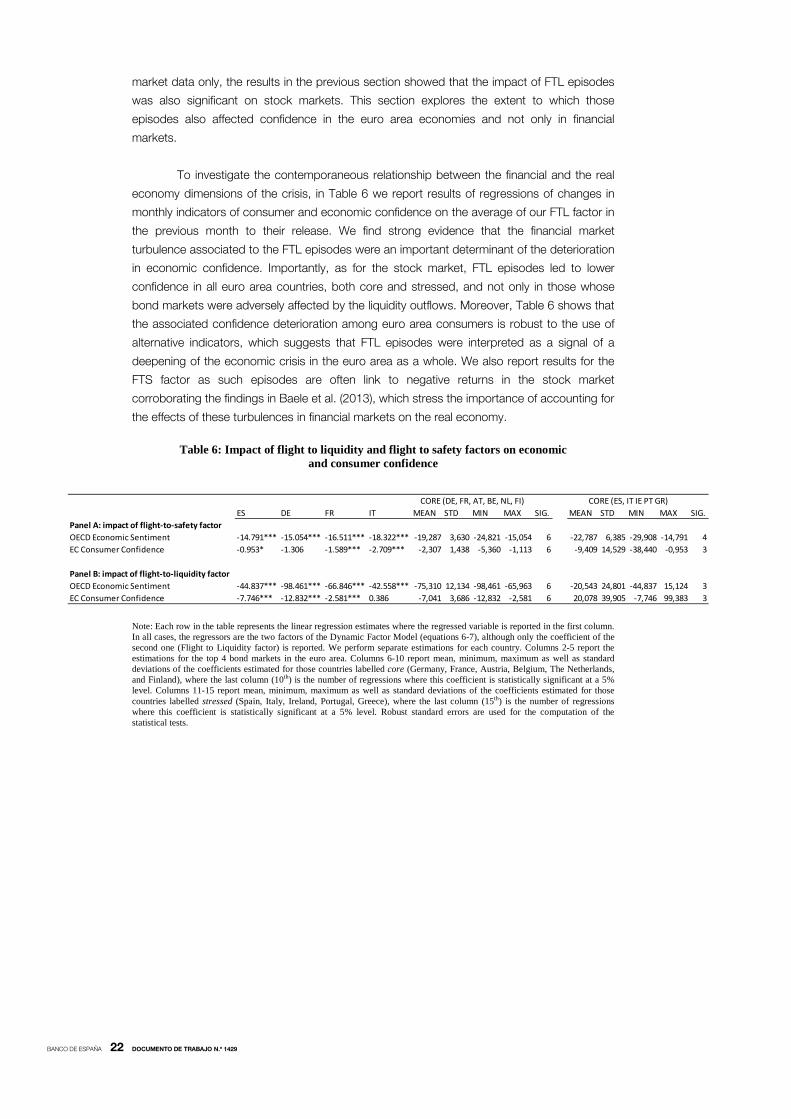
market data only, the results in the previous section showed that the impact of FTL episodes
was also significant on stock markets. This section explores the extent to which those
episodes also affected confidence in the euro area economies and not only in financial
markets.
To investigate the contemporaneous relationship between the financial and the real
economy dimensions of the crisis, in Table 6 we report results of regressions of changes in
monthly indicators of consumer and economic confidence on the average of our FTL factor in
the previous month to their release. We find strong evidence that the financial market
turbulence associated to the FTL episodes were an important determinant of the deterioration
in economic confidence. Importantly, as for the stock market, FTL episodes led to lower
confidence in all euro area countries, both core and stressed, and not only in those whose
bond markets were adversely affected by the liquidity outflows. Moreover, Table 6 shows that
the associated confidence deterioration among euro area consumers is robust to the use of
alternative indicators, which suggests that FTL episodes were interpreted as a signal of a
deepening of the economic crisis in the euro area as a whole. We also report results for the
FTS factor as such episodes are often link to negative returns in the stock market
corroborating the findings in Baele et al. (2013), which stress the importance of accounting for
the effects of these turbulences in financial markets on the real economy.
Table 6: Impact of flight to liquidity and flight to safety factors on economic and consumer confidence
Note: Each row in the table represents the linear regression estimates where the regressed variable is reported in the first column. In all cases, the regressors are the two factors of the Dynamic Factor Model (equations 6-7), although only the coefficient of the second one (Flight to Liquidity factor) is reported. We perform separate estimations for each country. Columns 2-5 report the estimations for the top 4 bond markets in the euro area. Columns 6-10 report mean, minimum, maximum as well as standard deviations of the coefficients estimated for those countries labelled core (Germany, France, Austria, Belgium, The Netherlands, and Finland), where the last column (10th) is the number of regressions where this coefficient is statistically significant at a 5% level. Columns 11-15 report mean, minimum, maximum as well as standard deviations of the coefficients estimated for those countries labelled stressed (Spain, Italy, Ireland, Portugal, Greece), where the last column (15th) is the number of regressions where this coefficient is statistically significant at a 5% level. Robust standard errors are used for the computation of the statistical tests.
ES DE FR IT MEAN STD MIN MAX SIG. MEAN STD MIN MAX SIG.Panel A: impact of flight-to-safety factorOECD Economic Sentiment -14.791*** -15.054*** -16.511*** -18.322*** -19,287 3,630 -24,821 -15,054 6 -22,787 6,385 -29,908 -14,791 4EC Consumer Confidence -0.953* -1.306 -1.589*** -2.709*** -2,307 1,438 -5,360 -1,113 6 -9,409 14,529 -38,440 -0,953 3
Panel B: impact of flight-to-liquidity factorOECD Economic Sentiment -44.837*** -98.461*** -66.846*** -42.558*** -75,310 12,134 -98,461 -65,963 6 -20,543 24,801 -44,837 15,124 3EC Consumer Confidence -7.746*** -12.832*** -2.581*** 0.386 -7,041 3,686 -12,832 -2,581 6 20,078 39,905 -7,746 99,383 3
CORE (DE, FR, AT, BE, NL, FI) CORE (ES, IT IE PT GR)
BANCO DE ESPAÑA 23 DOCUMENTO DE TRABAJO N.º 1429
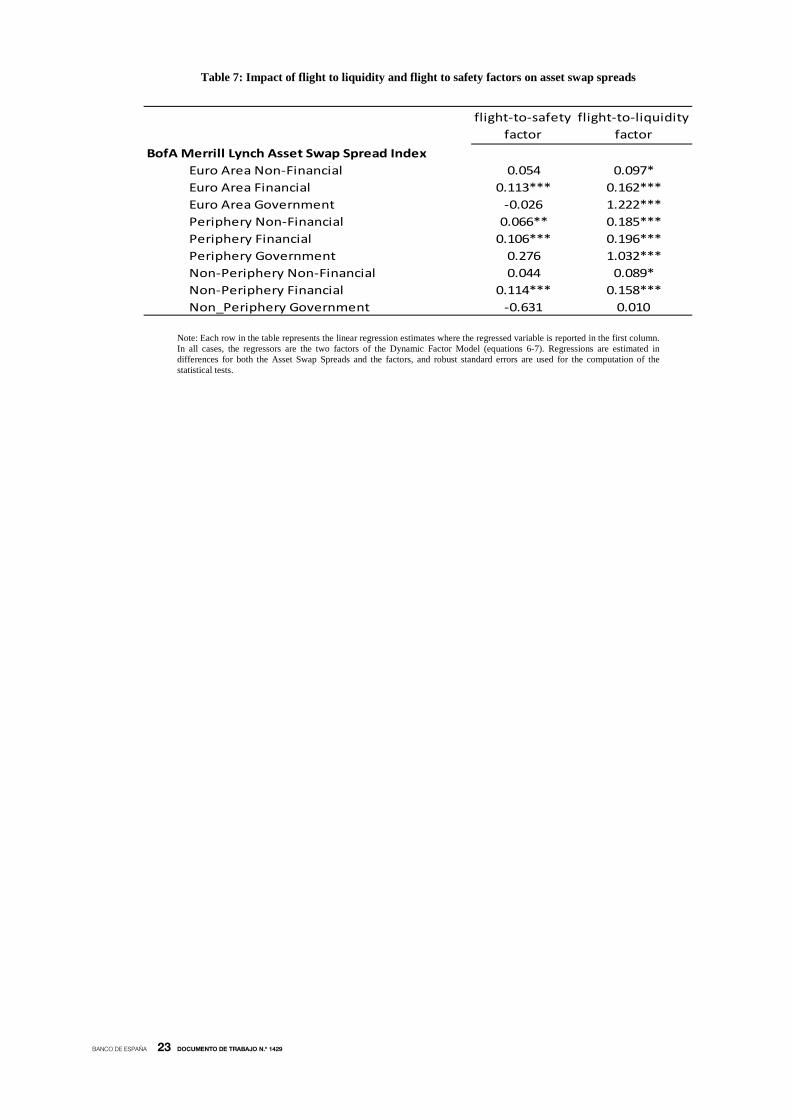
Table 7: Impact of flight to liquidity and flight to safety factors on asset swap spreads
Note: Each row in the table represents the linear regression estimates where the regressed variable is reported in the first column. In all cases, the regressors are the two factors of the Dynamic Factor Model (equations 6-7). Regressions are estimated in differences for both the Asset Swap Spreads and the factors, and robust standard errors are used for the computation of the statistical tests.
flight-to-safety factor
flight-to-liquidity factor
BofA Merrill Lynch Asset Swap Spread IndexEuro Area Non-Financial 0.054 0.097*Euro Area Financial 0.113*** 0.162***Euro Area Government -0.026 1.222***Periphery Non-Financial 0.066** 0.185***Periphery Financial 0.106*** 0.196***Periphery Government 0.276 1.032***Non-Periphery Non-Financial 0.044 0.089*Non-Periphery Financial 0.114*** 0.158***Non_Periphery Government -0.631 0.010

BANCO DE ESPAÑA 24 DOCUMENTO DE TRABAJO N.º 1429
5 Concluding remarks
By comparing sovereign and agency bonds (bonds with identical level of credit risk but
different levels of liquidity), this paper analysed liquidity premia in three major euro area
sovereign bond markets (Spain, Germany and France) between 2008 and 2013. We showed
that such liquidity spreads reached more than 100 basis points during the euro area debt
crisis, and identified flight to liquidity episodes above and beyond “flight to quality” or “flight to
safety” spells.
We then showed that accounting for flight to liquidity episodes is an essential
element for a thorough understanding of developments in euro area bond markets in recent
years. First, flight to liquidity flows contributed to explain the significant widening of intra-euro
area sovereign spreads by increasing the yields of the bonds from stressed countries while at
the same time lowering those from core countries. In addition, we showed that flight to
liquidity episodes were associated with stock market declines and confidence deterioration in
the euro area as a whole, that is, not only in stressed but also in core countries, and thereby
aggravating the financial and economic crisis.
The strong effects of flight to liquidity flows that we find in this paper suggest at least
two areas for further research. First, a more thorough understanding of their effects in other
market segments, like for example corporate bond markets, and the macroeconomy, for
example on growth expectations, is important and such extensions of our analysis are already
in our agenda.
Our results also show that the effects of flight to liquidity episodes on bond and other
financial markets are important for policy makers. Indeed, the timing and goals of some of the
policy measures taken during the euro area debt crisis could be better understood by the
intensity of flight to liquidity episodes. Assessing the impact of such measures, for example
the sovereign bond purchases under the Securities Market Programme of the Eurosystem, on
attenuating flight to liquidity episodes is another important avenue to explore. In this field, the
original analyses of Eser and Schwaab (2013) and Ghysels et al. (2013) are seminal and the
factors proposed in our paper could be added to their methodology to assess the
improvements in liquidity of the SMP programme.
BANCO DE ESPAÑA 25 DOCUMENTO DE TRABAJO N.º 1429
REFERENCES
BAELE, L. G. BEKAERT, K. INGHELBRECHT and M. WEI (2012). Flights to safety, NBER Working Paper No. 19095, May.
BEBER, A., M. W. BRANDT, and K. A. KAVAJECZ (2009). Flight-to-quality or flight-to-liquidity? Evidence from the euro-area bond market, Review of Financial Studies 22, 925-957.
BERENGUER, E., R. GIMENO, and J. NAVE (2013). Term structure estimation, liquidity-induced heteroskedasticity and the price of liquidity risk, Banco de España Working Paper No.1308.
BIS (2005). Zero-coupon yield curves: technical documentation, Bank for International Settlements Papers, No. 25, Basel.
BRUNNERMEIER, M. K., and L. H. PEDERSEN (2009). Market liquidity and funding liquidity, Review of Financial Studies 22, 2201-2238.
CABALLERO, R. J., and A. KRISHNAMURTHY (2008). Collective risk management in a flight to quality episode, Journal of Finance 63, 2195-2230.
DRAGHI, M. (2012). Speech by Mario Draghi, President of the European Central Bank at the Global Investment Conference in London, 26 July. http://www.ecb.europa.eu/press/key/date/2012/html/sp120726.en.html
EJSING, J., GROTHE, M. and GROTHE, O. (2012). Liquidity and Credit Risk Premia in Government Bond Yields, ECB Working Paper Series No. 1440.
ESER, F. and B. SCHWAAB (2013). Assessing asset purchases within the ECB’s securities markets programme, ECB Working Paper Series No. 1587.
GHYSELS, E., J. IDIER, S. MANGANELLI and O. VERGOTE (2013). A high frequency assessment of the ECB securities markets programme, CEPR working paper No. 9778.
HU G. X, J. PAN and J. WANG (2013). Noise as Information for Illiquidity, Journal of Finance, 68, 2223-2772, GIMENO, R. and NAVE, J.M. (2009). A genetic algorithm estimation of the term structure of interest rates,
Computational Statistics & Data Analysis 53(6), 2236-2250. LONGSTAFF, F.A. (2004). The Flight-to-Liquidity Premium in U.S. Treasury Bond Prices, Journal of Business, 77(3), 511-
526. MONFORT, A., and RENNE, J. P. (2013). Default, liquidity, and crises: An econometric framework, Journal of Financial
Econometrics, 11(2), 221-262. MONFORT, A., and RENNE, J. P. (2013). Decomposing Euro-Area Sovereign Spreads: Credit and Liquidity Risks,
Review of Finance, forthcoming. NELSON, C.R., and SIEGEL, A.F. (1987). Parsimonious Modelling of Yield Curves, Journal of Business 60 (4), 473-489. Schwarz, K. (2010). Mind the gap: disentangling credit and liquidity in risk spreads, mimeo, University of Pennsylvania,
October. VAYANOS, D. (2004). Flight to quality, flight to liquidity, and the pricing of risk, Working Paper.
BANCO DE ESPAÑA 26 DOCUMENTO DE TRABAJO N.º 1429
APPENDIX
Figure A1: Yield curve of ICO and Spanish Sovereign bonds
Note: Red dots represent yield and time to maturity of Spanish sovereign bonds; Blue dots represent yields and time to maturity of ICO bonds, while continuous lines represent the zero-coupon Nelson-Siegel yield curves. All data corresponds to the 01/04/2011.
Figure A2: Time variant coefficient in the regression between daily changes in French and German liquidity spreads
Shadows represent periods of statistically significant negative correlation. The solid line represents the estimated parameter, and the dotted lines the 95% confidence intervals. Kalman filter parameters estimated: 𝛼� = −0.019; 𝜎�𝑣 = 6.366; 𝜎�𝑤 = 0.0006; �̂�0 = 0.820.
0%
1%
2%
3%
4%
5%
6%
7%
8%
0 5 10 15 20 25 30
YIE
LD
TIME TO MATURITY
Sovereign Agency
-1.5
-1.0
-0.5
0.0
0.5
1.0
1.5
2.0
08 09 10 11 12 13 14
BANCO DE ESPAÑA 27 DOCUMENTO DE TRABAJO N.º 1429
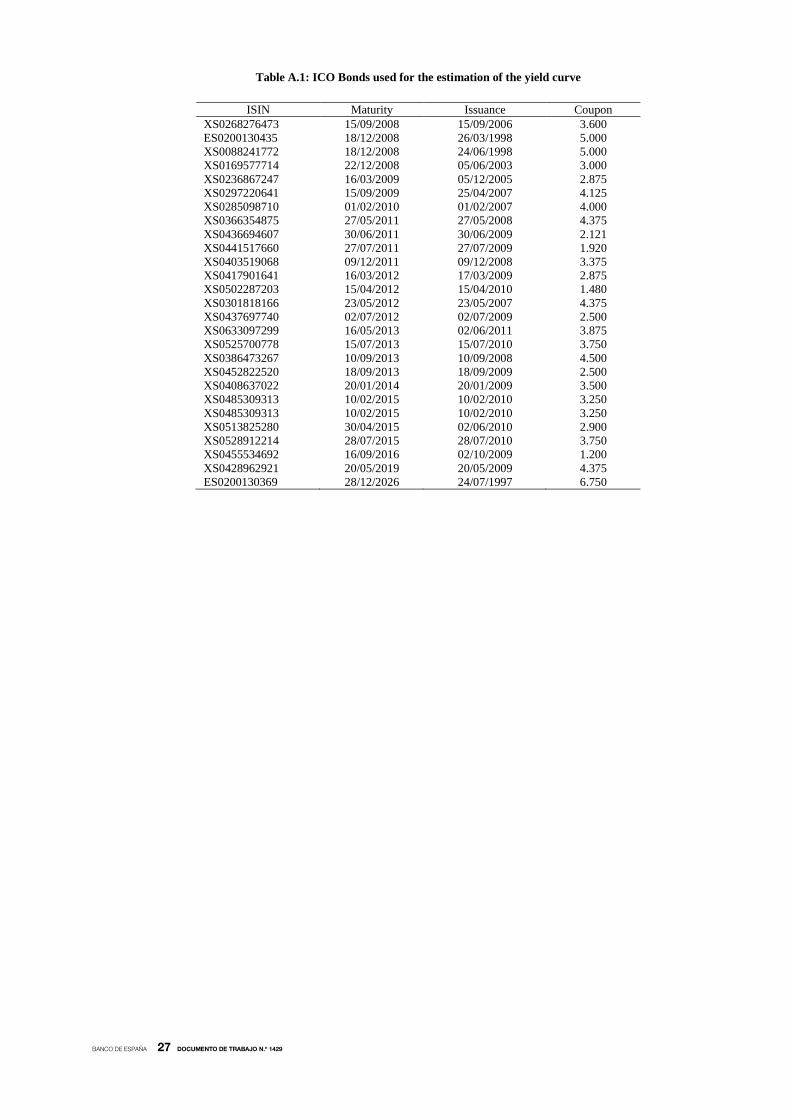
Table A.1: ICO Bonds used for the estimation of the yield curve
ISIN Maturity Issuance Coupon XS0268276473 15/09/2008 15/09/2006 3.600 ES0200130435 18/12/2008 26/03/1998 5.000 XS0088241772 18/12/2008 24/06/1998 5.000 XS0169577714 22/12/2008 05/06/2003 3.000 XS0236867247 16/03/2009 05/12/2005 2.875 XS0297220641 15/09/2009 25/04/2007 4.125 XS0285098710 01/02/2010 01/02/2007 4.000 XS0366354875 27/05/2011 27/05/2008 4.375 XS0436694607 30/06/2011 30/06/2009 2.121 XS0441517660 27/07/2011 27/07/2009 1.920 XS0403519068 09/12/2011 09/12/2008 3.375 XS0417901641 16/03/2012 17/03/2009 2.875 XS0502287203 15/04/2012 15/04/2010 1.480 XS0301818166 23/05/2012 23/05/2007 4.375 XS0437697740 02/07/2012 02/07/2009 2.500 XS0633097299 16/05/2013 02/06/2011 3.875 XS0525700778 15/07/2013 15/07/2010 3.750 XS0386473267 10/09/2013 10/09/2008 4.500 XS0452822520 18/09/2013 18/09/2009 2.500 XS0408637022 20/01/2014 20/01/2009 3.500 XS0485309313 10/02/2015 10/02/2010 3.250 XS0485309313 10/02/2015 10/02/2010 3.250 XS0513825280 30/04/2015 02/06/2010 2.900 XS0528912214 28/07/2015 28/07/2010 3.750 XS0455534692 16/09/2016 02/10/2009 1.200 XS0428962921 20/05/2019 20/05/2009 4.375 ES0200130369 28/12/2026 24/07/1997 6.750
BANCO DE ESPAÑA 28 DOCUMENTO DE TRABAJO N.º 1429
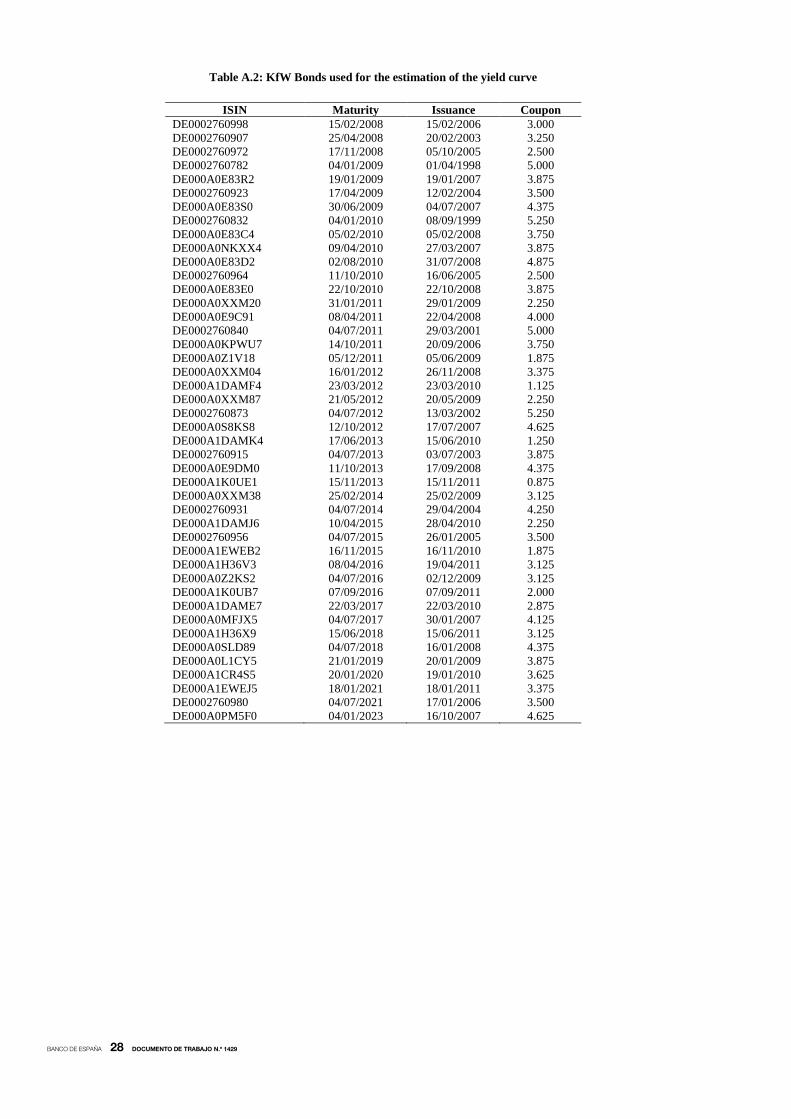
Table A.2: KfW Bonds used for the estimation of the yield curve
ISIN Maturity Issuance Coupon DE0002760998 15/02/2008 15/02/2006 3.000 DE0002760907 25/04/2008 20/02/2003 3.250 DE0002760972 17/11/2008 05/10/2005 2.500 DE0002760782 04/01/2009 01/04/1998 5.000 DE000A0E83R2 19/01/2009 19/01/2007 3.875 DE0002760923 17/04/2009 12/02/2004 3.500 DE000A0E83S0 30/06/2009 04/07/2007 4.375 DE0002760832 04/01/2010 08/09/1999 5.250 DE000A0E83C4 05/02/2010 05/02/2008 3.750 DE000A0NKXX4 09/04/2010 27/03/2007 3.875 DE000A0E83D2 02/08/2010 31/07/2008 4.875 DE0002760964 11/10/2010 16/06/2005 2.500 DE000A0E83E0 22/10/2010 22/10/2008 3.875 DE000A0XXM20 31/01/2011 29/01/2009 2.250 DE000A0E9C91 08/04/2011 22/04/2008 4.000 DE0002760840 04/07/2011 29/03/2001 5.000 DE000A0KPWU7 14/10/2011 20/09/2006 3.750 DE000A0Z1V18 05/12/2011 05/06/2009 1.875 DE000A0XXM04 16/01/2012 26/11/2008 3.375 DE000A1DAMF4 23/03/2012 23/03/2010 1.125 DE000A0XXM87 21/05/2012 20/05/2009 2.250 DE0002760873 04/07/2012 13/03/2002 5.250 DE000A0S8KS8 12/10/2012 17/07/2007 4.625 DE000A1DAMK4 17/06/2013 15/06/2010 1.250 DE0002760915 04/07/2013 03/07/2003 3.875 DE000A0E9DM0 11/10/2013 17/09/2008 4.375 DE000A1K0UE1 15/11/2013 15/11/2011 0.875 DE000A0XXM38 25/02/2014 25/02/2009 3.125 DE0002760931 04/07/2014 29/04/2004 4.250 DE000A1DAMJ6 10/04/2015 28/04/2010 2.250 DE0002760956 04/07/2015 26/01/2005 3.500 DE000A1EWEB2 16/11/2015 16/11/2010 1.875 DE000A1H36V3 08/04/2016 19/04/2011 3.125 DE000A0Z2KS2 04/07/2016 02/12/2009 3.125 DE000A1K0UB7 07/09/2016 07/09/2011 2.000 DE000A1DAME7 22/03/2017 22/03/2010 2.875 DE000A0MFJX5 04/07/2017 30/01/2007 4.125 DE000A1H36X9 15/06/2018 15/06/2011 3.125 DE000A0SLD89 04/07/2018 16/01/2008 4.375 DE000A0L1CY5 21/01/2019 20/01/2009 3.875 DE000A1CR4S5 20/01/2020 19/01/2010 3.625 DE000A1EWEJ5 18/01/2021 18/01/2011 3.375 DE0002760980 04/07/2021 17/01/2006 3.500 DE000A0PM5F0 04/01/2023 16/10/2007 4.625
BANCO DE ESPAÑA 29 DOCUMENTO DE TRABAJO N.º 1429
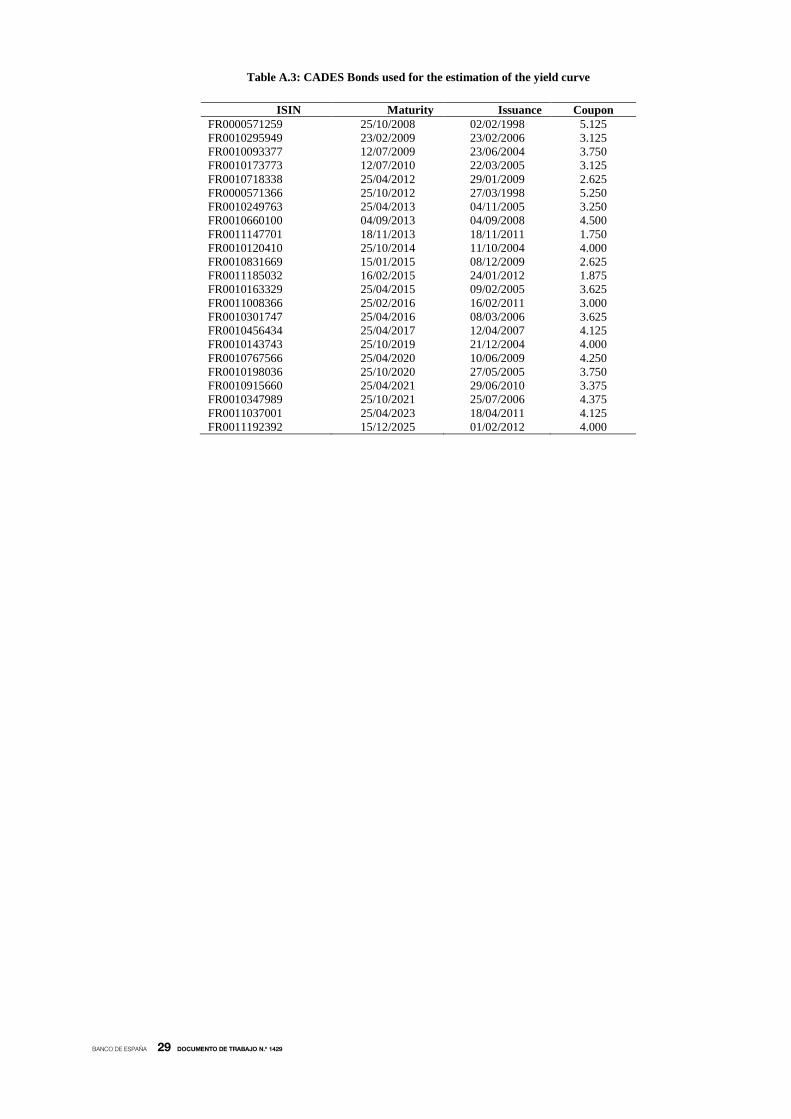
Table A.3: CADES Bonds used for the estimation of the yield curve
ISIN Maturity Issuance Coupon FR0000571259 25/10/2008 02/02/1998 5.125 FR0010295949 23/02/2009 23/02/2006 3.125 FR0010093377 12/07/2009 23/06/2004 3.750 FR0010173773 12/07/2010 22/03/2005 3.125 FR0010718338 25/04/2012 29/01/2009 2.625 FR0000571366 25/10/2012 27/03/1998 5.250 FR0010249763 25/04/2013 04/11/2005 3.250 FR0010660100 04/09/2013 04/09/2008 4.500 FR0011147701 18/11/2013 18/11/2011 1.750 FR0010120410 25/10/2014 11/10/2004 4.000 FR0010831669 15/01/2015 08/12/2009 2.625 FR0011185032 16/02/2015 24/01/2012 1.875 FR0010163329 25/04/2015 09/02/2005 3.625 FR0011008366 25/02/2016 16/02/2011 3.000 FR0010301747 25/04/2016 08/03/2006 3.625 FR0010456434 25/04/2017 12/04/2007 4.125 FR0010143743 25/10/2019 21/12/2004 4.000 FR0010767566 25/04/2020 10/06/2009 4.250 FR0010198036 25/10/2020 27/05/2005 3.750 FR0010915660 25/04/2021 29/06/2010 3.375 FR0010347989 25/10/2021 25/07/2006 4.375 FR0011037001 25/04/2023 18/04/2011 4.125 FR0011192392 15/12/2025 01/02/2012 4.000
BANCO DE ESPAÑA 30 DOCUMENTO DE TRABAJO N.º 1429
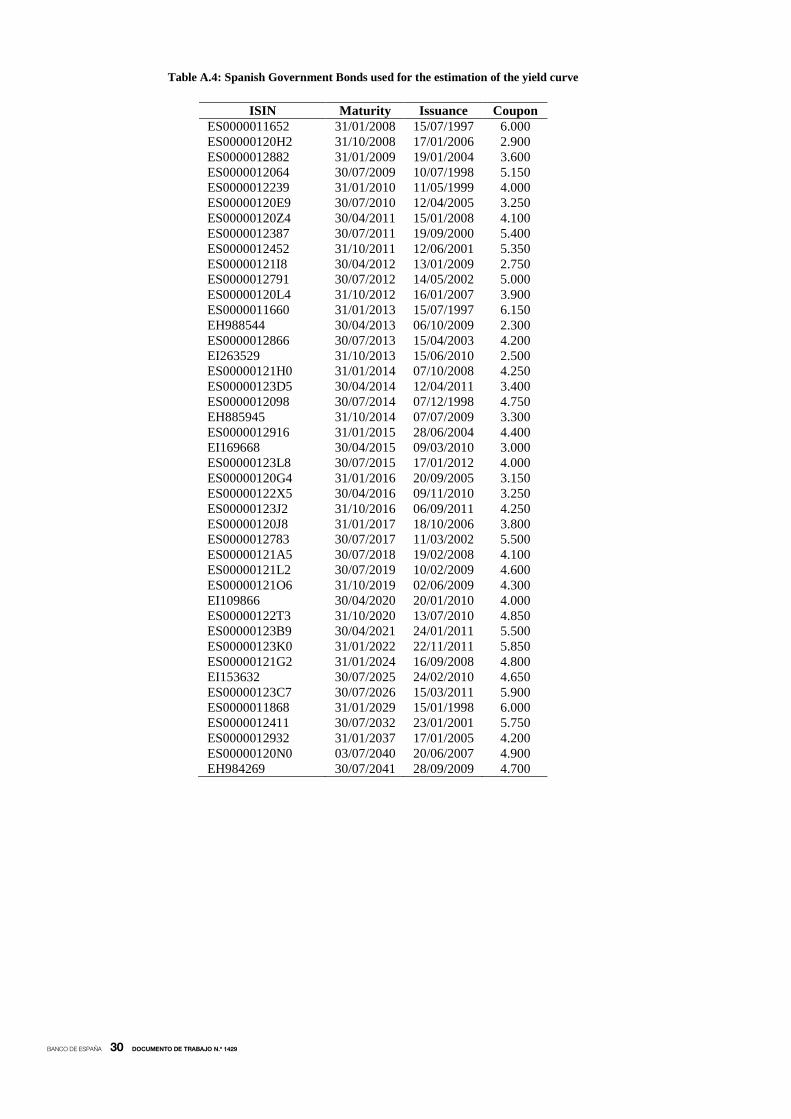
Table A.4: Spanish Government Bonds used for the estimation of the yield curve
ISIN Maturity Issuance Coupon ES0000011652 31/01/2008 15/07/1997 6.000 ES00000120H2 31/10/2008 17/01/2006 2.900 ES0000012882 31/01/2009 19/01/2004 3.600 ES0000012064 30/07/2009 10/07/1998 5.150 ES0000012239 31/01/2010 11/05/1999 4.000 ES00000120E9 30/07/2010 12/04/2005 3.250 ES00000120Z4 30/04/2011 15/01/2008 4.100 ES0000012387 30/07/2011 19/09/2000 5.400 ES0000012452 31/10/2011 12/06/2001 5.350 ES00000121I8 30/04/2012 13/01/2009 2.750 ES0000012791 30/07/2012 14/05/2002 5.000 ES00000120L4 31/10/2012 16/01/2007 3.900 ES0000011660 31/01/2013 15/07/1997 6.150 EH988544 30/04/2013 06/10/2009 2.300 ES0000012866 30/07/2013 15/04/2003 4.200 EI263529 31/10/2013 15/06/2010 2.500 ES00000121H0 31/01/2014 07/10/2008 4.250 ES00000123D5 30/04/2014 12/04/2011 3.400 ES0000012098 30/07/2014 07/12/1998 4.750 EH885945 31/10/2014 07/07/2009 3.300 ES0000012916 31/01/2015 28/06/2004 4.400 EI169668 30/04/2015 09/03/2010 3.000 ES00000123L8 30/07/2015 17/01/2012 4.000 ES00000120G4 31/01/2016 20/09/2005 3.150 ES00000122X5 30/04/2016 09/11/2010 3.250 ES00000123J2 31/10/2016 06/09/2011 4.250 ES00000120J8 31/01/2017 18/10/2006 3.800 ES0000012783 30/07/2017 11/03/2002 5.500 ES00000121A5 30/07/2018 19/02/2008 4.100 ES00000121L2 30/07/2019 10/02/2009 4.600 ES00000121O6 31/10/2019 02/06/2009 4.300 EI109866 30/04/2020 20/01/2010 4.000 ES00000122T3 31/10/2020 13/07/2010 4.850 ES00000123B9 30/04/2021 24/01/2011 5.500 ES00000123K0 31/01/2022 22/11/2011 5.850 ES00000121G2 31/01/2024 16/09/2008 4.800 EI153632 30/07/2025 24/02/2010 4.650 ES00000123C7 30/07/2026 15/03/2011 5.900 ES0000011868 31/01/2029 15/01/1998 6.000 ES0000012411 30/07/2032 23/01/2001 5.750 ES0000012932 31/01/2037 17/01/2005 4.200 ES00000120N0 03/07/2040 20/06/2007 4.900 EH984269 30/07/2041 28/09/2009 4.700
BANCO DE ESPAÑA 31 DOCUMENTO DE TRABAJO N.º 1429
Table A.5: German Government Bonds used for the estimation of the yield curve
ISIN Maturity Issuance Coupon DE0001137131 14/03/2008 10/03/2006 3.000 DE0001141422 11/04/2008 16/05/2003 3.000 DE0001137149 13/06/2008 23/06/2006 3.250 DE0001135077 04/07/2008 10/07/1998 4.750 DE0001135093 04/07/2008 30/10/1998 4.125 DE0001137156 12/09/2008 15/09/2006 3.500 DE0001141430 10/10/2008 10/10/2003 3.500 DE0001137164 12/12/2008 15/12/2006 3.750 DE0001135101 04/01/2009 08/01/1999 3.750 DE0001137172 13/03/2009 16/03/2007 3.750 DE0001141448 17/04/2009 13/02/2004 3.250 DE0001137180 12/06/2009 15/06/2007 4.500 DE0001137198 11/09/2009 14/09/2007 4.000 DE0001141455 09/10/2009 27/08/2004 3.500 DE0001137206 11/12/2009 14/12/2007 4.000 DE0001135135 04/01/2010 22/10/1999 5.375 DE0001137214 12/03/2010 14/03/2008 3.000 DE0001141463 09/04/2010 01/04/2005 3.250 DE0001137222 11/06/2010 13/06/2008 4.750 DE0001135150 04/07/2010 05/05/2000 5.250 DE0001137230 10/09/2010 12/09/2008 4.000 DE0001141471 08/10/2010 23/09/2005 2.500 DE0001137248 10/12/2010 12/12/2008 2.250 DE0001135168 04/01/2011 20/10/2000 5.250 DE0001137255 11/03/2011 13/03/2009 1.250 DE0001141489 08/04/2011 24/03/2006 3.500 DE0001137263 10/06/2011 29/05/2009 1.500 DE0001135184 04/07/2011 25/05/2001 5.000 DE0001137271 16/09/2011 11/09/2009 1.250 DE0001141497 14/10/2011 29/09/2006 3.500 DE0001137289 16/12/2011 20/11/2009 1.250 DE0001135192 04/01/2012 04/01/2002 5.000 DE0001137297 16/03/2012 19/02/2010 1.000 DE0001141505 13/04/2012 30/03/2007 4.000 DE0001137305 15/06/2012 14/05/2010 0.500 DE0001135200 04/07/2012 05/07/2002 5.000 DE0001137313 14/09/2012 13/08/2010 0.750 DE0001141513 12/10/2012 28/09/2007 4.250 DE0001137321 14/12/2012 12/11/2010 1.000 DE0001135218 04/01/2013 10/01/2003 4.500 DE0001137339 15/03/2013 25/02/2011 1.500 DE0001141521 12/04/2013 28/03/2008 3.500 DE0001137347 14/06/2013 13/05/2011 1.750 DE0001137354 13/09/2013 19/08/2011 0.750 DE0001141539 11/10/2013 26/09/2008 4.000 DE0001137362 13/12/2013 18/11/2011 0.250 DE0001135242 04/01/2014 31/10/2003 4.250 DE0001137370 14/03/2014 24/02/2012 0.250 DE0001141547 11/04/2014 27/03/2009 2.250 DE0001135259 04/07/2014 28/05/2004 4.250 DE0001141554 10/10/2014 25/09/2009 2.500 DE0001135267 04/01/2015 26/11/2004 3.750 DE0001141562 27/02/2015 15/01/2010 2.500 DE0001141570 10/04/2015 16/04/2010 2.250 DE0001135283 04/07/2015 20/05/2005 3.250 DE0001141588 09/10/2015 24/09/2010 1.750 DE0001135291 04/01/2016 25/11/2005 3.500 DE0001141596 26/02/2016 14/01/2011 2.000 DE0001141604 08/04/2016 26/04/2011 2.750 DE0001135309 04/07/2016 19/05/2006 4.000 DE0001141612 14/10/2016 30/09/2011 1.250 DE0001135317 04/01/2017 17/11/2006 3.750 DE0001141620 24/02/2017 13/01/2012 0.750 DE0001135333 04/07/2017 25/05/2007 4.250
BANCO DE ESPAÑA 32 DOCUMENTO DE TRABAJO N.º 1429
ISIN Maturity Issuance Coupon DE0001135341 04/01/2018 16/11/2007 4.000 DE0001135358 04/07/2018 30/05/2008 4.250 DE0001135374 04/01/2019 14/11/2008 3.750 DE0001135382 04/07/2019 22/05/2009 3.500 DE0001135390 04/01/2020 13/11/2009 3.250 DE0001135408 04/07/2020 30/04/2010 3.000 DE0001135416 04/09/2020 20/08/2010 2.250 DE0001135424 04/01/2021 26/11/2010 2.500 DE0001135440 04/07/2021 29/04/2011 3.250 DE0001135457 04/09/2021 26/08/2011 2.250 DE0001135465 04/01/2022 25/11/2011 2.000 DE0001135473 04/07/2022 13/04/2012 1.75 DE0001134922 04/01/2024 04/01/1994 6.250 DE0001135044 04/07/2027 04/07/1997 6.500 DE0001135069 04/01/2028 23/01/1998 5.625 DE0001135143 04/01/2030 21/01/2000 6.250 DE0001135176 04/01/2031 27/10/2000 5.500 DE0001135226 04/07/2034 31/01/2003 4.750 DE0001135275 04/01/2037 28/01/2005 4.000 DE0001135325 04/07/2039 26/01/2007 4.250 DE0001135366 04/07/2040 25/07/2008 4.750 DE0001135432 04/07/2042 23/07/2010 3.25
BANCO DE ESPAÑA 33 DOCUMENTO DE TRABAJO N.º 1429
Table A.6: French Government Bonds used for the estimation of the yield curve
ISIN Maturity Issuance Coupon FR0105427795 12/01/2008 28/01/2003 3.500 FR0108197569 12/03/2008 22/11/2005 2.750 FR0000570632 25/04/2008 15/01/1998 5.250 FR0105760112 12/07/2008 24/06/2003 3.000 FR0109136137 12/09/2008 25/07/2006 3.500 FR0000570665 25/10/2008 25/06/1992 8.500 FR0106589437 12/01/2009 22/01/2004 3.500 FR0000571432 25/04/2009 08/10/1998 4.000 FR0106841887 12/07/2009 22/06/2004 3.500 FR0110979178 12/09/2009 24/04/2007 4.000 FR0000186199 25/10/2009 12/05/1999 4.000 FR0107369672 12/01/2010 23/11/2004 3.000 FR0000186603 25/04/2010 08/02/2000 5.500 FR0107674006 12/07/2010 21/06/2005 2.500 FR0113872776 12/09/2010 20/05/2008 3.750 FR0000187023 25/10/2010 12/09/2000 5.500 FR0108354806 12/01/2011 24/01/2006 3.000 FR0000570731 25/04/2011 26/02/1996 6.500 FR0108847049 12/07/2011 20/06/2006 3.500 FR0116843519 12/09/2011 26/05/2009 1.500 FR0000187874 25/10/2011 11/09/2001 5.000 FR0109970386 12/01/2012 23/01/2007 3.750 FR0000188328 25/04/2012 12/03/2002 5.000 FR0110979186 12/07/2012 26/06/2007 4.500 FR0000188690 25/10/2012 10/09/2002 4.750 FR0000570780 26/12/2012 25/02/1987 8.500 FR0113087466 12/01/2013 22/01/2008 3.750 FR0000188989 25/04/2013 11/03/2003 4.000 FR0114683842 12/07/2013 22/07/2008 4.500 FR0010011130 25/10/2013 09/09/2003 4.000 FR0010061242 25/04/2014 09/03/2004 4.000 FR0010112052 25/10/2014 07/09/2004 4.000 FR0117836652 15/01/2015 26/01/2010 2.500 FR0010163543 25/04/2015 08/02/2005 3.500 FR0118462128 12/07/2015 22/06/2010 2.000 FR0010216481 25/10/2015 12/07/2005 3.000 FR0119105809 25/02/2016 25/01/2011 2.250 FR0010288357 25/04/2016 07/02/2006 3.250 FR0119580050 25/07/2016 21/06/2011 2.500 FR0000187361 25/10/2016 06/02/2001 5.000 FR0120473253 25/02/2017 21/02/2012 1.750 FR0010415331 25/04/2017 09/01/2007 3.750 FR0010517417 25/10/2017 11/09/2007 4.250 FR0010604983 25/04/2018 08/04/2008 4.000 FR0010670737 25/10/2018 07/10/2008 4.250 FR0000189151 25/04/2019 10/06/2003 4.250 FR0000570921 25/10/2019 25/01/1989 8.500 FR0010776161 25/10/2019 07/07/2009 3.750 FR0010854182 25/04/2020 09/02/2010 3.500 FR0010949651 25/10/2020 12/10/2010 2.500 FR0010192997 25/04/2021 10/05/2005 3.750 FR0011059088 25/10/2021 07/06/2011 3.250 FR0011196856 25/04/2022 07/02/2012 3.000 FR0000571085 25/04/2023 27/01/1992 8.500 FR0010466938 25/10/2023 09/05/2007 4.250 FR0000571150 25/10/2025 25/02/1994 6.000 FR0010916924 25/04/2026 06/07/2010 3.500 FR0000571218 25/04/2029 12/03/1998 5.500 FR0000187635 25/10/2032 12/06/2001 5.750 FR0010070060 25/04/2035 06/04/2004 4.750 FR0010371401 25/10/2038 12/09/2006 4.000 FR0010773192 25/04/2041 30/06/2009 4.500 FR0010171975 25/04/2055 28/02/2005 4.000
BANCO DE ESPAÑA PUBLICATIONS
WORKING PAPERS
1301 JAMES COSTAIN and ANTON NAKOV: Logit price dynamics.
1302 MIGUEL GARCÍA-POSADA: Insolvency institutions and effi ciency: the Spanish case.
1303 MIGUEL GARCÍA-POSADA and JUAN S. MORA-SANGUINETTI: Firm size and judicial effi cacy: evidence for the new
civil procedures in Spain.
1304 MAXIMO CAMACHO and GABRIEL PEREZ-QUIROS: Commodity prices and the business cycle in Latin America: living
and dying by commodities?
1305 CARLOS PÉREZ MONTES: Estimation of regulatory credit risk models.
1306 FERNANDO LÓPEZ VICENTE: The effect of foreclosure regulation: evidence for the US mortgage market at state level.
1307 ENRIQUE MORAL-BENITO and LUIS SERVEN: Testing weak exogeneity in cointegrated panels.
1308 EMMA BERENGUER, RICARDO GIMENO and JUAN M. NAVE: Term structure estimation, liquidity-induced
heteroskedasticity and the price of liquidity risk.
1309 PABLO HERNÁNDEZ DE COS and ENRIQUE MORAL-BENITO: Fiscal multipliers in turbulent times: the case of Spain.
1310 SAMUEL HURTADO: DSGE models and the Lucas critique.
1311 HENRIQUE S. BASSO and JAMES COSTAIN: Fiscal delegation in a monetary union with decentralized public spending.
1312 MAITE BLÁZQUEZ CUESTA and SANTIAGO BUDRÍA: Does income deprivation affect people’s mental well-being?
1313 ENRIQUE ALBEROLA, ÁNGEL ESTRADA and DANIEL SANTABÁRBARA: Growth beyond imbalances. Sustainable
growth rates and output gap reassessment.
1314 CARMEN BROTO and GABRIEL PEREZ-QUIROS: Disentangling contagion among sovereign CDS spreads during the
European debt crisis.
1315 MIGUEL GARCÍA-POSADA and JUAN S. MORA-SANGUINETTI: Are there alternatives to bankruptcy? A study of small
business distress in Spain.
1316 ROBERTO RAMOS and ENRIQUE MORAL-BENITO: Agglomeration matters for trade.
1317 LAURA HOSPIDO and GEMA ZAMARRO: Retirement patterns of couples in Europe.
1318 MAXIMO CAMACHO, GABRIEL PEREZ-QUIROS and PILAR PONCELA: Short-term forecasting for empirical
economists. A survey of the recently proposed algorithms.
1319 CARLOS PÉREZ MONTES: The impact of interbank and public debt markets on the competition for bank deposits.
1320 OLYMPIA BOVER, JOSE MARIA CASADO, SONIA COSTA, PHILIP DU CAJU, YVONNE MCCARTHY,
EVA SIERMINSKA, PANAGIOTA TZAMOURANI, ERNESTO VILLANUEVA and TIBOR ZAVADIL: The distribution
of debt across euro area countries: the role of Individual characteristics, institutions and credit conditions.
1321 BRINDUSA ANGHEL, SARA DE LA RICA and AITOR LACUESTA: Employment polarisation in Spain over the course of
the 1997-2012 cycle.
1322 RODOLFO G. CAMPOS and ILIANA REGGIO: Measurement error in imputation procedures.
1323 PABLO BURRIEL and MARÍA ISABEL GARCÍA-BELMONTE: Meeting our D€STINY. A Disaggregated €uro area Short
Term Indicator model to forecast GDP (Y) growth.
1401 TERESA SASTRE and FRANCESCA VIANI: Countries’ safety and competitiveness, and the estimation of current
account misalignments.
1402 FERNANDO BRONER, ALBERTO MARTIN, AITOR ERCE and JAUME VENTURA: Sovereign debt markets in turbulent
times: creditor discrimination and crowding-out effects.
1403 JAVIER J. PÉREZ and ROCÍO PRIETO: The structure of sub-national public debt: liquidity vs credit risks.
1404 BING XU, ADRIAN VAN RIXTEL and MICHIEL VAN LEUVENSTEIJN: Measuring bank competition in China:
a comparison of new versus conventional approaches applied to loan markets.
1405 MIGUEL GARCÍA-POSADA and JUAN S. MORA-SANGUINETTI: Entrepreneurship and enforcement institutions:
disaggregated evidence for Spain.
1406 MARIYA HAKE, FERNANDO LÓPEZ-VICENTE and LUIS MOLINA: Do the drivers of loan dollarisation differ between
CESEE and Latin America? A meta-analysis.
1407 JOSÉ MANUEL MONTERO and ALBERTO URTASUN: Price-cost mark-ups in the Spanish economy: a microeconomic
perspective.
1408 FRANCISCO DE CASTRO, FRANCISCO MARTÍ, ANTONIO MONTESINOS, JAVIER J. PÉREZ and A. JESÚS
SÁNCHEZ-FUENTES: Fiscal policies in Spain: main stylised facts revisited.
1409 MARÍA J. NIETO: Third-country relations in the Directive establishing a framework for the recovery and resolution
of credit institutions.
1410 ÓSCAR ARCE and SERGIO MAYORDOMO: Short-sale constraints and fi nancial stability: evidence from
the Spanish market.
1411 RODOLFO G. CAMPOS and ILIANA REGGIO: Consumption in the shadow of unemployment.
1412 PAUL EHLING and DAVID HAUSHALTER: When does cash matter? Evidence for private fi rms.
1413 PAUL EHLING and CHRISTIAN HEYERDAHL-LARSEN: Correlations.
1414 IRINA BALTEANU and AITOR ERCE: Banking crises and sovereign defaults in emerging markets: exploring the links.
1415 ÁNGEL ESTRADA, DANIEL GARROTE, EVA VALDEOLIVAS and JAVIER VALLÉS: Household debt and uncertainty:
private consumption after the Great Recession.
1416 DIEGO J. PEDREGAL, JAVIER J. PÉREZ and A. JESÚS SÁNCHEZ-FUENTES: A toolkit to strengthen government
budget surveillance.
1417 J. IGNACIO CONDE-RUIZ, and CLARA I. GONZÁLEZ: From Bismarck to Beveridge: the other pension reform in Spain.
1418 PABLO HERNÁNDEZ DE COS, GERRIT B. KOESTER, ENRIQUE MORAL-BENITO and CHRISTIANE NICKEL:
Signalling fi scal stress in the euro area: a country-specifi c early warning system.
1419 MIGUEL ALMUNIA and DAVID LÓPEZ-RODRÍGUEZ: Heterogeneous responses to effective tax enforcement:
evidence from Spanish fi rms.
1420 ALFONSO R. SÁNCHEZ: The automatic adjustment of pension expenditures in Spain: an evaluation of the 2013
pension reform.
1421 JAVIER ANDRÉS, ÓSCAR ARCE and CARLOS THOMAS: Structural reforms in a debt overhang.
1422 LAURA HOSPIDO and ENRIQUE MORAL-BENITO: The public sector wage premium in Spain: evidence from
longitudinal administrative data.
1423 MARÍA DOLORES GADEA-RIVAS, ANA GÓMEZ-LOSCOS and GABRIEL PÉREZ-QUIRÓS: The Two Greatest. Great
Recession vs. Great Moderation.
1424 ENRIQUE MORAL-BENITO and OLIVER ROEHN: The impact of fi nancial (de)regulation on current account balances.
1425 MÁXIMO CAMACHO and JAIME MARTÍNEZ-MARTÍN: Real-time forecasting US GDP from small-scale factor models.
1426 ALFREDO MARTÍN OLIVER, SONIA RUANO PARDO and VICENTE SALAS FUMÁS: Productivity and welfare: an
application to the Spanish banking industry.
1427 JAVIER ANDRÉS and PABLO BURRIEL: Infl ation dynamics in a model with fi rms’ entry and (some) heterogeneity.
1428 CARMEN BROTO and LUIS MOLINA: Sovereign ratings and their asymmetric response to fundamentals.
1429 JUAN ÁNGEL GARCÍA and RICARDO GIMENO: Flight-to-liquidity fl ows in the euro area sovereign debt crisis.
Unidad de Servicios AuxiliaresAlcalá, 48 - 28014 Madrid
E-mail: [email protected]