Flight Performance - Heathrow Airport · Page 4 Flight Performance – Annual Report 2015 IT...
48
Annual Report 2015 Flight Performance
-
Upload
nguyenkhuong -
Category
Documents
-
view
222 -
download
0
Transcript of Flight Performance - Heathrow Airport · Page 4 Flight Performance – Annual Report 2015 IT...
Annual Report 2015
Flight Performance
Page 2 Flight Performance – Annual Report 2015
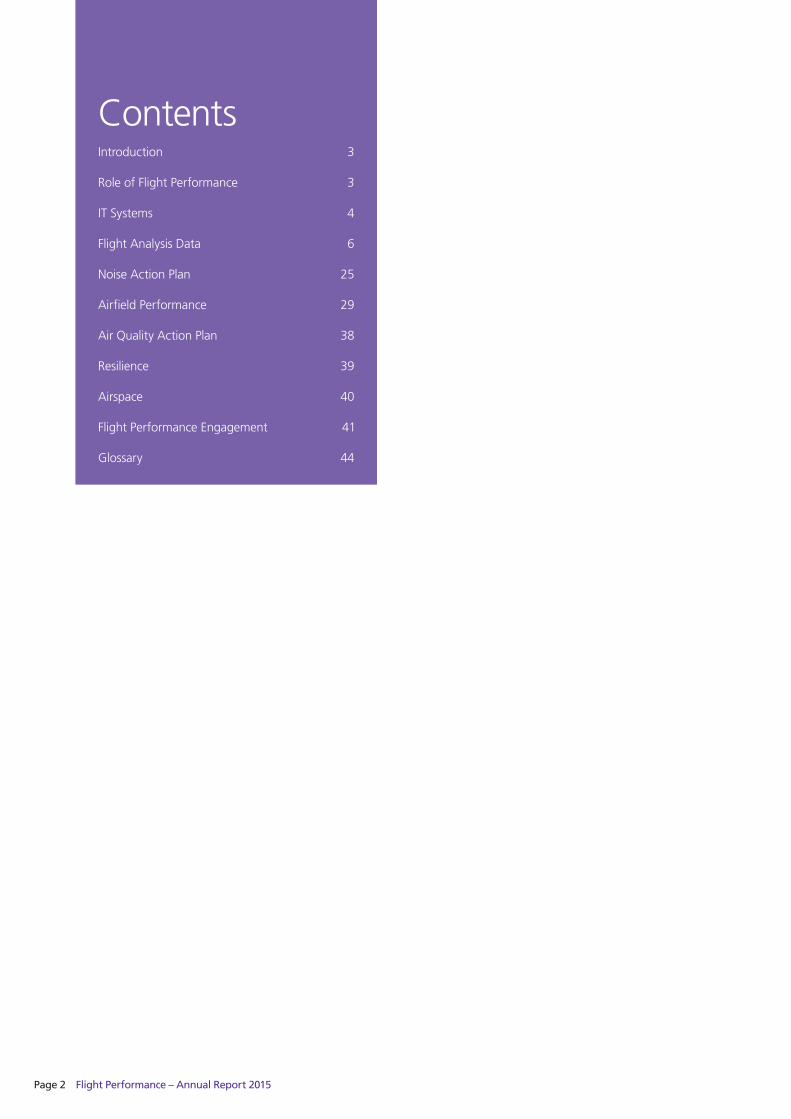
ContentsIntroduction 3 Role of Flight Performance 3
IT Systems 4
Flight Analysis Data 6
Noise Action Plan 25
Airfield Performance 29
Air Quality Action Plan 38
Resilience 39
Airspace 40
Flight Performance Engagement 41
Glossary 44
Flight Performance – Annual Report 2015 Page 3
We have three key areas of responsibility where we carry out daily/weekly/monthly monitoring, reporting and root cause analysis of specific issues to ensure compliance with statutory requirements and to enable Heathrow to continually assess the operational and environmental performance of its airspace and airfield operations.
What we do •Manageaircraft-relatedenvironmentalissuese.g.noise,airqualityandclimatechange. •Safeguardthecapabilityandtakeactionstodriveuptheefficiencyoftheairfield. •Feedintostrategicareasrelatingtothelong-termgrowthoftheairportwithhistoricdataandreportsdepictingtrends.
How we do it •WeleadontrialstoimproveenvironmentalandoperationalefficiencyandrespondtoconsultationsonmattersrelatingtoAir
TrafficManagement(ATM),airspacedevelopmentandenvironmentalissues.Weundertakehorizonscansandidentifythreatsto our airfield performance, working to mitigate and limit the impact.
•WeareambassadorsforHeathrowAirsideOperationsonmattersrelatingtogovernmentpoliciesandprocesseswiththeDepartmentforTransport(DfT)andtheMinistryofDefence.
•Weleadonoperationalinputregardingcapacitymanagementandrunwayresilience. •Weensurethataircraftnoiseandtrackkeeping(NTK)aremonitoredinlinewiththeDfTandourownrequirements. •WeareaccountableforaspectsofoperationalenvironmentalcomplianceandwedelivertheAirsideOperationsfacetsofthe
Noise and Air Quality Action plans. •WeworkonresearchanddevelopmentwithgroupssuchasSustainableAviationandtheAirportOperatorsAssociation(AOA). •Weprovidetechnicalanalysisfortheonwarddisseminationtomembersofthepublicregardingenquiriesrelatingtohow
airport operations may affect them.
IntroductionThisreport,producedbyHeathrowAirsideOperationsFlightPerformance(FP)Team,containsdetaileddataonarangeofkeyissuesrelated to noise and air quality management, performance metrics and airspace projects that FP delivers. The report covers the calendar year of 2015, with the exception of the data relating to night flights as they are managed and reported as separate summer and winter seasons.
Further detailed information on our noise strategy, abatement procedures, targets and mitigation schemes can be found on our dedicated noise website along with all our public reporting. Additional material on air quality, including how and what we monitor and our constant reporting, is available on our separate dedicated air quality website.
Ourwebsitedetailsare:www.heathrow.com/noise and www.heathrowairwatch.org.uk
Role of Flight Performance

Page 4 Flight Performance – Annual Report 2015
IT SystemsToenableustomonitortheperformanceoftheHeathrowoperationwemakeuseofairport-widesystems,togetherwiththefollowingFP-ownedassets:
AirportNoiseandOperationsManagementSystem(ANOMS)ANOMSisthemainnoiseandtrackkeepingsystematHeathrow.ANOMSreceivesradardatafromNATS(AirNavigationServicesProvider)AirTrafficControl(ATC)radars,whichprovidesinformationabouttheheightofanaircraftaboveairportelevation,thetrackithasflown,itsgroundspeedatanyparticularpointandtheaircraft’scall-sign.
Thecall-signisthencrossreferencedwithairtrafficlogs,whichprovidedatasuchastheaircraftoperator,aircrafttypeanddestination or origin. Additionally, the system automatically receives data overnight from a series of permanent noise monitors located around the airport. The locations of the permanent monitors and the noise limits, which apply to departing aircraft only, are prescribed by the DfT. The noise events recorded at the monitors are then matched to the aircraft track details. Its primary purpose is tomonitorairlineperformanceagainstKeyPerformanceIndicators.ANOMSmeasuresaircraftagainstthefollowing:
•AdherencetotheNPRs(NoisePreferentialRoutes). •Adherencetothegovernment-setnoiselimitsfordepartingaircraft. •1000ftcompliance. •CompliancewiththedayandnightInstrumentLandingSystem(ILS)JoiningPointprocedures. •MonitoringofContinuousDescentApproaches(CDA). •ReportingontheuseofNightJetMovementsandreportingtointernalandtoexternalstakeholdersonusage.
Additionally,ANOMShastheflexibilitytotrackandreportonanyoperationaltrialsrunbyHeathrow.Itisthesolesystemcapableofreportingontheoutcomesandfacilitatestheidentificationoftrialbenefits,anddis-benefits.Furtherdetailsofthetrialsappearlaterin this report.
2015wasthefirstfullyearoftheFlightPerformanceprojecttorefreshourNTKsystems.Theaimofthisthree-yearprojectistodevelop a ‘real time’ system capable of informing our airline partners of environmental compliance, better informing our local communities through new community tools, an enabler to Flight Performance to assist us in driving airline performance and the ability to better analyse aircraft performance on the airfield.
WebTrak WebTrak is an online system that allows those affected by aircraft operations at Heathrow to locate their residence and view how aircraft operate in their area. It has been in operation at Heathrow since 2008 and, following community feedback, can show flight tracksoverthepast12months.AspartoftheNTKrefreshprojectabove,the24-hourdelayhasbeenreducedto20minutes.WebTrak has gone through several upgrades since it was first implemented, the most notable being clearer mapping capability. A further upgrade, allowing postcode elevations to be calculated against aircraft height, will follow this year. WebTrak is currently running the latest version 5.1.1 Onceauserhasidentifiedtheoperationthatcausedthemannoyance,theycancomplainviaWebTrakwheretheircomplaintgetsloggeddirectlyintothemainNTKANOMS.WebTrakcanbeviewedfromwww.heathrow.com/noise
Flight Performance – Annual Report 2015 Page 5
WebTrakMyNeighbourhoodIn2014welaunchedanewonlinetoolcalledWebTrakMyNeighbourhood.ThisisinadditiontoourcurrentWebTraksystem.ThenewWebTrakMyNeighbourhoodsystemgivesageneraloverviewofwhereaircraftfly,allowingtheusertogetabetterunderstanding of Heathrow’s operations over time. Aircraft operations can be looked at over various periods, monthly, quarterly or annually.Inadditionthevieweddatacanbebrokendownbyperiodofday,day-time,night-time,evening,workdaysandweekends.Amorelocation-specifictooliscurrentlyunderdevelopmentandwillberolledouttothepublicin2016.
AirTrak AirTrak provides airports with a tool that measures carbon output from each phase of aviation activity. Airports can use this informationtoimplement,monitorandmeasurethesuccessofcarbon-reducingactivitiesovertime.Heathrowacquiredthesysteminmid-2012toevaluatetheproductandcheckitfordataaccuracyandsuitability.WearelookingtoenhancethisproductaspartofourNTKrefreshprojectoverthenext24monthsbeforedeployingit.
AirfieldDisruptionandDelayImpactCalculationTool(ADDICT)In 2015 FP has further developed the tool that was first rolled out the year before, mostly focusing on enhancing existing functionalitieswiththeobjectivetocreatea‘one-stopshop’solutionforpre-tacticalandtacticalplanningofaircraftflowanddemandandcapacitybalancingissues.TheprimaryfunctionofthetoolistosupportbothD-1andD0planningactivities,althoughinadditiontoperformanceforecastingthetoolhasbeenalsousedforretrospective‘what-if’scenariotestingpurposes.

Page 6 Flight Performance – Annual Report 2015
Flight Analysis DataThis data is produced by FP throughout the year. In order to set it in context, it is necessary to explain Heathrow aircraft operations.
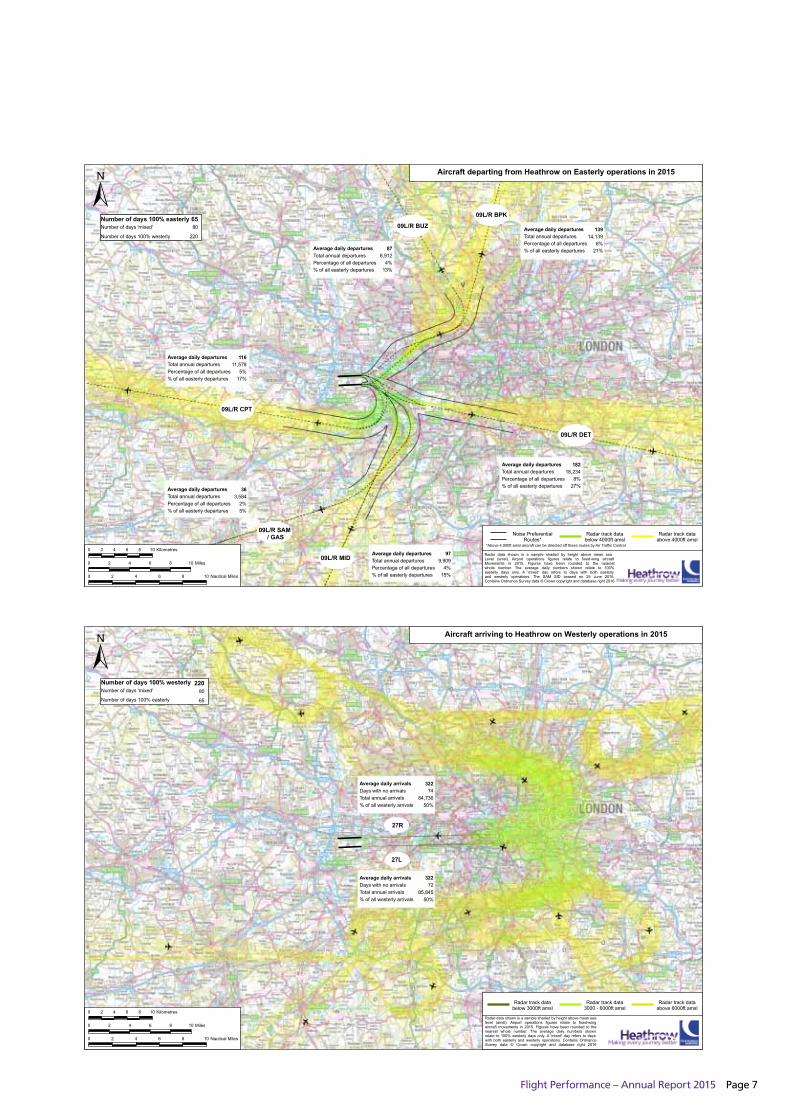
Heathrow has parallel runways commonly referred to as the Northern and Southern runways, lying west to east. These facilitate arrivalsanddeparturesresultinginmovementsfromfourdistinctrunwayends;27R,27L,09Rand09R.BelowarediagramsproducedbytheCivilAviationAuthority(CAA)whichshowthearrivalanddepartureroutesfromHeathrowAirport,alongwiththepercentage bias for each route that is used.
Aircraft arriving to Heathrow on Easterly operations in 2015
Radar track databelow 3000ft amsl
Radar track data3000 - 6000ft amsl
Radar track dataabove 6000ft amsl
0 2 4 6 8 10 Nautical Miles
0 2 4 6 8 10 Miles
0 2 4 6 8 10 KilometresRadar data shown is a sample shaded by height above mean sealevel (amsl). Airport operations figures relate to fixed-wingaircraft movements in 2015. Figures have been rounded to thenearest whole number. The average daily numbers shownrelate to 100% easterly days only. A 'mixed' day refers to dayswith both easterly and westerly operations. Contains OrdnanceSurvey data © Crown copyright and database right 2016
65Number of days 100% easterlyNumber of days 'mixed' 80
220Number of days 100% westerly
Average daily arrivals
% of all easterly arrivalsTotal annual arrivalsDays with no arrivals
610234
61,68593%
Average daily arrivals
% of all easterly arrivalsTotal annual arrivalsDays with no arrivals
46231
4,7347%
09L
09R
Flight Performance – Annual Report 2015 Page 7
Aircraft arriving to Heathrow on Westerly operations in 2015
Radar track databelow 3000ft amsl
Radar track data3000 - 6000ft amsl
Radar track dataabove 6000ft amsl
Radar data shown is a sample shaded by height above mean sealevel (amsl). Airport operations figures relate to fixed-wingaircraft movements in 2015. Figures have been rounded to thenearest whole number. The average daily numbers shownrelate to 100% westerly days only. A 'mixed' day refers to dayswith both easterly and westerly operations. Contains OrdnanceSurvey data © Crown copyright and database right 2016
0 2 4 6 8 10 Nautical Miles
0 2 4 6 8 10 Miles
0 2 4 6 8 10 Kilometres
32274
84,73650%
Average daily arrivals
% of all westerly arrivalsTotal annual arrivalsDays with no arrivals
32272
85,84550%
Average daily arrivals
% of all westerly arrivalsTotal annual arrivalsDays with no arrivals
220Number of days 100% westerlyNumber of days 'mixed' 80
65Number of days 100% easterly
27R
27L
Aircraft departing from Heathrow on Easterly operations in 2015
Average daily departures
Percentage of all departures% of all easterly departures
116
5%17%
Noise PreferentialRoutes*
Radar track databelow 4000ft amsl
Radar track dataabove 4000ft amsl
*Above 4,000ft amsl aircraft can be directed off these routes by Air Traffic Control
0 2 4 6 8 10 Nautical Miles
0 2 4 6 8 10 Miles
0 2 4 6 8 10 KilometresRadar data shown is a sample shaded by height above mean sea Level (amsl). Airport operations figures relate to fixed-wing aircraftMovements in 2015. Figures have been rounded to the nearestwhole number. The average daily numbers shown relate to 100%easterly days only. A 'mixed' day refers to days with both easterlyand westerly operations. The SAM SID ceased on 25 June 2015.Contains Ordnance Survey data © Crown copyright and database right 2016
Total annual departures 11,578
Average daily departures
Percentage of all departures% of all easterly departures
87
4%13%
Total annual departures 8,912
Average daily departures
Percentage of all departures% of all easterly departures
139
6%21%
Total annual departures 14,139
Average daily departures
Percentage of all departures% of all easterly departures
182
8%27%
Total annual departures 18,234
Average daily departures
Percentage of all departures% of all easterly departures
36
2%5%
Total annual departures 3,584
Average daily departures
Percentage of all departures% of all easterly departures
97
4%15%
Total annual departures 9,909
86Number days 100% easterlyNumber days 'Mixed' 86
193Number days 100% westerly
65Number of days 100% easterlyNumber of days 'mixed' 80
220Number of days 100% westerly
09L/R CPT
09L/R BUZ
09L/R BPK
09L/R DET
09L/R SAM / GAS
09L/R MID

Page 8 Flight Performance – Annual Report 2015
Aircraft departing from Heathrow on Westerly operations in 2015
Noise PreferentialRoutes*
Radar track databelow 4000ft amsl
Radar track dataabove 4000ft amsl
*Above 4,000ft amsl aircraft can be directed off these routes by Air Traffic Control
0 2 4 6 8 10 Nautical Miles
0 2 4 6 8 10 Miles
0 2 4 6 8 10 KilometresRadar data shown is a sample shaded by height above mean sea Level (amsl). Airport operations figures relate to fixed-wing aircraftMovements in 2015. Figures have been rounded to the nearestwhole number. The average daily numbers shown relate to 100%westerly days only. A 'mixed' day refers to days with both easterlyand westerly operations. The SAM SID ceased on 25 June 2015.Contains Ordnance Survey data © Crown copyright and database right 2016
Average daily departures
Percentage of all departures% of all westerly departures
96
11%15%
Total annual departures 25,778
Average daily departures
Percentage of all departures% of all westerly departures
99
11%15%
Total annual departures 25,989
Average daily departures
Percentage of all departures% of all westerly departures
140
16%22%
Total annual departures 37,028
Average daily departures
Percentage of all departures% of all westerly departures
174
19%27%
Total annual departures 45,924
Average daily departures
Percentage of all departures% of all westerly departures
100
11%16%
Total annual departures 26,570
Average daily departures
Percentage of all departures% of all westerly departures
34
4%5%
Total annual departures 9,011
220Number of days 100% westerlyNumber of days 'mixed' 80
65Number of days 100% easterly
27L/R WOB
27L/R BPK
27L/R CPT
27L/R SAM / GOG
27L/R DET
27L/R MID
Flight Performance – Annual Report 2015 Page 9
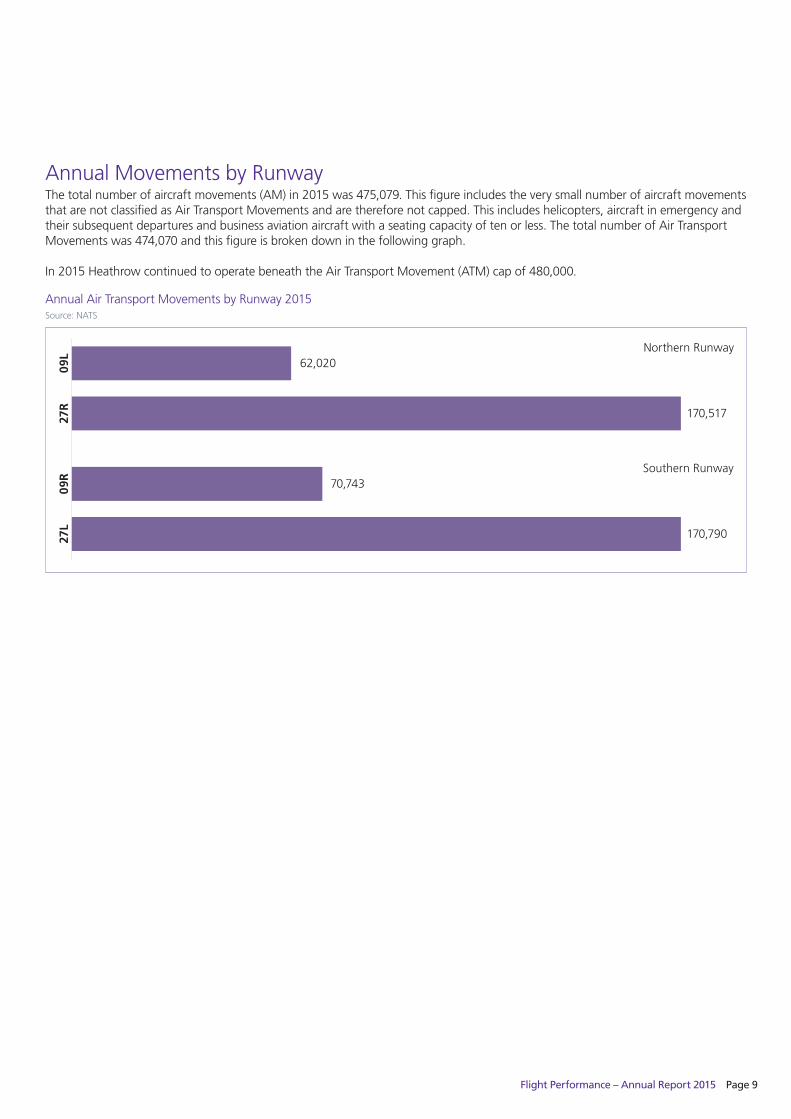
AnnualMovementsbyRunwayThetotalnumberofaircraftmovements(AM)in2015was475,079.ThisfigureincludestheverysmallnumberofaircraftmovementsthatarenotclassifiedasAirTransportMovementsandarethereforenotcapped.Thisincludeshelicopters,aircraftinemergencyandtheir subsequent departures and business aviation aircraft with a seating capacity of ten or less. The total number of Air Transport Movementswas474,070andthisfigureisbrokendowninthefollowinggraph.
In2015HeathrowcontinuedtooperatebeneaththeAirTransportMovement(ATM)capof480,000.
62,02009L
170,51727R
70,74309R
170,79027L
Northern Runway
Southern Runway
AnnualAirTransportMovementsbyRunway2015Source:NATS

Page 10 Flight Performance – Annual Report 2015
MovementsbyAircraftTypeThe mix of aircraft types has remained relatively consistent, although, the frequency of Airbus A380 usage continues to increase year onyearfromitsentryintoservicein2008.Ofnotefor2015isthecontinuedincreaseinB787operationsintoHeathrowandthecontinueddeclineofA340,B747andB737operations.ThefiguresalsoshowaslightdeclineinA319/321movementsinfavourofthe A320 variant.
2014
2015
2013
0
20,000
40,000
60,000
80,000
100,000
120,000
160,000
140,000
A320 A319 A321 B747 B777 B737 A340 B767 B757 A330 MD80 A310B787A380 OtherCRJ
MovementsbyAircraftType2015Source:BOSS
Wind DirectionFor safety and performance reasons, aircraft must take off and land into the wind. The prevailing wind for the area comes from a westerlydirectionwhichmeansthataircraftwillusuallyarrivefromtheeast(thatisoverLondon)anddeparttothewest.Thisisknownaswesterlyoperations,andtherunwaysusedare27R(Northern)and27L(Southern).However,whenthewindiscomingfromtheeast,aircraftwillarrivefromthewest(thatisoverWindsor)anddeparttotheeast.Thisisknownaseasterlyoperationsandtherunwaysusedare09L(Northern)and09R(Southern).
At Heathrow, government policy dictates that, during the day, unless the wind is too strong, planes should always take off to the west(towardsWindsor);consequentlyaircraftwillarrivefromtheeast(overLondon).Thisisknownasthewesterlypreference.However,ifthesurfacewindisfromtheeastandisoverfiveknots,aircraftwilltakeofftotheeast(towardsLondon)andarrivefromthewest(overWindsor).
Westerly preference was introduced to reduce the number of people exposed to high levels of noise emitted by departing aircraft, by minimising the number of departures on easterly operations. At the time of its introduction, westerly preference operated 24 hours a day because the noise emitted by aircraft on departure was considered by the government to be the predominant issue, since it was much greater than that emitted by arriving aircraft.
In 2001, following consultation on the preference for the direction of operation of the airport at night, the DfT decided that the westerly preference should be replaced, at night, by a weekly rotation between westerly and easterly operations, whenever weather conditions permit.
The operation of a preference is dependent on a tailwind speed of less than five knots, dry runways and the absence of strong crosswinds, so the eventual split is always dependent on weather.

Flight Performance – Annual Report 2015 Page 11
DeparturesArrivals
09R09L27R27L
85,893 84,792
61,636
4,729
84,897 85,725
394
66,014
Arrivals and Departures by Runway 2015Source:NATS
Runway AlternationRunway alternation is a system at Heathrow which provides respite for local residents affected by arriving aircraft on the final approach to land. It applies only to arriving aircraft, although ATC endeavour to use the ‘other’ runway for departures where possible.
Duringdaytimeoperations,thehistoricCranfordAgreement(explainedonp13)preventsdeparturesfromtheNorthernrunwayoneasterlyoperations(09L),whichinturnpreventsrunwayalternation.Itispossible,however,tousealternationafterthelastdepartureatnightandbeforethefirstdeparturethefollowingmorning,therebyspreadingtheearlymorningarrivals(whichstartbeforethedepartures)betweenthetwofinalapproachpaths.
The combination of runway alternation and the westerly/ easterly preference arrangements results in distinct periods during which alternation operates.
• Day – westerly operations Onerunwayisusedforlandingsfrom06.00to15.00(seeparagraphbelowonthe06.00to07.00period)andtheotherfrom15.00untilafterthelastdeparture.ThisarrangementrunsforaweekfromMondaytoSunday.
• Day – easterly operations There is no runway alternation during the day on easterly operations due to the historic Cranford Agreement.
• Night – westerly and easterly operations After the last departure there is a separate night period until 06.00. During this period, if weather conditions permit, there is a weekly rotation between westerly and easterly operations.
• Between 06.00 and 07.00 InJanuary2009,thethenSecretaryofStateconfirmedthatrunwayalternationbetween06.00and07.00wouldremain,subjecttooperationalrequirements.Therefore,ifthereisabuild-upoftrafficintheholdingstacks,orwithinUKandneighbouringairspace,ATC may use both runways to land arriving aircraft in order to maintain a safe and efficient traffic flow.
Each rotation of the overall pattern, taking into account both runway alternation and the rotation of the westerly/easterly preference atnight,resultsinanoverallfour-weekpattern.
The graph below shows the movements on each runway.

Page 12 Flight Performance – Annual Report 2015
ArrivalsOutofAlternationThere are occasions when unforeseen circumstances mean that changes in the procedure need to be made at short notice. For example, it may be necessary for safety reasons to land aircraft on the runway not scheduled for landings. This may occur if an aircraft landing on the designated runway develops a problem which prevents it vacating in time for the next aircraft. The subsequent aircraft will then need to use the other runway until the first aircraft is able to vacate safely.
Sometimestheremaybeabuild-upofairtrafficbeingheldinthestack.Inaccordancewithagreedprocedurestherewillbeoccasions when ATC may land aircraft out of alternation while maintaining the usual high safety standards. In these circumstances, both runways will be used for arrivals for a short period.
Routine maintenance of runways, taxiways or associated equipment is often scheduled to coincide with the pattern of runway alternation. However, there will be occasions when it is not possible in order to facilitate maintenance or works of a longer duration e.g.runwayre-surfacingandworkofanunforeseen,urgentnature.
Weathercanalsoaffecttheuseofalternation.Forexample,occasionallystrongsouth-westerlywindscanblowacrossthevariousbuildingsinHeathrow’smaintenanceareaandaffectaircraftlandingonthenorthernrunwayonwesterlyoperationsduetobuilding-inducedturbulence.Also,infrequently,patchyfogoranoff-airportfirecancauselowervisibilityononerunwaycomparedwiththeother;consequently,ATCmaydecidetode-alternateforsafetyreasons.Thegraphbelowshowsthattheadherencethroughout2015 was fairly consistent with previous years.
2013 2014 2015
60%
70%
65%
75%
80%
85%
90%
95%
100%
Jan Feb Mar Apr May Jun Jul Aug Sep Oct Nov Dec
Adherence to Runway Alternation Plan 2015Source:NATS
Flight Performance – Annual Report 2015 Page 13
Cranford AgreementThe Cranford Agreement was a verbal agreement between the Government and the residents of Cranford, which dated from the 1950s. It was designed to protect the residents of Cranford from the high noise levels experienced from departing aircraft.
The agreement was that the northern runway would not be used for departures on easterly operations except in exceptional circumstances, which prevented runway alternation on easterly operations when departures operate, i.e. the majority of the time. However, when there are no departures – i.e. early in the morning – runway alternation is possible as mentioned above.
On15January2009,thethenSecretaryofStateconfirmedthattheCranfordAgreementnolongerappliedandthatthecurrentoperational arrangements should end as soon as reasonably possible. Ending the agreement allows the introduction of full runway alternation on easterlies. The Coalition Government affirmed their support for this in 2010. However, introducing full runway alternation on easterly operations presents challenges in terms of the airport’s infrastructure. The airport is not currently set up to operate with runway alternation on easterlies while maintaining the existing schedule, therefore changes need to be made to the airport’s access and exit taxiways.
TomakethesechangesHeathrowsubmittedaplanningapplicationtotheLondonBoroughofHillingdoninMay2013andthiswasrejectedinMarch2014.SincethenHeathrowhasappealedthedecision.AplanningenquirytookplaceinJune2015andtheoutcome of the enquiry is expected to be announced to be announced in 2016.
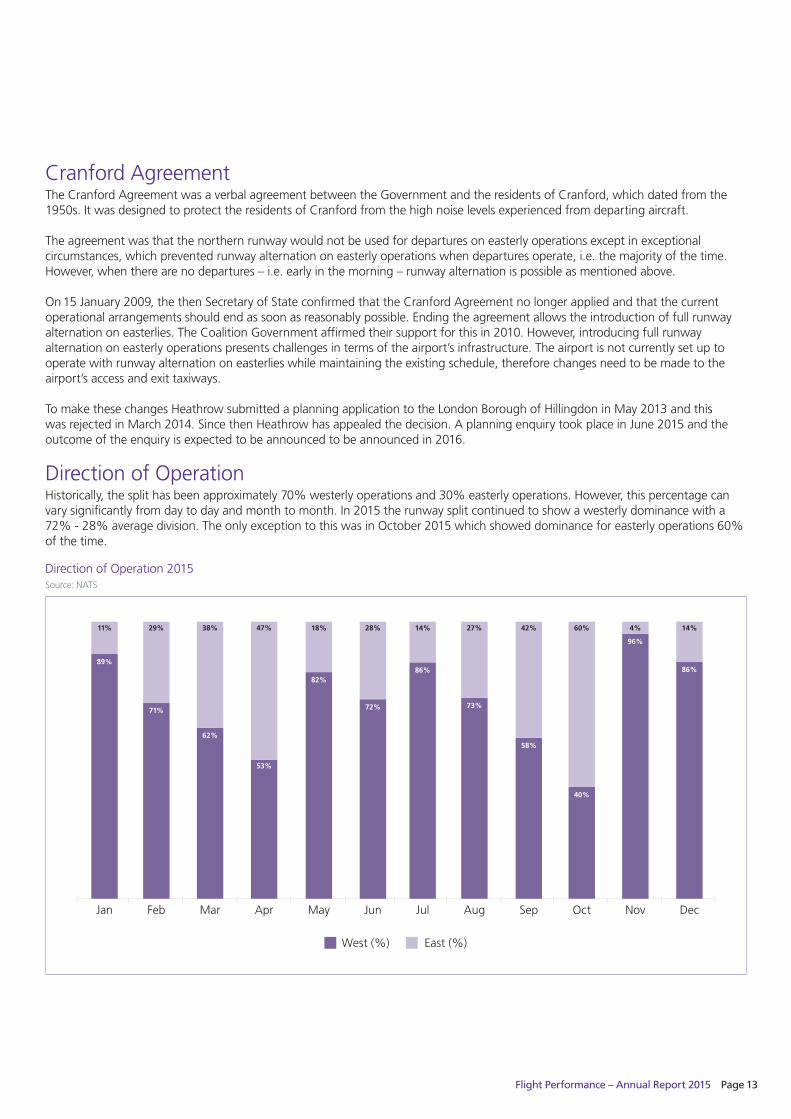
DirectionofOperationHistorically, the split has been approximately 70% westerly operations and 30% easterly operations. However, this percentage can vary significantly from day to day and month to month. In 2015 the runway split continued to show a westerly dominance with a 72%-28%averagedivision.TheonlyexceptiontothiswasinOctober2015whichshoweddominanceforeasterlyoperations60%of the time.
East (%)West (%)
Jan Feb Mar Apr May Jun Jul Aug Sep Oct Nov Dec
89%
11%
71%
29%
62%
38%
53%
47%
82%
18%
72%
28%
86%
14%
73%
27%
58%
42%
40%
60%
96%
4%
86%
14%
DirectionofOperation2015Source:NATS

Page 14 Flight Performance – Annual Report 2015
Jan Feb Mar Apr May Jun Jul Aug Sep Oct Nov Dec
56
45
51
39
72
4745
42
23
47
75
49
MissedApproaches(Go-arounds)2015Source:NATS
MissedApproaches(Go-arounds)Occasionallyitisnecessaryforanaircrafttocancelitslanding.Thereisanestablishedproceduretofollowwhenthisoccurs,knownasago-around,inwhichtheaircraftabortsthelandingandthenre-joinsthelandingpattern.Ago-aroundisawell-practicedandsafe procedure and is instigated by the pilot or on the instruction of ATC.
Althoughtherearemanyreasonsforago-around,themostcommonreasonisduetotheprecedingaircraftbeingslowtovacatethe runway. In 2014 there were 720 occurrences. This figure fell in 2015 where a total of 591 missed approaches were recorded. NovemberandMaysawhighincidencesofmissedapproachesandthiscanbeattributedtoinclementweather,particularlyrelatingto strong winds as experienced in November.
Flight Performance – Annual Report 2015 Page 15
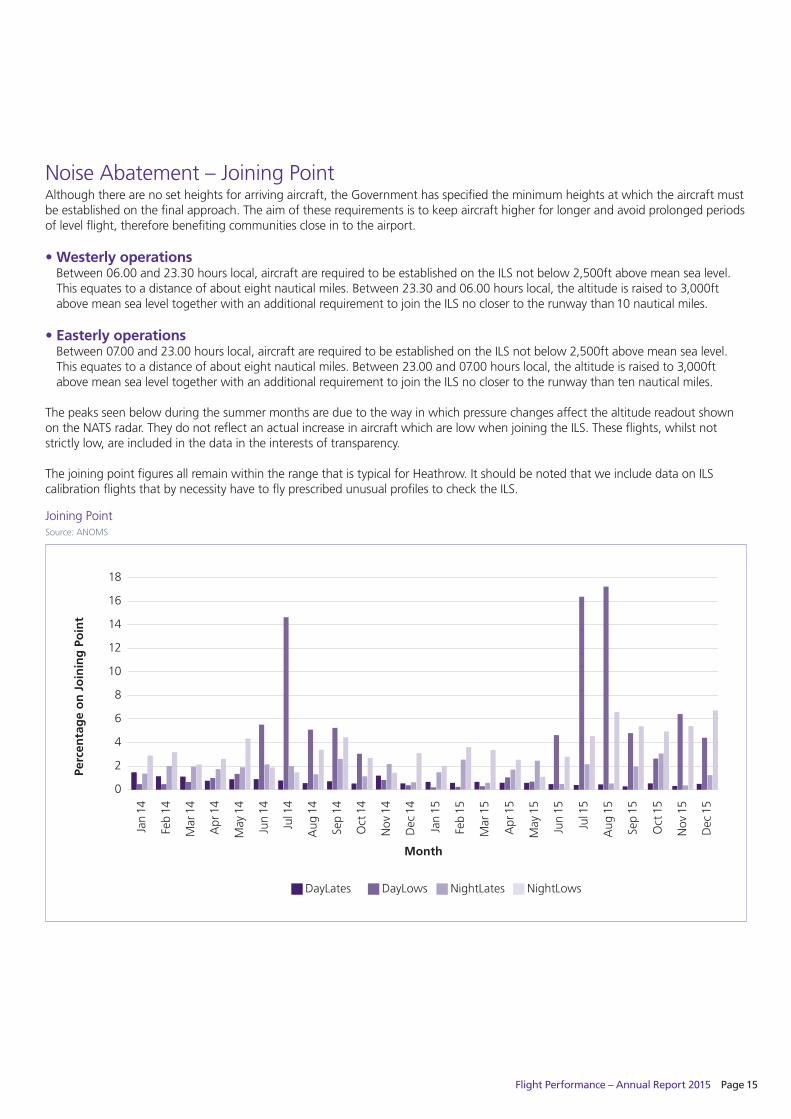
NoiseAbatement–JoiningPointAlthough there are no set heights for arriving aircraft, the Government has specified the minimum heights at which the aircraft must be established on the final approach. The aim of these requirements is to keep aircraft higher for longer and avoid prolonged periods of level flight, therefore benefiting communities close in to the airport.
• Westerly operations Between06.00and23.30hourslocal,aircraftarerequiredtobeestablishedontheILSnotbelow2,500ftabovemeansealevel.Thisequatestoadistanceofabouteightnauticalmiles.Between23.30and06.00hourslocal,thealtitudeisraisedto3,000ftabovemeansealeveltogetherwithanadditionalrequirementtojointheILSnoclosertotherunwaythan10nauticalmiles.
• Easterly operations Between07.00and23.00hourslocal,aircraftarerequiredtobeestablishedontheILSnotbelow2,500ftabovemeansealevel.Thisequatestoadistanceofabouteightnauticalmiles.Between23.00and07.00hourslocal,thealtitudeisraisedto3,000ftabovemeansealeveltogetherwithanadditionalrequirementtojointheILSnoclosertotherunwaythantennauticalmiles.
The peaks seen below during the summer months are due to the way in which pressure changes affect the altitude readout shown ontheNATSradar.TheydonotreflectanactualincreaseinaircraftwhicharelowwhenjoiningtheILS.Theseflights,whilstnotstrictly low, are included in the data in the interests of transparency.
ThejoiningpointfiguresallremainwithintherangethatistypicalforHeathrow.ItshouldbenotedthatweincludedataonILScalibrationflightsthatbynecessityhavetoflyprescribedunusualprofilestochecktheILS.
0
2
8
6
10
4
14
18
12
16
Month
Perc
enta
ge
on
Jo
inin
g P
oin
t
DayLates DayLows NightLates NightLows
Jan
14
Feb
14
Mar
14
Apr
14
May
14
Jun
14
Jul 1
4
Aug
14
Sep
14
Oct
14
Nov
14
Dec
14
Jan
15
Feb
15
Mar
15
Apr
15
May
15
Jun
15
Jul 1
5
Aug
15
Sep
15
Oct
15
Nov
15
Dec
15
JoiningPointSource:ANOMS

Page 16 Flight Performance – Annual Report 2015
NoiseAbatement–ContinuousDescentApproaches(CDA)ACDAisatechniqueduringwhichapilotdescendsataratewiththeintentionofachievingacontinuousdescenttojointheglide-path at the correct height for the distance. This procedure avoids the need for extended periods of level flight. The intention of a CDA is to keep aircraft higher for longer, thereby reducing arrival noise.
In addition to aiding noise reduction, CDAs reduce fuel burn, thereby cutting emissions and producing an overall environmental benefit.
A descent is deemed to have been continuous provided that no segment of level flight longer than 2.5 nautical miles occurs below 6000ft above mean sea level and level flight is interpreted as any segment of flight having a height change of not more than 50ft overatrackdistanceoftwonauticalmilesormoreasrecordedintheairportNTKsystem.
The graph below shows that CDA numbers remain consistent and reflects the fact that CDA achievement is more difficult at busy times when the airspace is congested, and that performance during the summer months is slightly higher than during the winter months, when achievement may be more affected by adverse weather.
23.00-07.00 Core Night07.00-23.00 06.00 Hour
75
80
85
90
95
100
2009 2010 2011 2012 2013 20152014
Perc
enta
ge
CDA – Continuous Descent ApproachSource:ANOMS

Flight Performance – Annual Report 2015 Page 17
TrackKeepingAllaircraftdepartingfromHeathrowuseoneofanumberofStandardInstrumentDepartures(SID).EachSIDhasanoisepreferentialroute(NPR)associatedwithit.UnlessrequiredforsafetyanaircraftmustremainwithintheNPRuntiltheyreachanaltitudeof4,000ftabovemeansealevel(amsl).Onceabove4,000ftamslaircraftmaybedirectedofftheNPRbyATCasrequired. AtHeathrowtherearesixNPRsfromeachrunway.EachNPRhasathreekilometre-wideswatheupto4000ftamsl.Larger,heavieraircraft generally take longer to climb than smaller, lighter aircraft and so will remain within the NPR for longer. TheNTKsystemisusedtodetectanyaircrafttrackwhichdeviatesfromanNPR.Informationregardingtrackdeviationsissenttotheairline and statistics showing track keeping performance are shared regularly. Track deviations occur for a variety of reasons. They may be necessary for weather avoidance or strong winds, and the speed and weight of the aircraft are also significant factors. For example, modern faster aircraft will have a wider radius of turn than an older, slower aircraft; modern aircraft require more space to make tight turns. This is noticeable on the westerly Detling NPR, where some aircraft balloon out of the NPR as they make the turn.
AnotherNPRofnoteforHeathrowistheCompton(CPT)NPRforeasterlyoperations.Trafficdepartingonthisroutegenerallyhas to be directed by ATC to avoid traffic arriving from the holding stacks to the south of the airport, as well as modern aircraft beingunabletoflythetight180-degreeturndirectlyafterdeparture.ConsequentlytrackkeepingonthisNPRisnevertothesame standard as the others. The graph below shows track keeping figures with and without Compton departures for comparison purposes.
With the exception of the specifics mentioned above, the figures show good levels of achievement, and track keeping has remained broadly consistent across recent years with minor fluctuations.
Annual total excluding CPTAnnual total including CPT
2011
95.2%
97.9%
2012
93.3%
98.0%
2013
94.5%
97.5%
20152014
94.9%
98.0%
95.1%
97.7%
Perc
enta
ge O
n Tr
ack
AnnualOnTrackDeparturesSource:ANOMS
Page 18 Flight Performance – Annual Report 2015
NoiseInfringements:DayandNightFPhashistoricallyassessedaircraftnoiseintwodifferentways:annualairnoisecontoursanddeparturenoiselimits.Noisecontourreports are available on our website.
Aircraft departing from Heathrow are subject to noise limits set by the DfT. The current limits were introduced early in 2001. There arethreelimitsinplacefortheday,shoulderandnight-timeperiods.
Thelimitsare(alltimeslocal):
•Day(07.00-23.00hours)94dBA(LMax) •Shoulder(23.00-23.30,06.00-07.00hours)89dBA(LMax) •Night(23.30-06.00hours)87dBA(LMax)
Heathrow now has 12 permanent noise monitors which are used to monitor adherence to the departure noise limits. The noise limits are based on the assumption that the noise monitors are exactly 6.5km from the start of the roll point on the runway and at the same elevation as the airfield. In practice, this is rarely possible and so adjustments are made to the limits to take account of any variances in the monitor position.
Furthermore,eachmonitorhasanadditionalcalibrationallowanceof0.7dBAaddedtothelimittoprovideamarginoferrorforthemicrophone. An aircraft is deemed to have infringed the limits for the time period if it exceeds the limit at any of the permanent monitors.
Additionallyiftheaircraftwasrequiredtotakeoffwithatailwind(measuredattheairfieldanemometersandwindvanesaccordingtotheformula:(windspeedxcosine(runwayheadingminuswinddirection))x-1)anamountofupto2dBAofthenoiserecordedatthenoisemonitorshouldbedisregarded.Theamounttobedisregardedis:
•0.4dBforatailwindofupto1knot •0.8dBforatailwindexceeding1knotbutnotexceeding2knots •1.2dBforatailwindexceeding2knotsbutnotexceeding3knots •1.6dBforatailwindexceeding3knotsbutnotexceeding4knots •2.0dBforatailwindexceeding4knots.
In the event that an airline infringes one of the limits, they are charged a noise supplement, with all proceeds going to the CommunityandEnvironmentAwards,LargeGrantsScheme,whichfundscommunityprojectsinareasaffectedbytheairport’soperations. A total of £106,500 was invested back into community projects during 2015.
Thehighernumberofinfringementsduringthenight-time,seenonthenextpage,isreflectiveofthenumberoflarge,heavy,long-haulaircraftwhichdepartlatertofitschedulesaroundtheworldoraredisruptedfromtheirplannedscheduleofoperation(e.g. aspikeininfringementswillbeseenduringstorms,snow,securitythreatsetc.)andsodepartintheperiodswithdecreasedlimits.
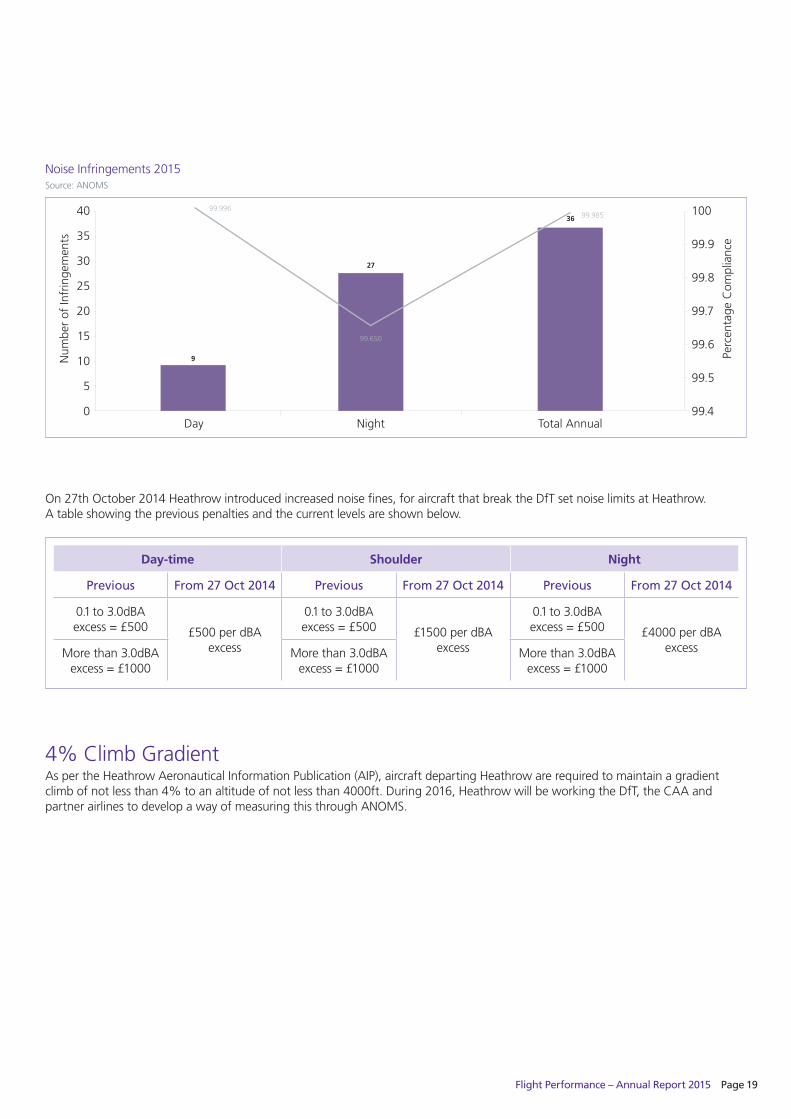
In 2015 there were 36 noise infringements, one more than 2014. Despite the minor increase, this figure still represents a 50% decrease in infringements compared to 2011. FP continues to work with airlines to reduce this figure further.
Flight Performance – Annual Report 2015 Page 19
Day
9
Night Total Annual
Num
ber
of In
frin
gem
ents
Perc
enta
ge C
ompl
ianc
e
40
35
30
25
20
15
10
5
0
100
99.9
99.8
99.7
99.6
99.5
99.4
27
3699.996
99.650
99.985
Noise Infringements 2015Source:ANOMS
Day-time Shoulder Night
Previous From 27 Oct 2014 Previous From 27 Oct 2014 Previous From 27 Oct 2014
0.1to3.0dBAexcess = £500 £500perdBA
excess
0.1to3.0dBAexcess = £500 £1500perdBA
excess
0.1to3.0dBAexcess = £500 £4000perdBA
excessMorethan3.0dBAexcess = £1000
Morethan3.0dBAexcess = £1000
Morethan3.0dBAexcess = £1000
On27thOctober2014Heathrowintroducedincreasednoisefines,foraircraftthatbreaktheDfTsetnoiselimitsatHeathrow. A table showing the previous penalties and the current levels are shown below.
4% Climb GradientAspertheHeathrowAeronauticalInformationPublication(AIP),aircraftdepartingHeathrowarerequiredtomaintainagradientclimb of not less than 4% to an altitude of not less than 4000ft. During 2016, Heathrow will be working the DfT, the CAA and partnerairlinestodevelopawayofmeasuringthisthroughANOMS.

Page 20 Flight Performance – Annual Report 2015
Ground NoiseGroundnoisedescribesnoisegeneratedatgroundlevelasaresultoftheairport’soperation.Unlikethenoiselimitsthatapplytodeparting aircraft, there are no limits on other sources of noise that originate from the airport. However, it is clearly important that a balance is struck between the interests of the local community and the needs of airport users, therefore various controls have been adopted.
Generallyspeakingthemainfactorscontributingtoaircraftnoiseonthegroundare:
Reverse Thrust Aircraft use reverse thrust to increase their braking action when they land. Pilots are asked not to use reverse thrust between the hoursof23.00-06.00wherereasonablypracticable.Theuseofreversethrustisclassifiedasairnoiseasitispartofthelandingphaseof flight and, as such, any associated noise is considered during the production of the annual noise contours.
Ground Movement We work closely with airport stand planners to ensure ground taxi times are reduced. This has benefits in terms of noise reduction, fuel burn and emissions. We also work with our airline partners to encourage initiatives such as reduced engine taxiing.
Aircraft sitting on their stands with their power units running AnAuxillaryPowerUnit(APU)isasmalljetenginelocatedinthetailofmostaircraft.Thisengineisusedtopowervitalsystemswhilstthemainenginesareswitchedoff.HeathrowencouragestheuseofFixedElectricalGroundPower(FEGP)andPreConditionedAir(PCA)whichhelpscutfuelusage,groundnoiseandemissions.
Engine testing Engine testing associated with maintenance is strictly controlled and limited, with high power runs taking place in acoustically designed pens.
Flight Performance – Annual Report 2015 Page 21
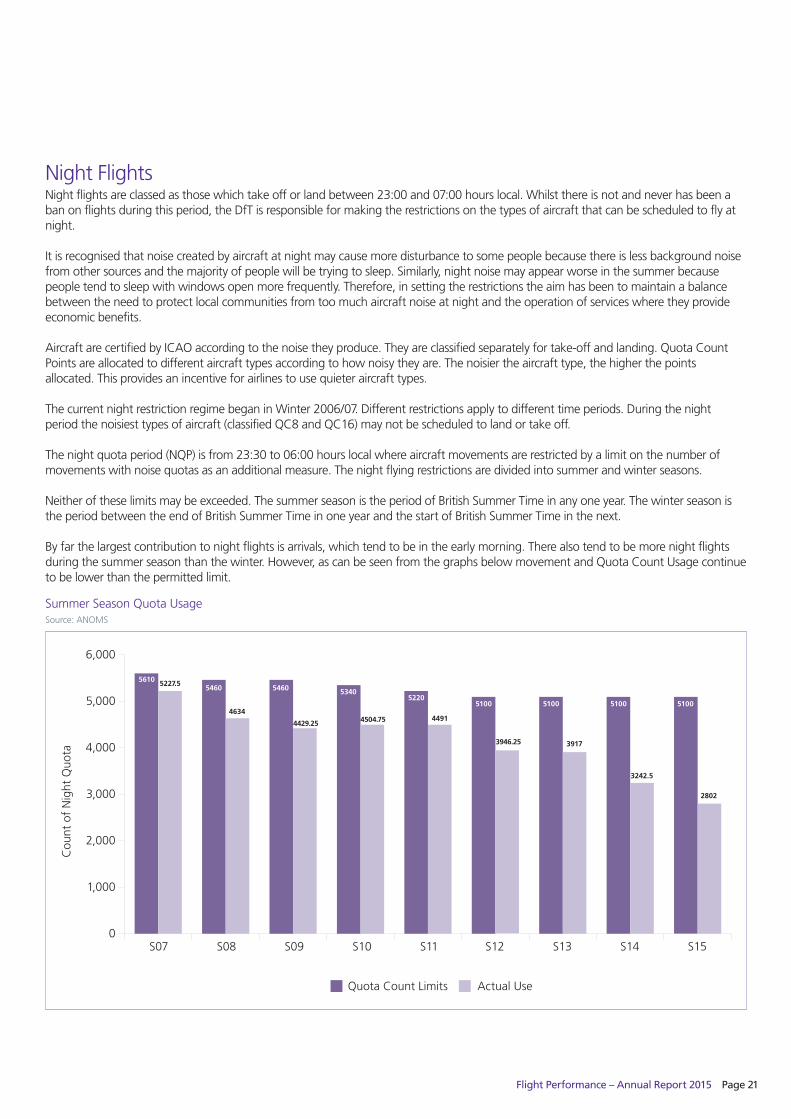
Night FlightsNightflightsareclassedasthosewhichtakeofforlandbetween23:00and07:00hourslocal.Whilstthereisnotandneverhasbeenaban on flights during this period, the DfT is responsible for making the restrictions on the types of aircraft that can be scheduled to fly at night.
It is recognised that noise created by aircraft at night may cause more disturbance to some people because there is less background noise from other sources and the majority of people will be trying to sleep. Similarly, night noise may appear worse in the summer because people tend to sleep with windows open more frequently. Therefore, in setting the restrictions the aim has been to maintain a balance between the need to protect local communities from too much aircraft noise at night and the operation of services where they provide economic benefits.
AircraftarecertifiedbyICAOaccordingtothenoisetheyproduce.Theyareclassifiedseparatelyfortake-offandlanding.QuotaCountPoints are allocated to different aircraft types according to how noisy they are. The noisier the aircraft type, the higher the points allocated. This provides an incentive for airlines to use quieter aircraft types.
The current night restriction regime began in Winter 2006/07. Different restrictions apply to different time periods. During the night periodthenoisiesttypesofaircraft(classifiedQC8andQC16)maynotbescheduledtolandortakeoff.
Thenightquotaperiod(NQP)isfrom23:30to06:00hourslocalwhereaircraftmovementsarerestrictedbyalimitonthenumberofmovements with noise quotas as an additional measure. The night flying restrictions are divided into summer and winter seasons.
Neitheroftheselimitsmaybeexceeded.ThesummerseasonistheperiodofBritishSummerTimeinanyoneyear.ThewinterseasonistheperiodbetweentheendofBritishSummerTimeinoneyearandthestartofBritishSummerTimeinthenext.
Byfarthelargestcontributiontonightflightsisarrivals,whichtendtobeintheearlymorning.Therealsotendtobemorenightflightsduringthesummerseasonthanthewinter.However,ascanbeseenfromthegraphsbelowmovementandQuotaCountUsagecontinueto be lower than the permitted limit.
Actual UseQuota Count Limits
S10S09S08S07
5610 5227.55460
4634
5460
4429.25
5340
4504.75
S13 S15S14S12S11
5220
4491
5100
3946.25
5100
2802
5100
3242.5
5100
3917
Cou
nt o
f N
ight
Quo
ta
6,000
5,000
4,000
3,000
2,000
1,000
0
SummerSeasonQuotaUsageSource:ANOMS

Page 22 Flight Performance – Annual Report 2015
Actual UseMovement Limits
S10S09S08S07
3250
3047
3250
2922
3250
2848
3250
3033
S15S14S12S11
3250
2958
3250
2853
3250
2837
3250
2847
3250
2714
Num
ber
of N
ight
Mov
emen
ts
3,300
3,200
3,100
3,000
2,900
2,700
2,500
2,800
2,600
2,400S13
SummerSeasonMovementUsageSource:ANOMS
Actual UseQuota Count Limits
W09W08W07W06
44204266 4514 4100.25
4936
3947.5
4547
3863.25
W14W12W11W10
4682
3735.25
4839
3374.5
4620
3310.75
4488
3070.5
4488
2939.5
Cou
nt o
f N
ight
Quo
ta
6,000
5,000
4,000
3,000
2,000
1,000
0W13
WinterSeasonQuotaUsage(includingcarry-over)Source:ANOMS

Flight Performance – Annual Report 2015 Page 23
Actual UseMovement Limits
W09W08W07W06
2712
2659
27472710
2875
2715
2875
2686
W14W12W11W10
2767
2577
2842
2581
2875
2670
2810
2676
2810
2715
Num
ber
of N
ight
Mov
emen
ts
2,900
2,850
2,800
2,750
2,700
2,650
2,600
2,550
2,500
2,450
2,400W13
WinterSeasonMovementUsage(includingcarry-over)Source:ANOMS
• End of season flexibility Upto10%ofthecurrentseason’smovementlimitmaybecarriedoverifunused.AtHeathrow,thereisoftenacarry-overfromthesummer to the winter season, but rarely from the winter to the summer season.
• Overrun of movements Upto10%ofthenextseason’smovementlimitmaybeanticipatedintheeventofanoverrun.Anyexcessoverrunispenalisedinthe following season at double the amount of the excess. The same arrangements apply to the noise quotas.
• Exempt aircraft Aircraftareexemptfromthemovementslimitsandnoisequotasiftheirnoisecertificationdataislessthan84EPNdB,i.e.lessthanQC 0.25.
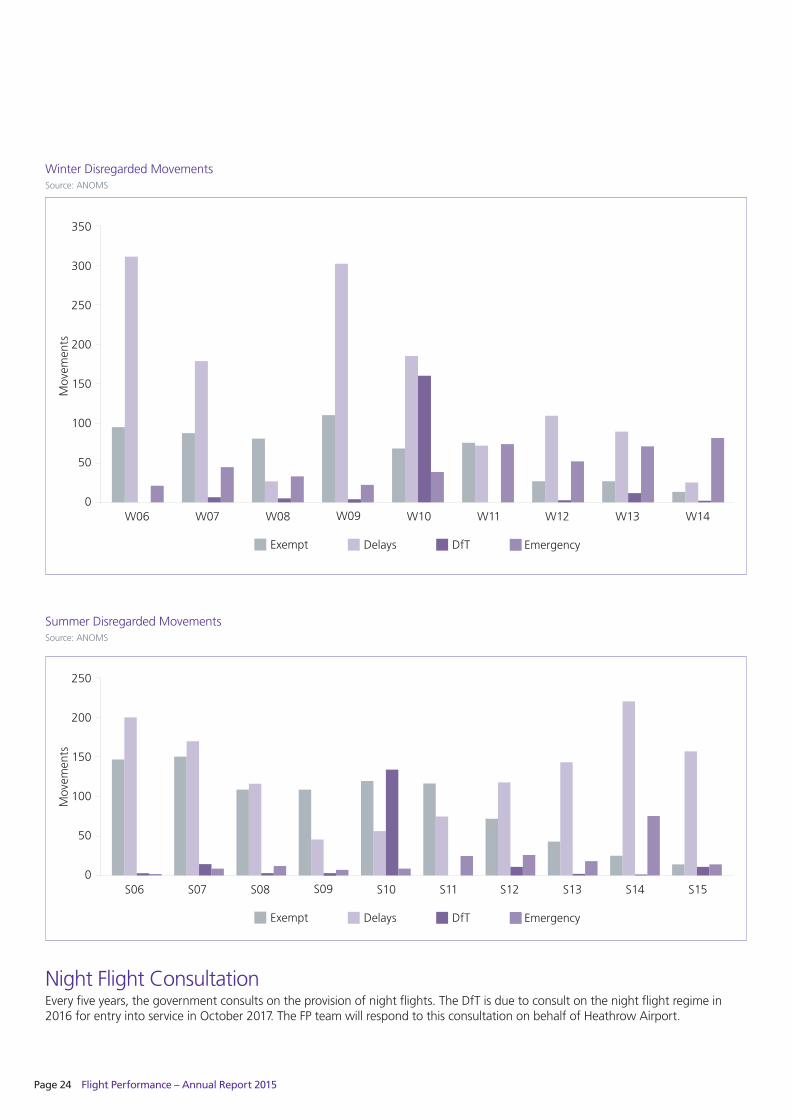
• Dispensations The Secretary of State has the power to state circumstances in which movements may be disregarded from the night restrictions. These are in exceptional circumstances only and disregarded movements include emergencies, delays which are likely to lead to serious congestion at the airport or serious hardship or suffering to passengers or animals or which result from widespread and prolonged disruption of air traffic. Heathrow Airport strictly monitors compliance with all current Government restrictions, reporting regularly to the DfT. A list of dispensation reasons can be found in the glossary.
The movements shown on the next page were exempt from the restrictions, or dispensed either due to delays, emergencies, or by the DfT. Following the poor weather experienced in 2014 which saw a rise in summer exemptions, summer 2015 saw improved weather and because of this the exemption figures reduced. This also resulted in an improvement in delay figures.
Page 24 Flight Performance – Annual Report 2015
Exempt Delays DfT Emergency
0
50
100
150
200
250
300
350
W06 W08W07 W09 W11W10 W14W13W12
Mov
emen
ts
WinterDisregardedMovementsSource:ANOMS
Exempt Delays DfT Emergency
0
50
100
150
200
250
S06 S08S07 S09 S11S10 S12 S15S14S13
Mov
emen
ts
SummerDisregardedMovementsSource:ANOMS
Night Flight ConsultationEvery five years, the government consults on the provision of night flights. The DfT is due to consult on the night flight regime in 2016forentryintoserviceinOctober2017.TheFPteamwillrespondtothisconsultationonbehalfofHeathrowAirport.
Flight Performance – Annual Report 2015 Page 25
BackgroundTherearethreemaintiersofregulationwhichgovernaircraftnoiseintheUK:international,Europeanandnational.
International RegulationTheInternationalCivilAviationOrganizationhassetprogressivelytightercertificationstandardsfornoiseemissionsfromcivilaircraftandrequiresMemberStatestoadopta‘balancedapproach’tonoisemanagement.Thebalancedapproachgoesbeyondindividualaircraftandconsiders:
•Reducingaircraftnoiseatsource •Landplanninguse •Changestooperationalprocedures •Restrictionsontheuseofthenoisiestaircraft.
European RegulationTheEUhasissuedvariousdirectivesrelatingtoenvironmentalissuesandisincreasinglyassumingresponsibilityfortheregulationofaircraftnoisestandards.MemberStatesareobligedtocomplywiththerequirementsofthedirectivesandincorporatethemintonational legislation.
National RegulationTheaimofsuccessiveUKgovernmentssincethe1960shasbeentostrikeabalancebetweentheneedsofanefficientaviationindustry, providing jobs and serving the local, regional and national economy, and the need to minimise the impact on the environmentandcommunitiesaroundairports.TheSecretaryofStatehasusedpowersundersections78-80oftheCivilAviationAct 1982 to make Heathrow a ‘designated airport’. This designated status means that the Secretary of State has direct responsibility for noise control at Heathrow and also has powers to introduce noise control measures to limit or mitigate the effect of noise and vibration connected with aircraft taking off or landing at Heathrow.
TheSecretaryofStatehasusedthesepowerstospecifyvariousnoiseabatementmeasures.Thesemeasuresinclude:
•Nightflyingrestrictions •Departurenoiselimits •NPRsandrelatedrequirementsfordepartingaircraft •Continuousdescentandlowpowerlowdragapproachprocedures •PolicyonhowATCdirectsarrivingtraffic •Powersforairportoperatorstochargeairlinesbyreferencetonoiseemissions •Therequirementtooperatenoisemonitorsandreportoutputs •Therequirementtorunandmaintainatrackkeepingsystem •Directionstoairportmanagerstotakemeasurestolimitormitigatenoisefromlandingordepartingaircraft.
HeathrowAirportLimited(HAL)StrategyAlthoughtheDfThasdirectcontrolovernoiseatHeathrow,wehaveadetailednoisemanagementstrategy.Sincethemid-1990s,FPhasbeenresponsiblefordeliveringthepolicysetoutbytheDfT,themainfunctionsbeing:
•Tomonitor,evaluateandreportonATCandairlineoperatingproceduresandcompliancewithpolicyrequirements. •ToprovidetechnicalanalysistoHeathrow’sCommunicationsdepartmentforonwarddisseminationtomembersofthepublic
whose enquiries relate to how airport operations may affect them. •Topromotebestpracticewithregardtonoiseabatementprocedures.Thisinvolvesworkingcloselywithairlines,NATSand
other industry stakeholders on joint industry initiatives. •Toinitiate,analyseandassessnewnoiseinitiatives.
Noise Action Plan

Page 26 Flight Performance – Annual Report 2015
Communications Heathrow’s dedicated noise website, www.heathrow.com/noise, is managed by the Heathrow Communications Team but the operational details are supplied by FP.
Examplesofinformationsuppliedin2015are:
•Operationaldata. •Quarterlydatareports. •ThisAnnualReport. •WebTrak–afacilitywhichenablesinvestigationofflightsoveraparticularareausingdatafromtheNATSradarfeed. •WebTrakMyNeighbourhood–anonlinetoolthatallowstheusertoseelongertermtrendsinairtrafficaroundHeathrow. •Detailedaircrafttrackingmaps,producedonourbehalfbytheEnvironmentalResearchConsultancyDivision(ERCD)oftheCivil
AviationAuthority(CAA)whichinclude: • where aircraft actually fly; • how high and in what numbers; • operations spilt into westerly and easterly arrivals and departures; and • a question and answer sheet explaining the information.
In2015FPhaddirectcontactwiththelocalcommunitythroughtheHeathrowCommunityNoiseForum(HCNF),whichwassetupinresponsetotheairspacetrialsrunin2014,theHeathrowAirportConsultativeCommittee(HACC)andtheHeathrowNoiseForum.FP supports Heathrow Community Communications in response to enquiries from members of the public on all aspects of our operationsand,whereappropriate,demonstrationsoftheNTKsystemwereprovidedtointerestedgroupsandindividualsandnoisemonitors deployed.
The Plan Astheairportoperator,HALwasrequiredbytheEnvironmentalNoise(England)Regulations2006toproduceaNoiseActionPlan(NAP)basedonstrategicnoisemapsproducedbytheSecretaryofState.
The second Heathrow NAP was adopted in 2014 and FP remains responsible for a number of actions. A selection of work undertaken last year is given below.
Community Noise Monitoring Programme The NAP requires Heathrow to maintain a community noise and track monitoring programme. This programme is designed to help Heathrow and the local communities better understand and explain how particular areas are affected by aircraft noise. This involves deploying mobile noise monitors to different sites around the airport. Data from sites is gathered, independently analysed and then assessed for noise by ERCD.
In2015fourmonitorsweredeployed,toRichingsPark,Brockley,WindleshamandEnglefieldGreen.FPwouldliketothankthelandowners who supported this project. The reports will be compiled, but previous reports are available and if they are not visible on the website please contact the Communications Team and request the information. The picture on the next page shows a typical set-upofanoisemonitor.

Flight Performance – Annual Report 2015 Page 27
In line with the NAP, we plan to deploy two community noise monitors in 2016.
In2016Heathrowwillbestartingtheprocessofprocuringover25newstate-of-the-artnoisemonitors.ThisnewequipmentwillenableHeathrowtofurtherdevelopitsNMTstrategy.
Noise MetricsHeathrow Airport is committed in the NAP to establish a range of supplementary metrics which meet the needs of a variety of stakeholders to describe the noise impact of Heathrow. These metrics were established independently through focus groups.
TherecommendationsfromthisworkhaveinitiallybeenincorporatedintotheCommunityNoiseMonitoringProgrammereports.Workcontinuedthrough2015toincorporatethesemetricsintoanenhancementtoWebTrakknownasWebTrakMyNeighbourhood.
Noise Contours In accordance with the NAP, FP commissions this work on an annual basis. The latest information is available on the website.
Flight Performance Quarterly ReportFP publishes quarterly performance reports as part of its NAP commitments and these can be found in the ‘Reports’ section of the Heathrow noise website.
Departures Code of Practice TheDeparturesCodeofPracticewaswrittenintotheConditionsofUsedocumentin2014.AlloperatorsutilisingHeathrowcontinueto voluntarily adhere to the published principle for departures along with its sister code which relates to arrivals.
Night Noise Consultation responseIn response to the government’s last Night Noise Consultation, we stated that we would work towards a Steeper Approach Trial. This work began in 2014 and more detail is provided in the Airspace section of this report.
Page 28 Flight Performance – Annual Report 2015
Fly QuietThe Fly Quiet programme was launched in November 2013. It is one of the steps Heathrow is taking to reduce aircraft noise, as set out in ‘A Quieter Heathrow’, a report published early in 2013. It is intended to further encourage airlines to use quieter aircraft and to fly them in the quietest possible way. FP continued to produce the Fly Quiet league tables in 2015 and engaged with airlines with the objective of improving their performance in areas represented by the six Fly Quiet metrics, which has led to some significant improvements, particularly in the CDA compliance metric. FP has recently commissioned a study on the effectiveness of the Fly Quiet programme; this study was completed in 2015. The findings and conclusions will form the basis for the evaluation of potential changes to the programme, which will be a major undertaking in 2016.
Further information is available from www.heathrowairport.com/noise
Noise BlueprintIn2014,aNoiseBlueprintwaspublishedwiththeaimofreducingaircraftnoisebySummer2015.TheBlueprintformsaten-pointplantocutnoiseandislinkedtoactionsfromtheNoiseActionPlan.TheBlueprintaimstospeeduptheworkontheseactionsandchallengesusandeveryoneweworkwithtobequieter,sooner.Theplanincludes:
•Earlyphase-outofthenoisiestplanes. •FittingquiettechnologytoA320s. •Campaignforquietapproaches. •Campaigntodelayloweringoflandinggear. •Exploringsteeperanglesofdescent. •Betterdistributionofnight-timelandingnoise. •Completionofschools’doubleglazingprogramme. •Moreadobebuildingsinlocalprimaries. •Biggerfinesfornoisydepartures. •Campaigntoreducelatedepartures.
Flight Performance – Annual Report 2015 Page 29
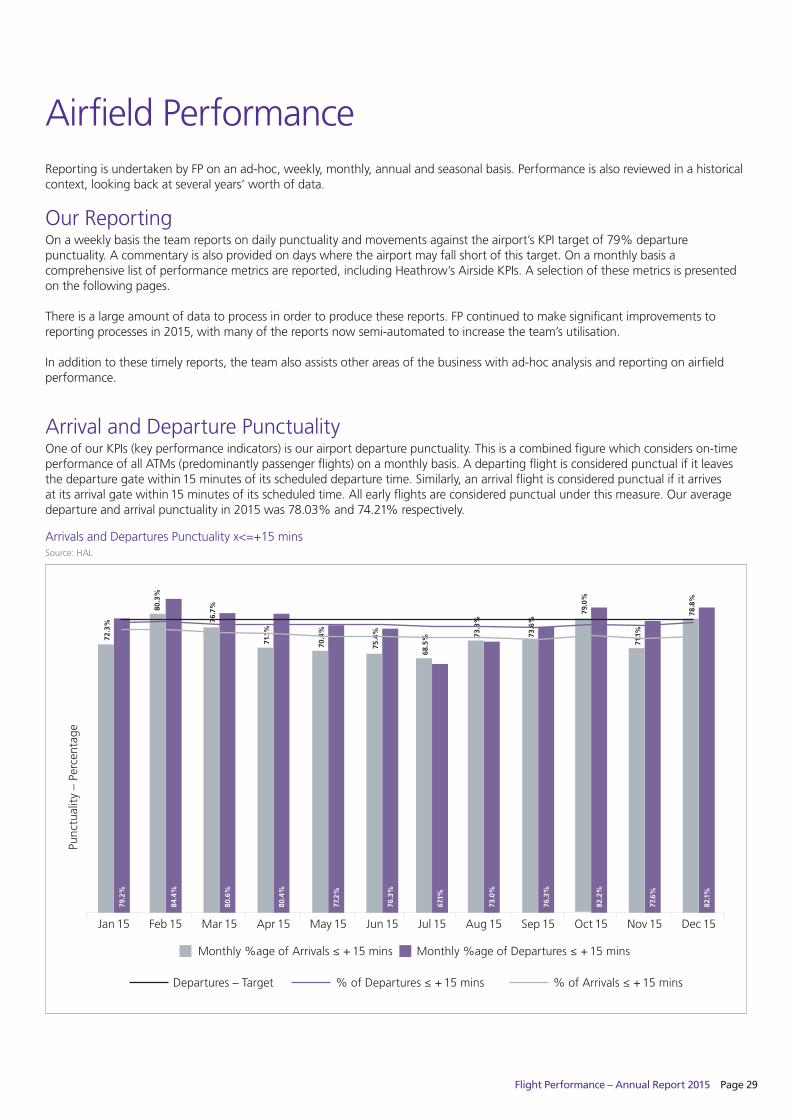
ReportingisundertakenbyFPonanad-hoc,weekly,monthly,annualandseasonalbasis.Performanceisalsoreviewedinahistoricalcontext, looking back at several years’ worth of data.
OurReportingOnaweeklybasistheteamreportsondailypunctualityandmovementsagainsttheairport’sKPItargetof79%departurepunctuality.Acommentaryisalsoprovidedondayswheretheairportmayfallshortofthistarget.Onamonthlybasisacomprehensivelistofperformancemetricsarereported,includingHeathrow’sAirsideKPIs.Aselectionofthesemetricsispresentedon the following pages.
There is a large amount of data to process in order to produce these reports. FP continued to make significant improvements to reportingprocessesin2015,withmanyofthereportsnowsemi-automatedtoincreasetheteam’sutilisation.
Inadditiontothesetimelyreports,theteamalsoassistsotherareasofthebusinesswithad-hocanalysisandreportingonairfieldperformance.
Arrival and Departure PunctualityOneofourKPIs(keyperformanceindicators)isourairportdeparturepunctuality.Thisisacombinedfigurewhichconsiderson-timeperformanceofallATMs(predominantlypassengerflights)onamonthlybasis.Adepartingflightisconsideredpunctualifitleavesthe departure gate within 15 minutes of its scheduled departure time. Similarly, an arrival flight is considered punctual if it arrives atitsarrivalgatewithin15minutesofitsscheduledtime.Allearlyflightsareconsideredpunctualunderthismeasure.Ouraveragedeparture and arrival punctuality in 2015 was 78.03% and 74.21% respectively.
Airfield Performance
Monthly %age of Arrivals ≤ + 15 mins Monthly %age of Departures ≤ + 15 mins
Punc
tual
ity
– Pe
rcen
tage
Jan 15 Feb 15 Mar 15 Apr 15 May 15 Jun 15 Jul 15 Aug 15 Sep 15 Oct 15 Nov 15 Dec 15
79.2
%
72.3
%
84.4
%
80.6
%
76.7
%
80.4
%
71.1
%
77.2
%
70.4
%
76.3
%
75.4
%
67.1
%
68.5
%
73.0
%
73.3
%
76.3
%
73.6
%
82.2
%
79.0
%
77.6
%
71.1
%
82.1
%
78.8
%
80.3
%
Departures – Target % of Departures ≤ + 15 mins % of Arrivals ≤ + 15 mins
Arrivals and Departures Punctuality x<=+15 minsSource:HAL
Page 30 Flight Performance – Annual Report 2015
Arrivals Departures
Percentage of arrivals ≥ -15 minutes and ≥ +15 minutesPercentage of arrivals ≤ +15 minutes
America Middle EastEurope UK
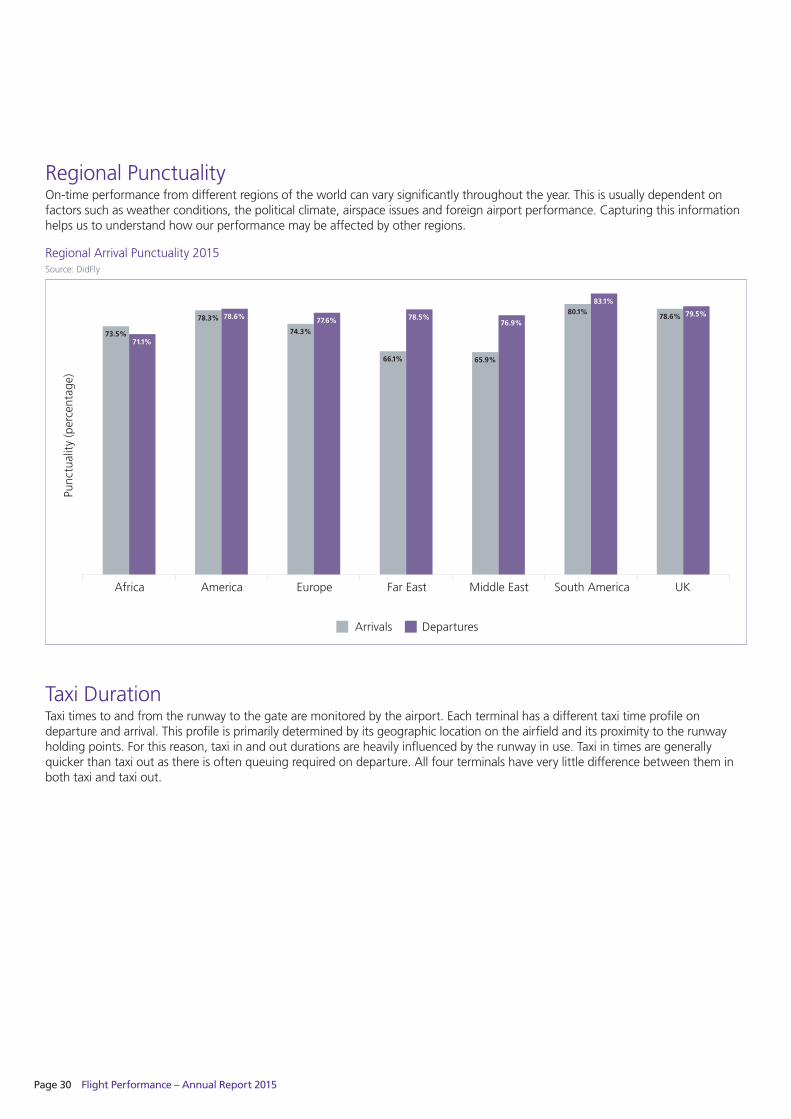
73.5%71.1%
78.3% 78.6%
74.3%
77.6%
66.1%
78.5%
Far East South AmericaAfrica
65.9%
76.9%
80.1%83.1%
78.6% 79.5%
Punc
tual
ity
(per
cent
age)
Regional Arrival Punctuality 2015Source:DidFly
Regional PunctualityOn-timeperformancefromdifferentregionsoftheworldcanvarysignificantlythroughouttheyear.Thisisusuallydependentonfactors such as weather conditions, the political climate, airspace issues and foreign airport performance. Capturing this information helps us to understand how our performance may be affected by other regions.
Taxi DurationTaxi times to and from the runway to the gate are monitored by the airport. Each terminal has a different taxi time profile on departure and arrival. This profile is primarily determined by its geographic location on the airfield and its proximity to the runway holding points. For this reason, taxi in and out durations are heavily influenced by the runway in use. Taxi in times are generally quicker than taxi out as there is often queuing required on departure. All four terminals have very little difference between them in both taxi and taxi out.

Flight Performance – Annual Report 2015 Page 31
AirTrafficFlowManagement(ATFM)delay
ATFM delay – other reasonsDelay - HAL regs only, reason = weather
Tota
l ATF
M D
elay
(min
utes
)
0
20,000
40,000
60,000
80,000
100,000
120,000
Ave
rage
ATF
M D
elay
Per
Arr
ival
(min
utes
)
0
1
3
2
5
4
6
7
Jan 15 Feb 15 Mar 15 Apr 15 May 15 Jun 15 Jul 15 Aug 15 Sep 15 Oct 15 Nov 15 Dec 15
Average ATFM delay per arrival (all reasons)
ATFMDelayonArrivalsResultingfromHeathrowRegulationsSource:NetworkManager,Eurocontrol
ATFMdelayisaresultofrestrictionsimposedonflightsintoHeathrowduetotacticalcapacityconstraints.Thesecapacityrestrictionsare predominantly due to weather at Heathrow. In 2015, flights inbound to Heathrow were subject to an average of 2.1 minutes of delay per flight.
Page 32 Flight Performance – Annual Report 2015
Stack Holding
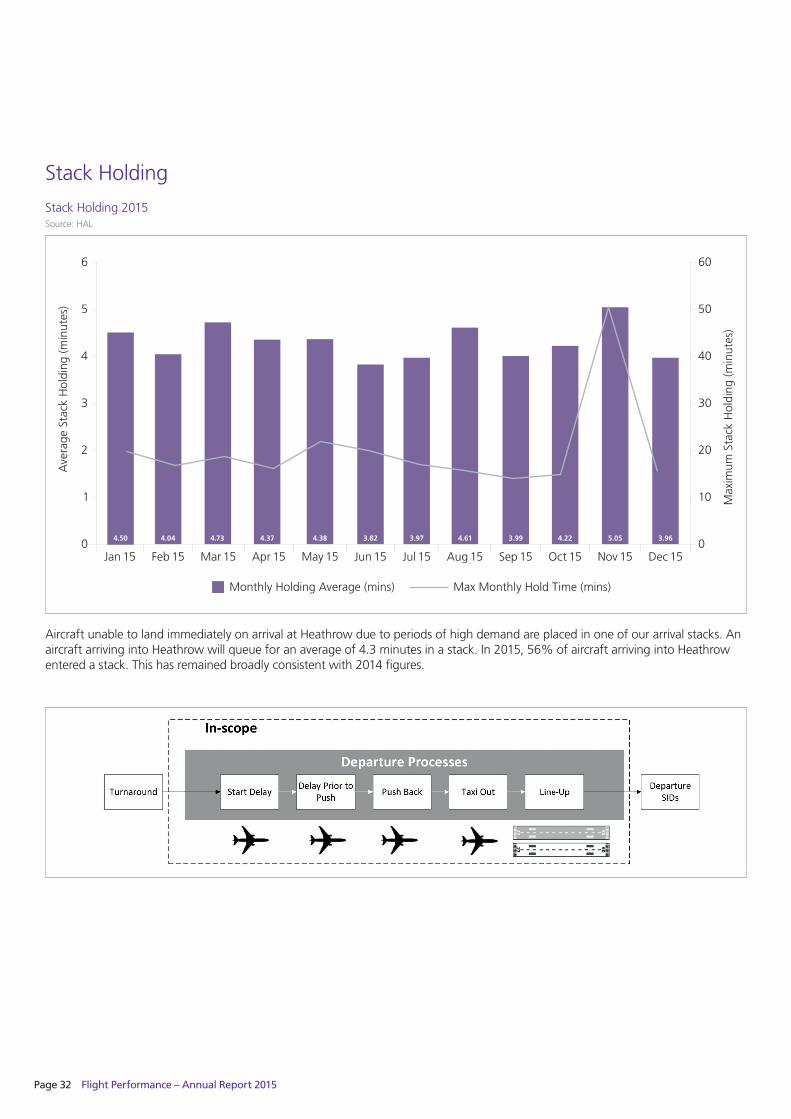
Aircraft unable to land immediately on arrival at Heathrow due to periods of high demand are placed in one of our arrival stacks. An aircraft arriving into Heathrow will queue for an average of 4.3 minutes in a stack. In 2015, 56% of aircraft arriving into Heathrow entered a stack. This has remained broadly consistent with 2014 figures.
Monthly Holding Average (mins)
Ave
rage
Sta
ck H
oldi
ng (m
inut
es)
0
1
2
3
4
5
6
Max
imum
Sta
ck H
oldi
ng (m
inut
es)
0
10
30
20
50
40
60
Jan 15 Feb 15 Mar 15 Apr 15 May 15 Jun 15 Jul 15 Aug 15 Sep 15 Oct 15 Nov 15 Dec 15
4.50 4.04 4.73 4.37 4.38 3.82 3.97 4.61 3.99 4.22 5.05 3.96
Max Monthly Hold Time (mins)
Stack Holding 2015Source:HAL
Flight Performance – Annual Report 2015 Page 33
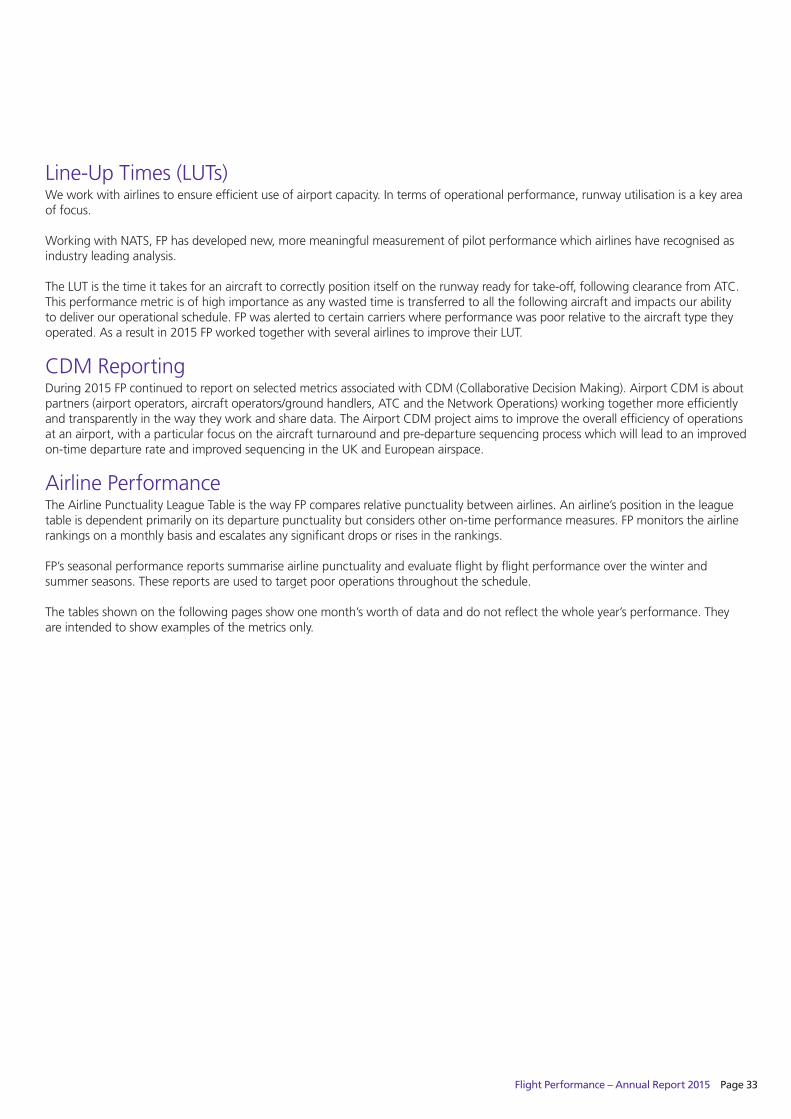
Line-UpTimes(LUTs)We work with airlines to ensure efficient use of airport capacity. In terms of operational performance, runway utilisation is a key area of focus.
Working with NATS, FP has developed new, more meaningful measurement of pilot performance which airlines have recognised as industry leading analysis.
TheLUTisthetimeittakesforanaircrafttocorrectlypositionitselfontherunwayreadyfortake-off,followingclearancefromATC.This performance metric is of high importance as any wasted time is transferred to all the following aircraft and impacts our ability to deliver our operational schedule. FP was alerted to certain carriers where performance was poor relative to the aircraft type they operated.Asaresultin2015FPworkedtogetherwithseveralairlinestoimprovetheirLUT.
CDMReportingDuring2015FPcontinuedtoreportonselectedmetricsassociatedwithCDM(CollaborativeDecisionMaking).AirportCDMisaboutpartners(airportoperators,aircraftoperators/groundhandlers,ATCandtheNetworkOperations)workingtogethermoreefficientlyandtransparentlyinthewaytheyworkandsharedata.TheAirportCDMprojectaimstoimprovetheoverallefficiencyofoperationsatanairport,withaparticularfocusontheaircraftturnaroundandpre-departuresequencingprocesswhichwillleadtoanimprovedon-timedeparturerateandimprovedsequencingintheUKandEuropeanairspace.
Airline PerformanceTheAirlinePunctualityLeagueTableisthewayFPcomparesrelativepunctualitybetweenairlines.Anairline’spositionintheleaguetableisdependentprimarilyonitsdeparturepunctualitybutconsidersotheron-timeperformancemeasures.FPmonitorstheairlinerankings on a monthly basis and escalates any significant drops or rises in the rankings.
FP’s seasonal performance reports summarise airline punctuality and evaluate flight by flight performance over the winter and summer seasons. These reports are used to target poor operations throughout the schedule.
The tables shown on the following pages show one month’s worth of data and do not reflect the whole year’s performance. They are intended to show examples of the metrics only.

Page 34 Flight Performance – Annual Report 2015
Arrivals
Rank [v MAA (pos.)]
52-week High
52-week Low
Airline Code
Airline Name TERMEARLY ARR
PUNCT.
ARR PUNCT.
ARR A/C MVMT
ARR DELAY (MINS)
AVG. ARR DELAY/MVMT
1 h (40) 1 68 MU China Eastern 4 67.74% 100.00% 31 5 00:00:102 h (28) 2 80 A3 Aegean Air 2 32.38% 98.10% 105 204 00:01:573 h (15) 3 25 KL KLM 4 22.51% 91.52% 342 1,392 00:04:044 –(4) 4 4 I2 Iberia Express 5 35.48% 90.32% 62 266 00:04:175 h (29) 5 50 QR Qatar 4 43.01% 90.32% 186 904 00:04:526 h (19) 6 59 KM AirMalta 4 5.00% 90.00% 60 379 00:06:197 h (15) 5 51 IB Iberia 5 14.16% 89.27% 233 1,004 00:04:428 h (25) 2 45 OS Austrian Airlines 2 4.49% 88.76% 89 545 00:06:079 h (24) 1 58 KQ KenyaAirways 4 19.35% 87.10% 31 167 00:05:2310 h (25) 8 50 JU Air Serbia 4 6.45% 87.10% 31 216 00:06:5811 h (26) 2 75 NZ Air New Zealand 2 32.26% 87.10% 31 225 00:07:1512 h (29) 1 65 J2 AzerbaijanAirways 4 9.52% 85.71% 21 115 00:05:2913 h (40) 13 61 TK Turkish Airlines 2 16.15% 85.09% 161 1,456 00:09:0014 h (15) 4 48 AV Avianca 2 74.19% 83.87% 31 186 00:06:0015 h (24) 5 81 DL Delta Airlines 3,4 34.51% 83.60% 284 2,280 00:08:0216 h (39) 16 66 AZ Alitalia 4 12.24% 83.67% 147 846 00:05:4517 h (32) 17 72 LH Lufthansa 2 9.29% 83.46% 538 3,786 00:07:0218 h (55) 13 77 FB BulgariaAirways 4 16.67% 83.33% 24 176 00:07:2019 h (44) 6 76 LO LOTPolishAirlines 2 13.25% 83.13% 83 635 00:07:3920 h (24) 11 76 EI AerLingus 2 11.60% 82.84% 612 4,669 00:07:3821 h (36) 20 52 AF Air France 4 5.15% 82.83% 233 1,872 00:08:0222 h (56) 22 75 QF Qantas 3 40.32% 82.26% 62 744 00:12:0023 h (26) 7 50 BA BritishAirways 3,5 16.78% 81.47% 9337 89,557 00:09:3524 i (19) 3 32 UA UnitedAirlines 2 32.82% 81.37% 451 7,006 00:15:3225 i (15) 4 25 VS Virgin Atlantic 2,3 41.84% 80.82% 631 6,580 00:10:2626 h (34) 20 73 TP TAP Air Portugal 2 19.88% 80.75% 161 1,483 00:09:1327 h (36) 6 60 4U GermanwingsGMBH 2 9.66% 80.67% 236 2,116 00:08:5328 –(28) 1 79 VY Vueling Airlines 3 8.70% 80.43% 46 274 00:05:5729 h (30) 4 62 UL SriLankanAirlines 3 25.64% 79.49% 39 571 00:14:3830 h (47) 1 70 GF Gulf Air 4 0.00% 79.00% 62 1,025 00:16:2231 h (47) 8 70 MS Egypt Air 2 10.61% 78.79% 66 727 00:11:0132 h (36) 17 56 LY El Al 4 12.00% 78.00% 50 444 00:06:5333 h (39) 15 56 LX Swiss International 2 4.26% 77.84% 352 4,016 00:11:2534 h (43) 29 66 SN BrusselsAirlines 2 11.24% 77.53% 89 841 00:09:2735 h (43) 15 68 AM AeroviasDeMexico 4 36.36% 77.27% 22 258 00:11:4436 h (42) 29 73 AT RoyalAirMaroc 4 4.88% 75.61% 41 490 00:11:5737 i (30) 3 52 MK AirMauritius 4 12.50% 75.00% 16 163 00:10:1138 h (44) 15 72 OU Croatia Airlines 2 0.00% 74.36% 39 445 00:11:2539 i (25) 1 69 JJ TAMBrazilian 2 38.71% 74.19% 31 332 00:09:4540 i (30) 7 48 AA American Airlines 3 25.56% 73.46% 520 10,520 00:20:1441 i (30) 4 49 SK SAS Scandinavian 2 2.64% 72.91% 454 5,574 00:12:1742 h (54) 35 70 EK Emirates 3 7.10% 72.90% 155 1,779 00:11:2943 h (61) 43 77 CA Air China 2 19.35% 72.58% 62 812 00:13:0644 h (66) 17 78 EY Etihad 4 12.90% 70.97% 93 932 00:10:0145 i (41) 14 60 BI RoyalBrunei 4 3.23% 70.97% 31 440 00:14:1246 i (27) 4 71 AY Finnair 3 1.39% 69.44% 144 1,689 00:11:44

Flight Performance – Annual Report 2015 Page 35
Rank [v MAA (pos.)]
52-week High
52-week Low
Airline Code
Airline Name TERMEARLY ARR
PUNCT.
ARR PUNCT.
ARR A/C MVMT
ARR DELAY (MINS)
AVG. ARR DELAY/MVMT
47 h (60) 30 77 KU KuwaitAirways 4 18.18% 68.18% 44 601 00:13:4048 –(48) 48 48 EW Eurowings 2 0.50% 67.84% 199 2,938 049 i (46) 9 70 MK MEAMiddleEastAirlines 3 6.45% 67.74% 62 683 00:10:3250 i (24) 2 74 JL JALJapanAirlines 3 16.13% 67.74% 31 380 00:12:1551 i (48) 19 68 AC Air Canada 2 12.59% 66.30% 270 6,527 00:24:1052 i (27) 2 67 KE KoreanAir 4 13.79% 65.52% 29 353 00:12:1053 i (45) 6 71 FI Iceland air 2 0.00% 65.52% 58 976 00:16:5054 i (35) 1 57 SU Aeroflot 4 7.79% 64.94% 77 984 00:12:4755 h (68) 54 80 TU Tunisair 4 0.00% 64.71% 17 239 00:14:0456 i (51) 20 72 WY OmanAir 3 3.23% 64.52% 31 600 00:19:2157 i (55) 35 76 CK Cathay Pacific 3 18.79% 64.43% 149 3,113 00:20:5458 i (15) 2 58 SA South African Airlines 2 1.64% 62.30% 61 1,474 00:24:1059 i (52) 15 71 SV Saudi Arabian Airlines 4 6.45% 61.29% 62 1,061 00:17:0760 i (59) 23 77 9W JetAirways 4 10.75% 60.22% 90 1,844 00:19:5061 i (46) 20 72 KT Ethiopian Airlines 2 6.45% 58.06% 31 606 00:19:3162 h (63) 51 78 RJ RoyalJordanian 3 6.45% 58.60% 31 668 00:21:3363 h (65) 33 79 IR Iran Air 3 7.14% 57.14% 14 227 00:16:1364 i (40) 3 72 SQ Singapore Airlines 2 7.26% 56.45% 124 2,198 00:17:4465 i (44) 19 67 RO Tarom 4 6.90% 56.17% 29 527 00:18:1066 i (55) 21 73 CZ China Southern 4 9.68% 54.84% 31 606 00:19:3367 i (58) 11 81 BA BimanBangladesh 4 5.88% 52.94% 17 504 00:29:3968 i (32) 1 68 NH ANA All NipponAirlines 2 9.68% 51.61% 31 477 00:15:2369 i (42) 11 70 TG Thai International 2 8.06% 50.00% 62 1,167 00:18:4970 i (44) 10 70 AI Air India 4 13.71% 50.00% 124 3,908 00:31:3171 i (36) 1 72 PR Philippine Airlines 4 22.73% 50.00% 22 1,178 00:53:3372 i (35) 14 72 NY UzbekistanAirways 4 0.00% 44.44% 9 216 00:24:0073 i (57) 29 77 OZ Asiana Airlines 2 3.23% 38.71% 31 1,031 00:33:1574 i (42) 1 74 KC CJSCAirAsiana 4 0.00% 38.46% 13 673 00:51:4675 i (44) 2 80 HH EVA Air 2 0.00% 35.48% 31 812 00:26:1276 i (60) 23 77 WJ ArikAirIntlLTD 4 0.00% 30.00% 30 1,564 00:52:0877 i (64) 22 881 VN Vietnam Airlines 4 0.00% 28.57% 28 1,012 00:36:0078 i (71) 11 80 PK PIA Pakistan International 3 4.55% 15.91% 44 2,861 01:06:0179 i (75) 66 80 AH Air Algeria 4 0.00% 5.88% 17 1,079 01:03:2880 i (72) 41 80 TS Turkmenistan Airlines 4 0.00% 0.00% 9 1,195 02:12:4781 i (49) 0 76 MH MalaysinaAirlines 4 0.00% 0.00% 62 9,304 02:30:34
NOTES
16 CurrentMonthRanking
h (46) i (6) CurrentMonthRankVsMovingAnnualAverage(MAA)oftheairline’sranksoverlast12months.Uparrowsignifiescurrentmonthrankisabovetheairline’sMAA.Downarrowsignifiescurrentmonthrankisbelowtheairline’sMAA.MAArankisshowninbrackets.
52-week High Highest airline rank over last 12 months
52-week Low Lowestairlinerankoverlast12months
EARLY ARR PUNCT. %ofarrivalswhichweregreaterthan15minutesearly(<-15minutes).
603 Arrival movements > 500 is highlighted in grey

Page 36 Flight Performance – Annual Report 2015
Departures
Rank [v MAA (pos.)]
52-week High
52-week Low
Airline Code
Airline Name TERMDEP
PUNCT.ARR
PUNCT.DEP A/C MVMT
DEP DELAY (MINS)
AVG. DEP DELAY/MVMT
1 h (8) 1 25 JL JALJapanAirlines 3 96.8% 67.7% 31 303 00:09:462 h (12) 1 32 BI RoyalBrunei 4 96.8% 71.0% 31 444 00:14:193 h (10) 3 25 AM AeroviasDeMexico 4 95.5% 77.3% 22 203 00:09:144 h (7) 2 16 NH ANA All Nippon Airlines 2 93.5% 51.6% 31 186 00:06:005 h (6) 1 21 CZ China Southern 4 93.5% 54.8% 31 665 00:21:276 h (23) 6 35 KL KLM 4 92.1% 91.5% 342 3,856 00:11:167 h (30) 4 57 MU China Eastern 4 90.3% 100.0% 31 240 00:07:458 h (24) 2 61 SV Saudi Arabian Airlines 4 90.3% 61.3% 62 536 00:08:399 h (15) 4 27 KQ KenyaAirways 4 90.3% 87.1% 31 322 00:10:2310 h (14) 9 20 DL Delta Airlines 3,4 89.8% 83.8% 284 3,539 00:12:2811 h (14) 3 26 KE KoreanAir 4 89.7% 65.5% 29 187 00:06:2712 h (29) 12 53 9W JetAirways 4 89.2% 60.2% 93 1,840 00:19:4713 h (24) 11 40 SK SAS Scandinavian 2 89.2% 72.9% 455 7,275 00:15:5914 h (22) 10 36 AF Ar France 4 88.8% 82.8% 232 3,363 00:14:3015 h (28) 5 59 CA Air China 2 88.7% 72.6% 62 1,111 00:17:5516 i (11) 3 16 SA South African Airlines 2 88.5% 62.3% 61 588 00:09:3817 h (26) 17 44 UA UnitedAirlines 2 87.8% 81.4% 451 6,084 00:13:2918 h (21) 4 49 OZ Asiana Airlines 2 87.1% 38.7% 31 224 00:07:1419 h (20) 6 35 SQ Singapore Airlines 2 87.1% 56.5% 124 1,326 00:10:4220 h (24) 3 54 NZ Air New Zealand 2 87.1% 87.1% 31 345 00:11:0821 i (15) 1 31 PR Philippine Airlines 4 86.4% 50.0% 22 192 00:08:4422 h (41) 22 65 EK Emirates 3 85.7% 72.9% 154 2,000 00:12:5923 h (42) 23 50 BA BritishAirways 3,5 85.7% 81.5% 9318 134,149 00:14:2424 h (34) 10 54 TG Thai International 2 85.5% 50.0% 62 1,054 00:17:0025 h (59) 25 77 EY Etihad 4 84.9% 71.0% 93 1,266 00:13:3726 i (20) 3 34 QR Qatar 4 84.9% 90.3% 186 2,598 00:13:5827 h (34) 27 43 EI AerLingus 2 84.0% 82.8% 613 7,414 00:12:0628 i (7) 1 31 AV Avianca 2 83.9% 83.9% 31 317 00:10:1429 i (11) 2 29 JJ TAMBrazilian 2 83.9% 74.2% 31 557 00:17:5830 h (44) 30 61 AC Air Canada 2 82.5% 66.3% 268 4,949 00:18:2831 h (62) 31 78 TK Turkish Airlines 2 82.1% 85.1% 162 2,331 00:14:2332 h (43) 29 51 IB Iberia 5 81.9% 89.5% 232 4,152 00:17:5433 i (27) 16 33 I2 Iberia Express 5 81.7% #N/A 60 535 00:08:5534 h (40) 21 60 AA American Airlines 3 81.6% 73.5% 522 5,874 00:11:1535 i (32) 6 50 ME MEAMiddleEastAirlines 3 80.6% 67.7% 62 408 00:06:3536 i (33) 10 64 WY OmanAir 3 80.6% 64.5% 31 235 00:07:3537 i (33) 11 56 ET Ethiopian Airlines 2 80.6% 58.1% 31 402 00:12:5838 h (44) 27 66 CX Cathay Pacific 3 80.5% 64.4% 149 1,553 00:10:2539 h (57) 28 77 PK PIA Pakistan International 3 79.5% 15.9% 44 452 00:10:1640 i (25) 2 69 IR Iran Air 3 78.6% 57.1% 14 291 00:20:4741 i (37) 11 55 SU Aeroflot 4 77.9% 64.9% 77 878 00:11:2442 –(42) 20 69 JU Air Serbia 4 77.4% 87.1% 31 238 00:07:4143 h (57) 43 68 AZ Alitalia 4 76.9% 83.7% 147 1,413 00:09:3744 h (45) 24 69 KM AirMalta 4 76.7% 90.0% 60 1,380 00:23:0945 h (56) 33 72 A3 Aegean Air 2 76.2% 98.1% 105 1,268 00:12:0546 h (59) 19 77 LO LOTPolishAirlines 2 76.2% 83.1% 84 1,168 00:13:54

Flight Performance – Annual Report 2015 Page 37
Rank [v MAA (pos.)]
52-week High
52-week Low
Airline Code
Airline Name TERMDEP
PUNCT.ARR
PUNCT.DEP A/C MVMT
DEP DELAY (MINS)
AVG. DEP DELAY/MVMT
47 i (32) 11 51 QF Qantas 3 75.8% 82.3% 62 889 00:14:2048 i (42) 12 67 AT RoyalAirMaroc 4 75.6% 75.6% 41 480 00:11:4249 h (65) 49 75 KU KuwaitAirways 4 75.6% 68.2% 45 559 00:12:2550 i (17) 1 54 GF Gulf Air 4 75.4% 79.0% 61 1,287 00:21:0651 i (30) 17 51 VS Virgin Atlantic 2,3 74.6% 80.8% 633 9,951 00:15:4352 h (61) 52 73 LY El Al 4 74.0% 78.0% 50 1,025 00:20:3053 i (50) 40 59 LH Lufthansa 2 73.9% 83.5% 540 8,341 00:15:2754 i (42) 25 54 TP TAP Air Portugal 2 72.8% 80.7% 162 2,828 00:17:2755 i (43) 7 72 J2 AzerbaijanAirways 4 71.4% 85.7% 21 229 00:10:5456 h (72) 56 79 FB BulgariaAirways 4 70.8% 83.3% 24 424 00:17:4057 i (54) 39 74 AI Air India 4 69.9% 50.0% 123 2,338 00:19:0058 h (60) 52 67 4U GermanwingsGMBH 2 69.2% 80.7% 237 3,418 00:14:2559 i (47) 13 62 OS Austrian Airlines 2 68.9% 88.8% 90 1,296 00:14:2460 h (61) 41 70 VN Vietnam Airlines 4 67.9% 28.6% 28 624 00:22:1761 i (29) 7 61 AY Finnair 3 66.9% 69.4% 145 1,936 00:13:2162 i (59) 11 76 VY Vueling Airlines 3 65.2% 80.4% 46 779 00:16:5663 i (61) 30 74 SN BrusselsAirlines 2 65.2% 77.5% 89 1,195 00:13:2664 i (60) 54 69 LX Swiss International 2 64.5% 77.8% 352 4,380 00:12:2765 i (50) 10 68 UL SriLankanAirlines 3 64.1% 79.5% 39 417 00:10:4266 i (62) 39 79 FI Iceland air 2 63.8% 65.5% 58 677 00:11:4067 i (55) 19 81 RR EVA Air 2 61.3% 35.5% 31 439 00:14:1068 i (63) 45 75 MS Egypt Air 2 60.6% 78.8% 66 709 00:10:4569 i (51) 11 75 MK AirMauritius 4 56.3% 75.0% 16 153 01:09:3470 h (73) 70 77 EW Eurowings 2 54.8% 67.8% 199 2,067 00:10:2371 h (73) 65 81 CU Croatia Airlines 2 48.7% 74.4% 39 478 00:12:1572 i (40) 4 75 W3 ArikAirIntlLTD 4 48.3% 30.0% 29 629 00:21:4173 h (79) 73 82 TU Tunisair 4 47.1% 64.7% 17 141 00:08:1874 i (39) 14 74 MI MalaysianAirlines 4 45.2% 0.0% 62 717 00:11:3475 i (69) 40 76 RJ RoyalJordanian 3 38.7% 58.1% 31 409 00:13:1276 i (60) 31 78 WY UzbekistanAirways 4 33.3% 44.4% 9 54 00:06:0077 i (72) 60 81 RO Tarom 4 27.6% 55.2% 29 296 00:10:1278 i (69) 33 80 RC BimanBangladesh 4 11.8% 52.9% 17 211 00:12:2579 i (76) 67 80 AR Air Algerie 4 11.8% 5.9% 17 229 00:13:2880 i (64) 51 80 KC CJSCAirAstana 4 77% 38.2% 13 285 00:21:5581 i (74) 51 81 TS Turkmenistan Airlines 4 0.0% 0.0% 9 71 00:07:53
NOTES
16 CurrentMonthRanking
h (46) i (6) CurrentMonthRankVsMovingAnnualAverage(MAA)oftheairline’sranksoverlast12months.Uparrowsignifiescurrentmonthrankisabovetheairline’sMAA.Downarrowsignifiescurrentmonthrankisbelowtheairline’sMAA.MAArankisshowninbrackets
52-week High Highest airline rank over last 12 months
52-week Low Lowestairlinerankoverlast12months
603 Departure movements > 500 is highlighted in grey

Page 38 Flight Performance – Annual Report 2015
BackgroundThe Heathrow Air Quality Action Plan supports our Air Quality Strategy and was published in December 2011. FP is the action owner for just over 10% of the actions. Details of some work undertaken in 2015 are given below. The FP team continues to provide operational and technical support for the wider air quality debate and initiatives.
Air Quality MonitoringFP continues to manage four permanent air quality monitoring sites, and ensures that the data is published on our website www.heathrowairwatch.org.uk. This website provides an excellent source of information together with updates from monitors every hour. In2014weupgradedfourNOxanalysers,oneO3analyserandfourparticleanalysers(seethepicturebelow).Thishasimproveddatarecordingandwillfacilitateapportionmentknowledge.In2015weupdatedtwoofourmonitors(LHR2andOaksRoad)toallowforBlackCarbonmonitoringandthisisnowincludedonourHeathrowAirWatchwebsite.ThismonitoringwasthefirstofitskindoutsideoftheUKGovernmentblackcarbonmonitoringnetwork.Theairqualitymonitorswillremaininplaceandthedataderivedfrom them continues to inform new air quality initiatives.
Air Quality Action Plan
Emissions BlueprintIn 2015 a blueprint was published which aims to reduce the amount of emissions produced by Heathrow Airport. At the airport, we andourpartnersareworkingtoimproveairqualitybyreducingemissionsfromaircraft,vehiclesandbuildings.Ourgoalistocutground-basedemissionsofNOxby5%by2020(from2009levels).TheBlueprintformsaten-pointactionforreducingemissions,ofwhichFlightPerformancearedirectlyresponsibleforthree.Theplanincludes:
•Reduceemissionsfromaircraftatthegate. •Phaseouttheoldestanddirtiestaircraft. •Improvetaxiingefficiency. •Providemoreandbetterelectricvehiclechargingpoints. •Incentiviselowemissionsvehicles. •Workwithpartnerstosetupemissionzonesandstandards. •Reduceemissionsfromourownfleet. •Poolvehiclestoreducenumbersandemissions. •Leadthemovetoelectricvehiclesairside. •Moderniseourheatingsupply.
Flight Performance – Annual Report 2015 Page 39
TheUKGovernment,insupportoftheSingleEuropeanSkyproject,aimstoachievethemodernisationofUKairspacethroughtheFutureAirspaceStrategy(FAS).ImplementationoftheFASisbeingledbytheCAA.Itwillseethewidespreaduseofmodernnavigationstandards–commonlyknownasPerformanceBasedNavigation(PBN).Existingground-basednavigationinfrastructurewillberemoved.Forthefirsttimeindecades,theredesignofairspacepresentsrealopportunities.PBNhasallowedHeathrowtoexplore ways to provide respite from aircraft noise for people who live and work under departure routes. This work will be taken forwardin2016withtheRespiteWorkingGroupincollaborationwiththeHeathrowCommunityNoiseForum(HCNF).
However, to enable improvements to the operation it is often necessary to conduct airborne trials. To facilitate this FP engaged with the DfT, CAA, NATS, airlines and local stakeholders. During 2014 FP contributed operational design parameters for four trials, produced trial documentation for three and monitored and report on a daily basis for four trials. Data analysis was also conducted attheendofthetrials,andduring2015FPcontributedtothetrialreportfortheMIDEasterlytrialsthatceasedinJune2014andmanagedthecompilationoftheDOKENtrialreporttogetherwithprovisionofasubstantialdataset.Trialreportsfortheseairspaceprojects were published in 2015 with the work being used to form the discussion in the Respite Working Group and the HCNF.
Aside from the mentioned arrival trials, no further Heathrow Airport departure airspace trials were carried out in 2015 with the trials that took place in 2014 being used to form our future engagement and policies. This involved the creation of HCNF to discuss these matters in more detail with the local community, airlines, DfT and the CAA.
TimeBasedSeparations(TBS)InMarch2015HeathrowAirportintroducedaworldfirstbydevelopinganewwayofseparatingarrivingaircraftatHeathrowAirportbytimeinsteadofdistanceinordertocutdelayscausedbystrongwinds,incollaborationwithNATSandLockheedMartin.Traditionally,airtrafficcontrollersseparateflightsbysetdistancesdependentontheaircrafttypeandthesizeofthespirallingairturbulence – or wake vortex – they create as they fly.
However, during strong headwinds aircraft fly more slowly over the ground, resulting in extra time between each arrival. Having to maintain a set distance in those conditions reduces the landing rate and can cause delays and cancellations.
Onanormaldayaround40aircraftanhourlandatHeathrow,butthatcandroptojust32onwindydays,whichiscapacitythatcannot be reclaimed because the airport is so busy, having been essentially full for the past decade.
TimeBasedSeparation(TBS)takeslivewinddatafromtheaircrafttodynamicallycalculatetheoptimalsafespacingbetweeneach aircraft in order to maintain the landing rate. Its introduction is expected to halve current headwind delays at the airport and significantly reduce the need for airlines to cancel flights.
EnhancedInstrumentLandingSystem(eILS)In2015Heathrowinstalledtwonewinstrumentlandingsystemson27RandLrunways.09RandLwillbeinstalledin2016.ThenewILSisbasedonnewnavigationtechnologyandknownasan‘enhancedILS’oreILSforshort.TheeILSprovidesHeathrowthecapability to increase the number of aircraft that can land in low visibility, giving improved resilience and punctuality.
ThenewsystemsaretheonlyonesoftheirkindintheUKandonlyoneotherEuropeanairport,Zurich,hasthesysteminstalled.Thiswill allow Heathrow Airport to increase resilience when operating in low visibility conditions by allowing a greater number of aircraft to land.
Resilience

Page 40 Flight Performance – Annual Report 2015
AsaninterestedandresponsiblememberoftheaviationindustryFPhasbeeninvolvedinthefollowingduring2015:
LondonAirspaceManagementProgramme(LAMP)LAMPaimstomoderniseairspacearoundLondonwheretrafficlevelsarehighestandrouteinteractionsarethemostcomplexintheUK.FPhasbeenengagedthroughouttheyearwithNATStoinfluencethedesignworkandtounderstandtheimpactthisvastprogrammewillhaveonouroperation,andconsequentlywhatchangeswewillhavetomaketoaccommodateit.Underthisumbrellathefollowingconsultationtookplacein2015:LondonAirspaceConsultation–NATSDepartureRouteProposalatLondonStansted Airport. This consultation concerned a change to the use of existing departure routes from Stansted that take traffic to the southeastandeastoftheairport.FPprovidedtheresponseonbehalfofHALwhichsupportedthisinitiativeasnoadverseimpactonthe Heathrow operation was identified.
Steeper Approach TrialInsupportoftheNoiseActionPlan,theNoiseBlueprintandpreparationforLAMP,FPbeganaSteeperApproachTrialin2015.A3.2degreeRNAVapproachwasmadeavailablefrom17September2015andwillrununtil16March2016.Asoftheendof2015thetrial is running with no major issues or concerns and a full report will be published in summer 2016 with a full assessment of the impact the trial had on the Heathrow operation, if any, and the potential noise benefits from operating a 3.2 degree approach. This reportwillthenbeusedtoformfutureHeathrowAirportdecision-makinginrelationtosteeperapproaches.
Quieter Procedures – Proving FlightsWorkundertakenwithBritishAirways,AirbusandNATScontinuedin2015withfurtherflightsflownbyBA.IntotaltenseparateflightswereflownonB777andA380aircraft.Theflightsoperatedtwo-segmentedapproaches,4.5degreesinto3.0degreesat5NM,whichwerethefirstoftheirkindflownintoHeathrowandfurther3.2degreeapproaches.Theyprovidedanopportunityforall parties to better understand these events and their potential impact on the operation.
Airspace
Flight Performance – Annual Report 2015 Page 41
The FP team continued throughout 2015 to support the following regular stakeholder meetings.
FlightOperationsPerformanceandSafetyCommittee(FLOPSC)The committee meets to discuss Heathrow Airside operational and safety performance. In 2015 FP had a significant input providing regular updates on airport operational performance, updates on runway occupancy engagement, briefings on the SID improvement programme and discussion around improving the airport’s operational performance.
Frequency: QuarterlyStakeholders:Internal,external;airlinepilotreps,NATS,CAA,BALPA
HAL/NATSMeetingsOperationalmeetingsrunbyFPatbothweeklyandmonthlylevels,inordertodisseminateandgarnerpertinentshorttermoperational information regarding Heathrow’s air traffic performance.
Frequency: Weekly, monthlyStakeholders: NATS
HeathrowAirportConsultativeCommittee(HACC)The HACC is an independent committee, set up in 1948, which includes representatives of airport users, local authorities and otherbodiesconcernedwithinthelocalityofHeathrow.HALmeetsastatutoryobligationbyconsultingwiththecommitteeonthe airport’s development and operational plans. In 2014 the HACC met six times a year and was a public forum. In 2015 the HACC plans to meet four times. FP provides reports directly to the HACC on matters including the management of the night flight restrictionsandcompliancewithrunwayalternation.InadditionwesupportHeathrow’sChiefOperatingOfficerandtheDirectorofPolicy and Political Relations with respect to operational questions.
Frequency: QuarterlyStakeholders: External, public forum
Heathrow Community Noise Forum TheHeathrowCommunityNoiseForumwassetupinresponsetotheAirspaceTrialscarriedoutin2014.Ithasbeensetupto:
•Keepcommunityrepresentativesandlocalauthoritystakeholdersinformedandseektheirinputinpreparingforandconsultingon future airspace modernisation as part of the Government’s Future Airspace Strategy.
•ImproveindustryandGovernmentrepresentatives’understandingofthekeyconcernsofcommunitieslivingaroundHeathrowand use these to influence Government aviation policy and guidance to the CAA.
•KeepmembersabreastofallairspacetrialsandproceduralchangesthatarebeingplannedbyNATSandHeathrowwheretheyare expected to have a discernible impact on the ground.
•BeakeychannelthroughwhichHeathrowandNATSwillcommunicatewithcommunitiesandstakeholdersonactionsbeingtaken to address community concerns about aircraft noise.
•BeameansbywhichHeathrowcommunitiesaffectedbynoisefromtheairport’soperationsprovidefeedbacktotheairport’smanagement, the DfT, CAA, NATS and the airlines on problems they are experiencing.
•Beafocalpointforstakeholderinvolvementintheplanning,consultationandcommunicationofthemodernisationofHeathrow’s airspace.
Frequency: Six times a yearStakeholders: External; NATS, airlines, local community
Flight Performance Engagement
Page 42 Flight Performance – Annual Report 2015
Heathrow Air Quality Working GroupThis working group is run by Heathrow Sustainability and Environment which allows us to better understand the position of the local councilsandworkwiththemtoaddressairqualityissues.FPattendstoensureanAirsideOperationsview.
Frequency: QuarterlyStakeholders: Internal
SustainableAviationOperationalImprovementsWorkingGroupFPrepresentsHeathrowwithinthiscrossindustryworkinggroup.UndertheSustainableAviationumbrellathegroupinvestigatesandstudies initiatives that may have environmental gains in terms of noise and air quality.
Frequency:Bi-monthlyStakeholders: External; airports, airlines, environmental bodies
Noise Steering GroupTheNoiseSteeringGroupisaninternalHALmeetingtodiscussandworkonaircraftnoise.FPrepresentsHeathrowAirsideOperations.
Frequency: Eight times a yearStakeholders: Internal
Arrivals and Departures Working GroupThisworkinggroupprovidesgovernanceandsupporttoanumberofworkstreamswhichfallunderHeathrow’sAirportOperationalEfficiency(AOE)Programme.Thegroup’sresponsibilitiesincludeairspacechange,groundimprovementandperformancemonitoring.
Frequency:MonthlyStakeholders:External;NATS,BA
Airspace Governance GroupThe Airspace Governance Group is responsible for driving the strategic debate on airspace, facilitating decision making to enable delivery. The group will consider business and strategic priorities and decide how airspace should be best managed for today and intothefuture.Memberswilluseevidencetobalancetheprioritiesofoperationalefficiency,noiseimpactmitigationandcommunityrelations.
Frequency:MonthlyStakeholders:Internalmeeting.Externalbyinvitation:CAA,AOC,NATS,IATA
Sustainable Aviation Noise Working GroupSustainableAviationisacoalitionoftheUK’sairports,airlines,aircraftandenginemanufacturers,andairtrafficmanagementproviders. It was launched in 2005 to allow the industry to come together to tackle the challenges of delivering a sustainable future foraviation:forexample,dealingwithcarbonemissions,noiseandlocalimpactsaroundairports.Thisworkinggroupspecificallylooks at noise impacts.
Frequency: Every other monthStakeholders:External:HAL,UKairports,airlines,AOA

Flight Performance – Annual Report 2015 Page 43
HeathrowNoisePerformanceMeeting •Toimprovethegeneralunderstandingofnoiseandtrackkeepingissuesbetweenthelocalauthoritiesandtheairport. •ToreviewthenoiseandtrackkeepingoutputoftheHALFlightPerformanceTeamsoastoensurethatchangesinperformance
and trends are shared with the local authorities. •Toidentifyspecificareasofconcern,improvementsorsignificantchangesinperformanceinordertoinformnoiseaction
planning and strategy development. •Toensurethatthevariouselementsofthesystemareusedinaco-ordinatedwaytoachievethebestoverallbenefitforthe
community. •ToensuretheGroup’sactivitiesremainwithintheoverallframeworkofnoisemanagementasdeterminedbytheDfT. •Toensurethatwheretheconfidentialnatureofdiscussionsanddocumentationisclearlyexpressedorindicated,thatthiswillbe
respected by all the group members. •ToprovidethecommitteeofHACCwithanoverviewoftheactivitiesofthemeetingtogetherwithastatisticalanalysisof
aircraft noise and track keeping as and when required.
Frequency: QuarterlyStakeholders:External;EnvironmentalHealthOfficers

Page 44 Flight Performance – Annual Report 2015
ADDICT Airfield Disruption and Delay Impact Calculation Tool
AIP Aeronautical Information Publication
amsl Above mean sea level
AM Aircraft movements
ANMAC AircraftNoiseMonitoringAdvisoryCommittee
ANOMS AirportNoiseandOperationsManagementSystem
ATC Air Traffic Control
ATM AirTransportMovement
ATFM AirTrafficFlowManagement
BA BritishAirways
CAA Civil Aviation Authority
CDA Continuous Descent Approach
CDM CollaborativeDecisionMaking
CPT Compton
D1 The day prior to the affected day
dBA A-weighteddecibel
DfT Department for Transport
EPNdB Effective Perceived Noise decibels
ERCD Environmental Research Consultancy Division
FP Flight Performance
FLOPC FlightOperationsPerformanceCommittee
HACAN Heathrow Association for the Control of Aircraft Noise
HACC Heathrow Airport Consultative Committee
HAL HeathrowAirportLtd
HCNF Heathrow Community Noise Forum
ICAO InternationalCivilAviationOrganization
ILS InstrumentLandingSystem
KPI KeyPerformanceIndicators
LAMP LondonAirspaceManagementProgramme
Leq Continuous equivalent noise level
LMax MaximumSoundLevel
LUT Line-UpTime
NAP Noise Action Plan
NATS Air Navigation Services Provider
NOx NitrogenOxide
NQP Night Quota Period
NPR Noise Preferential Routes
NTK NoiseandTrackKeepingSystem
QC Quota Count
RNAV Area Navigation
SID Standard Instrument Departure
Glossary

Flight Performance – Annual Report 2015 Page 45
DfT Flight Dispensation Reasons
Emergencies •Medical •Diversion •Lowvisibility •Risktolife
Serious Airfield and Terminal Congestion •Hardshiptopassengers •Longdelays •Terminalovercrowdedandfacilitiesstrained •Insufficienthotelaccommodation •Hardshiptoanimals •Singlerunwayoperations
Widespread and Prolonged ATC Delays •ATCflowrestrictions •Thunderstorms/strongwinds •Snowandice •ATCstrikeorcomputerproblems
DfT Dispensation •Headsofstate •Royalfamilies(incForeign) •Seniorministersonofficialbusiness •Reliefflights •Civilaircraftaffectedbyhostilities •Militaryflightsoncompassionategrounds

Page 46 Flight Performance – Annual Report 2015
Notes

Flight Performance – Annual Report 2015 Page 47
Notes

heathrow.com/noise
ProducedbyFlightPerformance,AirfieldOperations,HeathrowAirportLimited