Flight Data Monitoring On ATR Aircraft, 2016 - EASA · FDM: Flight Data Monitoring FDR: Flight Data...
44
FLIGHT DATA MONITORING ON ATR AIRCRAFT 2016
Transcript of Flight Data Monitoring On ATR Aircraft, 2016 - EASA · FDM: Flight Data Monitoring FDR: Flight Data...

FLIGHT DATA MONITORING ON ATR AIRCRAFT
2016


INTRODUCTION
A Flight Data Monitoring Program assists an operator to identify, quantify, assess and address operational
risks. It can be effectively used to support a range of airworthiness and operational safety tasks. Many cus-
tomers share the same difficulties in adapting their processes, defining or fine-tuning the software from the
supplier suitable for turbo-prop operations.
This handbook is written to accompany airlines in their implementation or fine tuning of their FDM process
for their ATR fleet. It provides information and guidelines to promote, establish or enhance their FDM pro-
gram. As any new publication, this handbook will be updated; hence we value your feedback and opinion
both on the form and content.
What ATR calls a Flight Data Monitoring (FDM) is:
A proactive and non-punitive program for gathering and analyzing data recorded during
routine flights to improve flight crew performance, operating procedures, flight training,
air traffic control procedures, air navigation services or aircraft maintenance and design.
Depending on the context (generally geographically related), such program may have different name and
acronym:
Flight Data Analysis (Program): FDA or FDAP
Flight Data Monitoring program: FDMP
Flight Operations Quality Assurance: FOQA
As illustrated here below, the document describe the FDM as the general process including the statistics
follow-up and evolution of events (mapping of network difficulties, trends, safety indicators), whereas FDA
(Flight Data Analysis) describes the detailed investigation of one event (Single occurrence investigation,
detailed investigation, practical flight investigation).
Airline OperationsFlight Data
FDAFDM
The FDM process inherently belongs to the Safety Management System (SMS) of an airline. In most coun-
tries, the implementation of a SMS process is mandatory. FDM is currently not mandatory, at least under FAA
and EASA regulations, for aircraft with a MTOW below 27 tons.
FDM is an efficient input to SMS for flight operations.
Important notice: This brochure is intended to provide general information regarding FDM. In no case it
is intended to replace the operational and flight manuals for ATR aircraft. The procedures described in the
AFM shall prevail over the information contained in this document.
1

CONTENTS
GLOSSARY ........................................................................................................................................................P. 4
1. DEFINITIONS ................................................................................................................................................P. 5
2. GUIDANCE MATERIAL ...............................................................................................................................P. 6
2.1. FDM .........................................................................................................................................................P. 6
2.1.1. ICAO................................................................................................................................................P. 6
2.1.2. EASA ...............................................................................................................................................P. 6
2.1.3. FAA .................................................................................................................................................P. 6
2.1.4. UK CAA ..........................................................................................................................................P. 6
2.2. SMS ..........................................................................................................................................................P. 7
2.2.1. ICAO ...............................................................................................................................................P. 7
2.2.2. EASA ..............................................................................................................................................P. 7
2.2.3. FAA .................................................................................................................................................P. 7
2.2.4. UK CAA .........................................................................................................................................P. 7
3. AIRLINE FDM PROCESS .............................................................................................................................P. 8
3.1. FDM IN SMS ..........................................................................................................................................P. 8
3.2. STAFFING / TRAINING RECOMMENDATIONS ...........................................................................P. 9
3.3. CONFIDENTIALITY .............................................................................................................................P. 9
3.4. NOMINAL AIRLINE WORKFLOW ....................................................................................................P. 9
3.4.1 DATA RECOVERY .......................................................................................................................P. 10
3.4.2 DATA PROCESSING ..................................................................................................................P. 10
3.4.3 DATABASE FILTERING ..............................................................................................................P. 10
3.4.4 ANALYSIS .....................................................................................................................................P. 10
3.4.5 STATISTICAL APPROACH ........................................................................................................P. 11
3.5. FINE TUNING......................................................................................................................................P. 12
3.6. FDM ANALYSIS GOOD PRACTICES .............................................................................................P. 14
2
FLIGHT DATA MONITORING ON ATR AIRCRAFT

4. ATR SPECIFICITIES ....................................................................................................................................P. 16
4.1. AIRCRAFT DATA RECORDER – GENERIC SCHEMATIC ...........................................................P. 16
4.2. PRESENTATION OF ATR RECORDING CHAIN ..........................................................................P. 16
4.2.1 MPC FUNCTIONALITIES .........................................................................................................P. 17
4.2.2. DATA RECORDING ..................................................................................................................P. 18
4.3. AVAILABLE PARAMETER ON EACH FRAME ..............................................................................P. 19
5. EVENT DEFINITION FOR ATR AIRCRAFT .............................................................................................P. 21
5.1. DEFINITION OF PARAMETERS USED ..........................................................................................P. 21
5.2. COMPUTATION OF CHARACTERISTIC SPEEDS ......................................................................P. 22
5.3. OTHER COMPUTED PARAMETERS .............................................................................................P. 25
5.4. ATR EVENTS ........................................................................................................................................P. 25
5.4.1. DETECTION OF SPECIFIC FLIGHT EVENTS ......................................................................P. 25
5.4.2. DEFINITION OF EVENTS .......................................................................................................P. 27
6. ANNEXES ....................................................................................................................................................P. 32
6.1. REGULATION ON MANDATORY PARAMETERS TO BE RECORDED ..................................P. 33
6.2. DATA FRAME PRINCIPLE .................................................................................................................P. 33
6.2.1 RECORDING STRUCTURE ......................................................................................................P. 34
6.2.2 SUPER FRAME ARCHITECTURE ............................................................................................P. 35
6.2.3 FRAME SAMPLING (OR FREQUENCY) DESCRIPTION ...................................................P. 37
3

GLOSSARY
ACMS: Aircraft Condition Monitoring System
AFDAU: Auxiliary Flight Data Acquisition Unit
APM: Aircraft Performance Monitoring
ASR: Aviation Safety Report
CRM: Crew Resource Management
CVR: Cockpit Voice Recorder
DFDR: Digital Flight Data Recorder
FDA: Flight Data Analysis
FDAU: Flight Data Acquisition Unit
FDEP: Flight Data Entry Panel
FDM: Flight Data Monitoring
FDR: Flight Data Recorder
FOQA: Flight Operational Quality Assurance
FSO: Flight Safety Officer
LOSA: Line Operation Safety Audit
MPC: Multi Purpose Computer
MRM: Maintenance Resource Management
PCM: Pulse Code Modulation
PLA: Power Lever Angle
QAR: Quick Access Recorder
SMS: Safety Management System
SSFDR: Solid State Flight Data Recorder
4
FLIGHT DATA MONITORING ON ATR AIRCRAFT

1. DEFINITIONS
Event: An occurrence or condition in which predetermined (values of) flight parameters are measured.
Event detection is the traditional approach to FDM that looks for deviations from Aircraft Flight Manual
limits, Standard Operating Procedures and good airmanship.
QAR (Quick Access Recorder): Copy of the FDR (Flight Data Recorder) on a non-crash resistant recorder
which has the specificity to be easy to download.
Hazard: A condition that could foreseeably cause or contribute to an accident.
Risk: The combination of hazard likelihood and severity.
Reactive (Past): Response to events that have already happened.
Proactive (Present): Identification of hazardous conditions through the analysis of airline operations.
Predictive (Future): Analysis of systems processes and environment to identify potential/future
problems.
5

2. GUIDANCE MATERIAL
The following lines provide useful references for further reading.
2.1. FDM
2.1.1. ICAO
Flight Data Analysis Program Manual / DOC 10000
2.1.2. EASA
• Paragraph ORO.AOC.130 of Commission Regulation (EU) 965/2012, Annexes III (Part ORO) con-tains the implementing rule requiring an FDM program for aeroplanes with a MTOW over 27 000
kg and operating for commercial air transport. That regulation is applicable in all EASA Member
States since 29 October 2014.
• AMC1 ORO.AOC.130 of EASA Executive Director (ED) Decision 2012/017/R contains acceptable means of compliance for the implementation of paragraph ORO.AOC.130.
2.1.3. FAA
• Advisory Circular (AC) No 120-82: provides guidance on “developing, implementing, and operat-ing a voluntary FOQA program – Good practice on the oversight of FDM programs (Version 1, Jan.
2015).
2.1.4. UK CAA
• CAP 739 Flight Data Monitoring. Document used by inspectors in the UK. This has subsequently
been used as the basis for JAA and other advisory material.
6
FLIGHT DATA MONITORING ON ATR AIRCRAFT

2.2. SMS
2.2.1. ICAO
SAFETY RISK MANAGEMENT:
“The objective of safety risk management is to assess the risks associated with identified hazards and
develop and implement effective and appropriate mitigations.”
(ICAO SMM /3rd version)
• ICAO defines the SMS standards in:
– ICAO Annexes 6: Operation of Aircraft
Safety Management Manual (SMM) / Doc 9859
An efficient SMS will manage the safety risks associated with these contributors and will continu-
ously manage the performance of the system.
– ICAO Annexes 19: Safety Management
2.2.2. EASA
• EU-OPS Paragraph OPS 1.037 (Accident prevention and flight safety program)
• Article 2 EASA Basic Regulation EC N°216-2008The EASA reference contains the elements of the ICAO State Safety Program.
The major principles of ICAO Annexes paragraph 3.2, such as data collection, monitoring of safety perfor-
mance, evolution of data, providing data to personnel, anonymous reporting and proactive attitude towards
the improvement of aviation safety, are included in EU-OPS 1.037.
Gap with ICAO Annexes 6: It does not explicitly require the definition of an acceptable level of safety and a
continuous monitoring thereof by the operator which are key reactive rather than proactive aspects.
2.2.3. FAA
• Advisory Circular 120-82
• Flight Operational Quality Assurance program: A new subpart 1 was added to 14 CFR Part 13 which codifies enforcement protection for FOQA programs. This rule became effective November
30, 2001.
2.2.4. UK CAA
• CAP 795 Safety management systems (SMS) guidance for organizations.
7

3. AIRLINE FDM PROCESS
Flight Data Monitoring software collects and analyzes aircraft operational parameters that are recorded on
board the aircraft typically using Quick Access Recorder (QAR).
QAR can typically record a large number of aircraft flight parameters. They are downloaded periodically
when the aircraft reaches a suitable station or maintenance base. The resulting data is stored in a large data-
base and analyzed to identify occurrences that exceed defined thresholds, and resulting trends.
Information about FDM software principles may be found in annexes 6.2.
3.1. FDM IN SMSThe principle of the SMS in an airline is to:
- Collect occurrence data;
- Identify hazards;
- Assess the risks (by combining the likelihood of occurrence and the possible consequences of each
hazard);
- Identify and put mitigation measures in place;
- Monitor the efficiency of the mitigation.
FDM provides the capacity to analyze a wide range of parameters and to identify contributing factors that
will help to assess and understand the root causes of in-service incidents – in complement to flight crew
reports or interviews.
Since FDM gathers the data of the complete airline or fleet, the analysis provided in a weekly or monthly
report enables one event to be analyzed in a general context instead of being focused on that single par-
ticular event.
The objective of setting up an FDM process in an airline is to transition from a purely reactive mode (incident
analysis based on flight crew reporting) to a more proactive mode (early identification of undesired events
and implementation of mitigation measures).
SMS system
FDM program
Hazard
identification
Risk
identificationInitial Risk Assessment
mitigation
Data analysisRisk/events correlation matrix
Risk monitoring policy
8
FLIGHT DATA MONITORING ON ATR AIRCRAFT

3.2. STAFFING / TRAINING RECOMMENDATIONSTo properly meet the workload of a typical airline with 10 to 20 aircraft, ATR recommends that the FDM team
should at least consist of one FDM analyst and one type-rated pilot (or former pilot).
To perform relevant FDM and being credible to the operational community the team should have in-depth
knowledge of operating manuals and aircraft performance characteristics - including SOPs, aerodromes and
routes. The FDM team members must have appropriate training on the tools and software used.
To obtain complementary perspectives, 2 part-time people (one from the Safety department and one from
the Engineering or Operational department) may provide a more synergistic approach than a single full-
time analyst dedicated to the FDM program.
3.3. CONFIDENTIALITYDefining safeguards ensuring confidentiality is paramount; FDM requires vigilant security and privacy pro-
tection for the data. Data shall be protected against unauthorized disclosure, alteration, misuse, or destruc-
tion. Data protection and security are sensitive issues that focus on the confidentiality of a particular air
carrier, flight, date, or flight crew and recorded event.
The confidentiality policy has to balance the FDM team needs to access the data against the need to keep
the data confidential. From the outset, air carrier policy and procedures for all security and protective aspects
of the FDM program should be carefully designed, documented, implemented, and periodically reviewed.
Any disclosure for purposes other than promoting or improving safety of the flight operations can compro-
mise the engagement of all persons involved, including flight crews or maintenance teams.
3.4. NOMINAL AIRLINE WORKFLOWThe FDM process key elements are:
• Identifying hazards or risk factors
• Determining the severity (probability of occurrence / level of consequences)
• Defining a mitigation plan, which can include:- dispatching good practices and standardization information to the flight crews
- adapting SOP
- adapting training
• Assessing the efficiency of these actions.
Different teams/functions will be involved: safety and flight operations at least, but engineering and/or main-
tenance may be included as well. The key tasks for which the FDM team will be the main actor are detailed
below.
9

3.4.1 DATA RECOVERY
On ATR, the most convenient way to recover data is to get the MPC’s PCMCIA card. Each time a card is
recovered from an aircraft, it must be replaced by another one. In order to identify any corrupted PCMCIA
card, it is strongly advised to dedicate each card to a specific aircraft. The number of cards required for each
aircraft to ensure a smooth process may therefore vary and must be determined according to the airline’s
specificities. Based on the storage space available on the cards and the recording rate of the aircraft, the
frequency with which data should be recovered is to be determined. If practicable ATR recommends a daily
download. It is always preferred as it allows an early reaction if an incident is found in the data.
Wireless data transfer solutions for ATR already exist and others are under development.
3.4.2 DATA PROCESSING
Data is processed by software that provides a corresponding series of flights and flight events to the end
user. Filtering those flights and events is necessary to ensure a good level of relevance and consistency in
the database. Undesired events to be cleaned are generally recurrent and may be due to several factors
such as improper thresholds or event definition under some circumstances (for instance in case of training
flight or steep approach) or inaccurate terrain database (GPWS “undue” warnings). Even though such spuri-
ous events have to be cleaned to ensure a good quality of the database, their root cause needs to be identi-
fied and corrected when possible, either by configuring the software differently or contacting the
manufacturer/vendor of the equipment at the origin of the issue.
The quality of the database can be assessed by the retrieval rate and the quality index.
- The retrieval rate is the ratio of the number of flights processed by the FDM software over the number of
flights actually operated (coming from another source).
- The quality index is the ratio of the number of flights properly analyzed over the number of flights
processed.
3.4.3 DATABASE FILTERING
Flight events need to be filtered. Deleting flight events under specific circumstances (for instance, long flare
or late touchdown on a runway whose threshold was moved due to works ongoing as signified by a NOTAM)
is a normal practice but should be temporary. Any permanent deletion policy on some events means that
either the software tuning is not appropriate or that the event itself is not appropriate (which can result of a
variety of reasons). In any case, investigation should be conducted to understand the cause of the issue and
solve it.
3.4.4 ANALYSIS
Analysis is the heart of the FDM process. The simplest way to look at it is to monitor the occurrence rates and
trends of the various events configured in the software. Typically, a high occurrence rate of one specific
event should be investigated.
Analyzing a trend of occurrence rate over a large (> 6 months) period of time requires the knowledge of any
change in the company that can impact this rate (change in SOP, change in routes or airports, change in
FDM algorithm or thresholds, specific training given to the crews, etc.). The analysis consists in putting those
numbers or occurrence rates in perspective.
To summarize, the FDM team provides the organization (but especially the SMS process downstream) the
validated factual material on which the operational and safety strategy will be based or amended.
10
FLIGHT DATA MONITORING ON ATR AIRCRAFT

3.4.5 STATISTICAL APPROACH
The power of a FDM program is to provide data of a large quantity of flights over a significant period of time
(generally, at least one year). A statistical approach to this data allows monitoring trends of occurrence of
events and therefore identifying hazards or follows their evolution.
Practically, on a regular basis the FDM team would produce statistical reports with systematic data: top 10
events, top 10 red events, top 10 events at each airport, top events trends, etc... By producing those reports
in a standard format it is then possible to monitor the evolution of the situation.
Any FDM software should provide a statistical module or capability.
Flight Operation
FDM SoftwareRetrieval rate calculation.If result is below 80%,
feedback to maintenance
Technical Filtering
Operational Filtering
Spurious valueY/NDelete invalid event/flight
Quality index calculation.If bad result, feedback to
maintenance
Spurious EventY/N
FDA TeamDépartement
FSO “Flight safety officer” + Head of Safety + Chief Pilot +
Head Of training
Event related with
maintenance:VFE exceedance, VRTG at landing
Delete invalid event / Tool perfomance assessment
Relevant Flight Database
Occurence AnalysisFlight Analysis of Most Significant DeviationsOccurrence
Rate ofCriticality(ORC)
If RED => Immediate Action
Statistical AnalysisTrends monitoring, global airline operations view
Safety issue
SMS process
PCMCIA / 3Gdata transfer Maintenance
department
11

It is important to remember that statistics are relevant only if they are based on a sufficient amount of data,
especially when a breakdown of event rate per airfield or runway (for instance) is performed. In such case, a
rate at a specific airfield may be artificially low or high just because there were not many flights to this air-
field: no event on two flights would give an occurrence rate of 0% while one event would give a rate of 50%.
Generally speaking, extreme rates (low or high) should raise the attention of the analyst.
3.5. FINE TUNINGFine tuning is the process with which the airline modifies the logics or the thresholds of one or several
events. It is more likely to take place after several months and sufficient statistics reports. It can also be the
consequence of a change in the SOPs that needs to be reflected in the FDM.
The company can tune these event thresholds to be more relevant by testing exceedance detection. This
can be tested either by realistically manipulating normal data to simulate an event, by reducing the event
limits such that normal flying will trigger events, or more acceptably, by replaying historical data known to
contain incidents that should trigger events. It is also important to identify issues such as “false events” gen-
erated by the program.
Airline operation policy FDM Software
Expected operational limitation
Event threshold programming or tuning
Example 1: High approach path on a specific airport due to obstacle constraints
Generally, the FDM software is using by default a 3° path angle standard to monitor the “path
high or a path low in approach” deviation.
With, for example, the following values for the high approach path:
Severity 1 => 3.3°
Severity 2 => 3.5°
Severity 3 => 3.7° and above.
SEVERITY SEVERITY 1 / LOW SEVERITY 2 / MEDIUM SEVERITY 3 / SEVERE
Above glide Slope standard
threshold3.3° 3.5° 3.7°
For a specific airport, this threshold can be changed by the company to be more representative.
If a path angle of 3.5° is required due to obstacle constraints:
Severity 1 can be adapted from 3.3° to 3.7°
Severity 2 can be adapted from 3.5° to 3.9°
Severity 3 can be adapted from 3.7° to 4.2° and above.
SEVERITY SEVERITY 1 / LOW SEVERITY 2 / MEDIUM SEVERITY 3 / SEVERE
Above glide Slope modified
threshold3.7° 3.9° 4.2°
12
FLIGHT DATA MONITORING ON ATR AIRCRAFT

Without this event threshold tuning, a lot of events will be triggered without any relevant information. They
will pollute the flight database and will not produce relevant statistics.
With the modified threshold, the event dispatch will show:
Previous threshold:
- Lots of flights to investigate.
New threshold:
- Focus on several flights
with relevant deviations.
Example 2: High bank events in approach
Apart from tuning the thresholds, the company can tune the logic of a specific event to remove events that
occur too often because of a specific and known feature. For example, while following a specific approach
to a given airport, the crew has to perform a final turn at relatively low height. This may be the normal opera-
tional procedure at this location. In any case, because the “high bank in approach” is set up the same way
everywhere, it would trigger far more often on this approach than anywhere else, and therefore pollute the
database. As a consequence, the logics of the event may be adapted to take into account this specific
approach and disable the event generation.
Be careful with event threshold modification; do not omit real events or real safety issues!
The tuning of a threshold must be done and reviewed with pilots, engineer and flight safety officer; and
must be validated on the next occurrence/statistic report.
A threshold or logics shall not be changed to reduce the number of events but to reflect a specific type
of operation or change in SOPs as agreed within the organization.
13

ROADMAPIMPLEMENTATION PHASE PROPOSAL (1 YEAR)
Depends on company size and manpower
Planning preparation
• Select personnel
- Training
• Select technology
- Install Equipment
• Define safeguards
• Negociate a pilot agreement
• Collect and process
airborne data
• Analyze and validate
• First statistics report
• Occurences
reports
Continuing operation
• Periodic review
• Solution implementation
• Objective definition
• Review previous corrective
actions
Start 3 Months 7 Months 12 Months
3.6. FDM ANALYSIS GOOD PRACTICESStatistic results investigation method:
It is often helpful to explain features visually identified in the data by presenting basic sample statistics.
These statistics can be used to describe the distribution of event and pattern of data over a range.
When looking at FDM or any other safety data it is important to take account of the chance of drawing the
wrong conclusions by misreading random variations or by taking biased samples of data. There are inherent
hazards in taking no action where a risk exists or taking inappropriate action where no risk actually existed.
Statistical techniques have a range of practical applications in an FDM program such as detecting abnor-
malities, both in terms of user-defined limits and statistical significance versus randomness. This information
can then feed the process of determining the actual severity of an event and, together with other relevant
information, help identify actual potential risk. In turn this can lead to a better overall understanding of an
event. When such techniques are employed in conjunction with IT systems and common software packages,
it is practical to use these for day-to-day monitoring FDM on larger quantities of data. The identification of
trends, clusters, exceptions and correlations between different variables will greatly assist the analyst’s work.
14
FLIGHT DATA MONITORING ON ATR AIRCRAFT

Following tools are available in order to interpret statistics report:
• Times series chart can be used to identify:- Trend over time
- Fluctuation over a fixed period
- Extreme fluctuation
• Time series line
• Pie chart
• Box plot
• Histograms- Histograms may dispatch several events by severity; it is also used for the top 10 events (all sever-
ity) or top 10 red events (by airport, by flight phase…)
- Histograms are also used for a concrete event like vertical G at landing to see the dispatch of the
event value.
Consider the following tips when performing an analysis of the data:
• The scale of the graph and the axis choice. A percent or quantity (number of occurrences or num-ber of flights) will not provide the same result.
• The sample (relevant sample is mandatory to study statistics), example: a single flight on a single destination with some major events will show this airport as “High risk airport” but in fact it is only
one flight. In that case if a statistic like “Major airport with high % red event” is produced, this single
flight will put this airport on the first place.
• Time period: it is important to take into account the date of any implementation solution, to moni-tor the effectiveness of this solution. To monitor positive or negative trend after an implementation
date.
15

4. ATR SPECIFICITIES
Apart from the Flight Data Recorder (FDR) and Cockpit Voice Recorder (CVR) used in the case of accident/
incident investigation, the modern aircraft are equipped with recorders and interfaces that enables the
operator to record and retrieve flight data daily for on-ground analysis.
4.1. AIRCRAFT DATA RECORDER – GENERIC
SCHEMATICThe purpose of an airplane Flight Data Recorder (FDR) system is to collect and record data from a variety of
airplane sensors onto a media designed to survive an accident.
To ease data recovery for the airlines’ needs (such as performing FDM) Quick Access Recorder (QAR) sys-
tems have been developed. The QAR records a copy of the FDR data but on a media that is easily accessible
and interchangeable.
Data from
Aircraft sensors
FDAU
Flight Data
Acquisition
Unit
DFDR / SSFDR
CVR
QAR
Each system or sensor from the aircraft sends data to the FDAU, which converts these signals into com-
pressed data sent to the FDR. All these data are stored together with the recorded time in FDR. All param-
eters can then be read simultaneous with the time as axis base.
4.2. PRESENTATION OF ATR RECORDING CHAINATR aircraft recording is ensured by two main systems:
• The Multi Purpose Computer (MPC), located in the avionic bay in the forward part of the aircraft, performing FDAU and QAR function
• The FDR, located in the tail of the aircraft. The most common type of FDR on ATR are SSFDR (Solid State Recorders) but some aircraft are still equipped with tape-based DFDR (Digital Flight Data
Recorder)
As shown in the figure below, heart of the ATR recording chain is the MPC. Directly linked to aircraft systems
and sensors, the MPC contains the FDAU function that converts and encodes data that will be transmitted to
FDR and QAR.
16
FLIGHT DATA MONITORING ON ATR AIRCRAFT

001100
MENU
1 2 3
654
7 8 9
0. +-/
/
PREV NEXT RMS
SP
A B C D E F G
H I J K L M N
O P Q R S
V W X Y Z
T U
FPLN
PROG
DTO
DATA
PERF
VNAV
MSG
MRK
CLR
EXEC
BRT
BRT
< FMS 1 <ACT>
< FMS 2
< RMS 1
< RMS 2
< ACMS
< DL
MENU
MENU
1 2 3
654
7 8 9
0. +-/
/
PREV NEXT RMS
SP
A B C D E F G
H I J K L M N
O P Q R S
V W X Y Z
T U
FPLN
PROG
DTO
DATA
PERF
VNAV
MSG
MRK
CLR
EXEC
BRT
BRT
< FMS 2
< FMS 1
< RMS 1
< RMS 2 <ACT>
< ACMS
< DL
MENU
PDR
ADV
SELF
TEST
PWR
ON
ALERT
RESET
PTR
BUSY
TO OPEN
TURNSLIDE DOWN
TO CLOSESLIDE UP
TURN
ONFLOOD
EVENT RESET
GND CTLLT RCDR
BRTOFF
112VM
FDPITCH HOLDHDG SEL LO
LNAV
010
7600
6
2
1
060
040
115
108
1010
20 20
DC EMER BUS
001100
001100
001100
DC ESS BUS
CAC
ADC
GPS
AHRS
MPC
EEC
PBC
TCAS
CLOCK
DU
FMS
RADALT
TAWS
VOR
DME
OPERATION
(if installed)
FCU
APM Control Panel
Legend
MCDU 1 MCDU 2Printer
(optional)
ACARS
Accellerometer
PCMCIA CARD
Recording panel APM alerts on
Primary Flight Display
SSFDR
DC
Discrete
RS 232
ARINC 429
ARINC 573
Signals from
the Aircraft
ATC Mode S
Enhanced
Surveillance
FDAU
MPC
4.2.1 MPC FUNCTIONALITIES
Incorporated in the aircraft avionics suite, the MPC incorporates several different separate systems such as
FDAU and Auxiliary FDAU (AFDAU).
It handles data collection and processing for both maintenance and regulatory purposes. The MPC features
a centralized maintenance function.
MPC
Multi Purpose ComputerLeft Electronic Rack
DMU
FDAU
Located in the LH electronic racks, the MPC is composed of two independent applications:
• Flight Data Acquisition Unit (FDAU) software part,
• Data Management Unit (DMU) software part.
The FDAU software part acquires aircraft parameters in analogue, discrete and digital formats from aircraft
systems. It concentrates all these data, in accordance with regulations (refer to annexes 6.1)
17

The main capabilities of the FDAU:
• Acquire aircraft parameters,
• Provides the Aircraft Performances Monitoring (APM) function,
• Parameters broadcast to avionics systems (CAC1 and CAC2),
• Recognition of aircraft configuration through pin-programming,
• Manage Time, Flight Time, Flight Number and Data loading,
• Synchronization between SSFDR and the CVR,
• Format and transmit data to FDR and QAR,
• Transmit data to the DMU
The DMU part of the MPC main functions:
• Format ACMS reports
• Aircraft Maintenance monitoring (ACMS) which facilitates the maintenance of the aircraft
4.2.2. DATA RECORDING
After acquisition, the parameters are processed and formatted into an ARINC 573 message for the SSFDR.
The format of the message is a FRAME comprising four SUBFRAMES each having duration of one second.
FDAU - MPC
FRAME
SUBFRAME Nº1 SUBFRAME Nº2 SUBFRAME Nº3 SUBFRAME Nº4
PCMCIA CARD
SSFDR
SUBFRAME
WORD 1
WORD1 2 3 4 5 6 7 8 9 10 11 12
WORD 2 WORD Y WORD Z
1 second
On ATR, each SUBFRAME comprises 64, 128, 256 or 1024 words of 12 bits. The same word can contain from
1 to12 different parameters.
The characteristics of recorded parameters meets the requirements defined by regulations (refer to annexes
6.1) in terms of recording range, sampling rate, accuracy and resolution.
18
FLIGHT DATA MONITORING ON ATR AIRCRAFT

4.3. AVAILABLE PARAMETERS ON EACH FRAME
ATR FRAME VERSION
The data frame version installed in the Final Assembly Line is given in the table below. Retrofit solutions exist
in order to improve the recording equipment embodied on an aircraft.
The first 2 rows show the correlation between frame version and the ARINC word capacity.
The third row shows the implementation of frame version regarding MSN (if possible)
The next rows are built on the same way e.g. ATR72
Frames descriptions are available in:
ATR-42 = Service letter ATR42-31-5011 (DFDR recorded parameters decoding law)
ATR-72 = Service letter ATR72-31-6010 (DFDR recorded parameters decoding law)
When setting up or running a program for new or existing aircraft, it is important to take the data frame
capabilities of the aircraft fleet into account, in terms of parameters coverage and resolution. Either of
these factors can influence the quality and options available for creating measures and events in the
program.
NUMBER OF
ARINC WORDS
AVAILABLE
/ FRAME
VERSION
64 64 64 128 256 1024
ATR 42 V0 V1 V2A V2B V3 V4
MSN 0 261 262 294First 443
Standard from 513
First 443 Standard from
613
First 844 Not standard,option
onlyAll 600 series
ATR 72 V0 V1 V2A V2B V3 V4
MSN 0 252 First 253First 468
Standard from 494
First 572 Standard from
632
First 773 Not standard, option
onlyAll 600 series
V0
+GPWS+TCAS
+A/P mode
V1+
+A/P mode sel+GNSS
information+Flight Control
pos+Icing AOA
+Fuel Quantity+target Torque+Engine -torque
V2A+
+Fuel Flow+CCAS warning+Decision Height
+Yaw trim position
V2B+
+Flight control forces+Brakes hydraulic pressure
+Propeller beta
V3++Target speed
+FWS+Precise weight+Procedures displayed+2 ADC
information+DME Distance
+AOA ½+Distance to missed
approach point+Drift angle
+TA+VOR FREQ+VOR bearing
Correlation between dataframe version and MSN
19
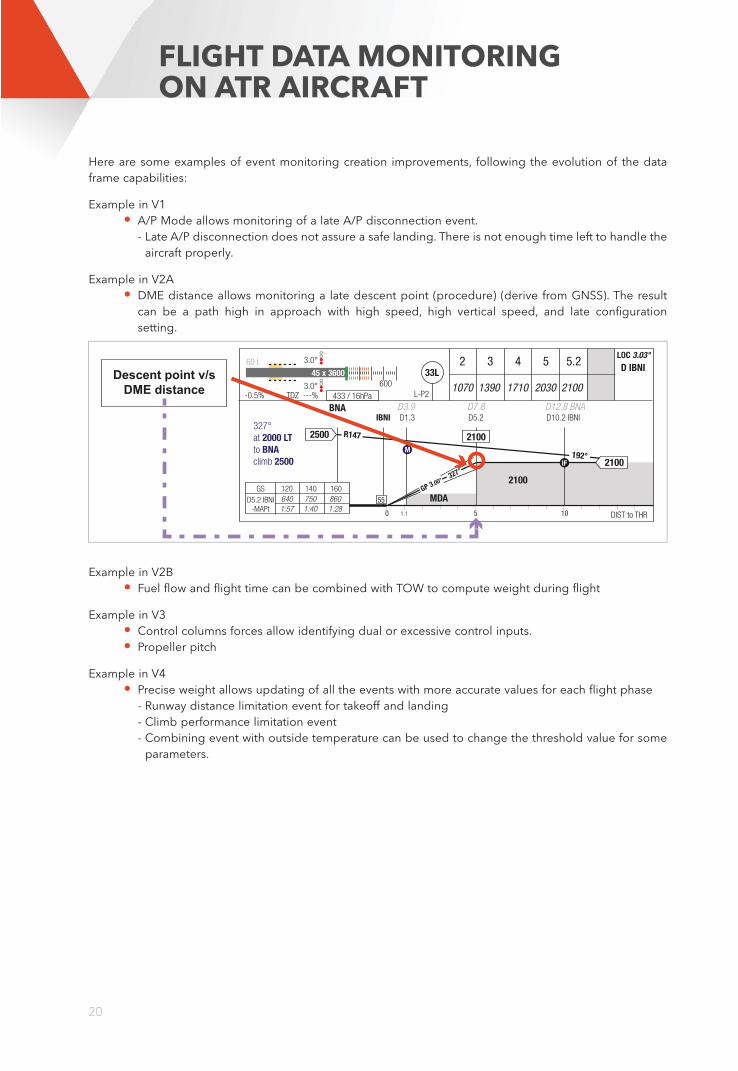
Here are some examples of event monitoring creation improvements, following the evolution of the data
frame capabilities:
Example in V1
• A/P Mode allows monitoring of a late A/P disconnection event.- Late A/P disconnection does not assure a safe landing. There is not enough time left to handle the
aircraft properly.
Example in V2A
• DME distance allows monitoring a late descent point (procedure) (derive from GNSS). The result can be a path high in approach with high speed, high vertical speed, and late configuration
setting.
2LOC 3.03°
L-P2
0
55
1.1 5 10
60 L
D3.9 D7.8 D12.8 BNA
-0.5%
D1.3
GS
D5.2 IBNI
-MAPt
120
640 750 860
1:57 1:40 1:28
140 160
2500
2100
2100327°
at 2000 LT
to BNA
climb 2500
D5.2 D10.2 IBNI
DIST to THR
433 / 16hPa
3.0°
6003.0°TDZ ---%
D IBNI
IBNI
R147
192°
GP 3.00°327°
BNA
2100
33L
1070 1390 1710 2030 2100
3 4 5 5.2Descent point v/s
DME distance
45 x 3600
MDA
M
IF
Example in V2B
• Fuel flow and flight time can be combined with TOW to compute weight during flight
Example in V3
• Control columns forces allow identifying dual or excessive control inputs.• Propeller pitch
Example in V4
• Precise weight allows updating of all the events with more accurate values for each flight phase- Runway distance limitation event for takeoff and landing
- Climb performance limitation event
- Combining event with outside temperature can be used to change the threshold value for some
parameters.
20
FLIGHT DATA MONITORING ON ATR AIRCRAFT

5. EVENT DEFINITION FOR ATR AIRCRAFT
5.1. DEFINITION OF PARAMETERS USEDThe parameters required to monitor an event may be recorded in the FDR/QAR (or only in some FDR) or not. In the
latter case, an alternative method is proposed to compute the parameter based on recorded parameters.
For instance, the following parameters are always recorded (from V0):
PARAMETER ATR MNEMONIC COMMENT
Altitude ALTThe recorded altitude is the standard altitude, or pressure altitude: it is recorded with a barometric reference of 1013.25 hPA (29.92 inHg).
Pitch trim position ELVTThe recorded pitch trim position corresponds to the deflection of the elevator tab, positive meaning tab up/pitch down. Hence, it is the opposite of the
indication in the flight deck.
Flap position FLAPDepending on the dataframe, the left flap or the average position of both flap
is recorded. On V4, both flaps position are recorded separately.
GPWS status GPWS (or TAWS)On all dataframes, there is at least a discrete parameter that trips when there is a GPWS warning. On V4, all warning modes are recorded (eg, “sink rate”,
“pull up”, ...)
Ground speed GSThe groundspeed is based on GPS/GNSS, therefore it is highly reliable but
slightly delayed (1.5 second being the order of magnitude).
Indicated airspeed IAS
Lateral acceleration LATG
Longitudinal acceleration LONG Negative sign means the aircraft is accelerating.
Magnetic heading MHDG
Power lever angle 1 (2) PLA1(2)The PLA positions are given as seen by the HMU. In this reference, the
reference Ground Idle (GI) position is 20°, Flight Idle (FI) position is 35° and the notch position (if applicable) is 75°.
Pitch attitude PTCHThe pitch attitude reference comes from AHRS. On V4, the three sources of pitch information (both AHRS and EHSI) are recorded separately. It is
recommended to use the Captain information by default.
Radio altitude RALT
Roll attitude ROLL See pitch attitude comment.
Selected altitude SALT
Landing gear selector (or lever) position
SLDG
TCAS TCASAvailable from V1 (except V2a), the TCAS resolution advisories are detailed
(eg: “climb”,”descend”,...)
Torque engine 1 (2) TQ1(2)
Vertical acceleration VRTG
21

5.2. COMPUTATION OF CHARACTERISTIC SPEEDS
Weight
Knowing the weight of the airplane is paramount: it is required for the computation of stall speeds (VS or
VSR) and all associated characteristic speeds (VmLB, VmHB and then VAPP, etc.). On -600 airplanes, the
gross weight (GW) is recorded from the crew input in the FMS with a good resolution. It is updated during
the flight.
On legacy airplanes, the weight is automatically provided via the APM selected weight rotator position
recording (SWEIGHT). It is meant to be set by the crew before take-off at the closest weight but has a limited
precision (at worst +-500 kg). It is still sufficient to compute the related operational speeds with a reasonable
precision (a few kt). The parameter is available on all dataframes provided the installation of the APM which
was mandated by AD (to be completed before Aug. 2015). It does not change during the flight, hence the
weight must be updated either by using the Fuel Quantity parameter or by integrating the Fuel Flows.
Once the weight is known, a series of characteristic speeds can be computed that will in turn be used for the
monitoring of events.
NOTE: The airspeeds in the AFM or the FCOM may be given in IAS or CAS. The relationship between IAS
and CAS is given in the AFM, chapter 6.01.
VS, VSR, VS1G: Depending on aircraft certification basis, the stall speed is referred to as VS (for 42-3xx) or VSR. VSR is identical to VS1G and both may be used in ATR documentation depending on the variant but
VSR will be referred to in this document. It is a function of flap / landing gear configuration and weight. The
data can be found in the AFM 3.04-p2 or in the FCOM 2.01.03-p2. The example below is taken from the ATR
42-400/500 FCOM (basic version):
115 ––––
110 ––––
105 ––––
100 ––––
95 ––––
90 ––––
85 ––––
80 ––––
75 ––––
70 –
0
15
2525
35
12 13 14 15 16 17 18 19
26 28 30 32 34 36 38 40 42
VSR (KT CAS)FLAPS
(1000 Lb)
WEIGHT (x1000 Kg)
GEAR UP
GEAR UP
GEAR UP
GEAR DOWN
GEAR DOWN
R STALL SPEEDS-VSR
22
FLIGHT DATA MONITORING ON ATR AIRCRAFT

VAPP:As defined in the FCOM (3.08.02):
VAPP = MAX(VmHB + Wind Factor, VMCL)
where: Wind factor = MAX(1/3 of the head wind, gust factor,15 kt)
It is generally not possible to know the gust factor based on flight data but a method based on ground and
air speeds can be used in order to evaluate the head wind component. When ground speed is recorded,
wind direction and speed usually are but with a lower sampling rate (every 4 s vs. every s). The recorded
wind data can be used directly but the head wind component can also be deduced from ground speed (GS)
and true airspeed (TAS, which is recorded in dataframes V4 or can be computed from IAS and ALT):
Head Wind = TAS-GS
Then the value obtained (for instance at 50 ft) is used to compute the wind factor.
IASth: The theoretical IAS in cruise depends on the temperature, flight level and weight. The data can be found in the QRH 4.3X / 4.4X or in the FCOM 3.05.02. The example below is an extract from ATR 72-212A
FCOM:
The theoretical airspeed in cruise at max cruise regime is the third line of each box.
VMCA: VMCA depends on altitude and temperature. The data can be found in the FCOM 2.01.03-p4.
CRUISE 2 ENGINES20 T
MINIMUM TIME
FLIGHT
LEVEL
DELTA ISA
-10 0 +10 +15 +20
60
94.4
466
252
267
94,5
471
250
270
88.1
450
241
265
83.1
433
235
261
78.6
416
229
256
80
94,5
459
250
273
94,5
464
248
276
84,4
429
235
266
79,9
412
229
262
75,4
396
223
257
100
94,5
453
247
278
90,4
441
241
275
81.0
409
229
267
76.5
392
222
262
72.3
377
216
257
120
93,8
446
244
283
86.3
419
234
277
78.1
390
223
268
73.9
376
217
263
69.8
361
211
258
140
89.5
428
237
283
83.0
401
228
278
75.7
374
217
270
71.7
361
211
265
67.7
347
205
260
160
85.0
407
230
283
79.2
382
221
278
72.6
357
211
270
69.3
345
206
266
65.5
332
199
261
180
79.7
383
221
281
74.6
361
213
276
68.7
337
203
269
65.5
325
198
264
62.3
314
192
259
200
74.0
357
212
278
69.4
336
204
273
64.4
316
194
266
61.6
305
189
261
58.7
295
183
255
220
68.4
331
202
274
64.3
313
194
268
60.0
294
185
261
57.5
285
179
256
54.9
276
172
249
240
63.0
306
191
268
59.3
289
183
262
55.3
272
172
252
53.2
265
166
246
50.9
256
159
238
250
60.4
294
186
265
56.7
277
176
257
52.9
261
165
246
50.9
254
158
238
48.7
246
149
227
TQ % NP-82%
KG/H/ENG
IAS
TAS
23

The table below gathers limitations and other characteristic speeds definitions that will be used in the events
settings:
ATR42 ATR 72
300/320 400 500 500 V600 200 210/212A 212A V600
VMO (IAS)250
230 (mod1739+1790)250
VFE (IAS)
Flap 15160
170 (mod 1790/1739/3686/8030)
Flap 30145
150 (mod 1790)
Flap 45130
Flap 15170
180 (mod 5948+4462)
Flap 25160
Flap 35150
Flap 15185
Flap 30150
VLE (IAS)160
170 (mod 1790)180 185
VLO RET (IAS) 160
VLO EXT (IAS) 160 170
VRA (IAS) 180
MAX TIRE SPEED
(GS)165
VMCL (CAS)
Flap 1589 (PW120)91 (PW121)
Flap 3087 (PW120)89 (PW121)
Flap 4585
Flap 15/25 94.5
Flap 1598.5
Flap 2596
Flap 1594 (PW124)100 (PW127)
98 (PW127F/127M)
Flap 3090 (PW124)
98 (PW127/127F/127M)Flap 35: 96.5
VMHB NORMAL
C (IAS)1.3* VS 1.23* VSR
VMLB NORMAL C
(IAS)
Flap 0max(V2 OR 1.25*VS)
Flap 15V2
Flap 01.20*VSR
Flap 15V2
Flap 01.22*VSR
Flap 15V2
Flap 01.18*VSR
Flap 15V2
VMLB0ICING
(IAS) 1.45*VS 1.45*VSR 1.43*VSR 1.4*VSR
VGA NORMAL C
(IAS)max(VmHB
(landing config)+5 OR 1.1*VMCA)
max(VmHB15 OR
1.1*VMCA ) max(VmHB
15 OR 1.1*VMCA )
V2MIN
(NORMAL
CONDITION)
max(1.2VS,1.1*VMCA) max(1.13VSR,1.1 VMCA)
24
FLIGHT DATA MONITORING ON ATR AIRCRAFT

5.3. OTHER COMPUTED PARAMETERSVZ: The vertical speed is recorded in the -600 airplanes (dataframe V4). On legacy airplanes, it can be com-puted from the standard altitude parameter (as the ADC does, typically). In this case it is recommended to
smooth the altitude data (moving average or any other smoothing function) with a typical time span of 5
seconds before deriving it.
FPA: The flight path angle can be computed based on geometrical altitude and ground speed. The geo-metrical altitude itself can be derived from the standard altitude, barometric setting and temperature. Once
derived with the same method than for vertical speed, it provides a ground reference based vertical speed.
The arctangent of the latter divided by ground speed then gives the FPA.
5.4. ATR EVENTS
5.4.1. DETECTION OF SPECIFIC FLIGHT EVENTS
Aborted take-off
Several possibilities exist that can be used or combined to analyze an aborted take-off:
– a change in the sign of the longitudinal acceleration during the take-off phase
– a reduction on the PLA from the notch or above (>=75°) to lower values (typically that would be
Ground Idle which is 20°) during the take-off phase
– a decrease in ground speed during the take-off phase, which is more reliable than monitoring
the airspeed but introduces some delay
20°
75°
0 g
IAS
Longitudinal acceleration
PLA retard to FI
Change of sign of long. acc.
Decrease in grounspeed
PLA 1
PLA 2
Gro
undspee
d
Typical aborted take-off parameters
25

Go-around
A go-around (GA) can be detected by:
– the engagement of the GA mode of the AFCS (associated with a disconnection of the AP)
- the increase of the PLA at or above the notch (>= 75°) during the approach or final approach
phase
- the change in the sign of the vertical speed during the final approach phase
75°
0 ft/min
Vertical speed
GA mode
Altitu
de
PLA moved forward
beyond notch
Change of sign of vertical speed
PLA 2
PLA 1
GA mode engagement
Typical go-around parameters
26
FLIGHT DATA MONITORING ON ATR AIRCRAFT

Touchdown
As illustrated in the chart below, the weight on wheel parameters are generally not very reliable, because
they require at least both main landing gears to be compressed. Therefore there is often a change of state
with a delay that can reach several seconds. It is a good indication of the latest moment at which the aircraft
touched down, but the vertical acceleration and the radio height are generally more suitable to use to
detect precisely the touchdown. At touchdown, the radio height is generally slightly negative.
1 g
0 ft
Weight on
wheel - Main
Radio height
Weight on
wheel - All
1st touchdown 2nd touchdown 3rd touchdown
Vertical
acceleration
WOWALG
WOWMLG
RALT
Typical landing parameters
5.4.2. DEFINITION OF EVENTS
The table below presents the list of proposed events to be monitored along with information needed to set
up the event:
Monitoring window: defines the timeframe over which the event is monitored.
Criteria: defines the criteria that is tested to determine whether an event occurred or not. It uses DFDR or
computed parameters (see above).
Thresholds/Confirmation give the values against which the criteria is tested for 3 levels of severity (“low” or
class 3, “medium” or class 2 and “high” or class 1).
The events and events characteristics that are proposed have no mandatory value. The airline may custom-
ize its own events and/or thresholds based on its experience and specific operations. Typically, the events
may be differentiated by airfield/runway (to cope with steep or step down approach, for instance) or thresh-
olds standardised across the airline’s whole fleet. At this stage, the events were chosen because they can be
implemented with almost any version of dataframe.
27

MONITORING W
INDOW
THRESHOLD
S / CONFIRMATION TIM
E
EVEN
TSTART
END
CRITER
IALO
WMED
IUM
HIGH
TAXI
High speed in straight line
Taxi phase
GS ≥
30 kt
40 kt
50 kt
High speed in turn
|dMHDG|≥4°/s
AND GS ≥
15 kt
18 kt
21 kt
High TQ
max(TQ1,TQ2)≥
10% / 15 s
15% / 15 s
20% / 15 s
TAKE-OFF
Aborted TO at high speed
Aborted TO
detected - 3
s
Aborted TO
detected + 3
s
IAS ≥
100 kt
110 kt
120 kt
Change of heading during
TO roll
Take-off phase
|dMHDG| ≥
3°/s
4°/s
5°/s
High lateral acceleration during TO roll
Take-off phase
|LATG| ≥
0.15 g
0.25 g
0.35 g
INITIAL CLIMB / CLIMB
Late LG retraction
Initial climb phase AND
SLDG = UP
time(SLDG=UP)-
time(VZ>0) ≥
10 s
15 s
20 s
Low VZ in initial clim
bVZ>0 AND
RALT ≥ 35 ft
VZ>0 AND
RALT ≥ 400 ftmin(VZ) ≤
750 ft/min
500 ft/min
250 ft/min
Low FPA in initial clim
bmin(FPA) ≤
1.7°
1.4°
1.2°
Low IAS in initial clim
bIAS ≤
V2min + 5 kt
V2min+2 kt
V2min-2 kt
High roll in initial clim
b|ROLL| ≥
16°
CRUISE
Low IAS in cruise
Start of cruise
phase + 1
min
End of cruise
phase
ICING AOA=OFF
AND IAS ≤
IASth-10 kt
IASth-20 kt
IASth-30 kt
Low IAS in cruise in icing conditions
Start of cruise
phase + 1
min
End of cruise
phase
ICING AOA=ON
AND IAS ≤
VmLB0icing +
20 kt
VmLB0icing +
15 kt
VmLB0icing +
10 kt
Level bust
Cruise phase
|SALT-ALT| ≥
150 ft
200 ft
300 ft
DESCEN
T
High ROD in descent
Descent phase
VZ ≤
–2500 ft/ min
–3000 ft/min
–3500 ft/ min
High speed in descent
IAS ≥
244 kt / 5 s
247 kt /5 s
250 kt / 5 s
28
FLIGHT DATA MONITORING ON ATR AIRCRAFT

MONITORING W
INDOW
THRESHOLD
S / CONFIRMATION TIM
E
EVEN
TSTART
END
CRITER
IALO
WMED
IUM
HIGH
FINAL APPROACH
Betwee
n 2000 and 1000 ft
High ROD between 2000 and 1000 ft
Approach
phase AND
ALTQFE ≤
2000 ft
Approach
phase AND
ALTQFE ≤
1000 ft
VZ ≤
–1000 ft/min
–1250 ft/min
–1500 ft/min
High FPA between 2000 and 1000 ft
FPA ≤
–3.5°
–4°
–4.5°
High IAS between 2000 and 1000 ft
IAS ≥
VAPP+20 kt / 5 s
VAPP+25 kt / 5 s
VAPP+30 kt / 5 s
Low IAS between 2000 and 1000 ft
IAS ≤
VAPP–2 kt / 5 s
VAPP–5 kt / 5 s
VAPP–10 kt
Betwee
n 1000 and 500 ft
High ROD between 1000 and 500 ft
Approach
phase AND
ALTQFE ≤
1000 ft
Approach
phase AND
ALTQFE ≤
500 ft
VZ ≤
–1000 ft/min
–1200 ft/min
–1400 ft/min
Low ROD between 1000 and 500 ft
VZ ≥
–400 ft/min
–250 ft/min
0 ft/min
High FPA between 1000 and 500 ft
FPA ≤
–3.5°
–4°
–4.5°
Low FPA between 1000
and 500 ft
FPA ≥
–2.5°
–2°
–1.5°
High IAS between 1000
and 500 ft
IAS ≥
VAPP+10 kt / 5 s
VAPP+15 kt / 5 s
VAPP+20 kt / 5 s
Low IAS between 1000
and 500 ft
IAS ≤
VAPP–2 kt / 5 s
VAPP–5 kt / 5 s
VAPP–10 kt
High roll between 1000
and 500 ft
|ROLL| ≥
10° / 3 s
15° / 3 s
20° / 3 s
Below 500 ft
High ROD below 500 ft
Approach
phase AND
ALTQFE
≤ 500 ft
Approach
phase end
VZ ≤
–1000 ft/min
–1200 ft/min
–1400 ft/min
Low ROD below 500 ft
VZ ≥
–400 ft/min
–250 ft/min
0 ft/min
High FPA below 500 ft
FPA ≤
–3.5°
–4°
–4.5°
Low FPA below 500 ft
FPA ≥
–2.5°
–2°
–1.5°
High IAS below 500 ft
IAS ≥
VAPP+5 kt / 5 s
VAPP+10 kt / 5 s
VAPP+15 kt / 5 s
Low IAS below 500 ft
IAS ≤
VAPP–2 kt / 5 s
VAPP–5 kt / 5 s
VAPP–10 kt
High roll below 500 ft
|ROLL| ≥
10°
15°
20°
Glide Slope Deviation
Final approach phase
|GLS| ≥
50 mV
100 mV
150 mV
Localizer Deviation
Final approach phase
|LOC| ≥
50 mV
100 mV
150 mV
29

MONITORING W
INDOW
THRESHOLD
S / CONFIRMATION TIM
E
EVEN
TSTART
END
CRITER
IALO
WMED
IUM
HIGH
GO-AROUND
Low height during go-around
GA detected
– 5 s
GA detected
+ 5 s
RALT
≥200 ft
<200 ft
–
Late LDG retraction
Go around phase AND
SLDG
= UP
time(SLDG=UP)-
time(VZ>0) ≥
10 s
15 s
20 s
LANDING
High speed at touchdown
Touchdown
– 2 s
Touchdown
+ 2 s
IAS ≥
VAPP
VmHB+15 kt
VmHB+20 kt
Low speed at TD
Touchdown
– 2 s
Touchdown
+ 2 s
IAS ≤
VmHB-5 kt
VmHB–10 kt
VmHB–15 kt
Low Pitch at touchdown
Touchdown
– 2 s
Touchdown
+ 1 s
PTCH ≤
0°
–0.5°
–1°
High Pitch at touchdown
(ATR 42)
Touchdown
– 2 s
Touchdown
+ 1 s
PTCH ≥
8°
9°
10°
High Pitch at touchdown (ATR 72)
Touchdown
– 2 s
Touchdown
+ 1 s
PTCH ≥
6°
7°
8°
Reduced flap landing
Start of landing phase
FLAP ≤
22°
12°
Late PLA to GI
Landing phase AND PLA1+2
at GI
time since
touchdown
4 s
7 s
10 s
Remaining power at touchdown
Touchdown
– 1 s
Touchdown
+ 1 s
(TQ1+TQ2)/2 ≥
5%
10%
20%
Change of heading during landing
Landing phase
|dMHDG| ≥
3°/s
4°/s
5°/s
High LATG
Landing phase
|LATG| ≥
0.15 g
0.25 g
0.35 g
PLA below GI without low pitch
Landing phase
LOP1(2) not
LOW PITCH and
PLA1(2) ≤
15°
High acceleration at touchdown
Touchdown
– 2 s
Touchdown
+ 10 s
VRTG
1.4 g
1.6 g
1.8 g
30
FLIGHT DATA MONITORING ON ATR AIRCRAFT

MONITORING W
INDOW
THRESHOLD
S / CONFIRMATION TIM
E
EVEN
TSTART
END
CRITER
IALO
WMED
IUM
HIGH
ALL FLIGHT
GPW
S / TAW
S warning trigger
Initial climb
phase start
Landing
phase start
GPWS=
ON
Low speed
IAS ≤
1.05*VSR
High vertical acceleration in flight
|VRTG-1| ≥
0.4 g
0.6 g
0.8 g
VFE, VLE, VLO, VMO
IAS ≥
limitation-5 kt / 3 s
limitation-2 kt / 3 s
limitation /
3 s
Excessive roll
|ROLL| ≥
40°
31

6. ANNEXES
CONTENTS
6.1. REGULATION ON MANDATORY PARAMETERS TO BE RECORDED ..................................P. 33
6.2. DATA FRAME PRINCIPLE .................................................................................................................P. 33
6.2.1 RECORDING STRUCTURE ......................................................................................................P. 34
6.2.2 SUPER FRAME ARCHITECTURE ............................................................................................P. 35
6.2.3 FRAME SAMPLING (OR FREQUENCY) DESCRIPTION ...................................................P. 37
32
FLIGHT DATA MONITORING ON ATR AIRCRAFT

6.1. REGULATION ON MANDATORY PARAMETERS
TO BE RECORDEDRegulations on parameters to be recorded only concern the DFDR. They also affect the QAR data since it is
a copy of DFDR. These regulations are:
• ICAO - Annexes 6 Part I - Aeroplanes - Chapter 6 Para 6.3 - Appendix 8
• EASA - AIR OPERATIONS - Commercial Air TransportAMC CAT.IDE.A.190 Flight Data Recorder
• EUROCAE - MOPS for Crash Protected Airborne Recorder SystemsED-55 / ED-112 / ED-112 A
• FAA FAR 121.334 Digital Flight Data Recorders Appendix M to Part 121 - Airplane Flight Recorder Specifications
6.2. DATA FRAME PRINCIPLEAnalogic parameters (torque, AOA …) are converted to binary data
Binary data is composed of bits whose values are either 0 or 1.
FDAU aggregates binary data of different parameters in a specific order and sends the resulting data flow
to the recorder. The sequence with which parameters are aggregated is defined by what is called a data
frame. It is specific to the aircraft type and equipment (P/N of the FDAU, mainly).
A data frame describes all the parameters recorded, along with associated data allowing retrieving the binary,
and then the original value: the position in the frame, the recording frequency, the resolution, the unit, etc.).
Thanks to the dataframe definition, one can decode the binary data from the recorder.
33

6.2.1 RECORDING STRUCTURE
As illustrated by figure 5, the core element of the FDR recording is called a “word”. Each word is composed
of 12 bits. This word can record the data of one or several parameters. Each parameter is identified by the
word and the bit number on which it is coded. Words are grouped into sub-frames that represent one sec-
ond of data On ATR the subframes can be composed of 64, 128, 256 or 1024 words. Four sub-frames con-
stitute a frame.
SensorAnalog-to-Digital
ConverterAIRCRAFTComputer
AIRCRAFTSystems
Recorder /FDAU
Recording principle
FRAME X FRAME X + 1 FRAME X + 2
1s 1s 1s 1sS
16
U
B
S
U S32
F
R
B
F
U
B
S
U64
A
M
R
A
F
R
B
F128
E M
E
A
M
R
A256
E M
E512
Word 1
Word 2
Word 3
Word 4
Word 5
Word 6
Word 7
Word 8
Word 9
Word …
Word n
1 0 1 0
1 0 0 0
0 0 0 1
12 bits
12 11 10 9 8 7 6 5 4 3 2 1
WORD
Parameter 2 Parameter 1
34
FLIGHT DATA MONITORING ON ATR AIRCRAFT

6.2.2 SUPER FRAME ARCHITECTURE
ATR FDR are using the principle of the superframe in order to save space and record parameters that not
subject to rapid change (e.g. flight number, dates, hour, etc.). A superframe is a group of 16 frames (64
sub-frames).
1s 1s 1s 1s 1s 1s 1s 1s 1s 1s 1s 1s 1s 1s 1s 1s 1s 1s 1s 1s 1s 1s 1s 1s 1s 1s 1s 1s 1s 1s 1s 1s 1s 1s 1s 1s 1s 1s 1s 1s 1s 1s 1s 1s 1s 1s 1s 1s 1s 1s 1s 1s 1s 1s 1s 1s 1s 1s 1s 1s 1s 1s 1s 1s 1s 1s 1s 1s
0 1 2 3 4 5 6 7 8 9 10 11 12 13 14 15 0
Super-frame are composed of 16 frames16*4s=64s
Superframe structure
The place of each frame within the superframe is defined by a parameter called “superframe counter” that
ranges from 0 to 15.
To increase the number of parameters recorded in the same space, the idea is to share the same word of a
given subframe between different parameters. Depending on the frame position within the superframe
(value of the superframe counter), the parameter recorded on the word will be different.
Practical example:
On an aircraft embodied with a V2 dataframe version, SIL 72-31-6010 (table below) defines two superframe
parameters locations (super frame 1 on word 50 of sub frame 1 and super frame 2 on word 57 of sub frame 1).
FDAU TYPE SUPER FRAME 1 SUPER FRAME 2
V2 S/F1 & W50 S/F1 & W57
V2a, V2b S/F1 & W57 S/F1 & W59
V3 S/F1 & W113 S/F1 & W117
Extrtact from the SIL 72-31-6010
In the definition of discrete parameters in the same SIL, the superframe counter is defined by the bits 9 to
12 of word 50 in subframe 1. The bits 1 to 8 of word 50 are therefore used to code the data for the super-
frame parameters that are defined: time, date, time in hotel mode, flight number, aircraft ident.
35

Discrete V2 parameters - D(V2)
Parameter ARINC word SubframeSampling int.
(persecond)Bit Law
time (hours)
(superframe 1, position 10)
50 1 1/61 pps 8 to 5
4 to 1
convert reading in binary; tens in BCD on 1 bits
convert reading in binary; units in BCD on 4 bits
time (minutes)
(superframe 1, position 11)
50 1 1/64 pps 6 to 5
4 to 1
convert reading in binary; tens in BCD on 4 bits
convert reading in binary; units in BCD on 4 bits
time (minutes/seconde) 50 3 1/4 pps 12 to 9
8 to 5
4 to 1
convert reading in binary; minute units in BCD on 4 bits
convert reading in binary; second tens in BCD on 4 bits
convert reading in binary; second units in BCD on 4 bits
date (day)
(superframe 1, position 4)
50 1 1/64 pps 8 to 5
4 to 1
convert reading in binary; tens in BCD on 4 bits
convert reading in binary; units in BCD on 4 bits
date (month)
(superframe 1, position 3)
50 1 1/64 pps 8 to 5
4 to 1
convert reading in binary; tens in BCD on 4 bits
convert reading in binary; units in BCD on 4 bits
date (year)
(superframe 1, position 5)
50 1 1/64 pps 8 to 5
4 to 1
convert reading in binary; tens in BCD on 4 bits
convert reading in binary; units in BCD on 4 bits
Time in hotel mode (minute)
(superframe 1, position 9)
50 1 1/64 pps 8 to 5
4 to 1
convert reading in binary; thousands in BCD on 4 bits
convert reading in binary; hundreds in BCD on 4 bits
Time in hotel mode (minute)
(superframe 1, position 8)
50 1 1/64 pps 8 to 5
4 to 1
convert reading in binary; tens in BCD on 4 bits
convert reading in binary; units in BCD on 4 bits
Flight number
(superframe 1, position 1)
50 1 1/64 pps 8 to 5
4 to 1
convert reading in binary; thousands in BCD on 4 bits
convert reading in binary; hundreds in BCD on 4 bits
Flight number
(superframe 1, position 2)
50 1 1/64 pps 8 to 5
4 to 1
convert reading in binary; tens in BCD on 4 bits
convert reading in binary; units in BCD on 4 bits
Superframe 1 & 2 counter
(superframe 1)
50 1 1/64 pps 12 to 9 0 to 15 in binary code
A/C ident (airline rank)
(superframe 1, position 8)
50 1 1/64 pps 8 to 1 0 to 255 in binary code
V2 word 50 description
For instance, if the superframe counter is equal to 10, the values of the bits will represent the hours of the
current time.
Figure below sums up the different values associated to the word 50 of the subframe 1:
1s 1s 1s 1s 1s 1s 1s 1s 1s 1s 1s 1s 1s 1s 1s 1s 1s 1s 1s 1s 1s 1s 1s 1s 1s 1s 1s 1s 1s 1s 1s 1s 1s 1s 1s 1s 1s 1s 1s 1s 1s 1s 1s 1s 1s 1s 1s 1s 1s 1s 1s 1s 1s 1s 1s 1s 1s 1s 1s 1s 1s 1s 1s 1s
0 1 2 3 4 5 6 7 8 9 10 11 12 13 14 15Flight
Number
Flight
Number
Date
(month)
Date
(day)
Date
(year)
A/C
ident
Time in
hotel mode
(minute)
Time in
hotel mode
(minute)
Time
(hours)
Time
(minute)
Word 50, Subframe 1
Encoded parameter
36
FLIGHT DATA MONITORING ON ATR AIRCRAFT

6.2.3 FRAME SAMPLING (OR FREQUENCY) DESCRIPTION
Sampling is the process of measuring a signal at specific points in time. The sampling rate or frequency is
expressed in Hertz or in point per second (pps).
1HZ = (1 pps) => a parameter value is recorded once a second.
2HZ = (2 pps) => a parameter value is recorded twice a second.
4HZ = (4 pps) => a parameter value is recorded 4 times a second.
1/4 HZ = 1 point recorded every 4 seconds
½ HZ = 1 point recorded every 2 seconds
FRAME 252 FRAME 253 FRAME 254
1/4 Hz PARAMETER
1/2 Hz PARAMETER
1 Hz PARAMETER
2 Hz PARAMETER
4 Hz PARAMETER
1/2 Hz PARAMETER
In that extract from SIL ATR42-31-5011, 4 concrete parameters (Weight Rotactor Position1.2.3.4) are recorded
at ¼ HZ. Depending on the value of these 4 parameters in binary a hexadecimal value can be decoded.
4 parameters are necessary to give a concrete hexadecimal value. (From 15T to 22.5T)
WEIGHT ROTACTOR POSITION#1 * 38 1 1/4pps 2 0000: 15T
WEIGHT ROTACTOR POSITION#2 * 38 2 1/4pps 2 0001: 16T
WEIGHT ROTACTOR POSITION#3 * 38 3 1/4pps 2 0010: 17T
WEIGHT ROTACTOR POSITION#4 * 38 4 1/4pps 2 0011: 18T
0100: 19T
0101: 19,5T
0110: 20T
0111: 20,5T
1000: 21T
1001: 21,5T
1010: 22T
37

Other example with different recording rate
VHF 1 (2) 14 (14) 1;2;3;4 1pps 1 (2) 0: transmission
L/G Selector 448-960 1 to 4 2pps 1 0 = Up
1 = Down
vertical acceleration (g) 3;35;67 1;2 8pps 12 1 1 0000 0164 Value = 0*R-3
99;131;163 3;4 0164 4095 Value = 0,00228897*R-3,3754
195;227 (>0 : normal acceleration)
longitudinal acceleration (g) 5;69 1;2 4pps 12 3 4 0000 0041 Value = 0*R+1
133;197 3;4 0041 1023 Value = 0,002034795*R+1,0834
(<0 : acceleration or nose up)
Example with VHF parameter transmission
FRAME
SF 1 SF 2 SF 3 SF 4
1 Hz
VHF 1 (2) 14 (14) 1;2;3;4 1pps 1 (2) 0: transmission
Parameter
Word 14
Sampling BIT InformationARINC Word Subframe
used
VFH 1
From bit 1 (0 or 1) if
0 VHF active
1
The number of bits used to record parameter depends on the operational range and required accuracy of
the parameter. To increase resolution/range several words can be used.
For instance, to record the pitch parameter that ranges (theoretically) from -90° to +90°, using 10 bits would
give a resolution of 180/2^10 = 0.176°. If it is considered not precise enough, another one or two bits can
be used.
In the case of the longitude that ranges from -180° to +180°, using 12 bits (the maximum in one word) would
give a resolution of 360/4096 = 0.0879°, which corresponds to 5.27 NM at the equator. Then another word
can be used to improve the accuracy of the recorded parameter. If 9 extra bits are used, the resolution
becomes 0.000172° which corresponds to about 0.01 NM or 20 meters. In such case, the parameter with the
highest resolution is generally referred to as “coarse” part and the other as “fine” part.
38
FLIGHT DATA MONITORING ON ATR AIRCRAFT


Dear Readers,
Every effort has been made to ensure document quality.
However please do not hesitate to share your comments and information
with us by using the following address: [email protected]
Yours faithfully,
Your ATR Training and Flight Operations support team.

© ATR. 2016. All rights reserved. Proprietary document of ATR. This document shall not be reproduced or disclosed to a third party without the written consent of ATR.
This document and its content shall not be used for any purpose other than that for which it is supplied. ATR, its logo, the distinctive ATR aircraft profiles and patented
information relating to the ATR aircraft are the exclusive property of ATR and are subject to copyright. This document and all information contained herein are the sole
property of ATR. No intellectual property right is granted through, or induced by, the delivery of this document or the disclosure of its content. The statements made
herein do not constitute an offer or a representation. They are based on the mentioned assumptions and are expressed in good faith.
ATR
1, allée Pierre Nadot
31712 Blagnac cedex - France
Tel: +33 (0)5 62 21 62 21
Fax: +33 (0)5 62 21 68 00
CONTACT
For ordering manuals, please contact us at:
Tel: +33 (0)5 62 21 62 07
e-mail: [email protected]
ATR Product Support & Services Portal: https://www.atractive.com