Flight Avionics Sequencing Telemetry (FAST) DIV …...NASA USRP — Internship Final Report Flight...
15
NASA USRP — Internship Final Report Flight Avionics Sequencing Telemetry (FAST) DIV Latching Display Charlotte Moorel Arkansas Tech University, Russellville, AR, 72801 The NASA Engineering (NE) Directorate at Kennedy Space Center provides engineering services to major programs such as: Space Shuttle, International Space Station, and the Launch Services Program (LSP). The Avionics Division within NE, provides avionics and flight control systems engineering support to LSP. The Launch Services Program is responsible for procuring safe and reliable services for transporting critical, one of a kind, NASA payloads into orbit. As a result, engineers must monitor critical flight events during countdown and launch to assess anomalous behavior or any unexpected occurrence. The goal of this project is to take a tailored Systems Engineering approach to design, develop, and test Iris telemetry displays. The Flight Avionics Sequencing Telemetry Delta-IV (FAST- D4) displays will provide NASA with an improved flight event monitoring tool to evaluate launch vehicle health and performance during system-level ground testing and flight. Flight events monitored will include data from the Redundant Inertial Flight Control Assembly ( RIFCA) flight computer and launch vehicle command feedback data. When a flight event occurs, the flight event is illuminated on the display. This will enable NASA Engineers to monitor critical flight events on the day of launch. Completion of this project requires rudimentary knowledge of launch vehicle Guidance, Navigation, and Control (GN&C) systems, telemetry, and console operation. Work locations for the project include the engineering office, NASA telemetry laboratory, and Delta launch sites. Nomenclature CARDS = Computer Aided Render Display System CCAFB = Cape Canaveral Air Force Base CDR = Critical Design Review CONOPS = Concept of Operation DCR = Design Certification Review DLPS = Delta Launch Processing System DOC = Delta Operations Center DOD = Department of Defense ELV = Expendable Launch Vehicle(s) FAST-D4 = Flight Avionics Sequencing Telemetry Delta IV FF = Functional Flow HOQ = House of Quality KSC = Kennedy Space Center LCC = Launch Control Center LSP = Launch Services Program MSID = Measurement Identification NASA = National Aeronautics and Space Administration NE = NASA Engineering PCM = Pulse Code Modulation PDR = Preliminary Design Review PM = Project Manager RAM = Random Access Memory RIFCA = Redundant Inertial Flight Control Assembly SE = Systems Engineering SRR = System Requirement Review TDP = Telemetry Data Processing TPM = Technical Performance Measurement ULA = United Launch Alliance USRP = Undergraduate Student Research Project V&V = Validation and Verification I. Introduction Three e National Aeronautics and Space Administration (NASA) has been a space exploration leader since 1958 in core competencies: research and technology, flight hardware and development, and mission operations. The NASA Engineering (NE) branches servicing the Launch Services Program (LSP) contributes to the third competency of NASA by procuring safe and reliable services for transporting critical, one of a kind, NASA Summer 2010 Session https://ntrs.nasa.gov/search.jsp?R=20100031530 2020-04-17T01:13:24+00:00Z
Transcript of Flight Avionics Sequencing Telemetry (FAST) DIV …...NASA USRP — Internship Final Report Flight...

NASA USRP — Internship Final Report
Flight Avionics Sequencing Telemetry (FAST) DIV LatchingDisplay
Charlotte MoorelArkansas Tech University, Russellville, AR, 72801
The NASA Engineering (NE) Directorate at Kennedy Space Center provides engineeringservices to major programs such as: Space Shuttle, International Space Station, and theLaunch Services Program (LSP). The Avionics Division within NE, provides avionics andflight control systems engineering support to LSP. The Launch Services Program isresponsible for procuring safe and reliable services for transporting critical, one of a kind,NASA payloads into orbit. As a result, engineers must monitor critical flight events duringcountdown and launch to assess anomalous behavior or any unexpected occurrence. Thegoal of this project is to take a tailored Systems Engineering approach to design, develop,and test Iris telemetry displays. The Flight Avionics Sequencing Telemetry Delta-IV (FAST-D4) displays will provide NASA with an improved flight event monitoring tool to evaluatelaunch vehicle health and performance during system-level ground testing and flight. Flightevents monitored will include data from the Redundant Inertial Flight Control Assembly(RIFCA) flight computer and launch vehicle command feedback data. When a flight eventoccurs, the flight event is illuminated on the display. This will enable NASA Engineers tomonitor critical flight events on the day of launch. Completion of this project requiresrudimentary knowledge of launch vehicle Guidance, Navigation, and Control (GN&C)systems, telemetry, and console operation. Work locations for the project include theengineering office, NASA telemetry laboratory, and Delta launch sites.
Nomenclature
CARDS = Computer Aided Render DisplaySystem
CCAFB = Cape Canaveral Air Force BaseCDR = Critical Design ReviewCONOPS = Concept of OperationDCR = Design Certification ReviewDLPS = Delta Launch Processing SystemDOC = Delta Operations CenterDOD = Department of DefenseELV = Expendable Launch Vehicle(s)FAST-D4 = Flight Avionics Sequencing Telemetry
Delta IVFF = Functional FlowHOQ = House of QualityKSC = Kennedy Space CenterLCC = Launch Control CenterLSP = Launch Services ProgramMSID = Measurement Identification
NASA = National Aeronautics and SpaceAdministration
NE = NASA EngineeringPCM = Pulse Code ModulationPDR = Preliminary Design ReviewPM = Project ManagerRAM = Random Access MemoryRIFCA = Redundant Inertial Flight Control
AssemblySE = Systems EngineeringSRR = System Requirement ReviewTDP = Telemetry Data ProcessingTPM = Technical Performance MeasurementULA = United Launch AllianceUSRP = Undergraduate Student Research
ProjectV&V = Validation and Verification
I. Introduction
Threee National Aeronautics and Space Administration (NASA) has been a space exploration leader since 1958 in
core competencies: research and technology, flight hardware and development, and mission operations.The NASA Engineering (NE) branches servicing the Launch Services Program (LSP) contributes to the thirdcompetency of NASA by procuring safe and reliable services for transporting critical, one of a kind, NASA
Summer 2010 Session
https://ntrs.nasa.gov/search.jsp?R=20100031530 2020-04-17T01:13:24+00:00Z

NASA USRP — Internship Final Report
payloads into orbit. To provide this reliability, engineers must monitor critical flight events during launch to assessany anomalous behavior or unexpected occurrence. One of the launch vehicles used by NASA is the Delta IV rocketbuilt by United Launch Alliance (ULA). Part of NASA Engineering's responsibility is to evaluate vehicle health andperformance during system level pad testing and flight. To assist NASA engineers in reviewing vehicle data, a newtool was developed to display flight events for the Delta IV launch vehicle. This project develops the FlightAvionics Sequencing Telemetry-Delta IV (FAST-D4) display which is a new telemetry display based on Iris. FAST-D4 provides the NE Expendable Launch Vehicle (ELV) Avionics branch with an independent assessment tool toevaluate health and performance of the Delta IV launch vehicle. This tool functions by illuminating flight events ona display to alert the user that a command has been sent by the flight computer. FAST-134 utilizes pre-existingtelemetry hardware at Hangar AE and easily interfaces with the Iris and Winplot data display systems. The contentsof this paper describe the design and development of the FAST-134 display with a tailored Systems Engineering (SE)approach.
II. NASA Engineering's Role in the Launch Services ProgramThe Launch Services Program Office is located at the Kennedy Space Center (KSC) and is responsible for the
vehicle selection and management of expendable launch vehicle missions. The principal objectives are to providesafe, reliable, cost-effective, and on-schedule processing. LSP also provides mission analysis, spacecraft integration,and launch services for NASA and NASA-sponsored payloads needing a mission on an ELV. LSP is responsible forthe success of its missions and implements a technical oversight approach to ensure the reliability of each vehicle.Unlike commercial companies, NASA does not buy insurance for their spacecraft; instead, the LSP program ensuresmission success by mitigating risk.
LSP acquires avionics and flight control systems engineering services from the NE directorate. These servicesinclude clarifying the technical objectives required for each mission and reviewing flight hardware, which includesanalyzing the design and development of new implementations. The branch also provides technical oversight duringintegrated launch vehicle checkout and console support during day of launch activities. The fleet of launch vehiclesthat NE oversees includes the Delta, Atlas, Taurus, and Pegasus vehicles (Fig. 1).
Figurel. The NASA LSP Fleet (from the left: Delta IV, Atlas V 500 Series, AtlasV 400 Series, Delta II, Taurus, and Pegasus).
III. Problem Statement and SolutionNASA Engineering needs a telemetry display for the Delta IV launch vehicle to capture short duration
sequencing events such as 180ms ordnance events. NASA Engineering requires a display to aid in monitoring thevehicle's health. The design needs to be compatible with existing telemetry architecture to reduce cost, and theformatting needs to be similar to previous architectures to facilitate the user's navigation of the page.. Sinceordnance events are too quick for the existing telemetry display, a latch needs to be included on the display that willkeep the flight event illuminated until the user issues a reset command. The latch will keep the flight eventilluminated until the user issues a reset command. Each page should also show a quick view of the 1 St or 2°d stages tokeep the engineer informed of flight events from both stages at all times. The final product should provide NASAEngineering with a useful tool for viewing Delta IV flight event telemetry.
2 Summer 2010 Session

NASA USRP — Internship Final Report
IV. Systems Engineering ApproachA tailored Systems Engineering (SE) approach (Fig. 2) is applied to the organizational structure of this project to
ensure the quality of the final product. The process begins with soliciting the stakeholder's needs. Stakeholders areindividuals or groups that have an interest in or need for the final project. Once the stakeholders' needs have beenidentified, a timeline (Fig. 3) is created to establish critical SE milestones. Next, two diagrams are produced toprovide the basis for developing the system level requirements and to clarify the technical processes involved. Thefirst diagram is the Functional Flow (FF) which is a flow diagram that describes in words the technical steps thatoccur in the final product. The second diagram is the Concept of Operation (CONOPS) which provides a pictorialrepresentation of how the final product will function within the system. Afterwards, a System Requirement Review(SRR) is conducted to baseline the system level requirements with the stakeholders. Next, a preliminary design orprototype is developed and data collection begins. The next step develops the design-to requirements which describehow the system level requirements will be implemented. After all requirements have been defined, the design teamholds a Preliminary Design Review (PDR) to baseline the design-to requirements and ensure that the project is onschedule, the technical performance meets the stakeholders standards, and the prototype meets system levelrequirements. Once the PDR is accepted by the stakeholders, the product begins development. The developmentprocess iterates many cycles of prototype production and Validation and Verification (V&V) processes whichconfirm that the right product was produced, the stakeholders' needs were met, and that it was built according to thesystem level and design-to requirements. Then, a Critical Design Review (CDR) is conducted to verify with thestakeholders that the product is mature enough for finalization. Once the stakeholders approve the CDR, the projectis finalized and the V&V process is completed. Finally, the Design Certification Review (DCR) certifies the designfor release.
Solicit Stakeholders NeedsI 'Llaintenance I
Develop a Time line
I ?roductRelease IConcept of Operation
House of quality nalizaticn ofCesign / V&V
Functional Nov.,^--^ ?rototJpe n3 / V&V
System Level Requirements^— ?ro#atype X2 JV &V
Col I e ct Data/ Case Stud Y
Design-to Requirements +--I r---- ?rototype#l/ V&V
Implerr.en-a-icn
Figure 2. Tailored Top-Down/ Bottom-Up Systems Engineering Development Process
Summer 2010 Session

NASA USRP — Internship Final Report
June JUIR Auqust, , , , , , , : x x 2 2 : x 1 , , , , , , x x x x x x x x 1 , , ,
Com P .„ s i r s: 1, s 1 1 n , 2 S L r 1 1 2 1, 1 1 1 1 1 x 1 k r 1 1 1 r 1, 1 1 1 1 1 r
ntro "..k 7 W..k a M^.k 3 Y..k 4 Y..k 5 Y..k 4 W..ki M..k f Y&Ik o W..k_Orientation 100%Meet Mentor 100'/.Definition of the Project i i i iInstall Software100/.Tours 100%
Delta IV Iris DisplalCritical MilestonesSolicit Stakeholders
rmPerfoPerform System100%100% 14
1Sustem Level 100%Identification and 100%Develop Concept of 100%Generate Desiqn to 100%SRRIPDR (PresentBaseline Requirementsand Preliminana Designt 100%Collect Fliqht Event 100%Develop Sustem Per 100YProqramminq 100/.Insert Data into System 100% i
iAdditional Formattinq 100%Verification and 100%CDR(Present Mature 100%DCR(Present Final IN/.
DocumentationPowerPoint 100% t_Paper 100% I r-, .. -:. __ .. ^. „ r IPoster 100'%
Figure 3. Project Timeline
V. Stakeholders NeedsThe Stakeholders are identified according to their influence in Fig. 4. Stakeholders for this project include
NASA, the Engineering directorate, LSP, the design team, ULA, and Hangar AE. The stakeholders' needs areassessed through meetings, interviews, or direct requests. Many of these stakeholders are involved in the SRR,PDR, CDR, and DCR Systems Engineering processes to discuss their needs with the design team. Tablel definesthe needs of the stakeholders for the FAST-134 display.
Figure 4. FAST-D4 Proiect Stakeholders
Table 1. Stakeholder Requirements
No. Stakeholder Requirements
I The stakeholder needs a toolbox to display telemetry to illustrate flight events for Delta IV.II The stakeholder needs the toolbox to be compatible with existing telemetry architectures.III The stakeholder needs the toolbox to be easv to use.
4 Summer 2010 Session
NASA USRP — Internship Final Report
VI. Case StudyAn important part of the SE process is to identify which method would be the best approach to execute the
project. OpenOffice and Microsoft Power Point were studied to assess the pros and cons of using either software.Power Point offered some convenient tools for creating a telemetry display. First, Power Point can be easilyconverted into a web page which enables the engineering team to view how the final design would look at HangarAE. Power Point also automatically adjusts the display size to fit the console monitor where it is being viewed. It isalso easy to insert clip art and manipulate the size of the widgets. However, the FAST-D4 telemetry display requiresa very large number of telemetry signals that would require a great amount of time to insert into Power Point and bedifficult to organize. OpenOffice offered a better solution to that issue since existing cells allow data to be insertedmore easily. OpenOffice also has a hiding feature that allows informative data such as the MeasurementIdentification (MSID), description, and raw signal to be accessible yet not displayed. This is important, becausespace is limited for flight events on the consol. Hangar AE can use either software program; however, the case studyconcluded that OpenOffice provides the best approach to implementing a telemetry display with such a largenumber of parameters.
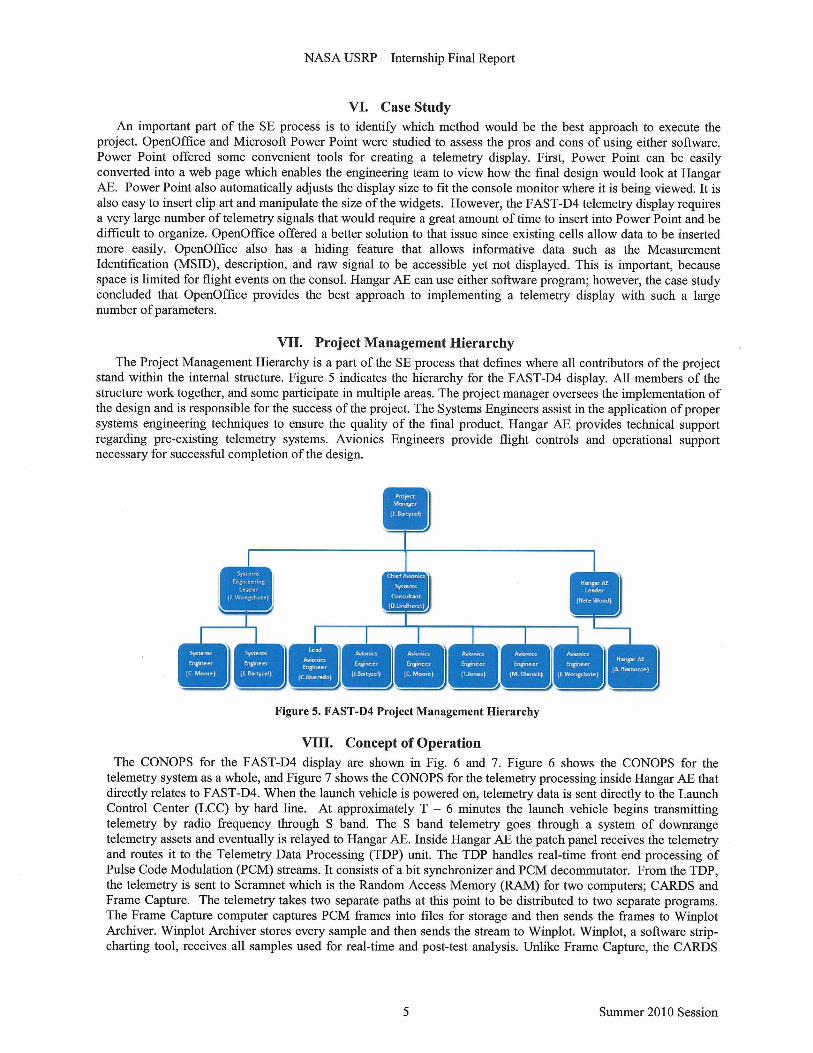
VII. Project Management Hierarchy
The Project Management Hierarchy is a part of the SE process that defines where all contributors of the projectstand within the internal structure. Figure 5 indicates the hierarchy for the FAST-D4 display. All members of thestructure work together, and some participate in multiple areas. The project manager oversees the implementation ofthe design and is responsible for the success of the project. The Systems Engineers assist in the application of propersystems engineering techniques to ensure the quality of the final product. Hangar AE provides technical supportregarding pre-existing telemetry systems. Avionics Engineers provide flight controls and operational supportnecessary for successful completion of the design.
Figure 5. FAST-D4 Project Management Hierarchy
VIII. Concept of Operation
The CONOPS for the FAST-D4 display are shown in Fig. 6 and 7. Figure 6 shows the CONOPS for thetelemetry system as a whole, and Figure 7 shows the CONOPS for the telemetry processing inside Hangar AE thatdirectly relates to FAST-D4. When the launch vehicle is powered on, telemetry data is sent directly to the LaunchControl Center (LCC) by hard line. At approximately T — 6 minutes the launch vehicle begins transmittingtelemetry by radio frequency through S band. The S band telemetry goes through a system of downrangetelemetry assets and eventually is relayed to Hangar AE. Inside Hangar AE the patch panel receives the telemetryand routes it to the Telemetry Data Processing (TDP) unit. The TDP handles real-time front end processing ofPulse Code Modulation (PCM) streams. It consists of a bit synchronizer and PCM decommutator. From the TDP,the telemetry is sent to Scramnet which is the Random Access Memory (RAM) for two computers; CARDS andFrame Capture. The telemetry takes two separate paths at this point to be distributed to two separate programs.The Frame Capture computer captures PCM frames into files for storage and then sends the frames to WinplotArchiver. Winplot Archiver stores every sample and then sends the stream to Winplot. Winplot, a software strip-charting tool, receives all samples used for real-time and post-test analysis. Unlike Frame Capture, the CARDS
Summer 2010 Session

FAST-D4 Display
NASA USRP — Internship Final Report
computer does not store every sample; instead, it collects data into packets for the Iris telemetry program. The Irishardware and software de-couples raw telemetry and graphically displays all measurements. It is designed to bescalable and easily deployable to different locations depending on the location of the launch. FAST-D4 detectsflight events by looking at changes in the discrete telemetry from Iris.
Z> 5 bandTt12 min
-. UmbilicalTDRSS
r-osecreleased) TEL-4/Downrange White Sands
(Umbilical is I telemetry stations ^ /
Goddard(C
A
n --- aw11rM _
_._ power on '- ""° L^cJ
Launch Control Center Hangar AE Console in Hangar AE
Figure. FAST-D4 Concept of Operations of Existing Architectures
frame
—' CARDSvcmaUa
nmms3
^ mTDP > Z
v
ua
c
E
—^ mcE
to
Frome Winplotc
Frame Capture Archiver
Winplot
Figure 7. FAST-D4 Concept of Operations inside Hangar AE
IX. Functional FlowThe Functional Flow (FF) shown in Fig. 6 provides a flow chart of how the actual product will function.
FAST-D4 begins with the Launch Vehicle (LV) broadcasting telemetry (TLM) and ends with the flight event beingilluminated on the screen.
Telemetry
Stream Enters
W
True True ^, True
r' ^ ^ • ^True ^ Fligh[event is
- ^ illuminated
FalseFalse ,^
False I False
Flight event is Flight event is Flight event isnot illuminated I illuminated I illuminated
Figure 8. FAST-D4 Functional Flow Logic in Each Cell
Summer 2010 Session

NASA USRP — Internship Final Report
X. PrototypeA prototype provides a visual sample of how the final project will work or how it will look. The first prototype
shown in Fig. 9 looks very different from the final project, but many of the same concepts are implemented. Thisprototype labels daily events, and illuminates a green box when an event occurs. For example, the bit designated forwaking up was activated, so the corresponding box is illuminated. The second prototype in figure 10 appears muchmore like the final product, but contains very different functional logic.
Charlotte's Daily Events(no Macros)Evt# MSID Alt Name Description Value Units Green Box Time Stamp Value Binary
1 abcl wkup Wake up snooze buttons 1 6:00am 1 00000000000000012 deft brkfst Eat Breakfast cheerios 1 6:16am 2 00000000000000103 geh3 gt rdy Get ready for work activities 1 6:30am 4 00000000000001004 q dv2wk Drive to work turns I 7:15am 3 00000000000010005 Jlmn5 shwbdg IShovigadge I slowin rat? 1 0 7:45am 16 00000000000100CG
Figure 9. Prototype 1: Charlotte's Daily Events
Figure 10. A) Prototype 2: CBC Display
Figure 10. B) Prototype 2: Upper Stage Display
XI. The System Level RequirementsOnce the stakeholders needs have been identified and a case study has been performed, the system level
requirements are determined. The system level requirements define the system architecture that must beimplemented to meet the stakeholders' needs. For instance, the stakeholder needs the telemetry display to becompatible with existing architecture. One system level requirement is met by using OpenOffice since it interfaceseasily to Iris as determined by the case study. The system level requirements for the FAST-D4 display are listed inTable 2 below.
Table 2. Svstem Level Requirements
No. System Level RequirementsI.A The display shall contain all flight critical data.I.B Both displays shall illuminate flight events as received.I.0 Both displays shall contain a resettable latching mechanism to capture ordnance eventsII.A The toolbox shall be compatible with the Iris Telemetry System.II.B The toolbox shall be compatible with Winplot.II.0 The toolbox shall read the telemetry from the Launch Vehicle.III.A All display functions shall be easy to navigateIII.B The toolbox shall follow a standard color scheme for the text and sienals
XII. Design-to RequirementsThe design-to requirements specify the desired outputs of the system. The Concept of Operation, Functional
Analysis, and System Level Requirements form the basis for these specifications. For example, the system level
Summer 2010 Session

NASA USRP — Internship Final Report
requirement that the display shall contain all flight critical data will be implemented by displaying the true andcomplimentary flight parameters for system 1 and system 2.
Table 3. Sample of Design-to Requirements
No. Design-to Requirements
I.A.1 Both displays shall list true and complimentary flight parameters for system 1 and system 2.
I.A.2 Both displays shall contain the MSID for each telemetry signal.
I.A.3 Both displays shall contain the IRIS description for each telemetry signal.
I.A.4 Both displays shall be compatible with East and West coast NASA telemetry labs.
I.A.S Both displays shall contain RIFCA telemetry data.
I.A.6 The Upper Stage display shall contain a quick view of the CBC display.
I.A.7 The Upper Stage display shall contain 2nd stage flight events.
XIII. Implementation
Implementation of the FAST-D4 display consisted of various design methods including data collection,problem solving, programming, and communication systems analysis. During the implementation phase of thesystems engineering process, three iterations of the FAST-D4 display were produced, tested, and revised to meetthe stakeholders' requirements. Peer reviews, code analyses, and system testing were used to satisfy designsolutions and verify specified requirements.
Prior to the implementation of the FAST-D4 display, a spreadsheet requiring programming skills similar tothose needed for the second prototype was produced. This initial prototype listed the system engineer's dailyevents such as waking up and included examples of data such as MSID, alternate name, and description. Eachevent was coupled to a grey indicator box that would illuminate green when the event occur red. These events, likeflight events, are assigned to bits in specific words which make up the frames used for telemetry. The illuminationcriterion was the presence of a binary `1' or `bit' from a specified location within a 16-bit word. Since the inputsto the display were in decimal representation, the first step to implement this requirement was to convert thedecimal input to binary. Excel comes with a binary to decimal converter function; however, it was discovered thatthis function only works for binary words less than or equal to 9 bits. Therefore, a macro was written to replacethis function. The macro accomplished this task; however, to create a design comparison, an alternative methodwas investigated. The alternative method used a combination of different functions embedded in the spreadsheetthat also successfully completed the conversion. Once the conversion was completed, a bit search function wasutilized to locate the set bit or event trigger, and the cells were illuminated using conditional formatting. Thespreadsheet passed all testing, and the design team was then ready to implement the FAST-D4 display.
The second prototype began with one page intended to contain all flight event data. The page containedvisible cells designated for illumination of flight events and hidden cells containing parameter names, MSID's,description, Engineering Units (EU), and raw data for analysis. Each flight event contained two sets of data toprovide system redundancy. This included system 1 HIGH, system 1 LOW, system 2 HIGH, and system 2 LOWparameters. Most of the MSID's were found in the ULA Delta IV Vehicle Assembly Launch Test Requirementsdocument using the parameter name. The description, EU data, and raw data were then easily found by looking upthe MSID in Iris. The remaining parameters were not found in this document, because they were latchingparameters derived from ordnance events. Since ordnance events are often only 180ms long, these latchingparameters illuminate when triggered by an ordnance event and stay on until the user turns them off. The latchingmechanism requires formulas embedded in the spreadsheet to capture the trigger, and a macro to enable the latch.The ordnance event parameter names and corresponding MSID's were retrieved from a parameter file. Theordnance event MSID's were then used in Iris to look up their corresponding description, EU data, and raw datatelemetry. The latch was created using two buttons titled `set' and `reset' in OpenOffice that contained twoseparate macros. A `1' was inserted into a hidden cell if `set' was selected, and a `0' was inserted if `reset' wasselected. The next step was to add an additional column in the spreadsheet for latching parameters and insertembedded formulas to capture ordnance events. The embedded formulas required variables from the latch value,the discrete ordnance data, and the previous value of the formula. Since the formula required the cell to bereferenced to itself, the output returned an error even after many data manipulations. OpenOffice was not storingthe previous value of the cell, so the design team attempted to insert the formula into a macro. This solution was
Summer 2010 Session

NASA USRP — Internship Final Report
undesirable, because the macro could not process the inputs efficiently and would consistently freeze theapplication. It was concluded that the macro would not be stable enough for operation at Hangar AE, and thefocus was then turned back to embedded formulas. Additional research was done on OpenOffice, and the designteam found that the iterations option which allows a cell's previous value to be stored in the memory was disabledunless activated by the user. The iterations option was then enabled and the latching function worked nominally.After the technical issues were solved, conditional formatting for cell illumination and page layout were designedfor usability and general aesthetics. Due to the number of events being captured and displayed, it was decided tosplit the screen into two pages for clarity and ease of use. Finally, testing was done at Hangar AE by running aplayback of a previous Delta IV launch countdown. The non-ordnance flight events were illuminating nominally;however, several ordnance events were not triggering the latch. Also, the display size was too small for theconsole and needed to be enlarged.
Prototype three began with an ordnance event analysis using Winplot. Since the Winplot software displaysfull rate data from the launch vehicle, the ordnance events were verified in graphical format. The Winplot diagramrevealed that the latch trigger did not function properly. This meant that there was an issue with how OpenOfficewas retrieving data from Iris. The problem was that OpenOffice only updates raw or EU data from Iris once everysecond, and Iris only refreshes data every half-second. The Hangar AE team solved this problem by suggestingthe cells be referenced to a monitor program associated with Iris instead of raw data. This monitor programevaluates high, low, and present-time values every half second from CARDS. The Iris monitor program detectsflight events by evaluating changes in these outputs. For example, if the 180 ms ordnance event does not occurwhen the present time sample is taken, the high value would still be triggered and indicate that an ordnance eventoccurred. Some formulas had to be altered slightly to accommodate this change. Unlike raw data, data from themonitor file returned values other than `1' if a flight event occur red. A function was created to convert thesevalues to a `1' if the ordnance event was triggered and a `0' if it was not. The latching cell was then referenced tothe function to complete the technical troubleshooting. Next, the display size was adjusted to fit the console, andthe font was enlarged to increase visibility. The display was tested again using the same playback data from therecorded launch. The project manager and design team concluded that the product was ready to be finalized.
Senior NASA Avionics Engineers reviewed the product in a Design Certification Review (DCR) and agreedthat the product was mature enough for certification. The stakeholders' needs were met for a product that is easyto use, compatible with existing architectures, and monitors flight event telemetry for the Delta IV launch vehicle.FAST-134 will be used in the upcoming Delta IV launch scheduled for September 2010 and will be tailored toother existing NASA fleet vehicles.
XIV. Verification and ValidationVerification and Validation (V&V) is a SE process that verifies that the right product was produced and
validates that it was produced cor rectly. This process was completed at Hangar AE for prototypes 2 and 3 byrunning a playback of the GPS2F1 Delta launch. The V&V matrix shown in table 4 below indicates thespecifications for each design-to requirement involving the second and final prototype. The first prototype is notincluded, because the design-to requirements do not match all of the design-to requirements of the final product.In this table, the first design-to requirement for testing all four parameters for each flight event was done July 23and 30, 2010 by the Systems Engineer, Hangar AE, and Project Manager (PM) as an inspection and test. Thisconcludes that the stakeholders' need was met appropriately and effectively.
^'& l' ]Matrix Y&Y ]Method Auditor DatesLevel Requirement I A T D SE PM AE Protoq-pe 2 Protohpe 3I.A.1 Both displays shall list true and complimentary flight parameters for system 1 and system 2. 3 3 7,23!2010 7 302010I_a.2 Both displays shat[ contaict the IISID for each telemetry si gnal. 3 7+23+2010 7:30r2010 I.A3 Both displays shall contain the IRIS description for each telemetry si gnal.
F7212010 7'302010
I_a.d Both displays shall be compatible with East and West coast NASA telemetry tabs. 3 ^ y 7'212010 710'2010
Table 4. Sample Validation and Verification Matrix
XV. Final ProductFAST-D4 was approved for certification August 10, 2010. The final product is shown in Fig. 11 A and B below.
The flight events properly illuminate when the appropriate signal is received from Iris, and the display is the correctsize for the monitors at Hangar AE.
Summer 2010 Session

NASA USRP — Internship Final Report
Figure 11. A) Final Product CBC Display Figure 11. B) Final Product Upper Stage
XVI. MaintainabilityEach NASA mission is unique; thus, for each mission, the sequence or presence of certain flight events may
change. The FAST-D4 telemetry display was designed with this in mind and can be easily adjusted to accommodatenew requirements. The spare flight event cells are ready to be used if required for the mission. The onlyimplementation that would be needed is to insert the telemetry parameter for the new flight event, and determine theoutput value that would indicate that the flight event has occurred.
NASA Engineering routinely acquires ULA launch services for several vehicles other than Delta IV. The FAST-D4 display also provides a versatile foundation for creating new displays for other vehicles. All architectures withinthe display can also be adjusted at the user's discretion; this includes parameters, size, color, functions, macros, etc.This maintenance will ensure that the display is up to date and accurate for future missions.
XVII. Future ImplementationNASA Engineering constantly looks for new ways to improve existing capabilities. FAST-D4 is a new capability
that has flexibility to allow for future enhancement, including quick access to Winplot, a time stamping tool, and atool to locate flight events with a cursor in a flight sequence document.
A tool that provides quick access to Winplot would be beneficial to NE and the Hangar AE team.Implementation of this tool could be accomplished by creating a button with a macro that takes the user directly tothe strip-charting tool. Since the display would allow direct access to Winplot, the user would save time and be ableto verify flight events more accurately.
A time stamp would also be beneficial, because it would allow engineers to see exactly when a flight eventoccurred. This is important in launch vehicle diagnostics for determining the cause of any anomalous systembehavior. Right now, Winplot is used as the primary tool for determining the time of flight events relative toimportant events. Although Winplot is very accurate, the flight event would have to be located in order to determinethe time. This task is not too difficult, but a time stamp would provide a convenience to the engineer, so that theycan focus on more critical objectives.
Engineers use a flight event sequence document to verify vehicle flight events. It can sometimes be difficult totrack the flight events in this document since so many critical events are taking place. Some engineers haveexpressed interest in a tool that would display an arrow next to the flight event that is occurring in the document.This would facilitate the launch monitoring process.
These three implementations would contribute greatly to the FAST-D4 display by providing conveniences to theengineer. Quick access to Winplot, a time stamp, and a cursor following flight events would not be difficult toimplement, however, they require a significant amount of time. Time constraints prevented the implementation ofthese features on the baseline release.
XVIII. ConclusionNASA Engineering provided leadership, management, and flight expertise services to successfully implement
the FAST-D4 display. By utilizing a systems engineering approach, I helped develop a product that met allstakeholder requirements: display flight events, use existing architectures, and implement a user friendly interface.FAST-D4 contains all flight critical events that illuminate correctly when the telemetry signal is received from Iris.The latch implementation also resulted in success by accurately capturing ordnance events under 180 ms. Senior
10 Summer 2010 Session

NASA USRP — Internship Final Report
NASA Avionics Engineers have examined the display and certified the design for release. This product will be usedfor processing the upcoming Delta IV launch in September to assist engineers in monitoring the system for anyanomalous behavior.
11 Summer 2010 Session

x
tL
AH
E^
.U.
•U
0U
a.clNh
00 OC oc 00 00 00
Q ^ d d ^ Q
00
Qi—i
N
N
Ncli
wS-
CIS
OU
p.
uP^U
a1
f--i
U
bq
N
QN
0U
cd
ON
vi
a3
Y"
bhp '^ ^ N N U U N
y ^ ^" U O N NU '--
°' Q U Q d¢ UZ u w w w w w ^a
U °-I..' ^ ^ w p
u U O z 0 H H O
°' ", : 3000^^^A u - x x xCD
U '^ a3 U U] V] QN V)
F".
U W .," a3 cC m cC m d
Q C
m O O O O O O
CIOd., u o
th
,^ ,^ ^ ^ ai N N N N ^ ^
.--i ^ N U U N Q) U
Y -S y
0 0 0 0 d Q Q Q
f^ W 0.l CG E-^ ^ ^ ^-; ^-, ^
0
CIO
0
0N
N
Qi—i
04

C'U+
N ^
4O X00-a
O
O ^U 0 ^ rq
OO
cl
ol
U U
Pi U N ^O L^
.^ O .O U
^ O ^I
4.1 un
p.
O
^i
R•^
Oo--r
d
z
UU
.ii
O
.d
U
O
.Oa.Y
OOU
O,DOO
U
E-^
Q^
U
y
O
'd
aU+
U
tt
^ N
^' rnOU ^
U
^ N
o A
O aU+O ^U ^"
H O
d ^
'C7
Y0CA
U
a^
U
N
NO
9A
U
O
U
'rter.a
s^U
G^ O O O
U
^'^ U
N'ate.+
¢, O^'
NLy
^+
O ^ ^O U
Lr^ ^*"
44^ U
cd
U3 a
U U CII .flN
NN
iO•
y ^U.
N
N ^ bA ^ ^ "^
^ ^ O •^ •^ ^
YbAN
O O ^t"r U
^--i N N bA
6'b U
^, 4-^cc^ N U
0,t' Cd
ON .C,u 0
Qp .fl cd U
" ..+'i^' O
a
I7O
yvr^ U
-- Ua7b bcd
O• ^' ^^+a O ^ Ou)
0 O O ,U,
O "y ^" O O O vOi
bA Uxicn v O CC .SC
3 a • 3 ^ ^ Y ^, >, ^ b ^ ^ bn _^
wQa O ,.O 'C3 '^ p U N Qo vn
^
+-
U..
U vJ '^
a3^ v]
rn^ r/] ^ a..a
cn4)4)-c ,^ ,D O ,5 O y O
O
'pO
S3 a3 cC U• .--1 y 75 O O ^I-= QI y
U
x! O ^^yyN-1
.0 O
N
4 .14 U
UU 'C
L:o W
F E-E h Efl D
°^ d ^ U ^ d 0.7 ^
z
0
0
0N
N
O
M

C^ CJ
O cmo cs
C,
O
aj
Iml-
1 2'Al
C3
0
rn
O
Cl ,A
ql
CI
IllrluS
O
QL
Idbl
rtriro
O
tu^
hi)
d)
ni
C)
r4I--
ri
o

NASA USRP — Internship Final Report
AcknowledgmentsAlthough my time at KSC was only a few short weeks, I received an enormous amount of assistance from
several people in the development of my project, the FAST-D4 telemetry display. Joe Bartyzel, my mentor and theproject manager, played a large role by providing expertise, encouragement, and assistance in the development ofthe project. Doug Lindhorst, the NASA KSC ELV Branch Chief, provided assistance and encouragement onmultiple occasions. Jeerapong Wongchote, Carlos Alvarado, Matt Olenick, and Ted Jones provided a vast amount ofassistance in Avionics and Systems Engineering. Vernon Wikander and Teresa Sauter edited and contributed greatlyto the development of this paper. Nate Wood and Alex Biamonte at Hangar AE also contributed significantly inmaking the telemetry display compatible with existing architectures. I owe a tremendous amount of credit to each ofthese skilled engineers for all of their hard work. Working with each of these individuals has made my time here avery enjoyable and enriching experience. The Undergraduate Student Research Program (USRP) also assisted in thisproject by providing the internship funding.
USRP Internship Experience
I am an Electrical Engineering student working as a NASA intern at KSC this summer, and will be entering mysenior year at Arkansas Tech University this fall. During this internship, I had the opportunity to work for the NEAvionics branch through the USRP program which provided me with a broad range of activities. I was providedwith an excellent introduction into researching and analyzing engineering issues. Through this experience I acquireda great amount of knowledge in launch vehicles avionics/GN&C, programming, SE techniques, and telemetry. I wasalso introduced to the NASA's fleet of launch vehicles: Shuttle, Delta II/IV, AtlasV, Pegasus, and Taurus. Mycommunication and oral presentation skills greatly improved through my experience with SE reviews, and I enjoyedthe networking opportunities that were created by a very diverse work environment. My internship also taught meabout the history of NASA, the role of each Space Center, and how each facility operates through very interesting.and informative tours. It was an amazing experience to be a part of such an inspirational program, and I know thatthe knowledge I acquired this summer will be useful for the rest of my life.
References
'Blanchard, B., Systems Engineering Management, 3 `d ed., John Wiley & Sons, Inc., Hoboken, New Jersey, 2004 Chaps, 2-3
2Clausing, D., and Hauser, J.R., "The House of Quality." Harvard Business Review, 1988. URL:http://www.csuchico.edu/—jtrailer/HOQ.pdf [citied Aug 5, 2010].
3NASA's Launch Services Program. NASA., 2005. URL: http://www-pao.ksc.nasa.gov/kscpao/nasafact/pdf/LSP2005.pdf[citied Aug 5, 2010].
15 Summer 2010 Session