FLEXURAL STRENGTH QUALITY CONTROL FOR CONCRETE … · 2018-08-10 · Portland cement concrete (pCC)...
65
FLEXURAL STRENGTH QUALITY CONTROL FOR CONCRETE PAVEMENTS Final Report Steven M. Trost, Ph.D., P.E. STRATEGIC SOLUTIONS Prepared for the OKLAHOMA DEPARTMENT OF TRANSPORTATION in cooperation with the FEDERAL HIGHWAY ADMINISTRATION June 2004
Transcript of FLEXURAL STRENGTH QUALITY CONTROL FOR CONCRETE … · 2018-08-10 · Portland cement concrete (pCC)...

FLEXURAL STRENGTH
QUALITY CONTROL FOR
CONCRETE PAVEMENTS
Final Report
Steven M. Trost, Ph.D., P.E.
STRATEGIC SOLUTIONS
Prepared for the
OKLAHOMA DEPARTMENT OF TRANSPORTATION
in cooperation with the FEDERAL HIGHWAY ADMINISTRATION
June 2004

TECHNICAL REPORT STANDARD TITLE PAGE 1. REPORT NO. 12. GOVERNMENT ACCESSION NO. 3. RECIPIENT'S CATALOG NO.
4. TITLE AND SUBTITLE 5. REPORT DATE
FLEXURAL STRENGTH QUALITY CONTROL FOR June 2004 CONCRETE PAVEMENTS: 6. PERFORMING ORGANIZATION CODE Final Report
7. AUTHOR(S) 8. PERFORMING ORGANIZATION REPORT NO.
Steven M. Trost, Ph.D., P.E. SS-0310302
9. PERFORMING ORGANIZATION NAME AND ADDRESS 10. WORK UNIT NO.
Strategic Solutions 1414 S. Sangre Rd., Ste. 106-N 11. CONTRACT OR GRANT NO.
Stillwater, OK 74074 3459000764
12. SPONSORING AGENCY NAME AND ADDRESS 13. TYPE OF REPORT AND PERIOD COVERED
Oklahoma Department of Transportation Final Report 7/03 - 6/04 200 N. E. 21st Street 14. SPONSORING AGENCY CODE Oklahoma City, OK 73105
15. SUPPLEMENTARY NOTES
16. ABSTRACT
Portland cement concrete (pCC) pavement design relies upon the modulus of rupture, or flexural strength, of the concrete as a primary design input. However, the beam specimens required for the flexural strength test (ASTM C78) are heavy and easily damaged prior to testing. As such, many state highway agencies rely upon cylinder specimens tested in compression as a means to monitor and control the quality of concrete pavements. Unfortunately. the failure mechanisms associated with compressive-strength testing do not parallel those of the flexure test, leaving agencies potentially exposed to the risk of accepting concrete pavements of questionable quality.
The goal of this research was to overcome the difficulties associated with determining flexural strengths in the field by demonstrating effective alternative methods for verifying concrete flexural strengths. As such, the focus of the research was to examine the suitability of alternative test methods that could potentially replace field-cast beam specimens while still measuring the same or similar strength properties as the flexure test.
Three alternative test methods were evaluated - pullout (ASTM C9OO), direct tension, and modified pullout. Of the three methods investigated, the pullout and direct tension tests both showed promise as potential methods to replace field-cast beams as means for flexural strength quality control, with the direct tension test showing the most promise due to its lower coefficient ofvatiation (7.8% versus 12.3%) and close similatity of its failure characteristics with the flexure test. Though not included as part of the study, the splitting tension test (ASTM C496) is also recognized as an alternative means for flexural strength quality control. A protocol for beneficially using concrete maturity methods for flexural strength quality control is also provided.
17. KEY WORDS 18. DISTRIBUTION STATEMENT
Flexural Strength; Tensile Strength; Direct No restrictions. Tension; Pullout; Concrete Maturity; Quality Control; Statistical Process Control;
19. SECURITY CLASSIF. (OF THIS REPORT) \20. SECURITY CLASSIF. (OF THIS PAGE) \21. NO. OF PAGES 122. PRICE
Unclassified Unclassified 65 Form DOT F 1700.7 (8-72)

[This page intentionally left blank]

NOTICE
The contents of this report reflect the views of the authors who are responsible for the facts and accuracy of the data presented herein. The contents do not necessarily reflect the views of the Oklahoma Department of Transportation or the Federal Highway Administration. This report does not constitute a standard, specification, or regulation. While trade names may be used in this report, their use is not intended as an endorsement of any machine, contractor, process or product.
This report is intended SOLELY for use by PROFESSIONAL PERSONNEL who are competent to evaluate the significance and limitations of the information provided herein, and who will accept total responsibility for the application of this information.
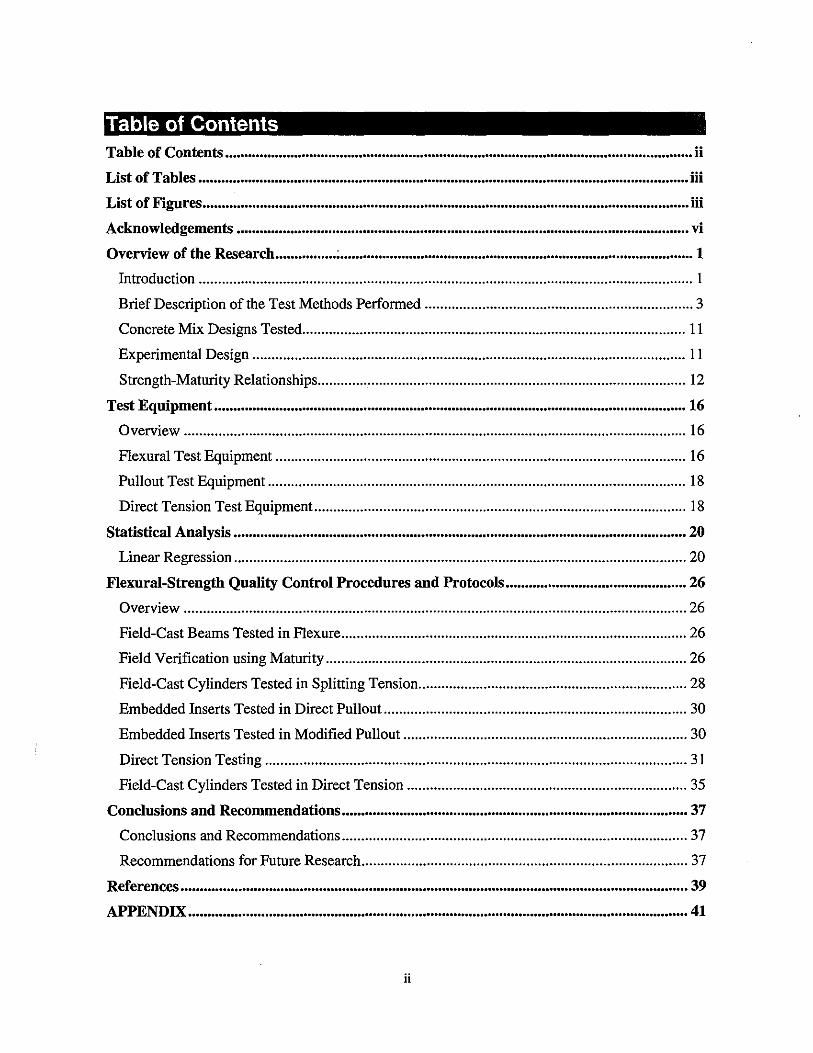
Table of Contents Table of Contents .......................................................................................................................... ii
List of Tables ................................................................................................................................ iii
List of Figures ............................................................................................................................... iii
Acknowledgements ...................................................................................................................... vi
Overview of the Research ................ ; ............................................................................................ 1
Introduction ................................................................................................................................. 1
Brief Description of the Test Methods Perfonned ...................................................................... 3
Concrete Mix Designs Tested .................................................................................................... 11
Experimental Design ................................................................................................................. 11
Strength-Maturity Relationships ................................................................................................ 12
Test Equipment ........................................................................................................................... 16
Overview ................................................................................................................................... 16
Flexural Test Equipment ........................................................................................................... 16
Pullout Test Equipment ............................................................................................................. 18
Direct Tension Test Equipment ................................................................................................. 18
Statistical Analysis ...................................................................................................................... 20
Linear Regression ...................................................................................................................... 20
Flexural-Strength Quality Control Procedures and Protocols ............................................... 26
Overview ................................................................................................................................... 26
Field-Cast Beams Tested in Flexure .......................................................................................... 26
Field Verification using Maturity .............................................................................................. 26
Field-Cast Cylinders Tested in Splitting Tension ...................................................................... 28
Embedded Inserts Tested in Direct Pullout ............................................................................... 30
Embedded Inserts Tested in Modified Pullout .......................................................................... 30
Direct Tension Testing .............................................................................................................. 31
Field-Cast Cylinders Tested in Direct Tension ......................................................................... 35
Conclusions and Recommendations .......................................................................................... 37
Conclusions and Recommendations .......................................................................................... 37
Recommendations for Future Research ..................................................................................... 37
References .................................................................................................................................... 39
APPENDIX .................................................................................................................................. 41
ii

List of Tables ' Table I - Concrete Mix Designs """"""""""""""""""""""." .. """""".""""""".""."""""."". I I
Table 2 - Regression Statistics for Pullout Test versus Flexural Strength ................................... 20
Table 3 - Regression Statistics for Direct Tension Test versus Flexural Strength ....................... 20
Table 4 - Regression Statistics for Modified Pullout Test versus Flexural Strength ................... 20
Table 5 - Regression Coefficients (versus Flexural Strength) and Single-Operator Coefficients of Variation (Within-Batch) ....................................................................................................... 21
Table 6 - Comparison of the Suitability of Various Test Methods for Flexural Strength Quality ControL .................................................................................................................................. 26
List of Fi ures Figure I - Hypothetical Cracked Cylinder Loaded in Compression .............................................. 2
Figure 2 - Hypothetical Cracked Beam under Attempted Third-Point Loading ............................ 2
Figure 3 - Hypothetical Cracked Cylinder Loaded in Direct Tension ........................................... 3
Figure 4 - Reaction Frame for Third-Point Flexural Beam Test (ASTM C78) ............................. 5
Figure 5 - Embedded Inserts for Pullout and Modified Pullout Tests (ASTM C900) ................... 5
Figure 6 - Hydraulic Pull Machine for Pullout, Direct Tension, and Modified Pullout Tests ....... 6
Figure 7 - Typical Failure Surface of Pullout Test (Extracted Cone) ............................................ 6
Figure 8 - Surface Preparation Equipment (Diamond Planing Disk) for Direct Tension Test ...... 7
Fignre 9 - Steel Disk Adhered to Prepared Concrete Surface Prior to Coring for Direct Tension Test ........................................................................................................................................... 7
Figure IO - Coring Equipment for Direct Tension and Modified Pullout Tests ............................ 8
Figure 11 - Coupling Device and Counterpressure Ring for Direct Tension Test.. ....................... 8
Figure 12 - Typical Failure Surface of Direct Tension Test .......................................................... 9
Figure I3 - Typical Failure Surface of Direct Tension Test (Extracted Partial Core) ................... 9
Figure 14 - Typical Failure Surface of Modified Pullout Test ..................................................... 10
Figure 15 - Typical Failure Surface of Modified Pullout Test (Extracted Partial Core) ............. IO
Figure 16 - intelllRock IT Handheld Reader. ................................................................................ I3
Figure 17 - intelllRock IT Concrete Maturity Sensor ................................................................... I3
Figure 18 - Flexural Strength vs. Maturity ................................................................................... 14
Figure 19 - Pullout Force vs. Maturity ......................................................................................... 14
Figure 20 - Direct Tension Force vs. Maturity ............................................................................. 15
iii

Figure 21- Modified Pullout Force vs. Maturity .......................................................................... 15
Figure 22 - Forney LA-270 Beam Tester ..................................................................................... 17
Figure 23 - Close-Up of Spring Arrangement on Forney LA-270 Beam Tester ......................... 17
Figure 24 - Close-Up View of Universal Joint for Diamond Planing Disk and Diamond Coring Equipment .............................................................................................................................. 19
Figure 25 - Pullout Test vs. Flexural Strength ............................... : ............................................. 22
Figure 26 - Direct Tension vs. Flexural Strength ......................................................................... 22
Figure 27 - Modified Pullout Test vs. Flexural Strength ............................................................. 23
Figure 28 - Compressive vs. Flexural Strength (paired Test Data from the Oklahoma Transportation Authority) ...................................................................................................... 23.
Figure 29 - Histogram of Within-Batch Coefficients of Variation for Flexural Strength Tests .. 24
Figure 30 - Histogram of Within-Batch Coefficients of Variation for Pullout Tests .................. 24
Figure 31 - Histogram of Within-Batch Coefficients of Variation for Direct Tension Tests ...... 24
Figure 32 - Histogram of Within-Batch Coefficients of Variation for Modified Pullout Tests ... 25
Figure 33 - Example of Coarse-Aggregate Pullout (Beam Tested in Flexure) ............................ 29
Figure 34 - Close-Up View of Coarse-Aggregate Pullout (Beam Tested in Flexure) ................. 30
Figure 35 - Example of Coarse-Aggregate Pullout (Direct Tension Extracted Core) ................. 32
Figure 36 - Typical Surface Break with Direct Tension Test (View of Metal Disk) ................... 32
Figure 37 - Typical Surface Break with Direct Tension Test (View of Concrete Surface) ......... 33
Figure 38 - Hypothesis for Explaining High Frequency of Surface Breaks During Direct Tension Tests ....................................................................................................................................... 34
Figure 39 - Proposed Modification to Direct Tension Test ......................................................... 35
Figure 40 - Recommended Direct Tension Test Locations on Conventional 6-inch by 12-inch Cylinder Specimens ............................................................................................................... 36
Figure 41 - Recommended Direct Tension Test Locations on Beam Specimens ........................ 36
Figure 42 - Flexural Strength vs. Maturity for 4061 Mixes ......................................................... 41
Figure 43 - Pullout Test vs. Maturity for 4061 Mixes ................................................................. 41
Figure 44 - Direct Tension vs. Maturity for 4061 Mixes ............................................................. 42
Figure 45 - Modified-Pullout Test vs. Maturity for 4061 Mixes ................................................. 42
Figure 46 - Pullout Test vs. Flexural Strength for 4061 Mixes .................................................... 43
Figure 47 - Direct Tension vs. Flexural Strength for 4061 Mixes ............................................... 43
Figure 48 - Modified Pullout Test vs. Flexural Strength for 4061 Mixes .................................... 44
Figure 49 - Flexural Strength vs. Maturity for 3057 Mixes ......................................................... 44
Figure 50 - Pullout Test vs. Maturity for 3057 Mixes ................................................................. 45
iv

Figure 51- Direct Tension vs. Maturity for 3057 Mixes ............................................................. 45
Figure 52 - Modified Pullout Test vs. Maturity for 3057 Mixes .................................................. 46
Figure 53 - Pullout Test vs. Flexural Strength for 3057 Mixes .................................................... 46
Figure 54 - Direct Tension vs. Flexural Strength for 3057 Mixes ............................................... 47
Figure 55 - Modified Pullout Test vs. Flexural Strength for 3057 Mixes .................................... 47
Figure 56 - Flexural Strength vs. Maturity for 757 Mixes ........................................................... 48
Figure 57 - Pullout Test vs. Maturity for 757 Mixes ................................................................... 48
Figure 58 - Direct Tension vs. Maturity for 757 Mixes ............................................................... 49
Figure 59 - Modified Pullout Test vs. Maturity for 757 Mixes .................................................... 49
Figure 60 - Pullout Test vs. Flexural Strength for 757 Mixes ...................................................... 50
Figure 61 - Direct Tension vs. Flexural Strength for 757 Mixes ................................................. 50
Figure 62 - Modified Pullout Test vs. Flexural Strength for 757 Mixes ...................................... 51
Figure 63 - Compressive vs. Flexural Strength for Mix OTA-Al ............................................... 51
Figure 64 - Compressive vs. Flexural Strength for Mix OTA-A2 ............................................... 52
Figure 65 - Compressive vs. Flexural Strength for Mix OTA-A3 ............................................... 52
Figure 66 - Compressive vs. Flexural Strength for Mix OTA-A4 ............................................... 53
Figure 67 - Compressive vs. Flexural Strength for Mix OTA-A5 ............................................... 53
Figure 68 - Compressive vs. Flexural Strength for Mix OTA-B ................................................. 54
Figure 69 - Compressive vs. Flexural Strength for Mix OTA-C ................................................. 54
Figure 70 - Compressive vs. Flexural Strength for Mix OTA-D ................................................. 55
Figure 71 - Compressive vs. Flexural Strength for Mix OTA-E ................................................. 55
Figure 72 - Compressive vs. Flexural Strength for All OTA Mixes ............................................ 56
v

Acknowled ements . The research results discussed in this publication were made possible by the OARS award for project number AR03(2)-064, from the Oklahoma Center for the Advancement of Science and Technology (OCAST) in conjunction with matching funds provided by the Oklahoma Department of Transportation (ODOT) in cooperation with the Federal Highway Administration (FHWA).
The investigators hereby acknowledge and thank OCAST, ODOT, and FHW A for making this research possible. The investigators also acknowledge and thank the Oklahoma Legislature for their vision in funding the Oklahoma Applied Research Support (OARS) program.
In addition, the investigators thank Duit Construction Company for donating the use of their ELE hydraulic compression frame for a portion of the project, as well as Dolese Brothers Co. for donating all the concrete materials used for the project.
vi

Overview of the Research Introduction Portland cement concrete (PCC) pavement design relies upon the modulus of rupture, or flexural strength, of the concrete as a primary design input. However,
the flexure test is not convenient for control or compliance purposes because the test specimens are heavy and are easily damaged. Also, the outcome of the flexure test is strongly affected by the moisture conditions of the specimen. (Neville 1996, p. 597)
Because of this difficulty associated with casting and handling beam specimens in the field, many state highway agencies rely upon field-cast cylinder specimens tested in compression to monitor or control concrete quality. However, the failure mechanisms are considerably different between cylinders tested in compression (ASTM C39) and beams tested in flexure (ASTM C78).
The goal of this research was to overcome the aforementioned difficulties by demonstrating effective methods for verifying concrete flexural strengths in the field. To be considered "effective", a given test method needed to satisfy the following five criteria:
• Exhibit a failure mode similar to that of the flexure test (e.g. instantaneous tensile failure without significant bridging or redistribution of the load during the test),
• Exhibit a strong predictive correlation with the flexure test,
• Exhibit good repeatability and reproducibility (i.e. a relatively small coefficient of variation),
• Exhibit robustness to variable test conditions, particularly loss of surface moisture prior to testing, and
• Exhibit robustness in the field, as in • Either, does not require field-cast specimens (i.e. an in-situ test),
• Or, does not require field-cast specimens that
• Are large (i.e. over 40 pounds), or
• Are prone to damage.
As such, the focus of the research was to examine the suitability of alternative test methods that could potentially replace field-cast beam specimens while still measuring the same or similar strength properties as the flexure test.
As stated above, concrete flexural strength is difficult to measure reliably under field conditions due to the inherent problems associated with casting and handling the relatively large beam specimens required by the test procedure. Figures I and 2 demonstrate an extreme hypothetical case that highlights the problem of using cylinder specimens tested in compression as a substitute method for measuring flexural strength. Figure I depicts a cylinder specimen with a jagged crack completely through the entire cross section of the specimen. This crack would most likely reduce the tested strength of the specimen compared to an intact specimen. However, the cracked specimen would still be able to resist a substantial amount of compressive force (perhaps 50% as much force as a non-cracked specimen). Figure 2, on the other hand, depicts a beam
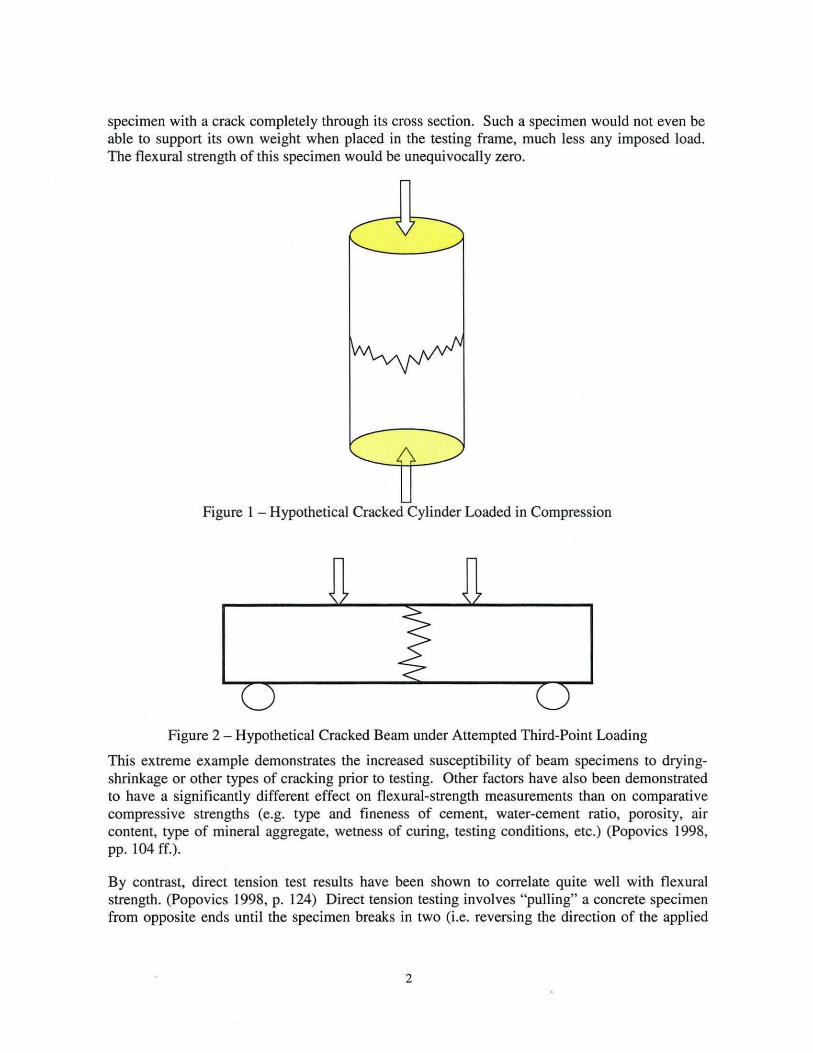
specimen with a crack completely through its cross section. Such a specimen would not even be able to support its own weight when placed in the testing frame, much less any imposed load. The flexural strength of this specimen would be unequivocally zero.
Figure I - Hypothetical Cracked Cylinder Loaded in Compression
Figure 2 - Hypothetical Cracked Beam under Attempted Third-Point Loading
This extreme example demonstrates the increased susceptibility of beam specimens to dryingshrinkage or other types of cracking prior to testing. Other factors have also been demonstrated to have a significantly different effect on flexural-strength measurements than on comparative compressive strengths (e.g. type and fineness of cement, water-cement ratio, porosity, air content, type of mineral aggregate, wetness of curing, testing conditions, etc.) (Popovics 1998, pp. 104 ff.).
By contrast, direct tension test results have been shown to correlate quite well with flexural strength. (Popovics 1998, p. 124) Direct tension testing involves "pulling" a concrete specimen from opposite ends until the specimen breaks in two (i.e. reversing the direction of the applied
2
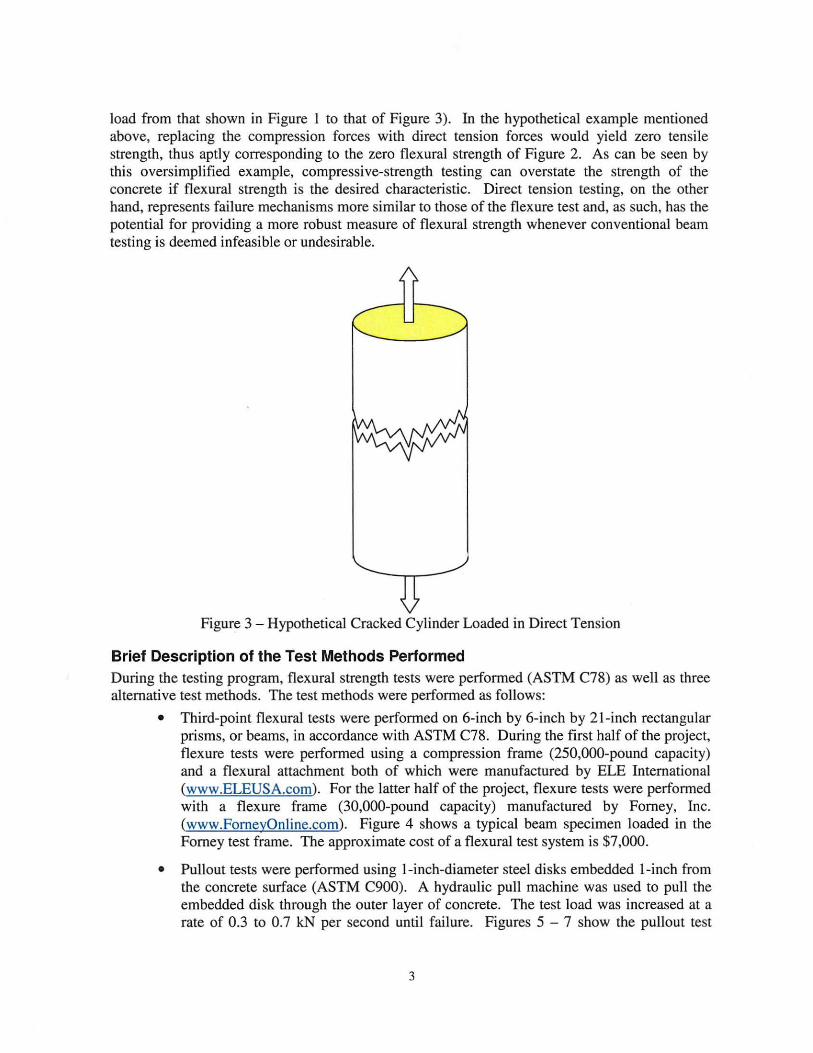
load from that shown in Figure I to that of Figure 3). In the hypothetical example mentioned above, replacing the compression forces with direct tension forces would yield zero tensile strength, thus aptly corresponding to the zero flexural strength of Figure 2. As can be seen by this oversimplified example, compressive-strength testing can overstate the strength of the concrete if flexural strength is the desired characteristic. Direct tension testing, on the other hand, represents failure mechanisms more similar to those of the flexure test and, as such, has the potential for providing a more robust measure of flexural strength whenever conventional beam testing is deemed infeasible or undesirable.
Figure 3 - Hypothetical Cracked Cylinder Loaded in Direct Tension
Brief Description of the Test Methods Performed During the testing program, flexural strength tests were performed (ASTM C78) as well as three alternative test methods. The test methods were performed as follows:
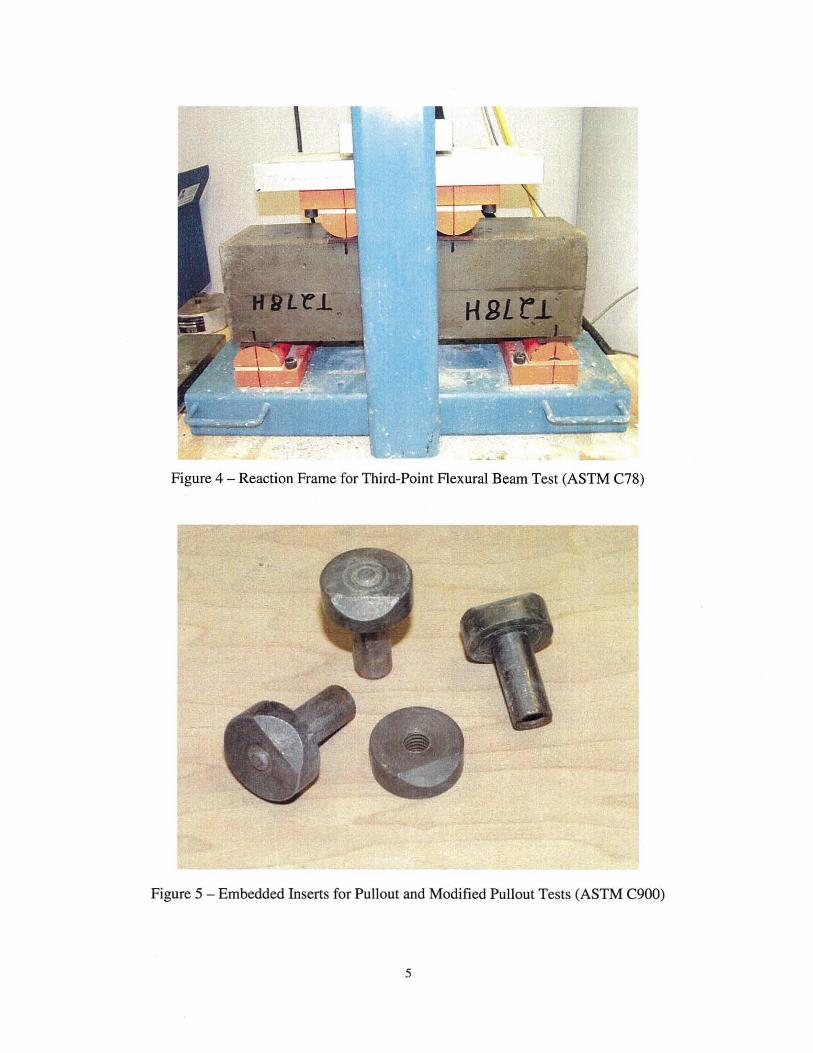
• Third-point flexural tests were performed on 6-inch by 6-inch by 21-inch rectangular prisms, or beams, in accordance with ASTM C78. During the first half of the project, flexure tests were performed using a compression frame (250,000-pound capacity) and a flexural attachment both of which were manufactured by ELE International (www.ELEUSA.com). For the latter half of the project, flexure tests were performed with a flexure frame (30,OOO-pound capacity) manufactured by Forney, Inc. (www.ForneyOnline.com). Figure 4 shows a typical beam specimen loaded in the Forney test frame. The approximate cost of a flexural test system is $7,000.
• Pullout tests were performed using I-inch-diameter steel disks embedded I-inch from the concrete surface (ASTM C900). A hydraulic puB machine was used to puB the embedded disk through the outer layer of concrete. The test load was increased at a rate of 0.3 to 0.7 kN per second until failure. Figures 5 - 7 show the puBout test
3

inserts, hydraulic pull machine, and typical fracture surfaces. The inserts and hydraulic pull machine used in this study were manufactured by Germann Instruments AlS of Copenhagen, Denmark (www.Germann .org). The approximate cost of the equipment for this test is $6,000.
• Direct tension tests were performed by adhering 3-inch-diameter steel disks onto the surface of the concrete, cutting 3-inch-diameter partial-depth cores in the concrete (around the steel disks), then pulling the disks parallel to the direction of coring (using the same hydrauHc pull machine as the aforementioned pullout test). The test load was increased at 0.1 to 0.5 kN per second until failure. Failure of the partial core occurs instantaneously once the maximum induced tensile stress in the concrete exceeds its tensile strength (much the same way a concrete beam fails during the flexure test). The equipment used for this test was originally developed to test the bond strength of concrete overlays and is thus referred to by the manufacturer as their "BOND" test equipment. Figures 8 - 13 show the direct tension test equipment and typical fracture surfaces. In addition to the hydraulic pull machine, surfacepreparation and coring equipment is required for this test. These items were also manufactured by Germann Instruments AlS. The additional equipment required for this test costs approximately $4,000.
• The investigators initially sought to indirectly measure tensile strength using acoustical sensors to "listen" for tensile cracking during the aforementioned pullout test. Previous studies by the manufacturer of the pullout equipment had demonstrated the occurrence of an audibly-discemable tensile fracture occurring at approximately one-third the ultimate load during the pullout tests (Petersen and Poulsen 1993). Although this first-fracture cracking was sometimes audible even to the unaided ear, efforts to consistently detect the onset of the tensile cracking via acoustical sensors proved unsuccessful. In an attempt to overcome this inability to audibly detect the first fracture, the investigators developed a modified pullout test wherein the first fracture would also be the terminal fracture. The resulting test is a hybrid of the pullout and direct tension tests mentioned above. This hybrid test uses the embedded inserts of the pullout test in conjunction with the partial-depth coring of the direct tension test. Figures 14 and 15 show typical modified-pullout fracture surfaces. No additional test equipment (other than the pullout and direct tension test equipment) is required for this test.
4
\
.........
Figure 4 - Reaction Frame for Third-Point Flexural Beam Test (ASTM C78)
Figure 5 - Embedded Inserts for Pullout and Modified Pullout Tests (ASTM C9DD)
5

Figure 6 - Hydraulic Pull Machine for Pullout, Direct Tension, and Modified Pullout Tests
Figure 7 - Typical Failure Surface of Pullout Test (Extracted Cone)
6

Figure 8 - Surface Preparation Equipment (Diamond Planing Disk) for Direct Tension Test
Figure 9 - Steel Disk Adhered to Prepared Concrete Surface Prior /0 Coring for Direct Tension Test
7

Figure 10 - Coring Equipment for Direct Tension and Modified Pullout Tests
Figure I I - Coupling Device and Counterpressure Ring for Direct Tension Test
8

Figure 12 - Typical Failure Surface of Direct Tension Test
Figure 13 - Typical Failure Surface of Direct Tension Test (Extracted Partial Core)
9

Figure 14 - Typical Failure Surface of Modified Pullout Test
Figure 15 - Typical Failure Surface of Modified Pullout Test (Extracted Partial Core)
10

Concrete Mix Designs Tested
Four different standard mix designs were included in the study. The mix designs are designated 3057, 4061 ,757, and 757F. Table I provides a breakdown of the mix proportions for each mix design. The 3057 and 4061 mixes are non-paving mixes designed for 3,500 and 4,000 psi 28-day compressive strength respectively and, as such, exhibited relatively low flexural strengths (325 to 625 psi) across the maturity ages tested (500 to 11,500 °C-H). The 757 and 757F mixes are paving mixes designed to reach 750 psi flexural strength at 28 days. The 757 and 757F mixes are essentially identical to each other except that 757F contains 20% substitution of the portland cement with Class C fly ash. The 757 and 757F mixes achieved flexural strengths between 575 and 975 psi across the maturity spectrum tested (500 to 70,000 °C_H).
Table I - Concrete Mix Designs MixlD
Raw Materials Units 3057 4061 757 757F
4/0 .11 ., 469
I Fly As. >S. - - - 122 r::;= os. '.'U - , •• U , •• 0 >s. - 1755 - -
139/ 1493 1219 1273 >s_ 230 256 230 225
>Z-. 2.4 - 3.1 3.1 >Z. 14.1 15.5 18.3 18.3
Design Strength psi 3,500 4,000 750 750 I
In addition, certain batches of the 4061 and 757 mixes were intentionally modified so as to alter the strength characteristics of those batches. As such, mix 4061 D involved the addition of a deleterious liquid (motor oil) during the mixing process, mix 757+ contained 15% additional portland cement, and mix 757++ also contained 15% additional portland cement plus a proprietary modification designed to further increase the flexural strength.
Experimental Design The experimental design focused on the collection of paired data in order to reliably determine the predictive correlations for flexural strength of the alternative test methods evaluated (pullout, direct tension, and modified pullout).
As previously mentioned, the goal of the research was to demonstrate effective methods for verifying concrete flexural strengths in the field. This goal was achieved by addressing the following specific objectives:
I . Determine the strength-maturity relationships for different concrete mix designs using four different strength-measurement methods: flexural (ASTM C78), pullout (ASTM C900), direct tension, and modified pullout. These relationships are shown in Figures 18 - 21.
2. Determine the relationship between flexural strength and pullout force for the different concrete mix designs. The overall relationship (based on all mixes combined) is shown in Figure 25. The relationships calculated for each individual mix design are located in the Appendix.
II

3. Determine the relationship between flexural strength and direct tension force for the different concrete mix designs. The overall relationship is shown in Figure 26. The relationships calculated for each individual mix design are located in the Appendix.
4. Determine the relationship between flexural strength and modified pullout force for the different concrete mix designs. The overall relationship is shown in Figure 27. The relationships calculated for each individual mix design are located in the Appendix.
Prior to being tested for strength, the specimens were cured in calcium-hydroxide-saturated water tanks at three different temperature ranges. A portion of the specimens were cured at standard temperature (i.e. 23 C +/- 2 C), a portion were stored in a heated tank (at approximately 35 C to 50 C) and the remaining specimens were stored in an external tank subject to ambient temperature fluctuations (resulting in temperature ranges of approximately 5 C to 20 C).
Strength-Maturity Relationships The strength-maturity relationship for each test method was determined for each of the four mix designs as well as the "modified" mix designs mentioned above. Maturity calculations were based on the Nurse-Saul method (with datum temperature = 0 C) using the intelliRock II Concrete Maturity and QC System manufactured by Engius, LLC of Stillwater, Oklahoma (www.intelliRock.com) (ASTM C 1074). Figures 16 and 17 show the intelliRock II handheld reader and concrete maturity sensor.
In addition to determining mix-specific strength-maturity relationships, the investigators calculated and recorded maturity data on all test specimens. As such, every strength test was tied to the actual temperature curing history of the specimen being tested.
The strength-maturity relationships for the four test methods are shown in Figures 18 - 21. Three of the four test methods exhibited strength-maturity relationships that were in line with expectations (i.e. with strength measurements increasing in a near linear fashion on a semi-log plot). The modified pullout test was the only exception, with the strength-maturity curves being relatively flat and at times even showing decreasing strength with increasing maturity. The investigators observed that the ultimate load from the modified pullout test did not always coincide with the first fracture. In other words, the first fracture did not always result in a terminal failure condition. Occasionally, the modified pullout test would reach a momentary plateau during loading (presumably coinciding with the first fracture), but then continue resisting additional pulling forces. Whereas the pullout force-measurement equipment does not store the load-versus-time curve, accurate identification of the plateau and associated pull force was extremely difficult and subject to operator error. The anomalies observed in the strengthmaturity curves for the modified pullout test are most likely the result of this difficulty.
12

Figure 16 - intelliRock II Handheld Reader
Figure 17 - intelliRock II Concrete Maturity Sensor
13

1200 - . "'- I "'. ", 757F
"" 3057 C2 1000
",,0 3057 Cl • /
-;; BOO .!!o
" 0, c e 600 iii e ~ x j! .. 400
i I I - I I I I i / --- I I I -
i ~ -I v-: . ~ I , ./
I . t-
200 ,
I j I i -o 100 1000 10000 100000
Maturity ('C-H)
Figure 18 - Flexural Strength vs. Maturity
I t
• I L ~~'.--~~--rl-----+;~
i I ! I :7 j) _~-
i· .
•
I ~- I +-
1000 10000 100000
Maturity (OC·H)
Figure 19 - Pullout Force vs. Maturity
14

20
18
16
14
Z 12 ~ ~ 5 10 "-"5
8 0-
-6
4
2
a 100
20
18
16
14
Z 12 ~ ~
~ 10 ~
~ 8
6
4
2
a 100
757_ m. m 757F .,," 3057 C2 . 061 D 3057 Cl
l
, I
757_ 757. m 7S1F
."" 3057C2
""'" 3057Cl
-
7'" . j - I / /
1 .......-+ .,,- .",,- +
~/~I .... -- , -, + ' .-....,...
.......- .......- ---'-I - .......- I ,
/ --c. .",,- t-Y , / + -.v- r I t I , L , + ,
I t c I ~
I , I I I I , , I ~ I I I
1000 10000 100000
Maturity ('C-H)
Figure 20 - Direct Tension Force vs. Maturity
-,
" ' , + + , ,
~ : , I . I •
r I· t- ,+ .... ':::--.L "- i
.;. I / ~I t ' .
,. / ---Q,.- - + .-
• .
,
;- . . +
t :
1000 10000 100000
Maturity ('C-H)
Figure 21 - Modified Pullout Force vs. Maturity
15

Test E ui ment Overview Although the goal of this project was to evaluate test methods and not necessarily test equipment, several of the pieces of equipment exhibited attributes that warrant discussion. As such, this section will briefly describe some of the investigators' noteworthy observations with respect to the equipment utilized.
Flexural Test Equipment During the first half of the project, the investigators utilized an ELE 250,000-pound capacity hydraulic reaction frame fitted with a flexural attachment. For this equipment, the full scale output of the pressure transducer was 10,000 psi at 250,000 pounds of applied force. Whereas concrete beam specimens typically break below 10,000 pounds force, the pressure transducer was unable to provide repeatable force measurements in this range, which is less than 4% of full scale. To overcome this difficulty, the investigators placed a 20,000-pound capacity shear-web load cell between the upper loading platen and the flexural attachment. The modified setup was able to provide the required precision and accuracy.
During the latter half of the project, flexural testing was performed on a Forney LA-270 30,000-pound capacity hydraulic reaction frame with a Pilot Digital Controller ill. Whereas the fullscale output of the LA-270's pressure transducer (also 10,000 psi) was at 30,000 pounds of applied force, the accuracy of the system at and below 10,000 pounds force was more than adequate. However, during calibration of the Forney equipment, the investigators identified an issue about which users of this and similar systems should be aware. The Forney system utilizes a pair of springs connected to the upper loading platen. Figure 22 shows the Forney LA-270 and Figure 23 shows a close-up of the spring arrangement.
The purpose of the springs is to increase the retraction speed of the upper platen. Although the quick-retraction of the upper loading blocks facilitates placement of the leather shims after checking for gaps between the specimen and the loading blocks, this benefit comes with two disadvantages. First, as soon as the hydraulic ram leaves its seated position, the springs exert an instantaneous additional force on the hydraulic system. This extraneous initial force was approximately 240 pounds, which relates to an apparent extra 20 psi flexural strength if this additional force is not properly zeroed prior to starting the test. Second, whereas springs follow Hooke's law (i.e. the force increases linearly with the spring's longitudinal displacement, or F = kx), the induced force continues to increase as the loading platen progresses throughout the test. This second source of error imparts an extra 450 pounds (above and beyond the initial 240 pounds) throughout the 2Y2-inch travel of the hydraulic ram. Whereas a typical beam specimen deflects only fractions of an inch during the flexure test, this source of error is relatively small. However, whenever \4-inch leather shims are used between the specimen and the loading blocks (per ASTM C78), this creates a difference of Y2-inch in the location of the hydraulic ram prior to engaging the specimen compared to specimens tested without shims. If this s()urce of error is not accounted for, the appl!fatus will produce a bias of approximately 90 pounds (7.5 psi) between shimmed versus non-shimmed specimens.
16

Figure 22 - Forney LA-270 Beam Tester
,
Figure 23 - Close-Up of Spring Arrangement on Forney LA-270 Beam Tester
17

Pullout Test Equipment Whereas the pullout tests, the direct tension tests, and the modified pullout tests all required the hydraulic pull machine, this equipment was used extensively throughout the project. The investigators were pleased with the performance of the equipment. A particularly helpful feature is the automatic recording of the date, time, and maximum load for each test. This feature saved many hours of retesting when a data-recording sheet was accidentally dropped into a water basin, leaving portions of the written data illegible.
Direct Tension Test Equipment The direct tension test equipment used for this research was specifically chosen for its robustness in overcoming the difficulties commonly associated with direct tension testing (i.e. gripping stresses and eccentric loading). Concerning these limitations of direct tension testing, Popovics (1998, p. 115) states,
Because of the stresses introduced due to gripping, there is a tendency for the specimens to break near the ends. . .. [T]he method in which metal pulling pieces are glued with epoxy or fixed with grout to the end of the tension specimens eliminates stresses caused by gripping. These however, offer no final solution for the eccentricity problem.
Germann Instruments' direct tension test equipment, in addition to using a glue system to eliminate gripping stresses, minimizes the occurrence of eccentricity problems by the following:
• Incorporation of a clamping system for use during surface planing and coring operations, thus ensuring perpendicularity between the concrete surface, the steel disk and the sawcut for the partial core (see Figures 8 and 10),
• Use of a "universal" type drill coupling on the diamond planing disk and diamond coring equipment, thus completely eliminating the potential inducement of a moment during planing and coring (see Figures 8, 10, and 24), and
• Pre-placement of the steel disk followed by the use of the steel disk as a guide for the diamond coring bit, thus ensuring the concentric placement of the disk in relation to the partial-depth core (see Figures 9 and 10).
Germann Instruments' direct tension test equipment includes a diamond planing disk for removing 1/16- to 114-inch from the surface of the concrete prior to adhering the steel disk. The purpose of the planing disk is to expose the concrete aggregate and also provide a clean flat surface as preparation for adhering the steel disk. Although the planing disk was effective in achieving these results, a couple difficulties were encountered with the planing disk. First, the diameter of the planing disk is only slightly larger than the diameter of the counterpressure ring. This limited tolerance sometimes led to off-center placement of the steel disk on the prepared concrete surface which sometimes created a lateral force during the test, causing a premature failure. This problem became more frequent as the outer edges of the diamond planing disk began to wear, further reducing the tolerance between the two diameters. To correct this problem, the manufacturer supplied a new counterpressure ring with a thinner wall. The thinner wall resulted in a net increase in the tolerance between the two diameters and virtually eliminated further instances of this problem.
18

Figure 24 - Close-Up View of Universal Joint for Diamond Planing Disk and Diamond Coring Equipment
The second problem with the diamond planing disk involved uneven wearing of the diamondimpregnated surfaces. The uneven wear pattern was manifest as excessive wear at the midpoint of the radius of the planing disk. This caused the formation of a ridge on the prepared surface of the concrete. This ridge increased the amount of adhesive required between the concrete and the steel disk. The investigators have recommended to the manufacturer (Germann Instruments) that the pattern of the planing disk be redesigned to better ensure an even wear pattern and thus minimize the occurrence of this problem.
19

Statistical Anal sis Linear Regression The test results from each of the three alternative test methods (pullout, direct tension, and modified pullout) were compared to the corresponding flexural strength data. The comparisons were based on least-squares linear regression using flexural strength as the dependent variable.
The analysis involved pairing the average test results from each alternative test with the corresponding average flexural strengths from the same batch at the same maturity. From this paired data, the corresponding least-squares regression (in the form y = b + rnx) was calculated and plotted, where
y = predicted flexural strength,
b = intercept coefficient from the regression calculation,
m = slope of the regression line, and
x = test value from the alternative test method.
The results of the regression analyses are presented in Tables 2 - 5 below.
Table 2 - Regression Statistics for Pullout Test versus Flexural Strength
FlexuralStrength = 279 + 13.3 PulloutForce
N ~ 41
Predictor Caef Constant 278.59
T 9.07
12.58
p
0.000 0.000 PulloutForce 13.294
S ~ 69.76
SE Caef 30.73 1. 057
R-Sq ~ 80.2% R-Sq(adj) ~ 79.7%
Table 3 - Regression Statistics for Direct Tension Test versus Flexural Strength
FlexuralStrength = - 53.4 + 53.5 DirectTension
N ~ 45
Predictor Caef SE Caef T Constant -53.36 55.90 -0.95 DirectTension 53.492 4.161 12.85
P 0.345 0.000
S ~ 73.06 R-Sq ~ 79.3% R-Sq(adj) ~ 78.9%
Table 4 - Regression Statistics for Modified Pullout Test versus Flexural Strength
FlexuralStrength = - 50 + 70.3 ModifiedPullout
N ~ 9
Predictor Caef Constant -49.8
T -0.49
5.84
P 0.639 0.001 ModifiedPullout 70.29
S ~ 60.92
SE Caef 101.7 12.04
R-Sq ~ 83.0% R-Sq(adj) ~ 80.5%
All three alternative test methods demonstrated significant regression models (p < 0.00 I) and all three prediction equations exhibited reasonable standard errors (S) (69.8, 73.1, and 60.9 psi) and also reasonable coefficients of determination (R2) (80.2%, 79.3%, and 83.0%), suggesting that all three have potential as suitable replacements for beams in determining flexural strengths in the field.
20

The intercept coefficient for the pullout test was unquestionably non-zero (p < 0.00 I ) whereas the intercept coefficients for the direct tension and modified pullout tests were not significant (i.e. not discernibly different from zero) (p = 0.35 ; P = 0.64). In other words, the regression line for the pullout test would NOT extend through the origin (zero, zero) whereas the regression lines for the direct tension and modified pullout tests do, in fact, extend through the origin.
Figures 25 - 27 show scatter plots, regression lines, regression equations, coefficients of determination (R\ and prediction intervals for each of the alternative test methods (pullout, direct tension, and modified pUllout). In addition, Figure 28 provides the same information for compressive- versus flexural-strength based on paired data from nine different mix designs from projects constructed for the Oklahoma Transportation Authority. Figures 25 - 28 are based on the combined data for all mix designs. Similar figures showing scatter plots, regression lines, and coefficients of determination for each test method by mix design are given in the Appendix.
The distribution of coefficients of variation (i.e. normalized standard deviations) for the four test methods are shown in Figures 29 - 32. The coefficients of determination (R2) and the pooled and median coefficients of variation for the tests conducted during the study are summarized in Table 5 below. The coefficient of variation (COV) of the flexural strength test results conducted during this study compared favorably to ASTM's published precision and bias statement for the test method (5.5% actual versus 5.7% published single-operator COY). The coefficient of variation for the direct tension test, though higher than the flexural strength COY, was still reasonable (7.8%).
Table 5 - Regression Coefficients (versus Flexural Strength) and Single-Operator Coefficients of Variation (Within-Batch)
Pooled Median Coefficient of Intercept Test Method Coefficient of Coefficient of Determination Coefficient
Variation Variation FlexuraITASTM C781 100% 0 5.5% 4.3% Direct Tension 79% 0 7.8% 6.6% PulioutCASTM C9OO) 80% 280 12.3% 10.2% Mociffied Pullout 83% 0 13.1% 12.9% ColiiiiiiiSSlva CASTM C39) 39% 390 2.4%- N/A Splitting Tension (ASTM C496) NlA N/A 5.0%- N/A . from PreCIsion and Bias statement published In ASTM C39·01
U from Precision and Bias statement published in ASTM C496·96
21

1000
900
1 1
I I I l..--V I ; y = 13.29x + 278.591 R2 0 .80
I , 800
" .-"
, -;;
700 So
= C> c 600 ~
~ A L ...... '. T ~ V · ,I---V . , , .......
---k
iii • e 500 ~ • ~ 8-u: 400 ~ C>
~ 300 >
'"
....... . . , , ......... I .
, V I i
,
200
• Paired Test Data (Average vs. Average) 100 Prediction Interval (95% Confidence)
Regression Line 0 I , ,
0 5 10 15 20 25 30 35 40 45 50
Average Pull Force (kN)
Figure 25 - Pullout Test vs. Flexural Strength
1000
900
y _ 53.46x - 53.60 IT . I . II I 1./ I , R2 _ 0.79
I / r-1--- I--800 , ,
0; 700
S
& 600 c • ;;;
• 500 ,
--r IT I .• I~ i", 1./ I
"" , ~ L V-I . ,: .
I -" Y ,
b • ,
I V ~4 I ' I ~I I 1 I IP- I ,
• .. ~
& 400 .~ TT'
I • • ~ 300
200
,
I I h" Ii I I I
\, ' I , I I ' • Paired Test Data (Average vs. Average)
100 Prediction Interval (95% Confidence) Regression Line
o , , I "
o 2 3 4 5 6 7 8 9 10 11 12 13 14 15 16 17 18 19 20
Average Pull Force (kN)
Figure 26 - Direct Tension vs. Flexural Strength
22

1000 I I I
y; 69.48x - 43.11 900
"
A' 0.83 ,
t I i I ~ 800
,
.. 700 • I
'" " 600 ~
~ .. 500 , • £ • 400 ~
/' ,/
.....- I ~ J.....-~ .....-j V ., ..... (" ,
• • • > < 300
, 200 : .... I ,
• Paired Test Data (Average vs. Average) 100 Prediction Interval (95% Confidence)
~ Regression Line -0
, , , , ,
0 2 3 4 5 6 7 8 9 10 11 12 Average Pull Force (kN)
Figure 27 - Modified Pullout Test vs . Flexural Strength
1000 , -
y - 0.07x + 390.14
900 A' 0"39 •
800
700 'i
.....- . .: •• • . ..... ---....--. .( j. ~~ ~ • 1 • • : .
....-;""'" :,.-. I • ~ ...-- I .eo 600 " ;;, 0
, '" • ~ 500
iii E , 400 • • u:
300
• . ;. V
, .
~('" ,
200
• Paired Test Data (Average vs. Average) 100 Prediction Interval (95% Confidence) ,
Regression Line o
o 1000 2000 3000 4000 5000 6000 7000 8000
Compressive Strength (psi)
Figure 28 - Compressive vs. Flexural Strength (Paired Test Data from the Oklahoma Transportation Authority)
23

15
~ 10 c OJ :::l CT i!'
lJ.. 5
o
0.0 0.1 0.2 0.3
Coefficient of Variation (COV)
Figure 29 - Histogram of Within-Batch Coefficients of Variation for Flexural Strength Tests
0.0 0.1 0.2 0.3
Coefficient of Variation (COV)
Figure 30 - Histogram of Within-Batch Coefficients of Variation for Pullout Tests
>" c OJ :::l
20
CT 10 i!'
lJ..
o
0.0 0.1 0.2 0.3 Coefficient of Variation (COV)
Figure 31 - Histogram of Within-Batch Coefficients of Variation for Direct Tension Tests
24

0.0 0.1 0.2 0.3 Coefficient of Variation (COV)
Figure 32 - Histogram of Within-Batch Coefficients of Variation for Modified Pullout Tests
25

Flexural-Stren th Qualit Control Procedures and Protocols '
Overview This section includes discussion on several different methods for monitoring or controlling the flexural strength of concrete pavements during construction (flexure, compression, splitting tension, direct pullout, modified pullout, and direct tension). Of these methods, the direct pullout, modified pullout, and direct tension were investigated as part of this study. Commentary on the other methods is provided to help readers consider the numerous alternatives when deciding upon a method for flexural-strength quality control.
Table 6 summarizes the investigators' observations and judgments concerning the suitability of each test method to meet the five criteria for effectiveness detailed in the Introduction of this report. As can be seen from the table, the most promising test methods are the direct tension and splitting tension tests, with the direct tension test being preferable due to its closer similarity to the flexure test in terms of failure modes.
Table 6 - Comparison of the Suitability of Various Test Methods for Flexural Strength Quality Control
Test Method Predictive
Field-Cast Beams Tested in Flexure
Robust in the Field
Although the Federal Aviation Authority and other federal agencies routinely rely upon and use field-cast beams for verification of in-place flexural strengths, very few state agencies follow this practice. The primary reason for avoidance of this method by state agencies appears to relate back to the susceptibility to error and difficulties with handling the heavy specimens as discussed previously in this report. The investigators recognize this lack of robustness of field-cast beams and, as such, recommend that their use be limited to those instances where the quality of casting, handling, and testing of the specimens can be properly monitored and assured.
Field Verification using Maturity The concrete maturity method has a major limitation. This limitation follows from the fact that a mix-specific strength-maturity relationship must be determined for each mix design. Then, if anything changes in terms of the quality or relative proportions of the raw materials, the previously-determined strength-maturity curve may no longer be valid (as in, strength predictions based on the initial strength-maturity curve may prove erroneous).
Despite this severe limitation, or rather, because of this severe limitation, the investigators firmly recommend the use of maturity methods as a means for controlling concrete quality. This
26

recommendation follows from the fact that this severe limitation of the maturity method can be advantageously used to signal whenever any changes from the original mix design have occurred. The following sample protocol describes how to use this limitation as an advantage:
1. Determine the strength-maturity relationship curve for each mix design to be used on a project. The testes) for strength can be flexure, compressive, pullout, splitting tension, direct tension, and/or any other test method that provides a physical test of the concrete's strength (see Figures 12 - 15 for example curves).
2. During paving operations, periodically (e.g. at the beginning, middle, and end of each day's placement for each mix design) place a maturity sensor into the concrete pavement.
3. Cast three (3) verification specimens using concrete sampled from the same location where the maturity sensor was placed into the pavement.'
4. Instrument one of the verification specimens with a maturity sensor. '
5. Periodically check the maturity of the pavement.
6. When the maturity of the pavement indicates that the pavement has reached the required strength, note the maturity value of the verification specimens. '
7. Measure the strength of the verification specimens using the same strength-testing methodes) performed during Step 1. '
8. Compare the strength of the specimens (as measured by conventional test methods) to the strength values predicted by the specimen maturity value (using the mix-specific relationship curve from Step 1).
9. If the actual versus predicted strengths compare favorably to each other:' the concrete placed into the pavement has been verified (i.e. the concrete that was supplied to the project at that particular location is truly representative of the concrete mix approved for the project). The pavement's predicted flexural strength (as determined in Step 6) can be relied upon and the Contractor's payment for that section of concrete can be processed.
10. If the actual versus predicted strengths do not compare favorably to each other, the probable cause should be immediately investigated:'
a. If the actual strengths are considerably higher than the predicted strengths, an investigation should still be performed to identify the cause. However, the pavement's predicted flexural strength (as determined in Step 6) can still be relied upon and the Contractor's payment for that section of concrete can be processed.
b. If the actual strengths are considerably lower than the predicted strengths, an immediate investigation should be performed to identify and correct the cause. In this instance, something negative has changed either with the raw materials supplied to the project, the batching process, the relative proportions of the raw materials, or the testing procedures. As such, the pavement's predicted flexural strength (as determined in Step 6) should NOT be relied upon and the Contractor's payment for that section of concrete should not be processed until the quality of the concrete as placed is determined to be adequate and the cause of the deviant strength measurements is identified and corrected.
27

*
c. If the source of the observed differences cannot be readily determined and corrected, a new strength-maturity relationship curve should be developed to account for the unexplainable changes that have occurred with the mix.
NOTE: If the chosen strength-measurement test is an in-situ test, such as the pullout test, then Steps 3, 4, and 6 can be skipped and the testing of Step 7 should be performed in-situ.
*. NOTE: For Steps 9 and 10, rather than simply using a threshold value to determine whether or not the actual and predicted values "compare favorably to each other", the investigators recommend the use of statistical process control (SPC) charting where each actual-minus-predicted direct tension strength value is successively plotted on an SPC chart. Two significant benefits arise from this use of SPC charts. First, the control limits calculated for the SPC chart can be used as a quantitative assessment of the reliability of the strength-from-maturity measurements. Second, that reliability level can be trusted as long as the process remains in statistical control (i.e. as long as none of the standard SPC "alarm conditions" occur). In addition, SPC charting creates a more robust environment for detecting unwanted changes because it takes into consideration all previous test data rather than simply relying upon the latest test value. A detailed discussion of the methods and benefits of SPC charting as a quality control tool is beyond the scope of this report. However, a number of good references are available on the topic (e.g. Shewhart 1931, 1986).
Field-Cast Cylinders Tested in Splitting Tension As mentioned previously, the Federal Aviation Authority (FAA) relies upon field-cast beams for verification of flexural strengths during construction. However, the FAA, in recognition of the aforementioned limitations of field-cast beams, has issued an engineering bulletin describing the procedures for referee testing whenever there is "reasonable doubt as to the ,validity of the normal flexural strength acceptance tests." (Joel 2002) To resolve such disputes, the FAA prefers to rely upon the splitting tension test performed on cores extracted from the pavement structure because
the failure mode [of the splitting tension test] is somewhat similar to flexural failure. A correlation between compressive strength and flexural strength could be used, however it is felt that the difference in the failure modes between compressive and flexural failure make compression testing less attractive as a referee test. (Joel 2002)
Whereas the splitting tension test fails instantaneously once the relatively uniform tensile stresses along the vertical diameter of the specimen exceed the tensile strength of the concrete, the investigators agree that the failure mode of the splitting tension test more closely resembles the type of failure experienced by beams tested in flexure than does the standard compressivestrength test, making it the more preferable of the two. However,
28

[i]n contradistinction to concrete failure under direct tensile load, in the splitting test the major part of the coarse aggregate particles is usually broken along the surface of failure. This may be due to the fact that the tensile stresses have their high values in the splitting specimen within a narrow strip along the central vertical plane .. .. Also, when the tensile strength of a cement paste has been increased, for instance by epoxy modification, the splitting strength of the concrete containing this cement paste shows less increase than the flexural or direct tensile strength. (Popovics 1998, pp. 118-9)
Figures 33 and 34 show an example of coarse aggregate pullout that occurs during a flexure test whenever the bond between the paste and the aggregate is weak relative to the strength of the paste. Whereas the splitting tension test may not adequately reflect this type of failure, certain quality problems, particularly those that affect the quality of the bond between the paste and the coarse aggregate, may go undetected.
Figure 33 - Example of Coarse-Aggregate Pullout (Beam Tested in Flexure)
29

Figure 34 - Close-Up View of Coarse-Aggregate Pullout (Beam Tested in Flexure)
Embedded Inserts Tested in Direct Pullout Pullout testing with embedded inserts showed good predictive correlation to flexural strength (R2 = 80%). However, the fact that the intercept coefficient of the regression line was non-zero implies that at some point the relation between pullout strength and flexural strength will become distinctly non-linear. A non-linear relationship suggests that the two tests are not truly measuring the same property. Also, the pullout tests conducted as part of this study showed a relatively hjgh coefficient of variation (12.3%). The high coefficient of variation was most likely due to the relatively small volume of concrete tested by each pullout test. . In addition, the existence of any sizeable piece of coarse aggregate crossing the conical failure surface appears to contribute to the variability of the test. The investigators believe a larger diameter embedded disk with a subsequent increase in the depth of embedment would address both these problems and produce more consistent results.
Embedded Inserts Tested in Modified Pullout Like the pullout test, the modified pullout test exhibited good predictive correlation to flexural strength (R2 = 83%) but a high coefficient of variation (13.1 %). However, unlike with the pullout test, the regression coefficient for predicting flexural strength for the modified pullout test was zero, suggesting that the modified pullout test may, in fact, be measuring the same properties as the flexure test.
The maturity curves developed for the modified pullout test produced troublesome results, with most of the curves being relatively flat or even showing decreasing strength with increasing maturity. This problem suggests that the modified pullout test as currently configured is not robust enough to be relied upon as a field quality control tool. However, the investigators
30

believe the modified pullout test has the potential to be reconfigured to eliminate these problems and, in such instance, could prove to be a suitable in-situ test for monitoring or controlling flexural strength.
Direct Tension Testing During this study, the investigators tested nearly 200 beams in flexure while performing over 200 pullout tests, over 600 direct tension tests, and over 100 modified pullout tests. As a result of this testing and a thorough analysis of the resulting data, thf; investigators have concluded that the direct tension test has the highest potential as a means for reliable flexural strength quality control. The following reasons form the basis for this conclusion:
• Direct tension tests exhibit a failure mode with the same characteristics as the flexure test failure mode, namely:
• Instantaneous failure occurs as soon as induced tensile stresses exceed the tensile strength of the concrete (i.e. with no bridging or significant redistribution of stresses or strains),
• Location of the failure is not concentrated along a single line or plane within the specimen, but is allowed to occur across a relatively large area or volume of constant stress, and
• Aggregate-pullout failures occur whenever the bond between the paste and the aggregate is relatively weak (see Figure 35),
• Direct tension tests demonstrated good predictive capability for flexural strength (R2 = 79%),
• Direct tension tests demonstrated reasonable repeatability and reproducibility (coefficient of variation = 7.8%),
• Direct tension tests demonstrated robustness to loss of surface moisture prior to testing, and
• Direct tension tests do not require large specimens or specimens that are prone to damage during casting, handling, or testing.
However, despite being the most promising test method, the direct tension test is not without limitations. At the outset of the study, the investigators were hopeful that the direct tension test would have the potential to be applied as in in-situ method for flexural strength quality control. However, this hope vanished as the direct tension tests began producing a significant number of breaks at the interface between the concrete and the adhesive (with over 50% of all direct tension tests resulting in surface breaks). Figures 36 and 37 show a typical surface break.
31
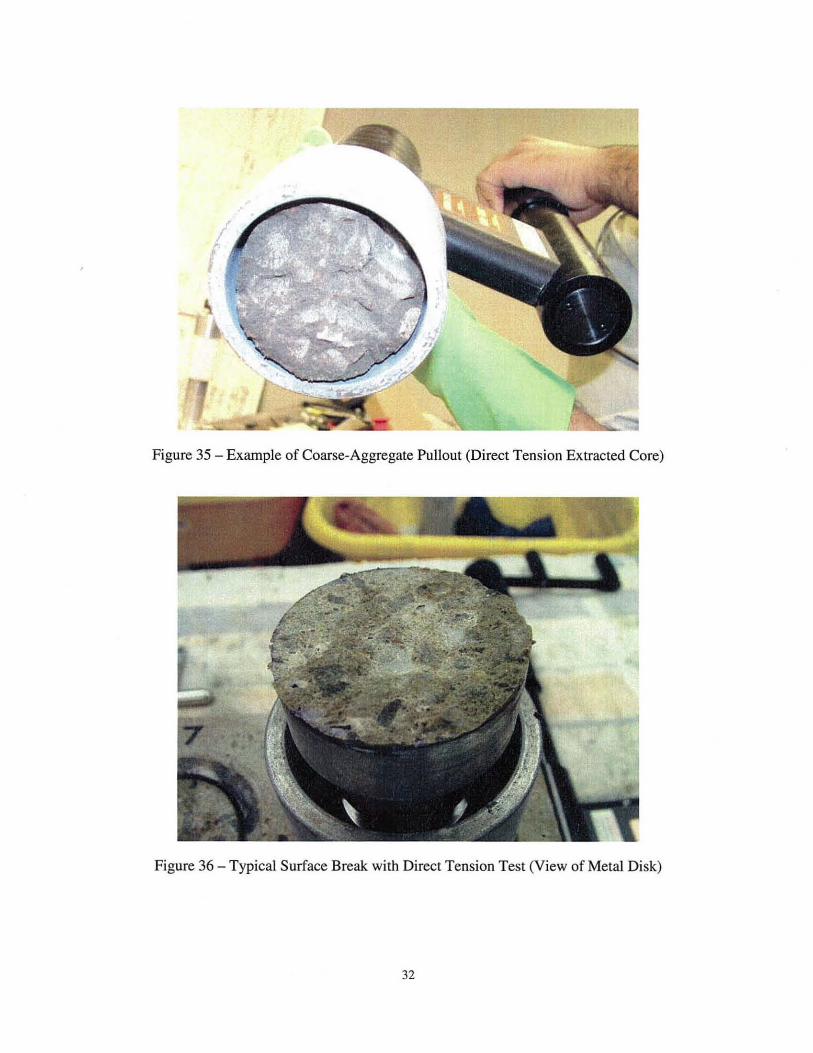
Figure 35 - Example of Coarse-Aggregate Pullout (Direct Tension Extracted Core)
Figure 36 - Typical Surface Break with Direct Tension Test (View of Metal Disk)
32

Figure 37 - Typical Surface Break with Direct Tension Test (View of Concrete Surface)
The investigators consulted multiple times with Germann Instruments (the manufacturer of the direct tension test equipment) as well as an adhesives chemist in an attempt to solve this problem. In addition, the investigators conducted several multi-day, multi-batch designed experiments using several different surface preparation procedures and different adhesive mixtures. All such attempts failed to produce a method wherein the occurrence of surface breaks could be consistently prevented.
After failing to isolate and correct this problem, the investigators postulated that the problem may not be with the method of adhering the steel disks to the concrete, but rather with the concrete itself. The investigators postulated that the concrete was simply weaker at the surface, thus resulting in the surface of the concrete being the "weakest link" during the direct tension test. As such, the depth of cut with the diamond planing disk was increased in an attempt to get beyond any weak surface concrete. However, this did not eliminate the problem of surface breaks.
In the end, the investigators hypothesized that the problem was not simply a weak outer layer, but rather a strength gradient throughout the specimen, whereby the concrete is strongest in the centroid of the specimen and progressively weaker outward from the centroid. If this were true, the direct tension partial cores would tend to break at the surface irrespective of the cutting depth with the planing disk. This hypothesis (depicted graphically in Figure 38) is consistent with the theory behind concrete maturity methods, which states that areas within a concrete structure or specimen subjected to higher temperatures will gain strength more rapidly than those at lower temperatures. Whereas the hydration of cement in concrete is an exothermic reaction, a concrete
33

mass will attain higher temperatures in its center until the heat transfer mechanisms establish a state of equilibrium. As such, a temperature gradient will most likely be experienced during the initial hydration period, wherein the interior of the specimen would be hottest, thus gaining strength more quickl y and thus creating a strength gradient.
With the final set of direct tension test specimens, the investigators conducted a mini-experiment to test this hypothesis. A 14-inch diamond saw blade was used to cut the specimens, thus exposing the interior of the concrete. The direct tension tests were then performed on the exposed inner surfaces. Although this mini-experiment was not comprehensive enough to be able to conclusively confirm the hypothesis, the results were revealing. Prior to sawcutting the specimens, over 50% of the direct tension tests resulted in surface breaks. During the sawcutting mini-experiment, the two direct tension tests performed on outer surfaces of the concrete both resulted in surface breaks; however, the eighteen direct tension tests performed on inner surfaces all resulted in non-surface breaks.
Whereas the investigators were only able to eliminate the high occurrence of surface breaks by testing interior surfaces of the concrete specimens, the use of the direct tension test as an in-situ method for monitoring or controlling flexural strength appears infeasible at this time. However, the investigators have initiated discussions with the equipment manufacturer (Germann Instruments) to possibly develop a device to reduce the cross section of the partial core across a central zone as shown in Figure 39. This reduction in cross section would restrict the failure to occur in that central zone rather than at the pavement surface, thus eliminating surface breaks except for those instances where the surface of the concrete is exceptionally weak (such as from extremely poor curing practices or overfinishing of the pavement surface).
Steel Disk Glued to Partial Core
Depth of Cut by Planing Disk Surface of
Weakest Concrele at Disk Interface
Figure 38 - Hypothesis for Explaining High Frequency of Surface Breaks During Direct Tension Tests
34

As such, an additional advantage may exist wherein the resulting in-situ direct tension test could also be used as a means for verifying the adequacy of curing protection and finishing operations. In other words, if inadequate curing protection and/or overfinishing leads to a severely-weakened outer layer of concrete (and thus a future surface-durability problem), the in-situ direct tension test may be helpful in identifying those situations.
Steel Disk Glued to Pavement Surface
Sawcut Performed Around Steel Disk to
Surface of Concrete Pavement
Section to Restrict Failure to this Zone
Figure 39 - Proposed Modification to Direct Tension Test
Field-Cast Cylinders Tested in Direct Tension Whereas the direct tension test as an in-situ quality control method does not appear feasible at this time, the investigators developed a specimen-based procedure for applying direct tension as a method for flexural strength quality control. Whereas standard 6-inch by 12-inch cylinder specimens are easy to cast in the field and easy to handle and transport, the investigators recommend the use of cylinder specimens for this procedure.
The field portion of the procedure involves casting and curing cylinder specimens the same as would be done for compressive-strength quality control. If maturity methods are to be used as part of the quality control program, maturity sensors should be placed as mentioned in the section entitled Field Verification using Maturity .
The direct tension testing itself would take place in a laboratory after the specimens have reached the desired maturity, which can be based on embedded maturity sensors as detailed previously or can be based on a standard curing regimen, such as 7- or 28-days under standard curing temperatures. In the laboratory, the following procedure would be performed:
I. Cut each cylinder specimen in thirds as depicted in Figure 40. (This provides four exposed surfaces for direct tension testing per cylinder.)
2. Dry the exposed interior surfaces with a hot-air gun until the surface is completely visibly • dry.
35

3. Glue a steel disk to the center of each interior surface.
4. After the glue has visibly hardened in the mixing container, place the coring equipment over the steel disk, clamp the coring equipment securely to the concrete surface, then core to a depth of I Y2 inches.
5. Remove the coring equipment, attach the coupling to the steel disk, position the counterpressure ring, and attach the hydraulic pull machine.
6. Apply a steadily-increasing load at a rate of 0.1 to 0.5 leN per second until failure .
• NOTE: If difficulty is encountered with adhesion of the steel disk to the concrete, perform the following prior to Step 2: Apply 5 to 10 milliliters of muriatic acid (i.e. 31.45% hydrochloric acid) to the exposed concrete surface, let stand for 30 seconds, then thoroughly rinse. Exercise extreme care and take necessary safety precautions; hydrochloric acid is extremely corrosive and caustic.
Direct-tensile test location (typ)
------.. ... '
, Sawcut
location (typ)
Figure 40 - Recommended Direct Tension Test Locations on Conventional 6-inch by 12-inch Cylinder Specimens
Direct-tensile test location (typ)
Sawcut location (typ)
Figure 41 - Recommended Direct Tension Test Locations on Beam Specimens
36

Conclusions and Recommendations
Conclusions and Recommendations The investigators offer the following conclusions and recommendations:
• By virtue of their good predictive correlations to flexural strength (R2 = 80%; 79%), direct pullout and direct tension tests appear suitable as alternative means to monitor flexural strength during construction without the need for field-cast beam specimens.
• Due to questionable strength-maturity results and a high coefficient of variation, the modified pullout test, as currently configured, does not appear suitable as a method for flexural strength quality control.
• Of the three alternative tests methods investigated, the direct tension test exhibited the highest level of suitability as a replacement for field-cast beam specimens due to:
• the close similarity of its failure characteristics with the flexural test, and • its relatively low coefficient of variation (7.8%).
• A comprehensive flexural strength quality control program should make beneficial use of the maturity method to help signal detrimental changes to the quality and/or proportions of the raw materials incorporated into the concrete pavement.
• The issue of surface-breaks with respect to the direct tension test has not been fully resolved. The investigators recommend additional research to more fully determine the causes of surface breaks and suitable means for preventing them.
• Until the causes and prevention of direct tension surface breaks can be more fully investigated, direct tension testing performed for field quality control should include the casting of conventional 6-inch by 12-inch cylinder specimens for use as direct tension test specimens. The cylinder specimens can be sawed into halves or thirds just prior to testing, with the direct tension tests subsequently performed on the inner surfaces of the cut cylinders.
• The investigators hypothesize that direct tension surface breaks, when they occur, are indicative of a strength gradient and/or weak outer layer of the concrete. Further investigation is necessary to confirm or reject this hypothesis. As such, the direct tension test may provide an additional advantage as a means for verifying the adequacy of curing protection and finishing operations for concrete pavements during construction.
Recommendations for Future Research The investigators offer the following recommendations for future research:
• Surface-durability test methods - as mentioned above, the investigators recommend further research into the causes and prevention of direct tension surface breaks. As
37

discussed previously, the investigators hypothesize that a strength gradient and/or a weak outer concrete layer is the primary cause of such surface breaks. As such, the investigators recommend a comprehensive study to not only investigate the causes of direct tension surface breaks, but, in so doing, to also investigate the suitability of the direct tension equipment and procedures as a quality-control tool in determining the adequacy of curing protection and concrete finishing operations, thus helping to predict and/or prevent surface-durability problems.
• Field demonstration - the investigators recommend one or more pilot or trial projects be conducted wherein direct tension, splitting tension, and/or pullout tests (as detailed in the section entitled Flexural-Strength Quality Control Procedures and Protocols) be utilized for flexural strength quality control on an actual concrete paving project to demonstrate the practicality of the method(s). Ideally, the field demonstration would also include conventional methods of flexural strength quality control (e.g. field-cast cylinders tested in compression and/or field-cast beams tested in flexure) for comparative purposes.
38

References AASHTO (1993), AASHTO Guidefor Design of Pavement Structures, Washington, DC: American Association of State Highway and Transportation Authorities.
AASHTO (1998), Supplement to the AASHTO Guide for Design of Pavement Structures, Washington, DC: American Association of State Highway and Transportation Authorities.
ASTM C 33 - 02a. (2003). "Standard Specification for Concrete Aggregates." 2003 Annual Book of ASTM Standards Vol. 04.02. West Conshohocken, PA: ASTM International.
ASTM C 39 - 01. (2003). "Standard Test Method for Compressive Strength of Cylindrical Concrete Specimens." 2003 Annual Book of ASTM Standards Vol. 04.02. West Conshohocken, PA: ASTM International.
ASTM C 78 - 02. (2003). "Standard Test Method for Flexural Strength of Concrete (Using Simple Beam with Third-Point Loading." 2003 Annual Book of ASTM Standards Vol. 04.02. West Conshohocken, PA: ASTM International.
ASTM C 496 - 96. (2003). "Standard Test Method for Splitting Tensile Strength of Cylindrical Concrete Specimens." 2003 Annual Book of ASTM Standards Vol. 04.02. West Conshohocken, PA: ASTM International.
ASTM C 900 - 01. (2003). "Standard Test Method forPullout Strength of Hardened Concrete." 2003 Annual Book of ASTM Standards Vol. 04.02. West Conshohocken, PA: ASTM International.
ASTM C 1074 - 98. (2003). "Standard Practice for Estimating Concrete Strength by the Maturity Method." 2003 Annual Book of ASTM Standards Vol. 04.02. West Conshohocken, PA: ASTM International.
Joel, R. N. (2002). "Referee Testing of Hardened Portland Cement Concrete Pavement-Percent Within Limits (PWL) Revision." Engineering Brief No. 34A. Washington, DC: Federal Aviation Authority.
Neville, A. M. (1996), Properties of Con crete, 4th ed., London: Pitman Publishing.
Petersen, C. G. and Poulsen, E. (1993), Pullout testing by LOK-test and CAPO-test: with particular reference to the in-place concrete of the Great Belt Link, Revised ed., Virum, Denmark: Dansk Betoninstitut NS (Danish Concrete Institute NS).
Popovics, S. (1998), Strength and Related Properties of Concrete: A Quantitative Approach, New York, NY: John Wiley & Sons.
PCA (1984), Thickness Designfor Concrete Highway and Street Pavements, Skokie, IL: Portland Cement Association.
39

Shewhart, W. A. (1931), Economic Control of Quality of Manufactured Product, New York, NY: D. Van Nostrand Company.
Shewhart, W. A. (1986), Statistical Methodfrom the Viewpoint of Quality Control, New York, NY: Dover Publications.
40

APPENDIX .1 1200 - -.. ,
o "" - .. m •
I
• <4061 0 , I
I ! ' I 1000
, f t
,~ 1- f I + ~ 800
~
'" 0. t- O ' T 0
~ 600
I I • ~ i i . I 'l! , • Jl ... 400 •
t
200 +
I
o 100 1000 10000 100000
Maturity ('C-H)
Figure 42 - Flexural Strength vs. Maturity for 4061 Mixes
40 -.. , • 4061
",,' 0 ,
35 • .(()61 0
30 : t t *
. ~
! j I t
25 Z ~ m 5 20 ... 3 ..
15
10
. ~ t ~: . ~ -t +
t V r i I r 0 . ....-----t11 i
r 5
, t ~ I
i 0 100 1000 10000 100000
Maturity ("C-H)
Figure 43 - Pullout Test vs. Maturity for 4061 Mixes
41

20
18
16
14
Z 12 e • ~ 10 & ~ 8
6
4
2
o 100
20
18
16
14
Z 12 e • e 10 & ~ 8
6
4
2
o 100
. <I,,, l- I ~
• 4061 - 40610
• 40610 I • • I I
f , , t
I ,
L /I
• ./ I • f .... I • ~
l. .v ,/ t 0 I
• _t I
I ! 1 I ,
~ I t I l- t t I- I- ~ t
t j I ~ r : I l- I- t t I ~ ~I I j~ + I I
1000 10000
Maturity ('C·H)
Figure 44 - Direct Tension vs. Maturity for 4061 Mixes
.
"" o "'"
"')0 • -40610 i-r . +
! 1= ~ .. t . :
+ I • I •
j
-~ • V • ", t
• • .t:: • • 0". -
• oT t 1=' 0-.
I- + t ~
1000 10000
Maturity ('C-H)
Figure 45 - Modified-Pullout Test vs. Maturity for 4061 Mixes
42
t ,
• .~
+
I .~
t , I , I ' ~
I I~~
t j- I~
, I
100000
+
i t
i -I :
, ; :
; . I
,
t
I-
+ t
100000

1,000
900
800
.. 700 1>
" a. 600 c
~ I I
(f) -"l! sao , • .. "- 400 • '" E • 300 ~
, ·e , I ,
200
100 Y _ 10.55x + 296.44
I R' 1.00
:
5.0 10.0 lS.0 20.0 2S.0 30.0 3S.0 40.0 4S.0 so.o Average Pull Force (kN)
Figure 46 - Pullout Test vs. Flexural Strength for 4061 Mixes
1,000
900 I . il :
800
.. 700 1> " a.
600 c
~ •
"l! soo , , • • ii: 400 • • '" f • > 300 '"
j I . I I , I : .
200
100 y 29.96x + 151. 69 =
R2 _ 0.92 -
2.0 4.0 6.0 8.0 10.0 12.0 14.0 16.0 18.0 20.0
Average Pull Force (kN)
Figure 47 - Direct Tension vs. Flexural Strength for 4061 Mixes
43

1,000
900
I -"---+c' 800
;.- 700 a ~
'& 600 c
~ <II
i! 500 , • ., .. 400 8. ~ • , ~ 300
200 ,
100 y _ 24.S1x + 25 9.95F R2 = 0.98 f-
2.0 4.0 6.0 8.0 10.0 12.0 14.0 16.0 18.0 20 .0
Average Pull Force (kN)
Figure 48 - Modified Pullout Test vs . Flexural Strength for 4061 Mixes
1200 - .
I~ 3057'"
, 3057Cl
• 3057 ~ f I
1000 , I I
" 800
+ + 1 ~ ,
a ~ I + I I
'& • e 600 Iii I I
E , • ., .. 400
•
---I • ".:f:d I Y'. -~
+ I
~ + ~ I ,
1 + + + t ~ ~ t
200
+ o 100 1000 10000 100000
Maturity ("C·H)
Figure 49 - Flexural Strength vs. Maturity for 3057 Mixes
44

40
35 B 30
25 Z ~ ~
~ 20 u.
"3 0-
15
10
5
o 100
20
18
16
14
Z 12 ~ ~
~ 10
~ 8
6
4
2
o
= =
100
-
305"" 3OS7Cl
• "'''
• -
I • • ,
• 0 O·
I •.
1000 10000 100000
Maturity ("C-H)
Figure 50 - Pullout Test vs_ Maturity for 3057 Mixes
-3057C2
JO Sl e1
• 3057
: t . ~
* .. t (
• .. i , • ~ I j
.. .
• ~t. A - • L
. / . r- : I t I i
• o. : .. I
: I I
I I
t I ,
1000 10000 100000
Maturity ("C-H)
Figure 51 - Direct Tension vs_ Maturity for 3057 Mixes
45

20
18 s. 16
14
Z 12 i!. ~
~ 10 & ~ 8
6
4
2
o 100
1,000
900
800
>r 700 e :;
'" 600 c e ;; e 500 , • • ;;:
400 • '" ~ • ~ 300
200
100
-I ~ I I +
3OS7C2
3OS7Cl
3('" 1 ~ , 1 ~ ~ . 1 J 1 .j. + ! H
~ t +- +- I
I ,
I I
+ ,
d t t 0 I .+
~ , • I·
t i. • 1:.. . k I ,/" • • I
• I I I t t
L L I- ~ 1 t t T I +- +- t +-+
t I r .;: ~ I j 1 I I
. r 1 1 +- + ~ . 1
1000 10000 100000
Maturity (OC-H)
Figure 52 - Modified Pullout Test vs. Maturity for 3057 Mixes
1 t .
.' ,
• '-• f j ,
I Y _15.86x + 194.50 I' A' - 0.91
5.0 10.0 15.0 20.0 25.0 30.0 35.0 40.0 45.0 50.0
Average Pull Force (kN)
Figure 53 - Pullout Test vs, Flexural Strength for 3057 Mixes
46

1,000
900
-800
" 700 .e, :; '" 600 c ~ t in E 500 , • • • u: 400 •
~
'" ; > 300 '"
•
200
100 y 31.S0x + 120.55
I I t I ; I R2 .. 0.94
2.0 4.0 6.0 8.0 10.0 12.0 14.0 16.0 18.0 20.0
Average Pull Force (kN)
Figure 54 - Direct Tension vs. Flexural Strength for 3057 Mixes
1,000
900 , I ,
800
" 700 .e, ~
1> 600 c
~ E 500 , = u: 400 • '" ; > 300 '"
i I I ,
200
Y _ 62.B2x· 10 .00 = 100 R2 _ 0.72 r-----
2.0 4.0 6 .0 8 .0 10.0 12.0 14.0 16.0 18.0 20.0
Average Pull Force (kN)
Figure 55 - Modified Pullout Test vs. Flexural Strength for 3057 Mixes
47

1200
1000
" 800
.eo .., c. c
~ 600
E ~ x m u: 400
200
o
50
45
40
35
Z 30 e
100
• ~ 25 l-u.
~ 20
15
10
5
o 100
-757_
• 757_ 757+
" 751.-, ,
757
• 157 • 7S7F
• 7S7F V • • • ., : ' -
• • . ~ ~1t-~. • i ~ ~ ,-. . r:.. • ~
t _I: • .. ,
• t + , r
I I I 1 1
t t ' ,- t-
, :
i 1 :
1000 10000 100000
Maturity ( "(>H)
Figure 56 - Flexural Strength vs_ Maturity for 757 Mixes
-751_ •
• 757 .... • 151 .. .. 157+- • 757 01- • • 157 . ,., • ,
757F • 757F .:r===+.
, ,.---. j: , I .. " • • • , - , • T -" ..
. --'7 _ ~=;=n.r:: • • l ~
r .,.t('"L"" • ., .+ • •
~ , • 1 • • I • 1 ~ • • • , • ~ , v/ + ~
~ " .- ," , + +
1 •
1 I' ,
+ + I : •
1000 10000 100000
Malurity ("C-H)
Figure 57 - Pullout Test vs, Maturity for 757 Mixes
48

20
18
16
14
Z 12 ~ • ~ 10 &. ~ 8
6
4
2
o 100
20
18
t6
14
Z 12 ~
• ~ 10 ... '5
8 a.
6
4
2
0 100
757 .... • 757_
- 757+ ... 751.
- 757 • 751
"" • 157F
757_ • 757 ....
757 .. ... 757+
757 • 157 7S7F • 151F
-~ I I I I -
L ~. . ~ ; : • - t - -.
" • c 1"1 °L / - ~ l. "I-!i • t-"
I Y ,. ~ a.!": ~~ ":-: : ~ 1;""'-- ,. '" '-t • • . . --+-, * ' • !:
~ I I • H - -t t • I
• .l Tt :
I , I I , I
, j I I I I , : I
.u ~ + t I ~ t I I I t ~ I I
.. ~ t- • + . + j I
1000 10000
Maturity (oc;-H)
Figure 58 - Direct Tension vs. Maturity for 757 Mixes
i
r 1
I (
; j
:
,
I
; .•
-
•
..L
0
I
I
,
1000 Maturity (oc;-H)
-
~ "
,
t I
• -...,
• I
, ,
, j
~
~
Figure 59 - Modified Pullout Test vs. Maturity for 757 Mixes
49
I
t+
I 1 I
I
I
I I t 1 ~ I
t I I
I I I , t l + :j: t + +
100000
t . .
- t
~
:
toooo

1.000
900 •
• 800 "- f- .
'" 700 10 • ,-1- • ~
C, 600 c
g <J)
~ 500 , • ;1:
400 • ~ ~ • > 300 '"
200
Y 6.0Bx + 536.77 100 R' 0.36
• ,
5.0 10.0 15.0 20.0 25.0 30.0 35.0 40.0 45.0 50.0
Average Pull Force (kN)
Figure 60 - Pullout Test vs . Flexural Strength for 757 Mixes
1.000
900 , + 800 •
;;; 700 10
• , io +
~ • C, 600 c •
E ;;; ~ 500 , • • u: 400 • ~ ~ • ~ 300
200
y 35.03x + 239.43 100 R2 _ 0 .47
2.0 4.0 6.0 8.0 10.0 12.0 14.0 16.0 18.0 20.0
Average Pull Force (kN)
Figure 61 - Direct Tension vs. Flexural Strength for 757 Mixes
50

1.000
900
800 -0; 700 <!o :; '" 600 c e I I • iii "i! 500 , • • u: 400 • '" e • ~ 300
.1 I I t I 1
200
100 y ::c -128.33x + 2148.13 ~ R2 ,", 1.00
2.0 4.0 6.0 8.0 10.0 12.0 14.0 16.0 18.0 20.0 Average Pull Force (kN)
Figure 62 - Modified Pullout Test vs. Flexural Strength for 757 Mixes
1000 y _ O.01x + 683.96
900
800
700
R2 _ 0.06
I .l
I I I .
I t • .. L
1 t I 1 I I
';; .eo 600 "" '5> c e 500 iii
I .
E 400 ,
• • . . u:
300 •
200 .' .
1 • Paired Test Data (Average vs. Average)
100 Prediction Interval (95% Confidence) . I . - Regression Line
0 o 1000 2000 3000 4000 5000 6000 7000 8000
Compressive Strength (psi)
Figure 63 - Compressive vs. Flexural Strength for Mix OTA-A I
51

1000
900 y IZ O.05x + 498.52 1 I j I R' 0.42
800
700 .. ,!;
600 :;
I I I r-- .p~
r I ~ 1 ,
--+---1 '" c E 500 Iii E ~ 400 ~
£ 300
! t-1 ! I ~ . I ;
200 ff 1
I , , • Paired Test Data (Average vs. Average)
100 Prediction Interval (95% Confidence)
Regression Line 0
o 1000 2000 3000 4000 5000 6000 7000 8000
Compressive Strength (psi)
Figure 64 - Compressive vs. Flexural Strength for Mix OTA-A2
1000 , y - O.05x + 494.11
900 R2:c 0.54
800
700 .. . ! L p- •
t > ... y • . I
I I • I I I ~ ,!;
600 ~
,
C. c E 500 Iii E
400 ~ ~ ~
lL
t I r : ,
I i ~ I : j 1 . ,
300 , ,
200
• Paired Test Data (Average vs. Average) 100 Prediction Interval (95% Confidence)
Regression Line 0
o 1000 2000 3000 4000 5000 6000 7000 8000
Compressive Strength (psi)
Figure 65 - Compressive vs. Flexural Strength for Mix OTA-A3
52

1000
900
y '" O.02x + 608.96 1 t ~ [ 1 I t II j III R2 0.04
800
700 0; ~ 600 ""
• • I I
1 . IT ' T . 1 •
I .. c
~ 500
E 400 ~
w ~
ii: 300
200
I 4 .
I I
t I
• Paired Test Data (Average vs. Average) 100 Prediction Interval (95% Confidence)
Regression Line o , , ,
o 1000 2000 3000 4000 5000 GOOD 7000 8000
Compressive Strength (psi)
Figure 66 - Compressive vs. Flexural Strength for Mix OTA-A4
1000
900
w -O.D8x + 267.01 R2 _ 0.76
800
700 0;
.
! . ,..-/"
j ---r • • .... "; I ....- :...- • ............ ....... • ~ 600 "" .. c e 500 0;
E 400 ~
w j! ...
............. ;- ~ V ........ >'
300
200
• Paired Test Data (Average vs. Average) 100 Prediction Interval (95% Confidence) ,
Regression Une 0
o 1000 2000 3000 4000 5000 6000 7000 8000
Compressive Strength (psi)
Figure 67 - Compressive vs. Flexural Strength for Mix OTA-A5
53

1000
900
y '" O.06x + 485.69 f ,..-!=-- I I I R2-0.17 ,-- +
• 800 •
• 700
7; Eo 600 ""
I • t,....:----- + • ...;-
C. c • ~ 500
e 400 ~
k ~
u: 300
200
, t ,
, • Paired Test Data (Average vs. Average)
100 Prediction Interval (95% Confidence)
Regression Line 0
o 1000 2000 3000 4000 5000 6000 7000 8000
Compressive Strength (psi)
Figure 68 - Compressive vs. Flexural Strength for Mix OTA-B
1000 y _ O.09x + 279.30
900 R' 0.60 ,
800
700 ;;
I , I !.
------ • ~ -- • ·....<r , ~
+,/" • Eo 600 ""
,
C. c e 500 iii e ~ 400 k
t ' t /'
~
u: 300
200
• Paired Test Data (Average vs. Average) 100 Prediction Interval (95% Confidence)
Regression Line 0
o 1000 2000 3000 4000 5000 6000 7000 8000
Compressive Strength (psi)
Figure 69 - Compressive vs. Flexural Strength for Mix OTA-C
54

1000
900
y "" O.09x + 232.99 H ~ r j j j j I R2 _ 0.54
800
700 0; .Eo 600 ""
t I t
~ r r t ........... r. I j-
'6> c • e 500 iii
,
E 400 ~ • ~
u: 300
200
,
I I
,. I I
l I
I I
• Paired Test Data (Average vs. Average) 100 Prediction Interval (95% Confidence)
Regression Line o , ,
o 1000 2000 3000 4000 5000 6000 7000 8000
Compressive Strength (psi)
Figure 70 - Compressive vs, Flexural Strength for Mix OTA-D
1000
900
y - O.06x + 440.90 , R' 0.51
800
700 0;
~ 1 ....J.-"'" ~ ,
j . • r 1....- i-"
I I ,... ...... .Eo 600 ""
, '6> c e 500 iii . . .
E 400 ~ • .!!
"-j . . ~
300
200 ~
• Paired Test Data (Average vs. Average) 100 Prediction Interval (95% Confidence)
Regression Line 0
o 1000 2000 3000 4000 5000 6000 7000 8000
Compressive Strength (psi)
Figure 71 - Compressive vs. Flexural Strength for Mix OTA-E
55

1000
900
y _ O.07x + 390.14 ........ I ;
.
R' 0.39 .+=
800
700 ~ .e 600 "
• • , --- (-~-' ~K·,: • • . ~ • ' . • , • •
~ -r /..,...... . • ~ !-- .... ...-r I '- .' .~
,
C, c f 500 iii
'--" .+ +
E 400 ,
• ~ u:
300
> -~ I I I . l •
200 I
• Paired Test Data (Average 'Is. Average) 100 Prediction Interval (95% Confidence)
Regression Une o
o 1000 2000 3000 4000 5000 6000 7000 8000
Compressive Strength (psi)
Figure 72 - Compressive vs. Flexural Strength for All OTA Mixes
56