A Building System Using Precast Concrete Sandwich Panels ...

51PCI Journal | November–December 2015
Space heating and cooling represent almost 60% of the energy consumption of commercial and residential structures in Canada. This is largely affected by the
thermal resistance of the building envelope.1 With regard to walls, designs with high thermal resistance (R-value) and thermal mass reduce required heating and cooling loads on a building relative to frame walls.2,3 Prefabricated elements are advantageous in practice because they can be constructed quickly in a controlled environment by a single manufacturer, then shipped to the site to quickly close the building envelope.4 Precast concrete insulated wall panels are prefabricated elements that combine structural and thermal efficiency. These panels are typically composed of a 25 to 100 mm (1 to 4 in.) thick rigid layer of foam insula-tion surrounded by two wythes of reinforced concrete.5 Wythe thickness depends on expected loads, fire, and cover requirements and generally ranges from 50 to 150 mm (2 to 6 in.).6
The structural behavior of sandwich panels heavily depends on the shear force transferred between wythes through elements known as connectors. Connectors are commonly arranged as discrete ties, trusses,7,8 mesh grids,9 or solid concrete regions.10 They have been composed of various materials, including steel, fiber-reinforced poly-mers (FRPs), and plastics.5 Panels with complete shear transfer are termed fully composite, panels with no transfer
A single-story precast concrete insulated sandwich wall panel design was tested in flexure using different shear-connector and flexural-reinforcement material types, namely steel and basalt-fiber-reinforced polymer (BFRP).
BFRP connectors have the advantage of lower thermal bridging than conventional metallic connectors.
The wall design performed adequately as a non-load-bearing wall based on building-code requirements for maximum wind pressure.
Flexural behavior of precast concrete sandwich wall panels with basalt FRP and steel reinforcement
Douglas Tomlinson and Amir Fam

November–December 2015 | PCI Journal52
image correlation is also used to aid the understanding of wythe slip.
Experimental program
Panel design
A single-story, two-wythe, nonprestressed sandwich panel design (Fig. 1) forms the basis for this study. Each panel is 2700 mm (106.3 in.) long, 1200 mm (47 in.) wide, and 270 mm (11 in.) thick. The facade (exterior) wythe has a rectangular cross section with a thickness of 60 mm (2.4 in.); the structural (interior) wythe has a double-tee cross section with a 60 mm thick flange and 150 mm (5.9 in.) deep webs spaced center to center at 600 mm (24 in.). The bulb-shaped webs are between 50 and 70 mm (2 and 3 in.) and extend into the insulation layer. The bulb accommodates longitudinal reinforcement. The webs serve to increase the structural wythe’s flexural resistance while reducing the unsupported shear-connector length through the insulation. This increases composite action without sacrificing much thermal insulation. The insulation for all panels in this study was made of expanded polystyrene.
Panels were reinforced for flexure with steel or BFRP bars. In steel-reinforced sections, the facade wythe and flange of the structural wythe were each reinforced at mid-thickness with a welded reinforcement grid of D5 (0.25 in. diameter) bars spaced at 200 mm (8 in.) transversely and longitudi-nally. The flange of the structural wythe was also rein-forced at mid-thickness with an additional longitudinal D8 (0.32 in. diameter) bar bundled to the mesh at each flange-web junction. A single D8 bar was also placed in each web 120 mm (5 in.) from the face of the structural wythe. BFRP-reinforced panels had the same arrangement, but the D5 mesh was replaced with nominal 6 mm (0.24 in.) diameter BFRP bars, while the D8 bars were replaced with nominal 8 mm (0.31 in.) diameter BFRP bars. The 100 mm (4 in.) section at each end of the structural wythe consists of solid reinforced concrete headers, which are intended to accommodate bolted connection hardware and serve as lintel beams for axial load bearing in practice. The headers were transversely reinforced with four 10M (no. 3) steel bars or 10 mm (0.39 in.) nominal diameter BFRP bars.
The panels had discrete shear connectors (Fig. 2) spaced longitudinally at 600 mm (24 in.). Connectors were insert-ed through the facade wythe into the web of the structural wythe. The steel connectors consisted of two L-shaped D5 (0.25 in. diameter) bars, one inserted normal to the facade and the other placed at a 45-degree angle. The connectors were laid out such that they would be put into tension if the panel were subjected to external pressure. BFRP connector pairs were cut into a U shape from a 6 mm (0.24 in.) nomi-nal diameter, 600 × 600 mm square spiral tie and inserted into the panel at the desired angles, again one normal to the facade and one at a 45-degree angle.
are termed noncomposite, and panels with some shear transfer between the two are termed partially composite6 Partial and noncomposite walls are also characterized through broken-line strain profiles (that is, two neutral axes) that create strain discontinuity between the wythes. This discontinuity accumulates over the panel length as relative slip between the wythes (shear deformation), which is greatest at the panel ends.11
There are advantages to both fully composite and noncom-posite walls. Fully composite walls are stronger and stiffer but are more susceptible to thermal bowing, which is of particular concern in long walls.5 Fully composite walls are also more susceptible to reduced R-values because of ther-mal bridging.12 Fully composite and noncomposite panels can be readily analyzed using reinforced concrete sectional analysis, but there is uncertainty in evaluating partial com-posite panels because their behavior is much more complex and typically relies on test results and designer experience.5 If the level of composite action is quantified, it allows designers to more accurately design a wall system.
Composite action has been evaluated using numerous methods, including strength, deflection,13 stresses,8 ef-fective moment of inertia,14 and curvature.9 Previous test programs for direct shear and flexure have seen high or full degrees of composite action from heavy steel trusses8 or solid concrete regions14 as shear connectors. Less compos-ite action has been observed in sections with discrete steel, FRP, or plastic ties.15 High degrees of composite action with reduced thermal bridging have also been achieved using glass-fiber-reinforced polymer (GFRP) trusses7 and carbon-fiber-reinforced polymer (CFRP) grids.9
Panel insulation is typically composed of expanded poly-styrene or extruded polystyrene because these foams can withstand the pressure and temperature of concrete casting, provide the desired R-values, and act as stay-in-place form-work. The foam layer has been found to contribute signifi-cantly to composite action,13,16 with expanded polystyrene giving higher values in addition to often being less costly.2
Basalt-fiber-reinforced polymer (BFRP) has recently been used in concrete structures as flexural reinforcement and shear connectors.17–19 Relative to GFRP, BFRP is promising because it is stronger and stiffer while having similar dura-bility and thermal conductivity.20 BFRP is less costly than CFRP21 and is easier to manufacture than GFRP and CFRP.17
This paper investigates the composite action of a non-prestressed concrete insulated wall panel using four-point bending tests. The impact of varying shear-connector and longitudinal-reinforcement material between steel and BFRP is studied, and the performance of full walls with that of the structural wythe alone is compared. The results focus on the flexural-test results compared with theoretical values to quantify the level of composite action. Digital

53PCI Journal | November–December 2015
The BFRP bars have a specified tensile elastic modulus of 70 GPa (10,000 ksi) and guaranteed ultimate tensile strength of 1100 MPa (160 ksi), based on manufacturer data. Two nominal bar diameters of 6 and 8 mm (0.24 and 0.31 in.) were used, and their cross-sectional areas, de-termined through immersion tests, were 28 and 59 mm2 (0.043 and 0.091 in.2), respectively. Tensile test results of the 6 mm (0.24 in.) diameter bars gave strengths of 1132 and 1185 MPa (164.2 to 171.8 ksi) and elastic modu-li between 65 and 73 GPa (9400 and 10,400 ksi) (Fig. 3).
Expanded polystyrene foam with a density of 27 kg/m3 (1.7 lb/ft3) was used as insulation because it is available precut and in greater thicknesses than extruded polystyrene, eliminating the time required to cut and adhere layers of extruded polystyrene foam. The insulation was also infused with graphite to improve its R-value. Material tests (Fig. 3) showed that the insulation has a yield strength of 122 kPa (17.7 ksi) at 1.67% strain, an elastic modulus of 9.2 MPa (1.3 ksi), and a shear modulus Gin (Eq. [1]) of 5.7 MPa (0.83 ksi).
Test specimens and parameters
To investigate this panel design and compare the two rein-forcement and shear-connector materials, seven flexural tests
The R-value of the panels, calculated using the revised zone method from Lee and Pessiki,10 is 2.86 m2 K/W (19.8 h × ft2 °F/BTU) for panels with steel connectors and 3.10 m2K/W (21.5 h × ft2°F/BTU) for panels with BFRP connectors. Both values meet the ASHRAE 90.1 zone 722 requirements for mass walls.
Material properties
All of the panels used the same mixture proportions but were cast on four separate dates. The concrete used in the panels was self-consolidating, with a design flow of 650 and 700 mm (26 and 28 in.), a maximum aggregate size of 6 mm (0.24 in.), a one-day stripping strength of 30 MPa (4.3 ksi), and a design 28-day compressive strength of 60 MPa (8.7 ksi). Test-date cylinder tests gave strengths from 58 to 70 MPa (8.3 and 10 ksi).
Steel used for the shear connectors and flexural reinforce-ment was made from deformed bars with a yield strength of 485 MPa (70 ksi), ultimate strength of 650 MPa (94 ksi), and elastic modulus of 196 GPa (28,400 ksi), based on standard tension tests (Fig. 3). The D5 (0.25 in. diameter) and D8 (0.32 in. diameter) bars have cross-sectional areas of 31 and 51 mm2 (0.048 and 0.079 in.2), respectively.
Figure 1. General panel design. Note: Ain = insulation foam area subject to shear; BFRP = basalt-fiber-reinforced polymer. All dimensions are in millimeters. 1 mm = 0.0394 in.
Facade wythe2700
270
See end detailStructural wythe
Side view
Insulation layerShear connectors
Cross section
Web detail
End detail
Shear connector
150
100Four 10 M (steel)or 10 mm (BFRP),30 mm cover
10 (typical)30
150
7050
30 150 240Six D5 (steel) or 6 mm (BFRP)Two D8 (steel) or 8 mm (BFRP)
Structural wytheSee web detail
Six D5, two D8 (steel) orsix 6 mm, two 8 mm (BFRP)
Reinforcement details
Facade wythe60270
60270Wythe dimenstions
Top view Mesh reinforcement layout
1040 (shear span)
600 (typical)100
600
1200
Concrete webShear connectors
Shaded area = Ain (Eq. 1 and Table 2)
D8 bar (Steel) or 8 mm Bar (BFRP)D5 welded longitudinal reinforcement(Steel) or 6 mm tied mesh (BFRP)
D8 bar (Steel) or 8 mm Bar (BFRP)
ReinforcedHeader
1200
200 (typical) 200 (typical)

November–December 2015 | PCI Journal54
The reinforcement ratios of the steel- and BFRP-reinforced panels were intended to be equal but varied by as much as 7%. Both materials were provided in the standard rein-forcement configuration (Fig. 1) using the available bar sizes for each material type. Equal reinforcement ratios were considered rather than designing for equal stiffness. This allowed for better assessment of the panel-fabrication process, based on fully composite sectional properties and considering the greater strength of BFRP compared with steel. The BFRP-reinforced walls had similar strength to their steel-reinforced counterparts (varying from 7% [fully composite] to 13% stronger [noncomposite]). All walls satisfied the minimum longitudinal reinforcement ratio of 0.15% and transverse reinforcement ratio of 0.2% of the gross concrete cross-sectional area Ag given by CSA A23.3-0423 and ACI 318-14.24
The effective shear-connection stiffness Gc11 was evaluated
using Eq. (1):
(1)
where
n = number of shear connectors
Esc = shear-connector modulus of elasticity
were performed (Table 1). The control test (specimen SPF) was a full panel reinforced with steel longitudinal bars and steel shear connectors with loads applied to the facade wythe to simulate wind pressure. Specimen SSF was identical to specimen SPF except that bending load was applied in the opposite direction (that is, loading on the structural wythe) to simulate wind suction.
To investigate the facade layer’s contribution to partial com-posite action, specimens SPS and SSS, which consist of only the structural wythes, were tested with the ribs of specimen SPS on the compression side for the wind-pressure case, and the ribs of specimen SSS on the tension side for the wind-suction case. Specimen HPF has the same flexural design as specimen SPF (that is, flexural steel reinforcement) but has BFRP shear connectors to capitalize on the reduced thermal bridging through the shear connectors and to investigate the impact of the lower stiffness of BFRP connectors, compared with steel connectors, on panel response.
To evaluate the performance of an all-FRP-reinforced system (for flexure and connectors), which may allow for thinner wythes in the future due to reduced cover require-ments, two fully BFRP-reinforced walls were tested, with specimen BPF being the full panel and specimen BPS being the structural wythe only. Both panels were tested in the pressure configuration.
Figure 2. Dimensions and layout of shear connector pair. Note: All dimensions are in millimeters. 1 mm = 0.0394 in.
Steel
Basalt-fiber-reinforced polymer
120 (straight) or 170 (angled)
600
FacadeInsulation
FacadeInsulation
Structuralwythe (at rib)
Structuralwythe (at rib)
Longitudinal reinforcement
D5 straightconnector
D5 angledconnector
6 mm diamterstraight connector
6 mm diamter connector(transverse view)
6 mm diamterangled connector
80 80
170
170
120
120
6060
150
60 6015
0
θ = 45°
θ = 45°
Longitudinal reinforcement

55PCI Journal | November–December 2015
Asc = shear-connector cross-sectional area
θ = connector insertion angle
Gin = shear modulus of the insulation foam
Ain = area of foam subjected to shear at the facade wythe, which is the minimum contact area (Fig. 1)
At low slip values, it has been found that perpendicu-lar shear connectors have a negligible impact on shear stiffness and their contribution from dowel action was ignored.19 Table 2 presents the inputs and evaluation of Gc for the tested panels.
Fabrication process
The panels were fabricated at a precast concrete facility (Fig. 4). The expanded polystyrene foam sections were cut using a computer numerical control machine. The reinforcement was then cut to size. The steel reinforce-ment was prewelded, while the BFRP reinforcement was tied with plastic zip ties. Shear connectors were inserted after setting the longitudinal bar in the web and placing
the facade mesh. Steel shear connectors were made by cutting D5 (0.25 in.) bars, then bending them to 90-degree or 135-degree angles (Fig. 2). BFRP connectors were cut from a prefabricated spiral. The connectors were tied to both the facade mesh and the web reinforcement for continuity. The panel was flipped, and the structural wythe flange mesh was added. The foam and reinforcement were then inserted into a steel form and poured vertically. To prevent floating of the foam during casting, the top of the panel was restrained by steel sections bolted to the formwork. Most panels were cast with a brick facade with negligible structural contribution that added 8 mm (0.3 in.) to the facade wythe thickness. Panels were stripped after one day and stored flat (facade side down), spending one week indoors, then an additional three- to six-month period outdoors before being shipped facade side down via flatbed truck to the testing facility. During storage, the panels were exposed to temperature ranges of −29 to +27°C (−20 to +81°F) in addition to rain and snow.
Test setup and instrumentation
Each panel was tested in four-point bending to failure under stroke control at 2 mm/min (0.08 in/min) using a 223 kN (50.1 kip) hydraulic actuator. The panels had a span of 2630 mm (104 in.), a constant moment zone of 550 mm (22 in.), and shear spans of 1040 mm (41 in.) (Fig. 5). At each end, the panel was plastered to a 102 mm (4.02 in.) wide and 12.7 mm (0.5 in.) thick steel plate bearing against a 32 mm (1.3 in.) diameter round bar to create roller connections. At the central loading points, two 102 × 102 × 12.7 mm hollow structural sections were used to distribute load across the width of the panel to ensure one-way behavior.
Load was measured with the actuator’s load cell. Deflec-tions at midspan, the ends of the constant moment zone, and midway through the shear span were recorded with 100 mm (4 in.) linear potentiometers (Fig. 5). Two additional 100 mm linear potentiometers were attached to the panel ends to measure relative slip between the wythes. Midspan longitudinal reinforcement strains were measured with 5 mm (0.2 in.) 120 Ω strain gauges mounted on each bar layer (Fig. 5). Strains at the top concrete surface were mea-sured with two 50 mm (2 in.) 120 Ω strain gauges placed 300 mm (12 in.) from each edge of the panel. Strains were also found with 100 mm displacement-type pi gauges. The pi gauges were also used to develop wythe moment-curva-ture relationships. They were placed 10 mm (0.4 in.) from the top and bottom surface of the panel and 10 mm from the edges of each wythe. The 10 mm offset was included in curvature calculations. To complement the slip linear po-tentiometer readings, digital image correlation was used on one end of the panel. A camera with a 5184 × 3456 pixel image size was used to photograph the 400 mm (16 in.) end of the panel at 15-second intervals during each test. Digital image correlation was then performed using a software
Figure 3. Material properties. Note: BFRP = basalt-fiber-reinforced polymer. 1 kPa = 0.145 psi; 1 MPa = 0.145 ksi.
0 0.5 1 1.5 2 2.5
200
400
600
800
1000
1200fu,frp BFRP tests
(strain extrapolated)
Steel tests
Strain gauge failureBFRP tests
fy
Strain, %Reinforcement tension tests
Foam compression tests
Stre
ss, M
Pa
0 2.5 5 7.5 10 12.5 15 17.5 20
50
100
150
200
Average proportional limit (102 kPa at 1.35%)Average yield point (122 kPa at 1.65%)
Average stress at10% strain (160 kPa)
Strain, %
Stre
ss, k
Pa
= 485 MPa
= 1100 MPa

November–December 2015 | PCI Journal56
program.25 Digital image correlation tracks the movement of a superimposed mesh of 64 × 64 pixel texture patches over the course of a test and reports a matrix of horizontal
and vertical movements for each patch. This has previously been used to evaluate panel end slip19 and has been extend-ed to present wythe rotation in this work (Fig. 6).
Figure 4. Fabrication of test panels.
Inserting basalt-fiber-reinforced polymer shear connector
Final product with nonstructural architectural facade
Foam and facade reinforcement
Foam and reinforcement before closing of form
Structural wythe chair to reduce stress on foam during casting

57PCI Journal | November–December 2015
to L/360, commonly used for architectural features, where L is the span length (this is stricter than the limit of L/150 for wall elements). The final constraint is strain, with three strain limits being examined: the point where concrete strain exceeds 0.001, accepted as where concrete becomes nonlinear; the FRP strain of 0.002, where the crack widths are expected to exceed acceptable values;27 or when the steel strain exceeds 60% of yield. Table 4 summarizes the service load values for each panel using these three conditions.
Ductility in sections that yielded was evaluated using the ductility index ∆u/∆y (where ∆u is the midspan deflection at ultimate and ∆y is the midspan deflection at yielding). Also, deformability Φ was evaluated using the J-factor (Eq. [2]):28
Results and discussion
The general response and failure mode of each panel were heavily reliant on the longitudinal reinforcement mate-rial. The test results (Table 3) include the self-weight of the panel and spreader beams as part of the reported loads because they accounted for 7% to 17% of the ultimate load. The maximum service live load LL for each panel was determined to be the lowest value given by three commonly used constraints. The first constraint is from strength, which unfactors the ultimate load UL using the UL equal to 1.25DL + 1.5LL load factors in the National Building Code of Canada,26 assuming that the dead load DL is the self-weight and spreader-beam weight. The second constraint limits midspan deflection from live load
Table 1. Test matrix for flexure tests
SpecimenLongitudinal
reinforcement material
Shear connector material
Loading condition
Panel typeWall
reinforcement, % of Ag
Reinforcement stiffness EA,× 106 N
Shear connection
stiffness Gc, × 106 N
Concrete strength,
MPa
SPF Steel Steel Pressure Full 0.38 115.3 48.5 57.7
SSF Steel Steel Suction Full 0.38 115.3 48.5 57.5
SPS Steel None Pressure Structural 0.48 77.6 n/a 63.0
SSS Steel None Suction Structural 0.48 77.6 n/a 61.6
HPF Steel BFRP Pressure Full 0.38 115.3 25.2 70.4
BPF BFRP BFRP Pressure Full 0.37 40.0 25.2 60.9
BPS BFRP None Pressure Structural 0.49 28.3 n/a 69.3
Note: A = gross reinforcement cross-sectional area; Ag = gross concrete cross-sectional area; BFRP = basalt-fiber-reinforced polymer; BPF = full panel BFRP-reinforced wall; BPS = structural wythe BFRP-reinforced wall; HPF = same flexural design as SPF but has BFRP shear connectors; E = reinforcment elastic modulus; n/a = not applicable; SPF = control full-panel reinforced with steel longitudinal bars and steel shear connectors with the load applied to the facade wythe; SPS = structural wythe with the ribs on the compression side; SSF = identical to SPF except load applied on the structural wythe; SSS = structural wythe with the ribs on the tension side. 1 N = 0.225 lb; 1 MPa = 145 psi.
Table 2. Shear connector stiffness inputs
Specimen
Shear connector Insulation
Gc, × 106 Nn Esc, MPa Asc, mm2 θ, deg
Shear connector contribution, × 106 N
Ain, m2 Gin, MPaInsulation
contribution, × 106 N
SPF 8 196 31 45 34.4 2.47 5.7 14.1 48.5
SSF 8 196 31 45 34.4 2.47 5.7 14.1 48.5
HPF 8 70 28 45 11.1 2.47 5.7 14.1 25.2
BPF 8 70 28 45 11.1 2.47 5.7 14.1 25.2
Note: SPS, SSS, and BPS only consist of a structural wythe and have no shear connection stiffness. Ain = insulation foam area subject to shear; Asc = shear connector cross-sectional area; FRP = basalt-fiber-reinforced polymer; BPF = full panel BFRP-reinforced wall; BPS = structural wythe BFRP-reinforced wall; Esc = shear connector elastic modulus; Gc = effective shear-connection stiffness accounting for both connector and insulation contri-bution; Gin = shear modulus of insulation foam; HPF = same flexural design as SPF but has BFRP shear connectors; n = number of shear connectors; SPF = control full-panel reinforced with steel longitudinal bars and steel shear connectors with the load applied to the facade wythe; SPS = structural wythe with the ribs on the compression side; SSF = identical to SPF except load applied on the structural wythe; SSS = structural wythe with the ribs on the tension side; θ = shear connector insertion angle. 1 mm = 0.0394 in.; 1 m = 3.28 ft; 1 N = 0.225 lb; 1 MPa = 145 psi.

November–December 2015 | PCI Journal58
to capture the true panel deformability. The point of nonlinearity was taken as the lowest of reinforcement yielding, concrete compression strain exceeding 0.001, and the point when the end slip exceeds the linear region established in prior push-through tests.19Deformability was also found using energy methods by taking the ratio of strain energy at ultimate to strain energy at the point of
(2)
where
δu = deflection at ultimate
δNL = deflection at the point of nonlinearity
Mu = ultimate moment
MNL = moment at the point of nonlinearity
Although curvature is more commonly used than deflec-tion to evaluate deformability, these panels have con-siderable shear deformations and curvature was unable
Figure 5. Test setup and instrumentation locations. Note: BFRP = basalt-fiber-reinforced polymer; BPF = full panel BFRP-reinforced wall; BPS = structural wythe BFRP-reinforced wall; DIC = digital image correlation; HPF = same flexural design as SPF but has BFRP shear connectors; SPF = control full-panel reinforced with steel longitudinal bars and steel shear connectors with the load applied to the facade wythe; SPS = structural wythe with the ribs on the compression side; SSF = identical to SPF except load applied on the structural wythe; SSS = structural wythe with the ribs on the tension side. All dimensions are in millimeters. 1 mm = 0.0394 in.
Load pointTest panel
Slip linearpotentionmeter
Support and loading locations
Displacement instrument layout
Midspan reinforcement layout
Slip linearpotentionmeter
Digital image correlation tracking zone
1040 1040550span = 2630
400
520520 595595200200
CLCL
CLCL
SSFSPF, HPF, BPF
SPS, BPS SSS100 mm displacement transducer (Pi gauge)120Ω strain gauge
Figure 6. Use of digital image correlation in experimental program. Note: SPF = control full-panel reinforced with steel longitudinal bars and steel shear con-nectors with the load applied to the facade wythe. 1 mm = 0.0394 in.
δs
Facade wythe
Structural wytheInsulation
Facade wythe
Insulation
Structural wythe
Facade wytheRotation, θf
Structural wytheRotation, θs
Representative patchWythe slip,
δs
Facade wythe
Structural wytheInsulation
Facade wythe
Insulation
Structural wythe
Facade wytheRotation, θf
Structural wytheRotation, θs
Representative patchWythe slip,
δs
Facade wythe
Structural wytheInsulation
Facade wythe
Insulation
Structural wythe
Facade wytheRotation, θf
Structural wytheRotation, θs
Representative patchWythe slip,
400 mm region at one end of the panel
Spray paint used to add texture to the surface representative quiver plot (5× exaggeration) showing
movement of texture patches in SPF at a point near failure
Simplified image showing how patch movement was used to find wythe rotation and slip
59PCI Journal | November–December 2015
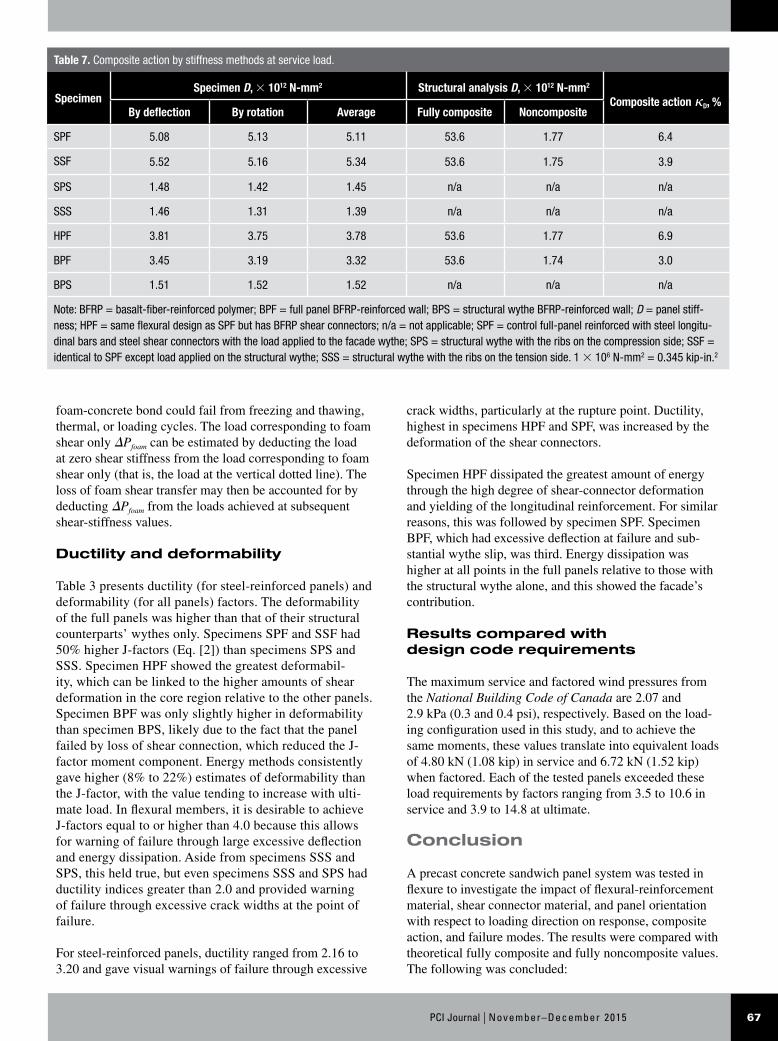
most pronounced in specimen SPS because the cross sec-tion has a high percentage of concrete in tension. Yielding occurred at similar deflections in each panel but yield load increased with reinforcement percentage and shear-con-nection stiffness. Due to the multiple layers of reinforce-ment and the relatively high yield strength of the steel, the load continued to increase after initial yielding, though at reduced stiffness. Near ultimate, the second layer of steel also yielded. Ultimate occurred after an additional 17% to 33% increase in load beyond yielding. After ultimate was
nonlinearity. Table 3 presents a summary of ductility and deformability factors.
Behavior of steel-reinforced panels
Fig. 7 shows the load-deflection plots of steel-reinforced panels, and Fig. 8 shows photos of the panels taken dur-ing testing. The steel-reinforced panels had a high initial stiffness until cracking. Crack formation was audible and indicated by a decrease in stiffness. These decreases were
Table 3. Key results from flexural tests
Specimen
SPF SSF SPS SSS HPF BPF BPS
Key load points, kN
Ultimate 99.3 72.7 41.4 26.3 88.9 58.6 35.7
Yielding 74.6 58.5 33.9 21.8 67.0 n/a n/a
Nonlinearity* 69.1 58.5 30.8 21.8 54.6 45.0 21.9
Service 50.9 50.8 23.5 16.6 39.4 29.5 17.0
Cracking 22.7 18.2 20.7 12.0 21.2 20.1 16.1
Total end slip, mm
Ultimate 7.08 1.87 n/a n/a 12.18 16.43 n/a
Yielding 1.87 1.11 n/a n/a 4.27 n/a n/a
Nonlinearity* 1.66 1.11 n/a n/a 3.08 3.47 n/a
Service 0.84 0.67 n/a n/a 1.74 1.14 n/a
Deflection, mm
Ultimate 45.1 33.7 36.9 42.9 54.9 64.2 67.5
Yielding 14.1 11.2 16.4 16.9 17.5 n/a n/a
Nonlinearity* 12.4 11.2 14.2 16.9 12.6 18.3 25.0
Service 7.6 8.7 7.8 8.0 7.8 6.6 8.3
Strain energy, kN-mm
Ultimate 3512 2079 1192 9.6 3819 2921 1671
Yielding 650 365 392 270 731 n/a n/a
Nonlinearity* 551 365 316 270 452 555 333
Service 243 306 119 95 206 117 96
Ductility 3.20 3.02 2.25 2.54 3.14 n/a n/a
DeformabilityJ factor 5.22 3.73 3.49 3.06 7.08 4.59 4.41
Energy 6.37 5.70 3.77 3.34 8.45 5.26 5.02
Failure modeLongitudinal bar rupture
Longitudinal bar rupture
Longitudinal bar rupture
Longitudinal bar rupture
Longitudinal bar rupture
Shear connector failure/ compression
Shear compression
Note: BFRP = basalt-fiber-reinforced polymer; BPF = full panel BFRP-reinforced wall; BPS = structural wythe BFRP-reinforced wall; HPF = same flexural design as SPF but has BFRP shear connectors; n/a = not applicable; SPF = control full-panel reinforced with steel longitudinal bars and steel shear connectors with the load applied to the facade wythe; SPS = structural wythe with the ribs on the compression side; SSF = identical to SPF except load applied on the structural wythe; SSS = structural wythe with the ribs on the tension side; εc = concrete strain. 1 mm = 0.0394 in.; 1 kN = 0.225 kip. * The point of nonlinearity was set to occur at the lowest of yielding, εc > 0.001, and end slip exceeding linear values found in previous push-through tests. This was used to determine deformability.

November–December 2015 | PCI Journal60
specimen SPF due to the lower stiffness of the BFRP con-nectors. The connectors closest to the support on one side (longitudinal direction) of specimen HPF failed around yielding of the longitudinal reinforcement and caused end slip to greatly increase on that side only. However, the load in specimen HPF continued to increase until flexural failure occurred.
In the full panels, the strain readings (Fig. 10) in the ex-treme compression fiber were well below crushing and in-dicate that the panels were severely underreinforced. Plane sections did not remain plane because there was disconti-nuity in the strain profile for the panels through the foam layer. In pressure cases, this led to compressive strains at the top of the web and tension at the bottom of the facade wythe. Panels with only the structural wythe, however, had strains nearing crushing at ultimate.
Behavior of BFRP-reinforced panels
Specimens BPF and BPS had lower postcracking stiffness than their steel-reinforced counterparts (Fig. 7). Cracking was clearly audible and caused larger decreases in load and longer recovery periods than for specimens SPF and SPS. The panel stiffness decreased further when the second series of cracks formed at a load of 31.2 kN (7.01 kip). From this point, specimen BPF remained essentially linear as cracking propagated until the load reached 52.7 kN (11.8 kip). At this point, the outermost shear connectors at one end of the panel failed, which decreased demand on the flexural reinforcement and increased end slip (Fig. 8 and 9). This also caused a change in the panel’s deflected shape as the greatest deflection no longer occurred at mid-span because shear deformation began to dominate on one
reached, the load steadily decreased as the flexural rein-forcement necked then ruptured (Fig. 8).
Rupture was expected as the reinforcement ratio is small, the concrete strength is relatively high, and the steel-welded longitudinal reinforcement is brittle relative to mild-steel reinforcement, which would allow for greater curvature to be developed and makes crushing more likely to occur. In general, Fig. 7 shows that partial composite behavior has a significant contribution to flexural strength, whether the panel simulates wind pressure (specimen SPF versus specimen SPS) or suction (specimen SSF versus specimen SSS). The ultimate load increased 2.49 times in pressure and 2.99 times in suction. Also, hybrid speci-men HPF with flexural steel reinforcement and BFRP ties behaved somewhat similarly to all-steel specimen SPF but with slightly lower strength and stiffness. In this hybrid specimen, partial composite behavior increased the ulti-mate load 2.21 times.
For steel-reinforced full panels (specimens SPF, SSF, and HPF) (that is, panels with both wythes) the load–end slip relationships in Fig. 9 showed similar shapes to the load-deflection plots. Specimens SPF and SSF showed nearly identical load-slip relationships until ultimate. Connector yielding was observed in specimen SPF and, although this was not the cause of failure, it prevented the full composite load from being reached. The side of the panel (longitudinal direction) where connectors yielded saw greater shear deformation after that point relative to the other side (Fig. 8). Connectors in specimen SSF did not reach material failure because slip did not exceed the point of connector buckling seen in prior push-through tests.19 Specimen HPF had higher slip under the same loads as
Table 4. Maximum service load values from each method
Specimen
Maximum service load, kNService load governed
by:Back-calculated from ultimate
Deflection (>L/360)Concrete strain,
(>1000 µε)Reinforcement strain*
SPF 52.1 50.9† 68.2 51.9 Deflection
SSF 41.4† 62.2 63.7 53.1 Strength
SPS 24.7 24.1 30.8 23.8† Reinforcement strain
SSS 19.0 16.6† 24.2 17.5 Deflection
HPF 47.6 40.0† 46.7 40.2 Deflection
BPF 38.1 34.6 40.2 22.3† Reinforcement strain
BPS 25.2 17.3† 20.1 18.3 Deflection
Note: BFRP = basalt-fiber-reinforced polymer; BPF = full panel BFRP-reinforced wall; BPS = structural wythe BFRP-reinforced wall; fy = steel yield stress; HPF = same flexural design as SPF but has BFRP shear connectors; L = span length; SPF = control full-panel reinforced with steel longitudi-nal bars and steel shear connectors with the load applied to the facade wythe; SPS = structural wythe with the ribs on the compression side; SSF = identical to SPF except load applied on the structural wythe; SSS = structural wythe with the ribs on the tension side. 1 kN = 0.225 kip. *Steel-reinforced panel maximum service strain = 0.6fy = 2475 µε. BFRP-reinforced panel maximum service strain = 2000 µε. †Governing value for each panel.

61PCI Journal | November–December 2015
(Fig. 8). Crushing was gradual, and the load decreased slowly as deflection increased. Both tests were concluded when the actuator reached full stroke (Fig. 8). Relative to peak loads at this point, the loads in specimens BPF and BPS were 84% and 70%, respectively. Specimen BPF had complete failure of all shear connectors on one side (Fig. 8). Specimens BPF and BPS failed to achieve their potential flexural capacity because of the shear-compres-sion failure in the region immediately beyond the constant moment zone.
The reduction in specimen BPS was minor. It achieved 90% of the expected flexural strength. However, specimen BPF was not close to its potential flexural capacity. Rela-tive to steel-reinforced members with equal reinforcement ratios, FRP-reinforced members have lower shear capacity because the lower stiffness of the longitudinal reinforce-ment increases crack widths and height, which limits aggregate interlock and reduces the compression zone. For specimen BPF, the ultimate strength was 1.65 times that of specimen BPS without a facade, lower than the in-creases seen when using steel longitudinal reinforcement. This reduction is due to the failure of the shear connection prior to that of the member, which was not observed in the other panels (even specimen HPF, which had BFRP shear connectors).
Similar to specimen HPF, once shear connectors began to fail on one side in specimen BPF, wythe slip on the other side remained almost constant. When specimen BPF was unloaded, the slip on the one end of specimen BPF was 34 mm (1.3 in.), while the other side had 3.4 mm (0.13 in.). The side with higher slip is where concrete crushed. The load-slip behavior of specimens BPF and HPF were similar at low loads but diverged around 35 kN (7.8 kip) as flexural crack propagation progressed in speci-men HPF.
With the exception of the crushed region, the crack patterns of the BFRP-reinforced panels were similar to those of the steel-reinforced ones. As indicated previously, cracks in the BFRP-reinforced panels were wider (by about six times at the same load) than their steel-reinforced counterparts.
The strain gauges in specimens BPF and BPS (Fig. 10) behaved as expected until the onset of shear failure. Shear failure caused a decrease in the longitudinal reinforcement strain as forces redistributed. Shear-connector failure in BPF caused a region of decreased strain because deforma-tion occurring elsewhere was not captured by the gauge.
Panels’ responses relative to theoretically noncomposite and fully composite panels
The panels were modeled with structural analysis soft-ware29 using the previously presented material properties
side. After connector failure (Fig. 8), there was a decrease in load and stiffness, but the load eventually reached a second peak.
The ultimate load of both specimens BPF and BPS co-incided with the onset of concrete crushing in the shear span immediately to the support side of the loading point
Figure 7. Load-midspan deflection relationships for each test. Theoretical curves for FC and NC walls are shown. Note: Values include self-weight. BFRP = basalt-fiber-reinforced polymer; BPF = full panel BFRP-reinforced wall; BPS = structural wythe BFRP-reinforced wall; FC = fully composite; HPF = same flexural design as SPF but has BFRP shear connectors; NC = noncomposite; SPF = control full-panel reinforced with steel longitudinal bars and steel shear con-nectors with the load applied to the facade wythe; SPS = structural wythe with the ribs on the compression side; SSF = identical to SPF except load applied on the structural wythe; SSS = structural wythe with the ribs on the tension side. 1 mm = 0.0394 in.; 1 kN = 0.225 kip.
0 20 40 60 80 100 120
20
40
60
80
100 SPF
SPS
HPF
FC
NC
Midspan deflection, mm
Load
, kN
0 20 40 60 80 100 120
20
40
60
80
100
SSF
SSS
FC
NC
Midspan deflection, mm
Load
, kN
0 20 40 60 80 100 120
20
40
60
80
100
BPF
BPS
FC
NC
Midspan deflection, mm
Load
, kN
HPF softer than SPF but has sameshape
Load plateaus after connector failure
Results convergeafter SSF ruptures
Steel-reinforced panels in pressure
Steel-reinforced panels in suction
BFRP-reinforced panels in pressure
First crackingInitial yieldingUltimate (flexure)
Service loadShear connector failureUltimate (shear)
Initial rupture

November–December 2015 | PCI Journal62
Figure 8. Photos of panels during and after testing. Note: BFRP = basalt-fiber-reinforced polymer; BPF = full panel BFRP-reinforced wall; BPS = structural wythe BFRP-reinforced wall; HPF = same flexural design as SPF but has BFRP shear connectors; SPF = control full-panel reinforced with steel longitudinal bars and steel shear connectors with the load applied to the facade wythe; SPS = structural wythe with the ribs on the compression side; SSS = structural wythe with the ribs on the tension side.
SSS during test
HPF after rupture of structural wythe reinforcement
Visible slip after failure of BPF
Crushed web in BPS
SPS during test
End slip in SPF near failure
Failed shear connector in BPF
Excessive deflection observed in BPF prior to unloading

63PCI Journal | November–December 2015
Rotation and slip from digital image correlation outputs
The slip readings from digital image correlation strongly correlated with those from the linear potentiometers (Fig. 9).
The full digital image correlation output for rotation of the panel ends of specimen SPF at the key test points is also shown on the left side of Fig. 12, while the right side of the same figure shows slip distribution through the panel thickness. For rotation, the wythes gave similar readings but rotation values decreased in the foam layer and show that it is deforming rather than slipping due to bond failure at the concrete-foam interface. This is confirmed in the slip readings from digital image correla-tion, where the accumulation of slip through the foam
to evaluate the fully composite and noncomposite flexural performances of the system. The results (Table 5) were compared with those of the test data to evaluate the par-tial composite action of test specimens. Fully composite panels were modeled as a single cross section made up of both wythes. Noncomposite panels were modeled by running the analysis of the two wythes separately, then summing moments based on the assumption that curva-ture of both wythes is equal. The theoretical contribution of the facade wythe to moment resistance in the non-composite system is low relative to that of the structural wythe and accounted for between 9.8% and 17% of the total moment.
The moment-curvature results from the structural analy-sis software were compared with those calculated from experimental strains measured using the pi gauges in Fig. 8. The panels generally stayed within the two bounds of the structural analysis curves. In specimen SSF, however, the pi gauge did not intercept the crack until near yielding and, as a result, the curvature is underestimated until this point (Fig. 11). The moment-curvature responses show that the tested panels have lower stiffness than in the fully compos-ite case and reach higher curvatures at ultimate. The steel-reinforced panels reached ultimate strengths close to those of the fully composite case (Fig. 11). Alternatively, BFRP-reinforced panel specimen BPF had a significantly lower ultimate strength than the fully composite case (Fig. 11) as curvature decreased upon connector failure in specimen BPF, which corresponded to the increase in wythe slip at this point.
Figure 9. Load-slip responses showing linear potentiometer readings (lines) and digital image correlation results (markers). SSF not shown for clarity but follows the line for SPF until failure. Note: Dominant = end of panel with higher slip and nondominant = end of panel with lower slip. BFRP = basalt-fiber-reinforced polymer; BPF = full panel BFRP-reinforced wall; HPF = same flexural design as SPF but has BFRP shear connectors; SPF = control full-panel reinforced with steel longitudinal bars and steel shear connectors with the load applied to the facade wythe; SSF = identical to SPF except load applied on the structural wythe. 1 mm = 0.0394 in.; 1 kN = 0.225 kip.
0 5 10 15
20
40
60
80
100 SPFSPF
HPFHPF
BPFBPF
End slip, mm
Load
, kN
Shear connector failure
Non-dominant Dominant-5-10
Figure 10. Test load-strain relationships. Note: BFRP = basalt-fiber-reinforced polymer; BPF = full panel BFRP-reinforced wall; BPS = structural wythe BFRP-reinforced wall; HPF = same flexural design as SPF but has BFRP shear connec-tors; SPF = control full-panel reinforced with steel longitudinal bars and steel shear connectors with the load applied to the facade wythe; SPS = structural wythe with the ribs on the compression side; SSF = identical to SPF except load applied on the structural wythe; SSS = structural wythe with the ribs on the tension side. 1 kN = 0.225 kip.
0 4000 8000 12,000 16,000
255075
100Lo
ad, k
N
Top concrete strain Facade reinforcement strainWeb reinforcement strainFlange reinforcement strain
Gauge failure
-4000
0 4000 8000 12,000 16,000-4000
255075
100
Load
, kN
255075
100
Load
, kN
255075
100
Load
, kN
255075
100
Load
, kN
255075
100
Load
, kN
255075
100
Load
, kN

November–December 2015 | PCI Journal64
ure and the shear-compression failure preventing the fully composite flexural capacity from being reached.
Alternatively, specimen SPF with steel connectors was consistently about 90% composite at all loading levels, with fully composite behavior limited by shear-connector yielding. Specimen SSF, which had low amounts of slip and no shear-connector failure, had unrealistic values, above 100%, for composite action at service and yielding. This is attributed to variance between theoretical predic-tions and experimental values, which is likely from the potential shifting of reinforcement location from design and some variability in wythe thickness. Specimen HPF had composite action of 52% at service and 75% at yield and ultimate, lower than specimen SPF due to the lower stiffness of the BFRP.
By deflection The composite action of the walls based on deflection κD can also be evaluated at the maximum service load using Eq. (4):
κD
FC
D D
D D=
−
−×exp NC
NC
100
(4)
where
DFC = theoretical fully composite service stiffness taken from the structural analysis software (in all cases, this was equal to the uncracked stiffness of 53.6 × 10¹² N-mm2 [18.7 × 10⁶ kip-in.2])
layer shows that it is resisting slip rather than failing at the interface. The header’s contribution to resisting slip is also seen as it redirects slip to the remaining 60 mm (2.4 in.) of insulation at the panel ends. Although only specimen SPF is depicted in Fig. 12, other tests gave similar outputs.
Assessment of level of partial composite action
By load The composite action by load κ (κu at ultimate, κy at yielding, and κs at service) was evaluated for each key load point using Eq. (3):
κ =−
−×
P P
P PFC
exp NC
NC
100
(3)
where
Pexp = observed test load
PFC = theoretical fully composite load
PNC = theoretically fully noncomposite load.
Table 6 shows the results in terms of the calculated at ultimate, yielding, and service. Generally, composite action increased as shear-connection stiffness increased: speci-men BPF with BFRP connectors had the lowest composite action with values of 20% at service and 24% at ultimate. This is due to the combination of the shear-connector fail-
Table 5. Ultimate moment comparisons between test and calculated values
SpecimenTest moment
resistance, kN-m
Fully composite Noncomposite
Calculated value Test/calculated Calculated value Test/calculated
SPF 51.1 55.6 0.92 19.9 2.57
SSF 37.2 40.2 0.92 15.0 2.48
SPS* 20.9 17.4 1.21 n/a n/a
SSS* 13.1 12.2 1.07 n/a n/a
HPF 45.7 55.6 0.82 19.9 2.30
BPF 29.9† 59.4† 0.50† 21.4 1.40
BPS* 17.9† 19.6† 0.91† n/a n/a
Facade only: steel n/a 3.6 n/a n/a n/a
Facade ony: BFRP n/a 4.2 n/a n/a n/a
Note: BFRP = basalt-fiber-reinforced polymer; BPF = full panel BFRP-reinforced wall; BPS = structural wythe BFRP-reinforced wall; HPF = same flexural design as SPF but has BFRP shear connectors; n/a = not applicable; SPF = control full-panel reinforced with steel longitudinal bars and steel shear connectors with the load applied to the facade wythe; SPS = structural wythe with the ribs on the compression side; SSF = identical to SPF except load applied on the structural wythe; SSS = structural wythe with the ribs on the tension side. 1 kN-m = 0.737 kip-ft. *In panels with the structural wythe only, comparison was made with a structural analysis model of the structural wythe only. †Failure of BPF and BPS was by shear compression, which was not predicted by structural analysis.

65PCI Journal | November–December 2015
DNC = noncomposite service stiffness from the structural analysis software
Dexp = experimental service stiffness, taken as the aver-age of stiffness estimated using measured midspan deflection Dδ (Eq. [5]) and stiffness estimated using measured end rotation Dϕ (Eq. [6])
D
L a Pδ
δ=
−( )3
24
2 2
(5)
Da L a L
φφ
=−( )2
2
(6)
where
a = shear span length
L = panel span length
δ = midspan deflection
ϕ = end rotation
P = applied load
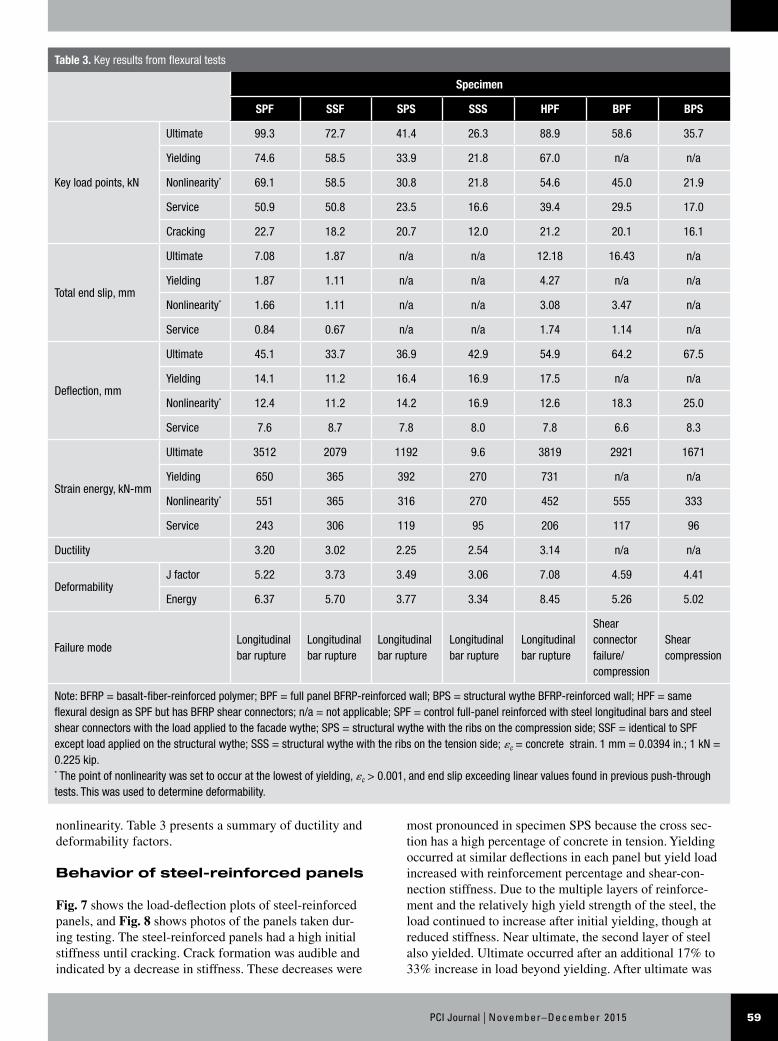
The stiffness D of a flexural member includes the effects of shear deformation and indirectly incorporates tension stiff-ening. Both techniques gave similar D results despite being measured from independent techniques. Table 7 provides a summary of the composite action parameter κD at service. The composite action by deflection is lower than that seen by load, with values ranging from 3% and 6.9%. Like the load-based case, κD increased with the increase of shear-connection and flexural-reinforcement stiffness.
The κD values were quite low, primarily as the high stiff-ness of the fully composite system (expected to remain uncracked at the maximum service-load value) offset the variations seen across the testing parameters. However, when comparing the stiffness of the tested panels with their theoretically noncomposite values, stiffness decreased 35% when the shear connectors were changed from steel to BFRP (from specimen SPF to HPF) and decreased a further 14% when the longitudinal reinforcement material was changed from steel to BFRP (from specimen HPF to BPF).
Effect of shear-transfer-system stiffness on loads achieved
The shear-transfer system is composed of shear transfer through the foam core, which was well bonded to the con-crete and able to absorb shear deformations, and the con-nector system. The total shear-connection stiffness Gc was established in Eq. (1). This section evaluates the effect of Gc on the yielding and ultimate loads. The highest Gc in this study was that of walls with steel connectors and was 47,200 kN (6120 kip) (Table 1).
The walls with BFRP connectors had a Gc of 25,200 kN (5670 kip) (Table 1). Figure 13 shows the variation of ultimate and yield loads with Gc for the cases of pressure and suction. For each curve, a third point of Gc equal to 0 (representing a totally noncomposite system) was added to provide a complete trend. This point was established by adding the load (ultimate or yield) from the tested structural (single) wythe to the load (ultimate, yield, or service) of the facade wythe, predicted using the structural analysis software (because the facade was never tested by itself). Figure 13 also shows the ceiling loads (horizontal lines), representing the maximum predicted values based on the assumption of a full composite action. The contri-bution of foam core only to Gc (second term of Eq. [1]) is also shown as the vertical dotted lines. Figure 13 clearly shows the expected trends that the ultimate and yield
Figure 11. Moment curvature diagrams showing results from tests and the structural analysis software. Note: BFRP = basalt-fiber-reinforced polymer; BPF = full panel BFRP-reinforced wall; FC = full composite; HPF = same flexural de-sign as SPF but has BFRP shear connectors; NC = noncomposite; SPF = control full-panel reinforced with steel longitudinal bars and steel shear connectors with the load applied to the facade wythe; SSF = identical to SPF except load applied on the structural wythe. 1 kN-m = 0.737 kip-in.; 1 rad/mm = 25.4 rad/in.
0 100 200 300 400
102030405060
SPF
HPF
FC
NC
Curvature, rad/mm 106
SSF
SSS
FC
NC
BPFFC
NC
Shear connector failure
Pi gauge did not intercept crack until late
Steel-reinforced panels in pressure
Steel-reinforced panels in suction
BFRP reinforced panels
Mom
ent,
kN, m
Mom
ent,
kN, m
Mom
ent,
kN, m
102030405060
102030405060
0 100 200 300 400
0 100 200 300 400
Curvature, rad/mm 106
Curvature, rad/mm 106

November–December 2015 | PCI Journal66
loads increase as the overall stiffness Gc of the shear-trans-fer system increases. The fully composite ultimate and yield loads were approximately double the fully noncom-posite loads. The panels with steel connectors approached closely the values of a fully composite system, while the
panels with BFRP connectors achieved about 90% of the loads of the panels with steel connectors.
Contribution from the foam core can be conservatively neglected in cases where a designer is concerned that the
Figure 12. Output of digital image correlation showing values at various load stages in SPF. Note: Left side shows rotation of wythes while right side shows slip relative to the structural (bottom) wythe. The header is seen on the bottom right. Results are similar in other tests. SPF = control full-panel reinforced with steel longitudinal bars and steel shear connectors with the load applied to the facade wythe. 1 mm = 0.0394 in.
Table 6. Composite action by strength methods at key load points
Specimen
Ultimate load, kN Yield load, kN Service load, kN Composite action, %
Test value
Fully composite
Fully non-composite
Test value
Fully composite
Fully non-composite
Test value
Fully composite
Fully non-composite κu κy κs
SPF 99.32 107.0 38.20 74.59 77.63 31.71 50.94 54.13 23.52 89 93 90
SSF 72.67 77.37 28.87 58.48 54.50 18.80 50.83 38.71 13.94 91 111 149
HPF 88.90 107.0 38.20 66.25 77.63 31.71 39.36 54.13 23.52 74 75 52
BPF 58.64 114.7 41.22 n/a n/a n/a 29.50 56.77 22.85 24 n/a 20
Note: BFRP = basalt-fiber-reinforced polymer; BPF = full panel BFRP-reinforced wall; HPF = same flexural design as SPF but has BFRP shear connec-tors; n/a = not applicable; SPF = control full-panel reinforced with steel longitudinal bars and steel shear connectors with the load applied to the fa-cade wythe; SSF = identical to SPF except load applied on the structural wythe; κs = degree of composite action based on service load; κu = degree of composite action based on ultimate load; κy = degree of composite action based on yield load. 1 kN = 0.225 kip.
67PCI Journal | November–December 2015
crack widths, particularly at the rupture point. Ductility, highest in specimens HPF and SPF, was increased by the deformation of the shear connectors.
Specimen HPF dissipated the greatest amount of energy through the high degree of shear-connector deformation and yielding of the longitudinal reinforcement. For similar reasons, this was followed by specimen SPF. Specimen BPF, which had excessive deflection at failure and sub-stantial wythe slip, was third. Energy dissipation was higher at all points in the full panels relative to those with the structural wythe alone, and this showed the facade’s contribution.
Results compared with design code requirements
The maximum service and factored wind pressures from the National Building Code of Canada are 2.07 and 2.9 kPa (0.3 and 0.4 psi), respectively. Based on the load-ing configuration used in this study, and to achieve the same moments, these values translate into equivalent loads of 4.80 kN (1.08 kip) in service and 6.72 kN (1.52 kip) when factored. Each of the tested panels exceeded these load requirements by factors ranging from 3.5 to 10.6 in service and 3.9 to 14.8 at ultimate.
Conclusion
A precast concrete sandwich panel system was tested in flexure to investigate the impact of flexural-reinforcement material, shear connector material, and panel orientation with respect to loading direction on response, composite action, and failure modes. The results were compared with theoretical fully composite and fully noncomposite values. The following was concluded:
foam-concrete bond could fail from freezing and thawing, thermal, or loading cycles. The load corresponding to foam shear only ∆Pfoam can be estimated by deducting the load at zero shear stiffness from the load corresponding to foam shear only (that is, the load at the vertical dotted line). The loss of foam shear transfer may then be accounted for by deducting ∆Pfoam from the loads achieved at subsequent shear-stiffness values.
Ductility and deformability
Table 3 presents ductility (for steel-reinforced panels) and deformability (for all panels) factors. The deformability of the full panels was higher than that of their structural counterparts’ wythes only. Specimens SPF and SSF had 50% higher J-factors (Eq. [2]) than specimens SPS and SSS. Specimen HPF showed the greatest deformabil-ity, which can be linked to the higher amounts of shear deformation in the core region relative to the other panels. Specimen BPF was only slightly higher in deformability than specimen BPS, likely due to the fact that the panel failed by loss of shear connection, which reduced the J-factor moment component. Energy methods consistently gave higher (8% to 22%) estimates of deformability than the J-factor, with the value tending to increase with ulti-mate load. In flexural members, it is desirable to achieve J-factors equal to or higher than 4.0 because this allows for warning of failure through large excessive deflection and energy dissipation. Aside from specimens SSS and SPS, this held true, but even specimens SSS and SPS had ductility indices greater than 2.0 and provided warning of failure through excessive crack widths at the point of failure.
For steel-reinforced panels, ductility ranged from 2.16 to 3.20 and gave visual warnings of failure through excessive
Table 7. Composite action by stiffness methods at service load.
SpecimenSpecimen D, × 1012 N-mm2 Structural analysis D, × 1012 N-mm2
Composite action κD, %By deflection By rotation Average Fully composite Noncomposite
SPF 5.08 5.13 5.11 53.6 1.77 6.4
SSF 5.52 5.16 5.34 53.6 1.75 3.9
SPS 1.48 1.42 1.45 n/a n/a n/a
SSS 1.46 1.31 1.39 n/a n/a n/a
HPF 3.81 3.75 3.78 53.6 1.77 6.9
BPF 3.45 3.19 3.32 53.6 1.74 3.0
BPS 1.51 1.52 1.52 n/a n/a n/a
Note: BFRP = basalt-fiber-reinforced polymer; BPF = full panel BFRP-reinforced wall; BPS = structural wythe BFRP-reinforced wall; D = panel stiff-ness; HPF = same flexural design as SPF but has BFRP shear connectors; n/a = not applicable; SPF = control full-panel reinforced with steel longitu-dinal bars and steel shear connectors with the load applied to the facade wythe; SPS = structural wythe with the ribs on the compression side; SSF = identical to SPF except load applied on the structural wythe; SSS = structural wythe with the ribs on the tension side. 1 × 10⁶ N-mm2 = 0.345 kip-in.2

November–December 2015 | PCI Journal68
panel with steel-reinforced wythes and steel connec-tors. In both cases the steel reinforcement ruptured in tension.
• With equal longitudinal reinforcement ratios, rib crushing is more likely to occur with BFRP than with steel reinforcement because the lower reinforcement causes wider cracks, limiting concrete aggregate interlock and reducing the shear capacity. In addition, the higher strength of the reinforcement makes it more likely to cause concrete crushing. This failure mode should be considered in design because designing purely for flexure with BFRP-reinforced walls may overestimate their capacity.
• While BFRP connectors provided less composite ac-tion than steel connectors in similar panels with steel-reinforced wythes, the added deformations and deflec-tions at ultimate led to higher deformability factors.
• The BFRP-reinforced panels showed a distinct load plateau after the onset of connector failure, which gave warnings of failure beyond the excessive deflec-tions typically used to provide warnings of failure in FRP-reinforced sections.
• Digital image correlation results can be used to show that the insulation contributes to shear resistance and can detect failure of the insulation-concrete bond. This is not definitively observed using conventional slip-measurement techniques.
In this study the reversed bending induced by wind suction was simulated by flipping the specimen and applying pres-sure to the structural wythe. Although this technique pro-vides the correct tension and compression in the respective wythes, it does not account for the transverse pulling effect of wind suction, which puts the foam-concrete interface in tension and could weaken the composite action.
In this study, BFRP performed adequately as a shear con-nector and as longitudinal reinforcement. If considering this material in practice, designers should pay special attention to the lower material stiffness relative to steel with particu-lar focus on the impact on deflections, partial composite action, and shear resistance. The authors recommend that additional research focusing on the long-term performance of BFRP-reinforced sandwich panels subject to fatigue, en-vironmental effects, and axial loading be performed before this material is used in practice.
References
1. Cuddihy, J., C. Kennedy, and P. Byer. 2005. “Energy Use in Canada: Environmental Impacts and Oppor-tunities in Relationship to Infrastructure Systems.” Canadian Journal of Civil Engineering 32 (1): 1–15.
• Strength-based methods for composite action gave val-ues from 51% to 90% composite action, while stiffness-based techniques gave from 3% to 6.9% composite ac-tion. Strength methods should be used for ultimate limit state checks, while stiffness methods should be used for serviceability-limit-state checks. Both methods saw increases in composite action with increases in shear-connection and longitudinal-reinforcement stiffness.
• In steel-reinforced wythes, partial composite action increased the ultimate load of the structural wythe 2.49 times in pressure loading, 2.99 times in simulated suc-tion when steel connectors were used, and 2.21 times in pressure when BFRP ties were used. In BFRP-rein-forced wythes with BFRP connectors, partial compos-ite action increased the ultimate load of the structural wythe 1.65 times in pressure loading. This highlights that designing walls using the capacity of a single wythe only may severely underestimate their strength and stiffness.
• The panel with steel-reinforced wythes and BFRP con-nectors achieved 90% of the flexural strength of the
Figure 13. Parameter impact. Note: BFRP = basalt-fiber-reinforced polymer; BPF = full panel BFRP-reinforced wall; FC = full composite; HPF = same flexural design as SPF but has BFRP shear connectors; SPF = control full-panel reinforced with steel longitudinal bars and steel shear connectors with the load applied to the facade wythe; SSF = identical to SPF except load applied on the structural wythe. Note: 1 kN = 0.225 kip.
0 10 20 30 40 50 60
0 10 20 30 40 50 60
20
40
60
80
100
120
SPFSPS
SSF
SSS
HPFBPS
BPF
Shear connection stiffness, N × 106
SPF
SPSSSF
SSS
HPF
Ulti
mat
e Lo
ad, k
NYi
eld
Load
, kN
20
40
60
80
100
120
FC pressure, BFRPFC pressure, steel
FC suction, steel
Foam contribution
Foam contribution
FC pressure, steel
FC suction, steel
Shear connection stiffness, N × 106
Steel longitudinal reinforcement (pressure)Steel longitudinal reinforcement (suction)BFRP longitudinal reinforcement (pressure)
Ultimate load
Yield load

69PCI Journal | November–December 2015
14. Pessiki, S., and A. Mlynarczyk. 2003. “Experimen-tal Evaluation of the Composite Behavior of Precast Concrete Sandwich Wall Panels.” PCI Journal 48 (2): 54–71.
15. Woltman, G., D. Tomlinson, and A. Fam. 2013. “Investigation of Various GFRP Shear Connectors for Insulated Precast Concrete Sandwich Wall Panels.” Journal of Composites for Construction 17 (5): 711–721.
16. Tomlinson, D., and A. Fam. 2014. “Experimental Inves-tigation of Precast Concrete Insulated Sandwich Panels with Glass Fiber-Reinforced Polymer Shear Connec-tors.” ACI Structural Journal 111 (3): 595–606.
17. Brik, V. 2003. Advanced Concept Concrete Using Basalt Fiber/BF Composite Rebar Reinforcement. Washington: DC: Transportation Research Board.
18. Naito, C., J. Hoemann, M. Beacraft, and B. Bewick. 2012. “Performance and Characterization of Shear Ties for Use in Insulated Precast Concrete Sandwich Wall Panels.” Journal of Structural Engineering 138 (1): 52–61.
19. Tomlinson, D. G., N. Teixeira, and A. Fam. 2014. “Comparison of Steel and Basalt-FRP Angled Shear Connectors in Precast Concrete Sandwich Wall Panels” In 60th PCI Convention and National Bridge Conference. Chicago, IL: PCI.
20. Wu, G., X. Wang, Z. Wu, Z. Dong, and G. Zhang. 2015. “Durability of Basalt Fibers and Composites in Corrosive Environments.” Journal of Composite Materials 49 (7): 873–887.
21. Sim, J., C. Park, and D. Y. Moon. 2005. “Character-istics of Basalt Fiber as a Strengthening Material for Concrete Structures.” Composites Part B: Engineering 36 (6–7): 504–512.
22. ASHRAE. 2010. Energy Standard for Buildings ex-cept Low-Rise Residential Buildings. ASHRAE 90.1. Atlanta, GA: ASHRAE.
23. CSA (Canadian Standards Association). 2004. Design of Concrete Structures. CAN/CSA-A23.3-04. Rex-dale, ON, Canada: CSA.
24. ACI (American Concrete Institute) Committee 318. 2014. Building Code Requirements for Structural Concrete (ACI 318-14) and Commentary (ACI 318R-14). Farmington Hills, MI: ACI.
25. Take, W. A., M. D. Bolton, and D. J. White. 2003. “Soil Deformation Measurement Using Particle Image
2. Al-Homoud, M. S. 2005. “Performance Characteristics and Practical Applications of Common Building Ther-mal Insulation Materials.” Building and Environment 40 (3): 353–366.
3. Gajda, J. 2001. Energy Use of Single-Family Houses with Various Exterior Walls. Skokie, IL: Portland Ce-ment Association.
4. Brown, W. C., P. Eng, D. L. Scott, and D. G. J. Dechamplain. 2001. “Building Science Details for Architectural Precast Concrete Sandwich Panels.” In Thermal Performance of the Exterior Envelopes of Buildings VIII, 1–13. Atlanta, GA: American Society of Heating, Refrigerating, and Air Conditioning Engi-neers (ASHRAE). CD-ROM.
5. PCI Committee on Precast Concrete Sandwich Panels. 2011. “State of the Art of Precast/Prestressed Concrete Sandwich Wall Panels.” PCI Journal 56 (2): 131–176.
6. PCI Committee on Precast Concrete Sandwich Panels. 1997. “State-of-the-Art of Precast/Prestressed Sand-wich Wall Panels.” PCI Journal 42 (2): 1–61.
7. Maximos, H. N., W. A. Pong, M. K. Tadros, and L. D. Martin. 2007. Behavior and Design of Composite Pre-cast Prestressed Concrete Sandwich Panels with NU-Tie. Lincoln, NE: University of Nebraska–Lincoln.
8. Benayoune, A., A. A. A. Samad, D. N. Trikha, A. A. Abang Ali, and S. H. M. Ellinna. 2008. “Flexural Behaviour of Pre-cast Concrete Sandwich Composite Panel — Experimental and Theoretical Investiga-tions.” Construction and Building Materials 22 (4): 580–592.
9. Hassan, T. K., and S. H. Rizkalla. 2010. “Analysis and Design Guidelines of Precast, Prestressed Concrete, Sandwich Wall Panels Reinforced with CFRP Grid.” PCI Journal 55 (2): 147–162.
10. Lee, B. J., and S. Pessiki. 2008. “Revised Zone Meth-od R-Value Calculation for Precast Concrete Sandwich Panels Containing Metal Wythe Connectors.” PCI Journal, 53 (5): 86–100.
11. Allen, H. G. 1969. Analysis and Design of Structural Sandwich Panels. Oxford, England: Pergamon Press.
12. McCall, W. 1985. “Thermal Properties of Sandwich Panels.” Concrete International 7 (1): 35–41.
13. Frankl, B. A., G. W. Lucier, and T. K. Hassan. 2011. “Behavior of Precast, Prestressed Concrete Sandwich Wall Panels Reinforced with CFRP Shear Grid.” PCI Journal 56 (1): 42–54.

November–December 2015 | PCI Journal70
Gc = effective shear-connection stiffness accounting for both connector and insulation contribution
Gin = shear modulus of insulation foam
L = panel span length
LL = live load
Mu = midspan moment at ultimate
MNL = midspan moment at point of first material nonlinear-ity
n = number of shear connectors
P = applied load
Pexp = observed experimental load
PFC = theoretically fully composite section load
PNC = theoretically noncomposite section load
UL = ultimate load
∆Pfoam = load corresponding to foam shear only
∆u = midspan deflection at ultimate
∆y = midspan deflection at yielding
δ = midspan deflection
δNL = midspan deflection at point of first material nonlin-earity
δu = midspan deflection at ultimate
εc = concrete strain
θ = shear connector insertion angle
κ = degree of composite action
κD = degree of composite action based on member stiff-ness
κs = degree of composite action based on service load
κu = degree of composite action based on ultimate load
κy = degree of composite action based on yield load
Φ = member deformability
ϕ = wythe end rotation
Velocimetry (PIV) and Photogrammetry.” Géotech-nique 53 (7): 619–631.
26. National Research Council of Canada. 2005. National Building Code of Canada. NBCC-2005. Ottawa, ON, Canada: National Research Council of Canada.
27. Newhook, J., A. Ghali, and G. Tadros. 2002. “Concrete Flexural Members Reinforced with Fiber Reinforced Polymers: Design for Cracking and Deformabil-ity.” Canadian Journal of Civil Engineering 29 (1): 125–134.
28. Theriault, M., and B. Benmokrane. 1998. “Effects of FRP Reinforcement Ratio and Concrete Strength on Flexural Behaviour of Concrete Beams.” Journal of Composites for Construction 2 (1): 7–16.
29. Bentz, E. C. 2000. “Sectional Analysis of Reinforced Concrete Members.” PhD thesis, University of To-ronto, Toronto, ON, Canada.
Notation
a = shear span length
A = gross reinforcement cross-sectional area
Ag = gross concrete cross-sectional area
Ain = insulation foam area subject to shear
Asc = shear connector cross-sectional area
D = stiffness
Dexp = experimental service stiffness incorporating shear deformation through the insulation layer
DFC = theoretical fully composite service stiffness
DNC = theoretical noncomposite service stiffness
Dδ = experimental service stiffness incorporating shear deformation evaluated based on deflections
Dϕ = experimental service stiffness incorporating shear deformation evaluated based on end rotation
DL = dead load
E = reinforcement modulus of elasticity
Esc = shear connector modulus of elasticity
fy = steel yield stress

71PCI Journal | November–December 2015
About the authors
Douglas G. Tomlinson is a PhD candidate and Canada Foundation for Innovation project manager in the Department of Civil Engineer-ing at Queen’s University in Kingston, ON, Canada.
Amir Z. Fam, PhD, PEng, is a professor and the Donald and Sarah Munro Chair in Engineer-ing and Applied Science for the Department of Civil Engineering at Queen’s University.
Abstract
A single-story precast concrete insulated sandwich wall panel design was tested in flexure. Testing parameters included shear-connector and flexural-reinforcement material type, namely steel and basalt-fiber-reinforced polymer (BFRP). BFRP connectors have the advantage of lower thermal bridging than conventional metallic connectors. Some walls were tested without facade wythes to quantify the additional capacity contributed by the facade through partial composite action. Steel-reinforced walls showed a strength-based composite ac-tion exceeding 90% with steel connectors and 75% with
BFRP connectors. Alternatively, BFRP-reinforced walls with BFRP connectors showed only 51% composite action. When evaluating composite action by deflection, rather than load, the walls had substantially lower val-ues, ranging from 3% to 6.9%. BFRP-reinforced panels had lower strength than the steel-reinforced panels be-cause they were prone to shear-compression failure but had higher deflections at ultimate. Shear deformation between wythes increased deformability, with the high-est value observed in a panel with BFRP connectors and steel flexural reinforcement. Digital image correlation was used to determine wythes’ relative slip and rotations at the panel ends. The wall design performed adequately as a non-load-bearing wall based on building-code requirements for maximum wind pressure.
Keywords
Basalt, facade, fiber-reinforced polymer, FRP, partially composite, sandwich panel, shear connector, structural wythe.
Review policy
This paper was reviewed in accordance with the Precast/Prestressed Concrete Institute’s peer-review process.
Reader comments
Please address reader comments to [email protected] or Precast/Prestressed Concrete Institute, c/o PCI Journal, 200 W. Adams St., Suite 2100, Chicago, IL 60606. J