Flexplane:)An)Experimentaon)Plaorm) for)Resource ...
20
Flexplane: An Experimenta0on Pla3orm for Resource Management in Datacenters Amy Ousterhout, Jonathan Perry, Hari Balakrishnan, Petr Lapukhov
Transcript of Flexplane:)An)Experimentaon)Plaorm) for)Resource ...

Flexplane: An Experimenta0on Pla3orm for Resource Management in Datacenters
Amy Ousterhout, Jonathan Perry, Hari Balakrishnan, Petr Lapukhov
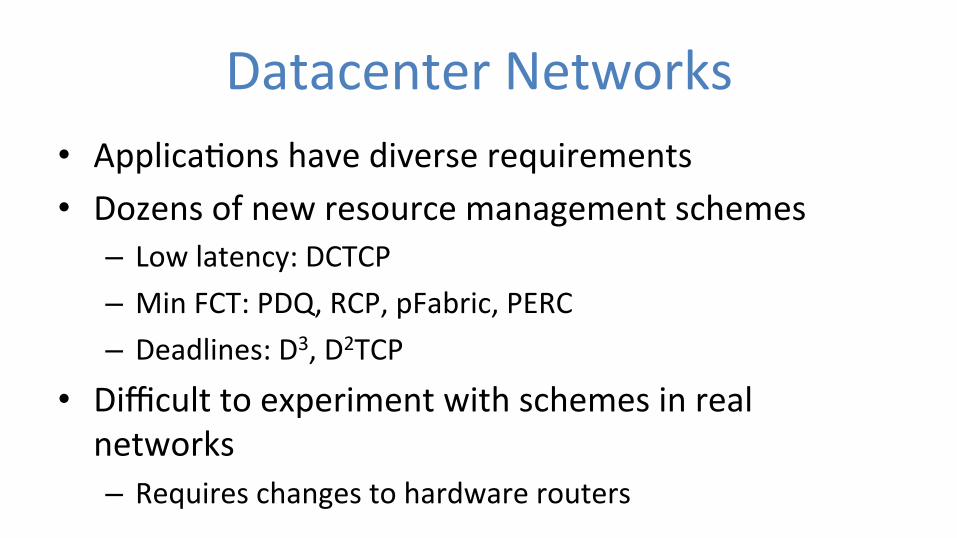
Datacenter Networks • Applica0ons have diverse requirements • Dozens of new resource management schemes – Low latency: DCTCP – Min FCT: PDQ, RCP, pFabric, PERC – Deadlines: D3, D2TCP
• Difficult to experiment with schemes in real networks – Requires changes to hardware routers
Experimenta0on with Resource Management
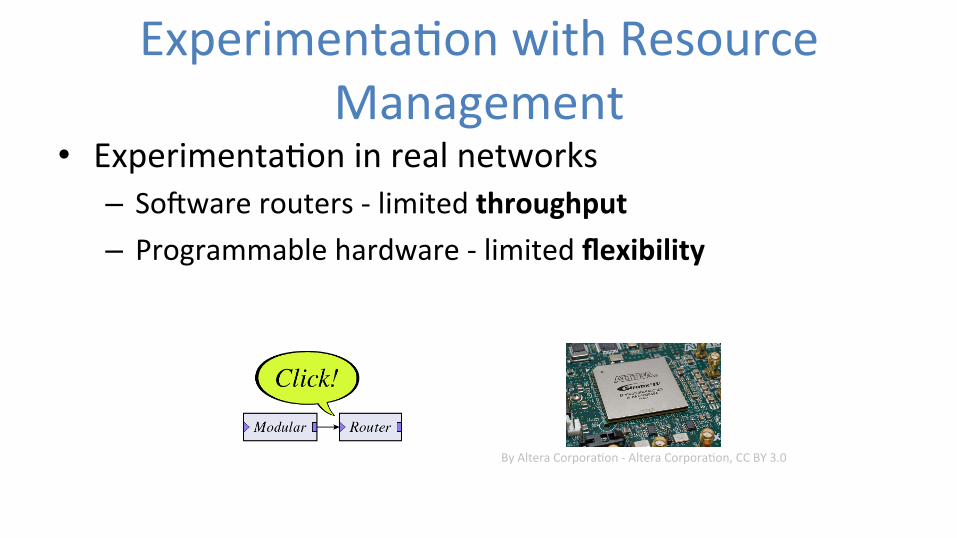
• Experimenta0on in real networks – SoSware routers -‐ limited throughput – Programmable hardware -‐ limited flexibility
By Altera Corpora0on -‐ Altera Corpora0on, CC BY 3.0

Experimenta0on with Resource Management
• Experimenta0on in simula0on (e.g., ns, OMNeT++) – Does not accurately model real network stacks, NICs, and distributed applica0ons
– Does not run in real 0me
No exis0ng approach to experimenta0on provides accuracy, flexibility, and high throughput

Our Contribu0ons • Key idea: whole-‐network emula0on • Flexplane: a pla3orm for faithful experimenta0on with resource management schemes – Accurate – predicts behavior of hardware – Flexible – express schemes in C++ – High throughput – 761 Gbits/s
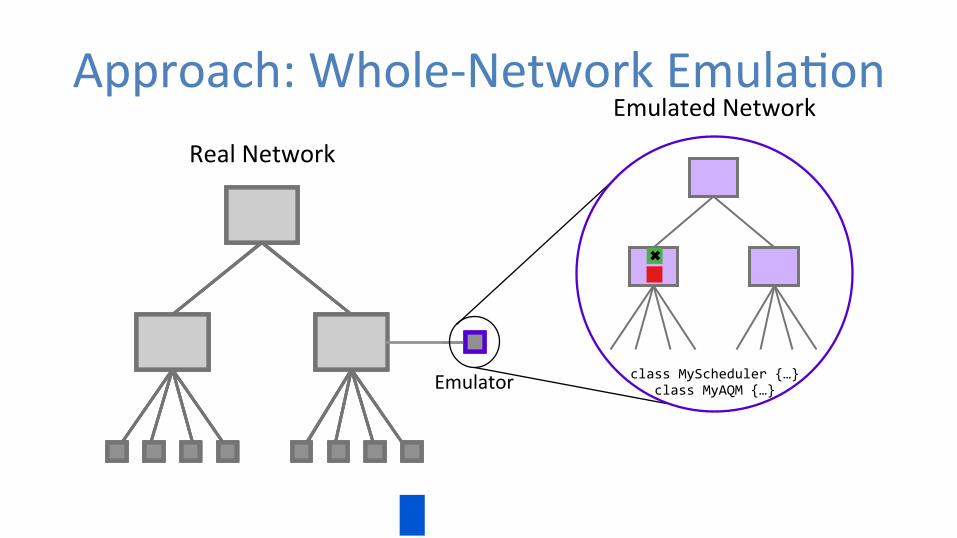
Approach: Whole-‐Network Emula0on Real Network
class MyScheduler {…}
Emulated Network
Emulator class MyAQM {…}
Abstract Packets • Resource management schemes are data-‐independent
• Concise representa0on of one MTU – Source, des0na0on, flow, ID – Custom per-‐scheme fields

Emulator • Real-‐0me network simulator • Faster than standard network simulators – Time divided into abstract-‐packet-‐sized 0meslots – Omits endpoint soSware
Real Network
Emulated Network
Emulator

Accuracy • Goal: predict behavior of a hardware network • Hardware latency: unloaded delay + queuing delay • Added latency of Flexplane: – RTT to emulator – Unloaded delay – Queuing delay in real network
Real Network
Emulated Network
Emulator
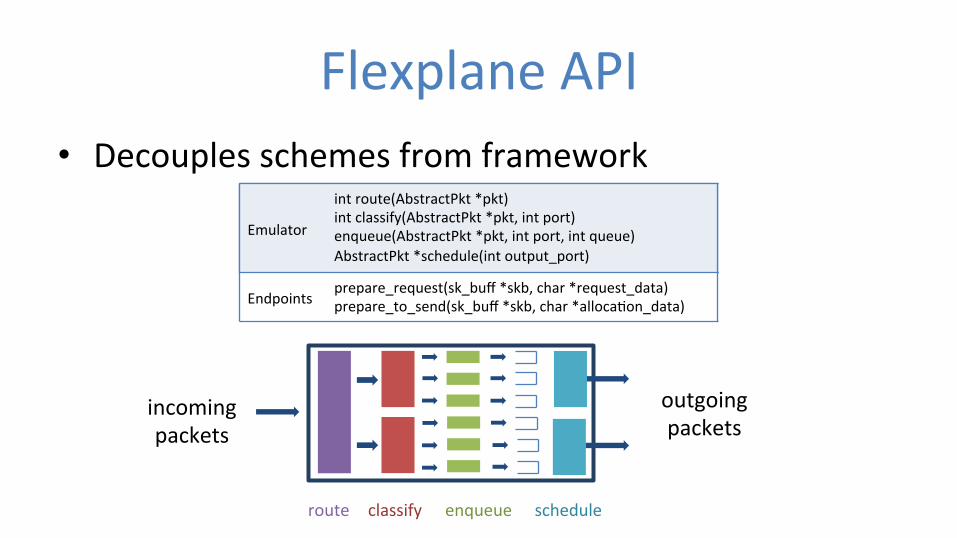
Flexplane API • Decouples schemes from framework
incoming packets
outgoing packets
route classify enqueue schedule
Emulator
int route(AbstractPkt *pkt) int classify(AbstractPkt *pkt, int port) enqueue(AbstractPkt *pkt, int port, int queue) AbstractPkt *schedule(int output_port)
Emulator
int route(AbstractPkt *pkt) int classify(AbstractPkt *pkt, int port) enqueue(AbstractPkt *pkt, int port, int queue) AbstractPkt *schedule(int output_port)
Endpoints prepare_request(sk_buff *skb, char *request_data) prepare_to_send(sk_buff *skb, char *alloca0on_data)

Mul0core Emulator Architecture • Pin network components (routers, endpoints) to cores
• Communica0on via FIFO queues • Router state not shared across cores
aggrega0on
endpoints
ToR CPU core
Implementa0on • Emulator uses Intel DPDK for low-‐latency NIC access • Endpoints run a Linux qdisc

Evalua0on • Accuracy • U0lity • Emulator throughput

Flexplane is Accurate • Bulk TCP: 5 senders, 1 receiver • Throughput 9.2-‐9.3 Gbits/s vs. 9.4 Gbits/s in hardware
• Similar queue occupancies by two. We run DropTail both in Flexplane and on thehardware switch.
The results in Figure 3 demonstrate that the per-packetlatency overhead of Flexplane is modest. Under the light-est offered load we measure (10,000 packets/s), the me-dian latency in Flexplane is 33.8 µs, compared to 14.9 µson hardware. As the load increases, the latency in Flex-plane increases slightly due to the additional load on thekernel module in the sending endpoint. Flexplane is un-able to meet the highest offered load (6 Gbits/s), becauseof the CPU overhead of the kernel module. Note that state-of-the-art software routers add latencies of the same orderof magnitude for each hop, even without the added round-trip time to an off-path emulator: 47.6-66.4 µs [21] for aCPU-based software router; 30 µs [31] or 140-260 µs [27]for GPU-based software routers.
Throughput. Next we evaluate accuracy for bulk-transferTCP, using network-level metrics: throughput and in-network queueing. In each experiment, five machinessend TCP traffic at maximum throughput to one receiver.
We compare Flexplane to hardware for three schemesthat our router supports: TCP-cubic/DropTail, TCP-cubic/RED, and DCTCP. We configure the hardwarerouter and the emulator using the same parameters foreach scheme. For DropTail we use a static per-portbuffer size of 1024 MTUs. For RED, we use min th=150,max th=300, max p=0.1, and weight=5. For DCTCP, weuse an ECN-marking threshold of 65 MTUs, as recom-mended by its designers [10].
Flexplane achieves similar aggregate throughput as thehardware. All three schemes consistently saturate thebottleneck link, achieving an aggregate throughput of9.4 Gbits/s in hardware, compared to 9.2-9.3 Gbits/s inFlexplane. This 1-2% difference in throughput is due tobandwidth allocated for abstract packets in Flexplane.
Queueing. During the experiment described above, wesample the total buffer occupancy in the hardware routerevery millisecond, and the emulator logs the occupancyof each emulated port at the same frequency.
Table 2 shows that Flexplane maintains similar queueoccupancies as the hardware schemes. For DropTail itmaintains high occupancies (close to the max of 1024)with large variations in occupancy, while for the other twoschemes the occupancies are lower and more consistent.Flexplane does differ from hardware in that its occupan-cies tend to be slightly lower and to display more variation.We believe this is due to the effectively longer RTT inFlexplane. When the congestion window is reduced, thepause before sending again is longer in Flexplane, allow-ing the queues to drain more.
During the Flexplane experiments, the hardware queuesizes remain small: the mean is 7-10 MTUs and the 95thpercentile is 14-22 MTUs. These numbers are small com-
Median Queue Occupancies(MTUs)
Hardware FlexplaneDropTail 931 837
RED 138 104DCTCP 61 51
Table 2: Flexplane achieves similar queue occupancies andstandard deviations in occupancies (s ) as hardware.
pared to the queue sizes in the emulator or in the hardwarequeues during the hardware experiments, and indicate thatqueueing in the hardware network does not significantlyimpact the accuracy of Flexplane (§3.4).Flow completion time. Next we evaluate Flexplane’s ac-curacy at the application level in terms of flow completiontime (FCT). We run an RPC-based application in whichfour clients repeatedly request data from 32 servers. Thesize of the requested data is determined by an empiricalworkload derived from live traffic in a production datacen-ter that supports web search (first presented in [10]). Itincludes a mixture of flows of different sizes. 53% of theflows are small flows of less than 100KB, but 37% of thebytes come from large flows of 10MB or larger. Requesttimes are chosen by a Poisson process such that the clientsreceive a specified load between 10% and 80%. We nor-malize the FCT for each flow to the average FCT achievedby a flow of the same size, in an unloaded network, whenflows are requested continuously.
We run this application for DropTail and DCTCP, inFlexplane and in the hardware network. Figure 4 showsthe average normalized FCTs. For both small flows andlarge flows, results with Flexplane closely match resultsobtained with a hardware network. For loads up to 60%with both schemes, Flexplane estimates average normal-ized FCTs of hardware to within 2-8% for small flowsand 3-14% for large flows. Accuracy decreases slightlyfor higher loads of 70% and 80%, but remains within 18%for small flows and 24% for large flows.
5.2 Flexplane UtilityIn this section, we evaluate the utility of Flexplane. Westudy how easy it is to write new schemes in Flexplane andprovide four examples of how Flexplane can be useful.Ease of use. To demonstrate the simplicity of implemen-tation, we show the key portions of the source code forpriority queueing scheduling in Figure 5. Most schemesrequire only a few dozen lines of code to implement, asshown in Table 3. pFabric requires significantly morecode than other schemes because it does not maintainpackets in FIFO order between the enqueue and dequeuestages; 170 of the 251 lines of code are used to implementcustom queueing.Parameter tuning. Flexplane enables users to quicklytune protocol parameters to accommodate different net-
●●
●
●
●
●
●
●
0
1
2
3
4
5
6
0.2 0.4 0.6 0.8Load
Aver
age
Nor
mal
ized
FCT
●
FlexplaneHardware
(a) DropTail, (0, 100KB]
●
●
●●
●
●●●
0
1
2
3
4
5
6
0.2 0.4 0.6 0.8Load
Aver
age
Nor
mal
ized
FCT
(b) DCTCP, (0, 100KB]
●
●
●
●●
●
●
●
0
1
2
3
4
5
6
0.2 0.4 0.6 0.8Load
Aver
age
Nor
mal
ized
FCT
(c) DropTail, (10MB, •)
●●
●
●
●
●
●●
0
1
2
3
4
5
6
0.2 0.4 0.6 0.8Load
Aver
age
Nor
mal
ized
FCT
(d) DCTCP, (10MB, •)
Figure 4: Flexplane closely matches the average normalized flow completion times of hardware for DropTail and DCTCP. The lefttwo graphs show results for small flow sizes; the right two graphs show results for large flow sizes.
class PriorityScheduler : public Scheduler {
public:
AbstractPkt
*
PriorityScheduler::schedule(uint32_t
port) {
/
*
get the mask of non-empty queues
*
/
uint64_t mask = m_bank->non_empty_qmask(port);
uint64_t q_index;
/
*
bsfq: find the first set bit in mask
*
/
asm("bsfq %1,%0":"=r"(q_index):"r"(mask));
return m_bank->dequeue(port, q_index);
}
private:
PacketQueueBank
*
m_bank;
}
Figure 5: Source code for a priority scheduler in Flexplane over 64 queues. A PacketQueueBank stores packets between thecalls to enqueue and schedule.
scheme LOCdrop tail queue manager 39
RED queue manager 125DCTCP queue manager 43
priority queueing scheduler 29round robin scheduler 40
HULL scheduler 60pFabric QM, queues, scheduler 251
Table 3: Lines of code (LOC) in the emulator for each resourcemanagement scheme.
works. For example, the authors of HULL [11] conductedevaluations using a testbed with 1 Gbits/s links; we useFlexplane to tune HULL’s parameters to fit our 10 Gbits/snetwork. We use the recommended phantom queue drainrate of 95% of the link speed (9.5 Gbits/s). The HULL au-thors use a 1 KB marking threshold in a 1 Gbits/s network,and suggest a marking threshold of 3-5 KB for 10 Gbit-s/s links. We found, however, that throughput degradedsignificantly with a 3 KB marking threshold, achievingonly 5 Gbits/s total with four concurrent flows. We there-fore increased the marking threshold until our achievedthroughput was 92% of the drain rate (this is what [11]achieves with their parameters); the resulting threshold is15 KB. Flexplane helped us conduct this parameter searchquickly and effectively.Evaluating trade-offs. In this example, we demonstratehow one might use Flexplane to evaluate the performance
●
●
●
● ●
●
●
better
HULL
DropTail
Priority Queueing250
300
350
400
303540455055Low priority FCT (ms)
Hig
h pr
iorit
y FC
T (u
s)
●
●
●
●
●
●
●
DCTCPDropTailHULLpFabric
Priority QueueingREDRound Robin
Figure 6: Flexplane enables users to explore trade-offs betweendifferent schemes. Large points show averages over the entireexperiment, faded points show averages over 1s, and ellipsesshow one standard deviation. Note the flipped axes.
of a specific application with different resource manage-ment schemes. We do not argue that any scheme is betterthan any other, but instead demonstrate that there are trade-offs between different schemes (as described in [47]), andthat Flexplane can help users explore these trade-offs.
We use an RPC-based workload and consider the trade-off that schemes make between performance for shortflows and performance for long flows. In the experiment,four clients repeatedly request data from 32 servers. 80%of the requests are short 1.5 KB “high priority” requests,while the remaining 20% are 10 Mbyte “low priority”requests. Request times are chosen by a Poisson processsuch that the client NICs are receiving at about 60% oftheir maximum throughput. We evaluate the schemesdiscussed in §5.1, as well as TCP-cubic/per-flow-DRR,TCP-cubic/priority-queueing, HULL, and pFabric.
Figure 6 shows the trade-off each scheme makes onthis workload. With DropTail, large queues build up inthe network, leading to high flow completion times for thehigh-priority requests. However, DropTail senders rarelycut back their sending rates and therefore achieve goodFCTs for the long requests. At the other end of the spec-trum, HULL’s phantom queues cause senders to decreasetheir sending rates early, leading to unutilized bandwidthand worse performance for the low priority flows; thehigh priority flows achieve relatively good performancebecause they encounter little queueing in the network.
●●
●
●
●
●
●
●
0
1
2
3
4
5
6
0.2 0.4 0.6 0.8Load
Aver
age
Nor
mal
ized
FCT
●
FlexplaneHardware
(a) DropTail, (0, 100KB]
●
●
●●
●
●●●
0
1
2
3
4
5
6
0.2 0.4 0.6 0.8Load
Aver
age
Nor
mal
ized
FCT
(b) DCTCP, (0, 100KB]
●
●
●
●●
●
●
●
0
1
2
3
4
5
6
0.2 0.4 0.6 0.8Load
Aver
age
Nor
mal
ized
FCT
(c) DropTail, (10MB, •)
●●
●
●
●
●
●●
0
1
2
3
4
5
6
0.2 0.4 0.6 0.8Load
Aver
age
Nor
mal
ized
FCT
(d) DCTCP, (10MB, •)
Figure 4: Flexplane closely matches the average normalized flow completion times of hardware for DropTail and DCTCP. The lefttwo graphs show results for small flow sizes; the right two graphs show results for large flow sizes.
class PriorityScheduler : public Scheduler {
public:
AbstractPkt
*
PriorityScheduler::schedule(uint32_t
port) {
/
*
get the mask of non-empty queues
*
/
uint64_t mask = m_bank->non_empty_qmask(port);
uint64_t q_index;
/
*
bsfq: find the first set bit in mask
*
/
asm("bsfq %1,%0":"=r"(q_index):"r"(mask));
return m_bank->dequeue(port, q_index);
}
private:
PacketQueueBank
*
m_bank;
}
Figure 5: Source code for a priority scheduler in Flexplane over 64 queues. A PacketQueueBank stores packets between thecalls to enqueue and schedule.
scheme LOCdrop tail queue manager 39
RED queue manager 125DCTCP queue manager 43
priority queueing scheduler 29round robin scheduler 40
HULL scheduler 60pFabric QM, queues, scheduler 251
Table 3: Lines of code (LOC) in the emulator for each resourcemanagement scheme.
works. For example, the authors of HULL [11] conductedevaluations using a testbed with 1 Gbits/s links; we useFlexplane to tune HULL’s parameters to fit our 10 Gbits/snetwork. We use the recommended phantom queue drainrate of 95% of the link speed (9.5 Gbits/s). The HULL au-thors use a 1 KB marking threshold in a 1 Gbits/s network,and suggest a marking threshold of 3-5 KB for 10 Gbit-s/s links. We found, however, that throughput degradedsignificantly with a 3 KB marking threshold, achievingonly 5 Gbits/s total with four concurrent flows. We there-fore increased the marking threshold until our achievedthroughput was 92% of the drain rate (this is what [11]achieves with their parameters); the resulting threshold is15 KB. Flexplane helped us conduct this parameter searchquickly and effectively.Evaluating trade-offs. In this example, we demonstratehow one might use Flexplane to evaluate the performance
●
●
●
● ●
●
●
better
HULL
DropTail
Priority Queueing250
300
350
400
303540455055Low priority FCT (ms)
Hig
h pr
iorit
y FC
T (u
s)
●
●
●
●
●
●
●
DCTCPDropTailHULLpFabric
Priority QueueingREDRound Robin
Figure 6: Flexplane enables users to explore trade-offs betweendifferent schemes. Large points show averages over the entireexperiment, faded points show averages over 1s, and ellipsesshow one standard deviation. Note the flipped axes.
of a specific application with different resource manage-ment schemes. We do not argue that any scheme is betterthan any other, but instead demonstrate that there are trade-offs between different schemes (as described in [47]), andthat Flexplane can help users explore these trade-offs.
We use an RPC-based workload and consider the trade-off that schemes make between performance for shortflows and performance for long flows. In the experiment,four clients repeatedly request data from 32 servers. 80%of the requests are short 1.5 KB “high priority” requests,while the remaining 20% are 10 Mbyte “low priority”requests. Request times are chosen by a Poisson processsuch that the client NICs are receiving at about 60% oftheir maximum throughput. We evaluate the schemesdiscussed in §5.1, as well as TCP-cubic/per-flow-DRR,TCP-cubic/priority-queueing, HULL, and pFabric.
Figure 6 shows the trade-off each scheme makes onthis workload. With DropTail, large queues build up inthe network, leading to high flow completion times for thehigh-priority requests. However, DropTail senders rarelycut back their sending rates and therefore achieve goodFCTs for the long requests. At the other end of the spec-trum, HULL’s phantom queues cause senders to decreasetheir sending rates early, leading to unutilized bandwidthand worse performance for the low priority flows; thehigh priority flows achieve relatively good performancebecause they encounter little queueing in the network.
DCTCP (0, 100KB]
DCTCP (10MB, ∞)
0
1
2
3
4
5
6
0.2 0.4 0.6 0.8Load
Aver
age
Nor
mal
ized
FCT
●
FlexplaneHardware
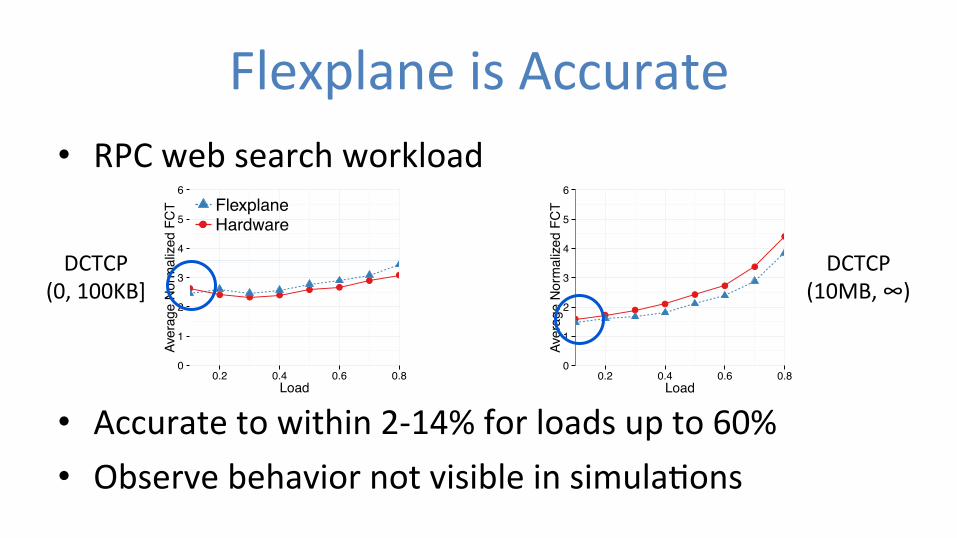
• RPC web search workload • Accurate to within 2-‐14% for loads up to 60% • Observe behavior not visible in simula0ons
Flexplane is Accurate
Queue Occupancies (MTUs)Hardware Flexplane
median s median sDropTail 931 73.7 837 98.6
RED 138 12.9 104 32.5DCTCP 61 4.9 51 13.0
Table 2: Flexplane achieves similar queue occupancies andstandard deviations in occupancies (s ) as hardware.
use an ECN-marking threshold of 65 MTUs, as recom-mended by its designers [8].
Flexplane achieves similar aggregate throughput as thehardware. All three schemes consistently saturate thebottleneck link, achieving an aggregate throughput of9.4 Gbits/s in hardware, compared to 9.2-9.3 Gbits/s inFlexplane. This 1-2% difference in throughput is due tobandwidth allocated for abstract packets in Flexplane.Queueing. During the experiment described above, wesample the total buffer occupancy in the hardware routerevery millisecond, and the emulator logs the occupancyof each emulated port at the same frequency.
Table 2 shows that Flexplane maintains similar queueoccupancies as the hardware schemes. For DropTail itmaintains high occupancies (close to the max of 1024)with large variations in occupancy, while for the other twoschemes the occupancies are lower and more consistent.Flexplane does differ from hardware in that its occupan-cies tend to be slightly lower and to display more variation.We believe this is due to the effectively longer RTT inFlexplane. When the congestion window is reduced, thepause before sending again is longer in Flexplane, allow-ing the queues to drain more.
During the Flexplane experiments, the hardware queuesizes remain small: the mean is 7-10 MTUs and the 95thpercentile is 14-22 MTUs. These numbers are small com-pared to the queue sizes in the emulator or in the hardwarequeues during the hardware experiments, and indicate thatqueueing in the hardware network does not significantlyimpact the accuracy of Flexplane (§3.4).Flow completion time. Next we evaluate Flexplane’s ac-curacy at the application level in terms of flow completiontime (FCT). We run an RPC-based application in whichfour clients repeatedly request data from 32 servers. Thesize of the requested data is determined by an empiricalworkload derived from live traffic in a production data-center that supports web search (first presented in [8]). Itincludes a mixture of flows of different sizes. 53% of theflows are small flows of less than 100KB, but 37% of thebytes come from large flows of 10MB or larger. Requesttimes are chosen by a Poisson process such that the clientsreceive a specified load between 10% and 80%. We nor-malize the FCT for each flow to the average FCT achievedby a flow of the same size, in an unloaded network, whenflows are requested continuously.
class PriorityScheduler : public Scheduler {
public:
AbstractPkt
*
PriorityScheduler::schedule(uint32_t
port) {
/
*
get the mask of non-empty queues
*
/
uint64_t mask = m_bank->non_empty_qmask(port);
uint64_t q_index;
/
*
bsfq: find the first set bit in mask
*
/
asm("bsfq %1,%0":"=r"(q_index):"r"(mask));
return m_bank->dequeue(port, q_index);
}
private:
PacketQueueBank
*
m_bank;
}
Figure 5: Source code for a priority scheduler in Flexplane over 64 queues. A PacketQueueBank stores packets between thecalls to enqueue and schedule.
scheme LOCdrop tail queue manager 39
RED queue manager 125DCTCP queue manager 43
priority queueing scheduler 29round robin scheduler 40
HULL scheduler 60pFabric QM, queues, scheduler 251
Table 3: Lines of code (LOC) in the emulator for each resourcemanagement scheme.
We run this application for DropTail and DCTCP, inFlexplane and in the hardware network. Figure 4 showsthe average normalized FCTs. For both small flows andlarge flows, results with Flexplane closely match resultsobtained with a hardware network. For loads up to 60%with both schemes, Flexplane estimates average normal-ized FCTs of hardware to within 2-8% for small flowsand 3-14% for large flows. Accuracy decreases slightlyfor higher loads of 70% and 80%, but remains within 18%for small flows and 24% for large flows.
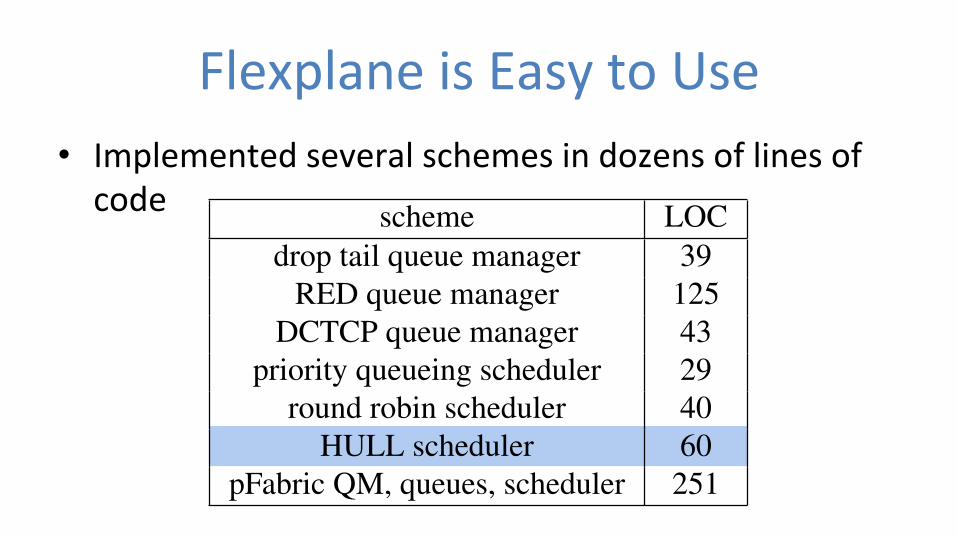
5.2 Flexplane UtilityIn this section, we evaluate the utility of Flexplane. Westudy how easy it is to write new schemes in Flexplane andprovide four examples of how Flexplane can be useful.Ease of use. To demonstrate the simplicity of implemen-tation, we show the key portions of the source code forpriority queueing scheduling in Figure 5. Most schemesrequire only a few dozen lines of code to implement, asshown in Table 3. pFabric requires significantly morecode than other schemes because it does not maintainpackets in FIFO order between the enqueue and dequeuestages; 170 of the 251 lines of code are used to implementcustom queueing.Parameter tuning. Flexplane enables users to quicklytune protocol parameters to accommodate different net-works. For example, the authors of HULL [9] conductedevaluations using a testbed with 1 Gbits/s links; we useFlexplane to tune HULL’s parameters to fit our 10 Gbits/s
8
Flexplane is Easy to Use • Implemented several schemes in dozens of lines of code
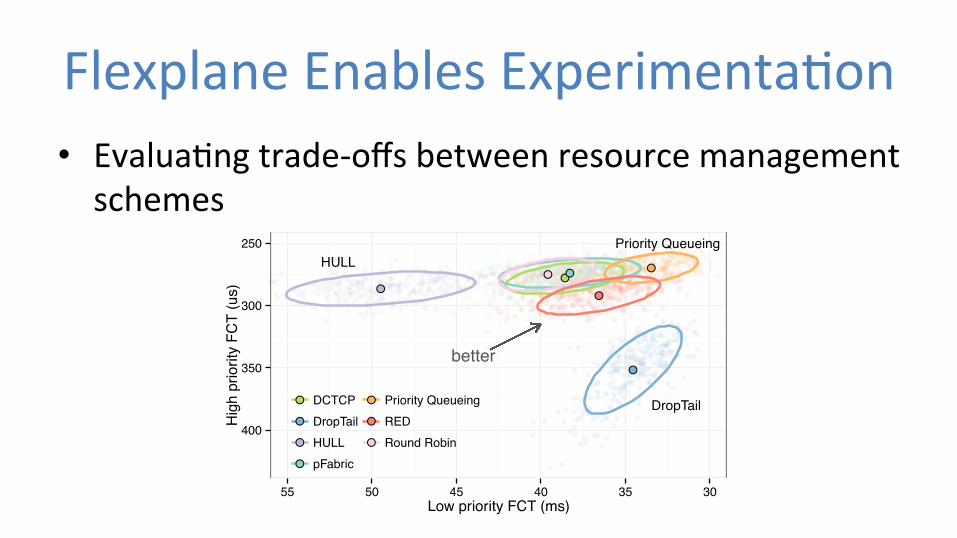
Flexplane Enables Experimenta0on • Evalua0ng trade-‐offs between resource management schemes
●
●
●
● ●
●
●
better
HULL
DropTail
Priority Queueing250
300
350
400
303540455055Low priority FCT (ms)
Hig
h pr
iorit
y FC
T (u
s)
●
●
●
●
●
●
●
DCTCPDropTailHULLpFabric
Priority QueueingREDRound Robin
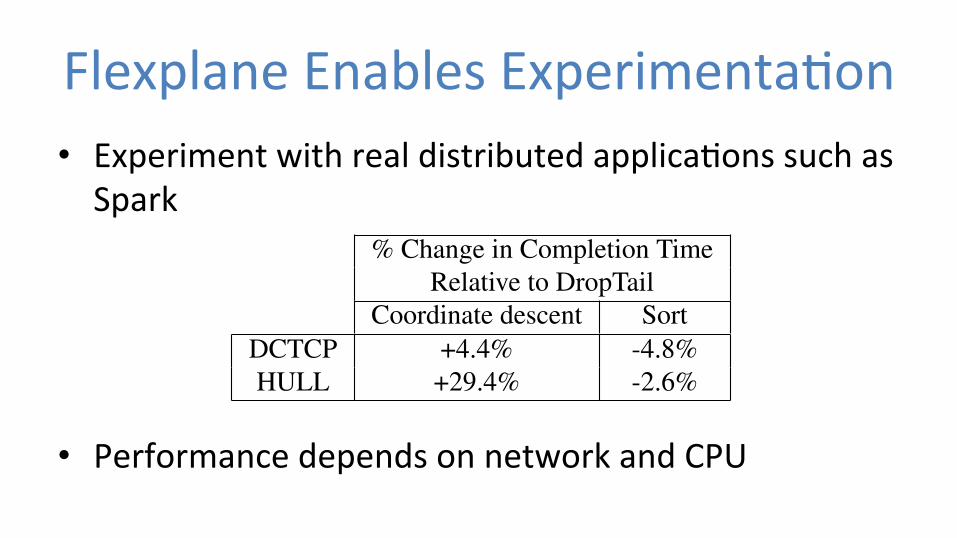
Flexplane Enables Experimenta0on • Experiment with real distributed applica0ons such as Spark
●
●
●●●
●
●
●
0
1
2
3
4
5
6
0.2 0.4 0.6 0.8Load
Nor
mal
ized
FCT
●
DCTCPHULLpFabricTCP−DropTail
(a) (0, 100KB]: Average
●
●
●●
●
●
●
●
0
5
10
15
20
0.2 0.4 0.6 0.8Load
Nor
mal
ized
FCT
(b) (0, 100KB]: 99th percentile
●●
●●
●
●●
●
0
2
4
6
8
0.2 0.4 0.6 0.8Load
Nor
mal
ized
FCT
(c) (10MB, •): Average
Figure 7: Normalized flow completion times for the web search workload, for four different schemes run in Flexplane. Note thedifferent y axes.
Priority queueing performs well on this simple workload,achieving good performance for both flow types. A net-work operator could use these results to determine whatscheme to run in their network, depending on how theyvalue performance of high priority flows relative to lowpriority flows.
Real applications. In addition to enabling experimenta-tion with network-bound workloads like the one above,Flexplane enables users to evaluate the performance im-pact of different resource management schemes on realapplications whose performance depends on both net-work and computational resources. We consider two ap-plications that perform distributed computations usingSpark [1]. The first uses block coordinate descent [2]to compute the optimal solution to a least squares prob-lem; this is a staple of many machine learning tasks. Thesecond performs an in-memory sort [4]. For this exper-iment, we use a small cluster of 9 machines (1 masterand 8 workers), each with 8 cores, connected via a singleswitch with 1 Gbit/s links. We use Flexplane to run eachapplication with DropTail, DCTCP, and HULL.
Table 4 shows that different Spark applications areaffected in different ways by a change in resource man-agement scheme. The sort application, which includesmultiple waves of small tasks and small data transfers,shows small improvements in completion time, relative toDropTail, when run with DCTCP or HULL. In contrast,coordinate descent takes 4.4% longer to complete whenrun with DCTCP, and 29.4% longer when run with HULL.This is because this application sends data in a small num-ber of bulk transfers whose throughput is degraded byHULL’s, and to a lesser extent DCTCP’s, more aggressiveresponses to congestion. Flexplane enabled us to quicklyevaluate the impact of a change in resource managementscheme on these real-world applications. Because theseapplications spend much of their time performing com-putation (>75%), it is not possible to accurately conductthis experiment in a network simulator today.
Reproducible research. Here we demonstrate how ex-
% Change in Completion TimeRelative to DropTail
Coordinate descent SortDCTCP +4.4% -4.8%HULL +29.4% -2.6%
Table 4: Percent change in completion time of two Spark appli-cations when run with DCTCP or HULL, relative to when runwith DropTail.
periments that researchers conducted in simulation inthe past can be conducted on a real network with Flex-plane, and how results in a real network might differ fromthose in simulation. To do so, we recreate an experi-ment that has been conducted in several other research pa-pers [12, 14, 26]. We use the same network configurationand workload as in the flow completion time experimentin §5.1; this is the same workload used in prior work.
Figure 7 shows the results of running this workload forDropTail, DCTCP, HULL, and pFabric, in Flexplane, atloads ranging from 10% to 80%. We present the averageand 99th percentile normalized flow completion time forsmall flows, and the average normalized flow completiontime for large flows, as in prior work.
We observe the same general trends as in prior work.For the small flows, DropTail performs the worst, withperformance degrading significantly at the highest loadsand at the 99th percentile. In contrast, pFabric maintainsgood performance for small flows, even at high load andat the tail. For large flows, DCTCP and DropTail maintainthe best performance, while HULL and pFabric degradesignificantly at loads of 70%-80%. For HULL, this isbecause the required bandwidth headroom begins to sig-nificantly limit large flows. For pFabric, performancedegrades at high load because short queues cause manypackets to be dropped. This may be exacerbated by thefact that we do not use all TCP modifications at the end-points, including the probe mode (which is particularlyimportant at high load).
Our results demonstrate an unexpected phenomenon.One would expect that under low load (e.g., 10%),
• Performance depends on network and CPU

0
100
200
300
400
500
600
700
800
900
0 1 2 3 4 5 6 7 8Emulation cores
Rou
ter t
hrou
ghpu
t (G
bits
/s)
racks connected with Agg
Emulator Throughput • Emulator provides 761 Gbits/s of aggregate throughput with 10 total cores
●
0
100
200
300
400
500
600
700
800
900
0 1 2 3 4 5 6 7 8Emulation cores
Rou
ter t
hrou
ghpu
t (G
bits
/s)
●
racks connected with Agg
isolated racks
●
●
●
●
●
●
●
●
0
100
200
300
400
500
600
700
800
900
0 1 2 3 4 5 6 7 8Emulation cores
Rou
ter t
hrou
ghpu
t (G
bits
/s)
●
racks connected with Agg
isolated racks
• 81x as much throughput per clock cycle as RouteBricks
Flexplane: an Experimenta0on Pla3orm
• Whole-‐network emula0on • Flexplane: a pla3orm for faithful experimenta0on with resource management schemes – Accuracy, flexibility, and high throughput
hqps://github.com/aousterh/flexplane