Value Stream Mapping. Introductions & Objectives Value Stream Mapping.

Manufacturing System Design: Flexible Manufacturing Systems and Value Stream Mapping
by
Rhonda A. Salzman
B.S. Mechanical Engineering
Massachusetts Institute of Technology, 2000
SUBMITTED TO THE DEPARTMENT OF MECHANICAL ENGINEERING IN PARTIAL FULFILLMENT OF THE REQUIREMENTS FOR THE DEGREE OF
MASTER OF SCIENCE IN MECHANICAL ENGINEERING
AT THE MASSACHUSETTS INSTITUTE OF TECHNOLOGY
JUNE 2002
© 2002 Massachusetts Institute of Technology
All rights reserved
Signature of Author: ______________________________________________________
Department of Mechanical Engineering May 15, 2002
Certified by: _____________________________________________________________
Timothy G. Gutowski Professor of Mechanical Engineering/Associate Department Head
Thesis Supervisor Certified by: _____________________________________________________________
John T. Shields Program Manager, Lean Aerospace Initiative
Thesis Reader Accepted by: ____________________________________________________________
Ain A. Sonin Professor of Mechanical Engineering
Chairman, Committee for Graduate Students

2

3
Manufacturing System Design: Flexible Manufacturing Systems and Value Stream Mapping
By
Rhonda Salzman Submitted to the Department of Mechanical Engineering
on May 15, 2001 in Partial Fulfillment of the Requirements for the Degree of Master of Science in
Mechanical Engineering
Abstract Manufacturing system design cannot be considered a science with formal principles and equations. The methodology used here to expand the knowledge of manufacturing system design is two-fold and includes an in-depth manufacturing system redesign and an investigation into the current uses, limitations, and appropriateness of value stream mapping (VSM). The case study shows why the given system was lacking in efficiency and what could be learned to improve its design. The analysis found the machinist to be a critical, yet overextended, resource for smooth production flow. Using multiple tools, a mismatch was identified between the current goals and system. A future system was designed that could manage both the system parameters and the expected changes in these inputs within the lifetime of the system. In the second part of the thesis, value stream mapping was studied through a mixture of case studies, interviews, and a survey. The principal result is that the success of a value stream mapping event is correlated with the environment in which it is run. This analysis shows the necessity for companies to rethink the capacity of VSM to benefit a particular system. A worksheet is proposed which can be used to determine the appropriateness of VSM. Thesis Supervisor: Timothy G. Gutowski Title: Professor of Mechanical Engineering/Associate Department Head

4

5
Acknowledgements SUPPORT I am grateful to Heidelberg Web Systems, Inc. and the Lean Aerospace Initiative for giving me the chance to do research that directly affects industry, works with real problems, and allows me the chance to experience manufacturing. The members of the LAI Consortium companies were always helpful and made a special effort to answer my questions and discuss my theories. I am also grateful to the employees of Heidelberg who were willing to share with me the details of their jobs and discuss ideas of how to improve them, and to Juergen Krebs and Bruno Posset whose thirst for knowledge and dedication to determine root cause drove this study. I would also like to thank the National Science Foundation for allowing me the privilege of attending graduate school and the freedom to choose my own research. GUIDANCE I would like to thank my research team, who has helped lead me through the journey of graduate research: Prof. Timothy Gutowski, whose guidance, patience, and expertise has guided me through all of the research contained in this document, and allowed me to learn from his enormous range of knowledge. Dr. Stanley Gershwin, who helped to keep me grounded to fundamental principles, and whose insights were always helpful and sometimes groundbreaking in my research. Tom Shields, whose advice and support helped me to gain a broader perspective on my research and who always looked out for my best interests. Prof. Ken McKay, whose constant questioning kept me thinking about new problems and new solutions. I would also like to thank the other students in my lab group whose constant thoughts and critiques were always helpful and uplifting, Mandy Vaughn and Pradeep Fernandes. FRIENDS AND FAMILY The work here is dedicated to my loving family, without whose push I would never have made it to graduate school and would have been too afraid to try. To my fiancé, Michael Altman, whose support has been necessary for my success and whose kindness has made me a better person. Seth Berman, whose outlook on graduate school helped remind me why I was at MIT, and helped me become excited again about learning and knowledge in general. Jim Chase, who answered my constant badgering of questions and always patiently waited for a break in the conversation to reply. This thesis is dedicated to those who have helped to shape its work, directly or indirectly.
I've done it, I've done it! Guess what I've done!
Invented a light that plugs into the sun. The sun is bright enough, The bulb is strong enough,
But, oh, there's only one thing wrong... The cord ain't long enough.
INVENTION by Shel Silverstein

6

7
Table of Contents
Abstract_______________________________________________________________ 3
Acknowledgements______________________________________________________ 5
Table of Contents _______________________________________________________ 7
List of Figures ________________________________________________________ 10
List of Tables _________________________________________________________ 12
Chapter 1 Introduction and Executive Summary _________________________ 13
1.1 Flexible Manufacturing System Case Study________________________ 14
1.2 Value Stream Mapping_________________________________________ 17
Chapter 2 Introduction to Manufacturing System Design __________________ 20
2.1 Manufacturing Systems Team and the Lean Aerospace Initiative _____ 20
2.2 Manufacturing System _________________________________________ 22
2.3 Manufacturing System Design___________________________________ 23
References _________________________________________________________ 26
PART ONE IN-DEPTH CASE STUDY ____________________________________ 27
Chapter 3 Methodology for Manufacturing System Design - Case Study ______ 28
3.1 Manufacturing System Design Framework ________________________ 28
3.2 Manufacturing Strategy by Miltenburg ___________________________ 29
3.3 Case Study Methodology _______________________________________ 31
References _________________________________________________________ 32
Chapter 4 Case Study Current System Analysis __________________________ 33
4.1 Case Study Background ________________________________________ 33
4.2 Characterization of the Problem _________________________________ 35
4.3 Pie Chart Data________________________________________________ 38
4.4 Improvement Opportunities ____________________________________ 39
4.5 Analysis of Current System _____________________________________ 41
4.6 Conclusions __________________________________________________ 42
References _________________________________________________________ 43
Chapter 5 Case Study System Redesign _________________________________ 44
5.1 Competitive Goals_____________________________________________ 44
5.2 Benchmarking ________________________________________________ 45

8
5.2.1 A Case Study Analysis of Flexible Manufacturing Systems _________ 45 5.2.2 Lean Aerospace Initiative’s Flow Efficiency _____________________ 48
5.3 Redesign Methodology _________________________________________ 49 5.3.1 Miltenburg’s Manufacturing Strategy Worksheet _________________ 49 5.3.2 Conclusion _______________________________________________ 50
5.4 System Redesign ______________________________________________ 51 5.4.1 Recommendations__________________________________________ 51 5.4.2 Backup Information ________________________________________ 54
5.5 Simulation ___________________________________________________ 57 5.5.1 Simulation Basics __________________________________________ 57 5.5.2 Model Procedure___________________________________________ 58
5.6 Conclusion ___________________________________________________ 66
References _________________________________________________________ 66
PART ONE CONCLUSION _____________________________________________ 68
PART TWO VALUE STREAM MAPPING _________________________________ 71
Chapter 6 Background and Problem Definition for VSM___________________ 72
6.1 Lean History _________________________________________________ 72
6.2 Lean Principles _______________________________________________ 73
6.3 Value Stream Mapping_________________________________________ 75 6.3.1 Current State ______________________________________________ 75 6.3.2 Future State _______________________________________________ 77 6.3.3 Implementation Plan ________________________________________ 78 6.3.4 Value Stream Mapping at Heidelberg___________________________ 78 6.3.5 Summary of VSM__________________________________________ 79
6.4 Summary ____________________________________________________ 80
6.5 Problem Statement ____________________________________________ 80
References _________________________________________________________ 80
Chapter 7 Value Stream Mapping Environment __________________________ 82
7.1 Hypothesis & Purpose _________________________________________ 82
7.2 Methodology for Research/Experimental Design ___________________ 83 7.2.1 Methodology______________________________________________ 83 7.2.2 Develop Hypotheses ________________________________________ 84 7.2.3 Survey Organization ________________________________________ 89
7.3 Results ______________________________________________________ 92 7.3.1 Main results_______________________________________________ 92 7.3.2 Data Verification___________________________________________ 94 7.3.3 Additional Results from Survey _______________________________ 96
7.4 Proposed Value Stream Mapping Worksheet ______________________ 99
9
7.4.1 Implementation ____________________________________________ 99 7.4.2 Value Stream Matrix_______________________________________ 100
7.5 Additional Insights ___________________________________________ 103
7.6 Improvement Opportunities ___________________________________ 104
References ________________________________________________________ 105
PART TWO CONCLUSION ____________________________________________ 106
Chapter 8 Conclusion and Recommendations___________________________ 107
8.1 Flexible Manufacturing System Case Study_______________________ 107
8.2 Value Stream Mapping________________________________________ 108
References ________________________________________________________ 109
Appendix A Manufacturing System Design References_____________________ 110
Appendix B Case Study Framework Description __________________________ 111
B.1 Analysis of the Current System _________________________________ 111
B.2 Goals – selection of criteria ____________________________________ 113
B.3 System Selection _____________________________________________ 114
B.4 Initial Design ________________________________________________ 115
Appendix C Simulation ______________________________________________ 118
C.1 Stochastic Model Parameters___________________________________ 118
C.2 Configuration and Input Changes_______________________________ 120
Appendix D Value Stream Mapping Survey ______________________________ 121
D.1 Survey______________________________________________________ 121
D.2 Glossary ____________________________________________________ 125
D.3 Informed Consent ____________________________________________ 125

10
List of Figures Figure 1-1 Thesis Outline ................................................................................................. 13 Figure 1-2 Heidelberg’s Flexible Manufacturing System ................................................ 14 Figure 1-3 Manufacturing System Design Methodology ................................................. 15 Figure 1-4 Effects of Setup, Variation in Cycle Time, and Other Factors on System
Utilization ................................................................................................................. 15 Figure 1-5 Hybrid System Proposal.................................................................................. 16 Figure 1-6 The Effect of Environmental Characteristics on Implementation................... 18 Figure 1-7 VSM Matrix .................................................................................................... 18 Figure 1-8 Comparison of Environmental Characteristics to Success.............................. 19 Figure 2-1 Manufacturing System Design Framework (Fernandes, 2001;Vaughn, 2002)21 Figure 2-2 Definition of Manufacturing System (J T. Black, 1991) ................................ 22 Figure 2-3 Hierarchy of System Objectives (Hopp & Spearman, 1996).......................... 25 Figure 3-1 Manufacturing System Design Framework (Fernandes, 2001; Vaughn, 2002)
................................................................................................................................... 29 Figure 3-2 Miltenburg's Manufacturing Strategy Worksheet (Miltenburg, 1995) ........... 30 Figure 3-3 Generalized Methodology for System Design ................................................ 31 Figure 4-1 Heidelberg Maxim Cell................................................................................... 34 Figure 4-2 System Data Leading to Study........................................................................ 35 Figure 4-3 Utilization vs. Lot Size.................................................................................... 36 Figure 4-4 Spindle Uptime compared to Productive Time............................................... 37 Figure 4-5 Effects of Setup, Variation in Cycle Time, and Other Factors on System
Utilization ................................................................................................................. 38 Figure 4-6 Pie Chart Data Obtained in 1997 .................................................................... 38 Figure 4-7 Machinist Matrix............................................................................................. 41 Figure 5-1 Comparison of Different Types of Manufacturing Systems (Black, 1991) .... 48 Figure 5-2 Flow Shop and Job Shop regimes on a Flow Efficiency Plot (Shields, 1996) 49 Figure 5-3 Manufacturing Strategy Worksheet-Partial (Miltenburg, 1995)..................... 50 Figure 5-4 System Elements used for System Redesign .................................................. 51 Figure 5-5 Hybrid System Proposal.................................................................................. 52 Figure 5-6 Transition States.............................................................................................. 53 Figure 5-7 Current Machinist Job Wheels ........................................................................ 54 Figure 5-8 New Machinist Job Wheel .............................................................................. 55 Figure 5-9 Simulation Modeled System Components ...................................................... 57 Figure 5-10 Simulation Current System Model................................................................ 59 Figure 5-11 Comparison of Simulation with Historic Data.............................................. 60 Figure 5-12 Simulation Utilization Trend Comparison to Historic Data ......................... 60 Figure 5-13 Machine-Operator Configurations Modeled in Simulation .......................... 61 Figure 5-14 Utilization of Different Machine Configurations Using Simulation............. 62 Figure 5-15 Utilization Map Comparing Machine Configuration and Part Inputs........... 63 Figure 5-16 50% Change in Machine Failures ................................................................. 65 Figure 5-17 50% Change in All Setup Quantities ............................................................ 65 Figure 6-1 Steps of Lean Thinking (Womack, 1996) ....................................................... 74 Figure 6-2 Current Value Stream Map (Rother, 1999)..................................................... 76 Figure 6-3 Future Value Stream Map (Rother, 1999)....................................................... 78

11
Figure 7-1 Simplification of Ten Inputs for VSM Environment ...................................... 86 Figure 7-2 How Costs, Quantity, Quality, and Humanity are Improved by the Toyota
Production System (Monden, 1998) ......................................................................... 89 Figure 7-3 VSM Matrix .................................................................................................... 90 Figure 7-4 Hierarchy of success ....................................................................................... 91 Figure 7-5 Comparison of Environmental Characteristics to Success.............................. 93 Figure 7-6 Original Survey Responses ............................................................................. 94 Figure 7-7 Comparison of Surveys to Discussions........................................................... 95 Figure 7-8 Investment compared to Organization ............................................................ 96 Figure 7-9 Complexity versus Capability ......................................................................... 97 Figure 7-10 Comparison of reduced set of Characteristics and Success .......................... 98 Figure 7-11 Product and Process Characteristics versus Organizational Characteristics. 99 Figure 7-12 The Effect of Environment Characteristics on Implementation ................. 100 Figure 7-13 Impact versus Implementation Difficulty ................................................... 104 Figure A-1 Manufacturing System Design References .................................................. 110 Figure B-1 Generalized Framework for System Design................................................. 111

12
List of Tables Table 1-1 Five Environmental Characteristic Definitions ................................................ 17 Table 4-1 Improvements within Other Factors, Variation in Cycle Time and Setup ....... 40 Table 5-1 Benchmarking System Characteristics Summary ............................................ 45 Table 5-2 Simulation Model Parameters .......................................................................... 58 Table 5-3 Change Effect Matrix ....................................................................................... 64 Table 6-1 Typical Value Stream Metrics (Millard, 2001) ................................................ 76 Table 7-1 Ten Manufacturing System Design Inputs (Fernandes, 2001)......................... 83 Table 7-2 Research Methodology for VSM...................................................................... 84 Table 7-3 Question for Stage 1 of VSM Research ........................................................... 84 Table 7-4 Value Stream Mapping Survey Questions ....................................................... 91 Table 7-5 Description of Cases from Figure 7-5 .............................................................. 93 Table 7-6 VSM Matrix.................................................................................................... 102 Table B-1 Framework Questions for System Design ..................................................... 111 Table B-2 Subsystems that Constitute a Production System (Miltenburg, 1995) .......... 116 Table C-1 Description of Model Parameter Distributions for Setup .............................. 118 Table C-2 Description of Model Parameters for Breakdowns........................................ 119 Table C-3 50% Change in Setup Parameters.................................................................. 119 Table C-4 50% Change in Maintenance Parameters (MTBF)........................................ 119 Table C-5 Simulation Data Generated from Configuration and Input Changes............. 120

Introduction
13
Chapter 1 Introduction and Executive Summary
Currently, manufacturing system design cannot be considered a science with
formal principles and equations. This work will study the process of design through a
manufacturing system redesign as well as to gain insight into the use of one design tool,
value stream mapping.
This thesis will be split into two parts (Figure 1-1). Part 1 will focus on a case
study performed over a one-year period. In the case study, the author will analyze and
design a system within a manufacturing plant. This will be done to better understand the
problems and obstacles of manufacturing system design through an in-depth study. The
analysis of the current system and the design of the future system will be explored. With
each step of the design, methodologies and tools will be used and each will be discussed
in reference to the design. The case study can be used by the thesis reader to explore
tools in manufacturing design or to compare his or her current framework for designing
to the one used here, in an attempt to improve designing skills.
Part 2 of this thesis will take the opposite approach to exploring manufacturing
system design. One tool, value stream mapping, is chosen as the subject and an in-depth
study of its impact and uses is performed. This tool is explored for its benefits,
limitations, and current use through multiple case studies and a survey. From this study,
the reader can gain insight into where to use it, why to use it, and how to use it.
Introduction
PART 1 Flexible
Manufacturing System
Framework
Analysis
PART 2 Value Stream
Mapping
Background
Environment
Conclusion
CH 1 & 2
CH 3
CH 4
CH 6
CH 7
CH 8
Design CH 5
Figure 1-1 Thesis Outline

Introduction
14
1.1 Flexible Manufacturing System Case Study Heidelberg Web Systems, Inc. produces printing presses in the commercial and
newspaper web offset regime. This study will focus on the division of Heidelberg Web
Systems that fabricates the parts necessary to produce these presses. Another division of
the organization assembles the presses. Heidelberg’s Flexible Manufacturing System is
not producing the necessary number of standard hours required by the company.
Therefore, it was requested that a study be performed to determine for what reasons the
system was not producing as necessary and to make recommendations for future system
requirements as the funding has been acquired for the system’s replacement. The system,
which can be seen in
Figure 1-2, is made up of five CNC Milling Machines connected by a computer
controlled “rover” which distributes universal pallets, on which the parts are located, to
all the machines and to the setup stations. The parts produced are mostly aluminum
castings with a volume of 20 in3 or less.
Tombstone storage
Machine 1 Machine 2 Machine 3 Machine 4 Machine 5
Rover
Setup Station
Computer Machinists
Machinists
Figure 1-2 Heidelberg’s Flexible Manufacturing System
An in-depth study of the current system was performed to determine the reasons it
was not producing as expected. Once overarching themes and problems of the current
system were determined, a high level study of the production system was performed
followed by an in-depth look at the initial design stages of the new manufacturing
system. Figure 1-3 shows the outline of this methodology.

Introduction
15
Goals System SelectionCurrent Analysis Initial Design Imple Reeval
Regular Improvement System Design (Green Field)
System Redesign (Brown Field)
CH 5 CH 4
Figure 1-3 Manufacturing System Design Methodology
In performing the current system analysis, a relationship was found between the
average lot size of products and the utilization, or spindle uptime, of the machinery. This
encouraged the team to study the possible reasons for this phenomenon, which led to
breaking down these reasons mathematically into: setup time, variation in cycle time
from the minimum production time, and other factors which could not be easily
separated. Figure 1-4 shows the separation of each of these factors and the estimated
improvement in utilization that could be expected from an elimination of each of these
factors individually from the system, in an attempt to determine root cause.
0.2
0.3
0.4
0.5
0.6
0.7
0.8
10 12 14 16 18 20 22 24 26 28 30AVERAGE LOT SIZE PER MONTH
Util
izat
ion
PT/ES
NO CYCLE TIME VARIATION
NO SETUP
NO OTHER FACTORS
S = 0
OF = 0
Productive Time / Event Span
dT=0
Figure 1-4 Effects of Setup, Variation in Cycle Time, and Other Factors on System Utilization
This analysis lead to an exploration into the use of the machinist, where it was
found that the machinist was a necessary resource for the resolution of all disruptions and
was being overloaded by the disruptions. It is, therefore, necessary to consider the

Introduction
16
machinist in any redesign that occurs, as it is understood that as lot size decreases the
demands on the machinist increase, causing the reduction in machine utilization.
Using multiple manufacturing design tools and methodologies (Miltenburg’s
Manufacturing Strategy Worksheet, LAI Flow Efficiency Diagram, and benchmarking)
to verify the determination, it was shown that the current production system was not
appropriate for the current system parameters (volume, mix, and new parts per year) and
was not meeting all of the system goals necessary for the happiness of the company (cost,
quality, flexibility, and innovativeness).
From the lessons learned from the current system analysis and the insights from
the system selection, a hybrid system (Figure 1-5) was determined to be the most
appropriate system to meet the identified manufacturing goals. The hybrid system
separates the product into groups allowing the immature, high maintenance products not
to affect production of the high volume mature ones. The hybrid system machine
organization can be modified to deal with the possibilities of mismatched goals that
might occur over time. The benefits of these changes were shown through the use of a
computer simulation. The simulation allowed study of the affects of both the shift in
machinist task requirement and changes in model stochastic parameters.
Figure 1-5 Hybrid System Proposal
Flexible Manufacturing Systems can produce a large array of different parts and
can drastically reduce the time required to produce a part because of the movement to
external setup. For these reasons, many companies are moving toward the use of FMS
systems without realizing the possible dangers that can occur if they are placed in
environments with the wrong characteristics. It was seen here that the system flexibility
has caused the system to be greatly underutilized due to the inherent inability to measure

Introduction
17
and find root cause. The system shift that occurs with the redesign may limit flexibility in
order to allow the quicker, more standard response to system disruptions and elimination.
1.2 Value Stream Mapping Value stream mapping is an improvement tool that has been used as an integral
part of lean transformations. It has been shown to yield vast improvements in lead-time
throughout manufacturing, including the aerospace industry, and beyond the factory
floor. A value stream mapping exercise was performed at Heidelberg. The activity
outlined possible improvement opportunities and helped identify the impact of the system
being studied on both the upstream and downstream operations. It has also been seen that
in some cases VSM is being used in what were not considered its initial appropriate
environments. It was, therefore, the goal of this study to explore under what conditions
(environmental) is it most appropriate to be performed and determine what insights could
be given about VSM to aid in its success for the user.
In order to determine the appropriate conditions under which VSM should be
performed, multiple case studies were completed. From these cases, a theory was
developed about VSM. This theory was converted to a survey, which was used to
capture the experiences of those doing VSM in the manufacturing sector of the aerospace
industry.
It was seen that the five environmental characteristics (Table 1-1): ability to pick
a representative part, capability, complexity, type of organization, and investment, could
be used to explain the appropriateness of value stream mapping. These characteristics are
organized in Figure 1-6 showing how they affect VSM. Three of the factors affect the
success of the event itself, while two others affect the implementation of the new map.
Representative Product that has similar process steps to the majority of the products that go through the system. The category also includes the time to obsolescence of the map due to product or process changes.
Capability Level of difficulty associated with the production of a part. Complexity Technological ability to repeatedly assemble something with minimal
intervention and minimal disruptions (scrap, rework, shortages). Organization Level of innovativeness (change) supported on the factory floor. Investment Availability of money and labor to make change.
Table 1-1 Five Environmental Characteristic Definitions

Introduction
18
Current
State
Future State
ImplementationCOMPLEXITY
CAPABILITY
ORGANIZATION
INVESTMENT
REPRESENTATIVE
Figure 1-6 The Effect of Environmental Characteristics on Implementation
Using this organization of the five characteristics, a VSM Matrix has been created
which is structured similar to Figure 1-6. The VSM Matrix, shown in Figure 1-7, can be
used to determine how a company, or VSM area, fits into each category. By determining
where the company fits in, from most appropriate for value stream mapping to
inappropriate, leadership can see how effective VSM will be by studying the tradeoffs of
different categories.
Figure 1-7 VSM Matrix
The validity of the matrix was tested using a survey. Each environmental factor
was scored on a one to five scale, with five being most appropriate. Figure 1-8 shows
that the total of these scores correlates to the success of the VSM event.

Introduction
19
0
1
2
3
4
5
6
0 5 10 15 20 25
Total
Succ
ess
Figure 1-8 Comparison of Environmental Characteristics to Success
It has been shown that the five identified environmental characteristics do
correlate with the success of the value stream mapping event. It is, therefore,
recommended that future studies be performed to isolate the affect of each factor, and
verify that additional factors are not needed. This theory could also be taken beyond
value stream mapping to include other improvement tools.

Introduction
20
Chapter 2 Introduction to Manufacturing System Design
This chapter will review the background of the Manufacturing Systems Team of the
Lean Aerospace Initiative, the lab group under which the following research was
conducted. It will also discuss the recent products of the team and show the motivation
for this research.
2.1 Manufacturing Systems Team and the Lean Aerospace
Initiative
The work seen here was conducted as part of the Manufacturing Systems Research
Team, a division of the Lean Aerospace Initiative (LAI). LAI, a consortium of academic
institutions, government organizations, and industrial partners, was started with the
objective of studying lean principles and their relevance within the aerospace industry.
This unique group allows for considerable information transfer and learning from what
was previously considered a non-sharing industry. Some of the unique research products
of this group include a “Production Operations Level Transition-To-Lean Roadmap”
(Crabill, 2000) and a recent book, Lean Enterprise Value (Murman, 2002).
The initial goal of the Manufacturing Systems Research Team was to study
implementation efforts that led to significant performance improvements in
manufacturing systems. The efforts were focused on understanding the manufacturing
operation and developing a broad knowledge base, which could be passed on to
consortium members. This was done through exploratory surveys and case studies,
including an inventory survey whose findings were used to make operation
recommendations in dealing with inventory in the defense aerospace industry. The work
also included multiple case studies used to “highlight the enablers, barriers and results
(LAI, 2001)” in the pockets of lean occurring in the aerospace industry. (LAI, 2001)
The latest phase of the research focused on answering key system level questions,
as it was found that manufacturing was larger than just a factory.

Introduction
21
These questions included:
(1) What are the high level goals of the manufacturing system?
(2) What is the best manufacturing system for a given set of conditions?
(3) At what point does it make sense to redesign the manufacturing system?
The first attempt at answering these questions was done by exploring the system
level literature and creating a framework showing the “scope of manufacturing system
design and the importance of a manufacturing system for the long-term success of a
corporation” (Fernandes, 2001). This framework can be seen in Figure 2-1. As part of
the current Manufacturing System Research Team’s efforts, this framework was being
tested for validity by multiple case studies of aerospace companies. The results showed a
correlation between fulfilling this framework and meeting the goals set out by the
redesign. The research has shown a correlation between the presence of each phase in the
framework, the timing of the phases in reference to each other, and their breadth across
functional groups (Vaughn, 2002).
Figure 2-1 Manufacturing System Design Framework (Fernandes, 2001;Vaughn, 2002)

Introduction
22
The research discussed in this document looks specifically at the factory
operations and system design. The objective was to dig deep into one system design in
an effort to understand the tools used to do system design and the possible roadblocks
and areas of improvement. This study fits into the redesign/modification loop of the
Manufacturing System Design Framework seen in Figure 2-1 with some time spent on
determining the requirements, considerations, and constraints of the system design.
The other aspect of this research was to investigate one popular and successful
design tool, VSM, and study its application. Value stream mapping can be seen listed on
the chart within the improvement loop. The tool will be evaluated for its appropriateness
at this level, and possible improvement opportunities for companies using VSM in their
redesigns. The benchmarking of multiple companies using VSM will give insight into its
use.
2.2 Manufacturing System
It is necessary to first define manufacturing system and then manufacturing system
design as these are the main topics of this document.
In J T. Black’s A Factory with A Future, a manufacturing system is defined as “a
collection or arrangement of operations and processes used to make a desired product(s)
or component(s). The manufacturing system includes the actual equipment composing
the processes and the arrangement of those processes [and people].” Figure 2-2 explains
this definition.
A Manufacturing System is
A complex arrangement of
physical elements
characterized by measurable
parameters.
Outputs
Material
Political Information
Social
Demand
Energy
Good products, good parts, etc.
Information
Defectives and scrap
Service to customer
Inputs Disturbances
Exte
rnal
cus
tom
er
Figure 2-2 Definition of Manufacturing System (J T. Black, 1991)

Introduction
23
The Manufacturing Systems Team believes manufacturing systems are larger than
just the factory floor and includes all the organizations that can affect how the floor
operates, along with the workers, suppliers, processes and management necessary to
produce the chosen products. Through the work of the Manufacturing Systems Team of
LAI the following definition of manufacturing systems has been presented:
A manufacturing system is an objective oriented network of people, entities, and
processes that transform inputs into desired products and other outputs; all managed
under an operating policy.
The underlines words are described below:
Objective: The ultimate objective of the manufacturing system should be to help satisfy
corporate goals.
Entities: Machines, tools, floor space, software, transport equipment, suppliers, etc.
Inputs: Raw materials, energy, and information.
Outputs: Desired products, wasted materials, wasted energy, and knowledge.
Operating Policy: A set of rules that determine how people, system entities, and the
processes are interconnected, added, removed, used and controlled.
This definition is an enhanced version of the definition that appears in Factory Physics,
that was discussed and improved at the Manufacturing System Industry Meeting,
February 2001 and has been presented with discussion in A Framework For A Strategy
Driven Manufacturing System Design In An Aerospace Environment written by Pradeep
Fernandes.
2.3 Manufacturing System Design
Manufacturing system design consists of “not only physical hardware but also
people who manage and operate this hardware and who must communicate information
within the manufacturing system” (Cochran, 2000). The job of a manufacturing system
designer includes making decisions about equipment selection, physical arrangement of

Introduction
24
equipment, work design (manual and automatic), standardization, design of material, and
information flow. Manufacturing system design is considered difficult because, unlike
mechanical design, there is no ability to visualize the entire system at once since it is
made up of physical hardware, people, and communications throughout the company’s
supply chain. (Cochran, 2000)
Currently, little information exists on manufacturing system design, although
many authors who give bits of insight into the subject. Factory Physics attempts to
describe manufacturing system behavior using fundamental relationships such as Little’s
Law and Economic Order Quantity. Lean Thinking: Banish Waste and Create Wealth in
your Corporation describes the key principles of lean thinking necessary to guide actions
to implement lean and includes specific examples of lean implementation. Systematic
Layout Planning, a worksheet based book, gives a step-by-step plan for the design of a
system, including worksheets. These three show the broad range of books that exist.
Appendix A gives an outline of books related to manufacturing system design. This list
represents some of the sources used in this research as well as others that the author has
found useful.
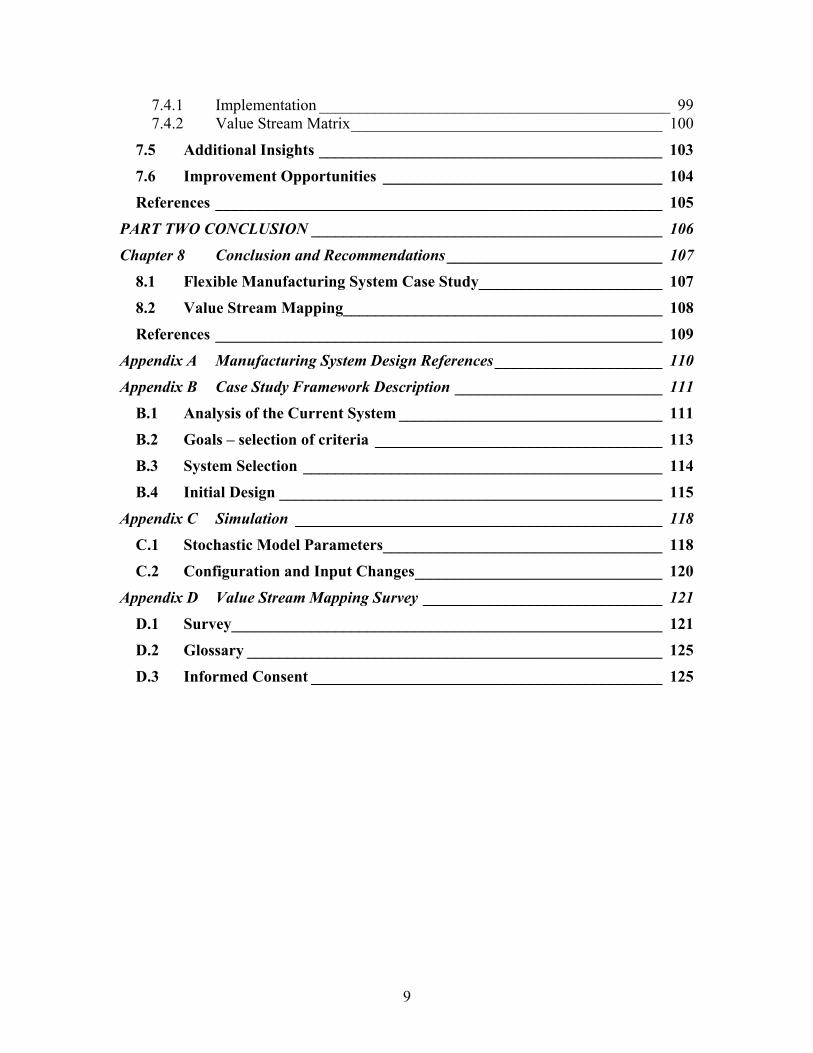
Current research done on manufacturing system design attempts to determine the
impact of the low level decisions on the manufacturing system objectives. Such work
includes Hopp and Spearman’s hierarchy of manufacturing objectives, Figure 2-3, which
shows the necessary need for tradeoffs as conflicting low level objectives are determined
from the same high level objective. Monden attempts a similar framework, by
connecting the improvement tools of the Toyota Production System to higher-level goals;
a copy of this framework is located in Chapter 7. Cochran’s Manufacturing System
Design Decomposition attempts to “communicate how low level design decisions will
affect performance” through a decomposition of the high level objective, return on
investment, into the lower level functional requirements necessary to achieve it. Through
the use of axiomatic design, Cochran develops a matrix type chart, which includes the
relationships between his requirements, not only to higher-level objectives but also to
each other.
Introduction
25
High profitability
Low costs
High sales
Low unit costs
High throughput
High utilization
Low inventory
Less variability
Short cycle times
Quality product
High customer service
Fast response
Many products
More variability
Low utilization
High inventory
Figure 2-3 Hierarchy of System Objectives (Hopp & Spearman, 1996)
Although there are many books on manufacturing system design, it is not
currently considered a science. The definition of a science is a “department of
systematized knowledge as an object of study (Merriam-Webster, 2002).” The
knowledge base around manufacturing systems cannot yet be considered systematized, as
we have no scientific method for determining the optimal system design or considering
tradeoffs. And the information that exists is in many cases only part of the entire issue.
In many ways manufacturing system design can be considered an art “a skill acquired by
experience, study or observation (Merriam-Webster, 2002).” The LAI Manufacturing
Systems Team attempts to aid in converting this art into to a science, as all of the authors
mentioned have done, through systematic research, which continues to shape and broaden
our understanding and construction of principles to guide us.
In many cases the examples discussed in this document can be considered system
redesigns. A system redesign can be defined as the production of a system design for an
area that already produces products. In some cases, a redesign might include simple, low
cost reorganization of workers, slightly higher cost options such as reorganization of
machines or products, or total redesign, which includes the purchase of new equipment
and change in system type.

Introduction
26
References Black, J T. The Design of the Factory with a Future. New York: McGraw-Hill. 1991 Cochran, David S., Jorge F. Arinez, James W. Duda, Joachim Linck. “Decomposition Approach for Manufacturing System Design.” A Collection of Papers Published by Professor David S. Cochran. MIT. September 2000. Crabill, John, et al. “Production Operations Level Transition-To-Lean Roadmap Description Manual.” MIT. June 2000. <http://lean.mit.edu>. Fernandes, Pradeep. “A Framework for a Strategy Driven Manufacturing System Design in an Aerospace Environment - Design Beyond Factory Floor.” Masters Thesis. MIT. Cambridge, 2001. Fernandes, Pradeep. “Manufacturing System Design Framework.” Manufacturing Systems Team Meeting. Gilbert, Arizona. February 2001. <http://lean.mit.edu>. Hopp, Wallace J. and Mark L. Spearman. Factory Physics: Foundations of Manufacturing Management. Boston: Irwin, 1996. Lean Aerospace Initiative. MIT. 2001. <http://lean.mit.edu>. Merriam-Webster’s Collegiate Dictionary, Merriam-Webster Online, 2002. <http://www.m-w.com/home.htm>. Monden, Yasuhiro. Toyota Production System: An Integrated Approach to Just-In-Time, Norcross, GA: Engineering and Management Press, 1998. Murman, Earll et al. Lean Enterprise Value. New York: Palgrave Publishers Ltd., 2002. Vaughn, Amanda. “A Holistic Approach to the Design of Assembly Operations in the Defense Aerospace Industry,” Masters Thesis. MIT. Cambridge, 2002.

Flexible Manufacturing Systems
27
PART ONE
IN-DEPTH CASE STUDY
PART ONE IN-DEPTH CASE STUDY
In order to better understand the methodology of manufacturing system design,
including problems and barriers, an in-depth case study will be explored. By completing
a manufacturing system design, parts of the manufacturing system design framework can
be investigated in more detail. Chapter 3 will first look at the necessary background for
this case study with a description of the methodology used in completing the design.
Chapter 4 will then describe in detail the analysis of the Flexible Manufacturing System
at Heidelberg Web Systems, Inc. and Chapter 5 will present in detail the design of the
future system.

Flexible Manufacturing Systems
28
Chapter 3 Methodology for Manufacturing System Design - Case Study
This chapter describes the Manufacturing System Design Framework created by
LAI in more detail. A detailed discussion of Miltenburg’s Manufacturing Worksheet will
also be conducted to further understand the background used in the following case study.
The details of this worksheet were used extensively in developing the new system design
and, therefore, need greater explanation. The final section will outline the methodology
used in the case study described in Chapter 4 and 5.
3.1 Manufacturing System Design Framework
The Manufacturing System Design Framework, designed by the Manufacturing
Systems Team of LAI, can be seen in Figure 3-1. The framework demonstrates the
importance of the manufacturing system within the corporation and the corporate
objectives. Past research has shown manufacturing system design limited to the factory
floor. Within the framework it is discussed from a strategy driven systems point of view.
It is believed that in mature industries (with dominant product designs), including the
aerospace industry, manufacturing is the necessary competitive weapon for success. It is,
therefore, necessary to have a manufacturing system based on a product strategy. The
framework shows the stakeholders, executive management and middle management, as
part of the decision making body that determines the product strategy. The product
design strategy is a coherent plan determined by all of the core competencies of the
company that coordinates the link between manufacturing and the rest of the enterprise.
Major components include suppliers, product design, manufacturing and marketing.
After the completion of the product strategy, also known as the infrastructural design, the
structural design may take place. This includes the detailed design of the factory floor.
The framework also recommends existing design tools and the level at which they make
the most appropriate contribution. (Fernandes, 2001)
The case study corresponds to the modification loop shown in Figure 3-1. It was
found necessary to redefine the requirements, considerations, and constraints in order to
use the tools shown to aid manufacturing system design and selection. Discussions

Flexible Manufacturing Systems
29
include use of some of the tools identified in the diagram, including Miltenburg, 2D
plots, simulation tools, and value stream mapping.
Modification Loop
Figure 3-1 Manufacturing System Design Framework (Fernandes, 2001; Vaughn, 2002)
3.2 Manufacturing Strategy by Miltenburg
This case study uses many of the components of the methodology developed by
John Miltenburg and shown in Manufacturing Strategy. He shows a systematic method
for evaluating the optimal production system based on the system goals. This
methodology provides a step-by-step approach to system selection decisions and required
infrastructure improvement.
What makes Miltenburg’s methodology unique is his use of multiple elements to
make a manufacturing system selection determination. The Miltenburg chart compares
the production system not only in terms of product structure (volume and mix) and
process structure (functional, cellular, line), but does an effective job of distinguishing

Flexible Manufacturing Systems
30
each system’s ability to meet the six different manufacturing goals (delivery, cost,
quality, performance, flexibility, and innovativeness).
The methodology goes on to discuss six manufacturing levers (human resources,
organization structure, sourcing, production planning, process technology, and facilities)
that can be adjusted to make the necessary infrastructure improvements. Miltenburg’s
methodology is compiled in the worksheet shown in Figure 3-2. The worksheet will be
used in Chapter 5 to determine the appropriate production system.
Figure 3-2 Miltenburg's Manufacturing Strategy Worksheet (Miltenburg, 1995)
Flexible Manufacturing Systems
31
The steps of the Miltenburg methodology using the worksheet are as follows:
Where am I?
• Determine current location in terms of product and process structure.
• Assess current level of capability for each manufacturing lever.
Where do I want to be?
• Determine market qualifying and order winning outputs that must be provided.
• Determine the production system that best provides the manufacturing outputs.
How will I get there?
• Adjust the manufacturing levers to provide the outputs at target levels.
The worksheet encourages selection of a system based on strategy and market
requirements and, therefore, promotes organized, systematic decision making in
manufacturing system design.
(Miltenburg, 1995)
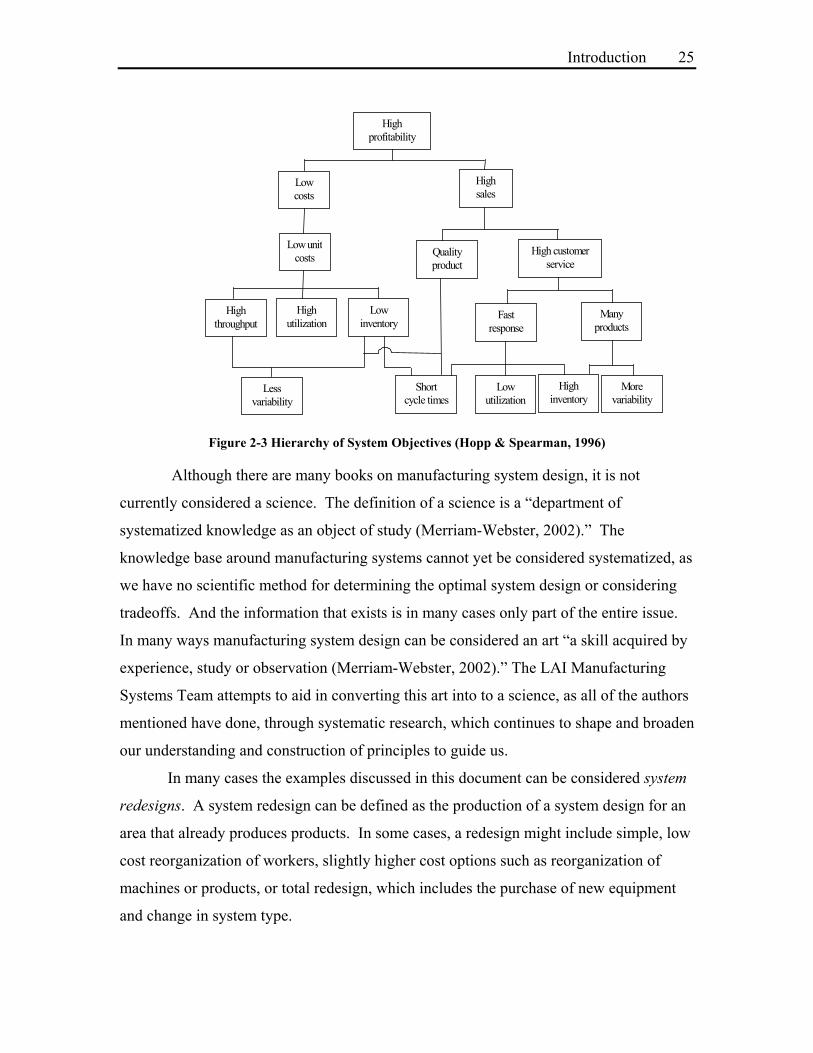
3.3 Case Study Methodology
The system design methodology used in the following case study is shown in
Figure 3-3. The main principles underlying these steps are similar to those of
Miltenburg’s Manufacturing Worksheet. The methodology is explained here as a
simplification of the total system design. The reader can compare his current method to
the one outlined here, and used in Chapters 4 and 5, to improve his own process.
Goals System SelectionCurrent Analysis Initial Design Imple Reeval
Regular Improvement System Design (Green Field)
System Redesign (Brown Field)
CH 5 CH 4
Figure 3-3 Generalized Methodology for System Design

Flexible Manufacturing Systems
32
The four main steps are: (1) current system analysis, (2) system goals, (3) system
selection, and (4) initial design. Implementation and revaluation were not explored in
this research.
1. Current Analysis-includes an investigation into the root causes of system
problems and determination that a system redesign is necessary.
2. System Goals-attempts to quantify the parameters provided to the customer, as
these will be the main system selection criteria.
3. System Selection-determines the type of production system that is appropriate.
The type of production system chosen will determine those system goals that will
be provided at the highest levels.
4. Initial design-includes determination of specific machine types, operator job
descriptions and priorities, and possible effects on infrastructural groups.
The determination of goals and system selection steps are developed from
Miltenburg’s Manufacturing Strategy Worksheet with insertion of additional tools.
Initial design uses the ideas of structural and infrastructural elements from Miltenburg but
goes beyond the detail given in the book. Additional detail on this generalized
methodology, used in this case study, can be found in Appendix B, and including the
questions asked within each section.
References
Fernandes, Pradeep. “A Framework for a Strategy Driven Manufacturing System Design in an Aerospace Environment - Design Beyond Factory Floor.” Masters Thesis. MIT. Cambridge, 2001. Miltenburg, John. Manufacturing Strategy: How to Formulate and Implement a Winning Plan. Portland: Productivity Press, 1995.

Flexible Manufacturing Systems
33
Chapter 4 Case Study Current System Analysis This chapter will present the analysis of the current system at Heidelberg Web
Systems, Inc. The analysis includes a study of utilization in order to determine
improvement opportunities. A discussion of both system flexibility and machinist
responsibilities will also be included in order to determine the root cause of system faults.
Improvement opportunities for the current system will be described and overarching
themes will be determined. The information acquired here will be used also in Chapter 5
the future system design.
4.1 Case Study Background
Heidelberg Web Systems, Inc. is a subsidiary of Heidelberger Druckmaschinen
AG, a German headquartered printing press company. The group has 18 sites worldwide
used to produce their solutions including all steps of the process: prepress, press, and
postpress. Heidelberg Web Systems, Inc. is one division of Heidelberg whose main
product solutions are in the web offset regime, including commercial web offset and
newspaper web offset. A web solution is one that produces product from a roll, or web,
of paper that is then cut and folded during postpress, as opposed to printing directly onto
sheets of paper. The company is a leader in its field of manufacturing printing presses
that are highly reliable products with innovative features. The division of Heidelberg
Web Systems studied here fabricates parts for the presses for assembly. (Heidelberg,
2002)
Heidelberg Web Systems asked MIT to study its MAXIM cell, a five horizontal
milling machine system with an automated rover. The current system can be seen in
Figure 4-1, and it includes five machines, three setup stations, and four machinists. An
automated pallet changer is used to move the parts from the setup station to the machines.
The cell is running three shifts a day. Two of the machinists work at the setup stations
and two at the machines. There are approximately 2,000 active part types in the cell, 811
of these were produced in 1999. Of the 811, 30% were new parts that year. The average
production of the system is 5.9 parts/hour or slightly more than one part per machine per
hour.

Flexible Manufacturing Systems
34
The cell can be considered a Flexible Manufacturing System (FMS). FMS’s are
known for their ability to run unattended for long periods of time. The systems are
usually made up of computer controlled machinery (horizontal mills) and automatic parts
delivery systems (rover). The computer controlled machinery allows production of many
different, and sometimes complex, parts on the same machinery. The mill can be used to
drill, mill, hog, shape, cut and finish a part through the use of many different tools. In a
horizontal mill the spindle is turning parallel to the ground and has the ability to move
up/down, left/right, and into the piece which is usually held perpendicular to the ground.
The cell is currently not producing the number of standard hours (similar to number
of parts produced) that were envisioned by the company. A relationship will be found
between machine utilization and product lot size. An attempt will be made to determine
root cause of utilization decrease by association with setup, cycle time variation, and
other factors.
Tombstone storage
Machine 1 Machine 2 Machine 3 Machine 4 Machine 5
Rover
Setup Station
Computer Machinists
Machinists
Figure 4-1 Heidelberg Maxim Cell
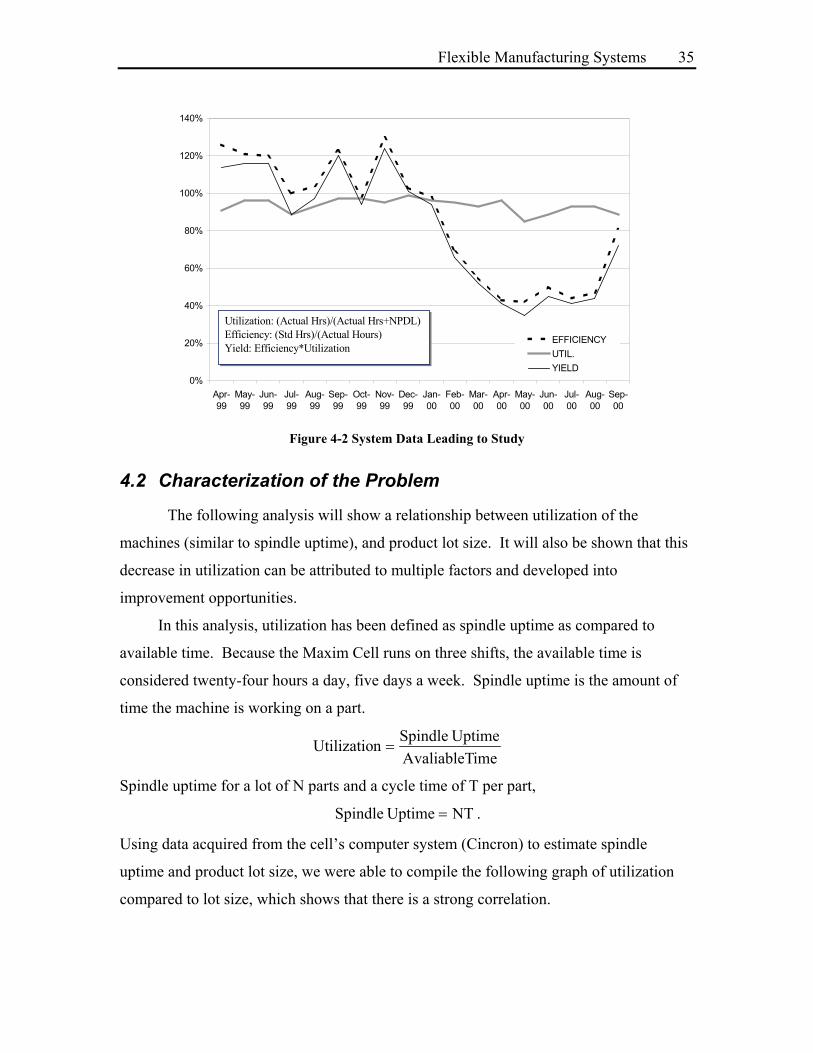
Heidelberg determined that a study of the MAXIM cell was necessary due to a
large drop in the productivity of the machines in Fiscal Year 2000, which corresponded
to the addition of a new product to their line. This trend can be seen in Figure 4-2.
Flexible Manufacturing Systems
35
0%
20%
40%
60%
80%
100%
120%
140%
Apr-99
May-99
Jun-99
Jul-99
Aug-99
Sep-99
Oct-99
Nov-99
Dec-99
Jan-00
Feb-00
Mar-00
Apr-00
May-00
Jun-00
Jul-00
Aug-00
Sep-00
EFFICIENCYUTIL.YIELD
Utilization: (Actual Hrs)/(Actual Hrs+NPDL)Efficiency: (Std Hrs)/(Actual Hours)Yield: Efficiency*Utilization
Figure 4-2 System Data Leading to Study
4.2 Characterization of the Problem
The following analysis will show a relationship between utilization of the
machines (similar to spindle uptime), and product lot size. It will also be shown that this
decrease in utilization can be attributed to multiple factors and developed into
improvement opportunities.
In this analysis, utilization has been defined as spindle uptime as compared to
available time. Because the Maxim Cell runs on three shifts, the available time is
considered twenty-four hours a day, five days a week. Spindle uptime is the amount of
time the machine is working on a part.
imeAvaliableT UptimeSpindlenUtilizatio =
Spindle uptime for a lot of N parts and a cycle time of T per part,
NT UptimeSpindle = .
Using data acquired from the cell’s computer system (Cincron) to estimate spindle
uptime and product lot size, we were able to compile the following graph of utilization
compared to lot size, which shows that there is a strong correlation.

Flexible Manufacturing Systems
36
R2 = 0.896
20.00%
25.00%
30.00%
35.00%
40.00%
45.00%
50.00%
55.00%
60.00%
65.00%
70.00%
10 15 20 25 30Avg. Lotsize
Util
izat
ion
Figure 4-3 Utilization vs. Lot Size
Using the data from the Cincron (1997-1998), we are able to separate available
time into three categories: spindle uptime, NT, internal setup time, S, and Other Factors,
OF,
OFNTSimeAvaliableT ++= .
Using spindle uptime as compared to available time for utilization above, assumes all
spindle uptime is productive time, that no time is wasted when the spindle is turning. In
the case of the current system, the computer system only records when a program starts
and when a program stops. Therefore, there is a chance that the machine could have
stopped during a program due to a system fault and this would still be considered as
“spindle uptime.” In order to estimate this difference, the cycle time of individual runs of
the same part were compared looking for deviations from the minimum. Consequently,
the addition of the variation in time, dT, has been separated from NT. A comparison of
the “spindle uptime utilization” and the “productive uptime utilization” can be seen in the
figure. There is a large gap between what was perceived as productive time for the
system and what actually is.

Flexible Manufacturing Systems
37
20.00%
25.00%
30.00%
35.00%
40.00%
45.00%
50.00%
55.00%
60.00%
65.00%
70.00%
10 15 20 25 30Average Lot Size
Util
izat
ion
Productive TimeAvailable Time
Spindle UptimeAvailable Time
Figure 4-4 Spindle Uptime compared to Productive Time
Using the new definition of available time, utilization becomes:
OFdT)N(TSNT
nUtilizatioprod
prod
+++= .
It can be seen from this formula that as lot size is changed, there will be a change
in utilization. If NT is large, then this ratio approximates one since S and OF are small in
comparison, but as NT is reduced, S and OF become larger and the ratio approaches zero.
This change in lot size causes a change in the number of setups necessary to produce the
same number of total parts; therefore utilization decreases with smaller lot sizes.
Using the Cincron data we were able to take the utilization formula and, assuming
100% improvement in each of these factors individually, see the difference it would make
on productivity. Therefore S, OF, and dT have each been independently eliminated
(reduced to zero) and graphed to see the impact on utilization. It can be observed in
Figure 4-5 that Other Factors is the biggest area for improvement. It is necessary to
determine what makes up Other Factors in order to determine improvement methods. It
can be observed in Figure 4-5 that with an improvement or elimination of Other Factors,
the curve levels off and would, therefore, have a more predictable and even response.

Flexible Manufacturing Systems
38
0.2
0.3
0.4
0.5
0.6
0.7
0.8
10 12 14 16 18 20 22 24 26 28 30AVERAGE LOT SIZE PER MONTH
Util
izat
ion
PT/ES
NO CYCLE TIME VARIATION
NO SETUP
NO OTHER FACTORS
S = 0
OF = 0
Productive Time / Event Span
dT=0
Figure 4-5 Effects of Setup, Variation in Cycle Time, and Other Factors on System Utilization
4.3 Pie Chart Data
The trends obtained from the cell controller data were not able to provide
information about root cause. A more in-depth understanding is necessary to determine
how to improve the system. Figure 4-6 shows the data, which was obtained in 1997 by
human observation and note taking at two machines for 208 hours. This data separates S,
OF, and dT into more categories and quantifies them.
spindle up56%
other 9%
prove out9%
no job in machine
20%
probe fault 8%
Back Up Loading
39%
Mach. Prove out(at other machine)
34%
Machine Problem13%Job at QC
11%Waiting Tools3%
Figure 4-6 Pie Chart Data Obtained in 1997
Complete Cell No Job in Machine

Flexible Manufacturing Systems
39
Setup
In the case of the cell, much of the setup, including the setup of fixtures, and
changing of parts, can be done externally, and therefore, is not included in the estimation
of setup time.
The internal setup is made up of:
• Tool change - time required to swap tools from previous jobs with those for next job.
• Load program - retrieval of the program from the mainframe computer to the
individual machine.
• Prove out - the machinist checks the program’s functionality during the first part.
Variation in Cycle Time
Variation in part cycle time, as discussed, is largely made up of probe faults.
These occur when the program calls for the checking of a dimension using an automated
probe and the dimension is determined unsatisfactory by the machine. The machine then
stops and awaits the machinist’s approval. Therefore, this is the cause of a large variation
is operator availability.
Other Factors
Other Factors, the total makeup of which is not known, was estimated by subtracting
setup, productive time and variation in cycle time from total available time. Using the
observations, Other Factors include:
• Machine problems – machine maintenance
• Job at quality control – determination of satisfactory dimensions by a separate group
• Machine awaiting tools from preset – necessary for current job
• Backup loading - internal resource unavailability, includes not enough tombstones or
space in tool cartridge to run jobs
• Other - lunch, meeting, edit program
4.4 Improvement Opportunities
In the table below suggestions for improvements to each part of Other Factors, setup
and variation in part cycle time, are listed and corresponded with the appropriate factor
they will affect. This list contains improvements that can be made to the current system
that will also affect any future system put in place.

Flexible Manufacturing Systems
40
Scheduling of resources Purchase of additional resources Simplify system
Backup loading
Focus resources by families of parts Standardize procedures for parts will reduce prove out time Have programmer at prove out for quicker response
Operator at other machine prove out
Separate immature jobs from mature jobs so as not to affect production Initiate program of preventive maintenance Assign clear responsibilities
Machine Problem
Find root cause to prevent repetitive problems Make QC available Job at QC Improve quality of parts produced
Oth
er F
acto
rs
Waiting on Tooling Similar to Backup loading Machine stops Fix root cause (probe fault) of repetitive
errors Make visible so machinist knows the problem
Waits for attention
Free up operator to deal better with problems
Var
iatio
n in
cyc
le
time
Needs action Make resources available so problems can be quickly fixed Standardize procedures Have programmer at prove out
Prove out
Separate activity from rest of jobs (mature versus immature) Externalize as much as possible Tool Change Reduce number of tools required
Setu
p
Load Program Standardize procedures Table 4-1 Improvements within Other Factors, Variation in Cycle Time and Setup
The underlying principle of the system redesign includes simplification of the
system in order to solve problems caused by system flexibility. This simplification
involves the focusing of resources including the machinist, tools, and machine, to
particular part families. This will help to identify root cause and standardize procedures.
Other ways to simplify the system include separation of prove out from production parts,

Flexible Manufacturing Systems
41
by assigning a machinist and a developmental machine to do this task, so as not to allow
production parts to be delayed by the long prove outs of immature parts.
The machinist matrix, Figure 4-7, shows that the operator is the necessary
resource to deal with all problems. Due to constant disruptions they have neither the time
nor the ability to improve root cause. It is necessary to reduce the need for the operator
by reducing disruptions or add an operator so these problems can be dealt with more
quickly. The more free time he has, the more he can be dealing with improvements to the
system. It is necessary for the operator to have clear responsibilities within the system so
as to use his time more efficiently.
Necessary Resources for Repair
Rea
sons
for M
achi
ne D
own
External Internal
Pre-set Engineer Program QC Maint Machinist Tombstone Tool cart Machine
Backup Load X X X
Mach. Prove Out X X X
Machine Problem X X X
Job at QC X X
Waiting Tools X X
Figure 4-7 Machinist Matrix
4.5 Analysis of Current System
A major theme seen in this analysis is flexibility. Flexibility can hinder
improvements in productivity. In this case, the increased flexibility has led to the
machinists being overloaded by many small and disruptive tasks, which make
improvement to the system difficult.
The system employed in this case study allows complete flexibility in part
production by using generic horizontal milling machines. Because of flexibility in the
machines and in the operations, it is the job of the programming department to determine
a process plan and, within the process plan, the order of operations. This lack of
standardization allows the programmers to produce programs using different methods.

Flexible Manufacturing Systems
42
This can lead to the use of different tooling on similar parts, as well as different feeds,
speeds and tool paths.
Due to the multiple types of materials and different types of possible cuts, it is
possible for a tool to wear unevenly. This uneven wear may affect its ability to produce
as expected on the next job. This flexibility in tooling contributes to the inability to use
the machines in an autonomous way. The machines are frequently in need of the
attention of the operator because of measurement errors, torque overloads, and other
types of probe faults, which can be caused by tool issues.
This flexibility is increased by the lack of machine, or product, ownership by the
machinists. No learning occurs from common parts and repetitive errors are not
recognized. Because of the constant interruptions caused by the system flexibility, the
machinists are overloaded. As was seen in the Figure 4-7, all problems and machine
stoppages require the machinist to attend to the machine. This causes continuous delays
and exceptions to the machinist’s required work pattern. This constant chaos also results
in minimal documentation and, therefore, poor resolution of the problems and
determination of root cause.
As a result of the flexibility of the system, the relationship between other
departments and the cell are not standard and, therefore, bring about varying quality of
the inputs into the system. These inputs include: tool selection, tool paths (programs),
tool sharpness, quality control, and maintenance speed and reliability. Because of the
large variation in parts that go through the system, and the large influx of new parts,
operating with a certain measure of decreased flexibility is the only way to stabilize the
system. This can be done by considering part families, a method by which
standardization can occur, and separation of machinery to allow dedication of workers to
machines, allowing quicker root cause analysis of problems.
4.6 Conclusions
It was difficult to determine root cause in this system; this is believed to be an
inherent problem built into Flexible Manufacturing Systems. The CNC machines allow
the running of multiple jobs on a machine at one time, causing the inability to directly
assign fault of a machine breakdown to one part. Machines connected with a shared

Flexible Manufacturing Systems
43
resource, such as a rover, allow shared responsibility by machinists, which can lead to
problems identifying repetitive errors. Due to the system construction it is difficult to
study the machinist’s work pattern, as many of his responsibilities cannot be measured.
The underlying principles for improvement that can be seen in the utilization
analysis include simplified flow, focused resources and standardization of work.
Simplified flow will allow for more focused attention on a job, quick response to
problems and better determination of root cause. By focusing resources they can be more
clearly assigned to part families and, therefore, cut down on flexibility. Standardization
of work for the machinist will allow him to better deal with his assigned duties and
quickly resolve problems. Standardization of parts and part families will allow quicker
prove out time and fewer probe faults because of thoroughly tested part methods. Each
of these areas is necessary to make the system more productive and manageable.
Utilization of machine was investigated in an effort to improve productivity of the
cell. Studying machine utilization has led to insights about machinist responsibilities. It
was determined that the machinist was overloaded with small disruptive tasks, due to
machine quality problems, and in order to improve productivity these disruptions must be
reduced.
In some cases, it is believed that utilization is not the appropriate factor to employ
in order to improve the system. High utilization usually necessitates high inventory and
large lead-time. In the current system utilization is the most reliable information that
could be obtained from the system. The system is also not able to produce all required
parts causing Heidelberg to outsource parts. Therefore, utilization is still the most
important measure since it is directly related to productivity of the system.
References
Heidelberg. Heidelberger Druckmaschinen AG. 2002 <http://www.heidelberg.com/>

Flexible Manufacturing Systems
44
Chapter 5 Case Study System Redesign In this chapter we focus on a new design for Heidelberg’s Maxim Cell. Many of
our insights for the new design are drawn from the analysis of the current system in
Chapter 4.
Summary of Chapter 4 findings:
1. Total standard production hours strongly correlate with lot size- A relationship
between the cell utilization and lot size was seen by analysis of the cell data.
2. Small lot sizes increase demands on machinists - As lot size decreases, production
time decreases and setup and other factors become more frequent.
3. Enormous variability in part types and lot sizes make it difficult to plan standard
work – Unexpected machine failures cause volatility in machinists’ tasks.
4. All tasks that reduce machine efficiency occupy the machinist - A matrix of
machine failures and their necessary resources show a correlation between the
need for the machinist and any type of breakdown.
This section will be a review the competitive goals determined by Heidelberg,
followed by an analysis of a benchmarking exercise to compare multiple sites, all using
similar Flexible Manufacturing Systems. Miltenburg's Manufacturing Strategy Worksheet
will also be used, including its implications on future system design. This will be
followed by a description of the system recommendations and a simulation used to
validate the recommendations.
5.1 Competitive Goals
The competitive goals of the manufacturing system chosen for the redesign were to
increase productivity while retaining flexibility and making the system manageable and
reliable.
Productivity – Ability to produce a certain number of parts within a time period. It can
be measured as standard hours of parts produced, or utilization.
Flexibility – Ability to successfully respond to variation mostly in parts related
parameters (implies variation within an expected range that can be handled as routine).

Flexible Manufacturing Systems
45
Possible measures of flexibility include: production volume, lot size, parts variety
(predefined), and quickness of introduction of newly developed parts.
Manageability – Ability to handle infrequent events that require redirection of resources.
Implies that intervention of management is required, hence, beyond the usual range of
variation, often applies to problems with resources and infrastructure, as well as large
changes in parts parameters.
Reliability – Elimination of variability in machines, work tasks and support response.
5.2 Benchmarking
5.2.1 A Case Study Analysis of Flexible Manufacturing Systems
In order to study under what conditions a FMS Horizontal Machining Cell would
perform best; we visited two companies with the same FMS as Heidelberg. The results
show a higher satisfaction with the FSM at the two companies visited. The main
difference was in the characteristics of products produced. In Site 2, the small part type
count has been exploited to not only improve utilization, but to allow for a low machinist
to machine ratio, as well. Table 5-1 is a summary of the different system characteristics
for the three sites.
Heidelberg Site 2 Site 3 Machines 5 6 2 Machinists/Shift 4 2 2 Programmers 5 1 1 Part Types 2000 9 200 Part Types/Year 811 9 -- New Part Types/Year ~240 2 6-12 Average Part Runtime 22min 5hours 23min Material Types 8 1 2 Parts/Hour 5.9 0.317 2.65 Total Produced/Year 35,000 1716 10,000 Utilization 44% 70%-80% System meets capacity goals
Table 5-1 Benchmarking System Characteristics Summary

Flexible Manufacturing Systems
46
History of Benchmarked Systems
Site 2 started the cell six years ago with the introduction of two 4-axis machining
centers. After that, two more machines were added in 1996 and then the last two were
added in 1999. All of the parts that are completed by the cell are titanium forgings. An
FMS system was used because of the complex part and part fixturing, long processing
time, and high necessary tolerances. There are other machining cells and machining
centers within the facility. These centers are producing parts of similar complexity and
volume, but made of different materials. The current system has two setup stations, but
only one is primarily used. From this station, four of the machines are easily accessible
without long walking distances. Due to a low percentage of new parts a year, the system
runs smoothly with only one programmer and two machinists per shift for six machines.
Site 3 used the FMS cell to replace two of six, older stand-alone Hydrotell
machines, approximately five years ago. They were replaced by the two machines that
make up the FMS, in order to increase capacity as well as by a conscious decision to
improve technology within the factory. There are still four of the older machines in the
factory. Most parts in the cell are produced from aluminum plate; some are from
aluminum forgings. The cell makes medium sized parts, the four older machines produce
larger parts, and a Tsugami machining center is used to produce parts of smaller size.
The goal of the current system is not high utilization; it is a system to produce the
necessary parts. Two machinists and one programmer manage the two-machine system.
In some cases of large fluctuation of new parts into the system, more programmers have
been known to participate.
System Characteristics at Heidelberg
Heidelberg has a considerably larger number of new parts per year than Sites 2
and 3 (almost one every day). This increases the necessary number of programmers for
the system and inhibits the system from reaching a steady state production mode. In
comparison, at Site 2, because of the low frequency of new parts, the programs can
become mature and error free, allowing the machinist to gain the benefit of the machine's
ability to run autonomously.
Flexible Manufacturing Systems
47
At Site 2, the number of workers to machines was greatly improved over a one-
man one-machine situation, with two workers running six machines. The major factor
that caused this large improvement over the other systems is the low total product mix
and longer cycle times. The benefit of the low product mix is that the fixtures do not
come off of the tombstones, allowing for essentially one-piece flow as internal setup is
eliminated.
Summary
In the case of Site 2 and Site 3, the product mix and frequency of new parts fits
the system requirements better. Site 2 is the only one with a large savings in labor, with
two machinists running six machines. Site 3 does not acquire this savings, with two
machinists for two machines because of a lower total volume and, perhaps, part
complexity.
To improve the Heidelberg system requires a reorganization of resource
management. In both Site 2 and Site 3 there is only one programmer. This eliminates
much of the need for standardized programs, tooling, and procedures. In Heidelberg,
with five programmers and four machinists, there is a necessity to improve information
transfer and success of new programs by implementing standards and procedural guides.
An FMS may not be the most effective system to meet Heidelberg’s needs: large
mix, large frequency of new parts, and short cycle times. The following chart, taken
from A Factory with a Future by J T. Black, has been used to visually compare the three
systems studied. It shows that in order to more closely match the attributes of the FMS
system, Heidelberg must reduce part variation to the system. In Heidelberg, the current
system equipment is an FMS but the current part characteristics (mix and volume) place
the production in the job shop regime. This shows the mismatch between the system and
the system parameters. Included also on the chart are the two other systems compared to
Heidelberg. In order to more closely match the attributes of the FMS system, Heidelberg
must reduce part variation to the system and move into the regimes that the other systems
are currently in.

Flexible Manufacturing Systems
48
Sit
Heidelberg
3 2
Figure 5-1 Comparison of Different Types of Manufacturing Systems (Black, 1991)
5.2.2 Lean Aerospace Initiative’s Flow Efficiency
The Lean Aerospace Initiative of MIT was able to acquire a measure of flow
efficiency for a variety of manufacturing systems. This data can be used to benchmark
the current system. Flow efficiency is the ratio of actual or “value added” production
time of one part to the total lead-time of the batch. To determine the following efficiency
of the cell an average production time was calculated which is the average time for any
part that is produced to spend in the machine. The lead time of the batch is the time from
initiation of the first part into the cell to completion of the last part of the batch. Figure
5-2 shows that in order to increase flow efficiency, or increase the productive time ratio,
it is necessary to leave the job shop regime and enter the flow shop one. (Shields, 1996)
014.04867.0
TimeLeadTime Prod Avg.
===hrshrsencyFlowEffici

Flexible Manufacturing Systems
49
(Theoretical Maximum)
Figure 5-2 Flow Shop and Job Shop regimes on a Flow Efficiency Plot (Shields, 1996)
5.3 Redesign Methodology
In this section we follow a methodology taken from Manufacturing Strategy by
John Miltenburg. A summary of the results from the analysis are presented here.
5.3.1 Miltenburg’s Manufacturing Strategy Worksheet
The essence of Miltenburg’s approach to manufacturing system design is
summarized in a single worksheet which allows one to go from system goals, to
manufacturing system types, to the required infrastructure improvements (called
manufacturing levers by Miltenburg). The core of this worksheet, which is reproduced in
Figure 5-3, allows one to go from manufacturing output requirements to manufacturing
system types. According to Miltenburg “manufacturing provides six manufacturing
outputs; cost, quality, flexibility, performance, delivery and innovativeness-to its
customers. Some outputs will be provided at higher levels than others because no single
production system can provide all outputs at the highest possible levels.” (Miltenburg,
1995) A more in-depth summary of Miltenburg’s theory, including a reproduction of the
entire Manufacturing Strategy Worksheet, can be found in Chapter 3 Section 2.
Heidelberg Web Systems

Flexible Manufacturing Systems
50
Heidelberg’s new Manufacturing Outputs fall into four critical areas:
Cost - Cost of material, labor, overhead and other resources to produce a product.
Quality - The extent to which materials and operations conform to specifications
and customers expectations.
Flexibility - The extent to which the volumes of existing products can be
increased or decreased.
Innovativeness - The ability to quickly introduce new products or make design
changes to existing products.
Miltenburg’s Manufacturing Strategy Worksheet (Figure 5-3) shows that the FMS
can generally provide high levels of response to the cost and quality criteria, but the best
type of system to meet the flexibility and innovativeness criteria is a job shop. This
explains the discrepancy in the way the current system was built and the way it is
managed, and agrees with the analysis of the J T. Black chart and Flow Efficiency figure.
It shows that no one system can meet all of the criteria and the product and volume
requirements.
Figure 5-3 Manufacturing Strategy Worksheet-Partial (Miltenburg, 1995)
5.3.2 Conclusion
The results of our previous analysis (Figure 5-1 and Figure 5-2), our benchmark
comparisons (Table 5-1) and the Miltenburg methodology (Figure 5-3) all point in the
same direction. The current system is overwhelmed by the large number of part types,
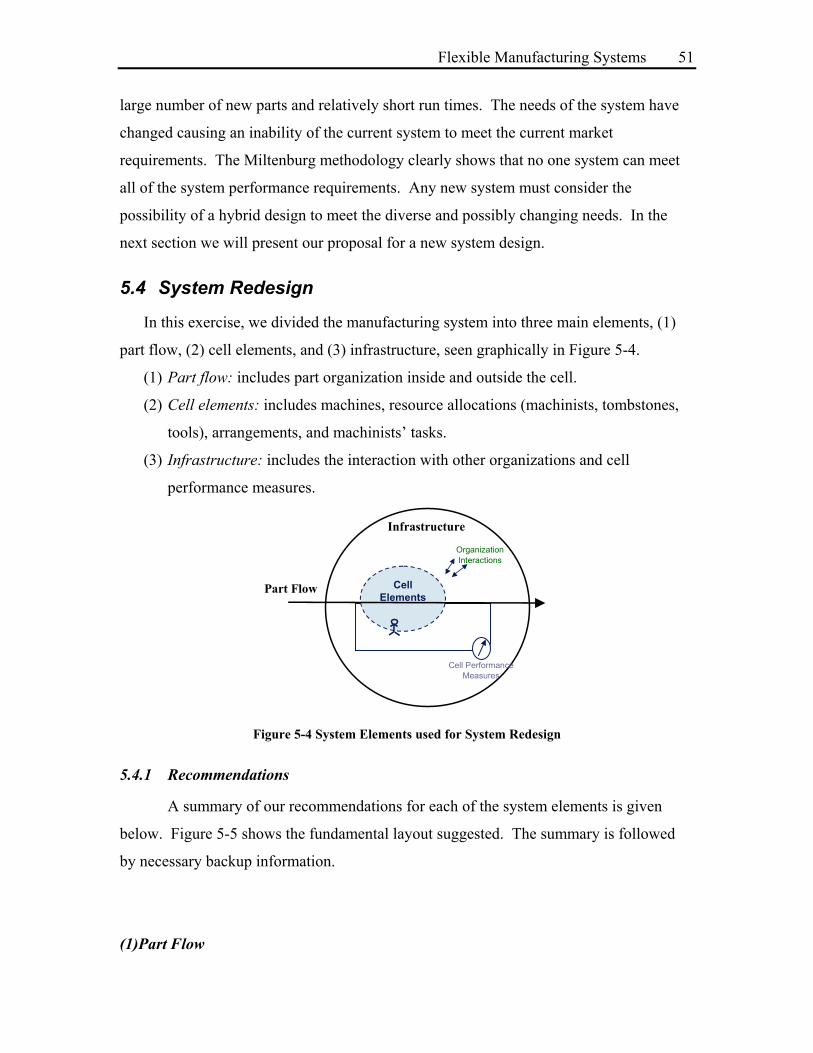
Flexible Manufacturing Systems
51
large number of new parts and relatively short run times. The needs of the system have
changed causing an inability of the current system to meet the current market
requirements. The Miltenburg methodology clearly shows that no one system can meet
all of the system performance requirements. Any new system must consider the
possibility of a hybrid design to meet the diverse and possibly changing needs. In the
next section we will present our proposal for a new system design.
5.4 System Redesign
In this exercise, we divided the manufacturing system into three main elements, (1)
part flow, (2) cell elements, and (3) infrastructure, seen graphically in Figure 5-4.
(1) Part flow: includes part organization inside and outside the cell.
(2) Cell elements: includes machines, resource allocations (machinists, tombstones,
tools), arrangements, and machinists’ tasks.
(3) Infrastructure: includes the interaction with other organizations and cell
performance measures.
Infrastructure
Part Flow
Cell Elements
Organization Interactions
Cell Performance Measures
Figure 5-4 System Elements used for System Redesign
5.4.1 Recommendations
A summary of our recommendations for each of the system elements is given
below. Figure 5-5 shows the fundamental layout suggested. The summary is followed
by necessary backup information.
(1)Part Flow

Flexible Manufacturing Systems
52
• Part Families can help improve productivity of the system.
Currently there are 2,000 active part numbers in the cell, 811 of them were run in
1999 alone. The use of part families allows reduction in the total part variety and will
shift the system characteristics closer to the regime of the flow shop system. Part families
allow production to benefit from the knowledge of the worker by allowing him
ownership for a family of parts, which increases improvement opportunities and problem
recognition. Ultimately, a machinist and a programmer should have ownership of a
family, in order to allow for improved quality of programs. Through an initial study,
such benefits have already been seen in a family of parts with the reduction in castings
from 86 to 7.
• A hybrid system is necessary to meet the manufacturing goals.
A hybrid system, shown in Figure 5-5, is proposed to meet the diverse needs of
Heidelberg. Prove out parts and immature parts, are dedicated to one machine and one
machinist. In this way, these jobs cannot disrupt the production jobs. The most
knowledgeable machinist would be placed on the prove out machine, ultimately
improving the programs for these new parts. The machine organization can be changed
to deal with changes in market requirements.
Figure 5-5 Hybrid System Proposal
(2) Cell Elements
• Stand-alone machines allow improved machinist job characteristics and root
cause analysis.
Allowing a machinist complete control over a job from initiation to completion
allows him not only ownership but also feedback from the system by completing both the
setup and the machining. It now becomes necessary for the machinist to have knowledge
of both setup and machining.

Flexible Manufacturing Systems
53
The cell currently exhibits constant job delays and waiting. In a stand-alone
system, each machine would only have two jobs running, and the setup station would not
be separated from the machine providing for less travel time and queuing time. Stand-
alone machines would also allow better tracking of jobs for root cause analysis and
observation of the system. To reduce the risk of a bad job inhibiting production, it is
suggested that the new system be designed with adequate “set-aside” space next to each
machine. Set-aside space would enable the removal of a bad job from the system.
• A Transition State is necessary to reduce the risk of switching to stand-
alones.
In this way, the system can slowly improve in machine reliability and program
reliability without risking a large drop in productivity during the change. It is
recommended to start with a one man one machine scenario and transition to a one man
two machine scenario as improvements occur.
Stand alone Transition State Production
Figure 5-6 Transition States
(3) Infrastructure
• Dispatch information must be expanded in depth and breadth.
With the separation to stand-alone machines, the dispatcher will now need to send
jobs to individual machines requiring more information about maturity, lot size, and part
family. Some cross training will be necessary to allow some flexibility in assigning jobs
to machines.
• Quick response from all organizations is necessary.
The new system requires the CNC programs to have a zero defect rate so as not to
severely decrease utilization. It is advisable to reevaluate the way these groups are
situated, in order to improve the response time. Possibilities for this include moving
programming next to the cell and assigning a maintenance person sole responsibility for

Flexible Manufacturing Systems
54
the machines in the cell. It is recommended that other parts of the organization make use
of the part families determined.
5.4.2 Backup Information
In this section we go into more detail concerning: 1) machinists’ tasks which are
captured in the “Machinist Wheel,” 2) part families based upon an examination of the
“pork chop” family, and 3) dispatch which will be more challenging with the new system
design.
Machinist Wheel
It is easiest to think of the machinist’s tasks as a wheel, or pie chart. The wheel
represents a machinist’s total day. In the current system, there are two types of
machinists, the setup machinist and the prove-out machinist. Each of these machinists
takes 2.5 machines under his priority (the current system has 4 machinists, 5 machines,
each with 2 tasks). Figure 5-7 shows the distribution for the two machinists.
Load Tools
Probe Fault
Prove Out
Maint
Broken Tools Probe
Fault Prove Out
Maint
Broken Tools
Load Tools
Machine 2
Machine 1
Machine 5
Setup Station
Machine 2
Setup Station
Machine 1
Setup Station
Machine 5
FixtureSetup
Part Change
Fixture Setup
Part Change
Fixture Setup
Part Change
Prove Out Machinist Setup Machinist
Figure 5-7 Current Machinist Job Wheels
It is imperative when designing a machinist’s work that it includes standard and
repetitive work with feedback about the system. Note that in the case of a disturbance to
the current system, such as a machine failure, there is no feedback of such occurrences
inherent in the setup machinist’s work. In the case of long running proven out parts, this
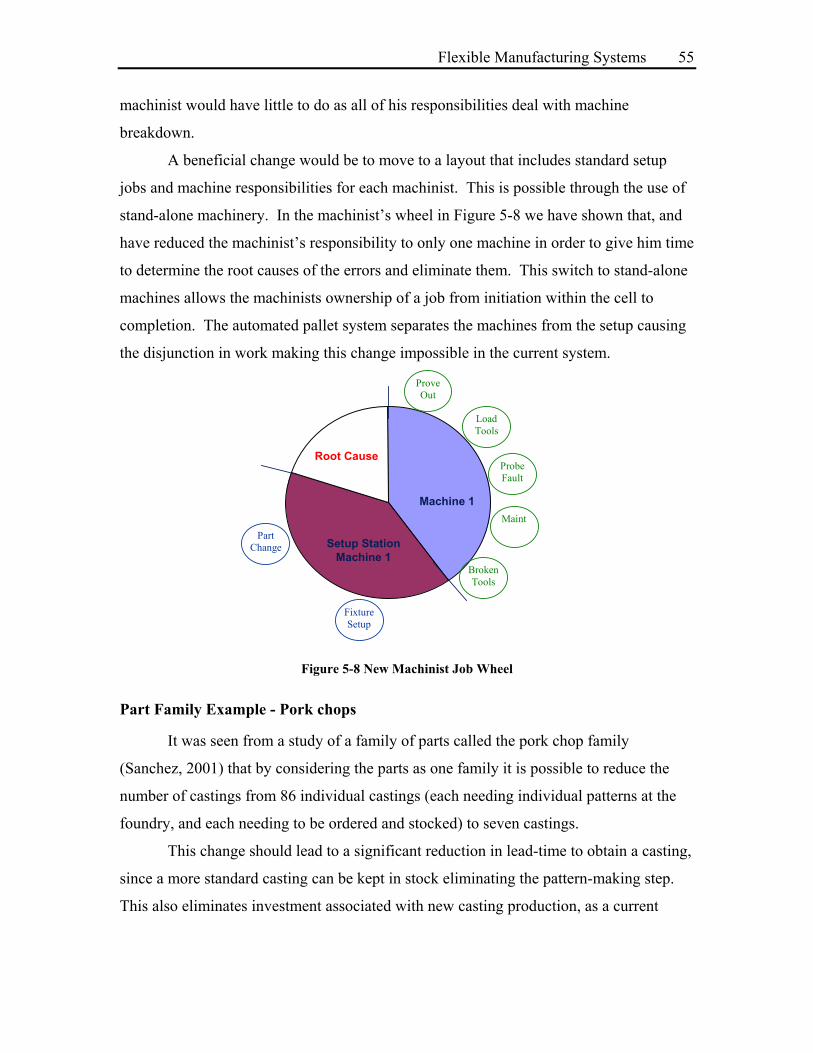
Flexible Manufacturing Systems
55
machinist would have little to do as all of his responsibilities deal with machine
breakdown.
A beneficial change would be to move to a layout that includes standard setup
jobs and machine responsibilities for each machinist. This is possible through the use of
stand-alone machinery. In the machinist’s wheel in Figure 5-8 we have shown that, and
have reduced the machinist’s responsibility to only one machine in order to give him time
to determine the root causes of the errors and eliminate them. This switch to stand-alone
machines allows the machinists ownership of a job from initiation within the cell to
completion. The automated pallet system separates the machines from the setup causing
the disjunction in work making this change impossible in the current system.
Load Tools
Probe Fault
Prove Out
Maint
Broken Tools
Setup StationMachine 1
Machine 1
Root Cause
Fixture Setup
Part Change
Figure 5-8 New Machinist Job Wheel
Part Family Example - Pork chops
It was seen from a study of a family of parts called the pork chop family
(Sanchez, 2001) that by considering the parts as one family it is possible to reduce the
number of castings from 86 individual castings (each needing individual patterns at the
foundry, and each needing to be ordered and stocked) to seven castings.
This change should lead to a significant reduction in lead-time to obtain a casting,
since a more standard casting can be kept in stock eliminating the pattern-making step.
This also eliminates investment associated with new casting production, as a current

Flexible Manufacturing Systems
56
standard pattern is already available. The standard castings will also significantly reduce
the number of fixtures necessary on initial machining steps.
A universal casting will weigh more than its current counterpart due to extra material
to accommodate more parts and, therefore, each casting will be more expensive to
purchase from the foundry. Due to this extra material, there will also be an increase in
machining time to cut it away.
It has been shown that it will take between two and three years before there is a
return on the initial investment in the new patterns necessary to switch to common
castings. (Sanchez, 2001) This analysis assumes 8 new castings would be needed per
year in the current system, and accounts for the additional cost in the weight of the
common castings. It does not take into account the additional machining costs or fixture
costs, and was not able to determine a monetary amount associated with the savings in
lead-time. It is believed such improvements can be seen with other part types as well, not
only in casting costs, but also in quicker program production, better use of fixtures, and
reduction in scrap and rework. (Sanchez, 2001)
Dispatch
Dispatch is a critical part of system utilization. It is important that the person in
charge of dispatch understand the resources and steps necessary for assigning jobs. The
policies used to dispatch parts to the cell can affect part flow and work management.
Dispatch for the cell, in the current system, is done mainly by prioritizing project
due dates. The process is done manually and requires some knowledge of the parts. In
order to be prepared for production, the dispatcher will check for complete programs and
request tools and fixtures. The dispatcher manually writes down the fixtures and tools
necessary on cards and determines how much in advance these need to be submitted in
order to be ready in time for production. He must check on their arrival before allowing
production to start on the job.
Stand-alone machines require different dispatching needs. Instead of dispatching
to the cell as a whole, it is necessary to dispatch per machine to take advantage of the
knowledge gained by the machinist and the resources. It is also more important not to
overload one machine and to allow balance in types and cycle times of parts produced.

Flexible Manufacturing Systems
57
In order to allow such a change, it is necessary to add depth and breadth to the
information made available to the dispatcher. He has no current knowledge of the
maturity of a program except through his own experience with the part. It is also
necessary to have a clearer understanding of the resources necessary, such as top tooling,
to allow those to factor into the decision. The change also brings with it the risk of
machine starvation when a part family is not being produced. It is, therefore, necessary
to consider cross training of workers to multiple part families.
5.5 Simulation
In an effort to determine how the proposed changes would affect the system a
simulation was performed to study the affects of (1) part characteristics, (2) system
configurations, and (3) worker assignments on machine utilization and machinist
utilization. Hence, system simulation provided a tool to assess the proposed system
redesign as well as other system changes and reconfigurations. The models were created
in Taylor ED 2000 Version 3.4, produced by Enterprise Dynamics. This software was
chosen over other similar software because of the ease of creating unique simulation
components using a straightforward programming language.
5.5.1 Simulation Basics
In order to make the problem manageable, a simplification of the real system was used as
shown in, Figure 5-9.
Figure 5-9 Simulation Modeled System Components

Flexible Manufacturing Systems
58
The basic system is made up of the machinist, the setup station and the machine.
Run times for events at the setup station and machine are given as model parameters and
depend strongly upon the part order inputs and the machinist’s availability. The
machinist’s actions depend upon a task priority system and the physical arrangement of
machines and machinists. Table 5-2 gives in outline form the basic parameters for the
model. Detailed description of the distributions used and the underlying assumptions can
be found in Appendix C.
Initial parameter values were chosen for each item based on personal experience
within the factory. Included also were breaks and lunch for the operator. For each new
job into the system, one prove out and one fixture setup were performed. For each
subsequent part no prove out or fixture setup was performed. Each part was subject to a
part change on the fixture. When multiple tasks requested the operator’s assistance, the
priority order used was 1) machine down, 2) prove out time, 3) part change, then 4)
fixture setup. Each machine was allowed two active tombstones at a time, therefore,
allowing two active jobs at a time.
Inputs Setup Station Machine Outputs
Part Orders Cycle Time Lot Size
Setup Time* Prove Out Time* Machine Utilization
Part Change Time* Machine Down* Maintenance Tool Break Probe Fault
Machinist Utilization
* Requires Machinist
Table 5-2 Simulation Model Parameters
5.5.2 Model Procedure
A comparison of the model to the current system was conducted using historic
data to verify the assumptions and simplifications described. Using this model, the
stochastic model parameters can be modified until verification is met.
Once the model is confirmed, new system implications can be studied for their affects
on the system. This will be divided into 3 categories: (1) machine configurations, (2) part
inputs, and (3) sensitivity to stochastic parameters.

Flexible Manufacturing Systems
59
Comparison of model with historic data
The first model simulates the current system layout that can be seen in Figure 5-10.
In the model, one team of machinists has main ownership of two machines and shares the
ownership of a third machine. One machinist is in charge of setup responsibilities and
the other, machine responsibilities. In the current system there are two such teams, which
share the responsibility of a fifth machine.
M1 M2 M3
Figure 5-10 Simulation Current System Model
Figure 5-11 shows a comparison between the simulation results and data for a
specific month in 1997 (based upon 20 hours of human observation). In comparing the
pie charts of Figure 5-11 simulation generated “busy” is directly related to the observed
“spindle up” time. In the simulation model, “setup” is made up of prove out, which can
be directly compared between the two pie charts. Machine “down” is made up of the
three types of downtime: maintenance, tool break, and probe fault. Therefore, probe fault
cannot be separated in order to compare. But it should be noted that part of what is
believed to be associated with “probe fault” in the observation would be considered
“waiting for operator” by the simulation. Therefore, the simulation agrees with the 1997
observation in all categories that can be directly compared.

Flexible Manufacturing Systems
60
Figure 5-11 Comparison of Simulation with Historic Data
The model was also used to generate “utilization curves.” Data of varying cycle
time and lot size was used and these results were compared with data generated from
1997/1998 data. As can be seen in Figure 5-12, these trends match the data generated in
that report. The difference in slope is hypothesized to be attributed to a variation in cycle
time from month to month of the actual system.
0
10
20
30
40
50
60
70
0 5 10 15 20 25 30 35Lot Size
Util
izat
ion
Cycle Time =20
Cycle Time =10
1997/1998 Data
Figure 5-12 Simulation Utilization Trend Comparison to Historic Data

Flexible Manufacturing Systems
61
Change in Machine Configuration
Multiple machine configurations were then tested to see their affect on machine
and operator utilization. In each configuration shown in Figure 5-13 there is a change in
the operator job description varying from setup, machine tasks or both. The dots used to
signify the machinists, indicate the machinist job assignments.
1
Current State
3
Division of Labor
2
Stand-alone
4
2 Machine 1 Operator
Figure 5-13 Machine-Operator Configurations Modeled in Simulation
The machine utilization and operator utilization for each of the cases above are
shown in Figure 5-14. The data used to generate this chart can be found in Appendix C
Table C-5. In the case of different utilizations within the same configuration, an average
was taken. A change in configuration has a large effect on both machine and operator
utilization. As seen in Figure 5-14 reorganization to stand-alone equipment
(Configuration 2) with one machinist in charge of each machine has the highest expected
machine utilization. The simulation also shows that a decrease to a one machinist, two
machine configuration (Configuration 4) could have a large negative impact on the
machine utilization that must be compared to the cost savings it allows before such a
decision is made.

Flexible Manufacturing Systems
62
0
10
20
30
40
50
60
70
80
90
100
0 20 40 60 80 100
Utilization of Operator
Util
izat
ion
of M
achi
ne
12
34
2 Machine 1 Operator
Current State Division of Labor
Stand-alone
Figure 5-14 Utilization of Different Machine Configurations Using Simulation
Production of Different Part Inputs
With the new system design there is also an expected shift in part input
characteristics. It is expected that more of the simple parts will be outsourced and the
more complex ones with longer prove out times and run times will be held in house.
Based upon these observations, a set of representative future part times was developed.
Using the same four system configurations, the simulation was run with the new input
data. As can be seen in Figure 5-15, there is a considerable change in the utilization of
both the machine and the machinist with the changes in input. This can be associated with
an increase in both average lot size and average cycle time by 2.5 times. The data used to
generate this chart can be found in Appendix C Table C-5.

Flexible Manufacturing Systems
63
0
10
20
30
40
50
60
70
80
90
100
0 20 40 60 80 100
Utilization of Operator
Util
izat
ion
of M
achi
ne
4
2
13
12
3 4
Worker Constrained
Fragile
Candidate for
Redesign Target
Not Likely
Current Inputs
Proposed Inputs
Figure 5-15 Utilization Map Comparing Machine Configuration and Part Inputs
Overlaid on Figure 5-15 are five categories of systems operation. High machine
utilization is desired, but if there is high machine utilization and operator utilization, the
system may be considered “fragile” because a slight increase in the operator utilization
will probably have a huge negative affect on the machine utilization. A low machinist
utilization and high machine utilization indicated possible “redesign” efforts that would
combine workers keeping the system production high and reducing the operational cost.
The “target” regime is one with a high machine utilization and approximately 50%
operator utilization, which causes the operator to be busy and yet also available for quick
response to problems and root cause analysis.
In this case, the target regime can be met in multiple ways. The first is through a
system redesign to one machinist and one machine. It is also possible to accomplish it
with one machinist and two machines, assuming the changes in part inputs. Figure 5-15
also shows that the current system is in the “operator constrained” regime, which verifies
the previous hypothesis made in Chapter 4.
Sensitivity analysis to stochastic parameters
In this section we look at the sensitivity of our results to variation in input
parameters, in particular setup, prove out and machine failure times. Each of these in

Flexible Manufacturing Systems
64
turn is related to the three biggest changes Heidelberg expects in the near future. These
are:
A Configuration change is expected to decrease machine failures by allowing
the machinist more ownership of his machine. This allows him to see both
repetitive program errors and machine failures sooner, improving root cause.
An increased Part Complexity is associated with the increased production
time in the future parts. With this change in part complexity comes an increase in
fixture setup time and prove out time due to the inherent increased features of
more complex parts.
Part Families aid the identification of products, therefore, causing
improvements in prove out times, design of the fixtures, and probe faults.
The stochastic parameters have been grouped into two categories, as seen in the matrix
below. The two parameter groups are: setup quantities (fixture setup, prove out, and part
change) and machine failures (maintenance, probe fault, and tool break). These
parameter groups can be changed individually to understand the effects of the system
changes on them. Appendix C Table C-3 and Table C-4 show the distribution changes
made.
Setup and Prove Out
Machine Failures
Configuration X - Part Complexity X +
Part Families X - X - Table 5-3 Change Effect Matrix
Figure 5-16 and Figure 5-17 show how a 50% change, both negative and positive,
in these two categories (setup and machine failures), would affect the systems. The
analysis was done for both Configuration 3 and 4 (Figure 5-13) in order to verify the
trends. The impact of these changes is shown with ‘x’ in the figure.
In Figure 5-16, we see that the change in machine failures exhibits a larger affect
on the future data set than the current set. The future input is in a machine constrained
regime and, therefore, a change in a machine parameters directly affects utilization. In
the current data set, the system is operator constrained, therefore, the affect of the failures
is smaller.

Flexible Manufacturing Systems
65
With a 50% change in setup times, the current input data exhibits a larger change
in machine utilization than the proposed input data. The current input lies in the
machinist constrained region and such a change in setup time is directly related to the
machinist time, causing the large affect on operator and machine utilization. Most of the
setup is external to the machine cycle time, therefore, when the machine is the
constrained resource, there is a much smaller effect.
0102030405060708090
100
0 20 40 60 80 100
Utilization of Operator
Util
izat
ion
of M
achi
ne
Current Inputs
Proposed Inputs
50% Increase andDecrease inMachine Failures
43
3 4
Figure 5-16 50% Change in Machine Failures
0102030405060708090
100
0 20 40 60 80 100
Utilization of Operator
Util
izat
ion
of M
achi
ne
Proposed Inputs
Current Inputs
50% Increase &Decrease in Setup
4
3
3 4
Figure 5-17 50% Change in All Setup Quantities

Flexible Manufacturing Systems
66
5.6 Conclusion
These results strongly suggest that a change in system type is necessary. This study
explored possible system regimes and showed that the current system is not operating in
the regime it was intended. This could be caused by a shift in market conditions since the
system was first put in place. The current part characteristics caused the system to run as
a job shop, although the equipment is that of an FMS. This analysis was confirmed with
the use of Miltenburg’s Manufacturing Worksheet on manufacturing strategy, LAI’s flow
efficiency analysis, Black’s system comparison, and benchmarking of other companies
running the same system. It has been suggested that a change to stand-alone machines
will improve productivity and allow for root cause analysis in order to continue to move
toward the target regime. The simulation allowed estimates of this improvement with (1)
changes of operator and machine configuration, (2) changes of part characteristics and (3)
improvement of machine and setup characteristics. The structural and infrastructure
system elements were discussed and improvement plans, including possible transition
states and hybrid systems, were determined. Possible risks associated with such a change
were also discussed.
Wickham Skinner proposed the idea of focused factories in his book
Manufacturing: The Formidable Competitive Weapon. It states that by separating parts
into families and dedicating resources to them we are creating factories within bigger
factories. The hybrid system proposed is similar to these focused factories and will be
used to help reduce variation and increase recognition of parts. The system is also a
dynamic one that can be flexible to change with changes in market conditions.
References
Black, J T. The Design of the Factory with a Future. New York: McGraw-Hill,1991. Miltenburg, John. Manufacturing Strategy: How to Formulate and Implement a Winning Plan. Portland: Productivity Press, 1995. Sanchez, Nathan. “Group Technology and the Application of Process Planning in a Flexible Manufacturing System.” Bachelors Thesis. MIT. Cambridge, 2001. Shields, J. Thomas. “Factory Flow Benchmarking Report.” Lean Aerospace Initiative Report RP96-06-61. MIT. Cambridge, 1996.

Flexible Manufacturing Systems
67
Skinner, Wickham. Manufacturing: The Formidable Competitive Weapon. New York: John Wiley & Sons, 1985.

Flexible Manufacturing Systems
68
PART ONE CONCLUSION:
CASE STUDY ANALYSIS AND DESIGN PART ONE CONCLUSION The case study discussed in Part One has improved our understanding of
manufacturing system design and has shown some repetitive overarching themes that will
be reviewed here. It is from this experience that we recommend the consideration of
these themes when determining the appropriate use of an FMS in a manufacturing
facility.
It can be stated that those themes discussed all relate to the flexibility, as
discussed in Chapter 4. The increased flexibility that was designed into the system is
causing many of the repetitive errors to go unidentified and causes the reduction in
quality.
• Focused Resources
It was observed that there was constant competition and waiting for resources. It is
suggested that by focusing these resources, using part families, this waiting can be
minimized.
With 2000 part numbers possible in the cell, the system can be considered a job shop.
By considering the use of part families, which will reduce the possible varieties of parts,
to a smaller list of families, the system can move out of the job shop regime and start to
perform more productively. Part families will allow a reduction in the varieties that must
be learned by the machinists and programmers, allowing the possibility for improved
quality of programs and parts because learning can be carried from one part to the next.
By considering all the pork chop parts as a family, a large reduction in necessary tooling,
and casting variations was identified. A standardization of the tooling path was also
found which will improve performance within the cell.
• Simplified Flow
With dedication of setup station, machinist, and machine we can create a simplified
flow path for parts, allowing for more focused attention on a job, quicker response to
problems, and better determination of root cause. In the case of the cell discussed, a

Flexible Manufacturing Systems
69
stand-alone machine allows for a reduction in the number of current jobs the machinist
must have knowledge of.
• Standardization
Standardized work for the machinist will help him better deal with his assigned duties
and be available to resolve problems quickly. Standardization of tool lists and
programming principles, will help improve the quality of other departments by reducing
prove outs, probe faults, and helping to determine root cause. It is also necessary to
standardize relationships with other departments with clear rules and interfaces to avoid
miscommunication and to promote quick responsiveness to problems.
Conclusion
As was seen in the analysis shown, a Flexible Manufacturing System is not
appropriate in all circumstances. In some cases of product mix, volume, and rate of new
products, an FMS can cause a system to be in constant chaos. Such a system can be
made productive with considerable planning and scheduling. But in this case, there is no
way to make a predictable schedule since the production time estimates are not reliable
and the programs are of low quality.
In determining the appropriate production system, it is necessary to consider the
system goals and system parameters. It has been seen here that not all types of
production systems will work well in all types of situations. A current mismatch was
found between the parameters, goals, and the Flexible Manufacturing System that was in
place. A hybrid system has been discussed to meet a wide variety of different and
possibly changing system goals and system parameters. The machine organization can
also be easily modified to deal with the changing performance goals and market
requirements.

Value Stream Mapping
70

Value Stream Mapping
71
PART TWO
VALUE STREAM MAPPING
PART TWO VALUE STREAM MAPPING The goal of Part Two of this report is to discuss in-depth an improvement tool.
Value stream mapping was chosen as the subject matter. The purpose of the current
project will be to study a cross section of those companies using value stream mapping
and to compare and contrast the success of the multiple activities.
Chapter 6 will review the background of lean manufacturing and describe how
value stream mapping fits into the lean principles. Chapter 7 will attempt to answer the
questions defined in the Chapter 6 problem statement about the use of value stream
mapping.

Value Stream Mapping
72
Chapter 6 Background and Problem Definition for VSM Lean manufacturing, is the philosophy of eliminating waste within a process;
looking to isolate the value added activities and place them in a form of continuous flow
to better meet customer demand. Many industry leaders, in order to improve their
processes toward the ultimate lean production system, are using value stream mapping
(VSM). VSM allows a simple two-dimensional representation that separates the value
added steps from the non-value added ones. As seen in the case study discussed
previously, value stream mapping is a great tool to help determine wasted steps, reduce
total lead-time, and provide a valuable door-to-door perspective on the entire process.
First the history of lean will be discussed, including the five key principles, and its
implementation in the US. This will be followed by a detailed discussion of value stream
mapping, since it is from these five key principles that value stream mapping was
developed.
6.1 Lean History
Lean is a term coined by The MIT International Motor Vehicle Program to
describe the Toyota Production System (TPS), in their publication The Machine That
Changed The World. The goal of this publication was to characterize the performance
differences between companies operating with traditional mass manufacturing systems
and those using TPS (Cochran, 2000). This book revolutionized the way people thought
about the automotive industry.
The Toyota Production System, now known also by the terms “lean” or Just-in-
Time (JIT), was developed based on the cultural, geographic and economic history of
Japan in the 1950s. The Japanese believe more strongly in conservation of material than
our US “throw-away society” does, making it easier to adapt tight material control
policies. Due to a more systems-oriented culture, policies that cut across individual
workstations, such as cross training of floating workers and total quality management,
were easier to adapt. The location of suppliers also made it feasible to have more frequent
deliveries. The possible impending doom of the automotive industry in Japan without an
increase in efficiency and productivity fueled the ability to make drastic changes (Hopp

Value Stream Mapping
73
and Spearman, 1996). Working under the desperation that this created, the theories and
principles of lean manufacturing were developed.
Lean has been implemented in a diverse set of environments including aerospace,
consumer products, metals processing, and industrial products (Spear and Bowen, 1999).
Contrary to Toyota’s open atmosphere about its practices, “few manufacturers have
managed to imitate Toyota successfully” (Spear and Bowen, 1999). The decomposition
of the Toyota Production System is difficult because many of the control functions, tools,
and practices (pull system, kanban, andon lights, pokayoke checks) are being confused
with the system. TPS is not just the implementation of these tools, there are principles
that underlie it. Although lean has spread throughout the manufacturing section of most
businesses, it is only now spreading towards other sectors of the business, including
product development where it has only been attempted in 20% of the activities (Chase,
2001).
Using the principles of lean manufacturing, which were developed in the
automotive industry, considerable system improvements have been seen in the aerospace
industry. Lockheed Martin obtained large savings on the F-16 project, including a 50%
reduction in floor space and a 60-80% improvement in cycle time (Lewis, Norris, &
Warwick, 2000). Using the principles of lean, General Electric saw an improvement to
100% on-time deliveries (Murman, 2002). The Delta IV launch vehicle was able to
reduce floor space from four million square feet to 108,900 square feet, a reduction of
97.3%, as well as the reduction from twenty crane moves to four (Murman, 2002). These
are just examples of a long list of substantial improvements seen in the aerospace
industry through the use of lean principles and lean improvement tools.
6.2 Lean Principles
In Lean Thinking, Womack and Jones define lean thinking as “a way to specify
value, line up value-creating actions in the best sequence, conduct these activities without
interruption whenever someone requests them, and perform them more and more
effectively.” It follows from this that there are five key principles vital to lean thinking,
these are: specify value, identify the value stream, make value flow, organize customer
pull, and pursue perfection. These principles are expected to be addressed in order, with

Value Stream Mapping
74
each one building on the one before it, as shown in Figure 6-1. Within this framework of
lean principles, this research will concentrate on the identification of the value stream and
the identification of the value adding actions.
Value Value Stream PullFlow Perfection
Figure 6-1 Steps of Lean Thinking (Womack, 1996)
Specify Value - Value is expressed in terms of a specific product or service, delivered
at a specific price at a specific time, which meets the needs defined by the customer.
Identify the Value Stream – Value stream is a look at the entire door-to-door
perspective of a production, from raw materials to product delivery. It includes the
determination of all actions necessary to produce a product, and the separation of these
necessary activities from the identified non-value added steps. This includes, not only the
physical transformation of the product from raw materials, but also the information
system necessary to produce the right quantity at the right time.
Flow – Once waste has been eliminated, ‘flow’ can be accomplished. Flow, the opposite
of batch production, requires the movement of products from one value-creating step to
the next with no waiting or scrap.
Pull - The production of only what the customer wants when the customer wants it.
Instead of pushing products from raw materials to the customer, information travels
upstream from the customer signaling production only when a need is shown.
Perfection – This step is a reminder that there is no end to reducing waste. Continuous
improvement of a system is vital to perfection, where waste is constantly being
eliminated.
It is necessary to understand that lean is not a specific control tool, improvement
tool, floor layout, or principle. It is the methodology or framework that focuses on the
ideas of value, waste, and meeting customer demand. From this, it is clear why value
stream mapping came about as a way of determining where the value and waste are
located and aiding in the reduction of lead-time to help make the right product at the right
time.

Value Stream Mapping
75
6.3 Value Stream Mapping
Identifying the value stream, the second principle in lean thinking, includes a study
of the entire production process and separation of value added from non-value added
process steps. This can be accomplished through the use of value stream mapping, a
simplification tool, where a highly complex real system can be represented in a simpler
two-dimensional format. Value stream mapping is the process of compiling all actions
that go into the design, order and production of a product into a door-to-door diagram
from which a future vision can be created, through the implementation of lean concepts
such as flow and pull.
VSM allows the separation of actions into three categories: (1) value added, (2)
non-value added but necessary, and (3) non-value added. The non-value added actions
should be addressed first and be eliminated. It should be possible to complete this step in
a short span of time under current operating procedures. This is followed by elimination
of those non-value added but necessary steps, which may require considerable
restructuring of the system.
Rother and Shook’s Learning to See, which devised value stream mapping in its
present form, recommends that value stream mapping be done in three phases; current
value stream, future value stream, and determination of an implementation plan. In many
cases, value stream mapping is done in a workshop type atmosphere which brings
together engineering, manufacturing control, machinists, and maintenance personnel,
where the current state, future state, and implementation plan are all created during a
three to five day period. This format brings together all of those people affected by
changes to the system. It achieves a method for obtaining their collective buy-in for the
changes, a sense of ownership of the improvements, and an increased team camaraderie
for all involved.
6.3.1 Current State
A current value stream map, seen in Figure 6-2, is read from left to right with the
first production step being placed in the bottom left corner and shipping usually in the
bottom right corner. In the top left corner the supplier can be found, and the top right is
the customer. The bottom of the chart is reserved for production steps, and the top for

Value Stream Mapping
76
information flow between the company, the individual production steps, the customer,
and the supplier.
Learning to See states that the current value stream should be made as a snapshot
of current findings and include such information as inventory levels, total lead-time,
machine uptime, and machine reliability. Table 6-1 shows the typical metrics included
for a specific process box on a value stream map. A current value stream map allows
someone to see the flow of the entire production process from supplier to customer,
something many people within the process do not know. People then understand how
their job or function affects the critical path operation. Through the use of the common
symbols, a common language is available to understand the situation. Supplier Customer
Start Production
Ship to Customer
Production Figure 6-2 Current Value Stream Map (Rother, 1999)
Metric Description Cycle Time Time required to complete a process Changeover Time Time required to change a process from one product to another Uptime Percentage of time station is processing parts Available Time Amount of time machines and employees are free to work
Batch Size Number of same part that goes through a process step at one time
Yield Percentage of good parts produced in a process Table 6-1 Typical Value Stream Metrics (Millard, 2001)

Value Stream Mapping
77
6.3.2 Future State
After a current value stream is made, the next phase is a future value stream.
Using the principles of lean manufacturing and a set of important questions vital to lean
manufacturing, supplied by Learning to See, a future state is drawn. These eight
questions, which can be seen below, should be answered in the following order for a
system perspective.
Questions seen in Learning to See:
1. What is the takt time?
2. Will we ship directly to the customer, or to a finished goods warehouse?
3. Where can we use continuous flow?
4. Where will we need supermarket pull systems?
5. Where will our pacemaker be?
6. How will we level the production mix at the pacemaker?
7. What increments of work will you consistently release and take away at
pacemaker?
8. What process improvements will we need to achieve our future state design?
It should be noted that these questions link to the ideas of flow and pull mentioned in
the lean principles, and shows how making a value stream map is vital to determining
where you can improve your processes. Figure 6-3 shows a future state that has been
developed using the principles of lean. A pull system from shipping has been
implemented through the use of kanban cards and supermarkets. The welding steps and
assembly steps have been combined for a continuous flow cell. Through these identified
improvements, there is a change in lead-time from 23.5 days to 4.5 days in this example.

Value Stream Mapping
78
Figure 6-3 Future Value Stream Map (Rother, 1999)
6.3.3 Implementation Plan
The final step of value stream mapping is creating an Implementation Plan to help
achieve the future state from the current state. Learning to See suggests the use of a
value stream plan worksheet and a review worksheet (Rother, 1999).
It is recommended that follow up meetings, once every week to two weeks, are
necessary to continue to update and make progress on the implementation plan. This
regular meeting format stresses the importance of the initial value stream mapping event
and the actions that were identified. Making people accountable for certain action items
will also help speed along the process.
6.3.4 Value Stream Mapping at Heidelberg
A value stream mapping exercise was performed at Heidelberg to obtain a better
understanding of where the currently discussed cell fits into the bigger production system
and as verification for the needed changes. In hindsight, such a map should have been
made in advance of discussion of any changes.
The value stream workshop was run to improve the lead-time of the pork chop
family throughout the entire plant. The pork chop was chosen because it is a high

Value Stream Mapping
79
volume product family, with a large number of steps and a large lead time. The workshop
found many opportunities for improvement of the system including improvement in the
supplier delivery of castings. It also suggested the elimination of unnecessary machining
steps where the value added could be moved to an already necessary machining step,
therefore eliminating the necessary queuing time and machinist setup time associated
with having two steps.
Within the entire flow of the product, the cell adds a great deal to the lead time
because the parts do not only come to the cell once, but on complex parts many come
through the cell multiple times. Therefore, any inventory savings or cycle time reduction
for the cell would have a large impact on the system, showing that this was indeed the
step to be concentrated on.
Within the cell, the important opportunities include reduction in prove out time to
allow for smaller batch sizes, reduction in manual deburr to free up the operator, review
of the programs in order to eliminate the Non-Conformance Documents, and
improvement in the reliability to eliminate inventory. Each of these areas consumes a
different amount of time depending on the job and the program. Methods of improving
prove out time have been discussed above and include determination of part families to
help improve the quality of the programs and to allow for standards.
6.3.5 Summary of VSM
As has been shown, the value stream mapping tool includes not only a
standardization of symbols and mapping technique but is famous for its format of
production of a current state, future state, and implementation plan through the answering
of eight fundamental questions. It is, therefore, necessary to acknowledge that other
symbolic representations are used and can accomplish the same fundamental objectives.
Such tools as process flow diagrams (Galloway, 1994) have been used in the same format
for comparable improvements. It is advisable to pick the mapping technique, which
meets the attributes most important to the system. Refer to “Value Stream Analysis and
Mapping for Product Development” (Millard, 2001) for a comparison of process flow
mapping with value stream mapping. From observation it is also seen that companies
Value Stream Mapping
80
will create their own version, which combines only their necessary attributes, and refer to
it as value stream mapping.
6.4 Summary
The main principles of lean manufacturing have been reviewed. It has been seen
that it is from these five main lean principles that value stream mapping was developed.
Value stream mapping plays an important role in developing a system wide look at the
problem and determining ways of eliminating waste. The steps to creating a value stream
map have also been discussed in order to understand the tool in-depth. Our analysis on
its appropriateness in the aerospace industry is discussed in the next chapter.
6.5 Problem Statement
Value stream mapping is a common design tool used in the manufacturing industry
to redesign systems. It helps to bring together different expertise and creativity, and
allows easy identification of system goals. The purpose of the current project will be to
study a cross section of those using value stream mapping in their companies and
compare and contrast the success of the methods used. Certain questions will be
addressed including:
Is there an environment in which value stream mapping is more appropriate or
less appropriate?
How do you measure the success of value stream mapping?
What are the limitations of value stream mapping?
References Black, J T. The Design of the Factory with a Future. New York: McGraw-Hill,1991. Chase, James. “Value Creation in the Product Development Process.” Masters Thesis. MIT. Cambridge, 2001. Cochran, David S. Design and Control of Manufacturing Systems Lecture Notes. MIT. Cambridge, 2000. Galloway, Dianne. Mapping Work Processes. Milwaukee: ASQC Quality Press, 1994.

Value Stream Mapping
81
Hopp, Wallace J. and Mark L. Spearman. Factory Physics: Foundations of Manufacturing Management. Boston: Irwin, 1996. Lean Enterprise Institute. Seventh Annual Lean Manufacturing Conference: A 21st Century Look at Lean Manufacturing. Detroit. May 2001. Lewis, Paul, Guy Norris, and Graham Warwick. "Manufacturing Technology: Building to Win." Flight International. July 25-31, 2000. Millard, Richard. “Value Stream Analysis and Mapping for Product Development.” Masters Thesis. MIT. Cambridge, 2001. Murman, Earll et al. Lean Enterprise Value. New York: Palgrave Publishers Ltd., 2002. Rother, Mike and John Shook. Training to See: A Value Stream Mapping Workshop Participant Guide. Brookline, MA: Lean Enterprise Institute, 2000. Rother, Mike and John Shook. Learning To See: Value Stream Mapping to Add Value and Eliminate Muda. Brookline, MA: Lean Enterprise Institute, 1999. Spear, Steven and H. Kent Bowen. “Decoding the DNA of the Toyota Production System” Harvard Business Review. September-October 1999. Womack, James P. and Daniel T. Jones. Lean Thinking: Banish Waste and Create Wealth in Your Corporation. New York: Simon & Schuster, 1996. Womack, James P., Daniel T. Jones, and Daniel Roos. The Machine that Changed the World: The Story of Lean Production. New York: Harper Perennial, 1990.

Value Stream Mapping
82
Chapter 7 Value Stream Mapping Environment The purpose of this research is to determine how to increase the success of a value
stream mapping event. The goal of this section is to develop an understanding of what
some of the factors are that affect VSM and help to determine if these can be used to
improve the tool’s success. This chapter will first explore the proposed characteristics
and their expected affect on value stream mapping. These hypotheses will then be tested
using a survey. The insights obtained will be used to design a value stream matrix, which
can be utilized by companies to consider the appropriateness of VSM in a production
area.
7.1 Hypothesis & Purpose
The effectiveness of a value stream mapping event has certain necessary
preconditions or factors. This chapter will explore possible factors that might affect the
success of value stream mapping.
It is believed that the set of factors can be determined from the system design
inputs developed by LAI. In a previous LAI study, ten inputs to manufacturing system
design were determined, seen in Table 7-1 (Fernandes, 2001). These are the major
factors used when considering what type of system to put in place. Currently, such a
determination of system type is usually made through trial and error or through
experience. This list, though not exhaustive, identifies those main factors that are
believed to directly affect system design. It is proposed that from this list a reduced set of
factors that affect value stream mapping can be identified and it can be understood how
these factors interact to increase the success of VSM.
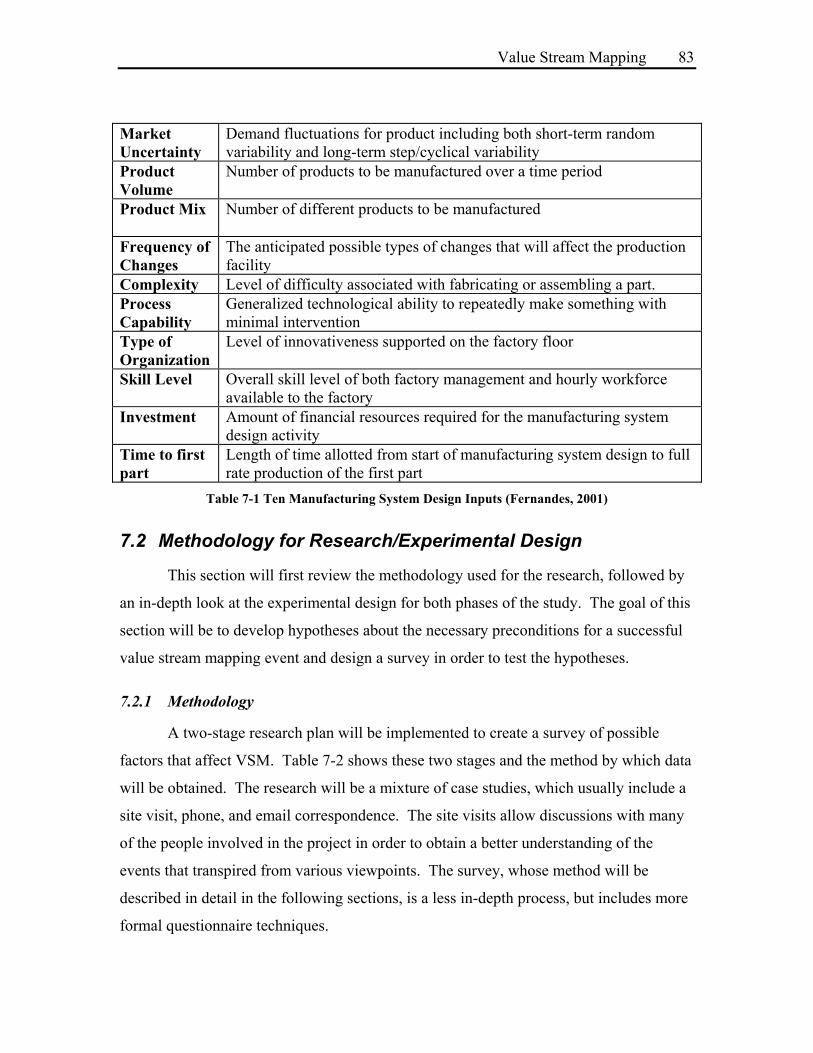
Value Stream Mapping
83
Market Uncertainty
Demand fluctuations for product including both short-term random variability and long-term step/cyclical variability
Product Volume
Number of products to be manufactured over a time period
Product Mix Number of different products to be manufactured
Frequency of Changes
The anticipated possible types of changes that will affect the production facility
Complexity Level of difficulty associated with fabricating or assembling a part. Process Capability
Generalized technological ability to repeatedly make something with minimal intervention
Type of Organization
Level of innovativeness supported on the factory floor
Skill Level Overall skill level of both factory management and hourly workforce available to the factory
Investment Amount of financial resources required for the manufacturing system design activity
Time to first part
Length of time allotted from start of manufacturing system design to full rate production of the first part
Table 7-1 Ten Manufacturing System Design Inputs (Fernandes, 2001)
7.2 Methodology for Research/Experimental Design
This section will first review the methodology used for the research, followed by
an in-depth look at the experimental design for both phases of the study. The goal of this
section will be to develop hypotheses about the necessary preconditions for a successful
value stream mapping event and design a survey in order to test the hypotheses.
7.2.1 Methodology
A two-stage research plan will be implemented to create a survey of possible
factors that affect VSM. Table 7-2 shows these two stages and the method by which data
will be obtained. The research will be a mixture of case studies, which usually include a
site visit, phone, and email correspondence. The site visits allow discussions with many
of the people involved in the project in order to obtain a better understanding of the
events that transpired from various viewpoints. The survey, whose method will be
described in detail in the following sections, is a less in-depth process, but includes more
formal questionnaire techniques.

Value Stream Mapping
84
Goal Methodology Stage 1 Determine reduced factor list Case Studies Stage 2 Develop relationship between factors Survey
Table 7-2 Research Methodology for VSM
7.2.2 Develop Hypotheses
Multiple case studies were performed to discuss specific value stream mapping
events. The format was informal, made up of interviews, which centered on the maps
themselves. The attempt was to acquire a relatively large array of different information,
since the specific factors that affect the mapping had not yet been determined. This
included questions on goals, methodology, and failures of the VSM process. The major
question areas are listed in Table 7-3. At each case study a facilitator and at least one
participant in the event was interviewed. Four main case studies were performed with
information acquired from additional site facilitators.
Area Primary Interview Questions
Goals of Mapping Event
• What are the goals for the VSM event (map production)?
• Why was the exercise of making the map initiated?
Procedural Tasks/ Methodology
• Describe the format of your VSM event?
• What background was necessary when organizing the VSM event?
• Were there multiple maps produced in this product area before?
Success • What is your definition of success? For the workshop? For the map
• What factors do you think affected the success of this VSM event?
Failure of VSM • In which decisions is VSM lacking from giving you complete advice?
• How have you modified VSM from its original version in Learning to See?
Additional Tools • What other tools are used or visualizations are needed in making decisions?
Table 7-3 Question for Stage 1 of VSM Research
The interviews performed led to a reduction in the inputs to only those that are
believed to affect value stream mapping. It was found that the methodologies used in
multiple companies were similar in content and organization to those in Learning to See
(Rother and Shook, 1999). Major modifications have not been seen in the methodology
used for VSM in order to improve its success. Since the essential VSM tool had not been
modified, there must be other environmental factors, which can have an influence on the

Value Stream Mapping
85
success. It was found from the interviews performed that the part chosen to be mapped
had a big effect on the types of improvements identified. With products that were simple
the recommendations were usually lower cost improvements. The complex product
recommendations were usually higher cost and required longer time spans in order to
make the proposed changes. In the complex products the solutions seen were within the
sublevels, or process boxes of the map and didn’t address the interactions between
process boxes. It was identified at all case studies that buy-in from management is
important to improvement. The idea of motivation was also identified and was believed
to be linked to the support of management.
Figure 7-1 shows the hypothesized simplification of the ten inputs to the five
considered vital to the implementation of value stream mapping. The importance of
motivation and support of the organization identified through the case studies directly
correlates to the factors of organization and investment. The difference in identified
improvement opportunities between complex products and simple products can be
explained through the factors of product complexity and process capability.
Further explanation of some of the concepts in Figure 7-1 is required. Market
uncertainty and frequency of changes relate to value stream map obsoleteness, which is
included in “representative part”. Product volume and mix relate to the discussion of
which part, within a chosen area, should be value stream mapped in order identify
important issues occurring in the chosen area. System process capability, the ability to
produce a part in a repetitive fashion, indirectly includes skill level because worker
ability can affect a system’s yield and cycle time variation. Time to first part, has been
eliminated from this analysis because in many cases value stream mapping is being
performed on current systems, not for initial system design, which is where that input
comes into play.

Value Stream Mapping
86
5 Environmental Factors Used in This Study
Representative Complexity Capability Organization Investment
Market Uncertainty
Product Volume
Product Mix
Frequency of Changes
Complexity
Process Capability
Type of Organization
Skill Level
Investment
10 F
acto
rs U
sed
to D
eter
min
e M
anuf
actu
ring
Syst
em D
esig
n (F
erna
ndes
, 20
01)
Time to First Part
Figure 7-1 Simplification of Ten Inputs for VSM Environment
Using the identified factors it is now important to determine how they affect the
success of a VSM event. The definitions and hypotheses that were created for each of the
chosen characteristics are located below. These hypotheses will be tested through the use
of a survey.
Ability to pick a representative part
A representative part is one that has similar process steps to the majority of the products
that go through the system and deals with similar issues (transportation, information
exchange, dispatching, etc.) as the majority of the parts. The category also includes the
time to obsolescence of the map due to product or process changes.
• If the map does not represent the problems of the area then it will solve the
wrong problems.

Value Stream Mapping
87
In some cases there are many different part types that go through an area. If the part
chosen has a considerably different production sequence from all others that go through
the area, or is not a considerably high volume part, then improvements in its processes
will not significantly affect the system as a whole. In selecting a part to value stream
map is it necessary to pick one that deals with the appropriate issues of the majority of
the parts with the most common steps. It is also necessary to be sensitive to the lifetime
of your value stream map in reference to the life cycle of the current status of a product.
Product Complexity
Level of difficulty associated with production of a part. Usually measured by estimation
of total production man-hours and difficulty of necessary tasks to perform including
serial and parallel processing.
• Less differentiation between value added and non-value added can be seen
on the value stream map with increased product complexity.
In producing a door-to-door value stream map for a product that has a high level of
complexity, each box represents a larger portion of manufacturing process than one with
a low level of complexity. In the case of assembling a door to a car, a map can be made
of the entire car assembly, which shows door assembly as a value added process box. If a
map is made of only the door assembly step, sub processes will be shown on the map.
These sub-processes include testing, bolting, and tightening. A map made of a complex
product causes only representation at a level too simple to differentiate value added from
non-value added, it is necessary to go into more detail to allow more information to be
seen.
System Capability
Generalized technological ability to repeatedly assemble something with minimal
intervention and minimal disruptions (scrap, rework, shortages).
• If the steps are unreliable there will be no ability to use continuous flow.
One of the main purposes of value stream mapping is reduction of lead-time by
elimination of inventory between steps and, wherever possible, using the ideas of
continuous flow (Question 3 of the VSM questions Chapter 6). If the processes

Value Stream Mapping
88
themselves are not reliable, including variable processing time or production of scrap, it
is not possible to eliminate all inventory (and make continuous flow) as it is necessary to
first make the system run smoothly. Therefore, the full benefits of value stream mapping
to aid in combining steps cannot be seen; instead much of the time will be spent on
improving reliability of individual steps and trying to eliminate the waste within them. In
this case activities, such as a “kaizen blitz” (Pyzdek, 2000), should be much more
effective at addressing improvement to the individual process steps than VSM. These
improvement methods allow a more detailed study of the process steps, which are usually
not detailed in a value stream map.
This observation, that reliability is a prerequisite for continuous flow, agrees with
Monden’s theories (Monden, 1998) and the Manufacturing System Design
Decomposition (Cochran, 2000). Monden’s relationship between goals and subgoals,
Figure 7-2, shows how the elements and improvement tools of lean interact to support the
implementation of the high-level goals. An upward flow of activities shows the order in
which they are to be completed. It can be seen that cutting inventory, which is required
for continuous flow is not an initial step, but requires a tremendous amount of
prerequisite improvements. The Manufacturing System Design Decomposition
(Cochran, 2000) separates the requirements of system design into six main parameters,
which are to be addressed in order: process quality, identifying and resolving problems,
predictable output, delay reduction, cost and investment. It can be seen from this list, that
in order to improve delay reductions (lead time) it is necessary to first improve quality
and disruptions, which are the main types of variability. This may lead to the assumption
that VSM should not be the first step in all improvement exercises, as variability in
processing steps must first be eliminated before continuous flow can be achieved.

Value Stream Mapping
89
Figure 7-2 How Costs, Quantity, Quality, and Humanity are Improved by the Toyota Production
System (Monden, 1998)
Type of Organization & Investment
Level of innovativeness (change) supported on the factory floor.
Availability of money and labor to make change.
• Even with a good map, without the availability of money, labor, and
leadership to support the change no implementation will occur.
Even in circumstances of identification of innovative improvements, an implementation
of them cannot occur if a barrier of leadership involvement and lack of financial
involvement of the company occurs. A good map, or reasonable map is one that includes
improvements that can be done in the time frame chosen.
7.2.3 Survey Organization
It is necessary to determine the relationships of those factors identified through
the case study. It is the goal of this research to use these five factors and correlate them
with value stream mapping success. It is proposed that a possible use for this information
is to create a matrix (Figure 7-3). The matrix takes the form of an advice tool where a
company can determine at which level they meet each of the characteristics and it can

Value Stream Mapping
90
help them to determine how well VSM fits their needs. It is envisioned that under each
of the five characteristics, there is a description of levels at which each characteristic can
be met. A company should be able, under each, to determine where the product being
discussed fits and this will lead to a level of success that can be reached with VSM.
Figure 7-3 VSM Matrix
Success
Before performing a survey to test the relationships it is necessary to determine
the possible levels of success to which value stream mapping should be correlated. In
order to determine the affects of these hypotheses on VSM, it is necessary to develop the
possible hierarchical levels of success that can occur from a value stream mapping event.
In many cases, the objective of running a value stream mapping event is to design a
future state system and to implement the designed system. This is the most common
reason to use value stream mapping, to make a change. In some cases while attempting
to implement these changes the company finds they have implemented some isolated
pieces of the identified improvements, but that no performance improvement can be seen
by the customer.
There are other possible outcomes of running a value stream mapping event. In
some cases, value stream mapping is a simplistic way of introducing new lean principles
to a company. This knowledge can be used in later designs or in other areas, but does not
lead to immediate improvement in this area. Figure 7-4 shows a hierarchy of proposed
success levels, from the lowest (learning only) to the highest (performance
improvement). These five levels will be used to measure the success of the VSM
exercise.

Value Stream Mapping
91
Make change that impacts performance of the system
No issues surfaced
(learn about lean)
High Low
Record known improvement opportunities
Identifying improvement opportunities
Implement various
isolated pieces of lean
Figure 7-4 Hierarchy of success
A survey was administered to attempt to correlate the hypotheses above with
success of a value stream mapping exercise. The survey was created directly from the
factors and theories already discussed. The questions, which are separated by
environmental factors, are shown in Table 7-4. The survey is located in Appendix D. All
of the questions were based on a five-point scale, where a five is assumed to be the best
agreement between the factor and value stream mapping. Included after each question in
the table the five point and one point answers have been indicated. In scoring the survey
the questions were weighted equally so that each of the five environmental characteristics
was ranked on a separate, but equal, five point scale. Those surveyed included
facilitators and participants and were identified through company points of contact. The
survey was placed on the web and allowed anonymous responses.
Identified Factor Number of Survey Questions Representative 1. Choose which of the following best describes the products that go through
the area depicted in the map: (all products/only the one mapped) 2. Which of the following statements describes the area mapped in the value stream event, assuming no process improvements have been initiated: (will never change/processes will change next week)
Complexity 3.The average number of tasks within a process box in the value stream is? (10 steps or less/too many to count) 4. Would you classify the process boxes as having: (serial/parallel processes)
Capability 5. Disruptions (scrap, rework, shortages, etc) throughout the value stream mapped area: (never happen/are a fact of life) 6. For the product mapped in the value stream: (variation in cycle time is negligible/impossible to predict)
Type of Organization
7. Please pick which of the following best explains the environment in which your VSM event was run: (leaders foster improvement/check box exercise)
Investment 8. Please pick which of the following best explains the environment in which the VSM event was run: money and labor are (in abundance/impossible to get)
Success 9. Please pick which of the following best describes your experiences while implementing improvements towards the future state: (an improvement was seen in the performance of the customer /did not surface any issues)
Table 7-4 Value Stream Mapping Survey Questions

Value Stream Mapping
92
7.3 Results
The following section will present the results of the survey through graphs
generated by data comparison. This will include trends seen in the data through addition
of factors and will compare different factors. The data was combined using multiple
techniques but addition was found to be the most indicative because it allowed no single
factor to outweigh the others. The results of the survey were discussed with selected
participants to clarify any questions related to the survey.
7.3.1 Main results
The following section will review the results obtained through the survey
described in the last section. Figure 7-5 shows a trend between the addition of the
environmental factors and the success of value stream mapping event. A score of twenty-
five is the highest possible total environmental factors score, showing an activity that
would be most appropriate for VSM. The highest success score is a five, correlated with
making changes that can be seen by the customer. Each hypothesis cannot be verified
individually using this survey method, but the trends shown in this section verify the
combined effect of the hypotheses. There is a correlation between the sum of the
environmental factors and the success of the VSM event. Table 7-5 describes the
circumstances of points located in the Figure 7-5 in order to give more insight into the
information within the graph.
∑=
=5
1iieristictalCharactEnviornmenTotal

Value Stream Mapping
93
0
1
2
3
4
5
6
0 5 10 15 20 25
Total Enviornmental Characteristic Score
Succ
ess
ABCE D
FGH
I
J
Figure 7-5 Comparison of Environmental Characteristics to Success
Case Description A Shown to use the tool repeatedly on the same area demonstrating the
continuous value in the tool and proving its appropriateness in this situation. B Event was performed on a simple part where value was easily differentiated,
and combination of stations for more continuous flow was possible. C Improvements identified included elimination of unnecessary steps like extra
crane moves. VSM was done at a level where value added could be differentiated, but the area was not mature enough for continuous flow.
D Event was able to identify improvements including reduction of testing and inspection. The improvements have taken a longer time frame than anticipated due to the changing of priorities by the company.
E The changes can all be considered low hanging fruit. In this case standardized procedures did not exist and the VSM helped to identify them.
F In order to make a dramatic reduction in cycle time a large investment was necessary but it was not received.
G The activity did enumerate improvement opportunities, but impact on the bottom line did not occur because of the loss of budgetary funds.
H Due to high motivation the activity was relatively successful even though the product was very complex.
I This event was subjected to a change in organizational requirements and vision for lean. The change shifted priority away from the VSM event.
J The event was run on a product that was too complex to see value added and non-value added. The event was also run as a check the box type of activity.
Table 7-5 Description of Cases from Figure 7-5
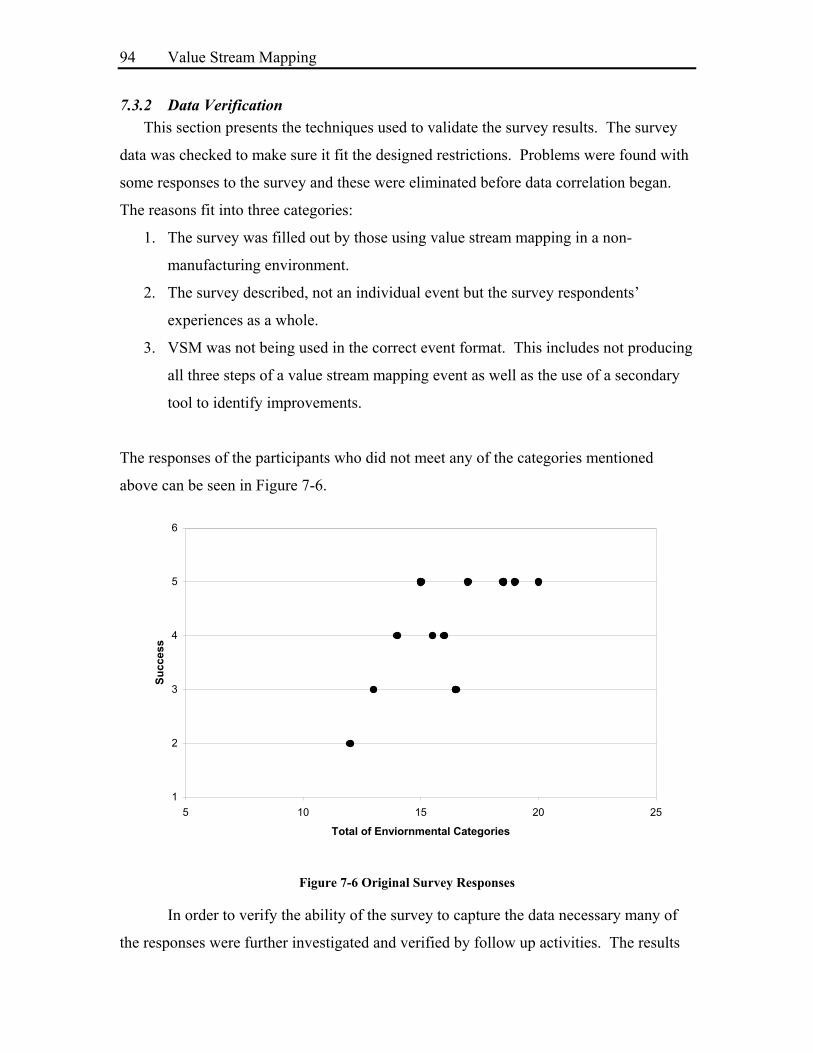
Value Stream Mapping
94
7.3.2 Data Verification This section presents the techniques used to validate the survey results. The survey
data was checked to make sure it fit the designed restrictions. Problems were found with
some responses to the survey and these were eliminated before data correlation began.
The reasons fit into three categories:
1. The survey was filled out by those using value stream mapping in a non-
manufacturing environment.
2. The survey described, not an individual event but the survey respondents’
experiences as a whole.
3. VSM was not being used in the correct event format. This includes not producing
all three steps of a value stream mapping event as well as the use of a secondary
tool to identify improvements.
The responses of the participants who did not meet any of the categories mentioned
above can be seen in Figure 7-6.
1
2
3
4
5
6
5 10 15 20 25
Total of Enviornmental Categories
Succ
ess
Figure 7-6 Original Survey Responses
In order to verify the ability of the survey to capture the data necessary many of
the responses were further investigated and verified by follow up activities. The results

Value Stream Mapping
95
were slightly modified by the survey respondent and the author after a discussion of the
event. Figure 7-7 shows the original and new placement of the verified points. It can be
seen that the majority of them moved to the right, giving them a better score than
originally. One point did change success level. This movement was because the changes
recorded in the VSM event had been suggested before VSM and they had not notated that
in the results. This disparity is differentiated between a success level of two and three.
The main reason survey cases improved in total score (moved to the right) had to
do with the representative part category, which was misunderstood by most survey
participants. This category attempts to capture how representative the product chosen
was for the entire mapped area. It was seen that in almost all surveys recorded, the area
mapped was a good representation, but the grasping and ranking of this category seemed
difficult for survey participants, perhaps the question was not clearly stated in the survey.
Other cases also included misrepresentations of capability and organization. There were
no trends in these misrepresentations.
0
1
2
3
4
5
6
0 5 10 15 20 25
Total
Succ
ess Old
New
Figure 7-7 Comparison of Surveys to Discussions
Figure 7-7 shows the change in results after follow up surveys. Because we believe that
this data more accurately represents our original intention, it will be used for all analysis.
This chart was shown in Figure 7-5.
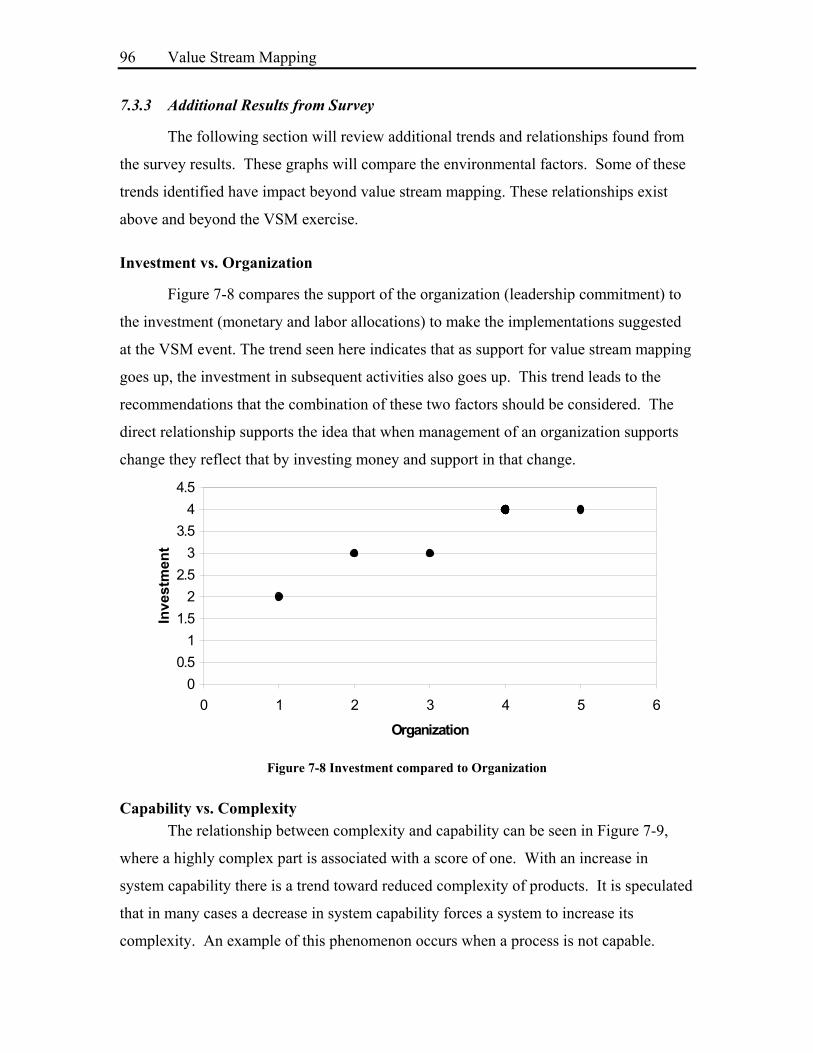
Value Stream Mapping
96
7.3.3 Additional Results from Survey
The following section will review additional trends and relationships found from
the survey results. These graphs will compare the environmental factors. Some of these
trends identified have impact beyond value stream mapping. These relationships exist
above and beyond the VSM exercise.
Investment vs. Organization
Figure 7-8 compares the support of the organization (leadership commitment) to
the investment (monetary and labor allocations) to make the implementations suggested
at the VSM event. The trend seen here indicates that as support for value stream mapping
goes up, the investment in subsequent activities also goes up. This trend leads to the
recommendations that the combination of these two factors should be considered. The
direct relationship supports the idea that when management of an organization supports
change they reflect that by investing money and support in that change.
00.5
11.5
22.5
33.5
44.5
0 1 2 3 4 5 6
Organization
Inve
stm
ent
Figure 7-8 Investment compared to Organization
Capability vs. Complexity The relationship between complexity and capability can be seen in Figure 7-9,
where a highly complex part is associated with a score of one. With an increase in
system capability there is a trend toward reduced complexity of products. It is speculated
that in many cases a decrease in system capability forces a system to increase its
complexity. An example of this phenomenon occurs when a process is not capable.

Value Stream Mapping
97
Correcting this might lead to testing, or checking, or even the addition of more assembled
parts to improve the quality. This increases the assembly complexity in order to
guarantee reduced overall defects. Because of this relationship perhaps one of these
factors is a predictor for the other.
00.5
11.5
22.5
33.5
44.5
0 1 2 3 4 5 6
Reduced Complexity
Cap
abili
ty
Figure 7-9 Complexity versus Capability
Reduced Set of Factors
Figure 7-9 and Figure 7-11 suggests a possible reduced set of factors, which can
be used to predict the success of VSM. This suggests that we should see a correlation
between one characteristic from the first set discussed (organization and investment) and
one characteristic from the second set (capability and complexity). The two more
sensitive factors were chosen and graphed against success. Figure 7-10 shows the
relationship and verifies that their combination is a predictor for success.

Value Stream Mapping
98
0
1
2
3
4
5
6
0 2 4 6 8 10
Organization + Complexity
Succ
ess
Figure 7-10 Comparison of reduced set of Characteristics and Success
Factor Combinations
Figure 7-11 shows the relationship between the sum of score of the three product
and process categories (ability to pick a representative part, product complexity, and
process capability) and the sum of the score of the organization categories (type of
organization and investment). There is no trend shown in the diagram. This supports the
hypothesis that the two sets of characteristics are independent of each other and both
categories must be included as predictors of the success of value stream mapping.

Value Stream Mapping
99
0
1
2
3
4
5
6
7
8
9
10
0 2 4 6 8 10 12 14
Sum of first three categories (representative, complexity, capability)
Sum
of i
nves
tmen
t and
org
aniz
atio
n
Figure 7-11 Product and Process Characteristics versus Organizational Characteristics
7.4 Proposed Value Stream Mapping Worksheet
From the survey respondents and the case studies many lessons were learned
about how the characteristics affect the success of value stream mapping. Each factor
plays a different role in the process between current state map production, future state
map production and implementation. This relationship will be explored in this section.
From this verification of the relationship between the factors and success, an advice
matrix has also been created which will be presented within this section.
7.4.1 Implementation
In Figure 7-12, the proposed affect of each factor on the VSM process is shown.
It is not necessary, in order to have a positive outcome from VSM, that all five factors are
met. For companies who want to use VSM as an exercise to learn about lean principles
or the flow of their product it might only be necessary to produce current and future state
maps. Production of the current state and future state make up the value stream mapping
event noted in the figure. The successful use of VSM in this case is only affected by the

Value Stream Mapping
100
first three characteristics noted. If, in order to evaluate the project as a success, you must
implement change, then it is necessary to include the last two factors in your evaluation.
Current
State
Future State
ImplementationCOMPLEXITY
CAPABILITY
ORGANIZATION
INVESTMENT
REPRESENTATIVE
Event
Figure 7-12 The Effect of Environment Characteristics on Implementation
It is hypothesized that complexity and capability affect the ability to draw a future
state map from a current state. The ability to pick the appropriate representative parts
affects whether this event identifies the correct opportunities for success. This is why
“representative” is shown on the box that encircles the current state and the future state.
These three factors affect the making of a map that identifies new improvements. Once
the map is made, and the event is complete, it can be shown that without the support of
the organization and the investment necessary for change, there is no ability to implement
it. This format, which is also shown graphically in Figure 7-12, supports the observations
seen in the case studies. It is interesting to note that the three characteristics that affect
the event can be considered physical product/process characteristics while the two
characteristics that affect the success of the implementation are people oriented choices
which are, therefore, more controllable by those attempting to use value stream mapping.
7.4.2 Value Stream Matrix
The matrix proposed is shown in Table 7-6 and can be used to determine the
appropriateness of a VSM event. Using the five environmental characteristics, and the
insights discussed about each, a company can rank itself and determine what factors need
improvement in order to make value stream mapping more successful or to determine for
what purpose it can be run. The matrix should be filled out in reference to an individual
VSM event.

Value Stream Mapping
101
The matrix is designed in a similar format as Figure 7-12 with the first three
columns associated with the value stream mapping event, the next two with the ability to
implement change, and the last one shows the correlation between these factors and the
success expected for value stream mapping, from recording already known improvement
opportunities to making a measurable change. An environmental characteristic score can
be developed from the matrix to determine whether value stream mapping will be a
valuable tool. This matrix describes similar criteria to those addressed in the survey and
is organized in a proposed format that can be used by those determining improvement
opportunities.

Value Stream Mapping
102
Pick a Representative Part1
Product Complexity
System Capability
Type of Organization
Investment Success7
All products go through the process depicted and the process drawn will not be changed2
Tasks per process box is 10 steps or less and all processes are serial4
Disruptions6
almost never happen and variation in cycle time of a process box is negligible.
Senior leaders reinforce transition and foster improvement throughout the VSM.
Money and labor are in abundance
1 An improvement was seen in the performance of the mapped area
The majority of the products go through the process depicted and they will not change before improvements can be made (1year)
Tasks per process box is greater than 10 steps and most processes are serial
Disruptions are low enough not to impede flow and variation does not impact flow
The organization promotes changes and improvements
Money, and labor are available but limited
2 Improvements were made using additional projects, but not enough were initiated to see an improvement
Half the products go through the process depicted and the process drawn might change in less than a year.
Tasks per process box is greater than 100 and the processes are a mixture of serial and parallel
Occasionally disruptions force out of sequence work and variation in cycle time impacts flow
Level of commitment among management is variable
Money and labor can be made available but an extensive justification process exists
3 The event helped to recognize new opportunities but no implementation occurred
A few of the products go through the process depicted and the process drawn might change in the next few months
Tasks per process box is greater than 1000 and most processes are parallel5
Disruptions and variation in cycle time are barriers to continuous flow
VSM was initiated by upper management with no lower management support, or visa versa
Money and labor are hard to come by even if justified
4 The event was a good way to record improvements that have already been suggested
Only the product mapped goes through the process shown and the processes drawn might change next week, making the map obsolete.3
Tasks per process box is too many to count and all processes are parallel
Disruptions are a fact of life and cycle time of a process box is nearly impossible to predict
The VSM event was perceived as a check the box exercise
Money and labor are impossible to get
5 The VSM event did not help surface any issues
Table 7-6 VSM Matrix
1Ability to pick a Representative Part- within the products that go through the mapped area 2Assuming no process improvements are initiated 3Assumes multiple products go through the area, if only one product goes through assume answer of all. 4Serial- only one task is occurring on the product at one time 5Parallel- multiple items of the product are being worked on at one time 6Disruptions – scrap, rework, shortages 7Improvements are seen in reference to the customer
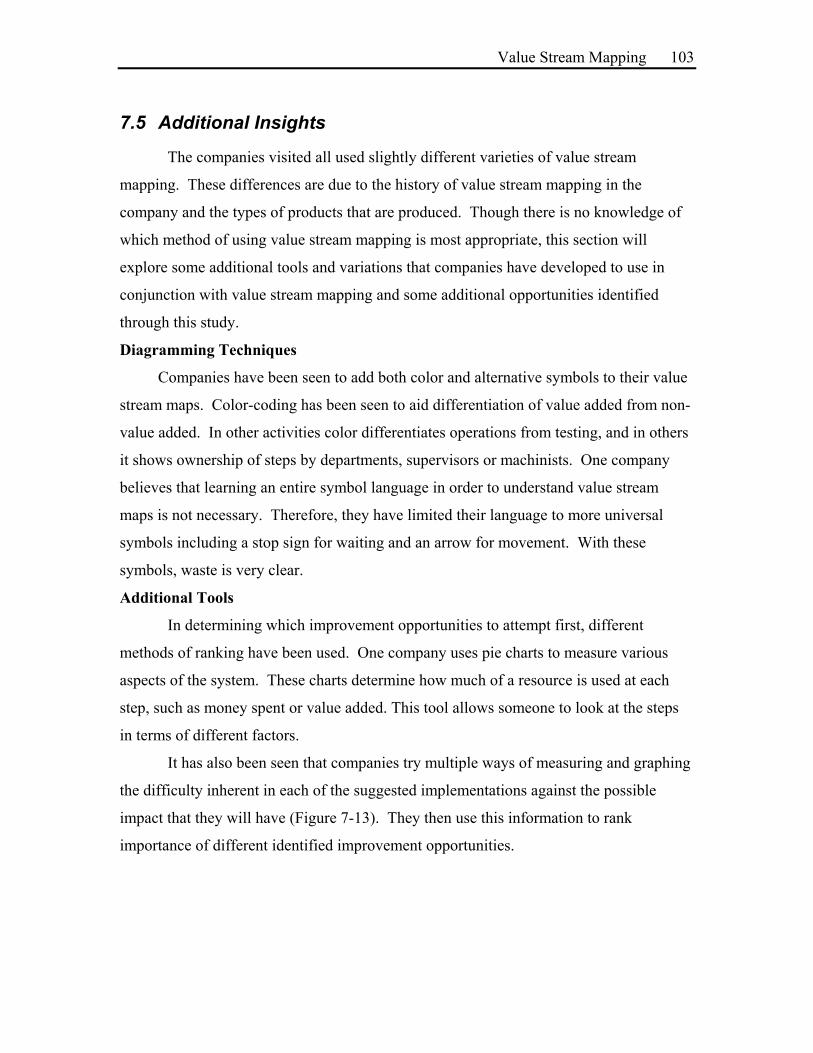
Value Stream Mapping
103
7.5 Additional Insights
The companies visited all used slightly different varieties of value stream
mapping. These differences are due to the history of value stream mapping in the
company and the types of products that are produced. Though there is no knowledge of
which method of using value stream mapping is most appropriate, this section will
explore some additional tools and variations that companies have developed to use in
conjunction with value stream mapping and some additional opportunities identified
through this study.
Diagramming Techniques
Companies have been seen to add both color and alternative symbols to their value
stream maps. Color-coding has been seen to aid differentiation of value added from non-
value added. In other activities color differentiates operations from testing, and in others
it shows ownership of steps by departments, supervisors or machinists. One company
believes that learning an entire symbol language in order to understand value stream
maps is not necessary. Therefore, they have limited their language to more universal
symbols including a stop sign for waiting and an arrow for movement. With these
symbols, waste is very clear.
Additional Tools
In determining which improvement opportunities to attempt first, different
methods of ranking have been used. One company uses pie charts to measure various
aspects of the system. These charts determine how much of a resource is used at each
step, such as money spent or value added. This tool allows someone to look at the steps
in terms of different factors.
It has also been seen that companies try multiple ways of measuring and graphing
the difficulty inherent in each of the suggested implementations against the possible
impact that they will have (Figure 7-13). They then use this information to rank
importance of different identified improvement opportunities.
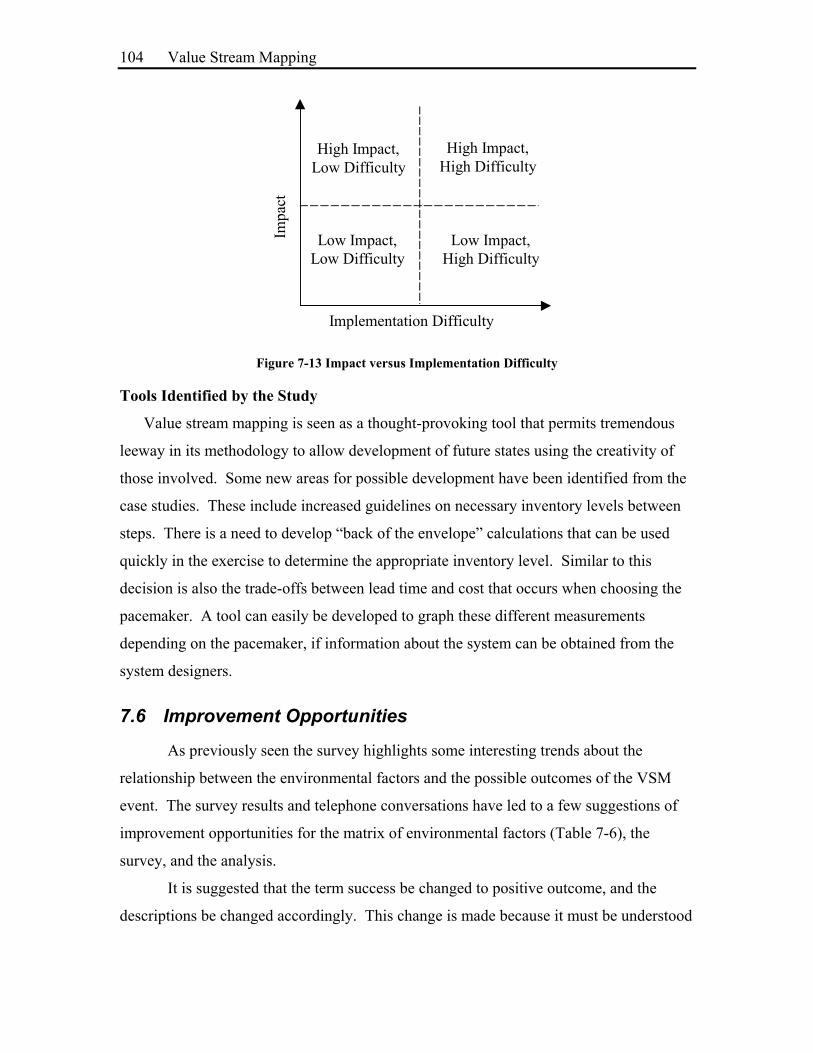
Value Stream Mapping
104
Implementation Difficulty
Impa
ct
High Impact, High Difficulty
Low Impact, High Difficulty
High Impact, Low Difficulty
Low Impact, Low Difficulty
Figure 7-13 Impact versus Implementation Difficulty
Tools Identified by the Study
Value stream mapping is seen as a thought-provoking tool that permits tremendous
leeway in its methodology to allow development of future states using the creativity of
those involved. Some new areas for possible development have been identified from the
case studies. These include increased guidelines on necessary inventory levels between
steps. There is a need to develop “back of the envelope” calculations that can be used
quickly in the exercise to determine the appropriate inventory level. Similar to this
decision is also the trade-offs between lead time and cost that occurs when choosing the
pacemaker. A tool can easily be developed to graph these different measurements
depending on the pacemaker, if information about the system can be obtained from the
system designers.
7.6 Improvement Opportunities
As previously seen the survey highlights some interesting trends about the
relationship between the environmental factors and the possible outcomes of the VSM
event. The survey results and telephone conversations have led to a few suggestions of
improvement opportunities for the matrix of environmental factors (Table 7-6), the
survey, and the analysis.
It is suggested that the term success be changed to positive outcome, and the
descriptions be changed accordingly. This change is made because it must be understood
Value Stream Mapping
105
that if the goal of the workshop is to learn about lean principles then this can be the
positive outcome of the exercise. Implementation must not always be the goal.
There are more dimensions to the idea of a positive outcome, or success than just
whether it occurs. It is recommended to find a way to represent the time it takes to fix the
system and include that in success. It is necessary in acquiring data to acquire
information on success from multiple angles; it is therefore recommended that the section
in the survey to measure the outcomes of the event be expanded to include additional
questions.
Many circumstances can make VSM a beneficial activity. In future studies it is
recommended that separation occur between those in low hanging fruit cases from those
in more mature situations. This is recommended, since it is believed that VSM can be
beneficial for low hanging fruit situations at a different environmental score value than
with mature situations.
Many companies do not use VSM alone, making it difficult to measure the
benefits of VSM in the context of other improvement tools and activities. There is a need
to devise a way of separating them in order to measure the effects of only VSM.
References Cochran, David S., Jorge F. Arinez, Jamer W. Duda, Joachim Linck. “Decomposition Approach for Manufacturing System Design.” A Collection of Papers Published by Professor David S. Cochran. MIT. September 2000. Fernandes, Pradeep. “A Framework for a Strategy Driven Manufacturing System Design in an Aerospace Environment - Design Beyond Factory Floor.” Masters Thesis. MIT. Cambridge, 2001. Monden, Yasuhiro. Toyota Production System: An Integrated Approach to Just-In-Time, Norcross, GA: Engineering and Management Press, 1998. Pyzdek, Thomas. The Six Sigma Handbook: A Complete Guide for Greenbelts, Blackbelts, and Managers at all levels. New York: McGraw Hill, 2000. Rother, Mike and John Shook. Learning To See: Value Stream Mapping to Add Value and Eliminate Muda. Brookline, MA: Lean Enterprise Institute, 1999.
Value Stream Mapping
106
PART TWO CONCLUSION:
IMPLEMENTATION IN YOUR COMPANY PART TWO CONCLUSION
Value stream mapping is being widely used within companies to make
improvements to existing facilities. Through a survey of those using VSM it has been
seen that it is being used as a way of organizing and determining improvement
opportunities. It was not observed that the tool is being used in the designing of
manufacturing systems. The tool is also very popular for use in understanding current
systems. Companies like to use it as a discussion point, and the determination of where
they are now. Many are then using other tools to develop future improvements. This
validates the placement of the tool within the implementation and modification loops on
the Manufacturing System Framework described in Chapter 3.
The study performed here showed a relationship between the five identified
environmental factors and the success of the value stream mapping event. It is, therefore,
recommended that before performing a value stream mapping event the company should
consider what its goals, objectives, and necessary positive outcome for the event are, in
order to ensure success. The company should then use the tool to identify the
appropriateness of value stream mapping in consideration of its and determine if another
tool would be more appropriate.
The survey results showed other interesting general lessons addressing the
fundamental relationships between environmental factors. The correlated relationships
shown test the need for the individual inputs, both in the VSM factors, and in the
introduced 10 inputs to a manufacturing system. This shows the need for more work on
these factors and their relationships to better understand their effects on manufacturing
system design.
In many companies value stream mapping is seen as a tool that can be used in all
circumstances. The study performed exhibited proof that value stream mapping is not
successful everywhere and, therefore, its appropriateness must be considered in advance
of performing a value stream mapping event.
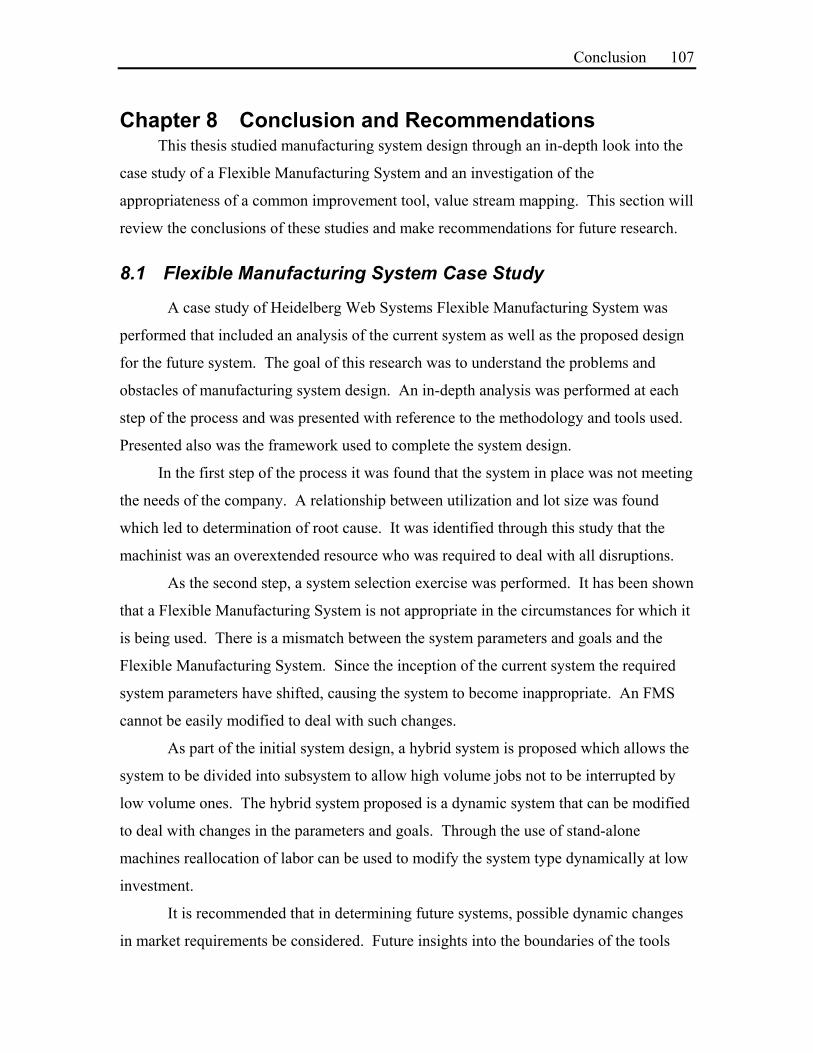
Conclusion
107
Chapter 8 Conclusion and Recommendations This thesis studied manufacturing system design through an in-depth look into the
case study of a Flexible Manufacturing System and an investigation of the
appropriateness of a common improvement tool, value stream mapping. This section will
review the conclusions of these studies and make recommendations for future research.
8.1 Flexible Manufacturing System Case Study
A case study of Heidelberg Web Systems Flexible Manufacturing System was
performed that included an analysis of the current system as well as the proposed design
for the future system. The goal of this research was to understand the problems and
obstacles of manufacturing system design. An in-depth analysis was performed at each
step of the process and was presented with reference to the methodology and tools used.
Presented also was the framework used to complete the system design.
In the first step of the process it was found that the system in place was not meeting
the needs of the company. A relationship between utilization and lot size was found
which led to determination of root cause. It was identified through this study that the
machinist was an overextended resource who was required to deal with all disruptions.
As the second step, a system selection exercise was performed. It has been shown
that a Flexible Manufacturing System is not appropriate in the circumstances for which it
is being used. There is a mismatch between the system parameters and goals and the
Flexible Manufacturing System. Since the inception of the current system the required
system parameters have shifted, causing the system to become inappropriate. An FMS
cannot be easily modified to deal with such changes.
As part of the initial system design, a hybrid system is proposed which allows the
system to be divided into subsystem to allow high volume jobs not to be interrupted by
low volume ones. The hybrid system proposed is a dynamic system that can be modified
to deal with changes in the parameters and goals. Through the use of stand-alone
machines reallocation of labor can be used to modify the system type dynamically at low
investment.
It is recommended that in determining future systems, possible dynamic changes
in market requirements be considered. Future insights into the boundaries of the tools

Conclusion
108
used in system design is necessary through future case studies. The limitations of
Miltenburg’s methodology are not known and would be considered valuable research.
8.2 Value Stream Mapping
Value stream mapping is being used in many different circumstances including
manufacturing environments (fabrication and assembly) and other areas of business
(product development, procurement, and purchasing). Value stream mapping is a simple
to learn mapping tool that has helped many to identify possible opportunities that could
not be seen without the door-to-door perspective it allows. Although the tool has been
shown to improve some systems considerably, it has also been seen to fail to reach
implementation in others.
It was hypothesized that certain preconditions affect the success of a value stream
mapping event. The environmental factors identified in this document, derived from case
studies and confirmed through the use of a survey, are a valuable methodology for
evaluating the appropriateness of value stream mapping for a specific area. It has been
verified that success is correlated with the addition of: ability to pick a representative
part, product complexity, system capability, type of organization, and investment. The
results were presented in an advice matrix form, which can be used to determine the
appropriateness of VSM in a production area.
It is recommended that additional work be done in this area of study to verify and
expand the knowledge acquired here. This study was performed to show a possible trend.
Now that this trend has been established, it is necessary to do a more in-depth analysis to
guarantee that additional categories have not been overlooked and to better understand
the pattern that occurred.
It has been seen that VSM, like many other tools, is being used in many situations
for which it is not fully appropriate. In general there is no understanding of what tools
are appropriate in what circumstances. Therefore, it is believed that the type of analysis
performed here should be done for additional tools. Guidance on the limitations and uses
of improvement tools is required in order to increase success of the improvement
opportunities. The method of organizing the tool’s appropriateness around the ten system
design inputs has been shown to be valuable in this study. Another methodology, which

Conclusion
109
has been successful, is to organize different improvement tools around different types of
waste that can be present in the system. This methodology has been used in the supply
chain improvement efforts. It was seen to be valuable in identifying the appropriate uses
of different improvement tools and the needed for additional tools (Hines, 1997).
References Hines, Peter and Nick Rich. “The Seven Value Stream Mapping Tools.” International Journal of Operations and Production Management. 1997.
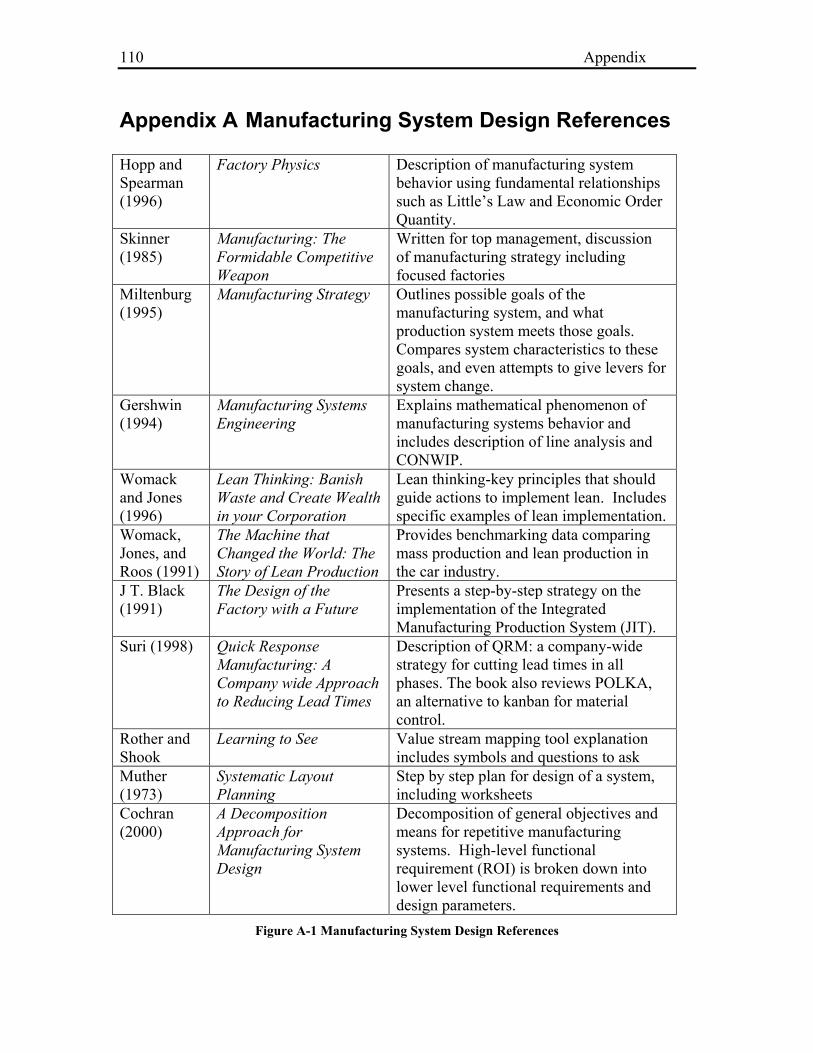
Appendix
110
Appendix A Manufacturing System Design References Hopp and Spearman (1996)
Factory Physics Description of manufacturing system behavior using fundamental relationships such as Little’s Law and Economic Order Quantity.
Skinner (1985)
Manufacturing: The Formidable Competitive Weapon
Written for top management, discussion of manufacturing strategy including focused factories
Miltenburg (1995)
Manufacturing Strategy Outlines possible goals of the manufacturing system, and what production system meets those goals. Compares system characteristics to these goals, and even attempts to give levers for system change.
Gershwin (1994)
Manufacturing Systems Engineering
Explains mathematical phenomenon of manufacturing systems behavior and includes description of line analysis and CONWIP.
Womack and Jones (1996)
Lean Thinking: Banish Waste and Create Wealth in your Corporation
Lean thinking-key principles that should guide actions to implement lean. Includes specific examples of lean implementation.
Womack, Jones, and Roos (1991)
The Machine that Changed the World: The Story of Lean Production
Provides benchmarking data comparing mass production and lean production in the car industry.
J T. Black (1991)
The Design of the Factory with a Future
Presents a step-by-step strategy on the implementation of the Integrated Manufacturing Production System (JIT).
Suri (1998) Quick Response Manufacturing: A Company wide Approach to Reducing Lead Times
Description of QRM: a company-wide strategy for cutting lead times in all phases. The book also reviews POLKA, an alternative to kanban for material control.
Rother and Shook
Learning to See Value stream mapping tool explanation includes symbols and questions to ask
Muther (1973)
Systematic Layout Planning
Step by step plan for design of a system, including worksheets
Cochran (2000)
A Decomposition Approach for Manufacturing System Design
Decomposition of general objectives and means for repetitive manufacturing systems. High-level functional requirement (ROI) is broken down into lower level functional requirements and design parameters.
Figure A-1 Manufacturing System Design References

Appendix
111
Appendix B Case Study Framework Description
Goals System SelectionCurrent Analysis Initial Design Imple Reeval
Regular Improvement System Design (Green Field)
System Redesign (Brown Field)
CH 5 CH 4
Figure B-1 Generalized Framework for System Design
Analysis of
Current System Goals System
Selection Initial Design
What triggered a study? (symptom)
What are the goals of the system?
Do the goals match the current system?
Determine structural and infrastructural elements.
What is the root cause of the symptom? (problem)
Does the current system match the system parameters?
Determine how each element can be designed to fit into the chosen system type.
Is this the bottleneck?
Comparison to others for benchmarking.
What are the tradeoffs of certain decisions?
Is the problem solvable without total system redesign?
Pick a system type.
Determine expected benefits and measurements.
Determine system parameters.
Determine how the system fits into its supplier and customer.
Table B-1 Framework Questions for System Design
B.1 Analysis of the Current System The goal of the first step of this methodology is to make sure all necessary
identification of mistakes, pitfalls and problems from the current system is transferred to
the design of a new system. It also compels the demonstration that a new system is
necessary. The questions below highlight some of the information, which is necessary to
obtain when reflecting on the current system. If the design effort has no preceding

Appendix
112
system that it is replacing, then this step can be skipped. To obtain answers to the
questions, it might be necessary to collect data on the system. A suggested multi-day
observation of the system is recommended as well as interviews with those who are in the
system daily.
What triggered a study? (symptom)
It might not be clear as to why the system redesign is being performed. In some
cases, a decline in performance is the reason. Try to pinpoint one reason why the study is
being conducted. This will help you to determine the goals of the future system. Do not
forget to ask those working in the system. In many cases, they can help to describe the
problematic occurrences in the system, and what influences them.
What is the root cause of the symptom? (problem) The problem cannot be fixed until it is determined why that problem is occurring.
In some cases, the answer may be easy, such as a communication issue, reliability of
machinery, or the missing of standardized work. But it may also be more complex, such
as a mismatch between the system parameters and the system put in place. Of course,
there may be multiple causes for each symptom. It might be necessary to do some data
collection or experimentation to fully discern the problem. Every problem should be
articulated using a few fundamental concepts because when the list is too extensive, a
simplified resolution will never be found.
Is this the bottleneck?
In some redesign efforts, considerable money and time are spent fixing an area
that has a considerable amount of waste or lead-time associated with it. Sometimes this
occurs because it was simpler to pinpoint the problem and the solution for one area, than
to determine its role in the entire product or program view. If cycle time reduction is the
enterprise level objective and the area you are focusing on is not on the critical path of
production, then your efforts are improperly focused. Such efforts may reduce cost of the
product, but, if it does not meet the competitive strategy, then that time has been misused
and could have been used in a process on the critical path of production.
One method for determining the appropriate areas for improvement is to use value
stream mapping to study the entire flow of the product. From the value stream map you
can compare the mismatch between the final production rate and the area you are

Appendix
113
studying. If the redesign of an area has not yet been identified, looking at the value
stream map will help to identify possible improvement areas, and to see their effects on
your company’s measurable quantities. If lead time is not your business objective, value
stream mapping may not be the appropriate tool to determine if the area chosen is the
bottleneck. Detailed guidance and evaluation of value stream mapping can be seen in
Chapters 6 and 7.
Is the problem solvable without total system redesign?
If the questions addressed above uncover improvements that can be made within
the current system structure and the performance of the system can be improved to within
acceptable measures for management, then those problems should be addressed without
the large investment of an entire system redesign. Such possible changes include
redistribution of other resources including people, and restructuring of parts into groups.
Determine system parameters and performance measures
In order to determine the appropriate type of system, it is necessary to acquire a
general set of system characteristics. Studying these factors will allow you to verify
reasons why the current system is not performing as required.
System parameters include: market conditions, product mix, product volume,
frequency of changes, product complexity, system process capability, type of
organization, and skill level. These include those external, or not under control of the
design, and internal, within control of the factory. (Fernandes, 2001)
Possible performance measures include machine utilization, machinist utilization,
lead-time, and system output. Performance measures are how the system will be
evaluated on its operation.
B.2 Goals – selection of criteria Determining the goals of the system help to crystallize what the needs and
competitive advantage of the manufacturing system are. The goals of the system will
impact the system selection part of the design.
What are the goals of the system?
The competitive goals of the system can be thought of as the system traits that are
provided for the customer (Miltenburg, 1995). Possible goals include: flexibility,
manageability, productivity, cost, delivery, innovativeness and quality. The goals

Appendix
114
directly correlate to the competitive advantage of the product. In a manufacturing
system, “some goals will be provided at higher levels than others because no single
production system can provide all outputs at the highest possible levels.” Therefore, it is
important to consider wisely the necessary system goals; and determine their importance.
(Miltenburg, 1995)
B.3 System Selection The main goal of system selection is to determine the type of production system
that is appropriate. The type of system chosen will determine those system goals that will
be provided at high levels. Possible system types include: job shop, continuous flow
shop, flexible manufacturing system, and just in time. As stated earlier, the system
parameters will play an important role in this step. Within the initial design step, it will
be very important to have chosen a correct system type, since that will be the basis for all
initial design decisions. As will be described, the system type will be chosen primarily to
meet the system goals, but must match system parameters as well. Miltenburg’s
Manufacturing Strategy Worksheet, seen in Chapter 3, can be used to accomplish this
step.
Do the goals match the current system?
Consider the type of system currently used, is it not performing well because it
was intended to deal with other types of goals? Literature exists to aid this comparison.
Miltenburg’s Manufacturing Strategy identifies how the manufacturing outputs (in our
terms goals) vary with system type. Each type of system is ranked on each goal and its
ability to meet that goal.
An example of such a situation occurs when putting a job shop in place if your
main goal is quick delivery. A job shop is known for being very flexible to new and
varying parts. But its system in many cases has large setup times associated with it and,
therefore, it generates a long delivery time.
Does the current system match the system parameters?
In some cases, the problem associated with production is that the current system
does not match the current system parameters. Many authors have included charts that
compare systems types to system parameters. The most common comparison is product
volume and mix. An example of this type of chart can be seen in J T. Black’s The

Appendix
115
Factory of the Future seen in Chapter 5. These charts are useful to help align your
manufacturing system with your system parameters.
Comparison to others for benchmarking
When possible, it can be very beneficial to test your hypothesis by visiting other
systems, either similar to your current or your future ideas. See what their system
parameters and system goals are and how their system is performing. Also, ask questions
about how they are managing the system. This should verify that your current system is
not performing as requested due to parameters outside of your control, and that the
redesign is necessary and will make improvements.
Pick a system type
As stated, the outcome of this step is a system type that best fits both your goals
and your system parameters. Also consider in this decision if there are any constraints
that will not allow you to chose the most optimal system type, such as timeline for
redesign and investment. Although you should not allow these, or any of the system
parameters, to limit your possibilities, they must be strongly considered when weighing
the risks of a radical change.
B.4 Initial Design It is now necessary to design the details of the system. These include specific
machine types, operator job descriptions and priorities, and possible effects on dispatch
and engineering. In designing a system, it is recommended that you determine the
possible elements of the system and distinguish between the structural and infrastructure
elements; this will help to guarantee that all aspects of the design are considered.
Within this step, different system types will warrant addressing different issues
and using different tools. General guidelines that can be used no matter what the design
is will be discussed to aid all manufacturing system designers.
Determine structural and infrastructural elements
The splitting of system design into two types of elements, structural and
infrastructural allows dealing with important issues in an organized framework. These
can be split in many ways, and should be divided in a manner, which makes the most
sense for the project at hand. It is necessary to check the completeness of your list, and
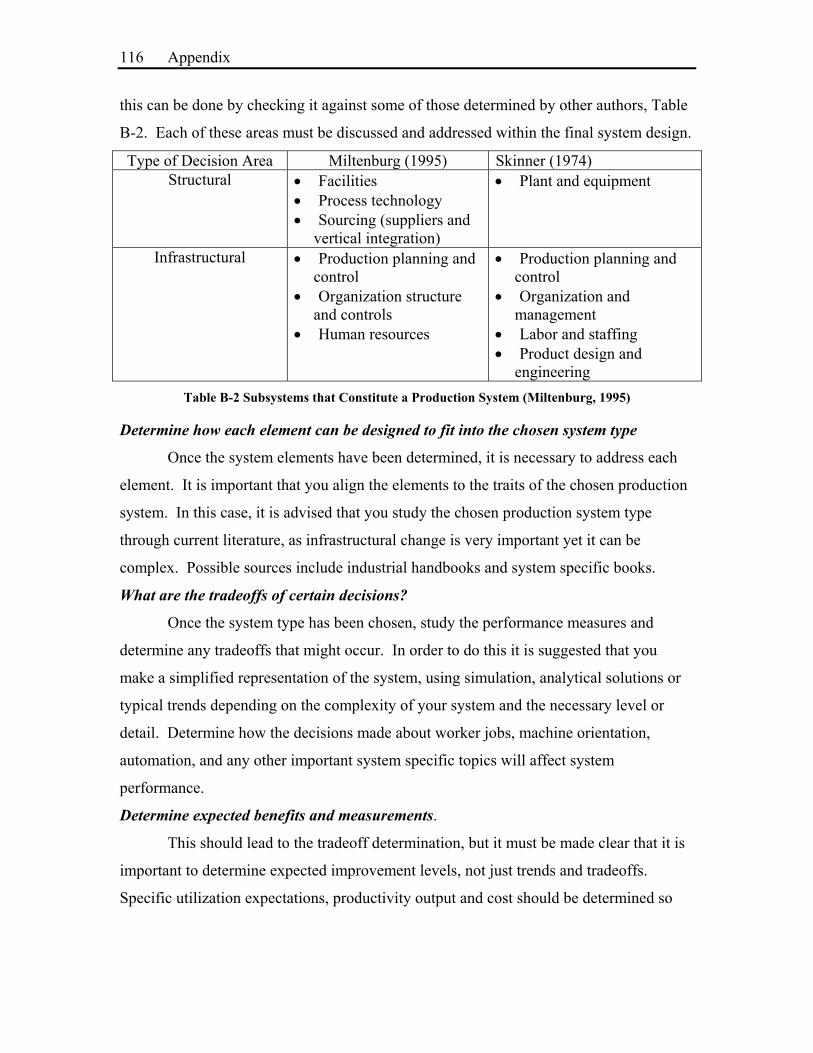
Appendix
116
this can be done by checking it against some of those determined by other authors, Table
B-2. Each of these areas must be discussed and addressed within the final system design.
Type of Decision Area Miltenburg (1995) Skinner (1974) Structural • Facilities
• Process technology • Sourcing (suppliers and
vertical integration)
• Plant and equipment
Infrastructural • Production planning and control
• Organization structure and controls
• Human resources
• Production planning and control
• Organization and management
• Labor and staffing • Product design and
engineering Table B-2 Subsystems that Constitute a Production System (Miltenburg, 1995)
Determine how each element can be designed to fit into the chosen system type
Once the system elements have been determined, it is necessary to address each
element. It is important that you align the elements to the traits of the chosen production
system. In this case, it is advised that you study the chosen production system type
through current literature, as infrastructural change is very important yet it can be
complex. Possible sources include industrial handbooks and system specific books.
What are the tradeoffs of certain decisions?
Once the system type has been chosen, study the performance measures and
determine any tradeoffs that might occur. In order to do this it is suggested that you
make a simplified representation of the system, using simulation, analytical solutions or
typical trends depending on the complexity of your system and the necessary level or
detail. Determine how the decisions made about worker jobs, machine orientation,
automation, and any other important system specific topics will affect system
performance.
Determine expected benefits and measurements.
This should lead to the tradeoff determination, but it must be made clear that it is
important to determine expected improvement levels, not just trends and tradeoffs.
Specific utilization expectations, productivity output and cost should be determined so

Appendix
117
that the system can be evaluated on its ability to improve the problems and make the
company more profitable within a specified time frame.
Determine how the system fits into its supplier and customer
Check flow and consistency of upstream and downstream processes to your system,
can you function in the current infrastructure? This includes operating on the current
information system. It is suggested that you consider studying this effect of the system
by shadowing the dispatcher if there is one, or spending some time at both the upstream
and downstream steps.

Appendix
118
Appendix C Simulation
C.1 Stochastic Model Parameters The distributions of the parameters described in Table 2 of Section 5.5.1 were
based on the experience of the author and were validated by historic data in Section 5.5.2.1.The chosen distribution functions were hypothesized using mathematical knowledge of the random occurrences they represent. It was seen, using a sensitivity test, that the chosen distribution function does not significantly affects the results of this model.
The charts below show the distributions and ranges chosen for all stochastic parameters. Table C-1 and Table C-2 show the distributions used in the first three models; the comparison to historic data, machine configuration, and part input models. Table C-3 and Table C-4 show the modifications to these parameters used in the fourth model which checks the sensitivity to stochastic parameters by modifying the setup and machine breakdowns by 50% both negatively and positively. Parameter Distribution Type Distribution Prove Out Negative Exponential
Setup Square
Part Change Triangular
Table C-1 Description of Model Parameter Distributions for Setup
70 Time (min)
5 10
Time (min)
10 25 40
Time (min)

Appendix
119
Parameter Distribution Type
MTBF (Mean Time Before Failure)
MTTR (Mean Time To Repair)
Maintenance Normal/ Negative Exponential
Tool Break Normal/
Normal
Probe Fault Normal/ Negative Exponential
Table C-2 Description of Model Parameters for Breakdowns
Parameter Increase Decrease Part Change triangular(mins(37.5),mins(22.5),
mins(52.5)) triangular(mins(12.5),mins(0), mins(27.5))
Setup uniform(mins(8.75),mins(13.75)) uniform(mins(1.25),mins(6.25)) Prove Out negexp(105) negexp(35)
Table C-3 50% Change in Setup Parameters
Parameter Increase Decrease Probe Fault normal(mins(150),mins(5)) normal(mins(50),mins(5)) Maintenance normal(hr(15),hr(4)) normal(hr(5),hr(4)) Tool Break normal(hr(12),hr(2)) normal(hr(4),hr(2))
Table C-4 50% Change in Maintenance Parameters (MTBF)
10Time (hr)
40 Time (min)
8 Time (hr)
15 Time (min)
100
Time (min) 3
Time (min)

Appendix
120
C.2 Configuration and Input Changes Table C- shows the recorded simulation data on machinist utilization (M) and
worker utilization (W) acquired for the four machinist configurations tested in Section
5.5.2. It also includes a comparison of these utilizations to those acquired for the
proposed data.
Current Data
Proposed Data
M1=53% Ws=57 M2=55 Wm=53 M3=37
M1=73% Ws=29 M2=73 Wm=35 M3=69
M1=61% Ws=47 M2=66 Wm=50
M1=80% Ws=22 M2=77 Wm=27
M1=56% Ws=46 M2=56 Wm=43
M1=77% Ws=23 M2=75 Wm=24
M1=47% W=76 M2=48
M1=73% W=44 M2=72
Table C-5 Simulation Data Generated from Configuration and Input Changes
4
3
2
1

Appendix
121
Appendix D Value Stream Mapping Survey
D.1 Survey Welcome! The following survey is part of a research project to evaluate appropriate conditions for performing value stream mapping. The results of the survey will be used to develop a decision matrix to evaluate the possible success of value stream mapping on an area. The survey should be filled out by someone who participated in a value stream mapping event (creation of current state, future state, and implementation plan) and has knowledge of the product characteristics and event results. If you have attended multiple value stream mapping events please fill the survey out individually for each event.
Before you continue with the survey please read the informed consent document and agree to its conditions.
Yes I agree: No I do not agree:
In case of multiple choice, pick answer that best fits the situation Background
Name (optional):
Company: If you are interested in a copy of the survey results being sent to you at the completion of the research
please leave your email address: Value Stream Mapping was performed on (please fill out the survey for only ONE event at a time):
When was this VSM event performed?
January 1996 What defines the beginning and end of the value stream (supplier and customer) as defined on your map?
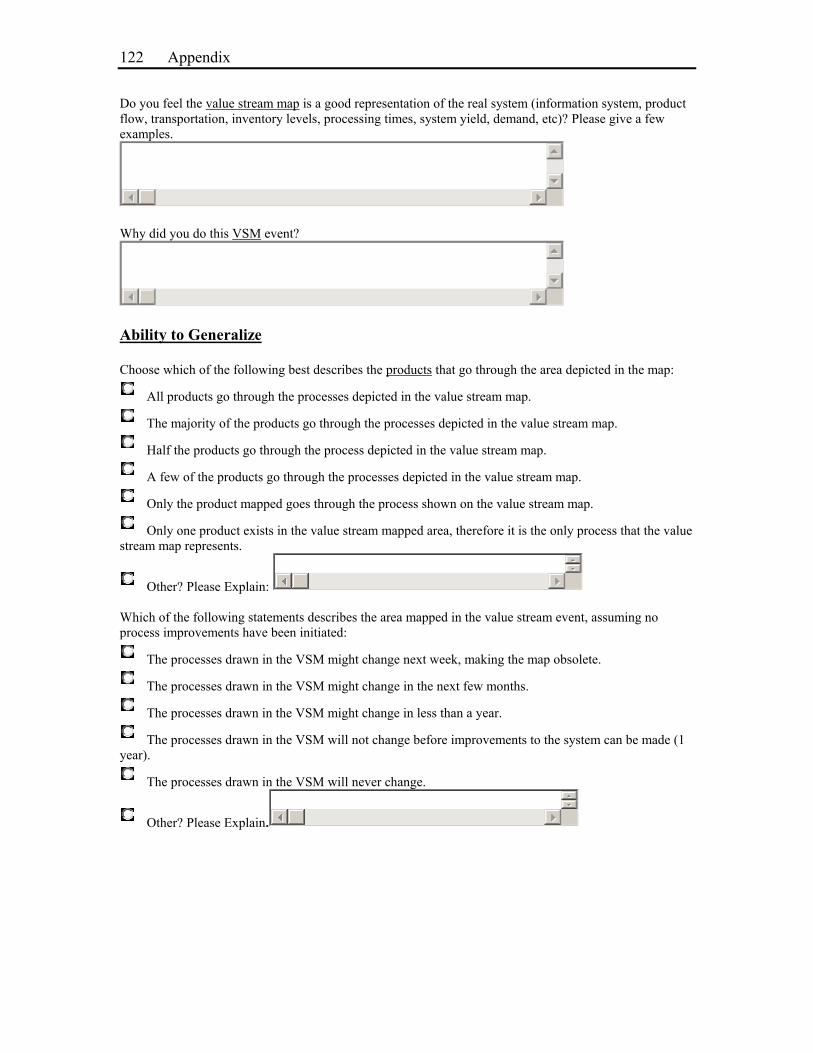
Appendix
122
Do you feel the value stream map is a good representation of the real system (information system, product flow, transportation, inventory levels, processing times, system yield, demand, etc)? Please give a few examples.
Why did you do this VSM event?
Ability to Generalize Choose which of the following best describes the products that go through the area depicted in the map:
All products go through the processes depicted in the value stream map.
The majority of the products go through the processes depicted in the value stream map.
Half the products go through the process depicted in the value stream map.
A few of the products go through the processes depicted in the value stream map.
Only the product mapped goes through the process shown on the value stream map.
Only one product exists in the value stream mapped area, therefore it is the only process that the value stream map represents.
Other? Please Explain: Which of the following statements describes the area mapped in the value stream event, assuming no process improvements have been initiated:
The processes drawn in the VSM might change next week, making the map obsolete.
The processes drawn in the VSM might change in the next few months.
The processes drawn in the VSM might change in less than a year.
The processes drawn in the VSM will not change before improvements to the system can be made (1 year).
The processes drawn in the VSM will never change.
Other? Please Explain.

Appendix
123
Map Characteristics The average number of tasks within a process box in the value stream is:
10 steps or less.
Greater than 10.
Greater than 100.
Greater than 1000.
Too many to count.
Other? Please explain: Would you classify the process boxes as having:
All serial processes where only one task is occurring on the product at one time.
Mostly serial processes where only one task is occurring on the product at one time.
A half and half mixture of serial and parallel process steps.
Mostly parallel processes where multiple items of the product are being worked on at one time.
All parallel processes where multiple items of the product are being worked on at one time.
Other? Please explain: System Characteristics Disruptions (scrap, rework, shortages, etc) throughout the value stream mapped area:
Almost never happen.
Are low enough not to impede flow.
Occasionally forces out of sequence activity.
Are a barrier to continuous flow.
Are a fact of life.
Other? Please Explain For the product mapped in the value stream:
The variation in cycle time of a process box is negligible.
The variation in cycle time of a process box exists but does not impact flow.
The variation in cycle time of a process box occasionally impacts flow.
The variation in cycle time of a process box is a barrier to continuous flow.

Appendix
124
The cycle time of a process box is nearly impossible to predict.
Other? Please Explain: Organization Please pick which of the following best explains the environment in which your VSM event was run:
The VSM event was perceived as a check the box exercise.
VSM was initiated by upper management with no lower management support, or VSM was initiated at lower management with no upper management support.
Level of commitment among management is variable.
The organization promotes changes and improvements.
Senior leaders reinforce transition and foster improvement throughout the VSM.
Other? Please Explain: Resources Please pick which of the following best explains the environment in which the VSM event was run:
Money and labor are in abundance.
Money and labor are available but limited.
Money and labor can be made available but an extensive justification process exists.
Money and labor are hard to come by even if justified.
Money and labor are impossible to get.
Other? Please Explain: Value Stream Mapping Impact Please pick which of the following best describes your experiences while implementing improvements towards the future state.
The VSM activity did not help surface any issues.
The VSM activity was a good way to record improvements that have already been suggested.
The VSM activity helped to recognize new improvement opportunities, but no implementation occurred.
Improvements were made using additional projects, but not enough projects were initiated so that the VSM customer could see an improvement.
An improvement was seen in the performance of the value stream mapped area customer.
Other? Please Explain:
Appendix
125
What do you think was the biggest factor that affected your success/failure? Was it something that was not mentioned above? Please explain.
General Comments
Thank you for taking the time to fill out the survey!
Submit
Please email [email protected] if there are any questions or problems.
D.2 Glossary Value Stream Mapping Event Allows the separation of actions into three categories: (1) value added, (2) non-value added but necessary, and (3) non-value added using a simplification mapping technique. VSM is defined as the process of making a (1) current state, (2) future state, and (3) implementation plan. Product Object produced in a value stream map for the defined customer. Process Box Action noted in the value stream map by a square box. Actions are usually separated by movement of material.
D.3 Informed Consent We would like to emphasize that participation in this research is completely voluntary. You are free to refuse to answer any question you are either uncomfortable with or uncertain about. You are also free to withdraw your participation at any time. We understand that you may have concerns about confidentiality. Several measures will be taken to ensure that your responses will remain confidential. All analysis of the data will be represented in the form of aggregated statistics. Excerpts from the individual results may be made part of the research results, but under no circumstances will your name or any identifying characteristics be included. Furthermore, no individual program will be identified in the analysis or reporting of the responses. We understand that the success of any research depends upon the quality of the information on which it is based, and we take seriously our responsibility to ensure that any information you entrust to us will be protected. For any additional information contact:
Researcher: Rhonda Salzman [email protected] Advisor: Tom Shields [email protected]
Lean Aerospace Initiative
MIT Room 41-205

Appendix
126
77 Massachusetts Ave. Cambridge, MA 02139 Phone: (617) 253-0308
Fax: 617-258-7845
Thank you for your participation in this research!