Fleet Performance Results Using Biodiesel … Performance Results Using Biodiesel. ... – 2000...
24
1 Fleet Performance Results Using Biodiesel Robb Barnitt National Renewable Energy Laboratory Golden, Colorado Clean Cities Coordinators Webcast March 24, 2007 U.S. Department of Energy Office of FreedomCAR and Vehicle Technologies NREL/PR-540-41830 March 2007
-
Upload
vuongduong -
Category
Documents
-
view
217 -
download
1
Transcript of Fleet Performance Results Using Biodiesel … Performance Results Using Biodiesel. ... – 2000...

1
Fleet Performance Results Using Biodiesel
Robb BarnittNational Renewable Energy Laboratory
Golden, Colorado
Clean Cities Coordinators WebcastMarch 24, 2007
U.S. Department of EnergyOffice of FreedomCAR and Vehicle Technologies
NREL/PR-540-41830March 2007

2
Agenda
1. Fleet Evaluation Team Background2. NREL Fleet Test Activities 3. RTD B20 Evaluation Results• Project objectives and approach• Mileage accumulation, fuel economy• Road calls and maintenance• Fuel and fuel filter analysis• Lube oil analysis• Chassis dynamometer emission results• Conclusions

3
B20 Fleet Evaluation Team• Early NBB requests of OEMs
– Warranty support for B20– All wanted more field data
• Major OEMs, industry experts, and stakeholders participate
• Biodiesel proponents: “No B20 issues in the field”
• OEMs: “Prove it with quantifiable data”• Active since 2003• Gather information about the B20 usage
experience• Now known as the Biodiesel Blend Evaluation
Team (BBET), with a focus on B20

4
B20 FET Team Members• Bosch• Case New Holland• Caterpillar• Cummins• DaimlerChrysler• Delphi Diesel Systems• Department of Defense• Engine Manufacturers
Association• Fleetguard• Ford Motor Co.
• General Motors• International• John Deere• National Biodiesel
Board• NREL• Parker - Racor• Siemens Diesel
Systems• Stanadyne Corp.• Volkswagen AG• Volvo Truck

5
NREL’s Fleet Test and Evaluation Team
• Focused on evaluating advanced technologies in medium and heavy vehicle applications
• Main goals:– Facilitate the transition of advanced technologies from
R&D to the marketplace– Provide potential users with accurate and unbiased
information on vehicle performance and costs• Fleet projects
– Denver Regional Transportation District (RTD) – United States Postal Service (USPS)– St. Louis Metro

6
B20 Fleet Evaluation – Objectives• Compare vehicles operating in the field on
B20 and conventional diesel over 24 months:– Engine performance– Fuel economy– Vehicle maintenance cost– Fuel-induced variations in operation
and maintenance– Lube oil performance– Emissions
• Exhibit high degree of experimental control in vehicle selection and duty cycle
• Aid engine OEMs in exploring effects of B20 on engine durability
• Aid potential B20 users in understanding costs, benefits, and differences in operation

7
B20 Fleet Evaluation – Approach• Nine mechanically identical Denver
RTD transit buses:– 2000 Orion V, Cummins ISM– Five operated on B20, four on diesel
• Dedicated to Skip Route in Boulderidentical duty cycle
• RTD submitted data electronically from their internal database– Fuel, labor, parts
• In-use fuel economy and maintenance costs analyzed by NREL
0
5
10
15
20
25
30
35
40
45
0 300 600 900 1200 1500
Time (seconds)
Spee
d (m
ph)
• Fuel delivery and vehicle tank sample analysis
• Periodic oil sampling at drain interval and analysis
• Two study buses emissions tested on chassis dyno at NREL’s ReFUEL facility

8
Mileage AccumulationRunning Average Monthly Miles Per Bus
3,800
3,900
4,000
4,100
4,200
4,300
4,400
4,500
Aug-04
Oct-04
Dec-04
Feb-05
Apr-05
Jun-05
Aug-05
Oct-05
Dec-05
Feb-06
Apr-06
Jun-06
Aug-06
Mile
s
Diesel Group B20 Group
• 4,200 miles per month per bus

9
On-Road Fuel Economy
• 4.41 mpg Diesel, 4.41 mpg B20

10
Maintenance Costs – Total
• 24-month average maintenance costs:– $0.54/mile diesel, $0.51/mile B20– Diesel transmission repairs drive difference

11
Maintenance Costs – Engine, Fuel System
• 24-month average engine and fuel system maintenance costs:– $0.05/mile diesel, $0.07/mile B20
May06: Failed injector, all 6 replacedJune06: Scheduled cylinder head change, all 6 injectors replaced (again)

12
Maintenance Costs – Engine, Fuel System
• Injector discrepancy driven by replacement of full set, then cylinder head replacement
• No reason to suspect B20 fuel currently– Cummins tear-down analysis of 6-injector set that failed
Diesel B20Fuel pump 2 1Fuel injector 1 13

13
Road Calls
• Average MBRCs are comparable– 3,197 Diesel, 3,632 B20

14
Fuel Analysis
• Biodiesel content of delivery samples scattered– Changes to fuel blending & sampling implemented May ‘05
• Vehicle samples taken are near B20• **Knowledge of sampling point is important**

15
Fuel Analysis• March 2006 vehicle fuel sample analysis
– Acid value, peroxides, aldehydes (alkanals) determined by Saftest
– Acid value and peroxides consistently low as compared to NREL B20 fuel quality survey
– Alkanals indicate some oxidative degradation, but are not high
VehicleNumber
B100 ContentVolume %
Acid ValuemgKOH/g
PeroxideSaftest™
ppm
AldehydeSaftest
mmol/mL
2207 20.3 <0.1 58.212
2208 18.4 <0.1 13.22 57.902
2209 17.4 <0.1 11.59 55.696
2210 18.7 <0.1 16.75 73.35
2211 19.7 <0.1 11.42 61.546

16
Fuel Analysis• Composite March 2006 vehicle fuel samples had more
detailed analysis– Higher cetane number– Lower sulfur content– 2.4% lower B20 energy content
AnalysisASTM
Method B20 Composite Diesel Composite
Water and sediment vol % D2709 0.01 0.01
Cloud point ºC D2500 -13 -14
Sulfur ppm D5453 324
D2622 272
Aromatics vol % D1319 25.6
Olefins vol % 1.3
Saturates vol % 73.1
C mass% D5291 84.7 86.6
H mass% 12.9 13.2
Derived cetane number D6890 51 48
LHV BTU/lb D240 17,860 18,307

17
B20 Fuel Filter PluggingThree filter plugging
events:1. April 2005 – Two buses
– Brown slime. Cold snap? – Biocide applied to next fuel
delivery
Bus%
BiodieselCFPP
ºCWater(ppm)
Bug Alert
18.4 (med)
2208 16.9 -25 77 27 (low)
2209 19.2 -25 88 57 (low)
2210 20.3 -25 971
(very low)
2211 15 -30 7893
(low-med)
Retention Time, min0 10 20 30 40 50
Tota
l Ion
Cur
rent
Diesel Hydrocarbons
FAME
Phytosterols
39 40 41 42 43 44 45
Cam
pest
erol
Stig
mas
tero
l Sito
ster
ol
Stig
mas
t-4-e
n-3-
one
• Filter residue analysis indicated presence of plant sterols

18
B20 Fuel Filter Plugging2. June 2005 – One bus
– B20 storage tank fuel level low
– Sediment plugged dispenser and fuel filters
– Fuel filter samples collected• Preliminary GC-MS results
indicate high levels of phytosterols
3. July 2006 – Two buses– B20 storage tank fuel level low (end of project)– Sediment plugged fuel filters (Soap?)– Fuel filter samples, fuel storage tank samples collected
• Preliminary GC-MS results indicate high levels of phytosterols

19
Lube Oil Analysis• One set of oil drain samples (March/April 2006) analyzed
by Cummins• Exponential decay of ZDDP and TBN consistent with
previous Cummins testing• No difference in ZDDP decay between diesel and B20
samples• TBN decay may be occurring more slowly in B20 samples

20
Lube Oil Analysis
Diesel B20Fuel Dilution Low LowerMetals (evaporative) No differenceMetals (engine wear) Low
Lower @ high mileage
Soot Low 50% lowerViscosity, Viscosity Index No difference

21
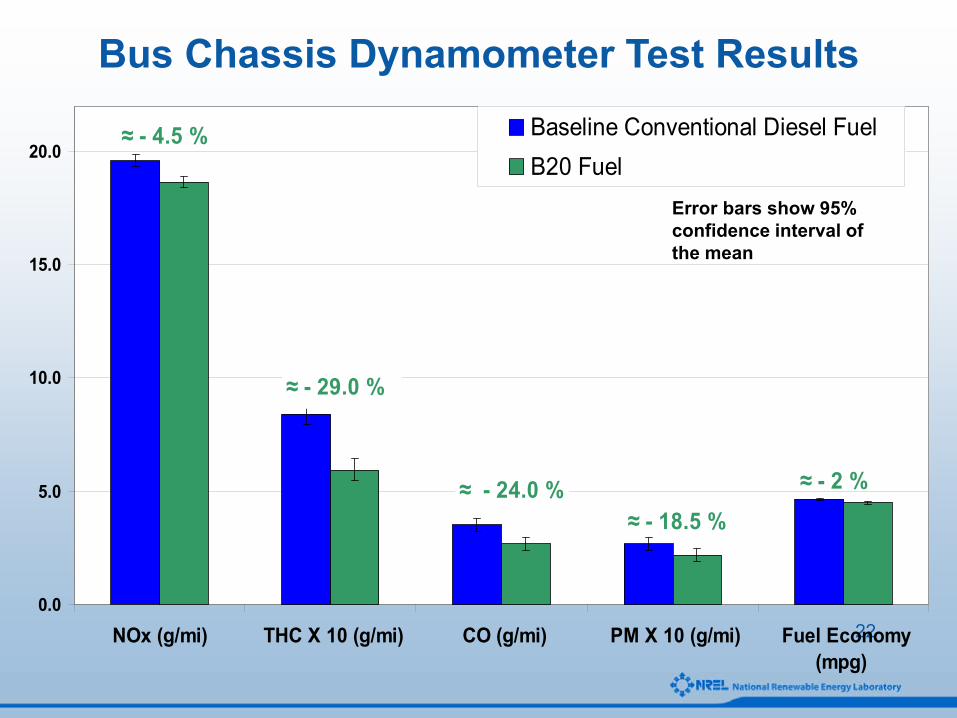
Bus Chassis Dynamometer Testing
• Two in-use buses tested• Cummins ISM 2000
engine – no EGR• In-use B20 vs. diesel fuel
0
5
10
15
20
25
30
35
40
45
0 300 600 900 1200 1500
Time (seconds)
Spee
d (m
ph)
Skip Bus Route CSHVC
Avg Speed 15.6 mph 14.2 mph
Max Speed 40 mph 44 mph
Stops/Mile 0.78 0.75
220.0
5.0
10.0
15.0
20.0
NOx (g/mi) THC X 10 (g/mi) CO (g/mi) PM X 10 (g/mi) Fuel Economy(mpg)
Baseline Conventional Diesel FuelB20 Fuel
≈ - 4.5 %
≈ - 24.0 %
≈ - 29.0 %
≈ - 2 %
≈ - 18.5 %
Bus Chassis Dynamometer Test Results
Error bars show 95% confidence interval of the mean

23
Conclusions• No significant difference between B20 and diesel
baseline:– On-road fuel economy– Reliability (road calls)– Total maintenance costs– Fuel System and engine maintenance costs
• Filter plugging issues – plant sterols one potential cause
• Early B20 splash-blending issues, generally B20 in tank
• Limited lube oil data suggests no harm with B20 use, some potential benefits
• Significant emissions reductions including NOx• SAE Paper 2006-01-3253

24
Information• SAE Paper 2006-01-3253 100,000-Mile Evaluation of
Transit Buses Operated on Biodiesel Blends (B20)– www.nrel.gov/vehiclesandfuels/npbf/pdfs/40128.pdf
• Contact information– Robb Barnitt
EngineerNational Renewable Energy LaboratoryGolden, [email protected]