Fleet Operations: Preventive Maintenance · preventive maintenance intervals are being adhered to...
38
CountyStat Fleet Operations: Preventive Maintenance June 2, 2009
Transcript of Fleet Operations: Preventive Maintenance · preventive maintenance intervals are being adhered to...

CountyStat
Fleet Operations: Preventive Maintenance
June 2, 2009

CountyStat2Fleet Preventive
Maintenance
6/2/2009
CountyStat Principles
Require Data Driven Performance
Promote Strategic Governance
Increase Government Transparency
Foster a Culture of Accountability

CountyStat3Fleet Preventive
Maintenance
6/2/2009
Agenda
Introductions and meeting purpose
Montgomery County performance
Improving performance for transit vehicles
Improving performance for administrative vehicles
Wrap-up

CountyStat4Fleet Preventive
Maintenance
6/2/2009
Meeting Goal
This meeting responds to the following items:
CountyStat follow-up item dated November 14, 2008: Analyze fleet
maintenance and replacement schedule options and costs to either
maximize mean distance between failure performance and/or minimize
turnaround time
One operational suggestion received by CountyStat: Monitor vehicle
maintenance, especially scheduling of light equipment
Establish strategies for preventive maintenance for transit, public
safety, and administrative vehicles to cost-effectively maximize
mean distance between failure and/or turnaround times.

CountyStat5Fleet Preventive
Maintenance
6/2/2009
Montgomery County Performance: FY08
Equipment ClassNumber of
Vehicles
Mean Distance
Between Failure
(miles)
Turnaround Time
(days)
Transit 469 2,707 6.9
Heavy Equipment 540 1,469 14.4
Public Safety Light
Equipment1,340 2,517 2.9
Administrative Light
Equipment757 1,943 3.4

CountyStat6Fleet Preventive
Maintenance
6/2/2009
Caveats to Data Shown in this Presentation
Vehicle mileage at the time of service is prone to error
– Data analysis filtered out these errors to the extent possible or found alternate
ways of making calculations to limit their effects
Determination of whether transit preventive maintenance occurred
on time or late is prone to error
– Next preventive maintenance should be scheduled 6,000 miles after the most
recent preventive maintenance
– 30% of the time, the next preventive maintenance mileage was something
other than 6,000 miles after the most recent
– It is possible that missed preventive maintenance is therefore underreported
Transit Light Equipment
% of maintenance work orders that
listed a vehicle mileage less than
the mileage at the previous visit
2.2% 1.7%
% of all vehicles affected 73% 11%

CountyStat7Fleet Preventive
Maintenance
6/2/2009
Caveats to Data Shown in this Presentation
Mean distance between failure did not show a relationship
with annual maintenance costs
– This result is suspect, since it is not likely that vehicles prone to failure
are just as expensive to maintain as vehicles that are not prone to
failure
– The mean distance between failure measure itself is prone to error
due to errors in recorded mileage
– The lack of relationship is likely compounded by a definition of “failure”
that is too broad
Moving forward, a clearer and more stringent definition of
failure should be developed, such as
– Number of times the vehicle was removed from service
– More limited number of repair types

CountyStat8Fleet Preventive
Maintenance
6/2/2009
Agenda
Introductions and meeting purpose
Montgomery County performance
Improving performance for transit vehicles
– Drivers of performance
– Improving performance
Improving performance for administrative vehicles
Wrap-up
CountyStat9Fleet Preventive
Maintenance
6/2/2009
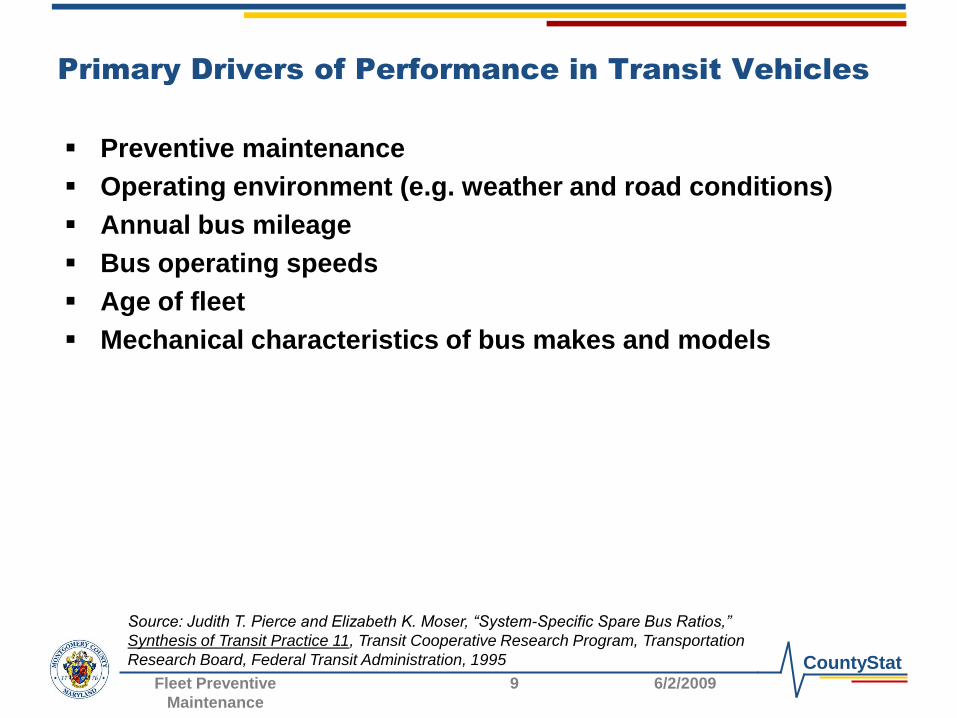
Primary Drivers of Performance in Transit Vehicles
Preventive maintenance
Operating environment (e.g. weather and road conditions)
Annual bus mileage
Bus operating speeds
Age of fleet
Mechanical characteristics of bus makes and models
Source: Judith T. Pierce and Elizabeth K. Moser, “System-Specific Spare Bus Ratios,”
Synthesis of Transit Practice 11, Transit Cooperative Research Program, Transportation
Research Board, Federal Transit Administration, 1995

CountyStat10Fleet Preventive
Maintenance
6/2/2009
Preventive Maintenance of Transit Equipment
Preventive maintenance is performed every 6,000 miles
– Mileage interval is set by agreement between the Federal Transit Administration (FTA) and Montgomery County
– FTA audits Montgomery County every three years to make sure that preventive maintenance intervals are being adhered to
• 80% of preventive maintenance must occur within 10% of 6,000 miles (i.e. the preventive maintenance is considered late if it occurs after 6,600 miles)
Montgomery County has struggled with meeting FTA expectations
– Most work each day in transit equipment is unscheduled repairs rather than scheduled maintenance
– An FTA report from July 2007 found that 83% of preventive maintenance was overdue at one garage, and 60% of preventive maintenance was overdue at the other garage
– Current Fleet management, which began in FY08, has made getting preventive maintenance under control a priority
FTA funding is dependent upon the findings of the audits.

CountyStat11Fleet Preventive
Maintenance
6/2/2009
Overdue Preventive Maintenance:
Transit Equipment
Number of missed preventive maintenance events
0
250
500
750
1,000
1,250
1,500
1,750
STS 281
TES 346 420 781 874 801
BMF 530 545 506 491 463
FY04 FY05 FY06 FY07 FY08
STS = Small Transit Shop (small bus maintenance at Nicholson Court)
TES = Transit Equipment Section (large bus maintenance at Crabbs Branch Way)
BMF = Bus Maintenance Facility (large bus maintenance in Silver Spring)

CountyStat12Fleet Preventive
Maintenance
6/2/2009
Cost of Missed Preventive Maintenance
Maintenance Cost 5/1/2008 – 4/30/2009, by Vehicle
$0
$20,000
$40,000
$60,000
$80,000
$100,000
$120,000
$140,000
$160,000
0% 25% 50% 75% 100%
Percent of preventive maintenance performed on time
Co
st o
f m
ain
ten
an
ce
There is essentially no relationship in this data between adherence to
preventive maintenance and annual vehicle cost.

CountyStat13Fleet Preventive
Maintenance
6/2/2009
Cost of Missed Preventive Maintenance
Mean Distance Between Failure, by Vehicle
0
2,000
4,000
6,000
8,000
10,000
12,000
14,000
16,000
0% 25% 50% 75% 100%
Percent of preventive maintenance performed on time
Me
an
dis
tan
ce
be
twe
en
fa
ilu
re (
mile
s)
Adherence to preventive maintenance improves mean distance
between failure somewhat.

CountyStat14Fleet Preventive
Maintenance
6/2/2009
Cost of Maintaining an Aging Fleet
Maintenance Cost 5/1/2008 – 4/30/2009, by Vehicle
$0
$20,000
$40,000
$60,000
$80,000
$100,000
$120,000
$140,000
$160,000
0 5 10 15 20
Vehicle Age
Co
st o
f m
ain
ten
an
ce
There is a strong relationship between vehicle age and annual vehicle
cost. Peak costs occur at age 10.

CountyStat15Fleet Preventive
Maintenance
6/2/2009
Predicted Maintenance Cost By Age
Regression Analysis Results
Age Predicted Maintenance Cost
1 $13,240
2 $25,058
3 $35,454
4 $44,428
5 $51,980
6 $58,110
7 $62,818
8 $66,103
9 $67,967
10 $68,409
11 $67,429
12 $65,027
13 $61,203
14 $55,957
15 $49,289

CountyStat16Fleet Preventive
Maintenance
6/2/2009
Cost of Maintaining an Aging Fleet
Mean Distance Between Failure, by Vehicle
0
2,000
4,000
6,000
8,000
10,000
12,000
14,000
16,000
0 5 10 15 20
Vehicle Age
Me
an
dis
tan
ce
be
twe
en
fa
ilu
re (
mile
s)
There is a relationship between vehicle age and mean distance
between failure. Minimum occurs at age 15.

CountyStat17Fleet Preventive
Maintenance
6/2/2009
Other Factors That Affect Maintenance Cost and Mean
Distance Between Failure
Bus class: Hybrid
– Higher
maintenance costs
– Lower mean
distance between
failure
Bus make: Orion
– Higher
maintenance costs
XX – Statistically significant at the XX% level (i.e. .95 is significant at the 95% level)
VariableMDBF
Model
Cost
Model
Intercept 4,27899 -$2,639
MDBF -$0.12
Vehicle Class
9HCM (Bus,13-18 Pass,Paratransit,Whlchair) -167 -$5,278
9HCU (Bus,13-18 Pass,Paratransit,Whlchair) -324 -$4,563
9OEU (Bus,25-42 Pass,Transit,Whlchair -CNG-) -291 $1,055
9QEU (Bus,25-42 Pass,Transit,Whlchair,Hybrid) -1,41395 $8,21585
Vehicle Make
Gillig 104 -$2,805
International 738 $4,759
Orion 194 $6,35185
Other -89 -$3,511
Age of Vehicle
Age -42399 $13,95199
Age2 (Age squared) 1490 -$71199
Percent of preventive maintenance events performed on time
0% -335 -$527
1% - 15% -219 -$8,38099
31% - 45% -62 -$2,752
45%+ -93395 -$856
R2 of model 0.219 0.613

CountyStat18Fleet Preventive
Maintenance
6/2/2009
Fleet Personnel:
Transit Equipment
Average number of personnel for transit maintenance
0
20
40
60
80
100
STS 6.6
TES 36.2 40.5 39.5 40.3 42.4
BMF 34.1 42.4 42.2 42.5 44.3
FY04 FY05 FY06 FY07 FY08
Average number of personnel charging to each facility during that fiscal year

CountyStat19Fleet Preventive
Maintenance
6/2/2009
Cost/Benefit of Replacing Aging Transit Vehicles
Comparison of Annual Cost
Methodology
Total cost of the vehicle
– Year 1: Purchase price + predicted
maintenance cost at age 1
– Remaining years: predicted maintenance
cost for each vehicle age
Annual cost of having the vehicle =
total cost / age at replacement
Goal: minimize the annual cost
Findings
The only vehicle that should be sold
early are small buses
Large buses should be held as long as
possible
Age Predicted Cost
1 $13,240
2 $25,058
3 $35,454
4 $44,428
5 $51,980
6 $58,110
7 $62,818
8 $66,103
9 $67,967
10 $68,409
11 $67,429
12 $65,027
13 $61,203
14 $55,957
15 $49,289
Annual Maintenance Cost Predicted
by Regression Analysis

CountyStat20Fleet Preventive
Maintenance
6/2/2009
Cost/Benefit of Replacing Aging Transit Vehicles
Comparison of Annual Cost of Owning a Vehicle
Replacement
Age
Purchase Price of Vehicle
$175,000 $200,000 $225,000 $250,000 $275,000
5 $69,032 $74,032 $79,032 $84,032 $89,032
6 $67,211 $71,378 $75,545 $79,711 $83,878
7 $66,584 $70,155 $73,727 $77,298 $80,869
8 $66,524 $69,649 $72,774 $75,899 $79,024
9 $66,684 $69,462 $72,240 $75,017 $77,795
10 $66,857 $69,357 $71,857 $74,357 $76,857
11 $66,909 $69,181 $71,454 $73,727 $76,000
12 $66,752 $68,835 $70,919 $73,002 $75,085
13 $66,325 $68,248 $70,171 $72,094 $74,017
14 $65,584 $67,370 $69,156 $70,942 $72,727
15 $64,498 $66,165 $67,831 $69,498 $71,165
Smallest annual cost of having the vehicle are shown in bold.

CountyStat21Fleet Preventive
Maintenance
6/2/2009
Fleet Summation of Meaning of Data
Data as displayed includes corrective maintenance work not
associated with mechanical failures.
DGS/DFMS contracted with an outside consulting firm in
December 2008 to audit the Preventive Maintenance Program
and provide insight into why PMs are being performed late.
MC should have the results of the audit with
recommendations in the next few months.
Contributing factors:
- Age of the fleet
- Size and age of the maintenance shops
- Bus to mechanic ratio (staffing)

CountyStat22Fleet Preventive
Maintenance
6/2/2009
Agenda
Introductions and meeting purpose
Montgomery County performance
Improving performance for transit vehicles
Improving performance for administrative vehicles
– Drivers of performance
– Improving performance
Wrap-up

CountyStat23Fleet Preventive
Maintenance
6/2/2009
Primary Drivers of Performance in Light Equipment
Mechanical characteristics of vehicle makes and models
Training of personnel
Availability of parts
Control of workflow
– Amount of unscheduled versus scheduled repairs
– How often vehicles are brought in on time for scheduled visits

CountyStat24Fleet Preventive
Maintenance
6/2/2009
Control of Workflow for Light Equipment
Most light equipment work each day is scheduled
maintenance rather than unscheduled repairs
Departments are responsible for bringing vehicles in on time
for their scheduled maintenance
– Fleet sends out quarterly reminders to departments to notify them of
upcoming scheduled maintenance
– Fleet managers within departments can view their upcoming
scheduled maintenance online
Turnaround time is affected by Fleet’s ability to predict and
control how much work there is to do on any given day
– Departments’ adherence to their given schedule
– Fleet’s determination of appropriate service intervals

CountyStat25Fleet Preventive
Maintenance
6/2/2009
Effect of Adherence to Schedule on Turnaround Time
Equipment Class
Turnaround time for
vehicles brought in on
their designated day
Turnaround time for
vehicles brought in late
Public Safety Light
Equipment1.5 days 3.4 days
Administrative
Light Equipment0.6 days 2.6 days

CountyStat26Fleet Preventive
Maintenance
6/2/2009
Cost of Not Adhering to Designated Maintenance Day
Maintenance Cost 5/1/2008 – 4/30/2009, by Vehicle
$0
$2,000
$4,000
$6,000
$8,000
$10,000
$12,000
$14,000
0 20 40 60 80 100
Percent of preventive maintenance that occurred on scheduled day last year
Co
st o
f m
ain
ten
an
ce last year
For every percent improvement in adherence to the designated maintenance day,
annual vehicle cost decreases $3.67. A 10% improvement across the 1,385
vehicles here that can improve would result in a cost savings of $51,000.

CountyStat27Fleet Preventive
Maintenance
6/2/2009
Cost of Not Adhering to Designated Maintenance Day
Mean Distance Between Failure, by Vehicle
0
5,000
10,000
15,000
20,000
25,000
30,000
35,000
40,000
0 20 40 60 80 100
Percent of preventive maintenance that occurred on scheduled day, all years
Me
an
dis
tan
ce
be
twe
en
fa
ilu
re (
mile
s)
There is essentially no relationship in this data between adherence to the
designated preventive maintenance day and mean distance between failure.

CountyStat28Fleet Preventive
Maintenance
6/2/2009
Drivers of Cost and MDBF in Light Equipment: Age
Maintenance Cost 5/1/2008 – 4/30/2009, by Vehicle
$0
$2,000
$4,000
$6,000
$8,000
$10,000
$12,000
$14,000
0 5 10 15 20
Age of vehicle
Co
st o
f m
ain
ten
an
ce last year
Public safety vehicles are replaced at age 6. Administrative vehicles are
generally replaced at age 8.

CountyStat29Fleet Preventive
Maintenance
6/2/2009
Drivers of Cost and MDBF in Light Equipment: Age
Mean Distance Between Failure, by Vehicle
0
5,000
10,000
15,000
20,000
25,000
30,000
35,000
40,000
0 5 10 15 20
Age of vehicle
Me
an
dis
tan
ce
be
twe
en
fa
ilu
re (
mile
s)
Regression models predict that the effects of age on mean distance
between failure peak at age 7.

CountyStat30Fleet Preventive
Maintenance
6/2/2009
Drivers of Cost and MDBF in Light Equipment: Class
$0
$500
$1,000
$1,500
$2,000
$2,500
$3,000
Compact Full-size Intermediate Minivan Pickup SUV Van
Vehicle Class
Ma
inte
na
nc
e c
os
t la
st
ye
ar
0
2,000
4,000
6,000
8,000
Compact Full-size Intermediate Minivan Pickup SUV Van
Vehicle Class
Me
an
dis
tan
ce
be
twe
en
failu
re (
mile
s)
Vehicle class has a definite effect on maintenance costs, but has less of
an effect on mean distance between failure.

CountyStat31Fleet Preventive
Maintenance
6/2/2009
Fleet Summary of Meaning of Data
Automotive/Light Equipment Maintenance Program has been
successful
Continue current practice of scheduling vehicles for
preventive maintenance
Continue notifying departments of missed PMs but will review
who the notification are sent to; fleet coordinator vs Director
Continue to analyze current maintenance schedule to ensure
maximum availability at lowest maintenance cost
Define qualifications for departmental fleet coordinators
Continue quarterly fleet coordinators meeting to share
information and answer questions

CountyStat32Fleet Preventive
Maintenance
6/2/2009
Warranty Use in Light Equipment
All light duty equipment warranty repairs are performed by the
manufactures dealership. The average dealer labor cost is
about 97.00 to 107.00 per hour.
Equipment warranties include:
– Standard 3 years/36,000 miles on all vehicles
– Exhaust 8 years/80,000 miles on all vehicles
– GM Drive train 5 years/100,000 miles on non Police
– Kia Drive train 10 years/100,000 miles

CountyStat33Fleet Preventive
Maintenance
6/2/2009
Service Intervals for Preventive Maintenance of Light
Equipment
Equipment ClassMontgomery County
Specified PM Interval
Manufacturer
Recommended PM Interval
Public Safety Vehicles
Chevy Impala
3,500 miles
3,000 miles
Ford Crown Victoria 3,000 miles
Dodge Charger 3,000 miles
Administrative Vehicles
Chevy Cavalier
4,000 miles
7,000 miles
Dodge Caravan 6,000 miles
Chevy Silverado 3,000 miles

CountyStat34Fleet Preventive
Maintenance
6/2/2009
Effect of Increasing Service Intervals for Light Equipment
Current average actual service intervals
– Law enforcement vehicles: 3,158 miles
– Non-law enforcement vehicles: 2,778 miles
Regression analysis showed that increasing service intervals
increases annual maintenance costs, on average, $0.16 for
every additional mile between service intervals
– Models using only law enforcement vehicles did not show a
relationship at a statistically significant level
• Law enforcement vehicles come in for other maintenance more often than
administrative vehicles (2.2 times per vehicle vs. 1.5 times per vehicle)
– Models using only administrative vehicles were effected: $0.38 for
every additional mile between service intervals

CountyStat35Fleet Preventive
Maintenance
6/2/2009
Tracking Our Progress
Meeting Goals:
– Establish strategies for preventive maintenance for transit, public
safety, and administrative vehicles to cost-effectively maximize mean
distance between failure and/or turnaround times
How will we measure success
– Fleet is using best available data to make purchasing and preventive
maintenance decisions

CountyStat36Fleet Preventive
Maintenance
6/2/2009
Wrap-up
Confirmation of follow-up items
Time frame for next meeting

CountyStat37Fleet Preventive
Maintenance
6/2/2009
Benchmarking: Mean Distance Between Failure (MDBF)
for Transit Equipment
Jurisdiction2007 2008
MDBF Average age MDBF Average age
Montgomery County 2,586 2,707
Fairfax County
Baltimore County
WMATA 6,267 6,326
Albany/Troy 4,500 5,700
San Francisco 3,400
CountyStat38Fleet Preventive
Maintenance
6/2/2009
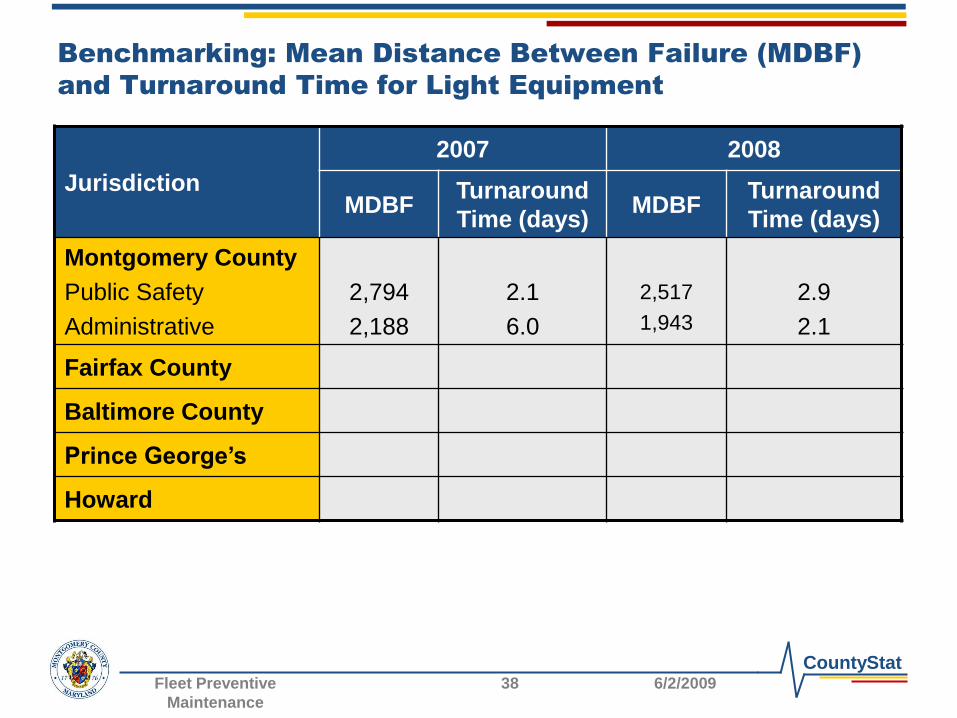
Benchmarking: Mean Distance Between Failure (MDBF)
and Turnaround Time for Light Equipment
Jurisdiction
2007 2008
MDBFTurnaround
Time (days)MDBF
Turnaround
Time (days)
Montgomery County
Public Safety
Administrative
2,794
2,188
2.1
6.0
2,517
1,943
2.9
2.1
Fairfax County
Baltimore County
Prince George’s
Howard