Fleet Equipment Performance Measurement Preventive Maintenance Model ... · FLEET EQUIPMENT...
76
Technical Report Documentation Page 1. Report No. FHWA/TX-13/0-6626-1 2. Government Accession No. 3. Recipient's Catalog No. 4. Title and Subtitle FLEET EQUIPMENT PERFORMANCE MEASUREMENT PREVENTIVE MAINTENANCE MODEL: FINAL REPORT 5. Report Date Published: April 2014 6. Performing Organization Code 7. Author(s) Michael Kader, Tara Ramani, Jeremy Johnson, Clifford Speigelman, Josias Zietsman, and Timothy Jacobs 8. Performing Organization Report No. Report 0-6626-1 9. Performing Organization Name and Address Texas A&M Transportation Institute College Station, Texas 77843-3135 10. Work Unit No. (TRAIS) 11. Contract or Grant No. Project 0-6626 12. Sponsoring Agency Name and Address Texas Department of Transportation Research and Technology Implementation Office 125 E. 11 th Street Austin, Texas 78701-2483 13. Type of Report and Period Covered Technical Report: September 2010–February 2013 14. Sponsoring Agency Code 15. Supplementary Notes Project performed in cooperation with the Texas Department of Transportation and the Federal Highway Administration. Project Title: Fleet Equipment Performance Measurement Preventive Maintenance Model (PM 2 ) URL: http://tti.tamu.edu/documents/0-6626-1.pdf 16. Abstract The concept of preventive maintenance is very important in the effective management and deployment of vehicle fleets. The Texas Department of Transportation (TxDOT) operates a large fleet of on-road and off- road equipment. Newer engines and vehicles are equipped with on-board diagnostic systems that can provide data on engine operation as indicators of engine load. There is the possibility of tracking these parameters to refine predictions for when equipment maintenance should be performed. Project 0-6626 aimed to provide a proof of concept for this idea by studying TxDOT’s fleet, selecting a vehicle category for data collection, and developing an algorithm that can be used to recommend appropriate oil change intervals based on engine data collected through on-board diagnostic systems. 17. Key Words TxDOT Fleet, Data Logging, Heavy Duty Vehicle, Idling 18. Distribution Statement No restrictions. This document is available to the public through NTIS: National Technical Information Service Alexandria, Virginia http://www.ntis.gov 19. Security Classif.(of this report) Unclassified 20. Security Classif.(of this page) Unclassified 21. No. of Pages 76 22. Price Form DOT F 1700.7 (8-72) Reproduction of completed page authorized
Transcript of Fleet Equipment Performance Measurement Preventive Maintenance Model ... · FLEET EQUIPMENT...

Technical Report Documentation Page 1. Report No. FHWA/TX-13/0-6626-1
2. Government Accession No.
3. Recipient's Catalog No.
4. Title and Subtitle FLEET EQUIPMENT PERFORMANCE MEASUREMENT PREVENTIVE MAINTENANCE MODEL: FINAL REPORT
5. Report Date Published: April 2014 6. Performing Organization Code
7. Author(s) Michael Kader, Tara Ramani, Jeremy Johnson, Clifford Speigelman, Josias Zietsman, and Timothy Jacobs
8. Performing Organization Report No. Report 0-6626-1
9. Performing Organization Name and Address Texas A&M Transportation Institute College Station, Texas 77843-3135
10. Work Unit No. (TRAIS) 11. Contract or Grant No. Project 0-6626
12. Sponsoring Agency Name and Address Texas Department of Transportation Research and Technology Implementation Office 125 E. 11th Street Austin, Texas 78701-2483
13. Type of Report and Period Covered Technical Report: September 2010–February 2013 14. Sponsoring Agency Code
15. Supplementary Notes Project performed in cooperation with the Texas Department of Transportation and the Federal Highway Administration. Project Title: Fleet Equipment Performance Measurement Preventive Maintenance Model (PM2) URL: http://tti.tamu.edu/documents/0-6626-1.pdf 16. Abstract The concept of preventive maintenance is very important in the effective management and deployment of vehicle fleets. The Texas Department of Transportation (TxDOT) operates a large fleet of on-road and off-road equipment. Newer engines and vehicles are equipped with on-board diagnostic systems that can provide data on engine operation as indicators of engine load. There is the possibility of tracking these parameters to refine predictions for when equipment maintenance should be performed. Project 0-6626 aimed to provide a proof of concept for this idea by studying TxDOT’s fleet, selecting a vehicle category for data collection, and developing an algorithm that can be used to recommend appropriate oil change intervals based on engine data collected through on-board diagnostic systems. 17. Key Words TxDOT Fleet, Data Logging, Heavy Duty Vehicle, Idling
18. Distribution Statement No restrictions. This document is available to the public through NTIS: National Technical Information Service Alexandria, Virginia http://www.ntis.gov
19. Security Classif.(of this report) Unclassified
20. Security Classif.(of this page) Unclassified
21. No. of Pages 76
22. Price
Form DOT F 1700.7 (8-72) Reproduction of completed page authorized


FLEET EQUIPMENT PERFORMANCE MEASUREMENT PREVENTIVE MAINTENANCE MODEL: FINAL REPORT
by
Michael Kader Graduate Research Assistant, Texas A&M Transportation Institute
Tara Ramani, P.E.
Assistant Research Engineer, Texas A&M Transportation Institute
Jeremy Johnson Research Specialist, Texas A&M Transportation Institute
Clifford Speigelman, Ph.D.
Senior Research Scientist, Texas A&M Transportation Institute and Distinguished Professor, Department of Statistics, Texas A&M University
Josias Zietsman, Ph.D., P.E
Division Head, Texas A&M Transportation Institute
and
Timothy Jacobs, Ph.D. Associate Professor, Department of Mechanical Engineering, Texas A&M University
Report 0-6626-1 Project 0-6626
Project Title: Fleet Equipment Performance Measurement Preventive Maintenance Model (PM2)
Performed in cooperation with the Texas Department of Transportation
and the Federal Highway Administration
Published: April 2014
TEXAS A&M TRANSPORTATION INSTITUTE College Station, Texas 77843-3135


v
DISCLAIMER
This research was performed in cooperation with the Texas Department of Transportation (TxDOT) and the Federal Highway Administration (FHWA). The contents of this report reflect the views of the authors, who are responsible for the facts and the accuracy of the data presented herein. The contents do not necessarily reflect the official view or policies of the FHWA or TxDOT. This report does not constitute a standard, specification, or regulation. The engineer in charge of the project was Tara Ramani, P.E. #113224. The United States Government and the State of Texas do not endorse products or manufacturers. Trade or manufacturers’ names appear herein solely because they are considered essential to the object of this report.

vi
ACKNOWLEDGMENTS
This project was conducted in cooperation with TxDOT and the FHWA. The authors thank the TxDOT Project Monitoring Committee (Don Lewis, Duncan Stewart, Johnie Muller, Curtis Reinert, German Claros, Ron Hagquist, Rick Walbrick, and Lori Clark) for their guidance and oversight during the course of this project.

vii
TABLE OF CONTENTS
Page List of Figures ............................................................................................................................... ix List of Tables ..................................................................................................................................x Chapter 1: Introduction ................................................................................................................1
Research Approach ..................................................................................................................... 1 This Report.................................................................................................................................. 2
Chapter 2: Literature Review .......................................................................................................3 Engine Oil Properties .................................................................................................................. 3 Criteria for Engine Oil Replacement .......................................................................................... 6
Degradation ............................................................................................................................. 6 Contamination ......................................................................................................................... 7
Effects of Engine Operation on Oil Quality ............................................................................... 8 Short and Long Trip Intervals ................................................................................................. 9 Excessive Idling ...................................................................................................................... 9 Extreme High and Low Temperature Operation .................................................................. 10 Poor Maintenance Procedures............................................................................................... 10
Engine Parameters .................................................................................................................... 11 Dynamic Parameters ............................................................................................................. 11 Static Parameters ................................................................................................................... 12
Correlation of Engine Parameters to Oil Change Intervals ...................................................... 12 Summary ................................................................................................................................... 13
Chapter 3: Selection of Test Vehicle Category ..........................................................................15 Study of TxDOT’s Fleet ........................................................................................................... 15
Equipment Operating System (EOS) Database .................................................................... 15 FleetTrackS ........................................................................................................................... 15 TxDOT Equipment Replacement Model (TERM) ............................................................... 16
Selection of Equipment Category for Data Collection ............................................................. 16 Identification of General Equipment Classes of Interest ...................................................... 16 Selection Criteria and Parameters ......................................................................................... 18
Fleet Analysis Results ............................................................................................................... 21 Recommended Equipment Categories Based on Analysis Results ...................................... 23 Units Available in Desired Districts ..................................................................................... 24 Final Selection ...................................................................................................................... 25
Chapter 4: Data Collection Setup and Methodology ................................................................27 Selection of Specific Test Vehicles .......................................................................................... 27 Data Collection Tools and Processes ........................................................................................ 27
Engine Data Logging ............................................................................................................ 28 Oil Sample Collection and Analysis ..................................................................................... 29
Implementation of Data Collection ........................................................................................... 30 Chapter 5: Data Analysis and Development of Predictive Algorithm ....................................31
Oil Data and Engine Data Analysis Results ............................................................................. 31 Engine Data Analysis Results ............................................................................................... 31 Oil Data Analysis Results ..................................................................................................... 36

viii
Summary of Data Analysis Results ...................................................................................... 47 Statistical Analysis and Development of Predictive Algorithm ............................................... 47
Chapter 6: Conclusions and Recommendations .......................................................................49 Summary of Findings ................................................................................................................ 49 Potential Cost Savings .............................................................................................................. 49 Other Implications and Scope for Future Study ....................................................................... 50
References .....................................................................................................................................51 Appendix A: Vehicle Log Sheet Examples ................................................................................55 Appendix B: Additional Wiring Setup .......................................................................................59 Appendix C: J1939 “Parser” Application .................................................................................63 Appendix D: Engine Speed Distribution and Idle Characteristics for Individual
Vehicles .....................................................................................................................................65

ix
LIST OF FIGURES
Page Figure 1. Summary of Research Approach. .................................................................................... 2 Figure 2. Layout of EoS Database. ............................................................................................... 17 Figure 3. Map of TxDOT Districts for Vehicle Selection. ........................................................... 20 Figure 4. Sterling Dump Truck with MBE-4000 Engine. ............................................................ 25 Figure 5. Caflor IOSiX Data Logger. ........................................................................................... 28 Figure 6. Histogram Showing Distribution of Engine Speed. ...................................................... 32 Figure 7. Histogram Showing Distribution of Actual Torque at Idle Speeds. .............................. 33 Figure 8. Vehicle Speed by Percent Run Time. ............................................................................ 34 Figure 9. Oil Temperature Distribution. ....................................................................................... 35 Figure 10. Coolant Temperature Distribution. .............................................................................. 35 Figure 11. Engine Oil Pressure Percent Run Time. ...................................................................... 36 Figure 12. Viscosity Degradation in Nature’s Choice Oil. ........................................................... 38 Figure 13. Viscosity Degradation in Goldenwest Oil. .................................................................. 39 Figure 14. Total Base Number v. Lube Mileage in Nature’s Choice Oil. .................................... 40 Figure 15. Total Base Number v. Lube Mileage in Goldenwest Oil. ........................................... 40 Figure 16. Fuel Dilution v. Lube Mileage in Nature’s Choice Oil. .............................................. 41 Figure 17. Fuel Dilution v. Lube Mileage in Goldenwest Oil. ..................................................... 42 Figure 18. Iron v. Lube Mileage in Nature’s Choice Oil. ............................................................. 43 Figure 19. Iron v. Lube Mileage in Goldenwest Oil. .................................................................... 43 Figure 20. Aluminum v. Lube Mileage in Nature’s Choice Oil. .................................................. 44 Figure 21. Aluminum v. Lube Mileage in Goldenwest Oil. ......................................................... 45 Figure 22. Boron v. Lube Mileage in Goldenwest Oil. ................................................................ 46 Figure 23. Molybdenum v. Lube Mileage in Goldenwest Oil. ..................................................... 46 Figure B-1. Location of VCU. ...................................................................................................... 60 Figure B-2. VCU Connectors. ...................................................................................................... 61 Figure B-3. Location of J1939+/– Pins. ........................................................................................ 61 Figure C-1. Sample Data from J1939 Data Logger. ..................................................................... 63 Figure D-1. Distribution of Engine Speed for All Test Vehicles. ................................................ 65

x
LIST OF TABLES
Page Table 1. Engine Type Classification and Number of Units – On-Road. ...................................... 21 Table 2. Engine Type Classification and Number of Units – Off-Road. ...................................... 21 Table 3. Selected Oil Expense Parameters – On-Road. ................................................................ 22 Table 4. Selected Oil Expense Parameters – Off-Road. ............................................................... 22 Table 5. Selected Usage Parameters – On-Road. ......................................................................... 23 Table 6. Selected Usage Parameters – Off-Road. ......................................................................... 23 Table 7. Available Units in Waco, Houston, Austin, and Bryan Districts. .................................. 24 Table 8. Selected Vehicles for Testing (Equipped with MBE-4000 Engine). .............................. 27 Table 9. Reserve Vehicles for Contingency Use (Equipped with MBE-4000 Engine). ............... 27 Table 10. Oil Parameters and Applicable Test Standards............................................................. 29 Table 11. Idle Load Characteristics. ............................................................................................. 33 Table 12. Specifications of Engine Oils Used by Test Vehicles. ................................................. 37 Table 13. Severity Levels for Oil Parameters. .............................................................................. 37 Table 14. Total Base Number Advisory Levels. ........................................................................... 39 Table C-1. Abbreviated Sample Data Output from J1939 Parser Application. ............................ 64 Table D-1. Vehicle Idle Characteristics. ....................................................................................... 66

1
CHAPTER 1: INTRODUCTION
The concept of preventive maintenance is very important in the effective management and deployment of vehicle fleets. The Texas Department of Transportation (TxDOT) operates a large fleet of over 15,000 pieces of on-road and off-road equipment. Consequently, fleet maintenance procedures represent a significant cost to the agency. TxDOT currently uses a fleet tracking program (FleetTrackS) to identify when specific fleet equipment require maintenance. This scheduling is dependent on simple variables such as vehicle miles or operational hours logged.
However, with newer engines and vehicles that are equipped with on-board diagnostic systems, there is the possibility of tracking these parameters or performance measures over time and correlating them to oil degradation levels to determine the need for preventive maintenance.
Additionally, advances in engine oil technology and increased combustion efficiency have resulted in the ability to have longer oil intervals in vehicles. Current oil change interval practice only takes into account the mileage a vehicle has driven and does not consider other vehicle operations that affect oil life, such as extended idling. While routine oil sampling is one way to ensure optimal oil intervals, a more efficient possibility is to use on-board diagnostic (OBD) data to correlate oil degradation to engine usage in order to develop an algorithm to refine predictions for when equipment maintenance should be performed.
The aim of this research is to provide a proof of concept for this idea by studying whether a statistical approach to recommending oil changes in TxDOT’s fleet vehicles can be achieved based on engine data and oil sampling analysis, and to discuss whether predictive intervals can improve preventive maintenance practices and save money.
RESEARCH APPROACH
Since this is a relatively new topic area that does not have much documented publicly available research associated with it, the research team designed the approach as a proof of concept study, i.e., to demonstrate viability of this approach before recommending steps to implement it at a broader scale. Figure 1 summarizes the research approach, and the specific project tasks are listed below:
• Task 1 – Literature Review. • Task 2 – Study of TxDOT Fleet. • Task 3 – Data Collection Plan. • Task 4 – Data Collection. • Task 5 – Development of Predictive Algorithm. • Task 6 – Development of Spreadsheet Interface. • Task 7 – Potential Cost Savings. • Task 8 – Final Deliverables.
The researchers performed the study for a single category of TxDOT equipment, using a broad approach that involved collecting in-use engine data from on-board vehicle diagnostics and analyzing this data along with vehicle oil condition, which they monitored through oil sampling.

2
After performing a statistical analysis of the data collected, the research team developed an algorithm, implementation plan, and recommendations.
Figure 1. Summary of Research Approach.
THIS REPORT
Following this introductory section, Chapter 2 contains a literature review covering relevant topics related to engine oil composition, criteria for replacement and relation to engine operation. Chapter 3 provides an overview of selection of test vehicles, and Chapter 4 discusses the data collection procedures. Chapter 5 presents data analysis results and development of a predictive algorithm, and Chapter 6 contains a summary, conclusions, and discussion of overall findings.
Review and categorize TxDOT fleet
Literature review
Select test vehicles and develop data collection
plan
Data logging to collect OBD data Oil sampling and testing
Data analysis and algorithm development
Recommendations and implementation plan
Assessment of validity, cost effectiveness, and
potential savings

3
CHAPTER 2: LITERATURE REVIEW
This literature review covers topics related to engine oil in the context of engine operations, including a review of engine oil composition, criteria for replacement, and relation to engine operation. This chapter also provides an overview of key engine parameters and practices for oil life prediction, a review of existing systems, and oil and engine parameters of relevance.
ENGINE OIL PROPERTIES
Engine oil is essential for maintaining lubrication, washing away wear particles, and providing cooling for an internal combustion engine. As stated by Barnes (1), engine oil has four main functions:
• To prevent wear between surfaces of an engine. • To serve as coolants or heat transfer mediums. • To help seal at compression rings. • To suspend matter, thus helping to keep engines clean.
Like many other components of an engine, oil is a wear component that must be replaced periodically to maintain the best vehicle performance. Engine oil is affected by engine operations, which lead to the degradation and contamination of the oil. In general, more extreme use of an engine causes faster degradation of the oil. Also, the engine performance is affected by the quality of the oil. If an engine is using oil that is past its useful life, the chances of major engine failure increase (2). Therefore, it is important that engine oil is changed at appropriate intervals to ensure optimal performance and to lower the risk of engine failure.
Engine oil is comprised of base oil with a specified viscosity and additives to help prolong the life of the oil by mitigating the negative effects of contaminants. The base oil is the main component to engine oil and is responsible for the primary function of lubrication and removing heat energy from the engine. In complete motor oil, the base oil is typically 80–98 percent of the composition (3). In today’s market it is common to hear about conventional and synthetic oils for use in vehicles. These are two different base oils derived from two different processes. The first, conventional, is actually a petroleum based mineral oil that is refined from a source of crude oil. The second, synthetic, is oil that derives from a polyolefin. With the advancements in technologies since the 1980s both oils can now be produced to provide lubrication in the most demanding environments. Additionally, these oils can be re-refined and can be reused in vehicles.
Mineral base oil is refined from crude oil. Initially the crude oil is sent through a heating unit that separates the base oil from lighter low-viscosity components such as naptha, kerosene, diesel, and jet fuels. These components are easily boiled off and separated from the stock. Then the stock is sent through a vacuum tower unit that reduces pressure to allow the products that do not vaporize at atmospheric conditions to do so. This step is where the product is separated into light vacuum gas oil (LVGO), heavy vacuum gas oil (HVGO), and asphaltic oil. The asphaltic oil is sent through a de-asphalting unit where the heavier asphaltic components of the crude oil are removed, leaving de-asphalted oil (DOA). All three of the oils can be used to produce different base oils. Each is left with varying levels of mineral oil, aromatics, and polar components in its
4
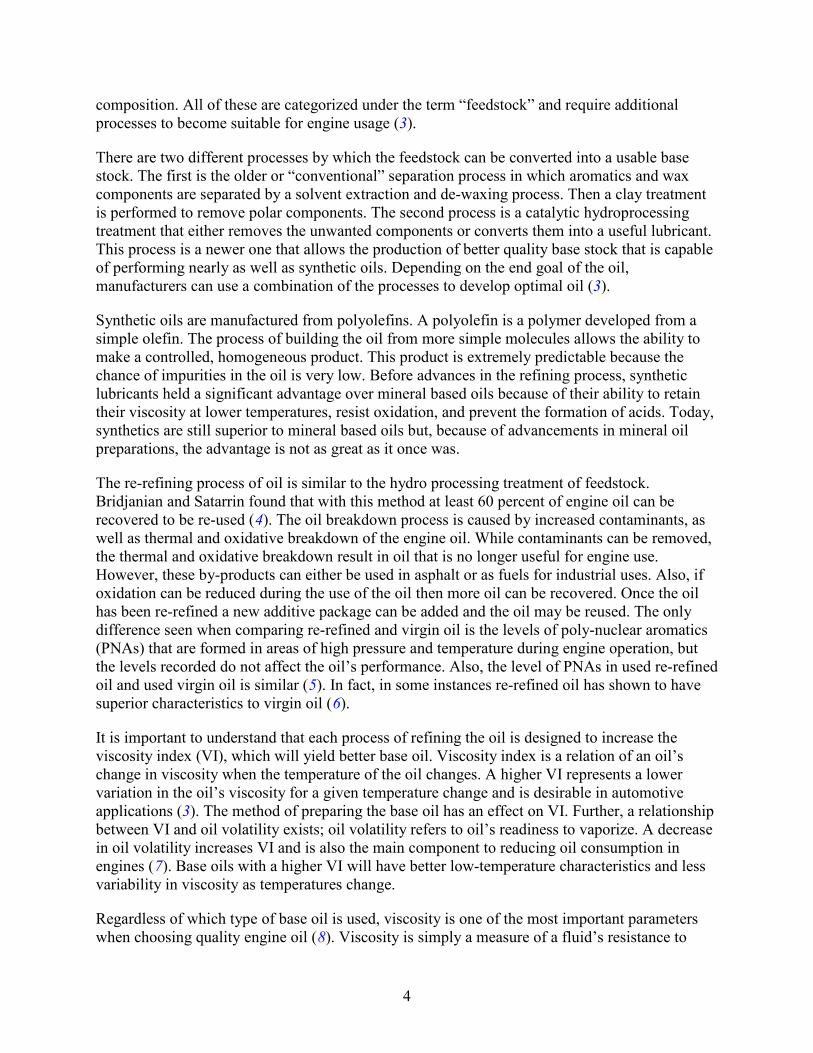
composition. All of these are categorized under the term “feedstock” and require additional processes to become suitable for engine usage (3).
There are two different processes by which the feedstock can be converted into a usable base stock. The first is the older or “conventional” separation process in which aromatics and wax components are separated by a solvent extraction and de-waxing process. Then a clay treatment is performed to remove polar components. The second process is a catalytic hydroprocessing treatment that either removes the unwanted components or converts them into a useful lubricant. This process is a newer one that allows the production of better quality base stock that is capable of performing nearly as well as synthetic oils. Depending on the end goal of the oil, manufacturers can use a combination of the processes to develop optimal oil (3).
Synthetic oils are manufactured from polyolefins. A polyolefin is a polymer developed from a simple olefin. The process of building the oil from more simple molecules allows the ability to make a controlled, homogeneous product. This product is extremely predictable because the chance of impurities in the oil is very low. Before advances in the refining process, synthetic lubricants held a significant advantage over mineral based oils because of their ability to retain their viscosity at lower temperatures, resist oxidation, and prevent the formation of acids. Today, synthetics are still superior to mineral based oils but, because of advancements in mineral oil preparations, the advantage is not as great as it once was.
The re-refining process of oil is similar to the hydro processing treatment of feedstock. Bridjanian and Satarrin found that with this method at least 60 percent of engine oil can be recovered to be re-used (4). The oil breakdown process is caused by increased contaminants, as well as thermal and oxidative breakdown of the engine oil. While contaminants can be removed, the thermal and oxidative breakdown result in oil that is no longer useful for engine use. However, these by-products can either be used in asphalt or as fuels for industrial uses. Also, if oxidation can be reduced during the use of the oil then more oil can be recovered. Once the oil has been re-refined a new additive package can be added and the oil may be reused. The only difference seen when comparing re-refined and virgin oil is the levels of poly-nuclear aromatics (PNAs) that are formed in areas of high pressure and temperature during engine operation, but the levels recorded do not affect the oil’s performance. Also, the level of PNAs in used re-refined oil and used virgin oil is similar (5). In fact, in some instances re-refined oil has shown to have superior characteristics to virgin oil (6).
It is important to understand that each process of refining the oil is designed to increase the viscosity index (VI), which will yield better base oil. Viscosity index is a relation of an oil’s change in viscosity when the temperature of the oil changes. A higher VI represents a lower variation in the oil’s viscosity for a given temperature change and is desirable in automotive applications (3). The method of preparing the base oil has an effect on VI. Further, a relationship between VI and oil volatility exists; oil volatility refers to oil’s readiness to vaporize. A decrease in oil volatility increases VI and is also the main component to reducing oil consumption in engines (7). Base oils with a higher VI will have better low-temperature characteristics and less variability in viscosity as temperatures change.
Regardless of which type of base oil is used, viscosity is one of the most important parameters when choosing quality engine oil (8). Viscosity is simply a measure of a fluid’s resistance to

5
flow. Generally, as fluids are cooled they become thicker, and they are more likely to resist flow (i.e., viscosity is increased). As they become hotter they become thinner and flow more easily (i.e., viscosity is decreased). In an engine, oils are subjected to extreme hot and extreme cold temperatures. It is desirable that the viscosity of the oil remains constant, in order to provide consistent lubrication properties at all temperatures. Generally, automotive oils today are developed as multi-grade oils. This type of oil is capable of producing adequate lubrication for both cold and hot operating temperatures of the engine. This ability is critical because research shows that engine wear occurs at a much higher rate during the colder start-up phase (9).
Vehicle and engine manufacturers generally specify the type and grade of oil that should be used by their product. If an engine does not use the correct viscosity the oil may not provide the proper lubrication for which it is designed. In a worst-case scenario, an end-user may suffer engine failure due to accelerated wear rates and temperature-driven part growth. Even when the correct viscosity oil is used, the oil will lose its lubrication characteristic. Any condition of engine operation (i.e., light use to extreme use) could increase or decrease viscosity during the life of the oil. In addition, the ability to properly lubricate at low temperature operation will decrease. This topic will be discussed more thoroughly in the section about degradation.
Additives are a supplement to the base oil and comprise between 2 and 20 percent of the total composition of engine oils. Additives were developed to improve oil performance where base oils fall short. Additives can be included to decrease wear, inhibit contamination or degradation, and to increase lubricity of the oil. Like viscosity, additives widely vary depending on the engine they will be used in. A study by Petrolon Technologies concluded that with the use of proper additives, engine wear can be reduced by 40 percent or more (10). Also, the depletion of additives could be a main indicator that oil is reaching the end of its life. The most typical additives are categorized as anti-wear particles, antioxidants, detergents, and antifreeze inhibitors. The following is an overview of these additives’ purpose and usage in engine oil.
• Anti-wear Additives – As their name suggests, anti-wear additives are designed to decrease the amount of internal wear of engine parts. The most common anti-wear additives are molybdenum, zinc, phosphorus, and boron. These additives are very fine particles that slip in between metal surfaces to create a buffer between two wear parts in an engine. Oils that are subjected to very high pressures, such as those created by small bearing clearances, typically use phosphorus as an additive because it is able to create a thin protective film in small spaces.
• Corrosion Inhibitors – These additives are designed to slow oxidation and nitration of oil, as well as inhibit the formation of corrosive particles in an engine. One main form of inhibitors is antioxidants. These particles behave by either inhibiting peroxides or scavenging radicals from the oil (2). Phosphorus and copper are the most common antioxidant additives. Zinc dialkyldithiophosphate (ZDDP) is a common phosphorus antioxidant that is very powerful because it exhibits both behaviors. Inhibitors also include calcium and magnesium. These additives neutralize acids in the oil.
• Detergents – These additives rid the engine of sludge that can stick to engine parts. Detergents include calcium, magnesium, and barium. Detergents are designed to break down sludge and suspend them in the oil of the engine. This is what causes discoloration of motor oil. Discoloration does not necessarily indicate full oil degradation; it just shows that the oil is cleaning sludge from the engine.

6
CRITERIA FOR ENGINE OIL REPLACEMENT
Engine oil is considered to be a “wear part,” and it eventually must be replaced. While there have been tests where engine oil has lasted for more than 400,000 miles in on-highway tractor trailer rigs (11), there are also instances where vehicles operating in harsh environments at extreme temperatures need more frequent oil changes. Degradation and contamination are the two aspects relating to the deterioration of engine oil. Degradation is generally noted as oil’s loss of additive and viscosity performance, and contamination is noted as the increase in harmful particles in the oil. Often, degradation and contamination interact with each other, causing one to increase along with the other. While long-term degradation and contamination are irreversible, it is possible to add make-up oil to a system to return additive concentrations to suitable levels. Make-up oil is fresh oil that will help replenish oil performance by decreasing the percentage of degraded or contaminated oil in the engine. In the short-term this practice will increase oil life, but it is only available when engines lose oil by means of burning, leaking, or routine filter changes. Therefore, it can increase oil drain intervals but not completely replace them. The remainder of this section explains further degradation, contamination, and their interactions.
Degradation
Degradation is a chemical deterioration of engine oil. Oxygen, sulfur, and nitrogen can form compounds in the crankcase, mix with oil, and reduce viscosity performance. Degradation is also the depletion of additives when they are exposed to contaminants in the system. We use the term viscosity performance because the viscosity of oil can be unsuitable for use if it is either too high or too low, while only depletion of additives can cause degradation.
Viscosity performance can be affected in both directions, i.e., an increase in viscosity or a decrease in viscosity. Increases in viscosity are caused by both internal and external contaminations, such as high operating temperatures or inefficient fuel combustion. These causes are explained more thoroughly in the next section on contamination. The effects of having higher viscosity oil are very serious to engine operation and include operational conditions such as engine overheating, restricted oil flow, and by-pass of the oil filter. Too low of a viscosity can also cause major issues such as poor lubrication, metal on metal contact and engine overheating. Both of these conditions can lead to higher operating costs due to decreased efficiencies and higher chances of part failure. All of these conditions create a cycle that continually degrades the oil at an increased rate until the oil is replaced or, ultimately, the engine fails.
Herbeaux (12) has concluded that the degradation in an oil’s kinematic viscosity decays logarithmically with time, where decay initially happens quickly but slows as time progresses. It is important to note that this logarithmic degradation will likely only occur in an engine that is running properly. When contamination issues begin to compound with the effects of high and low viscosity it is logical that the motor oil would then begin to degrade in a nearly exponential manner. Furthermore, in 1981 Yasutomi (13) concluded that volatile loss, due to viscosity performance degradation, is the most important factor in determining the degradation of a diesel engine and that other parameters such as total acid number (TAN) and soot can be predicted by understanding the loss in volatility.
Additives deplete as an engine operates under its normal conditions. The rate of this depletion increases as engines are subjected to harsher operating environments. High operating

7
temperatures will also cause an increase in oxidation and a subsequent decrease in antioxidants. Detergents are generally affected by the amount of blow-by past a piston and the engine’s efficiency. Inhibitors will be diminished based on the amount of antifreeze that leaks into the engine. Additives such as boron, calcium, magnesium, phosphorus, zinc, and barium are measured separately in oil testing and should be examined to ensure their levels do not drop below thresholds. Threshold levels vary among engines and oils used. Another parameter that is measured during oil analysis is the total base number (TBN). This number is a measure of the amount of alkaline additives in the oil that will neutralize the acidic components of the oil. Research has shown that measuring TBN is one of the most accurate indicators of remaining oil life (8).
Contamination
In its most basic definition, contamination refers to the point at which unwanted chemicals are added to the engine oil. Contamination begins as soon as oil is added to the crankcase of the engine. When fresh oil is added, residue from the previous oil (which the operator most likely changed because it was contaminated) mixes in and begins to contaminate the fresh oil. Even in a brand new engine, metal shavings are released at a high rate during the break-in period. The fresh oil is immediately exposed to these metal shavings and contamination occurs. These shavings are precisely why short interval oil changes are recommended in the initial hours of break in for an engine. Contamination can occur from either internal or external sources. Internal sources refer mostly to wear particles, while an external source could be antifreeze leaking into the oil. These sources are explained further below.
Internal Contamination
Internal contamination is the most difficult form of contamination to control. Regardless of the operating condition, an engine will have some form of wear particles that are being released. Internal contamination can result from multiple factors such as break-in wear and manufacturing debris on newly rebuilt engines, wear caused by sacrificial surfaces, mating surfaces’ fit and finish, and wear caused by defective parts (14). The best way to reduce wear particles and lengthen the oil duration is the use of high efficiency filters (15). Filters catch most of the wear particles carried by oil. Many times, however, other parameters of the oil, such as viscosity and TBN, will stay within their threshold long after the filter has reached its usable life. This condition has led people to implement a filter change without a complete oil change. The user will replace the filter and the oil lost during the procedure, and then proceed to use the oil until it fully degrades.
During oil analysis, wear metals such as aluminum, chromium, iron, copper, lead, molybdenum, and tin are measured. Iron is the most common of the wear metals because its high strength makes its use practical in many engine components. Iron is generally alloyed with other metals to help curb rust and corrosion issues (16). In an engine that is freshly rebuilt, copper and silicon level are generally high for the initial oil changes (17). Wear metals do not necessarily indicate the quality of the oil but indicate the effectiveness of the oil filter and the state of the engine. Certain elements showing unusually high concentrations can be an indicator that certain parts of the engine are heading toward failure. If wear metals are higher because of an inefficient filter, then the filter can be changed and the oil can remain working in the engine.

8
External Contamination
External contamination can be caused by a variety of systems within the vehicle. The most common external contaminants are water, fuel, glycol, dirt, and oil transferred from other vehicle components (14). These contaminants are caused by faulty gaskets or seals, or by piston blow-by.
Piston blow-by occurs when combustion products escape the combustion chamber through piston rings. This type of contamination happens to some extent in every vehicle and more often in vehicles with higher compression ratios, such as diesel or high performance gasoline engines. Products that make their way into the crankcase include unburnt fuel, water, dirt, soot (partially burnt fuel), and environmental contaminants such as potassium and silicon. While this contamination is caused by normal operations, it can also be caused by an engine that is running inefficiently because of air filter problems or other issues. An increase in soot will lead to an increase in viscosity. However, this increase should not be considered an improvement to lubricity as viscosity decreases during oil degradation. Generally, soot particles will batch together causing non-homogeneous oil that increases oil temperatures. Detergents in oils combat this condition by surrounding a soot particle and not allowing it to combine (18). Products that enter the oil from piston blow-by are a large cause for an increase of oxidation and nitration.
Glycol and potassium can enter the oil crankcase by means of a faulty seal that allows coolant to leak into the system. Also, leaks within other systems, such as the oil or transmission cooler, can allow other system fluids to leak into the oil that is eventually brought back to the crankcase. Generally, these fluids impact the viscosity of the engine oil. All these parameters are monitored by oil analysis and should be kept at minimum levels. If the levels of fuel, antifreeze, and water reach their high levels the oil must be replaced because of the dramatic changes in viscosity that these fluids cause.
Similar to TBN, the total acid number is used to quantify the rate of contamination. TAN is a measure of all the acids present in the oil. An increase in TAN is normally characterized by an increase in oxidation, nitration, or other acidic components formed by contamination (17, 20). One limitation to this test is that it cannot distinguish between different types of acids in the oil. However, an increase in acids is almost always directly linked to an increase in contamination of the oil. During normal engine operation, it is expected that TAN stays in the range of 1–4 (mg/g KOH), based on the American Society for Testing and Materials (ASTM) Standard D664-09A testing procedure. Abnormal conditions range from 4 to 6, and acid number is excessive when it is greater than 6 (19).
EFFECTS OF ENGINE OPERATION ON OIL QUALITY
The manner in which an engine is used has a large impact on the length of time in which the oil will be usable within the engine. This section is included to explain how individual operational characteristics of engines affect oil life. It focuses on the most common engine operating conditions, and the conditions relevant to the vehicles used in the study.
The different operation parameters that are covered in this section include: short and long trip intervals, excessive idling, extreme high and low temperature operation, and poor maintenance

9
procedures. Each of these conditions displays its own unique characteristics that will lead to different lengths of oil change intervals.
Short and Long Trip Intervals
Short trip intervals are characterized by trips that do not let the engine reach a normal operating temperature. Normal operating temperature is roughly the temperature in which the radiator thermostat is allowed to open and send coolant flow to regulate the temperature of the engine. During a short trip interval the engine generally “runs richer” (there is excess fuel in the combustion chamber) in order to provide enough fuel to keep the cold engine running. This rich mixture of fuel is not efficient and, therefore, causes an increase of contaminants into the system. The oil temperature does not reach a level in which the contaminants that developed during cold start procedures can be evaporated from the system. According to a study by Schwartz, short trip intervals do not let oil properly mix and provide proper lubrication (9). Because of this incomplete mixing, pools of corrosive particles develop within the engine. Furthermore, the study concluded that the development of sludge increases when engine oil temperatures are at or below 45°C. This analysis was done both visually and with quantitative sample analysis (9). Upon exceeding temperatures of 45°C, however, the sludge begins to decrease. This temperature is much less than the general operating temperature of 110°C for a typical engine. Thus, even if the operating temperatures are not reached the amount of sludge that is formed can be controlled. Another study performed by Younggren and Schwartz concluded that short trip operation produces a collection of water, fuels, and other contaminants (20). These contaminants greatly increase nitration and oxidation, which further increases the rate at which the oil is contaminated (20). When compared to long trip service, short trip service results in an increase in TAN, water, fuel, soot, and corrosion and wear products.
In contrast to short trip intervals, long trip intervals are characterized by an engine running for an extended period of time at a nearly steady state operation. An example of a long trip interval is driving a vehicle on a multi-hour road trip. A long trip interval allows an engine to reach operating temperatures and remain there for an extended period of time. Also, the operation of the engine is kept relatively constant throughout the trip. This situation leads to an even mixture of oil that is maintained at a steady temperature. The temperature allows for harmful contaminats to be vaporized and vented out of the engine, as well as providing optimal lubrication for engine components, thus reducing the formation of wear particles. During long trip operation, the engine is subjected to higher efficiency operation that leads to less blow-by down the piston walls. Because of these conditions engine oil degradation slows tremendously. Schwartz concluded that with synthetic oils under long trip interval service, the oil could last up to 10,000 miles for one interval. This interval is considerably longer than the recommended 7500 mi change recommendation. He also concluded that a borderline, non-synthetic, engine oil could possibly last up to 7500 miles during long trip service. This number is over twice the general manufacturer recommendation of 3000 mi for this kind of oil.
Excessive Idling
Excessive idling can occur in both cold start and warm temperature operation. The effects are generally the same, however, when comparing the two. Extended idling can lead to fuel, soot, and fuel dilution in the oil (16). Engines are designed to run most efficiently in full load

10
conditions. A vehicle at idle is in a no load condition. This inefficiency is especially a concern in cold vehicle operation where fuel-air ratio mixtures are richer and cause heavy unburnt fuel fractions that can wash down the cylinder walls and into the engine crankcase. Idling can cause unbalanced erratic motion in the engine, which can lead to an increase in wear particles that are deposited in the oil. Previously, the general recommendation was to allow the vehicle to sit at idle until the temperature becomes closer to operating temperature. Today’s studies show that this method is improper and will only result in decreased oil life and increased cost to the user. The general accepted principle now is to allow an engine to idle for 10 to 30 seconds before moving the vehicle. This idle time gives the oil sufficient time to lubricate the engine before being placed under load. Afterward it is best to drive the vehicle in such a way that engine speed is kept low until the engine reaches operating temperature. This low-speed driving creates a situation where the oil is warmed in a shorter amount of time and leads to less fuel usage. The Mercedes-Benz MBE-4000 operator’s manual states that an engine should never be idled for more than 30 minutes. Another concern of idle operation is the increase in pollutants that are created. The economic, environmental, and oil life length benefits are considerable when idling is reduced.
Extreme High and Low Temperature Operation
Oil temperatures around 100°C are beneficial to the oil’s life; temperatures exceeding 135°C, however, negatively affect engine oil life. At this temperature, oil oxidation and nitration begins to increase dramatically. Research indicates that the rate of oxidation of engine oil doubles for approximately every 8°C temperature increase in the oil (21). When this effect is considered in combination with the catalytic effects that air and metal shavings have on oxidation, the rate can lead to very short oil life. Also, sludge can form if trace amounts of glycol enter the system at high operating temperatures (16). With routine oil analysis, however, high temperature operation can be indicated by high levels of oxidation in the oil.
The effects of low temperature operation have been discussed generally in the short trip and excessive idling categories. Low operating temperatures increase the chances of nitration, fuel dilution, soot, and increased water into the system. This increase is because of the inefficient condition that the engine operates at cold temperatures. Despite very low ambient temperature conditions, engines can still reach operating temperature depending on the type and length of use. Reaching operating temperature mitigates the effects that cold temperature operation normally introduces. Unless excessive idling and short trip intervals are constantly employed, the effects of cold temperature operation on engine oil life can be minimized.
Poor Maintenance Procedures
While changing oil is one of the most critical maintenance procedures for a vehicle, all other maintenance procedures involved in a vehicle can positively or negatively affect oil life. Almost every system in a vehicle is somehow connected to the engine, rendering routine vehicle maintenance an important activity for extending engine life. When all of these systems are working optimally, the engine can also work optimally. Examples of the more critical maintenance procedures that affect engine oil life include air filter changes, catalytic converter care, clean fuel supply and injectors, properly maintained radiator and transmission, and proper air pressure in tires. Neglect of any of these components could lead to engine oil problems such

11
as increased water/glycol contamination, high fuel dilution, soot build up, abnormal viscosity, increased soot and TAN, or decreased TBN.
ENGINE PARAMETERS
Advances in modern engine technology have made it possible to record certain vehicle processes, including those of the engine, for analysis. This ability to analyze engine operation and correlate it statistically to oil analysis allows for the creation of a predictive model that can estimate oil change intervals without further assistance of oil analysis procedures. There are two types of engine parameters that are available for study. The first and most important are the dynamic parameters of the engine and the second are the static parameters of the engine.
Dynamic Parameters
Dynamic parameters of an engine refer to parameters that must be recorded on a time frequency basis. These parameters include, but are not limited to, engine speed (RPM), measured torque load, throttle position, vehicle speed, distance travelled, and oil temperature. To accurately record these parameters there must be an active processor in the vehicle capable of data logging. While these parameters are the most complicated to obtain, they are also the most relevant to relating engine oil life to engine operations. The following discussion explains the current accepted standard, as well as the importance of the use of dynamic parameters on oil life prediction.
Current standards produced by automobile manufacturers specify to change engine oil based solely on the amount of miles that are driven. Understanding the information from the previous sections, we realize this method is not the most optimal because it does not consider the engine’s operation (e.g., short or long trip intervals or the amount of idling time). The reason that this method is the current accepted standard is because it is one of the easiest and safest ways for consumers to keep their engines and engine oil clean. Consumers can easily monitor the miles the vehicle is driven between oil changes. The recommended mileage that manufacturers suggest for oil change intervals is based on harsh driving conditions, which are rarely seen by consumers. Yet, this is the minimum in which the oil would need to be changed and, therefore, the safest for the manufacturers to ensure that their engines do not suffer increased failure rates. This, in turn, is a large expense for the consumer. A consumer could use oil for a much longer interval but is instead changing it based on manufacturer recommendations (20). This practice is why we must incorporate other parameters in order to more accurately predict oil change intervals
Of all of these parameters, potentially the most important is the engine speed. In general, the faster the engine speed the more that the oil is circulated and used. Using this parameter, however, suffers the same shortcomings as the method that monitors vehicle mileage. For example, an engine with excessive idling has shorter oil life because of increased fuel dilution (21); but to use engine speed alone would suggest an idling engine has the longest oil life. Therefore, it seems that to correctly assess engine oil life we will need to correlate multiple parameters. This correlation is explained in depth later in this chapter.
Another important parameter to consider is engine oil temperature. The temperature at which oil operates has much to do with the way it degrades. If oil temperatures are not available,

12
approximations can be made using the engine coolant temperature. While this is not a direct measurement of the engine oil temperature, it does provide a good indication of the status of the engine oil (22). We also know that the formation of sludge increases at lower temperatures and the chances of oxidation increase at higher temperatures. This parameter does not allow us to consider the extent to which the oil is moving around the engine, but it does provide very important information about the engine usage.
While the other dynamic parameters may provide us with useful information about engine oil life, understanding them on a singular basis will not give us complete comprehension of the oil life cycle. We must combine these parameters and analyze them as a whole in order to understand the full spectrum.
Static Parameters
Static parameters for an engine include oil capacity, engine size, number of cylinders, compression ratio, and power rating. Theoretically, static parameters do not change over the life of the engine. The parameters could be useful when comparing the oil life across engines of different static parameters (e.g., comparing a 3.2L, 6 cylinder engine to a 5.4L, 8 cylinder engine). However, because these parameters are constant for the life of the engine they cannot be used to develop unique oil change intervals and are not given detailed consideration due to the scope of this study.
CORRELATION OF ENGINE PARAMETERS TO OIL CHANGE INTERVALS
At present, there is very limited published research relating the correlation of engine parameters to oil life on an empirical basis, and this research aims to demonstrate “proof of concept” of this approach. Given the variability in engine operations, even among vehicles of a similar type/class, it is challenging to develop reliable and valid principal equations that link oil and engine parameters. In order to create a beneficial model, extensive data collection and statistical analysis would be required to best fit the data received from the oil analysis to the data collected from the engine.
However, there are vehicle manufacturers who have begun to research this topic because of the potential economic and environmental benefits and for use in on-board oil monitoring systems. One such company is General Motors, who, based on in-house research, has implemented an oil life monitoring system in many of their production vehicles.
In this system, the engine oil temperature is approximated by two different methods. The first method is performed during the warm up mode. It occurs when the engine oil temperature is determined to be less than the operation temperature (~80°C depending on the engine). The warm up mode uses an equation based on a coolant reference temperature and engine speed to calculate the engine oil temperature before assessing a penalty factor. The second method is performed while at operating temperature, and it derives the oil temperature from an equation using the coolant temperature and engine speed (23).
The system is designed to calculate the oil life based on a computer program that correlates the engine oil temperature to the oil degradation levels. This program assigns a certain numerical

13
value (“bank number”), which is programmed in whenever the vehicle oil is replaced. As the engine is used, this value is decreased by an amount dependent on the various factors of engine usage such as engine speed and coolant temperature. These parameters correlate to a “penalty number” that is used to continually reduce/update the “bank number” as engine speed and temperature fluctuate. This value is then used to determine the need for an oil change.
The “penalty number” is assessed as follows: 1) a penalty factor is estimated based on an equation developed by General Motors that estimates engine oil degradation as a function of engine oil temperature. This equation is based on an assumption that the degradation of engine oil demonstrates a parabolic relationship to engine oil temperature, i.e., the degradation rates are very high at extreme high and low temperatures and degradation rates are low at intermediate temperatures. Thus, higher penalty factors are used when the oil is at extreme temperatures (24); 2) after the penalty factor is assessed, the factor is multiplied by the engine speed to obtain the “penalty number.”
The user is notified with a recommendation for an oil change either when the stored (“bank”) number reaches 10 percent of its initial value, or if one year has passed since the previous oil change (23). Once the oil is changed the user can reset the program, the bank number is restored, and the cycle repeats. This method is useful for the consumer as there is no need to track the mileage of the vehicle or usage levels. While other vehicle manufacturers have also implemented similar approaches that are described in other available studies, General Motors’ approach is the most relevant to this study.
SUMMARY
This chapter provided a thorough understanding of engine oil in relation to engine operations, with technical details on engine oil, covering topics such as oil composition, the criteria for replacing oil, its effects on engine operation, and how the engine affects the oil. Following that was a section on the study of engine parameters, and a discussion of parameters that could potentially correlate to oil life/oil analysis parameters in the development of a predictive algorithm. The nature of this topic is such that there is limited research published relating to the correlation of oil quality to engine operating parameters (as many studies related to this topic are proprietary and done by engine manufacturers). Therefore, related topics such as engine oil condition monitoring and engine data parameters, were also covered in the literature review.


15
CHAPTER 3: SELECTION OF TEST VEHICLE CATEGORY
This chapter provides an overview of the TxDOT fleet and fleet management systems, and a study of potential vehicle/equipment types conducted at the initial stages of the research project to identify a vehicle category for study based on parameters such as oil change expenses, vehicle usage, and the availability of appropriate data collection mechanisms. The final selection of equipment was done in discussion with the TxDOT Project Monitoring Committee (PMC).
STUDY OF TXDOT’S FLEET
TxDOT maintains a fleet of over 15,000 pieces of equipment throughout the state of Texas. This fleet includes on-road equipment, such as cars, trucks, and other vehicles, as well as off-road equipment, such as graders, excavators, and other construction equipment. The TxDOT system employs various databases and fleet management programs to keep track of fleet equipment, for scheduling preventive maintenance procedures, and for equipment replacement/retention decision-making. These databases and programs are described below.
Equipment Operating System (EOS) Database
TxDOT has maintained an Equipment Operating System database since 1984, which contains data on many aspects of fleet operation. The EOS database is the primary focus of this project, and it was used for the equipment selection process. The EOS is an extensive database that includes all equipment in the TxDOT fleet, each organized by its class, make, model year, etc. There are over 200 data fields in the EOS database, covering information on the vehicle type, engine characteristics, usage, fuel type and expenses, and the equipment location. In addition, each piece of equipment has record of its maintenance and repair costs for the past 3 years as well as for the entire lifetime. The type of data available in the EOS can be classified as static attributes (e.g., ID number, classification, model year, fuel type, engine horsepower) and dynamic attributes, which vary by year (equipment status, hours of usage, gallons of fuel consumed, etc.). The EOS database therefore provides all the necessary data to base the selection of vehicles for data collection. TxDOT provided the TTI research team access to the 2010 EOS database in text format, along with accompanying data dictionaries and files that explained the database fields, naming conventions, and codes. The research team used Microsoft Excel® to delineate the database file into a spreadsheet format to allow for easy filtering and aggregation of data.
FleetTrackS
FleetTrackS is a system used by TxDOT to keep track of when maintenance is to be performed. FleetTrackS (24) is a programmable software application that can schedule preventive maintenance procedures based on standards set at the state level, with individual districts allowed to make minor modifications. This research project did not directly use FleetTrackS for the equipment selection, but the research team developed a basic understanding of the FleetTrackS system and studied the FleetTrackS training manual and other available material. Currently, the preventive maintenance scheduling recommended in FleetTrackS is based on the data available in the EOS. Since access to the software is only available internally (to TxDOT), the research

16
team participated in an on-site demonstration of FleetTrackS with TxDOT staff in the early stages of the project.
TxDOT Equipment Replacement Model (TERM)
Since 1991, TxDOT has made use of the TxDOT Equipment Replacement Model (25), which is an application that is used for advance identification of equipment that are candidates for replacement. TERM was developed based on a previously completed TxDOT research project (26) and is also the focus of another recently-completed research project (27). TERM is utilized by TxDOT to mathematically determine when it is viable to replace fleet equipment. Future applications of our study findings may have influence on the TERM model, but at this stage of the project, it is not taken into consideration.
SELECTION OF EQUIPMENT CATEGORY FOR DATA COLLECTION
In developing a predictive algorithm that can be used to relate engine use parameters (such as speed and temperature) to engine oil condition (measured by viscosity, total base number, and presence of insolubles), it is desirable to conduct this research on a category of equipment or vehicles that could potentially provide the greatest benefit for TxDOT if oil change intervals could be extended. There are also practicalities such as compatibility with data logging systems, ease of access of equipment units, etc. that are to be taken into consideration for the vehicle selection.
The following criteria were taken into consideration by the research team in making an informed decision about the category of equipment for testing, keeping in mind the initial test plan developed as part of the project proposal:
• A total of 10 units belonging to a single equipment/vehicle category (defined as having the same type of engine) are to be used for data collection.
• Equipment categories that are present in large numbers in the TxDOT fleet, those that have high usage levels (hours/miles of operation) and high maintenance costs (in the form of oil change expenditures) could potentially be the best targets for data collection and algorithm development.
• Proximity to the TTI headquarters in College Station is to be considered, since each of the units requires data and oil samples to be collected from it multiple times on a regular basis.
• The availability of appropriate data logging systems and interfaces, ease of collecting oil samples, etc. also will be taken into account in final vehicle selection.
Identification of General Equipment Classes of Interest
As mentioned previously, the equipment selection process was based on the 2010 EOS database, which contained the static data parameters for each piece of equipment in TxDOT’s fleet, along with the dynamic parameters based on the last 3 years. Figure 2 shows the general layout of the EOS database converted into a spreadsheet.

17
Figure 2. Layout of EoS Database. Using the developed spreadsheet, the equipment was separated into broad general classes that were based on the general equipment type. The actual selection of an equipment category will require further narrowing down of the general class into categories with the same engine type or model. However, the initial sorting of the EOS database led the research team to identify a set of six broad classes of equipment determined by the vehicle class code. These six categories (three each of on-road and off-road types) were identified in conjunction with the TxDOT project director, and represent a major portion of TxDOT’s fleet. Further analysis of the EOS database for the final vehicle selection was performed only among vehicles belonging to these categories, which are as follows:
• On-Road.
o Excavators (EXC). o Graders (GRA). o Loaders (LOA).
• Off-Road.
o Cars (CAR). o Light-Duty/Pickup Trucks (TRU). o Heavy-Duty Trucks (HDT).
After narrowing the study of the EOS database to the six broad categories described above, identification of the specific category of equipment (i.e., those of the same engine type) was performed through the following approach:

18
• Initial classification and filtering based on engine type and average model year. • Study of oil expenditures for the sub-categories identified in the initial classification. • Study of usage of equipment for the sub-categories identified in the initial
classification. • Based on findings from previous steps, take into account final considerations such as
proximity to TTI headquarters, ease of access, and compatibility of data collection systems.
Selection Criteria and Parameters
Based on the approach to vehicle selection described previously, the following parameters were used as the criteria for the final selection of units for data collection:
1. Engine Type and Number of Units.
2. Average Model Year.
3. Total Oil Expense (for specific Engine Type).
4. Average Oil Expense (for specific Engine Type).
5. Total Usage (for specific Engine Type).
6. Average Usage (for specific Engine Type).
7. Location of Equipment.
8. Compatibility/Ease of Access.
Each of these parameters and the methodology for analyzing them are described below.
1. Engine Type and Number of Units
Since this research project makes use of engine operation and engine oil data, the data collection is to be done on equipment that has the same type (or model) of engine in order to develop an algorithm that is generalizable to that particular category of engine. It is logical to assume that the most commonly occurring engine types in the fleet would most likely create the greatest oil cost to the fleet overall. Thus, the general equipment classes were further sorted based on their engines, and categories with the most frequently occurring engines were selected for further screening.
In some instances the same engine may be identified by two different value inputs in the EOS database (e.g., 5.4LV8 and 5.4LV8 O refer to the same engine). In such cases, the numbers occurring for both value inputs were combined as a single category. Also, some of the same value inputs in the EOS database referred to different engines based on fuel type (e.g., the input 6.0L-V8 refers to both the gasoline and diesel versions of the engine). In such cases, researchers separated the engines out by fuel type based on the “MENG-FUEL-TYPE” column in the database and treated them as separate categories.

19
2. Average Model Year
While categorizing the TxDOT fleet equipment by engine type, those engine types that had too many older model year engines (or lacked newer model year engines) were omitted. This restriction was done for two reasons: 1) lack of compatibility with data logging and on-board diagnostics used for data collection, and 2) greater likelihood of older vehicle categories to be used less or be phased out of the fleet. An older model in this case is considered as an engine of model year prior to 2000. To aid in the selection process, an average model year for all units of a specific engine type was developed. This average year allows for the selection of vehicle categories that are newer and, therefore, more likely to have higher usage levels in the future, and to have diagnostic ports for data logging.
3. Total Oil Expense (for Specific Engine Type)
This category simply reflects a summation of the oil expenses (as recorded in the EOS) for all equipment in TxDOT’s fleet featuring the same engine. This step was done using two different time scales: 1) lifetime (i.e., cumulative expenses as recorded in the EOS database), and 2) annual average (based on the past 3 years of data). This distinction allows for understanding of expenditures not only as they stand currently, but also accounting for older vehicles that may be currently phased out (or used less).
However, the oil expense (as contained in the EOS) is not a reflection of all of an equipment unit’s oil changes and costs, but is only the cost of the oil used for topping off and the cost of oil for in-house oil changes at TxDOT. It does not include expenses when oil is changed at a commercial location rather than in-house at TxDOT. The oil expense also does not take into consideration the costs associated with the filters or person-hours/labor costs involved in the oil change.
Thus, the lack of recorded oil expenditures in the EOS database was noted in many cases, often when considering the light-duty and heavy-duty truck categories. For example, for the 5.3L-V8 engine type commonly used in the Chevrolet Silverado, 414 of the 979 vehicles in the fleet with that engine claim no oil expenses over the last three years, despite having logged substantial usage over the 3-year period. These vehicles’ oil was only changed at commercial locations and no top off oil was used from the TxDOT stock between oil changes. The lack of data on oil expenditures occurs less frequently in off-road categories, possibly because the larger off-road vehicles get most of their oil services done in-house. Despite a substantial amount of units with no oil expenditures listed in the database, this parameter was still identified as being relevant to the study. Additionally, equipment usage parameters also were given importance in the selection process in order to not bias the process against vehicles that did not have oil expenditures reported (i.e., had oil changes performed outside of TxDOT).
4. Average Oil Expense (for Specific Engine Type)
This parameter is very similar to the previous parameter, except that it is divided by the number of units under consideration in that category (i.e., to obtain an average expense per unit per year [based on a 3-year average] and average per unit over the lifetime of the equipment). The average results were reported only for units that had recorded expenditures (those with zero expenditures were eliminated), in order to not skew the results based on the equipment category.
20
5. Total Usage (for Specific Engine Type)
This parameter is a summation of the usage of all units in TxDOT’s fleet belonging to a specific engine type category. As with the oil expenditure parameters, the usage was reported over the lifetime of the units (i.e., the cumulative usage as recorded in the EOS) as well as an annual average (based on the previous 3 years). Unlike the oil cost data, usage was recorded for all units in the fleet. The usage is recorded differently between the off-road and on-road units, with on-road usage recorded in miles and usage for off-road categories recorded in hours.
6. Average Usage (for Specific Engine Type)
This parameter is the total usage per engine type category, averaged over the number of units present in the fleet. As with the previous parameters, this one is reported over the lifetime as well as an annual average (based on the previous 3 years’ data).
7. Location of Equipment
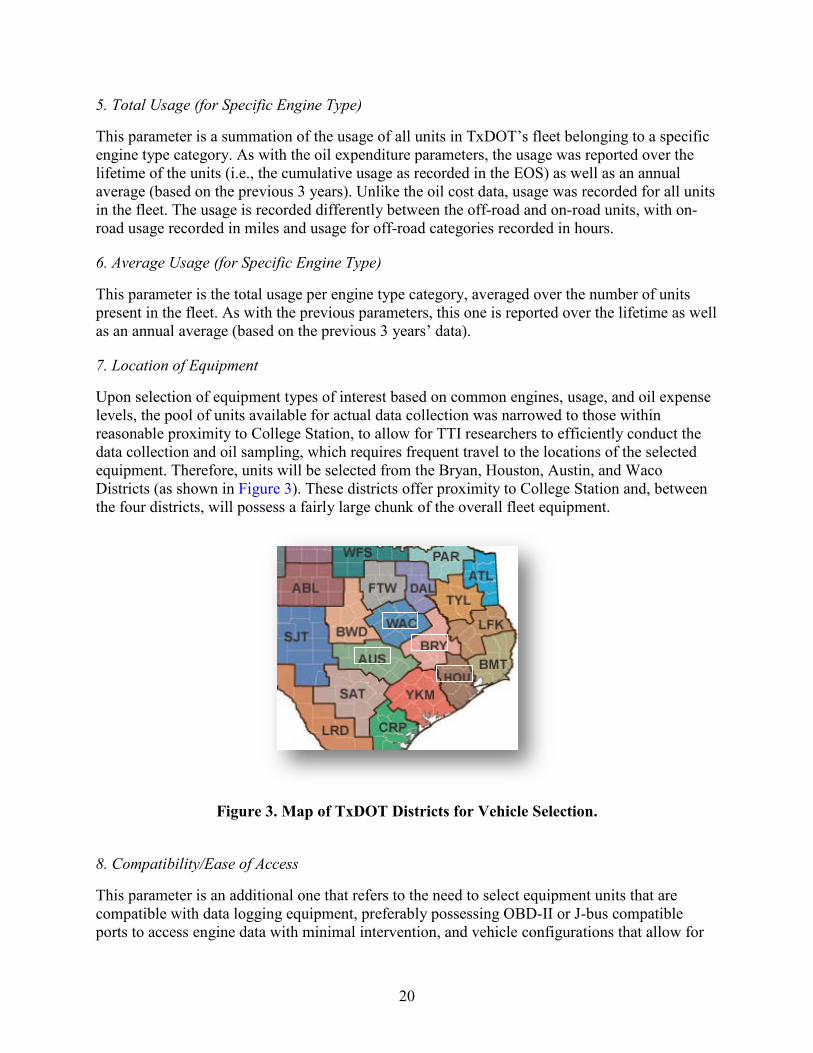
Upon selection of equipment types of interest based on common engines, usage, and oil expense levels, the pool of units available for actual data collection was narrowed to those within reasonable proximity to College Station, to allow for TTI researchers to efficiently conduct the data collection and oil sampling, which requires frequent travel to the locations of the selected equipment. Therefore, units will be selected from the Bryan, Houston, Austin, and Waco Districts (as shown in Figure 3). These districts offer proximity to College Station and, between the four districts, will possess a fairly large chunk of the overall fleet equipment.
Figure 3. Map of TxDOT Districts for Vehicle Selection.
8. Compatibility/Ease of Access
This parameter is an additional one that refers to the need to select equipment units that are compatible with data logging equipment, preferably possessing OBD-II or J-bus compatible ports to access engine data with minimal intervention, and vehicle configurations that allow for

21
ease of oil sampling from the engine. These are minor considerations that were also reflected in the final selection of equipment for data collection.
FLEET ANALYSIS RESULTS
This section presents the results from the analysis of selected parameters described in the previous section. These results only represent the main parameters considered in the final equipment selection, and not all the factors that were taken into consideration by the research team in conjunction with TxDOT. Table 1 through Table 6 represent the parameters as analyzed based on the entire TxDOT fleet, with the results presented separately for on-road and off-road categories.
Table 1. Engine Type Classification and Number of Units – On-Road. Engine Type
Broad Category
Make Typical Model
Number of Units
Average Year
Model
1.5L-I4 CAR Toyota Prius 48 2005 3.1L-V6 CAR Chevrolet Malibu 98 1999 3.5L-V6 CAR Chevrolet Impala 40 2006 5.3L-V8 TRU Chevrolet Silverado 979 2006 5.4L-V8 TRU Ford F150 1,717 2003 6.0L-V8 TRU Ford F350SD 696 2006
MBE-4000 HDT Sterling LT9500 355 2006 3126 HDT GMC C7H042 319 2000
Table 2. Engine Type Classification and Number of Units – Off-Road.
Engine Type
Broad Category
Make Typical Model
Number of Units
Average Year
Model
OM906 EXC Case 621D 44 2006 D7 GRA Volvo
BM G940 20 2008
3116 GRA Caterpillar 120H 54 2001 3126B GRA Caterpillar 120H 88 2005
6BT590 LOA Case 621D 32 2006 V3300T LOA Bobcat S300 68 2004

22
Table 3. Selected Oil Expense Parameters – On-Road.
Engine Type Broad Category
Number of Units
In-House Oil Expenditures* Annual**
Average for All Units
Cumulative*** for All Units
Annual** Average Per
Unit MBE-4000 HDT 355 $39,154 $165,308 $110.29
6.0L-V8 TRU 696 $35,065 $142,882 $50.53 5.4L-V8 TRU 1,717 $32,094 $196,928 $18.69 5.3L-V8 TRU 979 $18,054 $68,625 $18.42
3126 HDT 319 $16,533 $148,428 $51.83 3.1L-V6 CAR 98 $892 $9,400 $9.10 1.5L-I4 CAR 48 $720 $3,095 $15.00 3.5L-V6 CAR 40 $477 $2,090 $19.12
* As recorded in EOS database. ** Values based on the last 3 years of data. *** Total recorded since purchase of unit, till date.
Table 4. Selected Oil Expense Parameters – Off-Road.
Engine Type
Broad Category
Number of Units
In-House Oil Expenditures* Annual**
Average for All Units
Cumulative*** for All Units
Annual** Average Per
Unit 3126B GRA 88 $11,778 $49,637 $133.85 3116 GRA 54 $6,149 $43,083 $113.86
OM906 EXC 44 $4,518 $20,796 $110.92 6BT590 LOA 32 $1,967 $9,225 $61.47 V3300T LOA 68 $1,792 $8,863 $26.35
D7 GRA 20 $1,319 $4,616 $65.93 * As recorded in EOS database. ** Values based on the last 3 years of data. *** Total recorded since purchase of unit, till date.

23
Table 5. Selected Usage Parameters – On-Road. Engine Type Broad
Category Number of Units
Annual Average for All Units*
(miles)
Annual Average Per
Unit* (miles)
5.4L-V8 TRU 1,717 21,587,168 12,573 5.3L-V8 TRU 979 14,669,159 14,969 6.0L-V8 TRU 696 10,536,570 15,182
MBE-4000 HDT 355 3,917,887 11,036 3126 HDT 319 1,984,293 6,220
3.1L-V6 CAR 98 592,150 6,042 1.5L-I4 CAR 48 567,373 11,820 3.5L-V6 CAR 40 510,098 12,752
* Values based on the last 3 years of data.
Table 6. Selected Usage Parameters – Off-Road. Engine Type
Broad Category
Number of Units
Annual Average for All Units*
(hours)
Annual Average Per
Unit* (hours)
3126B GRA 88 37,037 421 3116 GRA 54 22,478 416
OM906 EXC 44 14,392 369 6BT590 LOA 32 11,674 365 V3300T LOA 68 9,528 309
D7 GRA 20 6,176 140 * Values based on the last 3 years of data.
Recommended Equipment Categories Based on Analysis Results
Based on the findings from the previous section, four engine type/equipment categories (two each from on-road and off-road types) were identified as being consistently among the highest in terms of number of units, usage, and recorded oil expenses. These types and categories were, in order of priority:
1. MBE-4000 engine (typically found in Sterling Dump Truck).
2. 6.0L-V8 engine (typically found in Ford F350 Truck).
3. 3126B Engine Caterpillar Grader.
4. 3116 Engine Caterpillar Grader.

24
MBE-4000
This engine is typically used in a Sterling LT9500 with an average year model of 2006. This engine is normally used in a large dump truck or tandem axle truck tractor rig. This vehicle incurs the highest total oil expenses per year compared to any other engine. Its average oil expense per vehicle is the highest of the on-road vehicles and higher than many of the off-road vehicles. The usage of this vehicle is only less than highly used light-duty vehicles. Because it is a large diesel engine, each oil change is a significant cost to TxDOT. All of these parameters make this engine a very good candidate.
6.0L-V8
This engine is commonly used in Ford F250, F350, and F450 pickup trucks with an average year model of 2006. Its average oil expense total per year and average vehicle oil expense per year is second only to the MBE-4000. This vehicle is also a diesel engine, which requires significantly more oil per change than other light-duty vehicles. There are 696 vehicles that use this engine in the TxDOT fleet, making the economic benefits of studying this vehicle more advantageous.
3126B
This engine is commonly used in Caterpillar 120H graders with an average year model of 2005. This vehicle is the top of every parameter among off-road units. This engine is also the most common of any of the off-road engines with 88 units in the TxDOT fleet.
3116
Similar to the 3126B, this engine is used in Caterpillar 120H graders as well. This category has an average year model of 2001. This engine is second only to the 3126B in every category amongst the off-road vehicles, and there are 54 units with this engine in the TxDOT fleet.
Units Available in Desired Districts
The next step for the equipment selection is locating the units that are within proximity to College Station, and the pool of those potential test units is summarized in Table 7 for all vehicle categories. Additional analysis was performed to confirm that the units’ average model year and characteristics were reflective of those in the overall TxDOT fleet, and it was found that the units in every district maintained an average model year that was within 1 year of the overall fleet model year for that type of unit.
Table 7. Available Units in Waco, Houston, Austin, and Bryan Districts.
Engine Typical Vehicle/Equipment Waco Houston Austin Bryan Total
MBE-4000 Sterling Dump Truck 26 13 9 18 66 6.0L-V8 Ford F350 Truck 31 88 37 10 166 3126B Caterpillar Grader 8 6 2 0 16 3116 Caterpillar Grader 0 0 1 0 1

25
Final Selection
From the analysis presented in this chapter, the research team, in discussion with TxDOT, decided on the MBE-4000 engine (Sterling dump truck) for the data collection (shown in Figure 4).
Figure 4. Sterling Dump Truck with MBE-4000 Engine.
Initially, the research team had envisioned that an off-road equipment type could be the preferred equipment for the research owing to larger volumes of engine oil/greater cost of oil change. However, the MBE-4000 has an oil capacity of 35 liters, which is greater than the high-use off-road category engines, such as the 3126B (Caterpillar grader) engine, which has a capacity of 29.5 liters. Additionally, the MBE-4000 units experience high usage and are present in greater numbers in TxDOT’s fleet, and therefore have the potential for higher economic impact/savings. Also, the MBE-4000 is a relatively new engine that should see many years of use in the TxDOT fleet. The MBE-4000 engine is also equipped with J-bus ports that would allow for the recording of on-board diagnostic/engine data using commercially available data loggers (as discussed in the next chapter).


27
CHAPTER 4: DATA COLLECTION SETUP AND METHODOLOGY
This chapter discusses the selection of specific test vehicles from among the major category identified in the previous chapter, and also provides an overview of data collection procedures and test methodologies employed for the collection of oil and engine data.
SELECTION OF SPECIFIC TEST VEHICLES
As discussed in Chapter 3, it was determined that the vehicle category of interest to this research is a Sterling LT9500 dump truck that features an MBE-4000 Mercedes diesel engine. TTI researchers implemented a random selection process to select 10 units from the available pool of vehicles, after placing constraints by vehicle age and location, to include either two or three vehicles from each of the four TxDOT districts (Waco, Houston, Austin, and Bryan). One additional vehicle was also identified in each district, to be used as a reserve/contingency vehicle, in the event that one of the originally selected vehicles could not be used. Table 8 lists the 10 vehicles identified for testing, and Table 9 lists the “reserve” vehicles for each district.
Table 8. Selected Vehicles for Testing (Equipped with MBE-4000 Engine).
Equipment Number
District Code and District
County Code and County
Vehicle Make
Vehicle Model
Model Year
04476J 09 – Waco 161 – McLennan Sterling LT9500 2007
05251H 09 – Waco 74 – Falls Sterling LT9500 2004 04475J 09 – Waco 147 – Limestone Sterling LT9500 2007 04255J 12 – Houston 102 – Harris Sterling LT9500 2007 05578H 12 – Houston 170 – Montgomery Sterling LT9500 2004 04238J 14 – Austin 144 – Lee Sterling LT9500 2006 05249H 14 – Austin 227 – Travis Sterling LT9500 2004 03366J 14 – Austin 227 – Travis Sterling LT9500 2005 04483J 17 – Bryan 239 – Washington Sterling LT9500 2007 03477J 17 – Bryan 145 – Leon Sterling LT9500 2005
Table 9. Reserve Vehicles for Contingency Use (Equipped with MBE-4000 Engine).
Equipment Number
District Code and District
County Code and County
Vehicle Make
Vehicle Model
Model Year
05252H 09 – Waco 161 – McLennan Sterling LT9500 2004 04253J 12 – Houston 102 – Harris Sterling LT9500 2006 04239J 14 – Austin 144 – Lee Sterling LT9500 2006 04840H 17 – Bryan 21 – Brazos Sterling LT9511 2003
DATA COLLECTION TOOLS AND PROCESSES
As discussed previously, the data collection process consists of two major components: engine data logging and the oil sample extraction. The data collection plan was developed to minimize

28
interference with the regular operations of TxDOT’s fleet, and to ensure that the data collected were representative of vehicles under normal operation.
Engine Data Logging
Through discussions with the engine manufacturer, the chassis manufacturer, and TxDOT, it was confirmed that the test vehicles conformed to Society of Automotive Engineers (SAE) J1939 protocol (28) and contained a J1939 data port and connector. The J1939 data port is the standard data port for newer model heavy-duty on-road vehicles and provides output data compatible with the protocol. A commercially available data logger (Caflor IOSiX Logger) was selected for use in data collection, due to the compatibility with the J1939 protocol and the availability of appropriate connectors to log the vehicle’s engine data. The data logger is capable of logging a range of parameters, which include parameters such as engine speed (RPM), engine load, vehicle speed, distance traveled, oil temperature, coolant temperature, etc.
Figure 5 shows the data logger deployed among the test vehicles. As seen in the figure, it is a small device, and will be connected to the diagnostic port inside the vehicle cab. The data logger has the capacity to log up to 20,000 hours of operation on a removable SD card, and is automatically powered on whenever the vehicle engine is in operation. The collected data will either be transferred to a laptop computer by means of a USB cord (on site), or the SD card will be removed from the logger (for downloading data later) and replaced with an empty card.
Figure 5. Caflor IOSiX Data Logger. The data stored by the logger needed to be converted into a format that is readable by software packages that will be used for the data analysis. After considering the available options, including the purchase of software for extracting data saved by the data logger, it was determined that the best option was for TTI researchers to develop a program in-house for this purpose, as it allowed flexibility in selecting the parameters to be extracted from the data logger, and to enable the research team to better understand the data’s characteristics. TTI researchers, therefore, developed a Microsoft Windows®-based software application that could extract the data saved by the data logger (i.e., to convert the hexadecimal format data into comma separated variable [CSV] format). This program was later integrated into the spreadsheet-based analysis tool that was developed as product 0-6626-P1 from this research.

29
Oil Sample Collection and Analysis
The oil parameters shown in Table 10 were identified by the research team as being likely determinants of oil life, based on findings from the literature review as well as further discussions with laboratories and testing facilities experienced in conducting such analyses. Table 10 also lists the corresponding ASTM standards for the tests, where applicable. Polaris Laboratories in Houston, Texas, was selected to provide the oil sample analysis, based on the pricing of their services and their ability to meet the technical specifications of the testing.
Table 10. Oil Parameters and Applicable Test Standards. Parameter Standard Number Standard/Test Name
Viscosity Modified ASTM D445
Standard Test Method for Kinematic Viscosity of Transparent and Opaque Liquids
Oxidation ASTM E2412
Standard Practice for Condition Monitoring of Used Lubricants by Trend Analysis Using Fourier Transform Infrared (FT-IR) Spectrometry Nitration
Total Acid Number
Modified ASTM D664
Standard Test Method for Acid Number of Petroleum Products by Potentiometric Titration
Total Base Number
Modified ASTM D4739
Standard Test Method for Base Number Determination by Potentiometric Hydrochloric Acid Titration
Wear Metals Modified ASTM D5185
Standard Test Method for Determination of Additive Elements, Wear Metals, and Contaminants in Used Lubricating Oils and Determination of Selected Elements in Base Oils by Inductively Coupled Plasma Atomic Emission Spectrometry (ICP-AES)
Soot ASTM E2412 Standard Practice for Condition Monitoring of Used Lubricants by Trend Analysis Using Fourier Transform Infrared (FT-IR) Spectrometry
Fuel Dilution - Fuel Dilution by Gas Chromatography Oil sample collection was performed by extracting the oil via the engine oil dipstick, on a warmed-up engine to ensure adequate mixing of oil. The extraction was done using a hand operated vacuum pump. The extraction process removes a very small amount of engine oil (approximately 100 ml), a quantity that will not affect engine performance. This method of oil sample extraction was determined to be the optimal method by the research team, when compared to extracting a sample from the oil sump, which could result in contamination and loss of oil and also poses a safety concern with the need for very warm oil. All samples were pulled from the same level in a warm engine, due to which sediments settled at the bottom also would not be picked up in the analysis. To confirm the representativeness of the oil sampling procedure employed with the other viable option of sampling from the engine drain plug, a statistical test (t-test) was conducted for multiple samples. The findings showed no statistically significant differences between the oil samples obtained from the dipstick and drain plug methods for one of the test vehicles.

30
IMPLEMENTATION OF DATA COLLECTION
Prior to starting the deployment of the data loggers the TTI research team tested the data logger and oil sampling procedure on a heavy-duty vehicle owned by TTI to ensure that all the data collection operations moved forward smoothly. The deployment for the TxDOT fleet vehicles was then initiated, starting with unit 4483J in Brenham, Texas. For each vehicle, a Preliminary Vehicle Information Sheet and an Oil Event Log Sheet were created to record important vehicle information and to track any maintenance that may be performed on the oil during the study (see Appendix A). The TTI research team consulted with the TxDOT project director in developing these forms. The “Preliminary Vehicle Information Sheet” was to be filled in prior to data collection, and it includes information about the vehicle’s most recent oil change, the type of oil used, etc. The “Oil Event Log Sheet” was to be maintained in the vehicle and filled in each time an oil change or top off was conducted after the data collection begins.
During the implementation of the engine data logger on unit 4483J it was discovered that an additional data link would be required on some vehicles due to a discrepancy in schematics provided by the vehicle manufacturer. When doing the initial installation, it was discovered that the selected vehicles actually communicate using an older protocol, J1807/1587, instead of J1939. The vehicles were capable of transmitting data per the J1939 protocol, but it would require an additional data link to be installed connecting to the vehicle control unit (VCU) on each vehicle. In order to complete the installation, each vehicle that used communication with the older protocol required two twisted wires, with 120 ohm resistors on each end, to be connected between the VCU and the vehicle interface harness. Once the connection was made between the proper terminals, the vehicle was able to communicate with the data loggers using the J1939 protocol, and the data collection was able to proceed as planned. Appendix B contains more information on the procedure for installing the additional data link.
During the initial installation of the data loggers, the research team collected an oil sample for analysis to establish the baseline oil conditions. Afterward, oil sample analysis and corresponding engine data collection was performed for each vehicle on roughly a bi-weekly basis, with scheduling changes made on a case-by-case basis to account for vehicle availability, vehicle usage, vehicle maintenance and other operational constraints. The research team worked with TxDOT staff to ensure that the oil samples were extracted during operator breaks or immediately at the end of the day’s service to ensure that the engine temperature was maintained while reducing interference with the vehicle’s regular operations.
The data collection activities were initiated in July 2011 and continued through October 2012, during which time the vehicles underwent regular fleet operations and had usual oil changes and preventive maintenance practices administered. While a total of 10 trucks were selected for deployment, two data loggers going missing during the data collection process resulted in data from only eight trucks being used for the final results and analysis (with approval from the TxDOT PMC). As discussed further in the following chapters, preliminary findings from the data analysis indicated low levels of oil degradation, due to which oil change intervals were then extended in selected vehicles after discussion with TxDOT.
31
CHAPTER 5: DATA ANALYSIS AND DEVELOPMENT OF PREDICTIVE ALGORITHM
As explained in previous chapters, the data collected as part of this project included oil analysis data and engine operation data. The oil sample analysis results (for the relevant tests identified in Table 10 in the previous chapter) were provided to the research team in the form of reports from the laboratory, which were then maintained in spreadsheet-based logs that were updated with results for each sample for the same vehicle. The engine data (saved on SD card readers via data loggers) required the development of a software application in order to extract the data saved by the data logger (i.e., to convert the hexadecimal format data into CSV format). Appendix C provides an overview of the software application developed by the research team, which was later integrated into the spreadsheet-based analysis tool that was developed as product 0-6626-P1 from this research. The final processed data collected was compiled into a single spreadsheet in JMP® for analysis to be performed. JMP is a statistical analysis software package that is capable of handling the large spreadsheets of data used in this project.
The research team developed a procedure for analyzing engine and oil data in a multiple step procedure that takes raw engine data and summarizes it in a simplified Excel chart that can be analyzed by statistical methods to create a single data line for each interval. In addition, oil analysis results were entered into the database and matched with engine data for the corresponding interval. At this point the combined engine and oil data can be statistically studied using regression curve fitting, correlation studies, and interrelationships among the variables. During the data collection task, the researchers observed from preliminary data results that the oil analysis results did not show much oil degradation. This issue was discussed with TxDOT, and TxDOT allowed the research team to extend the oil change intervals on selected units above the standard 10,000 mile oil change interval. The relatively low levels of oil degradation observed can be attributed to the extended idle and low-load operations observed, as discussed in the next section of the report.
OIL DATA AND ENGINE DATA ANALYSIS RESULTS
Engine Data Analysis Results
In this study, a vehicle is considered to have extended idling operations when it spends more than 50 percent of its engine run time at idle speeds. It was observed that all study vehicles exhibited extended idling operations. Mercedes states that the MBE-4000 engine is considered to be at idle when its engine speed is between 600–850 revolutions per minute. Figure 6 is a histogram showing the cumulative distribution of engine speeds for all the vehicles, and it shows that the vehicles spend a large amount of time idling between 600–700 RPM. Researchers found that the average engine spent 62 percent of run time at idle speeds, which amounts to 40 percent of all engine revolutions being at idle speeds. Engine revolutions as well as engine run time are important factors, as engine oil is worked on fewer times per second at lower engine speeds than at higher ones. Appendix D contains similar graphs of engine speed distributions for individual vehicles. As seen from the results, engine speed distributions and percent idle run time were comparable for each vehicle, confirming that all the vehicles operate in a similar fashion.

32
Figure 6. Histogram Showing Distribution of Engine Speed.
In addition to an extended idle condition, another factor to consider that may influence oil degradation is whether the vehicles also exhibit low load conditions at idle. The test vehicles are capable of using the engine to power external vehicle accessories that are needed on a job site. Also, the nature of a diesel engine is such that it uses low revolutions to create significant amounts of torque. This means that the engine could be under a significant load while still being in the range of idle speeds. Low load condition for this study is defined as a vehicle that spends over 80 percent of its idle time at a load of 10 percent or less. Data showed that 97 percent of idle time was spent at a load of less than 10 percent, and in Figure 7 we see that most of the idle time is spent in the 5–10 percent range. Table 11 also shows that each vehicle individually exceeds the requirement of an 80 percent low load at idle. These results show that the vehicles under study can be considered to have extended idle, low load operations. Figure 8 shows the distribution of vehicle speeds and shows that vehicles in this study spent 64 percent of run time at speeds under 5 km/h (3.1 mi/h).
Engine Speed (rev/min)
%R
unTi
me
0 500 1000 1500 2000 25000
10
20
30
40
50
60
70
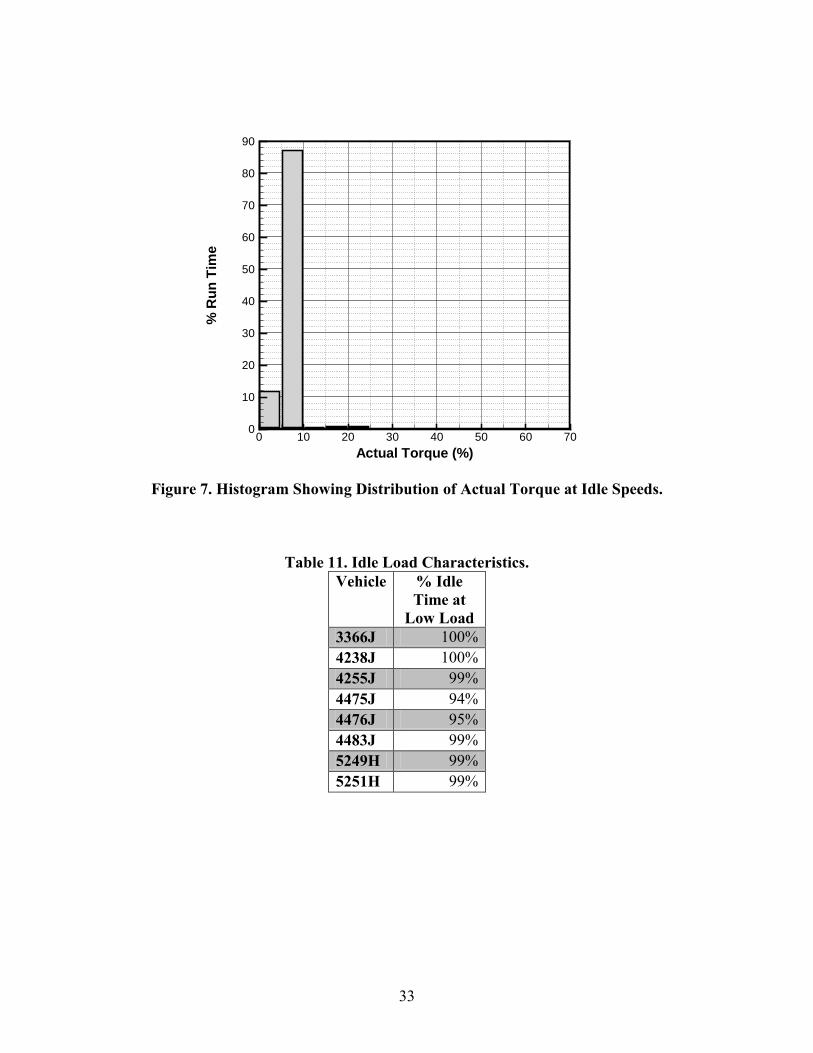
33
Figure 7. Histogram Showing Distribution of Actual Torque at Idle Speeds.
Table 11. Idle Load Characteristics. Vehicle % Idle
Time at Low Load
3366J 100% 4238J 100% 4255J 99% 4475J 94% 4476J 95% 4483J 99% 5249H 99% 5251H 99%
Actual Torque (%)
%R
unTi
me
0 10 20 30 40 50 60 700
10
20
30
40
50
60
70
80
90

34
Figure 8. Vehicle Speed by Percent Run Time.
In the literature review it was noted that oil colder than 45°C can create sludge, and oil hotter than 135°C can cause rapid oxidation in oil. It has also been shown that oil temperatures between 70°C and 130°C are generally considered to be optimal. We can see in Figure 9 (distribution of oil temperatures for total run time, for idle operations and all operations) that oil temperatures were in this range about 89 percent of the time. Investigation of engine oil temperature at idle condition indicates that oil temperatures fall within this range 85 percent of the time. This helps us to understand why engine oil has degraded slowly with extended idling. In Figure 9 we also see that idle conditions account for nearly all oil temperatures below 65°C. Additionally, Figure 10 shows the distribution of observed coolant temperatures.
Wheel Based Vehicle Speed (km/h)
%R
unTi
me
0 20 40 60 80 100 1200
10
20
30
40
50
60
70

35
Figure 9. Oil Temperature Distribution.
Figure 10. Coolant Temperature Distribution.
In addition to temperature, pressure is also a potential factor in engine oil degradation. For vehicles in this study, oil spent most of its time between 100–160 kPa (14.5–23 psi) gage pressures (Figure 11). Investigation of engine oil pressure at idle condition shows that the
Engine Oil Temperature (°C)
%R
unTi
me
0 10 20 30 40 50 60 70 80 90 100 1100
10
20
30
40
50
60
70AllIdle
Engine Coolant Temperature (°C)
%R
unTi
me
0 10 20 30 40 50 60 70 80 90 1000
10
20
30
40
50
60
70

36
average pressure at idle is 155 kPa. The MBE-4000 Operator’s Manual (29) states that the minimum acceptable pressure at idle conditions is 50 kPa (7 psi).
Figure 11. Engine Oil Pressure Percent Run Time.
Oil Data Analysis Results
To provide the basis for comparison of oil parameters across vehicles, all the graphs presented in this section are with respect to “lube mileage,” defined by the number of miles a vehicle has travelled since its last oil change at the time the sample was taken. In this way, we can locate trends more easily. Even though each oil type is labeled as 15W-40, their base viscosities differ slightly and they also use different additive packages. Therefore, separate graphs are provided for the two types of oil used.
Six of the vehicles in this study used Nature’s Choice CJ4 15W-40 re-refined oil, and the other two used Goldenwest Heavy Duty 15W-40 oil, which is a blend of re-refined and virgin engine oil. It was discussed in the literature review that re-refined oil does not result in performance differences when compared to virgin oil. Table 12 shows the specifications of engine oils used by the test vehicles.
Engine Oil Pressure (kPa)
%R
unTi
me
0 100 200 300 400 5000
10
20
30
40
50
60
70All Operating RangesIdle Conditions
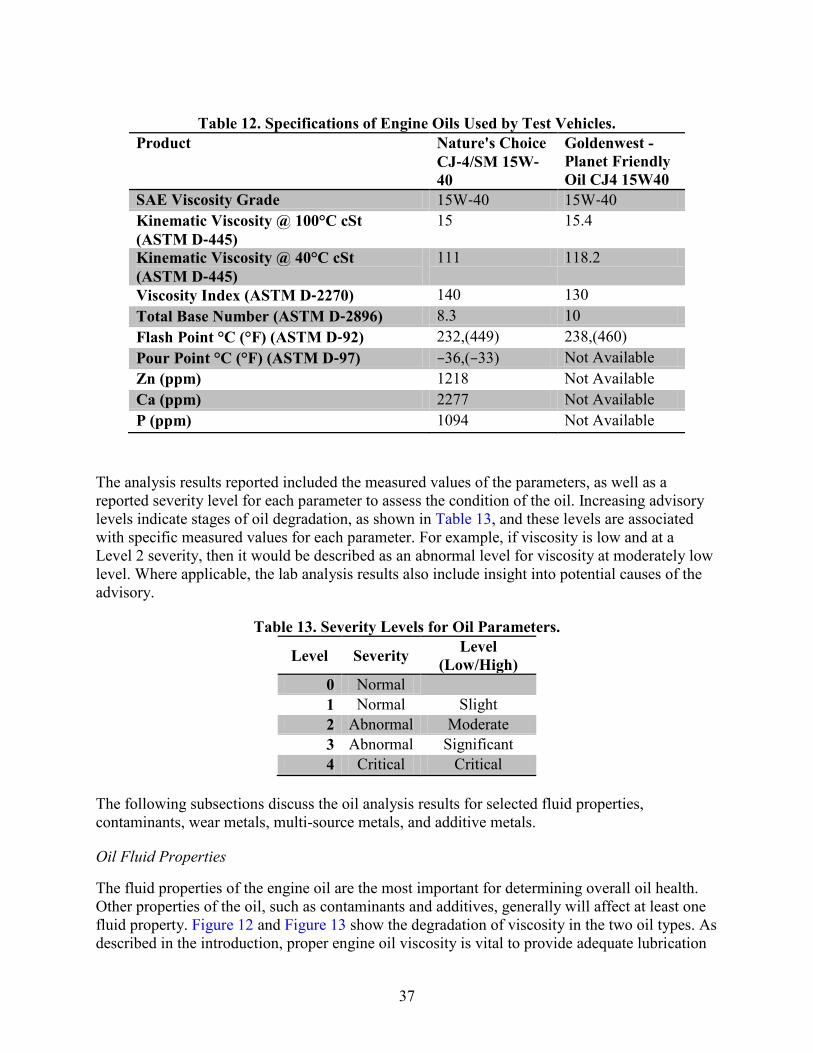
37
Table 12. Specifications of Engine Oils Used by Test Vehicles.
Product Nature's Choice CJ‐4/SM 15W‐40
Goldenwest - Planet Friendly Oil CJ4 15W40
SAE Viscosity Grade 15W‐40 15W‐40 Kinematic Viscosity @ 100°C cSt (ASTM D‐445)
15 15.4
Kinematic Viscosity @ 40°C cSt (ASTM D‐445)
111 118.2
Viscosity Index (ASTM D‐2270) 140 130 Total Base Number (ASTM D‐2896) 8.3 10 Flash Point °C (°F) (ASTM D‐92) 232,(449) 238,(460) Pour Point °C (°F) (ASTM D‐97) –36,(–33) Not Available Zn (ppm) 1218 Not Available Ca (ppm) 2277 Not Available P (ppm) 1094 Not Available
The analysis results reported included the measured values of the parameters, as well as a reported severity level for each parameter to assess the condition of the oil. Increasing advisory levels indicate stages of oil degradation, as shown in Table 13, and these levels are associated with specific measured values for each parameter. For example, if viscosity is low and at a Level 2 severity, then it would be described as an abnormal level for viscosity at moderately low level. Where applicable, the lab analysis results also include insight into potential causes of the advisory.
Table 13. Severity Levels for Oil Parameters.
Level Severity Level (Low/High)
0 Normal 1 Normal Slight 2 Abnormal Moderate 3 Abnormal Significant 4 Critical Critical
The following subsections discuss the oil analysis results for selected fluid properties, contaminants, wear metals, multi-source metals, and additive metals.
Oil Fluid Properties
The fluid properties of the engine oil are the most important for determining overall oil health. Other properties of the oil, such as contaminants and additives, generally will affect at least one fluid property. Figure 12 and Figure 13 show the degradation of viscosity in the two oil types. As described in the introduction, proper engine oil viscosity is vital to provide adequate lubrication
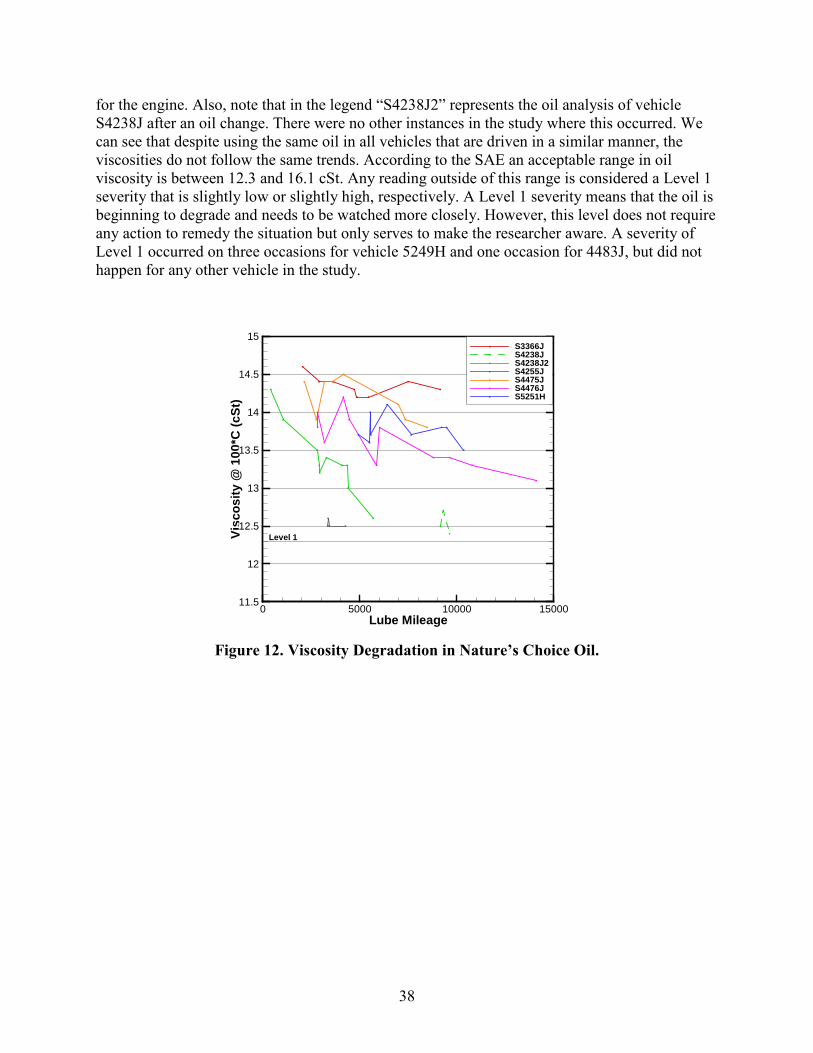
38
for the engine. Also, note that in the legend “S4238J2” represents the oil analysis of vehicle S4238J after an oil change. There were no other instances in the study where this occurred. We can see that despite using the same oil in all vehicles that are driven in a similar manner, the viscosities do not follow the same trends. According to the SAE an acceptable range in oil viscosity is between 12.3 and 16.1 cSt. Any reading outside of this range is considered a Level 1 severity that is slightly low or slightly high, respectively. A Level 1 severity means that the oil is beginning to degrade and needs to be watched more closely. However, this level does not require any action to remedy the situation but only serves to make the researcher aware. A severity of Level 1 occurred on three occasions for vehicle 5249H and one occasion for 4483J, but did not happen for any other vehicle in the study.
Figure 12. Viscosity Degradation in Nature’s Choice Oil.
Lube Mileage
Visc
osity
@10
0*C
(cSt
)
0 5000 10000 1500011.5
12
12.5
13
13.5
14
14.5
15S3366JS4238JS4238J2S4255JS4475JS4476JS5251H
Level 1

39
Figure 13. Viscosity Degradation in Goldenwest Oil.
Another parameter that showed a degradation trend is total base number, a measurement of all basic components (components with a pH greater than 7) present within oil. More simply, it is the measure of degradation of basic components in oil. In Figure 14 and Figure 15 we see that TBN does show a negative trend in both oils as mileage increases. This trend shows that the additives in the oil are working to control acidic components to the oil. Total acid number levels are not trending positively and, therefore, we can assume that the additives are sufficient to control the acidic components. The advisory levels/severity levels for TBN are shown in Table 14. The Level 1, 2, 3, and 4 severities are reached when the base value reaches 50 percent, 43 percent, 35 percent, and less than 25 percent of the base value, respectively. A sample of new oil was provided to Polaris Laboratories in order to determine the base level for TBN. The values recorded were 8.30 and 8.53 mg KOH/g for Nature’s Choice and Goldenwest, respectively. We see that the TBN for all the oil samples did not reach a Level 1 advisory.
Table 14. Total Base Number Advisory Levels. Total Base Number Advisory
Nature’s Choice
(mg KOH/g)
Goldenwest (mg
KOH/g) Base 8.30 8.53
1 4.15 4.27 2 3.57 3.67 3 2.91 2.99 4 <2.08 <2.13
Lube Mileage
Visc
osity
@10
0*C
(cSt
)
0 5000 10000 1500011.5
12
12.5
13
13.5
14
14.5
15S4483JS5249H
Level 1
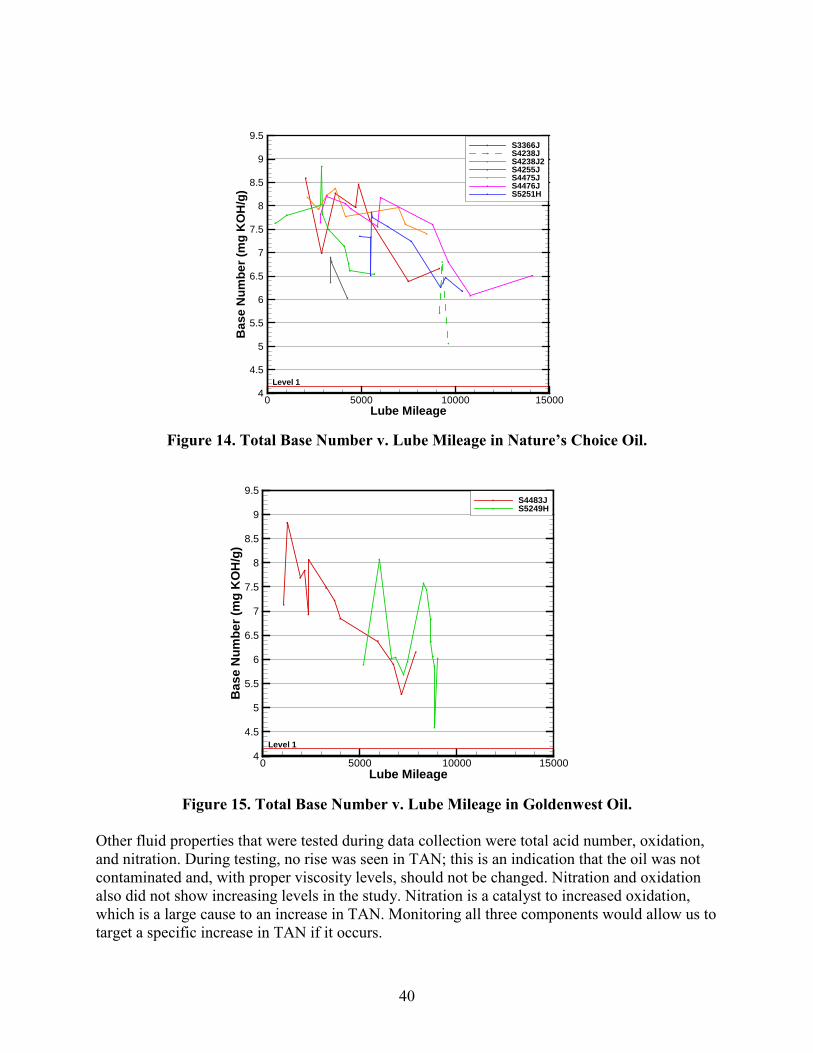
40
Figure 14. Total Base Number v. Lube Mileage in Nature’s Choice Oil.
Figure 15. Total Base Number v. Lube Mileage in Goldenwest Oil.
Other fluid properties that were tested during data collection were total acid number, oxidation, and nitration. During testing, no rise was seen in TAN; this is an indication that the oil was not contaminated and, with proper viscosity levels, should not be changed. Nitration and oxidation also did not show increasing levels in the study. Nitration is a catalyst to increased oxidation, which is a large cause to an increase in TAN. Monitoring all three components would allow us to target a specific increase in TAN if it occurs.
Lube Mileage
Bas
eN
umbe
r(m
gK
OH
/g)
0 5000 10000 150004
4.5
5
5.5
6
6.5
7
7.5
8
8.5
9
9.5S3366JS4238JS4238J2S4255JS4475JS4476JS5251H
Level 1
Lube Mileage
Bas
eN
umbe
r(m
gK
OH
/g)
0 5000 10000 150004
4.5
5
5.5
6
6.5
7
7.5
8
8.5
9
9.5S4483JS5249H
Level 1

41
Oil Contaminants
Contaminants can enter an oil system because of piston blow-by, or faulty gaskets and seals on the engine. Non-metal contaminants discussed in this section include water, fuel, and soot, and metal contaminants are considered to be silicon, sodium, and potassium. Non-metal contaminants will affect viscosity and decrease the vehicle’s ability to properly lubricate. A non-metal contaminant is measured by its percentage of volume in the sample. Contaminants are introduced to the oil system from an external source, and a summary of observations from the contaminant data is shown below:
• For the study samples, water was always measured to be less than 0.1 percent of the volume of the sample.
• Fuel dilution reached a Level 1 severity during testing (seen in Figure 16 and Figure 17), but it never reached an abnormal severity. An inverse relationship was seen between viscosity and fuel dilution. In areas of a sharp increase or decrease in fuel dilution there was a larger decrease or increase in viscosity than the overall trend.
• Soot levels for the study never reached Level 1 severity for the duration of the study, but they did increase as lube mileage increased.
• Silicon and sodium show insignificant concentrations that were less than one-third of the concentration needed for Level 1 severity.
• Potassium reached a Level 1 severity on two vehicles. Two possible sources are from the environment or engine break in.
Figure 16. Fuel Dilution v. Lube Mileage in Nature’s Choice Oil.
Lube Mileage
Fuel
Dilu
tion
(%Vo
l)
0 5000 10000 150000
0.5
1
1.5
2
2.5
3
3.5
4
4.5
5
5.5S3366JS4238JS4238J2S4255JS4475JS4476JS5251H
Level 2
Level 1

42
Figure 17. Fuel Dilution v. Lube Mileage in Goldenwest Oil.
Wear Metals
Elemental analysis was conducted using an inductively coupled plasma spectrometer by the third party laboratory to record the concentration of 10 wear metals that are commonly present in motor oils. This elemental analysis also detects contaminant metals, multi-source metals, and additive metals for a total of 24 metals that are recorded for the study. Iron is the most abundant metal in engines. As a result, this wear metal has shown the highest concentrations in oil analysis reports. It is expected for oil to accumulate iron over the course of its life. In the oil analysis, a Level 1 severity is when iron reaches a level of 57 ppm. Vehicles 4255J and 4483J show levels of iron that are not consistent with the other vehicles, but are still within an acceptable range. Figure 18 and Figure 19 show iron levels as lube mileage increases.
Lube Mileage
Fuel
Dilu
tion
(%Vo
l)
0 5000 10000 150000
0.5
1
1.5
2
2.5
3
3.5
4
4.5
5
5.5S4483JS5249HLevel 2
Level 1

43
Figure 18. Iron v. Lube Mileage in Nature’s Choice Oil.
Figure 19. Iron v. Lube Mileage in Goldenwest Oil.
Aluminum is the second most abundant metal found in the oil analysis, and the preliminary observed data for aluminum are shown in Figure 20 and Figure 21. There were four instances where a Level 1 severity occurred. These instances occurred in all four oil samples for S4255J. Over the course of the study, these levels did not escalate to anything more significant and no other vehicle approached these levels. We expect aluminum levels to be lower because there are
Lube Mileage
Iron
(ppm
)
0 5000 10000 150000
5
10
15
20
25
30
35
40
45
50
55
60S3366JS4238JS4238J2S4255JS4475JS4476JS5251H
Level 1
Lube Mileage
Iron
(ppm
)
0 5000 10000 150000
5
10
15
20
25
30
35
40
45
50
55
60S4483JS5249H
Level 1

44
fewer parts in the engine made of aluminum compared to iron. It is interesting to note the overall trend in aluminum and potassium is visually similar to the trend that is seen with iron. It is understandable that the levels of iron and aluminum trend in the same way because they are the most abundant metals in the engine. As oil ages, it will begin to accumulate more wear metals as the oil filter becomes less efficient and more oil is bypassed around it. However, it is odd to see the levels of potassium mimic the trends of iron and aluminum. Potassium is present in protective coatings over new bearings. It may be possible that all of the engines have not completely lost their protective coatings, and as there is more wear of iron and aluminum, more potassium also is released.
Figure 20. Aluminum v. Lube Mileage in Nature’s Choice Oil.
Lube Mileage
Alum
inum
(ppm
)
0 5000 10000 150000
5
10
15
20
25S3366JS4238JS4238J2S4255JS4475JS4476JS5251H
Level 1

45
Figure 21. Aluminum v. Lube Mileage in Goldenwest Oil.
The remaining eight wear metals show similar results to what has already been discussed for iron and aluminum. Copper increased slightly as lube mileage increased, but never higher than one-third of a Level 1 severity. Lead and chromium showed up to 2 ppm concentration at various lube mileage levels, and nickel, tin, cadmium, silver, and vanadium were absent from the oil during the study.
Multi-Source Metals
As the name implies, multi-source metals may be from an additive or may get introduced as contaminants. It is possible that a manufacturer may use a very fine metal as an additive, but a contaminant may be a larger size that could harm the engine. The metals labeled as multi-source are titanium, molybdenum, antimony, manganese, lithium, and boron. Goldenwest oil utilized boron and molybdenum in its additive package, while Nature’s Choice did not. Nature’s Choice vehicles tested molybdenum, as a contaminant, at a concentration of 1 ppm in one test and up to 5 ppm of boron, also as a contaminant. Some observations regarding data on multi-source metals are shown below:
• As a contaminant in Nature’s Choice, molybdenum tested at 1 ppm in one test. • As a contaminant in Nature’s Choice, boron tested up to 5 ppm, an insignificant level. • As an additive in Goldenwest, boron and molybdenum rate of degradation is very
similar. • As a contaminant in both oils, antimony was tested at 1 ppm in three tests for three
separate vehicles.
Lube Mileage
Alum
inum
(ppm
)
0 5000 10000 150000
5
10
15
20
25S4483JS5249H
Level 1

46
Figure 22 and Figure 23 show the wear rate of boron and molybdenum as additives in Goldenwest vehicles. Severity levels for these metals are not shown because severity levels of additives are proprietary information of the third-party test laboratories. However, if the concentration were to reach a particular severity level, it would be reported in the analysis results.
Figure 22. Boron v. Lube Mileage in Goldenwest Oil.
Figure 23. Molybdenum v. Lube Mileage in Goldenwest Oil.
Lube Mileage
Bor
on(p
pm)
0 5000 10000 1500025
30
35
40
45
50
55
60
65
70
75
80S4483JS5249H
Lube Mileage
Mol
ybde
num
(ppm
)
0 5000 10000 1500040
45
50
55
60
65
70S4483JS5249H

47
Additive Metals
Additive metals allow for increased longevity of the base oil, and the depletion of additive metals is considered to be a good indicator of oil degradation. This correlation is contrary to many of the other metals presented previously that would normally indicate a failure is occurring instead of the degradation of the oil. The exception to this is molybdenum and boron (mentioned previously), which are listed in the multi-source section and not the additive section. As mentioned in the previous section, the severity levels of additive metals are proprietary information that cannot be released by the test laboratory, but they are allowed to warn of the severity when threshold levels are reached. The additive metals in this study are magnesium, calcium, phosphorus, and zinc.
The overall data for additive metals showed no clear patterns or degradation during data collection for calcium, phosphorous, and zinc. In Nature’s Choice oil, levels of magnesium ranged from 6 ppm to 15 ppm. Goldenwest oil showed larger concentrations, with the change in magnesium corresponding closely with changes in boron and molybdenum.
Summary of Data Analysis Results
In terms of oil analysis results, the oil quality was monitored through engine oil sample analysis conducted for each of the test trucks on a regular basis. The oil analysis was conducted for oil fluid properties, oil contaminants, wear metals, multi-source metals, and additive metals and the results showed that, overall, there was minimal oil degradation occurring (i.e., none of the oil samples resulted in severity levels that would warrant an oil change based on that parameter, or be considered a “failure” in the quality of engine oil). Overall, the low levels of oil degradation observed can be attributed to the low-load and high levels of idling in the operating conditions observed in the trucks, which resulted in the occurrence of optimal oil temperature ranges and low oil pressures.
STATISTICAL ANALYSIS AND DEVELOPMENT OF PREDICTIVE ALGORITHM
During the course of the project, as engine and oil data were being compiled, several exploratory statistical analyses (principal component analyses, CRT growing method and stepwise regression) were conducted to identify whether a meaningful model can be developed to predict oil degradation (and consequently, the need for an oil change) using engine data. The step-wise method minimized Akaike information criterion (AIC) corrected, which essentially minimizes the residual standard deviation + a penalty for the number of predictors used in the fitted model. The complicated penalty used is routinely and appropriately used within the field of statistics (30). The various exploratory data analysis methods provided consistent results, and the step-wise regression method was selected as the final approach for identifying engine parameters that were the most likely predictors of oil degradation. The top engine parameters obtained through a step-wise regression of the final oil and engine dataset, in order of importance, are as follows:
• Quantiles25 (Actual Engine – Percent Torque [%]). • Mileage since Last Oil Change. • Min (Engine Oil Temperature 1° [C]). • Quantiles99.5 (Engine Oil Pressure [kPa]).

48
• Min (Engine Coolant Temperature [C]). • Quantiles90 (Engine Percent Load at Current Speed [%]). • Max (Engine Speed [rpm]). • Quantiles25 (Engine Speed [rpm]). • Quantiles50 (Actual Engine – Percent Torque [%]).
However, as mentioned previously, the lack of degradation observed in the oil samples limited the development of a sophisticated predictive algorithm. The TTI research team attempted to address this issue by requesting TxDOT to extend the oil change intervals beyond the usual 10,000 miles on selected units. However, oil degradation was still observed to be minimal even in vehicles that accumulated over 10,000 miles since an oil change. Therefore, the TTI research team’s recommendation to TxDOT is that the project’s findings support replacing the 10,000 mile oil change guidance with the manufacturer recommendations for the specific engine type, i.e., performing an oil change every 15,000 miles for annual use of 6000–60,000 miles, and performing an oil change every 10,000 miles for annual usage of under 6,000 miles, when driven under “severe service.” By this definition, most of the TxDOT vehicles in the study would likely fall into the former category, requiring oil changes only every 15,000 miles.

49
CHAPTER 6: CONCLUSIONS AND RECOMMENDATIONS
SUMMARY OF FINDINGS
The main objective of this research was to identify whether engine operation data collected via on-board diagnostic systems can be used as a viable means for predicting the need for preventive maintenance (specifically, the need for an oil change) among vehicles and equipment in TxDOT’s fleet. This research project was a proof-of-concept study that focused on a single category of the fleet to determine whether a predictive algorithm could be developed to relate oil life to engine operational characteristics.
As part of this project, the research team conducted an extensive literature review, covering topics such as engine oil composition, criteria for replacement and relation to engine operation, overview of engine parameters and practices for oil life prediction, and review of existing systems. The research team also studied TxDOT’s fleet and fleet management systems to recommend a vehicle category for study based on parameters such as oil expense, vehicle usage, and availability of data collection mechanisms. The final selection of Sterling dump trucks with MBE-4000 diesel engines was made and a data collection plan was developed and deployed. The data collection plan included the periodic collection of oil samples that were sent to a third-party laboratory for analysis, and the collection of engine operation data using J1939 protocol data loggers. Engine parameters that were logged included engine speed, oil temperature, engine load, coolant temperature, engine oil pressure, etc., and oil parameters tested included viscosity, oxidation, nitration, total acid number, total base number, wear metals, soot, fuel dilution, etc. As discussed in the previous chapter, the findings indicated that there were very low levels of oil degradation, even in the vehicles where oil change intervals were extended beyond the 10,000 mile mark. These findings are attributable to the engine operations, which were observed to be predominantly low-load operations with a lot of idling. The findings from the data indicate that a combination of optimal oil temperature and low oil pressures have led to idle conditions having a small impact on oil degradation.
While the findings did not support the development of a sophisticated algorithm, the findings do support replacing the 10,000 mile oil change guidance (current TxDOT practice) with manufacturer recommendations of an oil change every 15,000 miles for annual use of 6000–60,000 miles and an oil change every 10,000 miles for trucks traveling under 6000 miles driven under server service conditions. A spreadsheet interface was developed for logging, analyzing, and characterizing engine data for vehicles in the same category, and this interface was submitted to TxDOT as research product 0-6626-P1.
POTENTIAL COST SAVINGS
In support of the findings from this research project, an analysis of potential cost savings for changing the oil change intervals to manufacturers’ recommendations for the MBE-4000 engine Sterling trucks in the TxDOT fleet was conducted. Based on the number of such units operating in the fleet (395), and a conservative estimate of cost of an oil change ($110) and considering the average distance driven per year per vehicle (11,000 miles), it is estimated that extending oil change intervals to 15,000 miles could save nearly $16,000 per year. This cost does not include

50
costs of filters, other vehicle parts, the cost of equipment downtime or the cost of potential vehicle failures. This savings is also for only a single equipment category, and it is likely that several other categories of vehicle or equipment could also benefit from such an approach.
OTHER IMPLICATIONS AND SCOPE FOR FUTURE STUDY
While this research project did not result in the development of a sophisticated model/algorithm to predict oil change intervals as originally envisioned, the findings of this project still indicate that TxDOT has potential to benefit by saving money and time on oil changes and other preventive maintenance actions. This research project also established a successful data collection mechanism that could be used (with research product 0-6626-P1 and data loggers procured for this project) on any J1939 protocol-compatible heavy duty vehicle in TxDOT’s fleet. Similar studies, if extended to other vehicle categories, can also potentially impact TxDOT’s future fleet preventive maintenance actions. Other possible areas for TxDOT to target based on these findings are in idle reduction applications for emissions reduction and fuel savings. As observed from the engine data, not only were the vehicles observed to idle for a significant portion of their operating time, but a majority of the observed idling was not with an engine load (i.e. not used for other equipment operation), indicating the potential for enforcement of idle reduction policies for fuel consumption and emissions reductions.

51
REFERENCES
1 Barnes, A.M., K.D. Bartle, and V.R.A. Thibon, “A Review of Zinc Dialkyldithiophosphates (Zddps): Characterisation and Role in the Lubricating Oil.” Tribology International 34.6 (2001): 389–95.
2 Agoston, A., C. Ötsch, and B. Jakoby, “Viscosity Sensors for Engine Oil Condition Monitoring—Application and Interpretation of Results.” Sensors and Actuators A: Physical 121.2 (2005): 327–32.
3 Lynch, T.R. Process Chemistry of Lubricant Base Stocks. CRC Press, 2008.
4 Bridjanian, H. and M. Sattarin, Modern Recovery Methods in Used Oil Re-refining. Petroleum & Coal, 2006. 48(1): p. 40–43.
5 Stipanovic, A.J., et al., Compositional Analysis of Re-refined and Non-conventional Lubricant Base Oils. Correlations to Sequence VE and IIIE Gasoline Engine Tests. Society of Automotive Engineers, Paper, 1994.
6 Robbins, R. and D. Lis, Delivered Oil Performance Quality Characteristics: Virgin and Rerefined Oil—Case Study of the United States Postal Service Northeast Area. Society of Automotive Engineers Technical Paper, 2000: p. 01-2945.
7 Henderson, H., et al., Higher Quality Base Oils for Tomorrow’s Engine Oil Performance Categories. Society of Automotive Engineers, Paper, 1998.
8 Jun, H., et al., Predictive Algorithm to Determine the Suitable Tme to Change Automotive Engine Oil. Computers & Industrial Engineering, 2006. 51(4): p. 671–683.
9 Schwartz, S., Observations Through a Transparent Oil Pan During Cold-Start, Short-Trip Service. Society of Automotive Engineers, Paper, 1991.
10 Perrin, K., et al., Radioactive Tracer Study of Start-Up Wear Versus Steady-State Wear in a 2.3 Liter Engine. Society of Automotive Engineers, Paper, 1995. 952474: p. 85–98.
11 Sharing Miles Together. [cited 2013 May 14]; Available from:http://www.upmpg.com/diesel/diesel/haywood_gray_2005.htm.
12 Herbeaux, J., Mechanical Degradation of Multi-Grade Engine Oils. Society of Automotive Engineers, Paper, 1993.
13 Yasutomi, S., Kinetic Approach to Engine Oil. 1. Analysis of Lubricant Transport and Degradation in Engine System. Industrial & Engineering Chemistry Product Research and Development, 1981. 20(3): p. 530.

52
14 Optimizing Oil Change Intervals—for all Diesel Engines Except On-Highway Truck Engines. Report by Caterpillar, Inc. Maintenance Services 2008 [cited 2011 March 1]; Available from: http://www.wyomingcat.com/BusinessSolutions/FluidAnalysisLab/Documents/OptimizingOilChangeIntervals.pdf.
15 Evaluation of High Efficiency Oil Filters in the State Fleet. Report by the California Department of Toxic Substances Control, June 2008.
16 Gordon, B., Oil Sample Analysis Trouble Shooting Guide. [cited 2011 March 1]; Available from: http://www.laboneinc.com/?page_id=23.
17 Blackstone Laboratories Oil Report. September 27, 2009 [cited 2011 March 1]; Available from: http://www.blackstone-labs.com/diesel-engine-sample-report-1.php.
18 Troyer, D., Get Ready for More Soot In Engine Oil. Practicing Oil Analysis, July 1999.
19 Fluid Analysis Program. Report by Oil Analyzers Inc. 2009 [cited 2011 March 1]; Available from: http://www.oaitesting.com/g2047.pdf.
20 Younggren, P. and S. Schwartz, The Effects of Trip Length and Oil Type (Synthetic Versus Mineral Oil) on Engine Damage and Engine-Oil Degradation in a Driving Test of a Vehicle With a 5.7 l V-8 Engine. 1993.
21 A Publication of the Lubrication Engineers Technical Department, Techni/Tips, Number 38, Available from: http://www.le-international.com/uploads/documents/038_Use%20of%20Analysis,engine%20condition.pdf.
22 Schwartz, E.S., et al., Automatic Engine Oil Change Indicator System, 1989, Google Patents.
23 Schwartz, S.E. and D.J. Smolenski, Development of an Automatic Engine Oil-change Indicator System, 1987, Fuels and Lubricants Dept., General Motors Research Labs.
24 FleetTrackS Training and Testing Approach—Presentation, October 10, 2007, and “About Fleettracks” Overview Document. (Material provided to the research team by the Project Director.)
25 TxDOT Equipment Replacement Model—TERM, Texas Department of Transportation, November 2008 [cited 2010 March]; Available from: ftp://ftp.dot.state.tx.us/pub/txdot-info/library/pubs/bus/maintenance/term_summary_and_model.pdf.
26 0-6412: Equipment Replacement Optimization, Texas Department of Transportation, August 2011 [cited 2013 May]; Available from: ftp://ftp.dot.state.tx.us/pub/txdot-info/rti/psr/6412.pdf. 27 Analysis of Cost Data and Development of Equipment Replacement Framework, Texas Department of Transportation, January 2002 [cited 2013 May]; Available from http://library.ctr.utexas.edu/pdf1/4941-1.pdf.

53
28 Serial Control and Communications Heavy Duty Vehicle Network (SAE J1939), Society of Automotive Engineers, June 2012 [cited 2013 May], Available from http://standards.sae.org/j1939_201206/.
29 EPA07 MBE 4000 Operator’s Manual, Detroit Diesel Corporation, 2009 [cited 2013 May], Available from http://www.ddcsn.com/cps/rde/xbcr/ddcsn/DDC-SVC-MAN-0041.pdf. 30 Sheather, S.J., A Modern Approach to Regression with R. New York, New York: Springer, 2009.

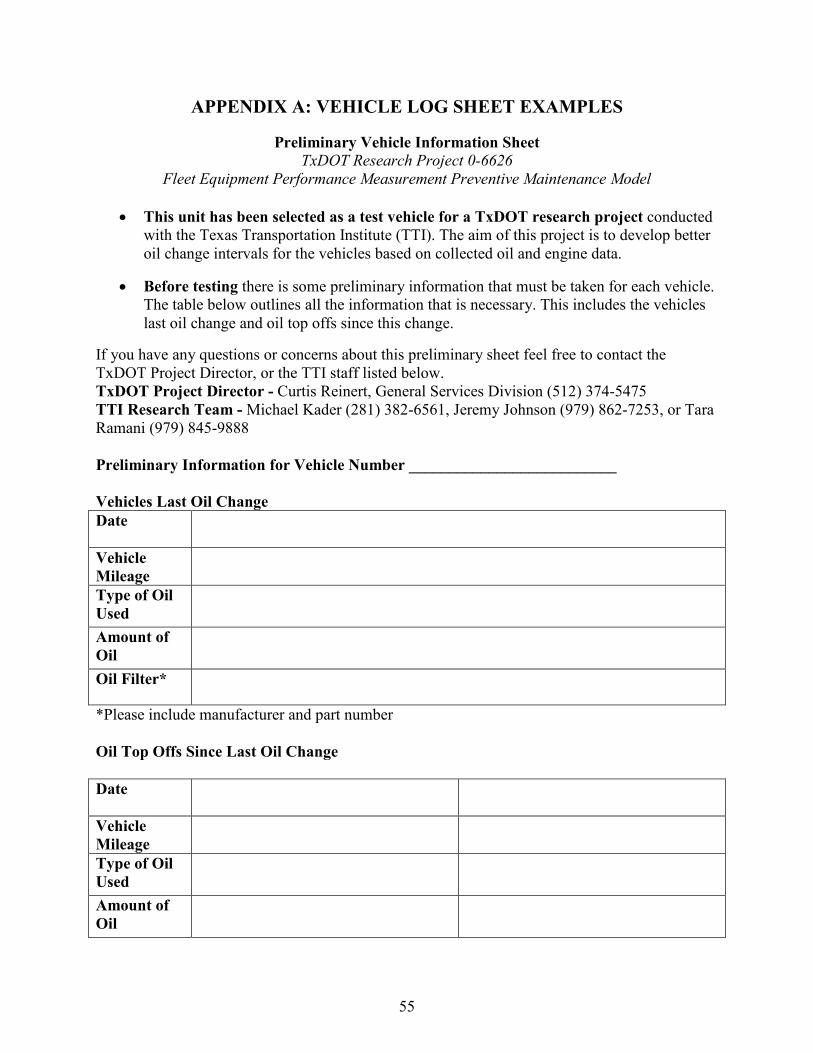
55
APPENDIX A: VEHICLE LOG SHEET EXAMPLES
Preliminary Vehicle Information Sheet TxDOT Research Project 0-6626
Fleet Equipment Performance Measurement Preventive Maintenance Model
• This unit has been selected as a test vehicle for a TxDOT research project conducted with the Texas Transportation Institute (TTI). The aim of this project is to develop better oil change intervals for the vehicles based on collected oil and engine data.
• Before testing there is some preliminary information that must be taken for each vehicle. The table below outlines all the information that is necessary. This includes the vehicles last oil change and oil top offs since this change.
If you have any questions or concerns about this preliminary sheet feel free to contact the TxDOT Project Director, or the TTI staff listed below. TxDOT Project Director - Curtis Reinert, General Services Division (512) 374-5475 TTI Research Team - Michael Kader (281) 382-6561, Jeremy Johnson (979) 862-7253, or Tara Ramani (979) 845-9888 Preliminary Information for Vehicle Number __________________________ Vehicles Last Oil Change Date
Vehicle Mileage
Type of Oil Used
Amount of Oil
Oil Filter*
*Please include manufacturer and part number Oil Top Offs Since Last Oil Change Date
Vehicle Mileage
Type of Oil Used
Amount of Oil
56
General Information and Oil Event Log Sheet TxDOT Research Project 0-6626
Fleet Equipment Performance Measurement Preventive Maintenance Model • This unit has been selected as a test vehicle for a TxDOT research project conducted
with the Texas Transportation Institute (TTI). The aim of this project is to develop better oil change intervals for the vehicles based on collected oil and engine data.
• As a part of the project, this vehicle has been installed with a data logger that records engine data when the vehicle is in use. This data logger will not interfere with your regular vehicle usage and will not be used to monitor operator activity. The data from the logger will be periodically collected by TTI staff and used only for research purposes.
• The log sheet on the reverse of this page must be used for recording oil changes and oil top-offs for this vehicle. In any event where oil is added or removed from the vehicle this log must be filled out. In the event that exact quantities cannot be determined a best guess is appropriate (please note that in the comments). An example of how to fill the oil log is shown below. TTI will also periodically extract small samples of oil from the vehicle engine for test purposes.
If you have any questions or concerns about this log, an oil event, or the data logger operation feel free to contact the TxDOT Project Director, or the TTI staff listed below. TxDOT Project Director - Curtis Reinert, General Services Division (512) 374-5475 TTI Research Team - Michael Kader (281) 382-6561, Jeremy Johnson (979) 862-7253, or Tara Ramani (979) 845-9888 EXAMPLE – HOW TO FILL THE OIL LOG SHEET
Date Event Type (Top Off/ Commercial
Change/ In-House Change)
Amount of Oil Comments
EXAMPLE: 5/2/10
Commercial Change
Unknown
EXAMPLE: 5/12/10
Top Off 1.5 Quarts (Estimated/Best Guess)
EXAMPLE: 7/2/10
In-House Change 37 Quarts

57
OIL LOG SHEET FOR VEHICLE NUMBER ___________________
Date Event Type (Top Off/
Commercial Change/ In-
House Change)
Amount of Oil Comments


59
APPENDIX B: ADDITIONAL WIRING SETUP
• The test vehicles identified were Sterling LT9500 trucks for which engine data logging and oil sample analysis were to be carried out. The diagrams provided by the vehicle manufacturer and follow-up confirmation by the research team indicated that the engine data logging mechanism was compatible with the J1939 protocol interface, with a standard 9-pin connector. Before deployment in TxDOT’s fleet, the research team tested the data loggers on a TTI-owned vehicle and also developed a software program to extract the engine data based on the J1939 protocol.
• Findings from the initial deployment of the data logger in the TxDOT fleet revealed that, contrary to the manufacturer diagram, the vehicles utilized an older protocol (J1807/1587) in the diagnostic port. Follow-up with the vehicle manufacturer revealed the inaccuracy in the manufacturer diagram.
• The ultimate result is that while the vehicle is capable of transmitting data per the J1939 protocol, it would require an additional data link to be created to the vehicle control unit (VCU). Alternatively, a data logger compatible with the J1807 protocol would be required to use the existing diagnostic port.
• The research team proposed a solution by the installation of a data link to allow J1939 protocol data to be transmitted to the data logger. The process is described in the following pages, and is shown in Figures B-1, B-2, and B-3. The implications of this for TxDOT are:
o Extra wiring will be required instead of plugging into diagnostic port. o The link can be installed and routed in such a way that it will not affect the safety
or daily operations of the vehicle operator. o This proposed solution should have no vehicle warranty issues. We are accessing
the VCU through data terminals (as opposed to actually opening the VCU case). Contact with the manufacturer has indicated support for this activity.

60
Figure B-1. Location of VCU.
• The data link would require a twisted wire with a 120 ohm termination resistor on each
end with the proper terminal and pin connections for the VCU and the diagnostic port, respectively.
• The terminals on the VCU end must be connected to the 19th and 21st (19 = J1939+, 21 = J1939–) pins on the 21-pin vehicle interface harness (shown in Figure B-2 and Figure B-3 below). The pins terminating at the diagnostic connector must be connected in the C and D (C = J1939+, D = J1939–) ports of the connector.
• The location of these ports was found through vehicle documentation and was confirmed visually by labeled connectors on the vehicle. These pins and terminals are available at the manufacturer dealership.
• A test data link was made to the specifications described above and tried on one of the research vehicles in Brenham. This data link was installed and routed in such a way that it will not affect the safety or daily operations of the vehicle operator.
• The data logger was able to record data via the J1939 protocol, and the research team was able to successfully extract the required data using the application developed.

61
Figure B-2. VCU Connectors.
Figure B-3. Location of J1939+/– Pins.


63
APPENDIX C: J1939 “PARSER” APPLICATION
The data output by the data loggers used in the project has a time stamp, an ID number, and measurements that are recorded in hexadecimal format; all data is placed in a .LOG file. A sample screenshot of the data is provided below in Figure C-1. This output corresponds to the J1939 protocol where each ID points to a specific set of parameters. Each parameter has a known byte and bit position and length. This code is then converted from hexadecimal to decimal code, and a scale and offset is applied, resulting in a value in understandable engineering units. To put the data into a format that can be more easily analyzed the J1939 Parser Application was developed. This application was designed by researchers at TTI and allows for the user to select the parameters that will be converted from the original file and recorded to an Excel spreadsheet. Additionally, the user inputs the vehicle number and the program automatically adds the year, month, and day based on file structure to allow for better organization of data.
Figure C-1. Sample Data from J1939 Data Logger.
Once the data are processed through the application, it is in a format that is easily understood and able to be analyzed. The output from the sample data above is shown below in Table C-1. The data below are a capture of 4 seconds of data from vehicle S4238J’s first run on the 26th day of the year 2012 (January 26, 2012). Also, sample interval 7 signifies that this is engine data that was captured between the 7th and 8th oil

64
sample for this vehicle. The output shows that the vehicle was just being started and was reaching idle speeds. It can also be seen that the driver was not depressing the gas pedal. The data collected from the program is later collected, organized, and analyzed in JMP statistical software.
Table C-1. Abbreviated Sample Data Output from J1939 Parser Application. Vehicle Number
Sample Interval
Day #
Run #
Year Time Wheel Based Vehicle Speed(kph)
Engine Oil Temperature 1(C)
4238J 7 26 1 2012 16.1092 0 14 4238J 7 26 1 2012 17.1184 0 14 4238J 7 26 1 2012 18.1284 0 14 4238J 7 26 1 2012 19.1384 0 14
Accelerator Pedal Position 1(%)
Engine Percent Load at Current Speed(%)
Engine Speed(rpm)
Engine Demand ? Percent Torque(%)
Actual Engine - Percent Torque(%)
Engine Oil Pressure(kPa)
0 12 467.5 25 21 8 0 11 629.5 6 6 8 0 11 608 6 6 40 0 11 610.875 6 6 456
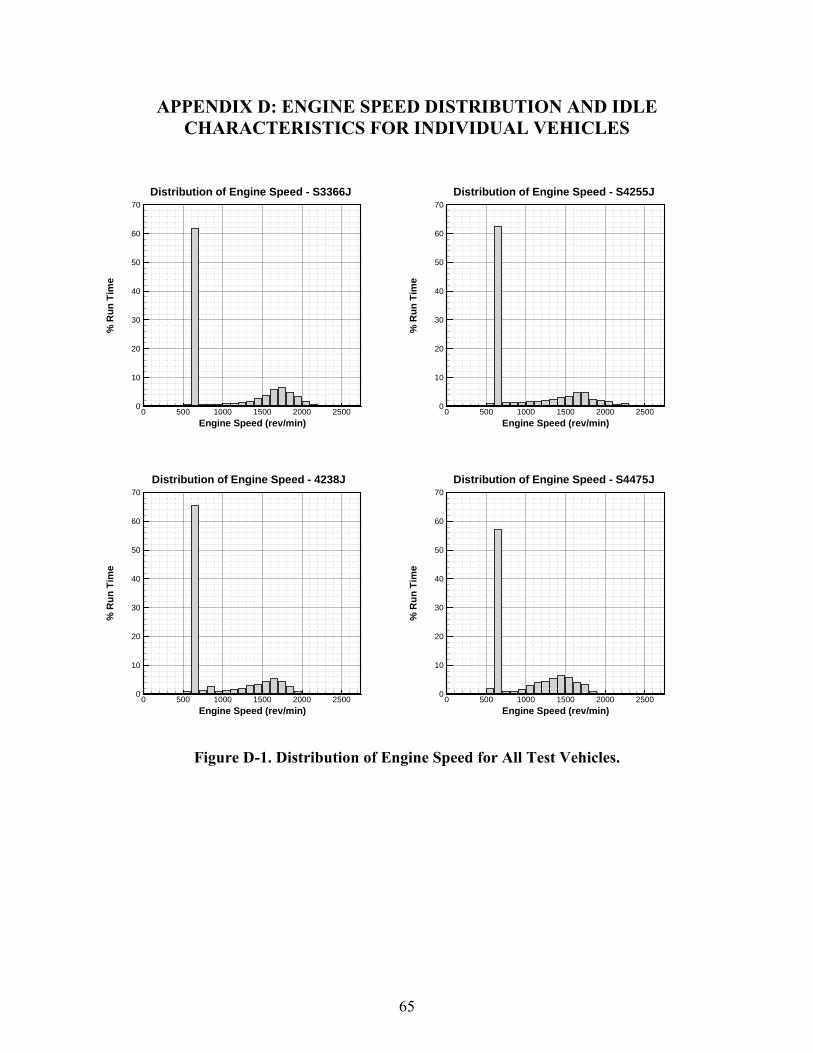
65
APPENDIX D: ENGINE SPEED DISTRIBUTION AND IDLE CHARACTERISTICS FOR INDIVIDUAL VEHICLES
Figure D-1. Distribution of Engine Speed for All Test Vehicles.
Engine Speed (rev/min)
%R
unTi
me
0 500 1000 1500 2000 25000
10
20
30
40
50
60
70Distribution of Engine Speed - S3366J
Engine Speed (rev/min)%
Run
Tim
e0 500 1000 1500 2000 2500
0
10
20
30
40
50
60
70Distribution of Engine Speed - S4255J
Engine Speed (rev/min)
%R
unTi
me
0 500 1000 1500 2000 25000
10
20
30
40
50
60
70Distribution of Engine Speed - 4238J
Engine Speed (rev/min)
%R
unTi
me
0 500 1000 1500 2000 25000
10
20
30
40
50
60
70Distribution of Engine Speed - S4475J

66
Figure D-1. Distribution of Engine Speed for All Test Vehicles (Continued).
Table D-1. Vehicle Idle Characteristics.
Engine Speed (rev/min)
%R
unTi
me
0 500 1000 1500 2000 25000
10
20
30
40
50
60
70Distribution of Engine Speed - S4476J
Engine Speed (rev/min)
%R
unTi
me
0 500 1000 1500 2000 25000
10
20
30
40
50
60
70Distribution of Engine Speed - S5249H
Engine Speed (rev/min)
%R
unTi
me
0 500 1000 1500 2000 25000
10
20
30
40
50
60
70Distribution of Engine Speed - S4483J
Engine Speed (rev/min)
%R
unTi
me
0 500 1000 1500 2000 25000
10
20
30
40
50
60
70Distribution of Engine Speed - S5251H
Vehicle ID
% Idle Run Time
% Idle Engine Revolutions
3366J 60% 37% 4238J 65% 45% 4255J 60% 39% 4475J 53% 35% 4476J 63% 45% 4483J 63% 41% 5249H 57% 34% 5251H 56% 34% Average 60% 38%