
Flash Flood Management Approach for Flood Risk Areas Using ...
Upload
trinhnguyetCategory
view
224download
0
Flash Flood Scenario Modelling for Preparedness and Mitigation: Case Study of
Barcelonnette, France.
Sheika Tamara Henry February, 2010

Flash Flood Scenario Modelling for Preparedness Planning and Mitigation: Case Study of Barcelonnette,
France.
by
Sheika Henry Thesis submitted to the International Institute for Geo-information Science and Earth Observation in partial fulfilment of the requirements for the degree of Master of Science in Geo-information Science and Earth Observation, Specialisation: (Disaster Management) Thesis Assessment Board Prof. V.G. Jetten (Chair) Dr. E. Dopheide (External Examiner) Dr. D. Alkema (1st Supervisor) Drs. N. Kingma (2nd Supervisor) Observe Drs. T.M. Loran (Programme Diretor)

INTERNATIONAL INSTITUTE FOR GEO-INFORMATION SCIENCE AND EARTH OBSERVATION ENSCHEDE, THE NETHERLANDS

Disclaimer This document describes work undertaken as part of a programme of study at the International Institute for Geo-information Science and Earth Observation. All views and opinions expressed therein remain the sole responsibility of the author, and do not necessarily represent those of the institute.

i
Abstract
Flash floods have been a nuisance to many countries for decades. The rapidity at which it occurs
makes prediction very difficult. As a result, an early warning system may not be the desired approach
since flooding of this nature may occur before it reaches the intended group of people who are
affected. Therefore, preparation for unexpected flood scenario is important.
Even though structural measures such as embankments have been used as a mitigation measure,
research has shown that people feel a strong sense of security when a disaster is not prevalent or has
never occur in an area for a long time. This is the case of Barcelonnette that experienced the last
major flood event in 1957. This event caused severe damage to infrastructures, buildings and resulted
in one death. Like the Dutch who were surprised by an unexpected flood scenario in 1953 and who
were once again under another threat in 1995, Barcelonnette had a near flood event in 2008 that has
reinforced the possibility that a flood can happen in the area. As a result, various stakeholders are
interested in research that is centred towards floods since majority of the research that have been done
in the area pertains to debris flow and landslides. There is therefore, the need for a study that
incorporates different flood scenarios with perception of the people at risk in Barcelonnette.
This study uses SOBEK, a coupled 1 Dimensional and 2 Dimensional Model to simulate the different
flood scenarios: overtopping, dike break and damming of the Ubaye River. The outputs generated
from these scenarios were later applied to preparedness. In addition, a risk perception survey that was
carried out by Marjory Arginand in the Mountain Risk Project was analysed.
The findings from the flood scenarios indicate that flooding caused by each scenario pose a danger to
the critical elements at risk. In each of the scenarios, the Fire Station, Police Station, two schools, and
a supermarket were flooded. Even though the Municipality has mad plans to relocate the fire station
and the Police Station to another location (Quartier Craplet), flooding still pose a risk to these
facilities. The results also indicated that flooding caused from damming and a breach in the flood
protection structures of the Ubaye River may cause more devastation on the community than flooding
from overtopping of the embankments.
Since flooding from each of the scenarios covered a wide extent of areas along the river, the next step
involved the identification of the emergency shelters and the shortest route to them. Whilst none of
the shelters that were allocated for people at risk were inundated, two were at risk of being flooded.
The next step involved the analysis of the perception survey. Results from the survey showed that
while few of the respondents were directly affected by a flood event, majority of them were aware of
the possibility of a flood occurring in Barcelonnette.

ii
Acknowledgements
After numerous topic changes, I have finally found my niche. It is within this regard that I express my
sincere gratitude to those who have made it possible for me to conduct this study. Special thanks go to
my Course Director, Mr. Tom Loran, Chairman Professor Victor Jetten, Drs Nanette Kingma second
supervisor and first supervisor Dr Dinand Alkema.
Acknowledgment also goes out to the Project leader of the Mountain Risk Project Jean-Philippe Malet
and the other scholars who are currently working withinin the project: Marjory Anginard, Melanie
Kappes, Byron Quan Luan, Simone Frigerio and Carolina Garcia. Robert Hennema is also to be
thanked for his role as translator during the fieldwork phase. Likewise are the officials at the RTM
Office, Mr. Michel Peyron and Audrey Dunand from the Municipality of Barcelonnette.
I am indeed grateful to Mr. Bas Retsios for his timely response in solving my many ILWIS problems.
Thank you Mr Gabriel Parodi for your assistance and Drs. Michel Damen, your assistance is also very
much appreciated.
To my family and friends who has been a tower of strength, I say thank you. I am deeply grateful for
your support during the most challenging phase of my life. And, to all my other colleagues who have
made my stay at ITC a peaceful and joyful one, thank you. From the receptionist to the chefs and
lecturers I say thank you.

iii
Table of contents

iv
List of figures

v
List of tables

vi
Abbreviations
RTM (Restauration des Terrains en Montagne) - Organization responsible for the restoration of mountain lands

FLASH FLOOD SCENARIO MODELLING FOR PREPAREDNESS AND MITIGATION MEASURES. CASE STUDY OF BARCELONNETTE, FRANCE
1
1. Introduction
The Munich Re Group (2003) has identified flash floods as the most recurrent and costly hazard
affecting many European Countries. Over the past decade, flash floods throughout Europe have cost
billions of dollars in damage and numerous fatalities. Out of the 23 events reported by EMDAT
(2009) for the last 10 decade, 197 people have been killed while the total affected population was
460,069 and total damage was estimated at US $11,025,150,000 in Europe. Whilst the reported events
are based on several criteria1, it does provide some insight into the devastating impact such hazards
pose on the economy and on the vulnerable population.
In literature, flash floods have been defined as weather related events. Norbiato et al. (2008) defined
a flash flood as a flood that follows the causative storm event in a short period of time. Creutin and
Borga (2003) have placed emphasis on the term flash, and explained how the rapid response with
water levels in the drainage network after the onset of a rain event leaves extremely short time for
warning. In many cases, such basins as Norbiato et al. (2008) elaborates, respond rapidly to intense
rainfall because of steep slopes and impermeable surfaces, saturated soils, or because of
anthropogenic induced alterations to the natural drainage system.
The previous literatures have identified the role rainfall plays in triggering flash floods. However,
many other factors can contribute to the occurrence of flash floods. Flash floods do not occur solely
based on extreme weather events like heavy torrential rainfalls but may also be triggered by dam
failure or the overtopping of embankments (UNESCO 1999). In such a case, it is unwise to rely upon
a formal flood warming system as dissemination takes time (World Meteorological Organization
2004). Therefore, the impact of such events can be devastating if proper mitigation measures,
response and preparedness plans are not in place; not to mention if the current preparedness plans are
not based on such flood scenarios.
In recent years, attention has been focused on monitoring flash floods through the incorporation of
precipitation data into meteorological and hydrological models (Papadopoulos A et al.). Notably too,
was the high dependence on statistical analysis of rainfall data. Today, technological advancement has
enabled the use of Radar and lightning with rainfall data in an attempt to improve prediction and
TITLE OF THESIS
2
forecast. Barnolas et al. (2008) and Creutin and Borga (2003) are two examples of several studies,
that have embarked on this technological innovation that are currently being used to monitor flash
floods. Both researchers have integrated rainfall data with Radar data in an attempt to improve the
distributed monitoring of flash floods. While this approach serves its relevance in predicting and
assessing flash floods, this is only one dimension of addressing the flash flood problem.
Clearly, the aforementioned approaches do not permit a pluralistic approach that includes the
perception of risk by different stakeholders within a given social system Raaijmakers et al (2008). As
Montz and Gruntfest (2002) pointed out, effective warning starts with monitoring and forecasting, and
move through decision making and message dissemination to preparedness and mitigation. Therefore
flash flood assessment requires a multidisciplinary approach since it goes beyond meteorological
events, hydrological regimes, flood hazard mapping and technical means. It includes perception of
risk by the general public and decision makers. The human response component is no less important
in flash flood assessment than those components which are usually studied (Krasovskia 1995).
Furthermore, the limited use of hydrological and meteorological models in flash flood studies have
not been able to reduce losses (Montz and Gruntfest 2002).
Due to the numerous fatalities and economic damages imposed by flood events in several European
countries, The Commission of the European Countries (CEC) has realized the importance of
mitigating the catastrophic impact a flood of a given magnitude may have on the vulnerable
population. It is with this framework in mind that The CEC developed a proposal for a Flood
Directive which aims at reducing and managing the impacts floods may pose to properties, human
health and the environment. This approach includes the perception of risk by the public, decision
makers and the study of spatial planning. Following this assessment, flood hazard maps will be made
and risk management plans must be developed by 2015. It also aims to include all aspects of the risk
cycle and will place emphasis on prevention, protection and preparedness (CEC 2007).
However, the plans highlighted in the Directive do not provide a clear guideline on how different
European Countries should prepare for an event caused by different flood scenarios such as the
breaching of embankments, overtopping and damming of the river systems. The plan only mentioned
the typical flood inundation outputs that are usually based on the probability that a flood of a given
return period may occur. And, will include an assessment of the number of inhabitants and type of
economic activity that will be affected (CEC 2007). Flood hazard maps based on different scenarios
1 One of the following criteria has to be met: 10 or more people have to be killed, 100 people reported affected, declaration of state of emergency or call for international assistance.

FLASH FLOOD SCENARIO MODELLING FOR PREPAREDNESS AND MITIGATION MEASURES. CASE STUDY OF BARCELONNETTE, FRANCE
3
can be useful in promoting public awareness and making information available to decision makers
(Shardul A. 2007). Furthermore, 2015 is a long time to wait if many countries do not have an updated
hazard map.
�
1.1. Problem Statement
This study focuses on the Barcelonnette area which is located in the Alpes de Haute Provence in the
flood plain of the Ubaye River (see figures 1 and 4). The area is situated in an elongated form.
Elongated or linear villages are usually found along canals, rivers, or road sites that promote
attenuated settlement forms (Knapp 1992). Barcelonnette epitomizes such a settlement pattern. The
elongated structure makes it highly dependent on structural measures such as dykes and levees to
protect against flooding. However, research has shown that there is no protection work that offers one
hundred percent security against floods. There is always the possibility that a threshold is surpassed
and that flood water will enter into areas where it should not go, for example, by overtopping or
breaching of dikes. Therefore, the higher the mitigation structure, the bigger the disaster if something
goes wrong (Alkema 2003).
Figure �1-1: Geomorphological Map of the Barcelonnette Area
�
����������������� ��������� ����� ����� �������������������������������� ��� ! ������������" ����#������������
#���$���������%��#��&������� '�
�
LandslidesAlluvial deposit Streams Holocene torrential fanLandslidesAlluvial deposit StreamsLandslidesAlluvial deposit Streams Holocene torrential fan
TITLE OF THESIS
4
As shown in figure 1, several streams flow from steep mountainous slopes into the Ubaye River.
Barcelonnette’s location at the foot of the slope and along the canalized river system makes it
vulnerable to the different flood scenarios mentioned earlier and other types of hazards such as
landslides. Over the past decades, the removal of natural vegetation on steep slopes for agricultural
purposes and tourist activities has aggravated the occurrence of torrential floods and debris flows in
the study area. The removal of natural vegetation serves as a precursor for the movement of soil down
steep slopes which results in sedimentation of rivers, further inducing the occurrence of flash floods.
The predominant marly lithology that is susceptible to landslides and erosion also adds to
Barcelonnette’s problem since these can cause damming of the river system which will influence the
probability of a flash flood.
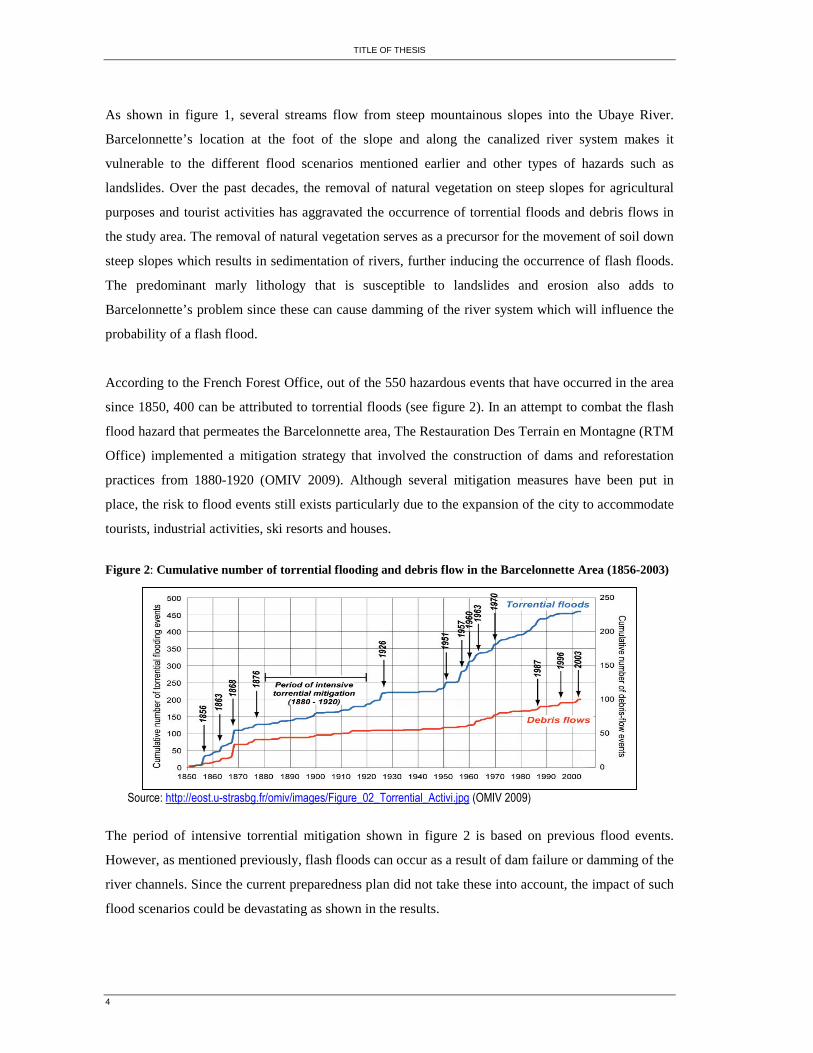
According to the French Forest Office, out of the 550 hazardous events that have occurred in the area
since 1850, 400 can be attributed to torrential floods (see figure 2). In an attempt to combat the flash
flood hazard that permeates the Barcelonnette area, The Restauration Des Terrain en Montagne (RTM
Office) implemented a mitigation strategy that involved the construction of dams and reforestation
practices from 1880-1920 (OMIV 2009). Although several mitigation measures have been put in
place, the risk to flood events still exists particularly due to the expansion of the city to accommodate
tourists, industrial activities, ski resorts and houses.
Figure 2: Cumulative number of torrential flooding and debris flow in the Barcelonnette Area (1856-2003) �
�
�
�
�
�
�
�
�
�
�
�������� � � �� � �� � ���� � �� � �� � � ����� � �� ��� � � � �� �� � �� � � � � � � ��� � �� �� � � �� ���� � � ! " #$ �� � � % &�
���
The period of intensive torrential mitigation shown in figure 2 is based on previous flood events.
However, as mentioned previously, flash floods can occur as a result of dam failure or damming of the
river channels. Since the current preparedness plan did not take these into account, the impact of such
flood scenarios could be devastating as shown in the results.

FLASH FLOOD SCENARIO MODELLING FOR PREPAREDNESS AND MITIGATION MEASURES. CASE STUDY OF BARCELONNETTE, FRANCE
5
The 2008 near flood event is a constant reminder of Barcelonnette’s vulnerability to flooding. As
indicated in the photograph of the 2008 near flood event in figure 3, the occurrence of a flood in
Barcelonnette is not merely a probability but has demonstrated some level of certainty that it can
happen. Furthermore, the 1957 flood event is proof of the devastation that can happen in the area. The
only difference is that, the area was not inhabited by a lot of people then. Therefore a flood event of
that nature or greater may have a more devastating impact on the lives of the current Barcelonnette
Populous since more people resides in the area. The 1957 flood occurred many years ago and so may
not active in the minds of the residents and may be unknown to the new migrants.
Figure 3: Photographs of the 2008 near flood event (a) and 1957 flood event (b)
�������������
�
�
�
It is clear that Barcelonnette is vulnerable to flooding and if it occurs, the impact could be devastating
on the population. Therefore, there is the need for a study that is based on different flood scenarios
that will take into account overtopping, breach, damming of the river system. Since the area is already
prone to multiple-hazards, an evaluation of the current preparedness plan is also needed in the event
there is a disaster that the current preparedness plan did not take into account of. This information
could be useful for spatial planning.
��
�
�
�
�
�
�
�
�
�
(b) (a)

TITLE OF THESIS
6
�
�
1.2. Research Objectives and Questions
Figure �1-2: Research Objectives and Questions
1.2.1. Thesis outline
The compilation of this thesis will give a brief description of the study area followed by a literature
review that addresses pertinent issues surrounding preparedness and mitigation planning. The
procedures employed in his study are illustrated in the form of a flow chart after which the results
from each of the flood scenarios: overtopping, damming and dike breach are analysed and applied to
preparedness planning. The preceding chapter provides an analysis of a questionnaire survey that was
carried out in the Barcelonnette in 2009 by Marjory Arginand who is apart of the Mountain Risk
Project. The latter approach is useful to this study since perception from community members can
indicate some level of preparedness and the level of confidence they have in the organizations that are
responsible for mitigating natural hazards; in this case a flood.
�
�
�
�
�
Research Objectives Research Questions 1. To simulate flood scenarios in order to characterize possible flood events spatially and temporally.
1 (a) What are suitable flood scenarios? -Overtopping of present levees;
-Breaching of levees; -Damming of the river. (b) What are the spatial and temporal Characteristics of these flood scenarios?
2. . To Identify the critical elements at risk. 2 (a) What are the critical elements at risk? (b) How could these be affected by floods?
3. To evaluate the current preparedness plans & mitigation measures.
3. What are the current preparedness plans & mitigation measures in regards to floods in Barcelonnette? Considering: safety levels, design, execution, updating
4. To interpret the results of a risk perception survey in Barcelonnette.
4. (a) What is the flood risk perception of the Barcelonnette population?
���������������
� �������������� ��� ���
������������
� ������ ���

FLASH FLOOD SCENARIO MODELLING FOR PREPAREDNESS AND MITIGATION MEASURES. CASE STUDY OF BARCELONNETTE, FRANCE
7
�
�
2. Study Area
Barcelonnette is located in the Alpes de Haute Provence at an elevation of approximately 1130m. It
lies between 44° 23� 0" latitude and 6° 39� 0" longitude. The Barcelonnette basin extends over an
area of 200km2 and is drained by the Ubaye River. The area is vulnerable to natural hazards such as
floods, landslides, earthquake, debris flow, avalanche, rock fall and erosion. Figure 1 shows a map of
the study area.
Figure4: Study Area (1), (2) and (3)
Source: http://www.unicaen.fr/mountainrisks/spip/IMG/jpg/Fig_1_01_Alpes_du_Sud.jpg
2.1. Climate
Barcelonnette experiences a dry and mountainous Mediterranean climate with strong inter-annual
rainfall variability between 700 and 800mm. The area experiences strong storm intensities during
summer and autumn and 130 days of freezing per year (OMIV 2009). These characteristics imply
significant thermal amplitudes and a great number of freeze thaw cycles (Maquaire et al. 2003). On
melting, the thick snow cover which forms during the cold months from December to March only
adds to the effect of heavy spring rain(Flageollet 1999).
2.2. Geology
The Barcelonnette Basin is part of the Alpes Dauphinoises and is part of the Intra-alpine zone of the
nappes of Brianconnais. This basin consists mainly of black marl which is responsible for the very

TITLE OF THESIS
8
soft morphology which is a feature of the base of the foot slopes. This makes the area susceptible to
both landslides and erosion (Weber 1994). Weber ( 1994) also noted that the area is also
characterized by Quaternary Deposits which has been formed as a result of previous flood events.
2.3. Economy
The economy was once based on crafts, the textile industry and agricultural produce. Sheep breeding
and weaving were the main activities. However, the present day economy is now predominantly based
on tourism with little dependency on agriculture (Weber D. 1994).
2.4. Land use
In Barcelonnette, forested areas were in abundance on steep mountainous slopes. Over the years,
deforestation has resulted in a reduction of the forested areas as some of the areas were used for
agricultural cultivation (arable lands, pastures). As a result of the natural hazards that have been
triggered by deforestation, the RTM had replanted trees as to reduce the number of landslides and
flood events that have been triggered by deforestation. Figure 1 shows the spatial distribution of the
forested areas as coniferous forest.
As people inhabited the area, development took place which lead to alterations of the physical terrain
to meet the needs of the inhabitants. Therefore natural surfaces were replaced by paved surfaces,
roads and buildings to accommodate people; this is shown as the built area in figure 5.
Figure 5: Land use
�
�
�
�
�
�
�
FLASH FLOOD SCENARIO MODELLING FOR PREPAREDNESS AND MITIGATION MEASURES. CASE STUDY OF BARCELONNETTE, FRANCE
9
Figure 5 shows that the built area is concentrated along or close to the river channel. This area is flat
and therefore promotes development than the steeper inaccessible slopes. This is a reason for concern
since the river embankments may fail during an unexpected scenario causing damage to the built area
in which people are located.
The figure also shows the Black Marls that are responsible for the numerous landslides that have
taken place over the years. These are located on the steeper mountainous slopes which can carry
materials down slope thereby blocking the river channel. An event like this can be disastrous since the
river will not be able to carry the full capacity it normally carries and so overtopping of the
embankments can occur as a result of this. The alluvial deposits signify the sediment load that has
been deposited over the years as the river transports it load downstream and as a result of previous
flood events that have occurred in the area.
2.5. Historical Floods
Flooding has been occurring in Barcelonnette since1740 and has increased over the years. Table 2
shows the numerous flood events that have occurred in the area.
Table2: 1957 flood event Flooding Year
Along the Ubaye River 1740,1843,1847,1957,1856,1839 Bachelard 1890, 1910, 1915, 1926, 1957, 1963
Du Gaudissard 1926,1970,1973 Du Claveaux 1998,1997 La Crossitte 2003 Du Pisse-vin 1986,2003
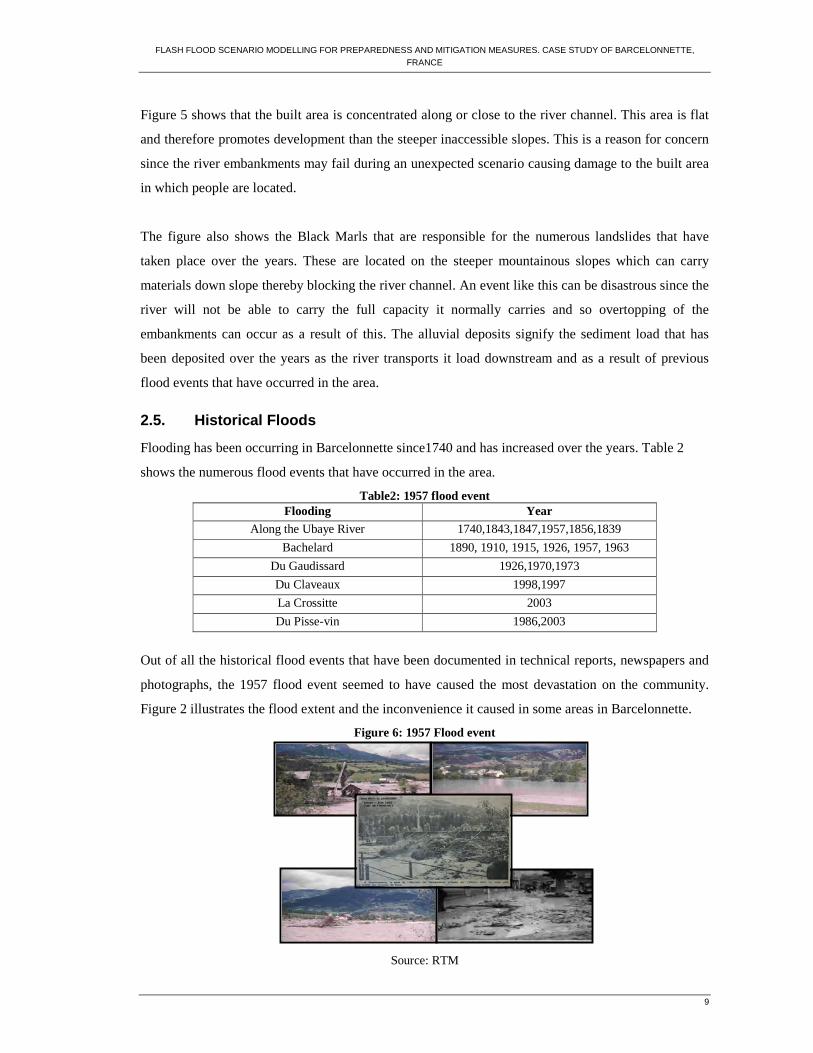
Out of all the historical flood events that have been documented in technical reports, newspapers and
photographs, the 1957 flood event seemed to have caused the most devastation on the community.
Figure 2 illustrates the flood extent and the inconvenience it caused in some areas in Barcelonnette.
Figure 6: 1957 Flood event
Source: RTM

TITLE OF THESIS
10
A number of factors were reported to have caused the devastation in 1957. These include: The Sirocco
Wind, discharge, snow melt, rainfall, dike break, blockage of the river channel and changes in the land
use pattern. According to (Waugh 2002), the Sirocco Wind is caused from a southerly wind that
originates it East Africa and moves over the Mediterranean Region when there is a low pressure
system. This wind picks up moisture once it reaches the Mediterranean Region and causes hurricane
“like” conditions in the Alps. It was also reported that the rapid snow melt coupled with a large
amount of discharge entering the river caused overtopping along numerous sections of the river.
Changes in land use pattern also influenced the occurrence of the flood since deforestation was
prevalent during that time. In addition people had settled along the flood plain which increased their
vulnerability to the hazard.
2.6. Flood Protection Works
In response to the devastation the flood had caused, the Municipality have constructed and repaired
the embankments that have been ruined. These are temporary measures that have been put in place
that may not be adequate to reduce the impact of a flood. Documents collected from the RTM has
shown that numerous recommendations were made to the Municipality to increase the height of the
bridges that could not accommodate a 100 year flood event. The SOGREAH Reports have also raised
concerns about the level of the embankments in the area. However, this was not carried out as a new
bridge was built instead that cannot accommodate the 450 m3/s of discharge inside the river. The
Municipality has also put in place temporary measures such as: clearing stones from the river, placing
stones along the earthen embankments and have increased sections of the dikes. Figure 3 shows
examples of the embankment in the area.
Figure 7: Flood embankments along Ubaye River

FLASH FLOOD SCENARIO MODELLING FOR PREPAREDNESS AND MITIGATION MEASURES. CASE STUDY OF BARCELONNETTE, FRANCE
11
Whilst these temporary measures may not be the desired approaches, they can be useful in hindering
the flow of water over the river banks. On the other hand, an undesired measure can have a
devastating impact on the residents if the flood event is caused by an unexpected scenario, for
example, damming. A study conducted for the Commune de Barcelonnette in 2000 at the request of
the municipality indicates that the levees that have been repaired since 1957 flood event do not offer
enough protection if a flood of that magnitude should occur again. This point was further reiterated in
several other reports namely: l’etude du schema d’amenagement de la valee de l’Ubaye (Study of the
Management of the Ubaye Valley) 1984, 1986, 1989 par le bureau d’etude Sud-Amanagement (office
of the study South-Installation), CEMARGREF in 1993 and The SOGREAH Report in 1995. A study
that was done in 1997 for the protection against flooding in the Ubaye, reached the same conclusion
and made recommendations for specific flood reduction measures along the river.
Based on the studies carried out, the Municipality has been keen on following the recommendations.
Plans are in place to increase the dike by 1.5 m in some areas, renovating sections of the river banks,
reinforcing concrete embankments, building sheet pile at the “shoreline of scouring”, using Dune
Hydraulic Model to define the characteristics of the threshold acceleration under the Bridge Plan and
to increase the height of the embankment of the bridges.
The total cost of the aforementioned plans would amount to 10, 727, 2008 Francs. Whilst the
Municipality is ardent at implementing permanent structural measures, it simply cannot afford the
exuberant amount of money that the project would cost especially in an economy marred by recession.
Private organizations should therefore provide funding for the plans that could improve the mitigation
measures in the area.
Although the mitigation measures do not guarantee full protection against an unexpected scenario, it
is useful in reducing the impacts once it has not been breached.

TITLE OF THESIS
12
3. Literature Review
For many years, the approach taken in managing natural disasters such as floods has been centered
towards the response and recovery phase even though the disaster management cycle consists of other
phases. This chapter addresses the issues surrounding the management of natural disasters and
emphasizes the need for attention to be placed at the preparedness and mitigation phase.
3.1. Disaster Management Cycle
The Disaster Management Cycle (CDM) provides the framework for what is needed in regards to
preparation for, during and after the occurrence of a disaster. The aim of CDM is to reduce potential
losses from hazards, ensure appropriate and rapid assistance to victims of a disaster and to achieve
rapid and effective recovery (European Commission. 2006). CDM therefore represents the continuous
process that is undertaken by different organizations, civil society, government officials, communities
and businesses to reduce the impact of a disaster. It is often implied that once these approaches are
followed correctly, actions at all points in the cycle will lead to greater preparedness, better warnings,
reduced vulnerability or the prevention of disasters. Figure 10 illustrates the ongoing process that is
involved in CDM.
Figure 10: Disaster Management Cycle Source:(European Commission. 2006)
FLASH FLOOD SCENARIO MODELLING FOR PREPAREDNESS AND MITIGATION MEASURES. CASE STUDY OF BARCELONNETTE, FRANCE
13
3.2. Mitigation
The mitigation phase involves putting in place mechanisms that will prevent a hazard from turning
into a disaster or reducing the impacts of a potential disastrous event. These measures may include
structural (dykes or levees) or non-structural (building codes, awareness or insurance) approaches.
One of the most important features of this stage is the identification of the level of risk that is to be
mitigated. Not withstanding that, responsible authorities’ should be cognizant of the impact a hazard
may pose on the vulnerable population and it is at this stage that serious consideration should be
undertaken in regards to the different elements at risk. In this case, risk is normally determined by the
equation below:
Equation -1 ........................................................................Error! Bookmark not defined.
VHR *=
Where R = risk, H represents the hazard and V stands for Vulnerability. Elements at risk include the population, buildings, civil engineering works, economic activities, public
services, utilities and infrastructure that are at risk in a given area (AGSO 2001). Each of these
elements at risk has its own characteristics which can be spatial, temporal (such as the population),
which will differ in time at a certain location and thematic characteristics (such as the material type of
buildings or the age distribution of the population (Westen C. 2004). Losses normally suffered by
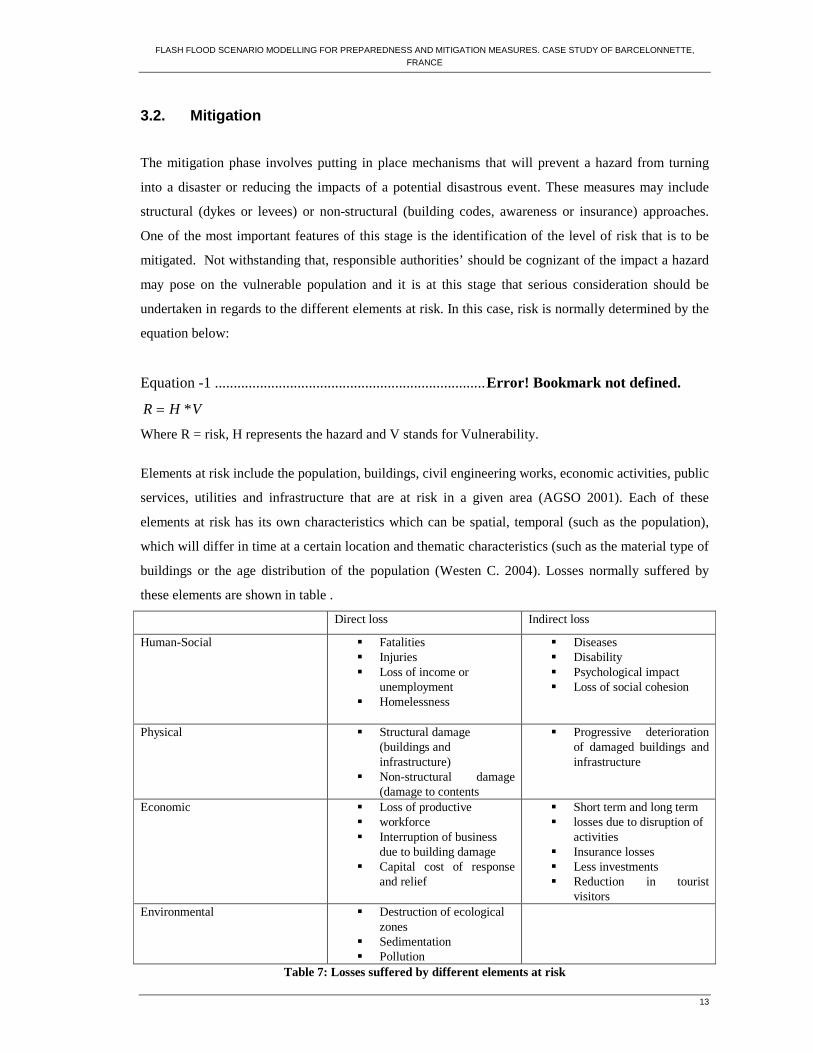
these elements are shown in table .
Direct loss Indirect loss
Human-Social � Fatalities � Injuries � Loss of income or
unemployment � Homelessness
� Diseases � Disability � Psychological impact � Loss of social cohesion
Physical � Structural damage (buildings and infrastructure)
� Non-structural damage (damage to contents
� Progressive deterioration of damaged buildings and infrastructure
Economic � Loss of productive � workforce � Interruption of business
due to building damage � Capital cost of response
and relief
� Short term and long term � losses due to disruption of
activities � Insurance losses � Less investments � Reduction in tourist
visitors Environmental � Destruction of ecological
zones � Sedimentation � Pollution
Table 7: Losses suffered by different elements at risk

TITLE OF THESIS
14
3.3. Preparedness
Preparedness entails the planning for an event through emergency exercises, preparedness plans and
early warning systems. In this regard, maintaining an inventory of supplies, equipment and proper
communication is essential. It also involves the building of capacity in disaster management as a
strategy for loss reduction. This is gained through the training of personnel among the civil society to
assist in the recovery and response phase.
Preparedness also involves the estimation of the impact a given scenario may have on an area. This
information will provide the responsible bodies in charge of what to put in place and the resources
that may be needed in such scenarios. It is also important to highlight the location of the vulnerable
groups of the society. These are usually children, women and the elderly. Such information if
represented spatially could help disaster responders in having timely evacuation before a disastrous
event occurs.
An effective approach to preparedness is not guaranteed if direct communication is not established
between responsible organizations. There needs to be a flow of information as to who is doing what,
who should respond and what to do in a crisis situation and who show provide information to the
public.
3.4. Response Phase
This phase involves the efforts put in place during the occurrence of a disaster which includes search
and rescue operations. People normally deployed in this phase include: fire fighters, police, military
personnel, ambulance crews and people that have been trained to carry out emergency services. An
effective emergency plan, designed at the preparedness stage, is useful in the coordination of rescue
operations since rescue operators will know each others responsibilities.
3.5. Recovery Phase
Recovery is involves the restoration of an area affected by a disaster to its previous state. Normality is
restored either through the building of temporary housing or permanent facilities. Therefore effort is
placed on the reconstruction of destroyed buildings and the repairing of important facilities and
infrastructures.

FLASH FLOOD SCENARIO MODELLING FOR PREPAREDNESS AND MITIGATION MEASURES. CASE STUDY OF BARCELONNETTE, FRANCE
15
3.6. From CDM to a Practical Approach
Several researches have been carried out to find suitable methods that are useful in order to combat
the ill effects of natural hazards such as floods, landslides and earthquake from leading to a disaster. It
is not a secret that natural hazards have been affecting the human specie since its existence. For
centuries, people at risk to drought, famine and heavy winds have made individual or small group
preparations to reduce the impact from these adversities (Leaning and Heggenhougen 2008). Today,
technology has brought about more sophisticated and state of the art techniques that are being used in
mitigating exposure to natural hazards.
Despite advances in knowledge and technology, vulnerability to natural hazards has increased in
many developed and developing countries (Gardner 2002). In fact, the frequency of recorded disasters
affecting communities has rose significantly from about 100 per decade in the period 1900-1940, to
650 per decade in the 1960s and 2000 per decade in the 1980’s and reached almost 2800 per decade in
the 1990s (International Council for Science 2008). These figures may seem startling and
overestimated; perhaps a better illustration is that of the UNEP which shows the trend in the
occurrence of disasters over the years in figure 11.

TITLE OF THESIS
16
Figure 11: Trends in natural disasters. Source: (UNEP 2008)
Since the disaster management cycle provides the framework for a reduction of loss from a disaster,
the question is therefore, why are so many disasters still occurring? The problem is that, for many
years, emphasis has been placed on recovery despite the goals set in the Millennium Development
Goals to reduce losses from natural disasters. Government officials should realize the challenges
disasters pose on the vulnerable population and on the economy. Even though the consequences are
known, many countries find it costly to invest in mitigation and preparedness measures and so are
more willing to help victims during the response and recovery process. Contrary to this view, research
as shown that preparedness is often times more economical than spending enormous amount of money
to compensate communities affected by a disaster.
The International Community like the United Nations and the Red Cross are willing to provide
assistance to people who are in dire need so countries will forever rely on them for assistance during a
crisis situation. There needs to be a shift from this approach to the new ‘buzz term’, which is,
‘Disaster Risk Reduction’ by placing emphasis on mitigation and preparedness. However, before an
effective mitigation and preparedness plan can be put into place, understanding vulnerability and the
nature of a hazard is important.
According to the report, the increase in the number of natural disasters has increased exponentially over the years. Reasons given for such an increase include: access to information and population growth. Population growth is said to have increased people’s vulnerability as the fight for space puts them in danger. These spaces or free lands are usually located on risk prone areas such as flood plains or steep slopes that are susceptible to landslides. While the attention was placed on disasters on a whole, concerns were raised as to the number of flood events that are increasing compared to other hazards such as Earthquakes.
The graph shows that floods have risen exponentially over the years compared to the number of earthquakes that have occurred in the same time frame.
FLASH FLOOD SCENARIO MODELLING FOR PREPAREDNESS AND MITIGATION MEASURES. CASE STUDY OF BARCELONNETTE, FRANCE
17
3.7. Understanding Vulnerability
According to the WMO (2008), vulnerability is the most crucial component of risk, in that it
determines whether or not exposure to a hazard constitutes a risk that may actually result in a disaster.
Therefore, in order to reduce recurrent losses and exposure to these phenomena, vulnerability cannot
be treated as a homogeneous and general term (Alcántara-Ayala 2002). In reality, several different
types and definition of vulnerability exist. Werritty et al (2007) defines vulnerability as the set of
conditions and processes that determine both the likelihood of exposure and resulting susceptibility of
individuals and social systems to the hazard. (IPCC 2001) describes vulnerability as the degree to
which a system is susceptible to or unable to cope with adverse effects of climate change including
variability and extremes while UNEP (2001) defined vulnerability as an aggregate measure of human
welfare that integrates environmental, social, economic and political exposure to a range of harmful
perturbations.
The views highlighted takes into account the same concepts: exposure, sensitivity and adaptation.
However, the main difference is that Werritty et al. (2007) focuses on both the human welfare and
the social system while UNEP (2001) and IPCC (2001) focused solely on the human welfare and the
social system respectively. What ever system the focus is on, this distinction clearly has implications
for how vulnerability is viewed and characterized with respect to the people affected (Berry et al.
2006).
More importantly are the differences in approaches between those that see vulnerability in terms of
variations in exposure to hazards and those that concentrate on variation in people’s capacity to cope
with hazards (Few 2003). Several classification of vulnerability exist, among them is the approach
put forward by (WMO. 2008). Vulnerability was classified by the WMO (2008) into:
1) Physical Vulnerability of people and infrastructure- which includes building, lifeline facilities
and material
2) Unfavourable organizational and economic conditions
3) Attitudes and motivations
Against this background, high income earners are said to be more able to avoid or bear related risks
while low income personnel cope with them to their detriment. The WMO (2008) implies that
disparity between income earners forces the urban poor to live in areas that are prone to natural
hazards because those areas are cheaper and available since high income earners tend to live far away
from these areas. This physical vulnerability tends to increase as a result of the dense concentration of

TITLE OF THESIS
18
potentially dangerous infrastructure and substances in urban areas (bridges, chemicals and electric
facilities).
Akin to this is the role that cultural attitudes play towards preparedness and mitigation measures. The
WMO (2008) further theorized that unwillingness towards flood preparedness and mitigation
measures increases vulnerability and recurrent losses are most times caused by a lack of hazard
knowledge or fatalistic attitudes.
Another concept related to vulnerability is the double structure which is shown in figure 12.
According to Bohle (2001), the external side of vulnerability is intrinsically related to exposure,
stress and shocks which are influenced by human ecological perspectives, entitlement theory and
political economy approaches. The internal side, he stressed is related to coping strategies and are
directly and indirectly influenced by action theory approaches, models of access to assets and crisis
and conflict theory.
Figure 12: The Double Structure of Vulnerability. Source (Bohle 2001)
The Pressure Release Model (PAR Model) indicated in figure 13, underlines how disasters occur
when natural hazards affect vulnerable people. Within this context, vulnerability in terms of three
progressive states: root causes, dynamic pressure and unsafe conditions. The model assumes that
disasters arise from some form of root causes which are structurally and historically embedded in the
cultural fabric of any given society. The root cause stressed Wisner et al. ((2005), is limited to power
structures and reflects how power is distributed in a society likewise exercise of the same. For
example, people who live in marginal areas (isolated or prone to flooding) tend to be of little
importance to those who hold economic and political power.

FLASH FLOOD SCENARIO MODELLING FOR PREPAREDNESS AND MITIGATION MEASURES. CASE STUDY OF BARCELONNETTE, FRANCE
19
Dynamic pressures are viewed as those activities and processes that translate the effects of the root
causes both temporally and spatially into unsafe conditions of general underlying economic social and
political patterns. Unsafe conditions in this case refers to specific forms in which the vulnerability of a
population expressed in time and space with a hazard (Wisner et al. 2005).
Figure 13: Pressure Release Model (PAR Model)
Source: (Wisner B et al. 2005)
However, whilst the model follows the progression of vulnerability from root causes to dynamic
pressures and unsafe conditions, it fails to adequately address the coupled human-environmental
system associated with the proximity to a hazard (Cutter et al. 2008). Amidst the concerns
highlighted, people have adopted mechanisms depending on the type environment they live in. In
doing so, they adopt or put in place their own coping mechanisms that will reduce vulnerability to
natural hazards.
3.8. Resilience and Natural Hazards
Like vulnerability, resilience encompasses several different concepts and definitions. Holling (1973 ),
initially defined resilience as a measure of persistence of a system and their ability to absorb change
and disturbance and still maintain the same relationships between populations or state variable. Later,
Berke and Campanella ( 2006) and the NRC (2006), termed resilience as the ability to survive and
cope with a disaster with minimum impact and damage. Within the hazard domain, resilience is
centered towards engineering and social systems and includes pre-event measures to prevent hazard
TITLE OF THESIS
20
related damage and losses (preparedness) and post event strategies to help cope with and minimize
impacts to disaster (Bruneau et al. 2003).
However, the ability of a community to recover from a hazardous event requires availability of
resources and mitigation measures that will assist in the reduction of recurrent losses and disruption to
the society. Notably too is the responsibility that should be taken by community members to ensure
they limit their vulnerable to the disastrous phenomena they often encounter. Therefore, while
government provides infrastructure and resources, community members should adopt coping measures
that will increase resilience. Furthermore, research as shown that resilient communities are far less
vulnerable to hazards than less resilient places (Cutter et al. 2008).
Therefore, preparation is very important for communities to be able to mitigate hazards. Coping with
floods is defined as all those measures with necessary policies and strategies of implementation which
a society may apply to alleviate the consequences of a flood event (Rossi et al 1994). The authors
further emphasized ways in which society may cope:
1) Do nothing, either structurally or administratively. This entails the abandonment of flood
plains for agricultural purposes.
2) Implementing non-structural measure as an approach to reduce the impacts from a flood
event. This is achieved by regulating the way in which flood plains are used and other flood-
prone lands, sensitizing the public and providing insurance schemes.
3) Implementation of flood control measures which includes intensive and extensive physical
measures which change a flood prone environment. Example of such measures include: dikes,
levees, dams and new flood related channels.
4) Combination of structural and non-structural measures. The availability of a large number of
measures to cop with floods lead to their classification as reactive and proactive. Reactive
measures in this case may include the improvised defences from floods while proactive
measures are well-prepared and planned flood defence and evacuation activity before a flood
occurs.
However it is important to note that each hazard requires different coping strategies and is restricted
to the type of impact the pose. Perception of the hazard also determines the type of coping strategy
that is taken.

FLASH FLOOD SCENARIO MODELLING FOR PREPAREDNESS AND MITIGATION MEASURES. CASE STUDY OF BARCELONNETTE, FRANCE
21
3.9. Risk Perception
It is of paramount importance to mention at this time that is that a hazard does not become a disaster
until people or other elements of value are affected. If a hazard occurs in an area that is uninhabited
by people and has no element of value, it is not considered a disaster. The disaster therefore occurs
when people are affected and their livelihoods are altered. Therefore, disaster is an anthropocentric
term and so any approach that is designed to mitigate potential hazardous events should include the
perception of people. Understanding the way in which different sectors or stakeholders of the society
perceive risk can be beneficial to the affected communities and provide an insight into how people
cope with disasters.
Risk perception may be complex in nature and relative since each individual will have a different
point of view. Nevertheless, it can provide information as to the coping mechanisms that are
employed at the community level. Community members are usually the first responders to natural
hazards and so have their own coping mechanisms that can be useful for an effective mitigation and
preparedness plan. Furthermore, risk perception plays an important role in the decisions that people
make in the sense that differences in risk perception lie at the heart of disagreements about the best
course of action between technical experts and members of the general public (Slovic P. 1987).
For years the experts and the public have always been at odds with each other. Experts see the public
as misinformed, badly educated and highly emotional Cohen (1998) while the public suspects that the
experts know less than they claim and that they are corrupt and because they are hired by the industry
or government officials Sjöberg (1999). Therefore the gap that exist between the two needs to be
bridged by utilizing both bottom up and top down approaches in planning. Regardless of the
scientific approaches presented to the public, their perception will determine whether or not
preparedness is essential.
According to (Van der Veen etal. 2008) , risk perception is the relationship between awareness,
worry and preparedness. They implied that once people are aware, they worry, which results in greater
preparedness. However, overtime people tend to forget the risk when they or their communities have
not been exposed for a long period of time. The authors further noted that, awareness will not
necessarily lead to worry and not necessarily to preparedness. Four types of risk characteristics were
given:
1) Ignorance: An individual who is not aware of a particular risk to an area will not worry or be
prepared because they are ignorant about it.

TITLE OF THESIS
22
2) Safety: This suggest that individuals who consider themselves to be safe will not worry and so
are more likely to be prepared for a risk because the risk is acceptable small or they are
prepared for it.
3) Risk Reduction: An individual who is highly aware, worried and badly prepared will demand
risk reduction.
4) Control: When an individual feels prepared, he or she has a sense of control over the risks and
is, as a result less worried.
Despite the many definitions put forward by Slovic (1987), Sjöberg (1999) and others, the term risk
perception is not fully defined and so can be substituted for risk experience. An individual who has
never been affected by a disaster will never have a true perception of the impacts such devastation
has. They may be aware of the impacts but their perception will be different from those who have
experienced such events. Notably too is the stance taken by scientist or personnel in charge of
mitigation and preparedness operations that employ a top down approach. Because they have never
been exposed to extreme events they often refuse to take into account people’s perception and the
results are often problematic. However, it is important to indicate that, even if someone has not been
affected by a hazard, they at least consider the level of risk.
According to (Sharlin H. 1989), an individual examines a risk or determines his or her favour towards
it by either accepting the level of risk, implement measures to reduce the risk or avoid it altogether.
Within this context, exposure to risk is seen as a matter of choice since the individual has the option
to avoid the risk. However, research has shown that many individuals are exposed to risk because of
perceived benefit of an activity. Stressed that an individual accepts the risk because the level of risk is
either small or the perceived benefit of the activity outweighs the risk. Reducing a risk usually leads to
a reduction of benefits which has many dilemmas for a society. Therefore, in case of voluntary risk, a
society has to make the trade-off between risk and benefit (Fischhoff et al. 1978). This trade-off
Raaijmakers (2008) further explained, depends on the nature of the risk. However, as pointed out by
Kraus and Slovic (1988) a specific hazard falls within a larger hazard domain. Since this is the case,
it is therefore important to differentiate between the different types of floods.
3.10. Different types of floods

FLASH FLOOD SCENARIO MODELLING FOR PREPAREDNESS AND MITIGATION MEASURES. CASE STUDY OF BARCELONNETTE, FRANCE
23
The different types of flood include: riverine floods, coastal floods, urban floods and flash floods.
Riverine Floods occur when the river exceeds its capacity to transport the entire load it carries along
the channel. The river bank overflows and flooding occur along the floodplain2. Flooding of this
nature is usually slow and may take days to cause a disaster. Opposite to this are Flash floods which
are rapid and causes are likely to cause damage within 6 hours. Coastal floods on the other hand
normally occur along coastal areas due to cyclonic activities like hurricanes, tropical cyclone which
produces heavy rainfall. Tidal waves which are created by earthquake or volcanoes can also cause
ocean or sea water to flow into coastal areas. Urban floods however, are normally referred to as a
flood which is caused by blockage of drainage system or lack thereof. In this case, the blockage of the
drainage system reduces the capacity of the drainage system to transport water freely into the river or
canalized system which aggravates flooding. Paved or concrete surfaces also prevent infiltration of
water and increases runoff which often times lead to flooding.
3.10.1. 2.6.1 Flash Floods
Flash floods can de defined as a flood that occurs within six hours of a rainfall event and is
characterized by its rapid movement. Since dam break, levee failure and debris jam results in the swift
movement of water, flooding which occurs as a result of these mishaps can be termed as flash floods.
Researchers have seen the merit to this argument and have elaborated on the impact these floods may
have on the vulnerable population. For example, UNESCO (1999), outlined two ways in which flash
floods can be categorized:
1) Natural flash floods: these can be formed as a result of heavy rainfalls on a waterlogged
surface or in a natural system. Once infiltration capacity has been exceeded, flooding occurs
as water flows from steep mountainous slopes downstream.
2) The formation of artificial flash floods: Flash floods can also occur as a result of the sudden
release of impounded water by the failure of a dam or other natural or man made barriers.
Figure 14 indicates the ways in which flash floods usually occur.
Figure 14: Flash Floods Occurrence
2 A flood plain in this case represents an area which surrounds the river channel that has been formed during previous flood events. Sedimentation occurs along the river bank as the river looses its capacity to carry its entire load.

TITLE OF THESIS
24
Source:(BBC)
3.10.2. Flash Floods in Europe
Flash floods have been a nuisance to many European countries for several decades. Data on the
number of flash floods that have occurred in Europe since 1950s, have been recorded by (Gaume E et
al. 2009). An examination of the data indicates that the most extreme floods with greater magnitude
occur in the Mediterranean and Southern Alps than in the inner continental countries. According to
these data, heavy rainfall accumulation is not a precursor for inducing flash floods since other factors
play an integral role in triggering such events (Norbiato et al. 2008).
While Gaume et al. (2009) focused on the occurrence of flash floods in Europe, Jean-Luc (2002)
compiled a list of the major floods that have occurred in France. Table 8 shows a list of some of the
major floods that have occurred in France from 1875-2002.
Table 8: Major floods that have occurred in France 1875-2002 Year Place Deaths/Victims (v) 1875 Loire 1910 The Seine in Paris 150,000 v 1930 The Garonne in Toulouse 200 d+ 10,000 v 1940 Eastern Pyrenees 171 d 1958 Cevennes rivers 50 d 1977 Lannemezan 38 d 1987 Grand-Bornand Torrent 16 d 1988 Nimes 23 d 1992 Vaison-la-Romaine 11 d+ 50,000 v 1993 The Leze in Bollene 46 d 1993 Burst Sea walls in Camargue 3 d 1994 South-East Corsica 26 d
Source: Jean-Luc (2002) According to Jean-Luc (2002), these events are triggered by changes in land occupation which
increases surface runoff thus causing a flood. These figures may not be the actual number of losses or
flood event that have occurred in the region. In fact, most of the events that have occurred in ungauge

FLASH FLOOD SCENARIO MODELLING FOR PREPAREDNESS AND MITIGATION MEASURES. CASE STUDY OF BARCELONNETTE, FRANCE
25
streams have not been documented or reported Gaume et al. (2009), hence the number could be
higher. It was based on this premise that the author collated a report of the number of floods that have
occurred in Europe.
�
Flash floods have cost billions of dollars in damage and numerous fatalities. Unless
appropriate mitigation measures are designed and implemented, the impact of this hazard is
likely to increase as an increase in population density has resulted in larger numbers of people
occupying vulnerable sites. However, such measures must be informed by a comprehensive
assessment of the vulnerability of people at risk thereby taking into account perception of the
different stakeholders.
3.11. Flood Management
The most important approach towards managing flood risk involves the identification of the nature
and extent of the threat it poses to the vulnerable population. This approach requires the use of
hydrodynamic flood models that will simulate the flow of water along a flood plain in which the
depth, velocity and water level is indicated. Outputs from these models should therefore indicate:
1) Areas where mitigation structures such as dykes and embankments may fail
2) Critical facilities such as hospitals, schools, bridges, emergency shelters and emergency
response agencies.
3) Areas that should be evacuated in the event there is a flood and routes that will be impassable.
Over the years several researches involving the use of hydrodynamic models have been conducted.
These models vary in the spatial domain in which they simulate flood events.
3.12. Hydrodynamic Models
Several different types of hydrodynamic models are available which range from simple one
dimensional (ID) to complex two and three dimensional (2D/3D) Models. 1D model are used when
the aim of the study is to simulate flood event in a river or canalized system. (Alkema, Nieuwenhuis et
al. 2007) have shown the usefulness of 1D Models in assessing river response to climatic events and
changes in topography and land cover. Examples of these models include: HEC-RAS and LISFlood.
Whilst these models provide a rapid evaluation of water level in a networked river system, they have
some limitations. These include the inability to simulate lateral diffusion of the flood wave and the
discretization of topography as cross sections Samuels (1990). 1 Dimensional Hydraulic Models are
unable to represent the true physical and hydrodynamic conditions that are important in understanding

TITLE OF THESIS
26
different river processes. Coupled with this, is the inability to simulate hydrodynamic conditions that
are common during large scale extreme events such as glacial outburst. As a result, ID hydraulic
models has been augmented or replaced by 2 Dimensional (Merwade et al. 2008).
2 D models such as SOBEK, Mike21 and TELEMAC are used to model flood propagation once the
water surpasses the canalized system. The capabilities of these models to provide information on the
rapidity at which water overflows a river system unto a flood plain makes them useful (Huang and
Spaulding 1995).
3.13. Applying Hydrodynamic Model Outputs to Real World Scenario
With the increase in the number of disastrous flood events that have occurred over the past years,
emphasis on preparedness and mitigation cannot be over-emphasized. One of the most important
approaches involved in conducting a study or a research is its applicability to the real world. This
study uses the scenario of a potential dike break and applies it to preparedness and mitigation.
3.13.1. Dike Break
An unexpected flood event such as a dike break can have a disastrous consequence on communities
along the flood plain of a river. As mentioned earlier, these communities rely on dykes or levees as a
mitigation measure to prevent flooding. It therefore provides a false sense of security and when such
structures fail, the impact is often times overwhelming. Many literatures have shown how high
precipitation intensity affects or play a role in the failure of such mitigation measures. However, dike
failure is not always caused solely by high precipitation intensity but is a result of a combination of
other factors such as discharge and changes in the land use pattern of an area or storm like weather
patterns.
For example, the flood event that affected the coastlines of the Netherlands and England in 1953 was
caused by a combination of high spring tide and windstorm. These caused an increase in the water
level that rose up to approximately 5.6 meters destroying flood defenses which resulted in extensive
flooding. It was reported that about 1835 people were killed in the Netherlands, 307 in the UK while
28 lives were lost in the Belgium. Among the reasons for such devastation was the fact that no
warning was issued and so the people were not prepared. Another reason was attributed to the
emphasis that was being placed on reconstruction and improving infrastructure after the Second
World War while neglecting the costly flood defenses (Baars 2007).

FLASH FLOOD SCENARIO MODELLING FOR PREPAREDNESS AND MITIGATION MEASURES. CASE STUDY OF BARCELONNETTE, FRANCE
27
3.13.2. Responses after the flood event
In the Netherlands, the aftermath resulted in the formation of the Delta Works, which was targeted at
protecting the river estuaries (Rhine and Meuse) and the building of storm surge barriers in the
Eastern Scheldt. The United Kingdom made investments into new sea defences and the Thames
Barrier programme was launched in an attempt to protect London from future storm surge.
Almost 50 years after the 1953 disastrous event, The Netherlands was once again under the threat of
another flood. The last flood occurred so long ago and so the impact was not vivid in the minds of the
people. The newly settled migrants were even more ignorant of the previous flood event. Although
there were no fatalities, the flooding caused massive damage to farmlands. Unlike the 1953 flood
event, the 1995 event was caused by snow melt coupled with heavy torrential rainfall. There was a
possibility that the river could breach its banks and this resulted in 250,000 people being evacuated.
This reinforced the need for a better protection of the dykes and made the platform for a new Delta
Plan.
For centuries, it has been the duty of the responsible organizations to increase the height of the dykes.
However, they have realized the potential danger of conducting such measures and have now given
more “Room for the River”. Giving more space to the river has become a major priority in river
management in the Netherlands as oppose to re-enforcing dykes. This paradigm shift is in response to
the inability to respond adequately to potential floods with high discharge levels. Therefore, a more
sustainable method, called Room for the River Project, is being implemented to give more space to
the river. Plans are being made to widen river channels and creating and de-poldering polder areas.
3.13.3. Reasons for dyke failure
According to Lachouette et al (2008), piping erosion is one of the main causes of failure in a water
retaining structure such as dams, dykes and levees. The term piping as Masannat (1980) explains, is a
subsurface form of erosion which involves the removal of subsurface soils in pipe-like channels that
are prone to erosion to a free or escape exist. In a dyke, it involves the flow of water through or under
the dyke as a result of differences in the level of the water. The water that is carried through the
opening is usually accompanied by soil particles which are deposited along the floodplain or into
people’s homes. Baars (2007) outlined that dike failure can be caused from unstable, loosely
compacted sand layers near the dyke (liquefaction) or uplift behind a dyke of clay layer on top of a
sand layer by high pore pressure during a storm or high water.

TITLE OF THESIS
28
According to Costa and Schuster (1988), floods caused by dam breaks induce debris flow, mudflows
or floating debris which can be severe. Capart and Young (2001) further pointed out that in some
extreme cases, the volume of the entrained material could reach the same order of magnitude as the
volume of the water initially released from the failure. For example as reported by Kale (1994), the
Chandora River-dam break flow which occurred in India in 1991 scoured away about 2 m thick layer
of bed material downstream.
3.14. France Risk Prevention Plan
In France, four sub-state levels exist: 1) National Level: The Department of Civil Defense and Safety (DDSC, ministry of interior)
prime responsibility is to prevent the risk of disasters of all natures and monitor rescue
operations at the national level of France and abroad.
2) Regional Level - Préfet (Prefects) supervise natural hazards and emergency planning while
ensuring efficiency and coordination at the regional level.
3) Departmental- Préfet departmental
4) Municipal-Local (Mayor) and the department prefect are responsible for ensuring the
prevention of risks and the distribution of aid and rescue.
Each state level as shown in figure 15 has its own responsibility in relation to managing the risk associated with natural disasters.
Figure 15: State Levels in France and responsibilities
Source: (Gaume Eric. 2007)

FLASH FLOOD SCENARIO MODELLING FOR PREPAREDNESS AND MITIGATION MEASURES. CASE STUDY OF BARCELONNETTE, FRANCE
29
Over the years France has France has implemented several programs that are geared towards reducing
vulnerability to flooding. These include the Risk Prevention Plans (PPR), Flood Prevention Action
Programmes, The National Solidarity System that compensate victims of natural disasters and weather
forecasting by Meteo France.
In fact, risk prevention in France has had its genesis in 1935 with the Submersible Surface Plan (PSS).
This entailed the identification of areas that were vulnerable to flooding along major rivers such as
Loire, Seine, Garonne and Rhone. These maps, however, were low in spatial resolution and did not
reinforce constraints (Luc 2002). Since 1952, the ORSEC (Organization des Secours-Rescue
Organization) provided a contingency plan for each disaster: natural hazards, industrial accidents,
pills and accidents. It was not until 1982, that a policy known as the Compensation Law was designed
to aid victims of natural disasters. The PER –Exposure to Predictable Natural Hazards Plan later
followed in 1984 which saw the zonation of areas vulnerable to hazards and preventative measures
along with land use planning and flood insurance schemes.
The need for reinforcing the policies that have been implemented was highlighted and in 1995,
reinforcement was gained when a single regulatory tool known as the Prevention of Plans for the
Prevention of Risks (PPR) was implemented for the pre-existing procedures and policies (Pottier
2005). Table 9 provides a brief synopsis of what the PPR entails.
3.14.1. Risk Prevention Plans
Risk Prevention Plans (PPR or Prevention de Prevention des Risques) are the main zoning instruments
in France (Erdlenbruch K et al. 2009). This is a legal document that defines risk zones and allocates
specific building restrictions in the zones that are said to be at risk. The overall objective of the PPR is
to reduce vulnerability of different elements that are prone to disasters such as floods. Table….shows
the hazard zonation.
Table 1: PPR Zonantion Zones Planning Response Red Zone (high risk areas) Development forbidden Blue Zone (low to medium risk) Suitable for construction with restrictions White Zone (negligible or low risk) Building permitted
A better illustration can be seen in figure 16 that shows the zonation in Barcelonnette.

TITLE OF THESIS
30
Figure 16: Barcelonnette Risk Zonation Figure 17 shows that a large portion of Barcelonnette is classified in the red and blue zones with few
areas located in the white zone. The red zones are classified as high risk areas in which construction
is not permitted. Existing land owners are also not allowed to improve construction works to premises
they currently occupy. In the event a property is destroyed or damaged by flooding, there is a
possibility that reconstruction in the area will be barred by the Municipality or the Prefecture. Even if
the local council approves building construction, the Prefectures can object to the permission that was
granted. The PPR also prohibit construction within 50m of a protection structure such as dikes and
levees.
The Blue zones which allow construction are prone to risks but are not as high as the red zones.
Therefore, construction is permitted with guidelines provided by the Prefectures or the Municipality.
The white zone is located in areas that have a lower level of risk or where disasters have not occurred
in the past. For example, if a disaster occurs in an area that was deemed safe, that area will be
classified in the red or blue zones.

FLASH FLOOD SCENARIO MODELLING FOR PREPAREDNESS AND MITIGATION MEASURES. CASE STUDY OF BARCELONNETTE, FRANCE
31
While the overall framework of the PPR is to reduce risk, it may have a negative impact on the people
living in the red zones. An area that is designated as unsafe may affect the valuation of property and
the possibilities of obtaining insurance. Land owners if given insurance may be asked to pay higher
premiums.
3.14.2. Flood Prevention Action Programs
This was first introduced in 2002 under the name Plans Bachelot. In 2006 it revised under the name
PAPI (Programme d’Action pour la Prevention des Inondations), Flood Prevention Action
Programmes (Erdlenbruch K et al. 2009). PAPI promotes an integrated basin-wide approach to flood
risk management for small catchments prone to flood risk. Each PAPI is managed by a local water
management institution (WMI). This program is geared towards: improving knowledge about floods,
flood warning systems, reducing vulnerability within the framework set out by the PPR, offer local
protection for urban areas with new infrastructure and promotes the regulation of water flows within
the natural floodplain.
3.14.3. National Solidarity Schemes for Natural Disasters
Victims from flood events are compensated through a financial scheme that is funded by the central
government and the insurance companies. According to (Erdlenbruch K et al. 2009) two main systems
exist in France: The National Catastrophe System (Cat-Nat) which covers all insured households and
assest that are not linked with agricultural production and the National Fund for Guarantee of
Agricultural Losses (Fonds National de Garantie des CCalamites Agricoles, FNGCA which applies to
losses suffered by the agricultural sector. Currently the FBGCA is being updated and will be replaced
by a private system called the Multi-risk Climatic Insurance.
The Cat-Nat system was put in place in 1982 and is managed by the Central Government, private
insurance companies and the French Public Insurance Company CCR (Caisse Centrale de
Reassurrance). (Erdlenbruch K et al. 2009) reported that this scheme only assist victim of natural
hazards only if the conform to the regulations in the PPR. The FNGCA on the other hand applies to
non-insured natural disasters affecting agricultural production while Multi-risk Climatic Insurance
covers several risks that have been triggered as a result of climatic conditions.
TITLE OF THESIS
32
3.14.4. ORSEC Plan
In 2004, the new ORSEC plan focused on: 1) The establishment of a civil defence network
2) Identification and assessment of risk
3) A general organizational structure for managing all types of events including specific
arrangements for unusual events.
4) Preparedness exercises and training phases
5) Updating
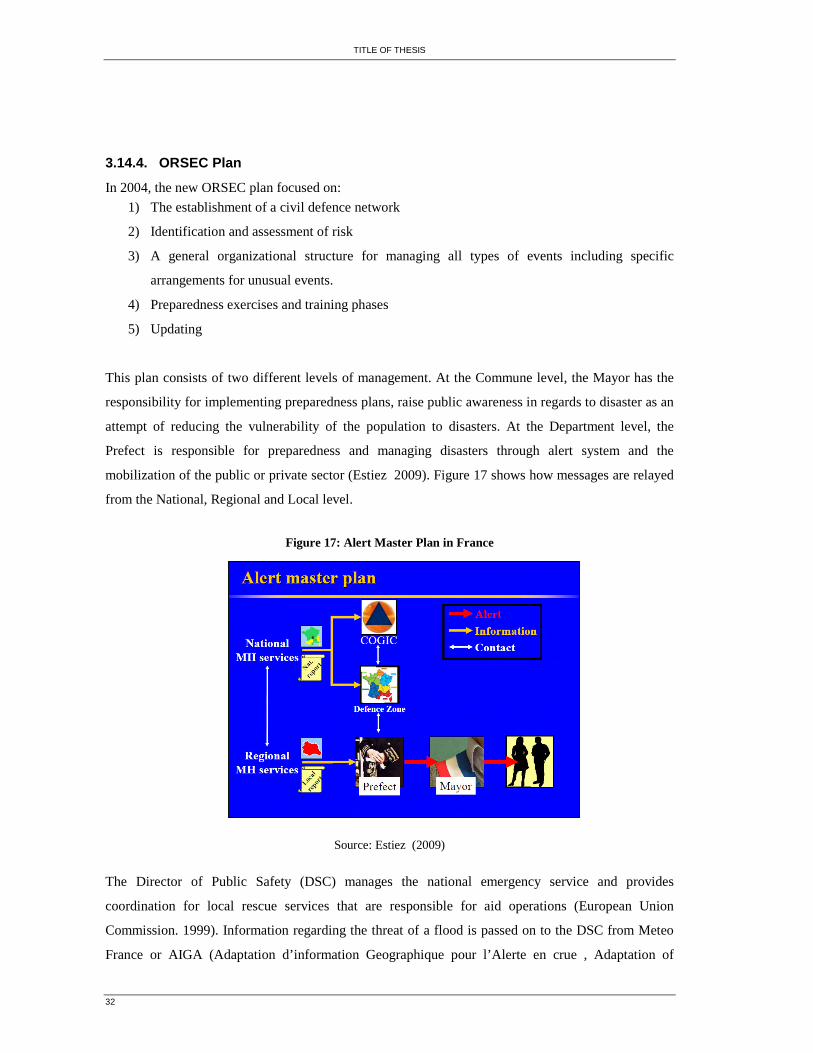
This plan consists of two different levels of management. At the Commune level, the Mayor has the
responsibility for implementing preparedness plans, raise public awareness in regards to disaster as an
attempt of reducing the vulnerability of the population to disasters. At the Department level, the
Prefect is responsible for preparedness and managing disasters through alert system and the
mobilization of the public or private sector (Estiez 2009). Figure 17 shows how messages are relayed
from the National, Regional and Local level.
Figure 17: Alert Master Plan in France
Source: Estiez (2009)
The Director of Public Safety (DSC) manages the national emergency service and provides
coordination for local rescue services that are responsible for aid operations (European Union
Commission. 1999). Information regarding the threat of a flood is passed on to the DSC from Meteo
France or AIGA (Adaptation d’information Geographique pour l’Alerte en crue , Adaptation of

FLASH FLOOD SCENARIO MODELLING FOR PREPAREDNESS AND MITIGATION MEASURES. CASE STUDY OF BARCELONNETTE, FRANCE
33
Geographic Information for flood Warning). Meteo France and AIGA use Radar to estimate rainfall in
real time for France on a km2 scale. Risk maps are produced which are colour coded and range from
red, orange to yellow with red indicating a disaster is likely to happen. Once a threat to a disaster has
been reported to the DSC who is attached to the Minister of Interior, the Department is alerted. DSC
utilizes the COGIC (Centre Operational de Gestion, Operational Centre) to deploy resources and aid
to areas that will be affected. The Department then informs the Mayor who triggers the alert to
community members.
The top down approach illustrated in the French Alert system may not be appropriated in a flash flood
scenario. The system does not allow community members to be proactive in disseminating
information even though they are the first responders to a disaster. The reality is that the time scale of
a flash flood is too short to allow the flow of information UNESCO (1999) in the way it is presented
in the diagram. Furthermore, forecasting and monitoring is done on few rivers in France. Therefore,
there are some rivers that do not cover real-time information.
Even though real time forecasting is available, mountainous region have problems with recording
accurately rainfall. For example, the debris flow that occurred in August 19, 1996 that blocked the
main road 3km east of Barcelonnette was not recorded by the rain gauge in Barcelonnette or the
nearby town in Jausier (Flageollet et al 1999). Therefore, preparation for them at the community level
is important and so community members should be involved in the dissemination of information.
The top down approach illustrated in the French Alert system may not be appropriated in a flash flood
scenario. The system does not allow community members to be proactive in disseminating
information even though they are the first responders to a disaster. The reality is that the time scale of
a flash flood is too short to allow the flow of information (UNESCO 1999) in the way it is presented
in the diagram. Therefore, preparation for them at the community level is important and so community
members should be involved in the dissemination of information.

TITLE OF THESIS
34
4. Methodology
The methodological framework shown in figure 18 illustrates the procedures that were followed. This
included the pre-field work, field work and post field work phase.
Figure 18: Flow Chart
4.1.
4.2.
4.3.
4.4.
4.5.
4.6. Title Paragraph
This is Body Text style. Use this for the body text.
4.6.1. Title Sub-paragraphs
This is Body Text style. Use this for the body text.
4.6.1.1. Title Sub-paragraph
This is Body Text style. Use this for the body text.
�����������������
���� ���������
�������
������������ ��
������
���� �������
�� �� �����
�������������
��� ���� �������
������� ���� ��
��� ����
����� ���
!�"
��!�� ������
��������� �����
� #�����
� $����""� �
� ����� �
%�"���� ������������� ��������
������
!������ �
&����
��"�
!�'�����
(������
!�'�����
���� �%�"���� ������
&�� � ��
����
)��� �����& ���
)�����������
�������
!� ���"�����
)��"���� ����
)��
�������� ��
�)��"���� ���
)��
)������ ����!�"�
����
������ ��������
��� ��*��
���������� �

FLASH FLOOD SCENARIO MODELLING FOR PREPAREDNESS AND MITIGATION MEASURES. CASE STUDY OF BARCELONNETTE, FRANCE
35
3.1 Pre field work Phase
During this period, data was gathered from secondary sources that were relevant to the research. An
inventory of the data provided by the Mountain Risk Project in the form of maps and documents were
put together. Land use maps, Building maps and a High Resolution Image of the area were printed
which acted as a guide for the fieldwork. Table 10 illustrates the data that were available.
Table 10: Available Data
Data Content Scale/Resolution Date Type Aerial Photographs Aerial and Ortho-
photographs 1:50,000 1956, 1974, 1982,
2000, 2002 GeoTiff
Boundary Map Study Area Boundary
1:10,000 2002 Shapefile
Discharge Monthly discharge N/A 1950-2008 XML
DTM Digital Terrain Model
1:10,000 (10m) 2000 Ascii
Elements at risk Buildings, roads 1:10,000 2004 Shapefile
Elevlines Elevation lines 1:10,000 (10m) 1956 Shapefile
Geological Map Geology 1:25,000 1974 GeoTiff
Geomorphology Map
Type of Geomorphology
1:25,000 1989 GeoTiff
Land cover Maps 1:10,000 (10m) 1:50,000
1972, 1982, 1974, 2000, 2002
Shapefile
Precipitation Rainfall N/A 1926-2004
Topographical Map Scanned Topographical map
1:10,000, 25,000 1931 GeoTiff
3.2 Field work phase
Both primary and secondary data were collected during the fieldwork. Primary data collected included
validation of land use and the different elements at risk. River cross-section measurements and the
height of the embankments were taken along the Ubaye River channel using a measuring tape. The
elements that might impede the flow of water such as bridges, roads and buildings were identified.
Secondary data such as Reports, Maps and Pamphlets were also collected from the RTM, the
Municipality in Barcelonnette and the Museum de la Valle in Jausieur, a town that is close to
Barcelonnette. Table 3 shows the secondary data that were collected.
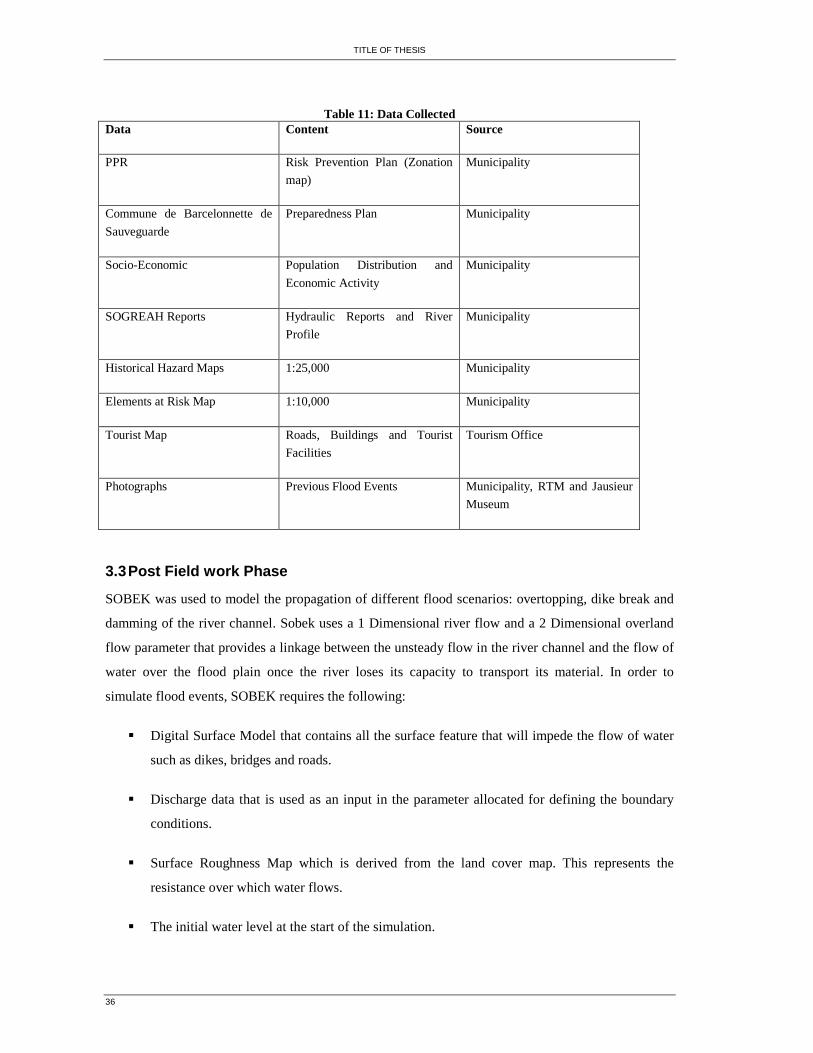
TITLE OF THESIS
36
Table 11: Data Collected Data Content Source
PPR Risk Prevention Plan (Zonation map)
Municipality
Commune de Barcelonnette de Sauveguarde
Preparedness Plan Municipality
Socio-Economic Population Distribution and Economic Activity
Municipality
SOGREAH Reports Hydraulic Reports and River Profile
Municipality
Historical Hazard Maps 1:25,000 Municipality
Elements at Risk Map 1:10,000 Municipality
Tourist Map Roads, Buildings and Tourist Facilities
Tourism Office
Photographs Previous Flood Events Municipality, RTM and Jausieur Museum
3.3 Post Field work Phase
SOBEK was used to model the propagation of different flood scenarios: overtopping, dike break and
damming of the river channel. Sobek uses a 1 Dimensional river flow and a 2 Dimensional overland
flow parameter that provides a linkage between the unsteady flow in the river channel and the flow of
water over the flood plain once the river loses its capacity to transport its material. In order to
simulate flood events, SOBEK requires the following:
� Digital Surface Model that contains all the surface feature that will impede the flow of water
such as dikes, bridges and roads.
� Discharge data that is used as an input in the parameter allocated for defining the boundary
conditions.
� Surface Roughness Map which is derived from the land cover map. This represents the
resistance over which water flows.
� The initial water level at the start of the simulation.
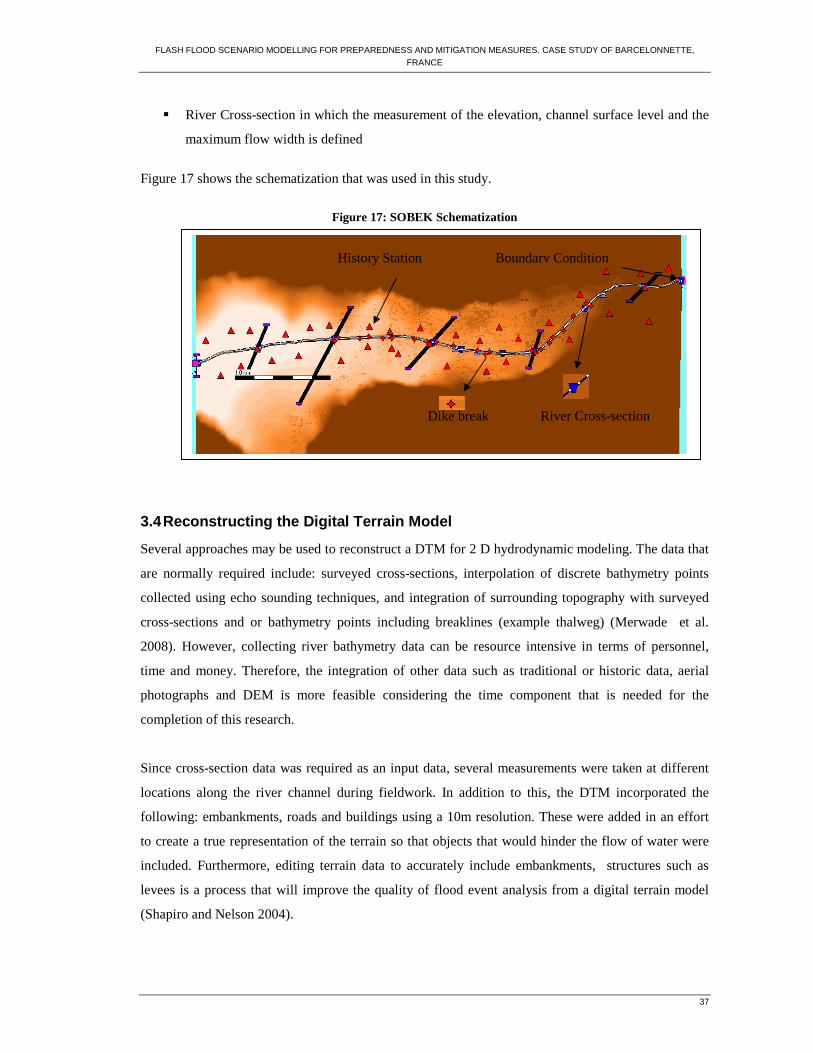
FLASH FLOOD SCENARIO MODELLING FOR PREPAREDNESS AND MITIGATION MEASURES. CASE STUDY OF BARCELONNETTE, FRANCE
37
� River Cross-section in which the measurement of the elevation, channel surface level and the
maximum flow width is defined
Figure 17 shows the schematization that was used in this study.
Figure 17: SOBEK Schematization
3.4 Reconstructing the Digital Terrain Model
Several approaches may be used to reconstruct a DTM for 2 D hydrodynamic modeling. The data that
are normally required include: surveyed cross-sections, interpolation of discrete bathymetry points
collected using echo sounding techniques, and integration of surrounding topography with surveyed
cross-sections and or bathymetry points including breaklines (example thalweg) (Merwade et al.
2008). However, collecting river bathymetry data can be resource intensive in terms of personnel,
time and money. Therefore, the integration of other data such as traditional or historic data, aerial
photographs and DEM is more feasible considering the time component that is needed for the
completion of this research.
Since cross-section data was required as an input data, several measurements were taken at different
locations along the river channel during fieldwork. In addition to this, the DTM incorporated the
following: embankments, roads and buildings using a 10m resolution. These were added in an effort
to create a true representation of the terrain so that objects that would hinder the flow of water were
included. Furthermore, editing terrain data to accurately include embankments, structures such as
levees is a process that will improve the quality of flood event analysis from a digital terrain model
(Shapiro and Nelson 2004).
Dike break River Cross-section
History Station Boundary Condition

TITLE OF THESIS
38
An accurate Digital Terrain model is essential in order to produce a realistic flash flood scenario.
Since sinks3 or depressions normally exist in regular Digital Elevation Models, using such a DEM
may generate faulty results. Therefore, hydrological processing is needed before it can be used for
modeling different flash flood scenarios. In this research, ILWIS DEM Hydro-processing tool was
used to fill the depressions. Filling the sinks gives a more hydrological correct surface to which the
flow direction algorithm can be applied (International Association of Hydrological Science 2004).
This provided a terrain in which water can flow without the hindrance from the depressions.
3.5 Manning’s N Roughness Coefficient
Hydraulic models requires the specification of flow resistance or roughness parameters that in theory,
can be specified for each computational cell (Hunter et al. 2005). Surface roughness is important in
order to have a true representation of the topography over which water is likely to flow. This should
include natural and man made surfaces since they influence infiltration and runoff. Man-made
surfaces such as tarmac and concrete are impermeable and so runoff increases as flood water
propagates on these surfaces. Trees and grasses tend to slow down the movement of water and
increases infiltration. On the other hand, deforested areas or barren lands allow water to flow freely
once infiltration capacity has been exceeded. Therefore, a map which indicates the surface roughness
as a value is useful as an input for modeling.
The Surface Roughness Map was generated from the land use map. Manning’s n Coefficient value
was given to each land use type after which an attribute map was created with all the values. Table 12
show the manning’s n values that were used.
Table 12: Manning’s n Coefficient Land Use Manning’s n Coefficient
Alluvial Deposits 0.04 Arable Land 0.035 Black Marls 0.029
Broad Leaved Forest 0.04 Built area 1
Coniferous Forest 0.147 Grassland 0.244
River 0.1 Pastures 0.037
Source: (Alkema D. 2007) and (Mohamoud Y. 1992)
3 Sinks in this case are areas that are lower than surrounding areas. If other cells are higher than the surrounding cells water will flow into the cells that are lower.
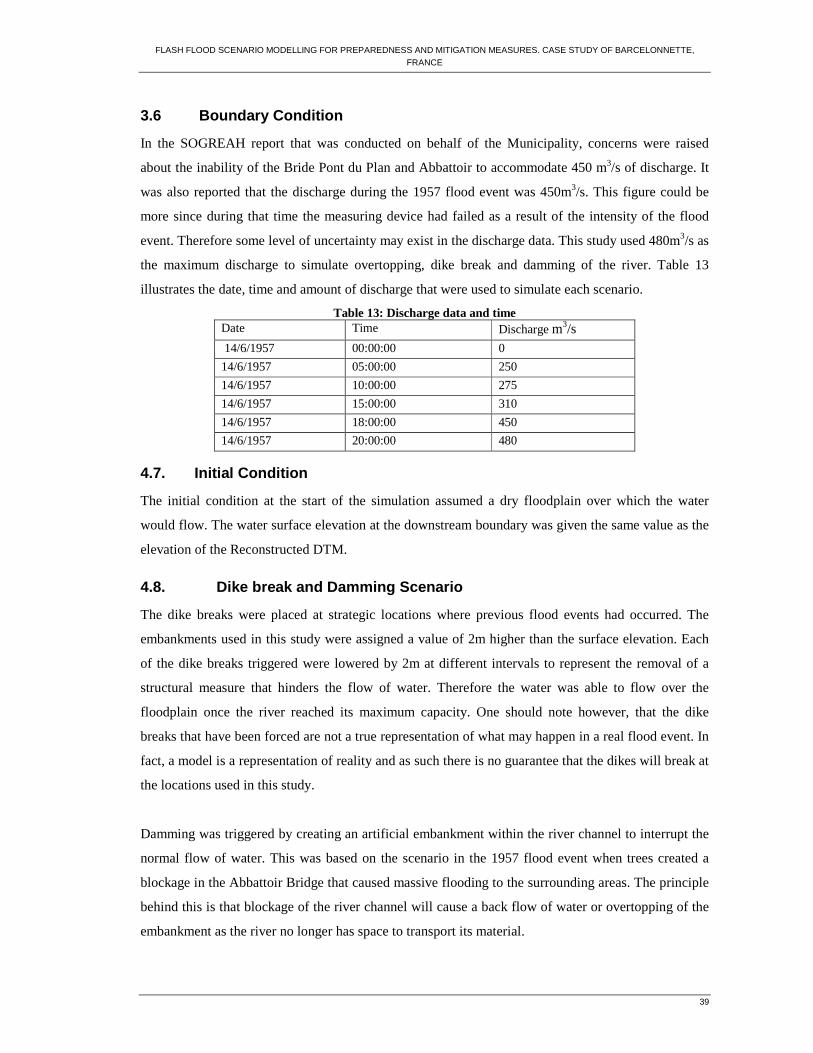
FLASH FLOOD SCENARIO MODELLING FOR PREPAREDNESS AND MITIGATION MEASURES. CASE STUDY OF BARCELONNETTE, FRANCE
39
3.6 Boundary Condition
In the SOGREAH report that was conducted on behalf of the Municipality, concerns were raised
about the inability of the Bride Pont du Plan and Abbattoir to accommodate 450 m3/s of discharge. It
was also reported that the discharge during the 1957 flood event was 450m3/s. This figure could be
more since during that time the measuring device had failed as a result of the intensity of the flood
event. Therefore some level of uncertainty may exist in the discharge data. This study used 480m3/s as
the maximum discharge to simulate overtopping, dike break and damming of the river. Table 13
illustrates the date, time and amount of discharge that were used to simulate each scenario.
Table 13: Discharge data and time Date Time Discharge m3/s
14/6/1957 00:00:00 0 14/6/1957 05:00:00 250 14/6/1957 10:00:00 275 14/6/1957 15:00:00 310 14/6/1957 18:00:00 450 14/6/1957 20:00:00 480
4.7. Initial Condition
The initial condition at the start of the simulation assumed a dry floodplain over which the water
would flow. The water surface elevation at the downstream boundary was given the same value as the
elevation of the Reconstructed DTM.
4.8. Dike break and Damming Scenario
The dike breaks were placed at strategic locations where previous flood events had occurred. The
embankments used in this study were assigned a value of 2m higher than the surface elevation. Each
of the dike breaks triggered were lowered by 2m at different intervals to represent the removal of a
structural measure that hinders the flow of water. Therefore the water was able to flow over the
floodplain once the river reached its maximum capacity. One should note however, that the dike
breaks that have been forced are not a true representation of what may happen in a real flood event. In
fact, a model is a representation of reality and as such there is no guarantee that the dikes will break at
the locations used in this study.
Damming was triggered by creating an artificial embankment within the river channel to interrupt the
normal flow of water. This was based on the scenario in the 1957 flood event when trees created a
blockage in the Abbattoir Bridge that caused massive flooding to the surrounding areas. The principle
behind this is that blockage of the river channel will cause a back flow of water or overtopping of the
embankment as the river no longer has space to transport its material.

TITLE OF THESIS
40
4.9. SOBEK Output Maps
The model produces the following maps: maximum water depth, maximum flow velocity, time to
flooding, duration and impulse. The maximum water depth indicates areas that will be inundated at a
certain height and is generated in meters (m). Maximum flow velocity on the other hand shows the
speed at which the flood propagates. Soetanto R and Proverbs (2004) stated that the higher the
velocity of the flood water, the greater the higher the level of danger to the exposed elements at risk.
However, velocity does not cause a high level of danger if the water is not high enough. However, as
McBean et al. (1988) pointed out, a velocity of 3 m/s with a depth of 1m can produce a force
sufficient to exceed the design capacity of a typical residential wall. Therefore the level of danger is
higher when the water depth and the velocity are combined. This determines whether or not people
are carried away by the water. The duration shows the length of time the flood stays within a
particular area. This map is generated in SOBEK as the impulse map.
SOBEK also produces a map that indicates areas that will have a shorter or longer waiting time
during a specific flood scenario. The principle behind the latter is that, areas that are inundated first
will have a shorter waiting time and so will have to respond to early warning systems or evacuate
quickly than other areas that have a longer waiting time. The length of time the water takes to recede
is also provided likewise the amount of sediment deposition that may occur as the water scours the
area over which it flows.
These maps were generated in ILWIS and were later used to analyze the impact flooding from each
scenario had on the critical elements at risk. The time taken for each scenario to reach bank full
discharge and the time it took to transport all its material was plotted in an attempt to see variations in
each of the scenarios.
4.9.1. Distance and Route to Shelter
1) The length of the roadway was calculated and converted into kilometers after which the
average speed at which a normal person walks was calculated for each road length.
2) A network dataset was created using the ARGIS Network Analyst Tool. This was later used to
create the shortest route to each emergency shelter. In addition to this, the time taken to reach
the closest emergency shelter was calculated using the service facilities option. This was
calculated for different time interval: 5, 10, 15, 20, 30 and 40 minutes assuming that the
average person walks at a speed of 5 km/hr.

FLASH FLOOD SCENARIO MODELLING FOR PREPAREDNESS AND MITIGATION MEASURES. CASE STUDY OF BARCELONNETTE, FRANCE
41
4.9.2. Perception Survey
A community risk perception study that was carried out by Marjory Anginard, PHD Student at the
Technische Universitat in Germany who is currently working in the Mountain Risk Project. The
Questionnaire was mailed to the residents of Barcelonnette in 2009. Some of the questions posed to
the respondents were in relation to flood experience, knowledge about the hazard, concerns and the
preparation various stakeholders who are responsible for hazard mitigation in Barcelonnette.
Response from these questions could provide some insight into how the community members perceive
different hazards in relation to flooding. Furthermore as pointed out by Raaijmaker et al (2008),
perception can give an in sight into how prepared a community is.
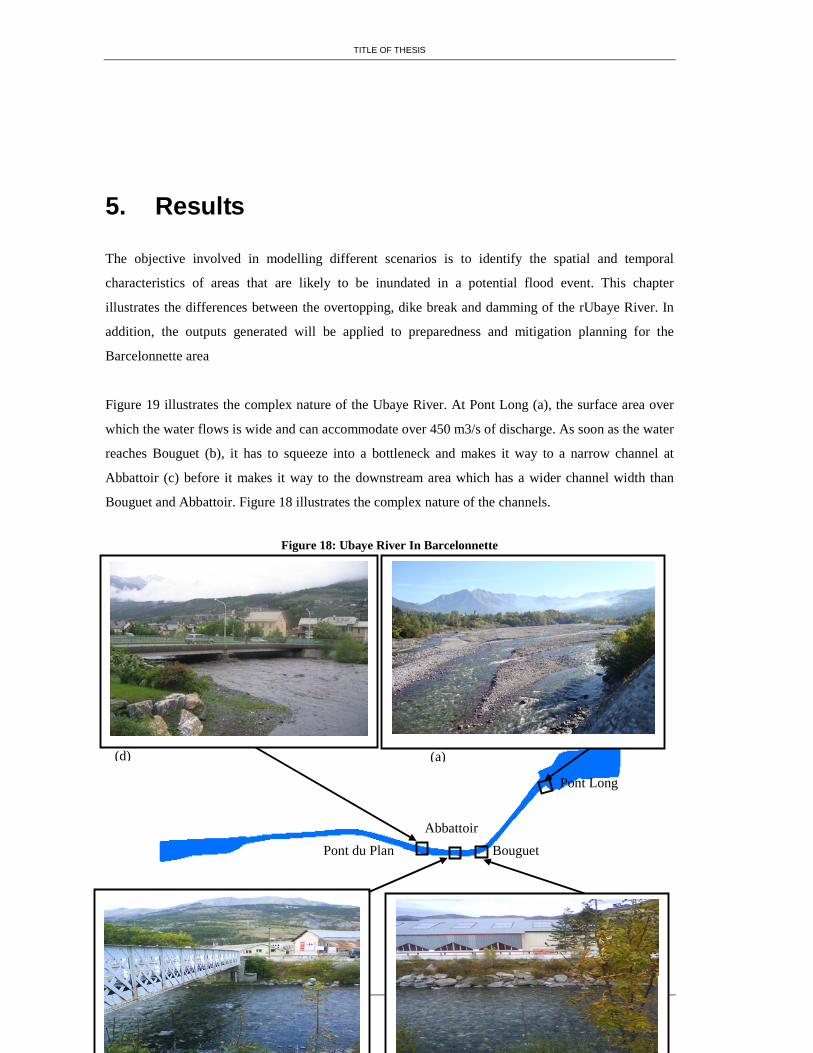
TITLE OF THESIS
42
5. Results
The objective involved in modelling different scenarios is to identify the spatial and temporal
characteristics of areas that are likely to be inundated in a potential flood event. This chapter
illustrates the differences between the overtopping, dike break and damming of the rUbaye River. In
addition, the outputs generated will be applied to preparedness and mitigation planning for the
Barcelonnette area
Figure 19 illustrates the complex nature of the Ubaye River. At Pont Long (a), the surface area over
which the water flows is wide and can accommodate over 450 m3/s of discharge. As soon as the water
reaches Bouguet (b), it has to squeeze into a bottleneck and makes it way to a narrow channel at
Abbattoir (c) before it makes it way to the downstream area which has a wider channel width than
Bouguet and Abbattoir. Figure 18 illustrates the complex nature of the channels.
Figure 18: Ubaye River In Barcelonnette
Bouguet
Abbattoir
Pont du Plan
Pont Long
(d) (a)

FLASH FLOOD SCENARIO MODELLING FOR PREPAREDNESS AND MITIGATION MEASURES. CASE STUDY OF BARCELONNETTE, FRANCE
43
5.1. Spatial and temporal characteristics of each flood scenario
The temporal characteristics of a flood are important as it indicates the time at which a flood may
pose serious danger to the population. An unexpected flood event that occurs during day time may not
cause the same devastation as those that occurs at night when people are asleep and unaware of what
is happening. Therefore it is important to simulate different scenarios and assess the time at which
each scenario may cause inundation as the river loses its capacity to carry its entire load. Figure19
shows the discharge each scenario is able to transport and the temporal component.
Figure 19: Dicharge transported in each scenario Both Damming and the dike break have similar characteristics while the normal flood event is the
outlier of the two. Each scenario starts with the same amount of discharge but as soon as they
approach bank full discharge of 250 m3 at 4.48 hrs, there is a gradual change in the discharge the
river is able to carry in each scenario. It is evident that for a normal scenario, the discharge stays in
the river channel; even though overtopping may occur, the water continues to flow downstream. In the
damming scenario, the maximum discharge the river can transport is approximately 350 m3 of the
discharge which is a bit lower than the normal scenario. The figure also implies that damming and a
dike break scenario may pose greater risk since the river will not be able to transport the normal
amount of discharge it normally carries. These differences are also obvious in the areas covered by the
inundation as shown in Table 14.
Table 14: Area Covered in each Scenario Area covered (103m2) Depth (m)
Overtopping Dike break Damming
Not flooded 11580.7 11539.1 11279.4 0.0-0.2 351.2 3186.4 106.8 0.2-0.5 250.1 288.2 181.4 0.5-1.0 41.5 1521.2 230.2
Time of Flooding for each scenario
0
50
100
150
200
250
300
350
400
450
500
0:00 4:48 9:36 14:24 19:12 0:00
Time (hrs)
Dis
char
ge (m
3/s)
Damming
Dike break
Without dike break
! ���������
�(�� � �����
�(�)��*���)��

TITLE OF THESIS
44
1.0-1.5 38.7 431.6 133.9 1.5-2.5 28.8 251.5 212.2 2.5-3.5 0 0 97.6 >3.5 49.5 0 0
The differences outlined in Table 14 indicate that the area covered and the depth of the water is larger
for Damming than for all the other scenarios. The Dike break and the normal scenarios are
comparatively close when the water depth is between 0.2 and 0.5. However, as the water depth
reaches 0.5m, inundation from a dike break covers a larger area than a flood without a dike break or
damming. As soon as the depth reaches 2.5m, there is no inundation for dike break and without a dike
break scenario. The Damming scenario covers a smaller area compared to dike break and a normal
flood when the water depth is at 0.2m. As soon as the depth of the water increases, more areas are
inundated up to a height of over 3.5m that none of the other scenarios reached. Generally, the larger
the flood event, the bigger the flood depth of the area inundated. Therefore, since flooding caused
from damming produces a higher depth than dike break and a flood event without dike break, it is
more likely to cause more damage than the others even though they can be destructive as well.
5.2. Number of Buildings Inundated
The number of buildings inundated in table 2 also shows that damming has the potential to cause a
more disastrous impact on the number of buildings inundated. These are buildings that are used for
residential and commercial purposes. Clearly, more buildings are inundated with the damming
scenario compared to the other scenarios.
Table 15: Number of buildings inundated
Area covered (103m2) Depth (m) Overtopping Dike break Damming
Not flooded 1351 1324 1340 0.0-0.2 27 28 21 0.2-0.5 17 47 12 0.5-1.0 11 29 23 1.0-1.5 7 11 20 1.5-2.5 5 9 17 2.5-3.5 0 0 2
>3.5 0 0 0 Total number of
buildings inundated 67 124 95
The table shows that none of the buildings are inundated when the water reaches a depth of 3.5m.
More buildings are flooded when the water depth is between 0.2 and 1.0m in a dike break scenario
than the other scenarios. However, significant differences lie as soon as the water depth is greater than
FLASH FLOOD SCENARIO MODELLING FOR PREPAREDNESS AND MITIGATION MEASURES. CASE STUDY OF BARCELONNETTE, FRANCE
45
1.0m. A total of 39 buildings are flooded with damming scenario while 20 buildings were inundated
for the dike break scenario and only 12 buildings were flooded in the overtopping flood event scenario
between 1.0 and 3.5m. The flood event without damming or dike break has more dry cells which
suggest that fewer buildings will be flooded in a overtopping flood event compared to the other
scenarios.
5.3. Critical Elements at Risk
Within the areas inundated, lie special elements at risk. These special elements at risk depicted in
figure 2 includes: fire station, police station, camping sites, schools, supermarket, bridges, roads and
buildings that provides logistic, security, consumer goods, education, assistance in rescue operations
during a crisis situation and a mode of transportation. Figure 2 shows that 2 schools, the fire station, a
police station, sporting complexes, camping sites, bridges, roads and several buildings are at risk if a
flood of the magnitude of such scenario should occur.

TITLE OF THESIS
46
Figure 20: Water Depth and critical elements at risk
It is the role of fire fighters to respond to an emergency either by providing rescue operations or aid to
the vulnerable population during a disaster. If the fire station is flooded, this hampered the efficient
����������
� � ������ �
��� � ���

FLASH FLOOD SCENARIO MODELLING FOR PREPAREDNESS AND MITIGATION MEASURES. CASE STUDY OF BARCELONNETTE, FRANCE
47
manner in which they respond to an emergency. Whilst the people at the camping sites or at the
sporting complex can go to another location, equipment and the necessary relief items at the fire
station cannot. The fire station is therefore more critical and so there will be a lost in logistic centre
and coordination can therefore be problematic. In a situation like this, the RTM Office and the
Municipality may be used as a logistic centre since they are not flooded.
Infrastructures such as bridges and roads facilitate the ease at which people travel. If these are
flooded, then the people are affected as well since roads and bridges will be impassable. The main
road in Barcelonnette runs along the river and serves as a pathway for many people who travel to
Cuneo, Italy. A flood event of each scenario can be devastating since traffic flow will be interrupted.
Repeated flooding may cause gradual deterioration of infrastructures and may cause emergency routes
to be inaccessible when they are needed the most.
A school is an educational institution that fosters the growth of knowledge. When the schools are
inundated, it causes a disruption in the school system as students are not able to go to school. On the
other hand, there may be instances where their homes are inundated as well so the flooding of the
school may not affect whether or not students attend classes. In most cases, schools are used as an
emergency shelter during a flood so the students whose homes are inundated may also seek refuge at
the school. If these are flooded then other schools may have to be used as shelters to accommodate
those people who have to abandon the flooded shelters. Gladly though, the schools that are inundated
in figure 8 are not used as emergency shelters in Barcelonnette. The two camping sites however are
used as emergency shelters for tourist.
5.4. Impulse
Flooding may pose serious consequences to these critical facilities and other elements at risk. The
depth indicated in figure 20 shows that people located in areas inundated from dark brown to light
blue could experience water from their ankles to their hips respectively. Flood water at the ankle and
knee may not pose serious threat to people and so they can still cope. However as soon as the water
reaches the hip, then their coping capacity reduces and poses serious risk. Figure 2 also shows that
there is a possibility that flood water could cover up to first floor of a building in the area in the
damming scenario. The latter pose serious threat to life and damage to infrastructures and buildings.
However, it is important to note that the depth of the water does not pose great damage if the velocity
is not fast. Therefore, an insight into the potential damage a flood may pose will depend on the

TITLE OF THESIS
48
velocity and the depth. This information is depicted in the impulse maps shown in figure 21 for the
different scenarios which is a combination of the velocity and the depth of the water. Figure 21 shows
each of the scenarios pose harm to the elements at risk. However, areas inundated in a damming
scenario may experience more damage compared to the scenario without dike break and Dike break.
The water in these areas could cause vehicles to float and may carry people along the way if they are
within the area at the time of the event. Therefore it is important that people stay out of these areas
that are inundated.
The legend was defined based on the value obtained from the impulse map. When the impulse is
between 0.0 and 0.2m/s2, the water may not pose a threat to people. As a result, this was given the
class “little danger”. As soon as the water reaches 0.3 and 0.4 m/s2 it may pose a threat to the
vulnerable population but may not have a devastating impact on the different elements at risk. The
water therefore has the potential to cause little damage and so this is shown dangerous in the legend.
As the impulse goes beyond 0.4 the level of danger increases and it is with this in mind that it was
allocated very dangerous to extremely dangerous respectively.

FLASH FLOOD SCENARIO MODELLING FOR PREPAREDNESS AND MITIGATION MEASURES. CASE STUDY OF BARCELONNETTE, FRANCE
49
����������
� � ������ �
��� � ��

TITLE OF THESIS
50
Figure 22: Duration

FLASH FLOOD SCENARIO MODELLING FOR PREPAREDNESS AND MITIGATION MEASURES. CASE STUDY OF BARCELONNETTE, FRANCE
51
Figure 22:

TITLE OF THESIS
52
Figure 22: Time to flooding
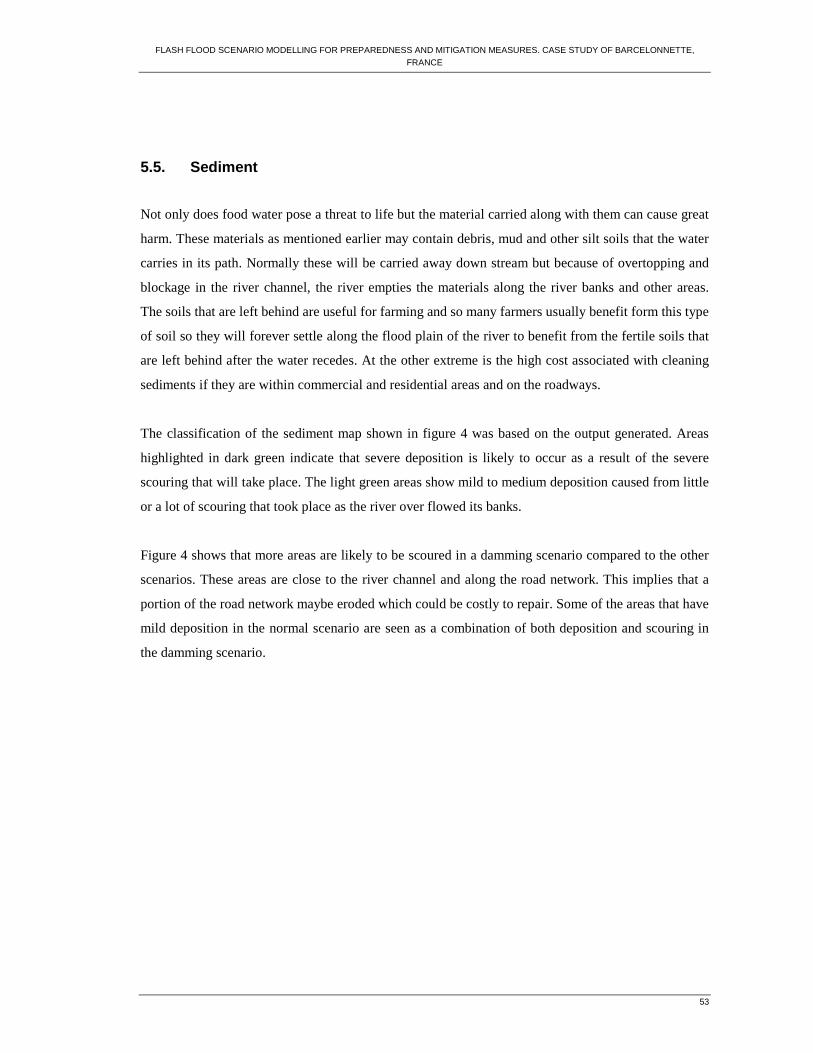
FLASH FLOOD SCENARIO MODELLING FOR PREPAREDNESS AND MITIGATION MEASURES. CASE STUDY OF BARCELONNETTE, FRANCE
53
5.5. Sediment
Not only does food water pose a threat to life but the material carried along with them can cause great
harm. These materials as mentioned earlier may contain debris, mud and other silt soils that the water
carries in its path. Normally these will be carried away down stream but because of overtopping and
blockage in the river channel, the river empties the materials along the river banks and other areas.
The soils that are left behind are useful for farming and so many farmers usually benefit form this type
of soil so they will forever settle along the flood plain of the river to benefit from the fertile soils that
are left behind after the water recedes. At the other extreme is the high cost associated with cleaning
sediments if they are within commercial and residential areas and on the roadways.
The classification of the sediment map shown in figure 4 was based on the output generated. Areas
highlighted in dark green indicate that severe deposition is likely to occur as a result of the severe
scouring that will take place. The light green areas show mild to medium deposition caused from little
or a lot of scouring that took place as the river over flowed its banks.
Figure 4 shows that more areas are likely to be scoured in a damming scenario compared to the other
scenarios. These areas are close to the river channel and along the road network. This implies that a
portion of the road network maybe eroded which could be costly to repair. Some of the areas that have
mild deposition in the normal scenario are seen as a combination of both deposition and scouring in
the damming scenario.
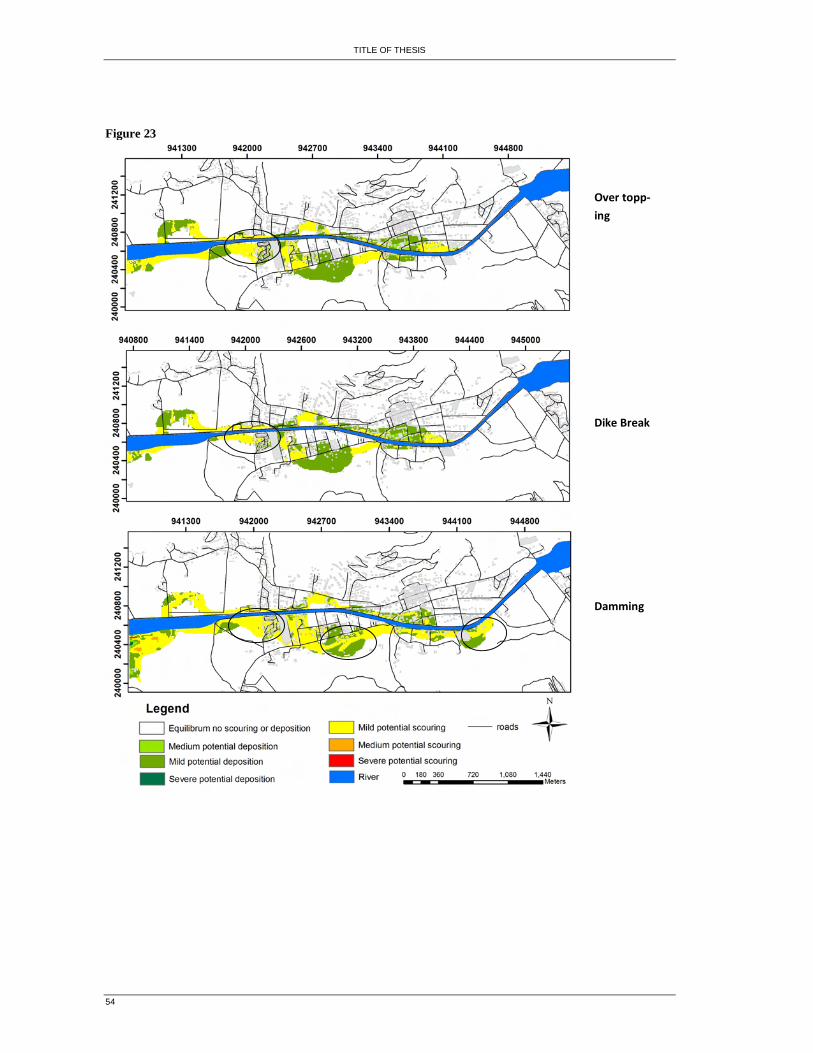
TITLE OF THESIS
54
Figure 23
�����������
��
� � ������ �
��� � ��

FLASH FLOOD SCENARIO MODELLING FOR PREPAREDNESS AND MITIGATION MEASURES. CASE STUDY OF BARCELONNETTE, FRANCE
55
5.6. Emergency Shelter Analysis
Figure 23 illustrates the emergency shelters that should provide a place of refuge during a flood in
Barcelonnette.
Figure 23: Emergency Shelters
The figure shows that two of the emergency shelters have the possibility of being flooded out if a
flood event of the damming scenario should occur. The emergency shelters located along the river are
reasons for concern. Even though they may not be flooded out in none of the scenarios, there is a
chance that they may be inundated if the discharge increases or a dike break or damming occurs in
other areas. One must remember at all times that the dike break or damming initiated in this study
does not imply that they will occur at the same location. Therefore multiple dike breaks or damming
may take place. If this is the case then more areas will be inundated.
5.7. Distance to Shelters
People should be aware of the time it takes to reach to a particular shelter. Also, the time it takes for
an area to be flooded could give an idea of how quickly people living in a particular area should
evacuate to the nearest or safest shelter if there are living within an area that has the potential to be

TITLE OF THESIS
56
flooded. Figure 23 shows the proximity each building is to a shelter and the time a particular area is
inundated.
Figure 23: Distance and time of flooding Figure 24: Shelter Capacity

FLASH FLOOD SCENARIO MODELLING FOR PREPAREDNESS AND MITIGATION MEASURES. CASE STUDY OF BARCELONNETTE, FRANCE
57
Figure 25 Time taken to reach Shelter
Figure 25 shows that people located in the dark green areas will take 5 minutes to reach the closest
shelter. As the colour changes from light green to orange the time increases up to 40 minutes. Even
though the map shows the time taken to reach a shelter for a wide area, not everyone will need
evacuation since the flood extent only covers a section of the area. However, people are mobile and
may not be at their homes when an unexpected scenario happens. Therefore it is important for
everyone living in the area to be cognizant of this information so in the event there is a warning and
they know how quickly they should evacuate from their current location. Also, if children, the elderly
and disabled people are to be evacuated, this time will increase. Table 16 shows the population
distribution of Barcelonnette.
Table 16: Barcelonnette Population distribution Composition (years) 1990 1999
<14 20.8% 18% 15-29 22% 19.3%
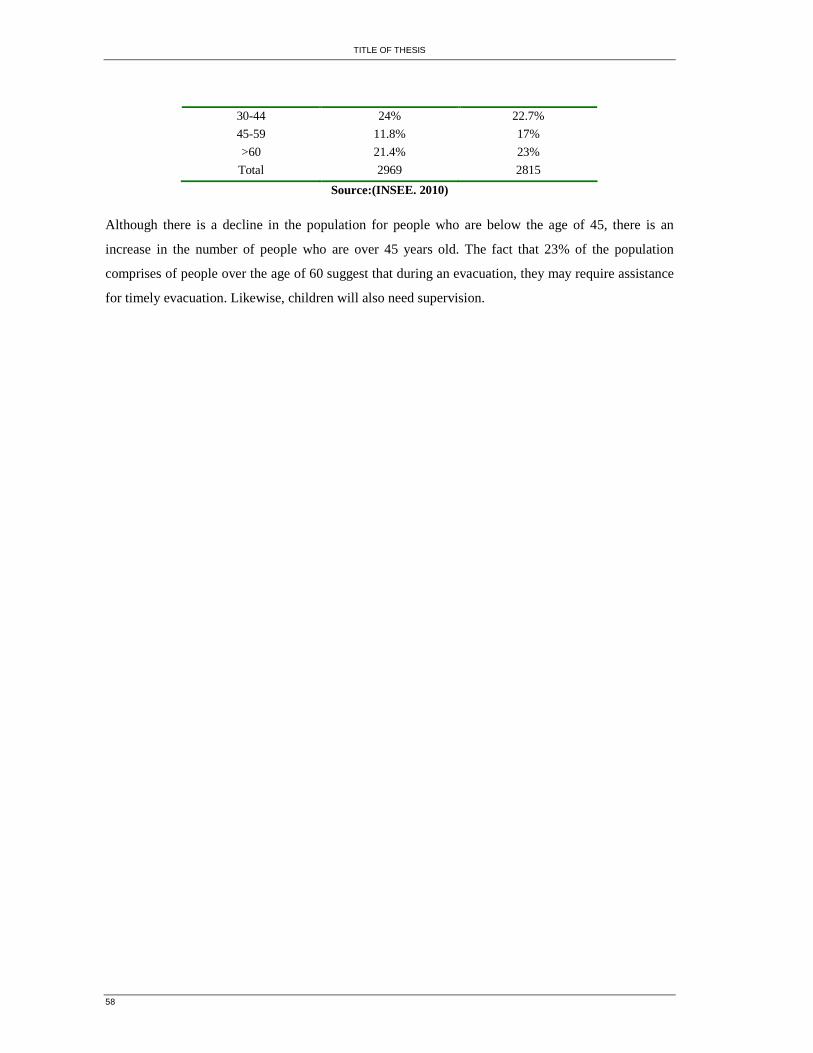
TITLE OF THESIS
58
30-44 24% 22.7% 45-59 11.8% 17% >60 21.4% 23%
Total 2969 2815
Source:(INSEE. 2010) Although there is a decline in the population for people who are below the age of 45, there is an
increase in the number of people who are over 45 years old. The fact that 23% of the population
comprises of people over the age of 60 suggest that during an evacuation, they may require assistance
for timely evacuation. Likewise, children will also need supervision.
FLASH FLOOD SCENARIO MODELLING FOR PREPAREDNESS AND MITIGATION MEASURES. CASE STUDY OF BARCELONNETTE, FRANCE
59
6. Perception Study
This section analyses a community risk perception survey that was conducted in 2009 in
Barcelonnette. Over the years, natural hazards such as landslides, debris flow and flooding have
occurred in the area. Hazard such as landslides and debris flow have been a frequent occurrence in
recent times and have caused several damages in the area. Although floods have occurred in the area
too, the last devastating one occurred in 1957 which was along time ago and so may not be a constant
reminder to the people living in the area since some are probably dead or have migrated from the area.
Therefore many people living in the area may not be prepared since they would not have experienced
a flood before. Those who have experienced flooding would more likely be prepared.
In addition, responsible organizations that are at the forefront of reducing risk to phenomenon such as
floods have to be prepared. One way of finding knowing an organization level of preparedness can be
through the perception of the people who are living in the area that are exposed to the hazards. This
study therefore uses this medium to see how prepared the people are and the views about the
responsible organizations.
6.1. Perception Analysis
Figure 26 shows that over 50% of the respondents are the first family generation living in the area.
Normally grandparents or older family members are seen as a source of passing down traditional
knowledge about events that have occurred in an area to younger members of the family. This implies
that majority will not have any history or experience to flooding in the area. Therefore, over
approximately 43 % of the respondents may have some knowledge or experience to flood events since
their parents, grandparents and great grand parents have been living in the area.
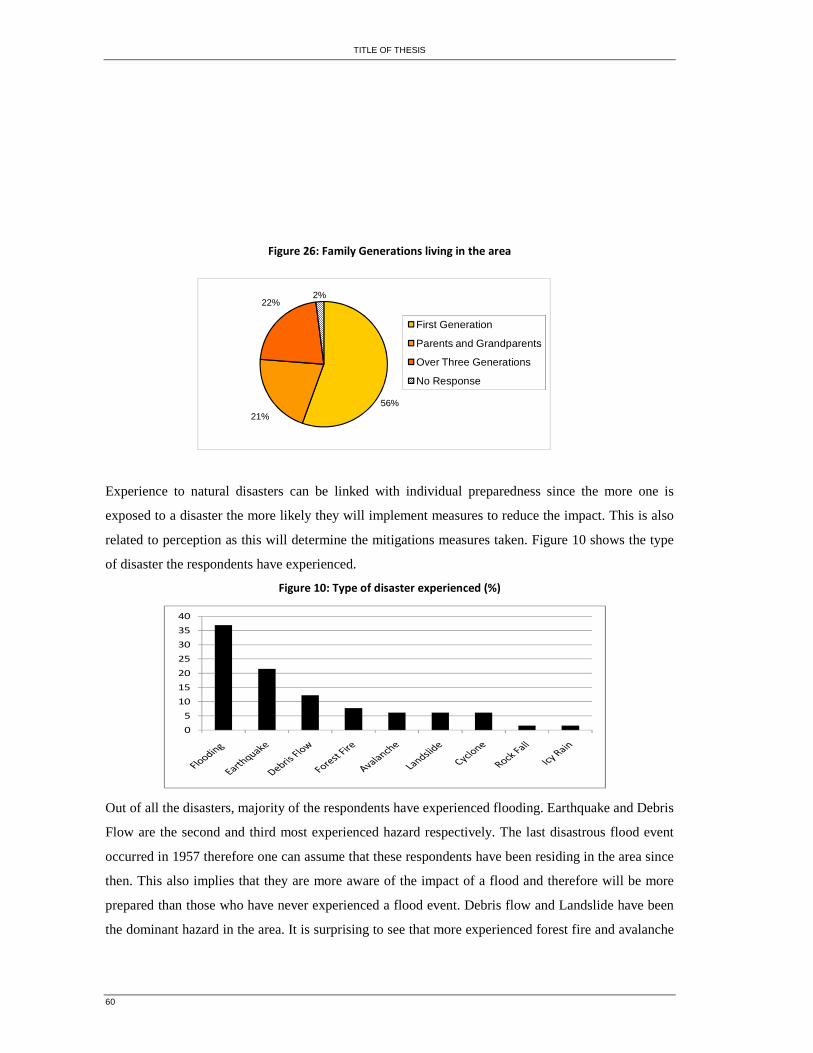
TITLE OF THESIS
60
������������� ������������������������������
Experience to natural disasters can be linked with individual preparedness since the more one is
exposed to a disaster the more likely they will implement measures to reduce the impact. This is also
related to perception as this will determine the mitigations measures taken. Figure 10 shows the type
of disaster the respondents have experienced.
���������������� �!���������"�����#�!�$% &�
Out of all the disasters, majority of the respondents have experienced flooding. Earthquake and Debris
Flow are the second and third most experienced hazard respectively. The last disastrous flood event
occurred in 1957 therefore one can assume that these respondents have been residing in the area since
then. This also implies that they are more aware of the impact of a flood and therefore will be more
prepared than those who have never experienced a flood event. Debris flow and Landslide have been
the dominant hazard in the area. It is surprising to see that more experienced forest fire and avalanche
56%21%
22%2%
First Generation
Parents and Grandparents
Over Three Generations
No Response
�
+
,�
,+
��
�+
-�
-+
.�

FLASH FLOOD SCENARIO MODELLING FOR PREPAREDNESS AND MITIGATION MEASURES. CASE STUDY OF BARCELONNETTE, FRANCE
61
than landslides. Landslides and rock fall may have occurred on steeper slopes that are not in habited
and so they were not affected.
Since Flooding is the main hazard that the respondents have experienced, it would be good to know
their awareness about that particular hazard. Figure 27 shows the flood experience of the respondents.
�������'������!��"�����#��� ����������!�����
Figure 27 shows that 15% of the respondents were ignorant to the occurrence of a disaster while 61%
were aware of some that have occurred in the area. Only 4% of the respondents have been directly
affected by a disaster while 18% whom had been affected did not suffer any damage or injury.
Explanations as to why majority of the respondents are aware of natural disasters in the area are not
hard to come by. Under French law, once a property is being sold, it is the responsibility of a vendor
to inform potential investors of foreseeable risk to natural hazards such as floods, landslides,
earthquakes and others. Therefore, while some of the respondents have not been affected by any
disaster, they are aware of previous events that have occurred in the area. On the other hand, the
respondents who are unaware may be due to the fact that such information was not provided at the
time of purchase or they have rented the household in which they currently reside. Another reason
may be due to the generation gap. Approximately 51% of the respondents were from the first
generation living in the area; therefore they may be the ones who are ignorant to the disasters.
It will also be useful to know the respondents view on the possibility of a flood occurring in
Barcelonnette and the impact it may have on the community or their family. From the survey, about
40% think that it is likely to occur soon. Almost 80% shared their concerns of the potential impact a
flood could have on the community.
�������(��)������������ �������!�
15%
61%
4% 2%
18%
Not A w ar e
No , Bu t A w ar e o f Som e in th isT ow nDid no t Su ffe r Dam ag e o r In ju ry
Dir e ctly A ffe cte d
No Re s po ns e
Likelihood for a flood event to occur
0% 20% 40% 60% 80% 100%
Could occur soon
Consequences in Barcelonnette

TITLE OF THESIS
62
While some of the respondents think that flooding may have a direct consequence on transportation
route, few believe that it can have an impact on their family. 80% believe that flooding could have a
devastating impact on utilities such as electricity and water. Again the 2008 event is an indication that
a flood is likely to occur and when it happens, the impact may be devastating. Furthermore flood
events have occurred in many countries so the response to this question might be as a result of what
has occurred in other places. Those respondents who have been living in the area since 1957 may have
seen the impact the disaster had on the infrastructures. Persons who do not believe that a flood event
may have an impact on their family may be prepared or live in areas that are not along the river.
Therefore, they will feel some level of security until an unexpected scenario occurs.
Figure 29 shows the level of danger associated with natural disasters. Majority of the respondents see
landslides as the most dangerous hazard followed by flooding and earthquake. Landslides may be seen
as causing more danger because of the proximity of the residents to the big La Valette Landslide and
since no major floods have occurred in the area since 1957, flooding will be ranked second as a result
of the 2008 near flood event. Earthquake may be ranked third because prediction is not possible and if
it occurs, other hazards can be triggered as well. Other reasons may be as a result of their experience
to the disaster or what they have seen occurred in other countries.
�������*��+������ ����������#����!�, �����������!���������
Danger associated with different disasters
0% 20% 40% 60% 80% 100%
Avalanche
Landslides
Debris Flow
Rock fall
Flooding
Forest fire
Earthquake
Extremely dangerous Very dangerous Little dangerousNot very dangerous Not dangerous No response

FLASH FLOOD SCENARIO MODELLING FOR PREPAREDNESS AND MITIGATION MEASURES. CASE STUDY OF BARCELONNETTE, FRANCE
63
The community members were asked to express their concerns about natural hazards. Figure 30 shows
that 32 % of the respondents were concerned about natural hazards. These persons may be those
persons who had experienced previous hazards or have seen the impact in other countries. The 4%
who are scared may be the ones living along the River or have been directly affected in the past. This
implies that they may not be prepared and so they are scared. Only 8% of the respondents are not
worried about a hazard occurring. Maybe the mitigation measures that have been put in place have
reinforced a false sense of security and so they do not see the occurrence of a hazard such as a flood
as a threat.
�
������-��.�#�������������������/��!��
The respondents also provided their views in regards to the level of knowledge for each stakeholder
who is in charge of reducing risk to natural hazards. Figure 31 shows that majority of the respondents
thinks that the Police and the Fire Chief are more aware of the risk in the area than the other actors.
This may be as a result of their roles as responders to a disaster or a tragedy. The RTM may be ranked
second since they are responsible for protection measures in the mountains. Over the years they have
constructed numerous check dams and have reforested areas that were deforested in an attempt to
reduce the potential disastrous impact of a hazard being triggered. RTM has also assisted in the
evacuation of persons from their homes in previous floods in other communities and have used
machineries to clear sections of the Ubaye River during previous flood events.
Figure 31: Level of knowledge for each stakeholders
0 38 76 114 152 190
Police and Fire Chief
RTM / ONF
Municipality
Communate
The Department
Insurrance Company
The Ministry
The Regional
You and your Family
2 9 %
2 5 %
8 %2 %4 %
3 2 %W o n 't th in k a b o u t a n y m o r e
C a lm a n d Co n f id e n t
N o t c o n c e r n e d
C o n c e r n e d
S c a r e d
N o R e s p o n s e

TITLE OF THESIS
64
Therefore the police, fire chief and the RTM are aware of their local conditions and have been on the
fore front of mitigating against hazards in the area. The Municipality, ranked second, could be as a
result of their responsibility as those responsible to reduce natural hazards in their community.
In an emergency, organizations that are responsible for mitigating risk should be prepared for
unforeseen scenarios.
Figure 32: How well prepared are the actors? 0 38 76 114 152 190
Fire Men, Police
RTM / ONF
Municipality
Communate
Department
State Ministry
You and Your Family
Regional
Media (Jounalist)
Insurrance Companies
Very well Well Less Bad Very Bad No Response
Majority of the respondents listed the fire and police, RTM and the Municipality has the stakeholders
who are well prepared. This may be as a result of them being at the fore front of previous disasters in
the area. The Municipality may be seen as well prepared because of the responsibility it has in
reducing the impacts from natural disasters. A limited number of the respondents and their family are
prepared for a disaster. This maybe because they do not reside in the areas that are prone to disasters
so they do not adopt any form of reduction measures. Even though the Insurance companies deal with
numerous compensations from damages caused by natural hazards, they are seen as not being
prepared.

FLASH FLOOD SCENARIO MODELLING FOR PREPAREDNESS AND MITIGATION MEASURES. CASE STUDY OF BARCELONNETTE, FRANCE
65
Figure 33 shows the stakeholders who should provide information in regards to risk from the
perspective of the respondents. Majority of the respondents suggested that the Police and the Fire
Chief should provide information about the risk followed by the scientific experts.
Figure 33: List of actors who should provide information about risk
They also think that the RTM and the Municipality should provide information relating to risk than all
the other actors. Reasons for their views maybe because of the factors outlined above. Maybe they
think that those who are more aware aware of the risk and their local conditions should provide risk
related information.
The Department and Regional Body may be ranked in their respective places because they are in
charge of a wider geographical area and so may not be aware of the local conditions affecting the
Barcelonnette. Barcelonnette is located in the Alps and so some of factors influencing natural hazards
in the area may not be the same ones causing a hazard in other areas. Normally when decisions are
made by people who are responsible for a wider geographical region, they implement measures or
policies that are not beneficial to some locations. For example, the PPR enforces a law that states that
construction should not take place within 50 m of a dike. This maybe feasible in other areas where
there is an abundant of space but to the people in Barcelonnete this may not be applicable since
majority of the available spaces are either in the blue zone or red zone. Whilst this may be measure
0 38 76 114 152 190
The Police, Fire Chief
Scientific Experts
RTM / ONF
Municipality
Communate
Department
Regional
Ministry
Media (Journalist)
Insurance Companies
Completely Slightly May Be Not at All Not at all No Response

TITLE OF THESIS
66
that is geared towards reducing loss from the expert’s perspective, the residents may not see the merit
of imposing such a law to a mountainous area like Barcelonnette. Therefore, the people are more
likely to trust those persons who are aware of their local situations.
The respondents also gave preferences as who should provide information about natural hazard in the
area. Figure 34 shows their preferences. Majority of the respondents would prefer if information about
risk was not provided by the media or the Insurance companies or friends. Over 110 would prefer if
the Mayor inform them about the risk or through brochure, internet, and newspaper or at public
meetings. Surprisingly, school was not one of the highly favored mediums through which they wanted
to gain information about natural hazards. Probably these are the older people who are not attending
school and so it would not be a preferred choice. On the other hand, their children or grandchildren
could benefit from such information.
Figure 34: How do you want to be informed about Natural Hazards?
Almost all of the respondents want the Mayor to inform them about natural Hazards. This may be due
to his responsibility a mentioned before or they gave confidence that he is doing a good job. Majority
will also prefer to be informed through the Brochure and the internet. Surprisingly, a small number of
the respondents wanted schools to be informed about Natural Hazards.
0 20 40 60 80 100 120
Mayor
Brochure
Internet
Newspaper
Posters
Public Meeting
Radio
Telivision
School
Technical Reports
Official Reports
Friends
Family
No Response
How do you want to be informed about Natural Hazards?

FLASH FLOOD SCENARIO MODELLING FOR PREPAREDNESS AND MITIGATION MEASURES. CASE STUDY OF BARCELONNETTE, FRANCE
67
7. Preparedness Plan
The preparedness planning was prepared by the Municipality under the legal framework imprinted in
the PPR. The plan envisages that an effort is needed to combat four types of risk: flooding, fire,
landslide and earthquake. The plan includes:
� The plan listed Mayor Jean Chabre as the head of security. In the event his absence, his legal
representative take control: Bernard Sarrailh, Jean Mercier or Patrick Derquenne.
� It is the responsibility of the Commander of the fire station to observe risk at a given point
and to report them.
The preparedness plan is a three stage process and consists of awareness, pre-alarm and alert once a
risk has been observed.
The state of alertness: The Director of operations establishes a level of alertness after being warned by
a competent authority. This warning is usually sent to the Inter-departmental Defense and Civil
Protection (SIDPC) or The Departmental Operation Center for fire and Rescue (CODIS). A number of
observers are required to supervise or delegate people at observation points.
Observers are required to issue warning about the progression of risk which be decided after
consulting DIREN, RTM, Fire Commander, Sub-Divisional Engineer for warning. In the event there
is a need for an evacuation, loudspeakers mounted on top of the fire brigade or vehicles that provides
technical service should be used to warn the people of a potential threat. This of course is done once a
certain level of risk is identified by a competent authority.
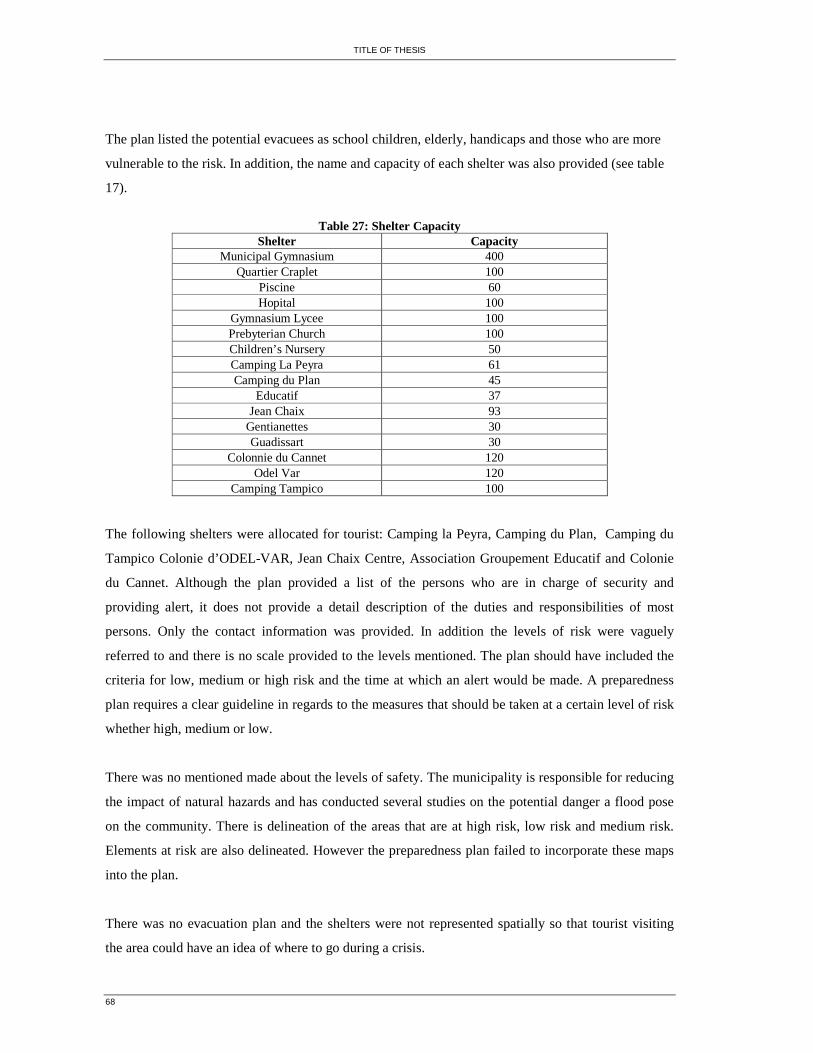
TITLE OF THESIS
68
The plan listed the potential evacuees as school children, elderly, handicaps and those who are more
vulnerable to the risk. In addition, the name and capacity of each shelter was also provided (see table
17).
Table 27: Shelter Capacity
Shelter Capacity Municipal Gymnasium 400
Quartier Craplet 100 Piscine 60 Hopital 100
Gymnasium Lycee 100 Prebyterian Church 100 Children’s Nursery 50 Camping La Peyra 61 Camping du Plan 45
Educatif 37 Jean Chaix 93
Gentianettes 30 Guadissart 30
Colonnie du Cannet 120 Odel Var 120
Camping Tampico 100
The following shelters were allocated for tourist: Camping la Peyra, Camping du Plan, Camping du
Tampico Colonie d’ODEL-VAR, Jean Chaix Centre, Association Groupement Educatif and Colonie
du Cannet. Although the plan provided a list of the persons who are in charge of security and
providing alert, it does not provide a detail description of the duties and responsibilities of most
persons. Only the contact information was provided. In addition the levels of risk were vaguely
referred to and there is no scale provided to the levels mentioned. The plan should have included the
criteria for low, medium or high risk and the time at which an alert would be made. A preparedness
plan requires a clear guideline in regards to the measures that should be taken at a certain level of risk
whether high, medium or low.
There was no mentioned made about the levels of safety. The municipality is responsible for reducing
the impact of natural hazards and has conducted several studies on the potential danger a flood pose
on the community. There is delineation of the areas that are at high risk, low risk and medium risk.
Elements at risk are also delineated. However the preparedness plan failed to incorporate these maps
into the plan.
There was no evacuation plan and the shelters were not represented spatially so that tourist visiting
the area could have an idea of where to go during a crisis.

FLASH FLOOD SCENARIO MODELLING FOR PREPAREDNESS AND MITIGATION MEASURES. CASE STUDY OF BARCELONNETTE, FRANCE
69
A strategy is needed that involve community members in the planning and the designing of a new
preparedness plan. This approach may be satisfactory as community members are the first responders
to a hazard and so are more aware of their own vulnerability.
8. Discussion

TITLE OF THESIS
70
9. Calibration and Validation
Although SOBEK uses spatial and hydrological data, it does not consider specific risks at specific
locations (Ortega 2008). Therefore, uncertainties of model parameters and their impact on flood
predictions propagate throughout the model. Since these are inevitable, sensitivity of the data used
should be considered (Borga, Frank et al. 2000). Researchers like (Muzik I. 1996) and (Patro S et al.
2009) compared simulated data with observed or measured data in their studies to compare
differences between the two results. However, flood events caused from dike break and damming of
the river are extreme conditions that did not occur during the field work visit. Therefore, the
roughness coefficient values were adjusted in order to illustrate the sensitivity of the model results.
Furthermore, the latter approach has been used by (Candela A. 2005; Alkema, Nieuwenhuis et al.
2007). Figure 1 show the calibrated results.
Figure 3: Calibrations
Calibrated Results
150
200
250
300
350
400
450
Dis
char
ge (m
3/s)
Dike Break
Normal Flood
Damming
�! ���������
�(�� � �����
�(�)��*���)��
Time of Flooding for each scenario
200
250
300
350
400
450
500
Dis
char
ge (m
3/s)
Damming
Dike break
Without dike break
! ���������
�(�� � �����
�(�)��*���)��
FLASH FLOOD SCENARIO MODELLING FOR PREPAREDNESS AND MITIGATION MEASURES. CASE STUDY OF BARCELONNETTE, FRANCE
71
The figure shows that as each of the scenarios reach bank full discharge at the same time. Regardless
of the adjustment made, the overtopping scenario is able to accommodate over 450 m3/s of discharge
compared to dike break and damming. Both damming and dike break scenarios have shown that it is
impossible to accommodate over 350 m3/s of discharge.
10. Conclusion
10.1. Flood Scenario Modelling and Emergency Shelter Study
After numerous attempts, SOBEK was able to simulate overtopping, dike break and damming of the
Ubaye River in Barcelonnette. The results indicated that each of the scenarios pose a significant threat
to the people living in the areas inundated. Each scenario reached a bank full discharge at 4.48 hrs
after which the amount of discharge the river could carry was reduced. Flooding caused by
overtopping of the embankment was able to transport over 450m3/s of discharge in the river event
though flooding occurred in some areas. Dike Break on the other hand, could only accommodate
320m3/s of discharge in the river while flooding from the damming scenario transported a maximum
discharge of 350m3/s.
The differences were also evident in the areas covered by the inundation. The dike break scenario
covered approximately 5678.9 103/m2 of the area inundated while flooding from the overtopping
scenario only covered 710.3 103/m2 of the area that was inundated. The total area inundated by the
damming scenario was 10116.6 103/m2. Whilst the dike break scenario covered a wider spatial extent
and buildings inundated, areas inundated as a result of the damming scenario experienced the highest
depth compared to the other scenarios. Some of the buildings inundated as a result of the damming

TITLE OF THESIS
72
scenario had water depth as high as 3.5 m that none of the other buildings inundated by overtopping
and the dike break experienced.
10.2. Critical Elements at Risk
Each of the critical elements at risk was flooded in each of the scenarios. The critical elements at risk
included a fire station, police station, two schools, roads and bridges. The fire station serves as a
logistic centre for the coordination of relief supplies and consists of people who are trained to perform
rescue operations in case there is a flood. Flooding of the fire station may result in the loss of a
logistic centre and delay in responding to rescue operations. In this case, other centres will have to be
used for coordination. However, supplies and equipment that are useful for clearing roads that have
been blocked are not able to be moved that easily. Therefore, other fire stations will have to provide
assistance provided that the roads are not impassable. The RTM will also be faced with added
pressure in performing recue operations.
The Police provide security in times of crisis. Looting is a common practice that occurs when an area
is flooded and people are no longer in their homes or business places. Flooding of the Police Station
reduces the level of security that is usually provided for an area during a crisis since they will have to
deal with their own crisis.
Flooding of the infrastructures such as roads and bridges alters the free movement of people since the
pathways will be inundated. The main road in Barcelonnette runs along the Ubaye River that is used
by many people who travels on a daily basis to Cuneo, Italy. This therefore means that people will not
be able to access this route during a flood. Even after the water recedes, sediments that have been left
behind prevent the usage of the roadways and require the use of equipment that is normally provided
by the Fire Department. Inundation of the schools could cause a disruption in the educational system
since students will not be able to attend classes.
In general, results from the scenarios were in accordance with previous flood events that have
occurred in the area. This suggests that SOBEK was able to simulate a satisfactory result that is close
to an event that occurred in the area.
10.3. Flood Perception
Based on the results from the risk perception study, it can be concluded that majority of the
respondents are aware of flood related events that have occurred in the area over the years. Experience
to flood events was not so prevalent amongst the respondents since most of them may not have been

FLASH FLOOD SCENARIO MODELLING FOR PREPAREDNESS AND MITIGATION MEASURES. CASE STUDY OF BARCELONNETTE, FRANCE
73
living in the area and had neither had grand or great-grand parents living in the area. Flooding was
among the most feared hazards by the respondents and many of them think that if a flooding should
occur in Barcelonnette, only the infrastructures will be affected. However, results from the model
indicated that several buildings will be inundated. Therefore, the respondents who believe that they
will not be affected may not be living in the areas prone to flooding or have implemented mitigation
measures to reduce the impact the flooding may have on their homes.
10.4. Preparedness Plan
The ORSEC Law that was implemented in 2004 gave the Municipality sole responsibility of reducing
the threat from disasters at the local level. The Saveguarde plan, as the preparedness plan is called,
identifies the roles and responsibilities of each stakeholders that should act in case there is an
emergency. The plan is described in three stages. At stage one, the observers (Example Fire
Commander or RTM officials) informs the Mayor once a significant level of threat has been reached
and continues with the monitoring of the threat. Once this level has been exceeded, a warning is given
to some of the people who reside in the areas that are prone to flooding. These areas include: Camping
du Plan, Camping Tampico, Colonie Cannet, Odel Var and Jean Chaix. They are immediately asked
to evacuate the area.. This warning however has to be given once the Mayor has been in dialogue with
the experts who are responsible for preparedness.
The preparedness plan needs to be updated. There is no information in regards to the level of safety
that is acceptable and the level at which an alert is made. The name and capacity of emergency
shelters are included but there is no evacuation route that could act as a guide during an emergency.
References Alkema D. (2007). Simulating floods : on the application of a 2D hydraulic model for flood hazard
and risk assessment. ITC Dissertation;147. Enschede, ITC: 198. Hunter N et al. (2005). "Utility of different data types for calibrating flood inundation models within a
GLUE framework." Hydrol. Earth Syst. Sci 9: 412-430. International Association of Hydrological Science. (2004). "GIS and Remote Sensing in Hydrology,
Water Resources and Environment." International Association of Hydrological Science 289: 422.

TITLE OF THESIS
74
Merwade V et al. ( 2008). "GIS techniques for creating river terrain models for hydrodynamic modeling and flood inundation mapping." Environmental Modelling & Software Volume 23 (10-11 ).
Mohamoud Y. (1992). "Evaluating Manning's roughness coefficients for tilled soils." Journal of Hydrology 135(1-4): 143-156.
Raaijmakers, R., Krywkow., J and van der Veen., A., (2008). "Flood risk perceptions and spatial multi-criteria analysis: an exploratory research for hazard mitigation." Natural Hazards 46(3): 307-322.
Shapiro, M. G. and E. J. Nelson (2004). Digital Terrain Model Processing for Integrated Hydraulic Analysis and Floodplain Mapping, ASCE.

FLASH FLOOD SCENARIO MODELLING FOR PREPAREDNESS AND MITIGATION MEASURES. CASE STUDY OF BARCELONNETTE, FRANCE
75


![Flash Flood Risk Estimation of Wadi Yutum (Southern Jordan ...tional for flash flood risk assessment. El-Maghraby et al. [54] employed morphometric analysis to evaluate the flash flood](https://static.fdocuments.net/doc/165x107/5f63b02dfde39d7cc462b8d3/flash-flood-risk-estimation-of-wadi-yutum-southern-jordan-tional-for-flash.jpg)


