
Flash Eurobarometer 375 - European...
82
Flash Eurobarometer 375 EUROPEAN YOUTH: PARTICIPATION IN DEMOCRATIC LIFE REPORT Fieldwork: April 2013 Publication: May 2013 This survey has been requested by the European Commission, Directorate-General for Education and Culture and co-ordinated by the Directorate-General for Communication. This document does not represent the point of view of the European Commission. The interpretations and opinions contained in it are solely those of the authors. Flash Eurobarometer 375 - TNS Political & Social
Transcript of Flash Eurobarometer 375 - European...

Flash Eurobarometer 375
EUROPEAN YOUTH: PARTICIPATION IN DEMOCRATIC LIFE
REPORT
Fieldwork: April 2013
Publication: May 2013
This survey has been requested by the European Commission, Directorate-General for Education
and Culture and co-ordinated by the Directorate-General for Communication.
This document does not represent the point of view of the European Commission. The interpretations and opinions contained in it are solely those of the authors.
Flash Eurobarometer 375 - TNS Political & Social

Flash Eurobarometer 375
European Youth: Participation in Democratic Life
Conducted by TNS Political & Social at the request of the European Commission,
Directorate-General for Education and Culture
Survey co-ordinated by the European Commission, Directorate-General for Communication
(DG COMM “Research and Speechwriting” Unit)

FLASH EUROBAROMETER 375 “European Youth: Participation in Democratic Life”
1
TABLE OF CONTENTS INTRODUCTION ......................................................................................................................... 2
KEY FINDINGS ........................................................................................................................... 4
I. PARTICIPATION IN ACTIVITIES OF VARIOUS ORGANISATIONS ........................ 6
II. PARTICIPATION IN POLITICAL ELECTIONS ............................................................ 10
III. AWARENESS OF HOW THE MEMBERS OF THE EUROPEAN PARLIAMENT ARE ELECTED ............................................................................................................................. 17
IV. PROBABILITY OF VOTING IN THE EUROPEAN ELECTIONS IN 2014 ................ 21
V. REASONS TO VOTE IN THE EUROPEAN ELECTIONS IN 2014 .............................. 22
VI. REASONS NOT TO VOTE IN THE EUROPEAN ELECTIONS IN 2014 ..................... 35
ANNEXES
Technical specifications Questionnaire Tables

FLASH EUROBAROMETER 375 “European Youth: Participation in Democratic Life”
2
INTRODUCTION
The primary objective of the Flash Eurobarometer survey “European Youth: Participation in Democratic Life” (No 375) was to study young EU citizens’ participation in society, with special reference to attitudes towards participation in elections and intentions to participate in the European elections in 2014. Only respondents aged 15 to 30 were considered for this survey.
This issue is of particular interest for the European Union, as its Treaties1 stipulate that it shall encourage the participation of young people in democratic life in Europe. The EU Youth Strategy2 also underlines the need to support young people’s participation in representative democracy and civil society.
The survey examined the following issues:
young people’s involvement in a range of groups and clubs such as sports clubs, youth organisations and cultural organisations. The findings are compared with those from the same question which was previously asked in a Flash Eurobarometer survey “Youth on the Move” (No 319a) conducted in early 2011
young people’s participation in political elections at the local, regional or national level, the results of which are again compared with those from “Youth on the Move” (No 319a)
young EU citizen’s awareness and intended participation in forthcoming European elections
respondents’ awareness of how the members of the European Parliament are elected
probability of voting in the European elections in 2014
reasons behind their expected level of participation in the 2014 European elections.
Please note: voting is compulsory for at least some elections in Belgium, Cyprus, Luxembourg and Greece. The voting age is 18 for most of the elections in the EU Member States and in Croatia, with the exception of Austria where the voting age is 16.
1 Article 165 of the Treaty on the Functioning of the European Union 2 http://ec.europa.eu/youth/policy/eu-youth-strategy_en.htm

FLASH EUROBAROMETER 375 “European Youth: Participation in Democratic Life”
3
This survey was carried out by TNS Political & Social network in the 27 Member States of the European Union and in Croatia between the 2nd and the 19th of April 2013. 12,927 respondents at EU level from different social and demographic groups, aged between 15 and 30 years old, were interviewed via telephone (landline and mobile phone) in their mother tongue on behalf of the European Commission, Directorate-General for Education and Culture. The methodology used is that of Eurobarometer surveys as carried out by the Directorate-General for Communication (“Research and Speechwriting” Unit)3. A technical note on the manner in which interviews were conducted by the Institutes within the TNS Political & Social network is appended as an annex to this report. Also included are the interview methods and confidence intervals4.
Note: In this report, countries are referred to by their official abbreviation. The abbreviations used in this report correspond to:
ABBREVIATIONS BE Belgium LV Latvia CZ Czech Republic LU Luxembourg BG Bulgaria HU Hungary DK Denmark MT Malta DE Germany NL The Netherlands EE Estonia AT Austria EL Greece PL Poland ES Spain PT Portugal FR France RO Romania IE Ireland SI Slovenia IT Italy SK Slovakia CY Cyprus FI Finland LT Lithuania SE Sweden UK The United Kingdom
HR Croatia EU27 European Union – 27 Member States
EU15 BE, IT, FR, DE, LU, NL, DK, UK, IE, PT, ES, EL, AT, SE, FI**
NMS12 BG, CZ, EE, CY, LT, LV, MT, HU, PL, RO, SL, SK***
** EU15 refers to the 15 countries forming the European Union before the enlargements of 2004 and 2007
*** The NMS12 are the 12 ‘new Member States’ which joined the European Union during the 2004 and 2007 enlargements
* * * * *
We wish to thank the people throughout Europe who have given their time to take part in this survey. Without their active participation, this study would not have been possible.
3 http://ec.europa.eu/public_opinion/index_en.htm 4 The results tables are included in the annex. It should be noted that the total of the percentages in the
tables of this report may exceed 100% when the respondent has the possibility of giving several answers to the question.

FLASH EUROBAROMETER 375 “European Youth: Participation in Democratic Life”
4
KEY FINDINGS
Over a third of respondents say that they have participated in a sports club within the past year (35%), while one in five (22%) are involved in a youth club, leisure-time club or any kind of youth organisation. 15% of respondents are involved in a local organisation aiming to improve the local area and 14% are active in a cultural organisation. Compared with 2011 there has been an increase in involvement in all of the groups and clubs, except two where participation rates have stayed the same - cultural organisations and political organisations or political parties. However, 44 % of the respondents did not take part in the activities of any organisation within the past year.
Over half of those surveyed have voted in a political election at the local, regional or national level in the past three years (56%). Of the 44% of respondents who did not vote, only a fifth (21%) did so out of choice and a further 23% were not eligible to vote because of their age. These findings represent a decrease in participation since 2011, when 62% of respondents said that they had voted and 37% had not.
The majority of respondents (79%) would not consider standing as a candidate in a political election at some point in their life: 30% say probably not and 49% say certainly not. On the other hand, almost one in five (19%) say that they would consider it: 5% say certainly and 14% probably.
Almost half (47%) of respondents are correct when they say that the following statement is true: the members of the European Parliament are directly elected by the citizens of each EU Member State. However, nearly as many respondents (43%) consider this statement to be false.
Approximately two thirds of all respondents (64%) say that they are ‘likely’ to vote in the next European elections in 2014. Almost three in 10 are certain that they will vote in the next election (28%). Just over a third (35%) say they are ‘unlikely’ to vote.
The most frequently mentioned reasons given by respondents who are likely to vote for taking part in the election are the belief in democracy (94%), that Europe and European elections are important (90%) and that voting is the right way to influence political decision-making (83%).
The belief that the respondents' vote will not change anything (64%), that they are not sufficiently informed to vote (61%), that the European Parliament does not sufficiently deal with problems that concern them (56%) and that they are not interested in European politics and elections (54%) are the most frequently given reasons for not voting.

FLASH EUROBAROMETER 375 “European Youth: Participation in Democratic Life”
5
Participation in activities run by various organisations has an impact on interest in politics or elections. Respondents who have participated in at least one activity or organisation are more likely to consider standing as a candidate in a political election at some point in their life (23% vs. 14% who have not participated). They are also more likely to vote in the European elections of 2014 (70% vs. 57% who have not participated).

FLASH EUROBAROMETER 375 “European Youth: Participation in Democratic Life”
6
I. PARTICIPATION IN ACTIVITIES OF VARIOUS ORGANISATIONS
Young people were asked about their participation in a range of activities organised by different types of groups and clubs within the past year. The findings are compared with those from the same question which was previously asked in a Flash Eurobarometer survey “Youth on the Move” (No 319a) in February 20115.
--Involvement in a sports club is the most popular activity
among young people--
Over a third of respondents say that they have been active in a sports club within the past year (35%). The next most popular activity is being involved in a youth club, leisure-time club or any kind of youth organisation (22%). 15% of respondents are involved in a local organisation aiming to improve the local community, while 14% are active in a cultural organisation.
Fewer than one in 10 respondents say that they are part of other types of organisations: 8% participate in an organisation promoting human rights or global development; 7% are part of an organisation involved in climate change/environmental issues and 5% are involved in a political organisation or political party. In addition, one in eight respondents (12%) say that they are involved in another non-governmental organisation.
There have been some changes in the levels of involvement since 2011. There has been an increase in participation of four percentage points in each of the following groups and clubs: youth clubs or leisure-time clubs or any kind of youth organisation (22%), local organisations aiming to improve the local community (15%), organisations involved in climate change/environmental issues (7%) and other non-governmental organisations (12%). There has also been an increase in the participation in organisations promoting human rights or global development (8%, +3 pp) and in sports clubs (35%, +1 pp).
Despite the fact that the majority of respondents have participated in an activity of one of the organisations, a significant proportion have not taken part in any of the organisations at all (44%).
Participation in groups and clubs is generally higher in the EU15 than in the NMS12. 39% of respondents in the EU15 are part of a sports club, compared with 21% of respondents in the NMS12, and 24% of those in the EU15 participate in youth organisations, compared with 14% of those in the NMS12. Participation is also highest in the EU15 for every other type of group or club listed.
5 Q6: Have you in the past year participated in any activities of the following organisations?

FLASH EUROBAROMETER 375 “European Youth: Participation in Democratic Life”
7
Base: All respondents (12,927)
Country-level analysis
Sport is the most popular activity in each of the EU Member States. Respondents in the Netherlands are the most likely to have participated in a sports club in the last year (59%), followed by those in Ireland (53%), Sweden (48%), Luxembourg (48%), Denmark (48%) and Belgium (46%). Conversely, respondents living in Lithuania and Romania are the least likely to have been involved in sport (15% and 16% respectively).
A youth club, leisure-time club or any kind of youth organisation is the next most likely organisation mentioned by respondents. However, involvement in this type of activity varies by country. More than one in three respondents in Luxembourg (38%), Ireland (37%) and Belgium (32%) say that they have participated in this type of activity in the last year. On the other hand, just one in seven or fewer of those living in Cyprus (8%), Hungary (11%), Romania (12%), Poland (13%), Slovenia (14%), Lithuania (14%) and Estonia (14%) have participated in such an organisation. Participation is also low in Croatia (12%).
Respondents in Ireland are particularly likely to be involved in a local organisation aimed at improving their local community (36%), which is significantly higher than in any other country. Respondents in Luxembourg are the most likely to be part of a cultural organisation (25%) or an organisation active in the domain of climate change/environmental issues (13%).
On the other hand, respondents in the Netherlands are the most likely, along with those in Finland, to be part of an organisation promoting human rights or global development (both 14%), while 14% of those surveyed in Malta are part of a political organisation or a political party.

FLASH EUROBAROMETER 375 “European Youth: Participation in Democratic Life”
8
Respondents in Cyprus are least likely to be involved in a youth organisation (8%) or a local organisation aimed at improving the local community (5%). Lithuanian respondents are the least likely to participate in a cultural organisation (6%), while respondents living in Estonia have a very low level of participation in cultural activities (6%) and organisations promoting human rights or global development (1%).
Very low levels of participation are also recorded for organisations active in the domain of climate change/environmental issues among respondents living in Poland (1%), while Hungarian respondents are particularly unlikely to be involved in a political organisation or political party (1%).
The respondents who are most likely not to participate in any of the organisations come from Cyprus (67%), Lithuania and Hungary (both 63%), whilst Dutch, Irish and Luxembourgish respondents are the most likely to be involved in an organisation.
A sports club
A youth club, leisure-time club
or any kind of youth organisation
A local organisation
aimed at improving your local
community
A cultural organisation
An organisation promoting human
rights or global development
An organisation active in the
domain of climate change/environme
ntal issues
A political organisation or a
political party
None of these(DO NOT READ
OUT)
EU27 35% 22% 15% 14% 8% 7% 5% 44%
BE 46% 32% 17% 22% 13% 10% 8% 32%
BG 23% 16% 9% 14% 8% 10% 6% 59%
CZ 30% 18% 11% 18% 6% 7% 2% 49%
DK 48% 28% 16% 10% 12% 7% 8% 28%
DE 42% 27% 16% 18% 8% 8% 6% 34%
EE 26% 14% 7% 6% 1% 2% 3% 57%
IE 53% 37% 36% 13% 12% 10% 7% 24%
EL 30% 15% 12% 10% 5% 10% 7% 52%
ES 38% 24% 14% 18% 12% 10% 5% 42%
FR 44% 23% 13% 12% 5% 6% 4% 39%
IT 25% 15% 14% 13% 6% 4% 6% 53%
CY 19% 8% 5% 7% 5% 4% 7% 67%
LV 25% 23% 16% 13% 6% 6% 4% 53%
LT 15% 14% 7% 6% 2% 4% 5% 63%
LU 48% 38% 21% 25% 13% 13% 10% 25%
HU 19% 11% 10% 7% 3% 6% 1% 63%
MT 25% 19% 12% 13% 5% 6% 14% 44%
AT 36% 21% 16% 16% 11% 10% 8% 38%
NL 59% 27% 13% 18% 14% 6% 4% 22%
PL 19% 13% 12% 10% 5% 1% 2% 60%
PT 31% 26% 21% 20% 9% 8% 5% 45%
RO 16% 12% 8% 8% 5% 5% 8% 60%
SI 26% 14% 9% 16% 3% 2% 3% 48%
SK 32% 23% 13% 23% 11% 9% 5% 43%
FI 30% 25% 17% 11% 14% 7% 5% 42%
SE 48% 24% 14% 12% 13% 9% 7% 28%
UK 38% 28% 25% 12% 9% 7% 5% 41%
HR 20% 12% 8% 9% 4% 3% 6% 59%
Q6 Have you in the past year participated in any activities of the following organisations?
Highest percentage per countryHighest percentage per item
Lowest percentage per countryLowest percentage per item
Base: All respondents (12,927)

FLASH EUROBAROMETER 375 “European Youth: Participation in Democratic Life”
9
Socio-demographic analysis
Overall rates of participation in groups and clubs vary according to socio-demographic factors. Men are more likely than women to have been involved in an activity in the last year (62% versus 50%). There are also differences by age: 15-19 year-olds are most likely to have participated in a club or group (65%), compared with those aged 20-24 (53%) and 25-30 (51%). Participation is also highest among respondents who left school when they were 20 or over (55%). Participation in at least one activity is also particularly low among respondents who left school at 15 (41%) or at the age of 16-19 (47%) and among manual workers (48%).
Sports clubs are the most frequently mentioned type of organisation across all age groups, however there are differences in the levels of participation by age: 47% of 15-19 year-olds, 32% of 20-24 year-olds and 29% of 25-30 year-olds. Respondents who are involved in a sports club are also more likely to be male (43% versus 27% of women) and still in education (44%).
The youngest age groups are the most involved in youth organisations: 30% of 15-19 year-olds, 20% of 20-24 year-olds and 17% of 25-30 year-olds. Respondents who attend a youth organisation are also more likely to be male (23% versus 20% of women) and living in a rural village (25%).
Respondents who left school at 20 or over are particularly likely to be involved in a local organisation aimed at improving the local community (16% and 18% respectively), in an organisation promoting human rights or global development (9% or 10% respectively) or in another non-governmental organisation (both 14%). People living in rural areas are also particularly likely to be part of a local organisation aimed at improving the local community (18%).
Differences also occur in the participation rates in cultural organisations according to the level of education and current occupation. Involvement is highest among respondents who left education when they were 20 or over (16%) and the self-employed (21%).

FLASH EUROBAROMETER 375 “European Youth: Participation in Democratic Life”
10
A sports club
A youth club, leisure-time club or any
kind of youth organisation
A local organisation
aimed at improving your local
community
A cultural organisation
Any other non-
governmental organisation
An organisation
promoting human rights
or global development
An organisation active in the domain of
climate change/
environmental issues
A political organisation or a political
party
None of these (DO NOT
READ OUT)Don't know
EU27 35% 22% 15% 14% 12% 8% 7% 5% 44% 1%
Male 43% 23% 16% 14% 13% 8% 7% 7% 38% 0%
Female 27% 20% 14% 13% 11% 8% 7% 3% 49% 1%
15-19 47% 30% 14% 14% 11% 8% 8% 3% 35% 0%
20-24 32% 20% 15% 12% 11% 7% 6% 6% 46% 1%
25-30 29% 17% 17% 15% 15% 9% 7% 6% 48% 1%
15- 23% 15% 14% 10% 9% 5% 8% 8% 58% 1%
16-19 29% 19% 14% 9% 10% 6% 5% 5% 52% 1%
20+ 32% 17% 18% 16% 14% 10% 7% 6% 44% 1%
Still studying 44% 30% 16% 18% 14% 9% 8% 5% 33% 0%
Rural village 37% 25% 18% 15% 12% 8% 8% 5% 43% 1%
Small/ Mid-size town 35% 21% 14% 13% 12% 7% 6% 4% 43% 1%
Large town 34% 20% 14% 14% 13% 9% 6% 6% 44% 0%
Self-employed 27% 19% 19% 21% 18% 13% 7% 11% 47% 1%
Employee 36% 19% 18% 13% 14% 8% 7% 6% 44% 0%
Manual workers 31% 19% 13% 11% 9% 5% 6% 5% 51% 1%
Not working 36% 24% 14% 14% 11% 8% 7% 4% 42% 0%
Respondent occupation scale
Q6 Have you in the past year participated in any activities of the following organisations? (MULTIPLE ANSWERS POSSIBLE)
Sex
Age
Education (End of)
Subjective urbanisation
Base: All respondents (12,927)

FLASH EUROBAROMETER 375 “European Youth: Participation in Democratic Life”
11
II. PARTICIPATION IN POLITICAL ELECTIONS
Young people were asked whether or not they have voted in a political election in the last three years. The question stated that this includes local, regional and national elections. The findings are compared with those from the same question which was previously asked in a Flash Eurobarometer survey “Youth on the Move” (No 319a) in February 20116.
--73% of respondents who were old enough to do so have voted in a political
election in the past three years--
Over half of those surveyed have voted in an election in the past three years (56%). 44% have not voted: a fifth (21%) out of choice, while a further 23% were not eligible to vote because of their age.
These findings represent a decrease in participation since 2011, when 62% of respondents said that they had voted and 37% had not (16% out of choice and 21% because they were not old enough).
73% of respondents who were old enough to vote in a political election actually did vote in the past three years. This compares to 79% in 2011.
Base: All respondents (12,927)
6 Q1: During the last 3 years, did you vote in any political election at the local, regional or national level? If
you were, at that time, not eligible to vote, please say so.

FLASH EUROBAROMETER 375 “European Youth: Participation in Democratic Life”
12
Country-level analysis
In 20 of the EU Member States a majority of respondents have voted in a political election in the past three years. In addition, a majority of those living in Croatia (67%) say that they have voted in the past three years. Voting among young people is particularly high in Malta (76%), Belgium (73%) and Italy (71%).
There are seven Member States where fewer than half of respondents have voted. In the UK (38%) and Hungary (39%) fewer than two in five of those surveyed have voted, while 44% voted in Estonia and slightly more in Lithuania (48%), Portugal (48%), Luxembourg (49%) and Sweden (49%).
When comparing the findings with those from 2011 there are some interesting differences. The countries where there has been a significant increase in the proportion of young people voting are: Italy (71%, +15 pp), Lithuania (48%, +14 pp), Finland (64%, +11 pp) and Malta (76%, +10 pp).
On the other hand, there are several countries that have seen a significant decrease in the proportion of young people voting. Participation in political elections has decreased the most in Hungary, from 67% in 2011 to 39% - a drop of 28 percentage points. Respondents in Sweden are also considerably less likely to vote in 2013 (49%) than they were in 2011 (74%). In Poland there was also a significant decrease in voting, from 74% in 2011 to 52% in 2013. Voting has also decreased in Austria, from 83% in 2011 to 62% in 2013. Other countries where there has been a significant decrease in voting of between ten and twenty percentage points include Slovakia (a decrease of 19 percentage points to 52%), Estonia (a decrease of 18 percentage points to 44%), the UK (a decrease of 15 percentage points to 38%), Portugal (a decrease of 12 percentage points to 48%) and Germany (a decrease of 10 percentage points to 53%).

FLASH EUROBAROMETER 375 “European Youth: Participation in Democratic Life”
13
FL375Apr. 2013
Diff. FL375 -FL319a
Apr.2013-Feb.2011
FL375Apr. 2013
Diff. FL375 -FL319a
Apr.2013-Feb.2011
EU27 56% -6 44% +7
BE 73% = 27% =
BG 56% -6 43% +5
CZ 60% = 39% -1
DK 56% -8 44% +8
DE 53% -10 46% +10
EE 44% -18 55% +17
IE 56% +3 43% -3
EL 66% -2 34% +2
ES 61% +6 39% -6
FR 64% +4 36% -4
IT 71% +15 29% -10
CY 59% +3 38% -5
LV 65% -2 35% +2
LT 48% +14 52% -13
LU 49% -1 51% +2
HU 39% -28 61% +28
MT 76% +10 24% -10
AT 62% -21 38% +21
NL 60% -8 40% +8
PL 52% -22 47% +21
PT 48% -12 52% +13
RO 63% -3 37% +4
SI 63% -9 37% +9
SK 52% -19 48% +19
FI 64% +11 36% -10
SE 49% -25 50% +24
UK 38% -15 62% +16
HR 67% * 33% *
* FL319a was not conducted in Croatia
Q1 During the last 3 years, did you vote in any political election at the local, regional or national level? If you were, at that time, not eligible to vote, please
say so.
Yes Total 'No'
Base: All respondents (12,927)

FLASH EUROBAROMETER 375 “European Youth: Participation in Democratic Life”
14
Socio-demographic analysis
Men and women are equally as likely to have voted in a political election in the past three years (57% men and 56% women).
The older a respondent is when leaving education, the more likely they are to have voted in an election. 80% of those who left education at 20 years or older have voted, compared with 59% of those who left at 16-19 and 50% of those who left at 15.
The self-employed (72%) and employees (73%) are more likely than manual workers to have voted (64%).
YesNo, did not vote in an election
No, because you were not old
enough to voteDon't know Total 'No'
EU27 56% 21% 23% 0% 44%
Male 57% 21% 22% 0% 43%
Female 56% 21% 23% 0% 44%
15-19 15% 10% 75% 0% 85%
20-24 72% 24% 3% 1% 27%
25-30 74% 25% 1% 0% 26%
15- 50% 34% 15% 1% 49%
16-19 59% 31% 10% 0% 41%
20+ 80% 20% - 0% 20%
Still studying 41% 10% 49% 0% 59%
Rural village 56% 19% 25% 0% 44%
Small/ Mid-size town 56% 20% 24% 0% 44%
Large town 59% 24% 17% 0% 41%
Self-employed 72% 24% 4% 0% 28%
Employee 73% 22% 4% 1% 26%
Manual workers 64% 29% 7% 0% 36%
Not working 45% 18% 37% 0% 55%
Respondent occupation scale
Q1 During the last 3 years, did you vote in any political election at the local, regional or national level? If you were,at that time, not eligible to vote, please say so.
Sex
Age
Education (End of)
Subjective urbanisation
Base: All respondents (12,927)

FLASH EUROBAROMETER 375 “European Youth: Participation in Democratic Life”
15
Respondents were then asked whether they would consider standing as a candidate in a political election at some point in their lives7.
--19% of those surveyed would consider standing as a
candidate in a political election--
The majority of respondents (79%) would not consider standing as a candidate; 30% say probably not and 49% say certainly not. Almost one in five (19%) say that they would consider it.
Base: All respondents (12,927)
Country-level analysis
There is considerable variation in the findings by country. In particular, 29% of respondents in Sweden, 27% in Latvia and 24% in Romania would consider it. 22% of respondents in Italy, the UK, Poland and Bulgaria, 21% in Cyprus, Luxembourg and Germany and 20% of those in Ireland and Lithuania would also consider standing for political election.
Hungary is at the other end of the scale, where just 8% of respondents say that they would consider standing for political election.
7 Q2: Would you consider standing as a candidate in a political election at some point in your life?

FLASH EUROBAROMETER 375 “European Youth: Participation in Democratic Life”
16
Base: All respondents (12,927)
Socio-demographic analysis
Men are more likely than women to say that they would consider standing for political election (24% versus 14%).
Those aged 15-19 are most likely to say that they would consider standing for election (21%), compared with 19% of 20-24 year-olds and 18% of 25-30 year-olds.
Respondents who left school at 15 (23%) are the most likely to consider standing for election, compared with those who left school at 16-19 (17%) or 20 years or over (18%).
Employees are the least likely to consider standing for election (17%), when compared with the self-employed (23%), manual workers (21%) and those who are not working (20%).

FLASH EUROBAROMETER 375 “European Youth: Participation in Democratic Life”
17
Respondents who have participated in at least one activity or organisation are more likely to consider standing as a candidate in a political election at some point in their life (23% vs. 14% who have not participated).
Base: All respondents (12,927)

FLASH EUROBAROMETER 375 “European Youth: Participation in Democratic Life”
18
III. AWARENESS OF HOW THE MEMBERS OF THE EUROPEAN
PARLIAMENT ARE ELECTED
Respondents were asked if they know how the members of the European Parliament are elected8.
--47% of respondents are aware of how members
of the European Parliament are elected--
Almost half (47%) of respondents are correct when they say that the following statement is true: ‘the members of the European Parliament are directly elected by the citizens of each EU Member State’.
Understanding of how members are elected is greater in the NMS12 than in the EU15: 55% of respondents in the NMS12 say that the statement is true, compared with 45% in the EU15.
Base: All respondents (12,927)
8 Q3: Could you please tell me whether you think the following statement is true or false: the members of the
European Parliament are directly elected by the citizens of each EU Member State?

FLASH EUROBAROMETER 375 “European Youth: Participation in Democratic Life”
19
Country-level analysis
Awareness of how the members of the European Parliament are elected varies by country. Respondents in 15 EU Member States are more likely than average to be aware of how members are elected.
A particularly high proportion of respondents in the following countries are correct in saying that members are directly elected by the citizens of each Member State: 70% of respondents in Lithuania, 66% in Malta and Romania, 65% in Ireland and 61% in Slovenia, the UK and Portugal. Awareness is also particularly high in Croatia, where 61% say that the statement is true.
On the other hand, awareness is low in the Netherlands (32%), the Czech Republic (32%) and Germany (35%).
The level of 'don’t know' answers was particularly high in Sweden (23%) and Denmark (22%).
Base: All respondents (12,927)

FLASH EUROBAROMETER 375 “European Youth: Participation in Democratic Life”
20
Socio-demographic analysis
Respondents aged 15-19 are particularly aware of how members of the European Parliament are elected: 50% correctly say that the statement is true, compared with 45% of those aged 20-24 and 47% of those aged 25-30.
There are also differences in awareness according to the age at which respondents left education: 46% of those who left education at 15 and 45% of those who left aged 16-19 are aware of how members are elected, compared with 49% of those who left at 20 years or over. Awareness is also higher among respondents living in large towns (50%), compared with 47% in rural villages and 45% in small towns.
True False Don't know
EU27 47% 43% 10%
15-19 50% 40% 10%
20-24 45% 45% 10%
25-30 47% 44% 9%
15- 46% 41% 13%
16-19 45% 43% 12%
20+ 49% 43% 8%
Still studying 48% 44% 8%
Rural village 47% 43% 10%
Small/ Mid-size town 45% 45% 10%
Large town 50% 41% 9%
Q3 Could you please tell me whether you think the following statement is true orfalse: the members of the European Parliament are directly elected by the citizensof each EU Member State?
Age
Education (End of)
Subjective urbanisation
Base: All respondents (12,927)

FLASH EUROBAROMETER 375 “European Youth: Participation in Democratic Life”
21
IV. PROBABILITY OF VOTING IN THE EUROPEAN ELECTIONS IN 2014
The following section of the report examines the likelihood of young people voting in the next European elections due in 2014.
Respondents were asked to state, on a scale between one and ten (where one means that they will definitely not vote and ten means that they will definitely vote), how likely it is that they will vote in the next European elections in 20149.
--64% say they are likely to vote in the 2014 European elections--
Approximately two thirds of respondents (64%) say that they are ‘likely’ to vote in the next European elections, that is, they gave scores of six or above for their answers to this question. A third (35%) say they are unlikely to vote, giving scores of between one and five. There are approximately three in ten (28%) respondents who say they will definitely vote, who gave a score of ten in response to this question, and one in ten (11%) who say they will definitely not vote, who gave a score of one.
Base: If at least 17 years old (except Austria – all respondents) = 11,702
(91% from the total number of respondents)
9 Q4: Can you tell me on a scale of 1 to 10 how likely it is that you would vote in the next European elections
in 2014? Please place yourself at a point on this scale where '1' indicates that you would "definitely not vote", '10' indicates that you would "definitely vote" and the remaining numbers indicate something in between these two positions?

FLASH EUROBAROMETER 375 “European Youth: Participation in Democratic Life”
22
Country-level analysis
There is a difference of 33 percentage points between the countries with the lowest and highest levels of respondents indicating that they are ‘likely’ to vote in the European elections in 2014.
In Belgium, where voting in the European elections is normally compulsory, four in five (80%) of respondents say they are likely to vote. There are six other countries with high proportions of respondents showing positive intentions towards voting in the next European elections: the Netherlands (76%), Sweden (76%), Italy (76%), Ireland (76%), Luxembourg (75%) and Malta (75%).
The country with the lowest level of respondents indicating they are likely to vote is Slovenia (47%). There are two other countries where slightly less than half of respondents say that they are likely to vote: Estonia (48%) and the Czech Republic (48%).
Base: If at least 17 years old (except Austria – all respondents) = 11,702
(91% from the total number of respondents)

FLASH EUROBAROMETER 375 “European Youth: Participation in Democratic Life”
23
Socio-demographic analysis
There are a variety of significant differences between sub-groups.
A higher proportion of women (67%) than men (62%) say that they are likely to vote in the 2014 European elections.
The 16-19 age group has the highest proportion of respondents who say they are likely to vote (68%), compared to 65% of those aged 20-24 and 62% of those aged 25-30.
Age of completion of education appears to affect the findings for this question. Those who left education at 15 or under and those that completed their education between the ages of 16 and 19 have much lower proportions of respondents who say they are likely to vote (48% and 59% respectively) than among those who completed their education aged 20 or over (67%).
Manual workers or the self-employed (57% and 59% respectively) are less likely to vote than respondents who are either employees (66%) or who are not working (64).
Respondents who have participated in at least one organisation (such as a youth group, non-governmental organisation, etc.) are more likely to vote than those who have not participated in any organisation (70% vs. 57%).

FLASH EUROBAROMETER 375 “European Youth: Participation in Democratic Life”
24
Total 'Likely' Total 'Not likely' Don't know
EU27 64% 35% 1%
Male 62% 37% 1%
Female 67% 32% 1%
15-19 68% 31% 1%
20-24 65% 34% 1%
25-30 62% 37% 1%
15- 48% 50% 2%
16-19 59% 40% 1%
20+ 67% 32% 1%
Still studying 72% 27% 1%
Self-employed 59% 41% 0%
Employee 66% 33% 1%
Manual workers 57% 41% 2%
Not working 64% 35% 1%
At least one 70% 29% 1%
None 57% 42% 1%
Respondent occupation scale
Participated in activities
Q4 Can you tell me on a scale of 1 to 10 how likely it is that you would vote in thenext European elections in 2014? Please place yourself at a point on this scalewhere '1' indicates that you would "definitely not vote", '10' indicates that youwould "definitely vote" and the remaining numbers indicate something inbetween these two positions?
Sex
Age
Education (End of)
Base: If at least 17 years old (except Austria – all respondents) = 11,702
(91% from the total number of respondents)

FLASH EUROBAROMETER 375 “European Youth: Participation in Democratic Life”
25
V. REASONS TO VOTE IN THE EUROPEAN ELECTIONS IN 2014
This section of the report comments on a question asked only of those respondents who indicated that they are likely to vote in the European elections in 2014 (scores of 6 to 10). This group of respondents were then asked to give details about why they are likely to do so10.
--94% of respondents state that their belief in democracy is an important reason why they are likely to vote in the 2014 European elections--
The reason with the highest proportion (94%) of respondents saying it affects their intention to vote is the belief that democracy is important. Nine in ten (90%) respondents say that their belief that Europe and European elections are important, while approximately four in five (83%) say that they believe voting is the right way to influence political decision-making. Slightly less than three quarters of respondents (72%) say their belief that voting is a moral obligation affects their position, while seven in ten (70%) simply say that they always vote. Slightly fewer than seven in ten (68%) believe that voting in the European elections has an impact on the problems that concern them specifically, and 65% say the reason they are likely to vote is that they are interested in politics or elections in general.
Base: Respondents who are likely to vote in the European election in 2014 = 7,506
(58% from the total number of respondents)
10 Q5B: If you are likely to vote in the European elections in 2014, will it be because…? 1. You are interested
in politics or elections in general, 2. You believe Europe and European elections are important, 3. You believe that voting is a moral obligation, 4. You believe that voting is the right way to influence political decision-making, 5. You believe that voting at the European elections has an impact on problems that concern you. 6. You believe that democracy is important. 7. You always vote.

FLASH EUROBAROMETER 375 “European Youth: Participation in Democratic Life”
26
Democracy is important - Country-level analysis
The level of respondents who say that ‘democracy is important’ as a reason to vote is highest in Germany, Malta and Denmark (all 98%), Austria, Sweden, Portugal and Ireland (all 97%). The country with the lowest proportion of respondents giving this reason is Romania (85%).
Base: Respondents who are likely to vote in the European election in 2014 = 7,506
(58% from the total number of respondents)

FLASH EUROBAROMETER 375 “European Youth: Participation in Democratic Life”
27
Europe and European elections are important - Country-level analysis
There is a difference of 19 percentage points between the country with the highest proportion (Malta 96%) and the country with the lowest proportion (Cyprus 77%) of respondents who believe that Europe and European elections are important. The proportion of respondents giving this reason is also relatively low in Croatia (78%).
Base: Respondents who are likely to vote in the European election in 2014 = 7,506
(58% from the total number of respondents)

FLASH EUROBAROMETER 375 “European Youth: Participation in Democratic Life”
28
Voting is the right way to influence political decision-making - Country-level analysis
The countries with the highest proportions of respondents whose likelihood of voting is positively affected by their belief that voting is the right way to influence political decision-making are Sweden (96%), Finland (95%) and Denmark (93%). The countries with the lowest proportion of respondents giving this reason include France (72%), Belgium (71%) and Croatia (65%).
Base: Respondents who are likely to vote in the European election in 2014 = 7,506
(58% from the total number of respondents)

FLASH EUROBAROMETER 375 “European Youth: Participation in Democratic Life”
29
Voting is a moral obligation - Country-level analysis
The countries where respondents are most likely to believe that voting is a moral obligation are Italy (88%), Malta (85%), Lithuania (81%), Portugal (81%), Croatia (81%) and Slovenia (80%). The countries with the lowest proportion of respondents who say this are Romania (63%), the United Kingdom (62%) and the Netherlands (56%).
Base: Respondents who are likely to vote in the European election in 2014 = 7,506
(58% from the total number of respondents)

FLASH EUROBAROMETER 375 “European Youth: Participation in Democratic Life”
30
Always vote - Country-level analysis
The countries with the highest proportions of respondents who say that they are likely to vote in the 2014 European elections because they always vote are Belgium (86%), Malta (83%), Germany (79%), Denmark (78%) and Greece (78%). The countries with the lowest proportion of respondents who say they are likely to be voting for this reason include Slovenia (58 %), Hungary (58 %), Bulgaria (55%) and Lithuania (52%).
The EU15 countries have a higher level of respondents who say that they always vote (73%) than the NMS12 countries (61%).
Base: Respondents who are likely to vote in the European election in 2014 = 7,506
(58% from the total number of respondents)

FLASH EUROBAROMETER 375 “European Youth: Participation in Democratic Life”
31
Voting at the European elections has an impact on problems that concern me - Country-level analysis
The levels of respondents who intend to vote at the 2014 European elections because they believe this has an impact on problems that concern them are highest in Bulgaria (82%), Portugal (81%), Czech Republic (78%), Greece (77%), Sweden (77%) and Ireland (77%). The countries with the lowest proportions of respondents who give this as a reason for voting are Germany (61%), France (59%), Estonia (58%) and Croatia (58%).
Base: Respondents who are likely to vote in the European election in 2014 = 7,506
(58% from the total number of respondents)

FLASH EUROBAROMETER 375 “European Youth: Participation in Democratic Life”
32
Interested in politics or elections in general - Country-level analysis
The three countries with the highest proportions of respondents who say they are likely to vote in the 2014 European elections because they are interested in elections in general are Cyprus (76%), Denmark (75%) and Germany (72%). The countries with the lowest proportion of respondents who agree with this are Poland (51%), Belgium (51%), Slovenia (49%) and Croatia (46%).
The EU15 countries have a higher level of respondents (67%) than the NMS12 countries (55%) saying that they will be voting at the next European elections because they are interested in politics or elections in general.
Base: Respondents who are likely to vote in the European election in 2014 = 7,506
(58% from the total number of respondents)

FLASH EUROBAROMETER 375 “European Youth: Participation in Democratic Life”
33
Reasons to vote - Socio-demographic analysis
Respondents who left education aged 20 or over (96%) are more likely to say that their intention to vote in the 2014 European elections is because of their belief that democracy is important than those who completed their time in education aged 15 or under (91%) or between the ages of 16 and 19 (92%).
Women are more likely (92%) than men (88%) to vote because they believe Europe and European elections are important. The youngest age group (aged 15-19) are more likely to give this answer (92%), compared to those aged 25-30 (89%). Employees (88%) are less likely to say this than those who are self-employed (90%), manual workers (90%) and those that are not working (92%).
Those aged 15-19 (86%) are more inclined to vote because they believe that voting is the right way to influence political decision making than those aged 20-24 or 25-30 (both 82%). Respondents who ended their education aged 20 or over (84%) are more likely to say this than those who completed their education aged 15 or under (77%) or aged 16-19 (81%).
Women (75%) are more likely than men (70%) to vote because they believe that voting is a moral obligation. Those aged 20-24 (72%) and those aged 25-30 (76%) are more likely to say this than those aged 15-19 (66%), as are those who completed their education aged 20 or over (74%), compared to those who completed their education aged 15 or under (69%) and aged 16-19 (72%). Four in five (80%) of the self-employed say this, compared to 76% of manual workers, 73% of employees and 71% of those not working.
Respondents who are self-employed (79%) or employees (75%) are more likely to vote because they always vote, compared to respondents who are manual workers (70%) or who are not working (67%). Respondents who completed their education aged 20 or over (78%) are more likely to say they always vote than are those who finished their education aged 15 or under (62%) or those who left education aged 16-19 (71%).
Respondents aged 15-19 (71%) are more likely to vote because they believe that voting has an impact on problems that concern them than are those aged 20-24 (68%) and those aged 25-30 (66%). This belief was more likely to be held by those who left education aged 15 and under (72%), compared to those that completed their education aged 16-19 (67%) or aged 20 or over (67%). The self-employed (72%) and manual workers (72%) are more likely to say this than those not working (68%) and employees (65%).

FLASH EUROBAROMETER 375 “European Youth: Participation in Democratic Life”
34
Male respondents (68%) are more likely than female respondents (61%) to vote because of their interest in politics or elections in general. Respondents aged 25-30 (68%) are more likely to say this, compared to those aged 20-24 (65%) and those aged 15-19 (57%). Respondents who completed their education aged 20 or over (72%) are more likely to say this than those who left education aged 15 or under (59%) and those who left education aged 16-19 (59%). Self-employed respondents (75%) are more likely to vote because of this reason than are employees (67%), manual workers (58%) and those that are not working (63%).
Respondents who have participated in activities run by various organisations (71% vs. 56% who have not) are more likely to take part in the 2014 elections because they are interested in politics or elections in general. Interestingly, this variable has no significant impact on any of the other reasons for voting in the elections.
You believe that democracy is
important
You believe Europe and European elections are
important
You believe that voting is the right way to influence
political decision-making
You believe that voting is a moral
obligationYou always vote
You believe that voting at the
European elections has an impact on
problems that concern you
You are interested in politics or
elections in general
EU27 94% 90% 83% 72% 70% 68% 65%
Male 93% 88% 84% 70% 70% 69% 68%
Female 95% 92% 82% 75% 71% 67% 61%
15-19 94% 92% 86% 66% 52% 71% 57%
20-24 94% 90% 82% 72% 75% 68% 65%
25-30 95% 89% 82% 76% 76% 66% 68%
15- 91% 88% 77% 69% 62% 72% 59%
16-19 92% 90% 81% 72% 71% 67% 59%
20+ 96% 88% 84% 74% 78% 67% 72%
Still studying 95% 93% 85% 71% 65% 71% 65%
Self-employed 96% 90% 85% 80% 79% 72% 75%
Employee 95% 88% 83% 73% 75% 65% 67%
Manual workers 92% 90% 83% 76% 70% 72% 58%
Not working 94% 92% 84% 71% 67% 68% 63%
At least one 95% 90% 84% 73% 73% 70% 71%
None 93% 90% 82% 72% 67% 65% 56%
Sex
Education (End of)
Respondent occupation scale
Participated in activities
Q5B. If you are likely to vote in the European elections in 2014, will it be because…? (% Yes)
Age
Base: Respondents who are likely to vote in the European election in 2014 = 7,506
(58% from the total number of respondents)

FLASH EUROBAROMETER 375 “European Youth: Participation in Democratic Life”
35
VI. REASONS NOT TO VOTE IN THE EUROPEAN ELECTIONS IN 2014
This section of the report comments on a question asked only of those respondents who indicated that they are not likely to vote in the European elections in 2014, i.e. those respondents who gave a score of between one and five on the likelihood to vote scale. The group of respondents who say they are not likely to vote were then asked to give details about the reasons for their response11.
--64% say they are not likely to vote in the 2014 European elections because they believe that their vote will not change anything--
The most frequent response to this question (64%) is because of a belief that their vote will not change anything. Approximately three in five respondents (61%) say it is because they believe they are not sufficiently informed to vote, while 56% say it is due to their belief that the European Parliament does not sufficiently deal with problems that concern them. Slightly more than half (54%) of respondents say they are not likely to vote because they are not interested in European politics and elections and just under half (47%) say it is because they are not interested in politics or elections in general. Approximately two in five (37%) say they are unlikely to vote in the 2014 European elections because they never vote and 18% say it is because they are against Europe and/or the European Union.
Base: Respondents who are not likely to vote in the European election in 2014 = 4,071
(31% from the total number of respondents)
11 Q5A: If you are not likely to vote in the European elections in 2014, will it be because…? 1. You are not
interested in politics or elections in general 2. You are not interested in European politics and elections 3. You believe that your vote will not change anything 4. You are against Europe, the European Union 5. You believe that the European Parliament does not sufficiently deal with problems that concern you 6. You believe that you are not sufficiently informed to vote 7. You never vote.

FLASH EUROBAROMETER 375 “European Youth: Participation in Democratic Life”
36
Vote will not change anything - Country-level analysis
The following chart shows the levels of respondents who state that their vote will not change anything. This belief is most commonly held in Bulgaria (74%), Greece (74%), Belgium (72%) and Lithuania (72%). The countries with the lowest proportion of respondents who say that this belief makes them unlikely to vote are Denmark (46%) and Sweden (37%).
Base: Respondents who are not likely to vote in the European election in 2014 = 4,071
(31% from the total number of respondents)

FLASH EUROBAROMETER 375 “European Youth: Participation in Democratic Life”
37
Not sufficiently informed to vote - Country-level analysis
The countries with the highest proportions of respondents who say that one of the reasons negatively affecting their likelihood to vote in the 2014 European elections is because they are not sufficiently informed to vote are Luxembourg (84%), Poland (71%), Denmark (70%) and Sweden (70%).
The countries with the lowest proportion of respondents who agree this is a reason why they are unlikely to vote include Romania (51%), Hungary (48%) and Croatia (41%).
Base: Respondents who are not likely to vote in the European election in 2014 = 4,071
(31% from the total number of respondents)

FLASH EUROBAROMETER 375 “European Youth: Participation in Democratic Life”
38
European Parliament does not sufficiently deal with the problems that affect me - Country-level analysis
The countries with the highest proportions of respondents who are unlikely to vote in the 2014 European elections because they believe that the European Parliament does not sufficiently deal with the problems that affect them are Italy (79%), Greece (76%) and Portugal (74%).
The countries with the lowest proportion of respondents who agree this is a reason that makes them unlikely to vote include the United Kingdom (39%), Finland (38%) and Denmark (23%).
Base: Respondents who are not likely to vote in the European election in 2014 = 4,071
(31% from the total number of respondents)

FLASH EUROBAROMETER 375 “European Youth: Participation in Democratic Life”
39
Not interested in European politics and elections - Country-level analysis
The countries with the highest proportions of respondents who are unlikely to vote in the 2014 European elections because they are uninterested in European politics and elections are Poland (65%), Sweden (63%), France (61%) and Bulgaria (60%).
The countries with the lowest proportion of respondents who say that this is a reason that makes them unlikely to vote include Cyprus (37%) and Italy (36%).
NMS12 countries (58%) have a greater proportion of respondents who say they are not interested in European politics and elections than EU15 countries (52%).
Base: Respondents who are not likely to vote in the European election in 2014 = 4,071
(31% from the total number of respondents)

FLASH EUROBAROMETER 375 “European Youth: Participation in Democratic Life”
40
Not interested in politics or elections in general - Country-level analysis
The countries with the highest proportions of respondents who are unlikely to vote in the 2014 European elections because they are not interested in politics or elections in general are Poland (60%), Sweden (60%) and Portugal (58%).
The countries with the lowest proportion of respondents who say this is a reason that makes them unlikely to vote include Latvia (41%), France (39%) and Italy (32%).
NMS12 countries (54%) have a greater proportion of respondents than EU15 countries (45%) who say they are unlikely to vote because they are not interested in politics and elections in general.
Base: Respondents who are not likely to vote in the European election in 2014 = 4,071
(31% from the total number of respondents)

FLASH EUROBAROMETER 375 “European Youth: Participation in Democratic Life”
41
Never vote - Country-level analysis
The following chart shows the levels of respondents who say they are unlikely to vote in the 2014 European elections because they never vote. The countries with the highest proportions who say that they never vote are the United Kingdom (53%), Lithuania (48%), Portugal (47%) and France (44%). The countries with the lowest proportion of respondents who say that they never vote are Cyprus (22%), Malta (19%) and Belgium (15%).
EU15 countries (39%) have a greater proportion than NMS12 countries (31%) of respondents that say they are unlikely to vote because they never vote.
Base: Respondents who are not likely to vote in the European election in 2014 = 4,071
(31% from the total number of respondents)

FLASH EUROBAROMETER 375 “European Youth: Participation in Democratic Life”
42
Against Europe, the European Union - Country-level analysis
The following chart shows individual country results for the proportions of respondents that say they are unlikely to vote in the 2014 European elections because they are against Europe and/or the European Union.
Just over six in 10 respondents in Cyprus (57%) say that they are unlikely to vote because they are against Europe and/or the European Union. Croatia has the next highest score on this measure, although much lower than that recorded for Cyprus, at 35%.
The countries with the lowest proportions that say they are unlikely to vote because they are against Europe and/or the European Union are Denmark (13%), Romania (13%), Estonia (13%) and Germany (12%).
Base: Respondents who are not likely to vote in the European election in 2014 = 4,071
(31% from the total number of respondents)

FLASH EUROBAROMETER 375 “European Youth: Participation in Democratic Life”
43
Reasons not to vote - Socio-demographic analysis
More female respondents (67%) than male respondents (62%) say that they are unlikely to vote in the 2014 European elections because they believe that their vote will not change anything. The younger a respondent completed their education, the more likely they are to hold this belief: 68% of those who left education aged 15 or under, 68% of those who left education aged 16-19 and 61% of those who left education aged 20 or over. Respondents who are not working (68%) are more likely to hold this belief than those who are employees (60%), manual workers (62%) or the self-employed (63%).
Female respondents (64%) are more unlikely to vote because they feel they are insufficiently informed than are male respondents (58%). Respondents aged 15-19 (64%) are more likely to say this than those aged 20-24 (62%) and those aged 25-30 (58%). Manual workers (62%), employees (61%) and those that are not working (61%) are more likely to say this than the self-employed (55%).
Female respondents (59%) are more unlikely than male respondents (54%) to vote because of their belief that the European Parliament does not sufficiently deal with the problems that concern them. Respondents aged 20-24 (60%) are more likely to have this belief than those aged 25-30 (55%) or those aged 15-19 (50%). Respondents who completed their education aged 15 or younger (66%) are more to say this than those who finished education aged 16-19 (57%) and those who completed education aged 20 or over (56%). Manual workers (63%) and respondents that are not working (58%) are more likely to say this than are those that are self-employed (50%) or employees (51%).
Male respondents (56%) are more unlikely to vote in the 2014 European elections because they are not interested in European politics and elections than are female respondents (51%). The youngest respondents, aged 15-19 (58%), are more likely to say this than those aged 20-24 (55%) and those aged 25-30 (50%), as are the self-employed (56%), manual workers (56%) and those not working (55%), as compared to employees (50%).
Women (49%) are more unlikely than men (46%) to vote in the 2014 European elections because they are not interested in politics or elections in general. Respondents aged 20-24 (51%) and those aged 15-19 (49%) are more likely to say this than those aged 25-30 (44%). Those who left education aged 16-19 (52%) and those who finished their education aged 15 and under (46%) are more likely to say this than those who completed their education aged 20 or over (39%). Employees (44%) are less likely to say this than respondents that are not working (49%), the self-employed (50%) and manual workers (50%).

FLASH EUROBAROMETER 375 “European Youth: Participation in Democratic Life”
44
Female respondents (39%) are more likely to say they never vote, compared to male respondents (35%). Respondents aged 25-30 (32%) are less likely to say that they never vote, compared to respondents aged 15-19 (41%) and those aged 20-24 (41%). Just three in ten (30%) of those who left education aged 20 or over say they never vote, compared to 41% of those who left education between the ages of 16 and 19, and 41% of those who completed their education aged 15 or younger. Respondents who are not working (41%) are more likely to say this than the self-employed (31%), manual workers (31%) and employees (34%). There are greater numbers of respondents dwelling in large towns (41%) that say they never vote, than there are among respondents who live in small/mid-size towns (38%) and rural villages (31%).
One in five (20%) male respondents, compared to 15% of female respondents, say they are unlikely to vote because they are against Europe and/or the European Union. The older respondents in this sample, those aged 25-30 (20%), are more likely to say this than those aged 15-19 (14%) or those aged 20-24 (17%). Age of completion of education is a factor affecting response to this question: 29% of those who left education aged 15 or younger say they are against Europe and/or the European Union, compared to 19% of those who left education aged 16-19. Manual workers (25%) and the self-employed (22%) have higher proportions saying this, compared to those that are not working (18%) and employees (14%).
Just like the results presented in Q5b, participation in activities run by various organisations has an impact on interest in politics or elections in general. Those who have not participated in any such activities (53% vs. 41% who have participated) are less likely to be interested in politics or elections.
You believe that your vote will not change anything
You believe that you are not sufficiently informed to vote
You believe that the European
Parliament does not sufficiently deal
with problems that concern you
You are not interested in
European politics and elections
You are not interested in
politics or elections in general
You never voteYou are against
Europe, the European Union
EU27 64% 61% 56% 54% 47% 37% 18%
Male 62% 58% 54% 56% 46% 35% 20%
Female 67% 64% 59% 51% 49% 39% 15%
15-19 63% 64% 50% 58% 49% 41% 14%
20-24 64% 62% 60% 55% 51% 41% 17%
25-30 65% 58% 55% 50% 44% 32% 20%
15- 68% 59% 66% 52% 46% 41% 29%
16-19 68% 59% 57% 56% 52% 41% 19%
20+ 61% 61% 56% 51% 39% 30% 17%
Still studying 59% 64% 53% 52% 48% 35% 14%
Rural village 64% 61% 54% 56% 47% 31% 18%
Small/ Mid-size town 65% 58% 58% 51% 46% 38% 19%
Large town 64% 64% 55% 55% 49% 41% 17%
At least one 61% 60% 54% 51% 41% 34% 19%
None 67% 61% 57% 56% 53% 39% 17%
Q5A. If you are not likely to vote in the European elections in 2014, will it be because…? (% Yes)
Sex
Age
Education (End of)
Subjective urbanisation
Participated in activities
Base: Respondents who are not likely to vote in the European election in 2014 = 4,071
(31% from the total number of respondents)

ANNEXES

TECHNICAL SPECIFICATIONS

FLASH EUROBAROMETER 375 “European Youth: Participation in Democratic Life”
TS1
FLASH EUROBAROMETER 375 “European Youth: Participation in Democratic Life”
TECHNICAL SPECIFICATIONS Between the 2nd and the 19th of April 2013, TNS Political & Social, a consortium created between TNS political & social, TNS UK and TNS opinion, carried out the survey FLASH EUROBAROMETER 375 about “European Youth: Participation in Democratic Life”. This survey has been requested by the EUROPEAN COMMISSION, Directorate-General for Education and Culture. It is a level B survey (specific target: population aged 15-30 years old) co-ordinated by the Directorate-General for Communication (“Research and Speechwriting” Unit). The FLASH EUROBAROMETER 375 covers the population of the respective nationalities of the European Union Member States, resident in each of the 27 Member States and aged 15-30 years old. It was also conducted in Croatia. The survey covers the national population of citizens in Croatia as well as the population of citizens of all the European Union Member States that are residents in this country and have a sufficient command of the national language to answer the questionnaire. All interviews were carried using the TNS e-Call center (our centralized CATI system). In every country respondents were called both on fixed lines and mobile phones. The basic sample design applied in all states is multi-stage random (probability). In each household, the respondent was drawn at random following the "last birthday rule".
TNS has developed its own RDD sample generation capabilities based on using contact telephone numbers from responders to random probability or random location face to face surveys, such as Eurobarometer, as seed numbers. The approach works because the seed number identifies a working block of telephone numbers and reduces the volume of numbers generated that will be ineffective. The seed numbers are stratified by NUTS2 region and urbanisation to approximate a geographically representative sample. From each seed number the required sample of numbers are generated by randomly replacing the last two digits. The sample is then screened against business databases in order to exclude as many of these numbers as possible before going into field. This approach is consistent across all countries.

FLASH EUROBAROMETER 375 “European Youth: Participation in Democratic Life”
TS2
Readers are reminded that survey results are estimations, the accuracy of which, everything being equal, rests upon the sample size and upon the observed percentage. With samples of about 1,000 interviews, the real percentages vary within the following confidence limits:
various sample sizes are in rows various observed results are in columns
5% 10% 15% 20% 25% 30% 35% 40% 45% 50%
95% 90% 85% 80% 75% 70% 65% 60% 55% 50%
N=50 6,0 8,3 9,9 11,1 12,0 12,7 13,2 13,6 13,8 13,9 N=50
N=500 1,9 2,6 3,1 3,5 3,8 4,0 4,2 4,3 4,4 4,4 N=500
N=1000 1,4 1,9 2,2 2,5 2,7 2,8 3,0 3,0 3,1 3,1 N=1000
N=1500 1,1 1,5 1,8 2,0 2,2 2,3 2,4 2,5 2,5 2,5 N=1500
N=2000 1,0 1,3 1,6 1,8 1,9 2,0 2,1 2,1 2,2 2,2 N=2000
N=3000 0,8 1,1 1,3 1,4 1,5 1,6 1,7 1,8 1,8 1,8 N=3000
N=4000 0,7 0,9 1,1 1,2 1,3 1,4 1,5 1,5 1,5 1,5 N=4000
N=5000 0,6 0,8 1,0 1,1 1,2 1,3 1,3 1,4 1,4 1,4 N=5000
N=6000 0,6 0,8 0,9 1,0 1,1 1,2 1,2 1,2 1,3 1,3 N=6000
N=7000 0,5 0,7 0,8 0,9 1,0 1,1 1,1 1,1 1,2 1,2 N=7000
N=7500 0,5 0,7 0,8 0,9 1,0 1,0 1,1 1,1 1,1 1,1 N=7500
N=8000 0,5 0,7 0,8 0,9 0,9 1,0 1,0 1,1 1,1 1,1 N=8000
N=9000 0,5 0,6 0,7 0,8 0,9 0,9 1,0 1,0 1,0 1,0 N=9000
N=10000 0,4 0,6 0,7 0,8 0,8 0,9 0,9 1,0 1,0 1,0 N=10000
N=11000 0,4 0,6 0,7 0,7 0,8 0,9 0,9 0,9 0,9 0,9 N=11000
N=12000 0,4 0,5 0,6 0,7 0,8 0,8 0,9 0,9 0,9 0,9 N=12000
N=13000 0,4 0,5 0,6 0,7 0,7 0,8 0,8 0,8 0,9 0,9 N=13000
N=14000 0,4 0,5 0,6 0,7 0,7 0,8 0,8 0,8 0,8 0,8 N=14000
N=15000 0,3 0,5 0,6 0,6 0,7 0,7 0,8 0,8 0,8 0,8 N=15000
5% 10% 15% 20% 25% 30% 35% 40% 45% 50%
95% 90% 85% 80% 75% 70% 65% 60% 55% 50%
Statistical Margins due to the sampling process
(at the 95% level of confidence)

FLASH EUROBAROMETER 375 “European Youth: Participation in Democratic Life”
TS3
ABBR. COUNTRIES INSTITUTES N° INTERVIEWS
FIELDWORK DATES
POPULATION 15-30 y.o.
BE Belgium TNS Dimarso 500 02/04/2013 11/04/2013 2.191.848 BG Bulgaria TNS BBSS 500 02/04/2013 05/04/2013 1.423.552 CZ Czech Rep. TNS Aisa s.r.o 500 02/04/2013 09/04/2013 2.083.493 DK Denmark TNS Gallup A/S 503 02/04/2013 09/04/2013 1.085.001 DE Germany TNS Infratest 500 04/04/2013 19/04/2013 15.047.599 EE Estonia TNS Emor 500 02/04/2013 03/04/2013 295.806 EL Greece TNS ICAP 500 02/04/2013 11/04/2013 1.875.992 ES Spain TNS Demoscopia S.A 500 02/04/2013 12/04/2013 8.356.631 FR France TNS Sofres 501 02/04/2013 10/04/2013 12.321.756 IE Ireland IMS Millward Brown 500 02/04/2013 17/04/2013 1.023.986 IT Italy TNS ITALIA 501 03/04/2013 12/04/2013 10.211.911 CY Rep. of Cyprus CYMAR 300 02/04/2013 03/04/2013 209.972 LV Latvia TNS Latvia 501 02/04/2013 09/04/2013 445.259 LT Lithuania TNS LT 500 02/04/2013 04/04/2013 644.404 LU Luxembourg TNS Dimarso 300 02/04/2013 11/04/2013 88.103 HU Hungary TNS Hoffmann Kft 504 02/04/2013 13/04/2013 2.026.984
MT Malta MISCO International Ltd
300 02/04/2013 04/04/2013 83.452
NL Netherlands TNS NIPO 500 02/04/2013 17/04/2013 3.262.524 AT Austria TNS Austria 500 02/04/2013 12/04/2013 1.692.724 PL Poland TNS OBOP 500 02/04/2013 18/04/2013 8.959.451 PT Portugal TNS EUROTESTE 500 02/04/2013 11/04/2013 1.801.188 RO Romania TNS CSOP 505 02/04/2013 05/04/2013 4.691.208 SI Slovenia RM PLUS 502 02/04/2013 05/04/2013 389.950 SK Slovakia TNS AISA Slovakia 510 02/04/2013 11/04/2013 1.251.445 FI Finland TNS Gallup Oy 500 02/04/2013 08/04/2013 1.069.338 SE Sweden TNS SIFO 500 02/04/2013 19/04/2013 1.955.025 UK United Kingdom TNS UK 500 02/04/2013 18/04/2013 13.493.519
TOTAL EU27
12.927
02/04/2013
19/04/2013 97.982.121
HR Croatia Puls 500 02/04/2013 11/04/2013 854.626
TOTAL
13.427
02/04/2013
19/04/2013 98.836.747

QUESTIONNAIRE

FLASH EUROBAROMETER 375 “European Youth: Participation in Democratic Life”
D4
D4A
12
3456
D4B
12
3456
European Youth
How old were you when you stopped full-time education?
(INT.: IF "STILL STUDYING", CODE ‘00’ - IF "NO EDUCATION" CODE '01' - IF "REFUSAL" CODE '98' - IF "DK" CODE '99')
FL908 D4
IF ‘NO EDUCATION’, ‘REFUSAL’ OR ‘DON’T KNOW’, CODE 01 OR 98 OR 99 IN D4, THEN GO TO Q1
ASK D4A IF ‘STILL STUDYING’, CODE 00 IN D4, OTHERS GO TO D4B
What type of education or training are you in?
(READ OUT IF NECESSARY - ONE ANSWER ONLY)
Lower secondary levelUpper secondary level, general educationUpper secondary level, general vocational education and training including apprenticeshipsPost-secondary, non-higher educationHigher educationDK/NA
FL319a D4a
ASK D4B IF FINISHED EUDCATION, D4<> 00, OTHERS GO TO Q1
What is the highest level of education or training that you have completed?
(READ OUT IF NECESSARY - ONE ANSWER ONLY)
Left school before completing lower secondary educationUpper secondary level, general educationUpper secondary level, general vocational education and training including apprenticeshipsPost-secondary, non-higher educationHigher educationDK/NA
FL319a D4b
Q1

FLASH EUROBAROMETER 375 “European Youth: Participation in Democratic Life”
Q1
1234
Q2
12345
Q3
123
ASK ALL
During the last 3 years, did you vote in any political election at the local, regional or national level? If you were, at that time, not eligible to vote, please say so.
(READ OUT – ONE ANSWER ONLY)
YesNo, did not vote in an electionNo, because you were not old enough to voteDK/NA
FL319a Q3
Would you consider standing as a candidate in a political election at some point in your life?
(READ OUT – ONE ANSWER ONLY)
Yes, certainlyYes, probablyNo, probably notNo, certainly notDK/NA
NEW
Could you please tell me whether you think the following statement is true or false: the members of the European Parliament are directly elected by the citizens of each EU Member State?
TRUEFALSEDK/NA
NEW
Q2

FLASH EUROBAROMETER 375 “European Youth: Participation in Democratic Life”
Q4
123456789
1011
Q5A
1
2
3
45
6
7
ASK Q4 IF AT LEAST 17 YEARS OLD (EXCEPT AUSTRIA – ASK ALL), D1<>15 OR D1<>16 - OTHERS GO TO Q6
Can you tell me on a scale of 1 to 10 how likely it is that you would vote in the next European elections in 2014? Please place yourself at a point on this scale where '1' indicates that you would "definitely not vote", '10' indicates that you would "definitely vote" and the remaining numbers indicate something in between these two positions?
(DO NOT READ OUT – ONE ANSWER ONLY)
12345678910DK/NA
NEW
ASK Q5A TO THOSE WHO ARE NOT LIKELY TO VOTE, CODES 1-5 IN Q4 - OTHERS GO TO Q5B
Q5A: ROTATE STATEMENTS 1 TO 7
If you are not likely to vote in the European elections in 2014, will it be because…?
(READ OUT - ONE ANSWER ONLY)
Yes No DK/NA
You are not interested in politics or elections in general
1 2 3
You are not interested in European politics and elections
1 2 3
You believe that your vote will not change anything 1 2 3
You are against Europe, the European Union 1 2 3You believe that the European Parliament does not sufficiently deal with problems that concern you
1 2 3
You believe that you are not sufficiently informed to vote
1 2 3
You never vote 1 2 3
NEW
Q3

FLASH EUROBAROMETER 375 “European Youth: Participation in Democratic Life”
Q5B
1
2
34
5
67
Q6
1,2,3,4,5,
6,7,8,9,
10,
ASK Q5B TO THOSE WHO ARE LIKELY TO VOTE, CODES 6-10 IN Q4 - OTHERS GO TO Q6
Q5B: ROTATE STATEMENTS 1 TO 7
If you are likely to vote in the European elections in 2014, will it be because…?
(READ OUT - ONE ANSWER ONLY)
Yes No DK/NA
You are interested in politics or elections in general 1 2 3
You believe Europe and European elections are important
1 2 3
You believe that voting is a moral obligation 1 2 3You believe that voting is the right way to influence political decision-making
1 2 3
You believe that voting at the European elections has an impact on problems that concern you
1 2 3
You believe that democracy is important 1 2 3You always vote 1 2 3
NEW
ASK ALL
Q6: ROTATE ITEMS 1 TO 7
Q6: ITEM 9 - SINGLE CODE
Have you in the past year participated in any activities of the following organisations?
(READ OUT – MULTIPLE ANSWERS POSSIBLE)
A sports clubA youth club, leisure-time club or any kind of youth organisationA cultural organisationA political organisation or a political partyA local organisation aimed at improving your local community (M)An organisation active in the domain of climate change/environmental issues (M)An organisation promoting human rights or global developmentAny other non-governmental organisationNone of these (DO NOT READ OUT)DK/NA
FL319a Q1 STRONGLY MODIFIED
Q4

TABLES

FLASH EUROBAROMETER 375 “European Youth: Participation in Democratic Life”
% Flash EB375
Diff.Flash EB
319
Flash EB375
Diff.Flash EB
319
Flash EB375
Diff.Flash EB
319
Flash EB375
Diff.Flash EB
319
Flash EB375
Diff.Flash EB
319EU 27 56 -6 21 5 23 2 0 -1 44 7
BE 73 0 7 2 20 -2 0 0 27 0
BG 56 -6 26 12 17 -7 1 1 43 5
CZ 60 0 27 4 12 -5 1 1 39 -1
DK 56 -8 7 -3 37 11 0 0 44 8
DE 53 -10 20 5 26 5 1 0 46 10
EE 44 -18 23 5 32 12 1 1 55 17
IE 56 3 20 -4 23 1 1 0 43 -3
EL 66 -2 17 5 17 -3 0 0 34 2
ES 61 6 18 -5 21 -1 0 0 39 -6
FR 64 4 17 4 19 -8 0 0 36 -4
IT 71 15 10 -8 19 -2 0 -5 29 -10
CY 59 3 15 0 23 -5 3 2 38 -5
LV 65 -2 11 -5 24 7 0 0 35 2
LT 48 14 32 -5 20 -8 0 -1 52 -13
LU 49 -1 23 0 28 2 0 -1 51 2
HU 39 -28 35 21 26 7 0 0 61 28
MT 76 10 4 -2 20 -8 0 0 24 -10
NL 60 -8 10 1 30 7 0 0 40 8
AT 62 -21 31 23 7 -2 0 0 38 21
PL 52 -22 22 14 25 7 1 1 47 21
PT 48 -12 27 11 25 2 0 -1 52 13
RO 63 -3 20 8 17 -4 0 -1 37 4
SI 63 -9 22 9 15 0 0 0 37 9
SK 52 -19 30 17 18 2 0 0 48 19
FI 64 11 15 -8 21 -2 0 -1 36 -10
SE 49 -25 9 3 41 21 1 1 50 24
UK 38 -15 36 11 26 5 0 -1 62 16
HR 67 13 20 0 33
Ja
Q1 Au cours des 3 dernières années, avez-vous voté lors d’une élection politique, que ce soit au niveau local, régional ou national ? Si vous n’aviez pas le droit de voter à cette période, merci de le préciser.
Q1 During the last 3 years, did you vote in any political election at the local, regional or national level? If you were, at that time, not eligible to vote, please say so.
Q1 Haben Sie innerhalb der letzten 3 Jahre bei irgendeiner politischen Wahl auf lokaler, regionaler oder nationaler Ebene gewählt? Wenn Sie zu dieser Zeit nicht wahlberechtigt waren, so sagen Sie dies bitte.
Nein, bei keiner Wahl gewählt
Total 'Non'
Total 'No'
Gesamt 'Nein'
Non, parce que vous n’étiez pas encore en
âge de voter
No, because you were not old enough
to vote
Nein, weil Sie noch nicht alt genug
waren, um zu wählen
Weiß nicht / Keine Angabe
Oui
Yes
NSP/SR
DK/NA
Non, n’a pas voté lors d’une élection
No, did not vote in an election
T1

FLASH EUROBAROMETER 375 “European Youth: Participation in Democratic Life”
%
EU 27
BE
BG
CZ
DK
DE
EE
IE
EL
ES
FR
IT
CY
LV
LT
LU
HU
MT
NL
AT
PL
PT
RO
SI
SK
FI
SE
UK
HR 1 15 844 11 24 60
69
6 16 37 39 2 22 76
6 23 48 21
2 1724 57
2 29
81
3 14 53 29 1 17 82
6 11
75
5 14 26 53 2 19 79
9 15 14 61
2 2234 42
1 24
76
5 14 26 52 3 19 78
6 16
84
6 9 28 56 1 15 84
4 10 47 37
2 814 76
2 14
90
1 9 16 71 3 10 87
2 6
78
6 15 35 43 1 21 78
5 15 35 43
1 2113 65
2 20
78
5 22 33 39 1 27 72
4 17
84
5 17 26 47 5 22 73
3 12 23 61
1 1217 70
1 15
87
5 12 26 54 3 17 80
4 8
80
5 15 32 47 1 20 79
3 11 37 43
1 1233 54
6 14
87
5 16 33 45 1 21 78
1 11
74
3 9 33 54 1 12 87
6 16 25 49
2 1930 49
4 22
79
3 11 34 51 1 14 85
5 14
Total 'Non'
Total 'No'
Gesamt 'Nein'
Flash EB375
Total 'Oui'
Total 'Yes'
Gesamt 'Ja'
Flash EB375
NSP/SR
DK/NA
Weiß nicht / Keine Angabe
Flash EB375
Non, certainement
pas
No, certainly not
Nein, sicher nicht
Flash EB375
Nein, wahrscheinlich
nichtFlash EB
375
Oui, probablement
Yes, probably
Ja, wahrscheinlich
Flash EB375
Oui, certainement
Yes, certainly
Ja, sicher
Flash EB375
Q2 Envisageriez-vous d’être candidat à une élection politique à un moment de votre vie ?
Q2 Would you consider standing as a candidate in a political election at some point in your life?
Q2 Könnten Sie sich vorstellen, sich im Laufe ihres Lebens irgendwann als Kandidat für eine politische Wahl aufstellen zu lassen?
Non, probablement
pas
No, probably not
T2

FLASH EUROBAROMETER 375 “European Youth: Participation in Democratic Life”
%
EU 27
BE
BG
CZ
DK
DE
EE
IE
EL
ES
FR
IT
CY
LV
LT
LU
HU
MT
NL
AT
PL
PT
RO
SI
SK
FI
SE
UK
HR
Q3 Veuillez me dire si vous pensez que l’affirmation suivante est vraie ou fausse : les membres du Parlement européen sont élus directement par les citoyens de chacun des États Membres ? Q3 Could you please tell me whether you think the following statement is true or false: the members of the European Parliament are directly elected by the citizens of each EU Member State? Q3 Bitte sagen Sie mir, ob die folgende Aussage Ihrer Meinung nach richtig oder falsch ist: Die Abgeordneten des Europäischen Parlaments werden direkt von den Bürgern der einzelnen EU-Mitgliedstaaten gewählt.
61 31 8
47 30 23
61 25 14
52 41 7
54 36 10
66 26 8
61 33 6
55 39 6
61 29 10
32 61 7
41 52 7
56 36 8
66 18 16
70 26 4
50 42 8
47 37 16
57 33 10
42 46 12
40 50 10
46 47 7
45 50 5
48 37 15
65 27 8
43 35 22
35 58 7
52 37 11
32 57 11
Falsch
Flash EB375
47 43 10
43 50 7
Vrai
True
Richtig
Flash EB375
NSP/SR
DK/NA
Weiß nicht / Keine Angabe
Flash EB375
Faux
False
T3
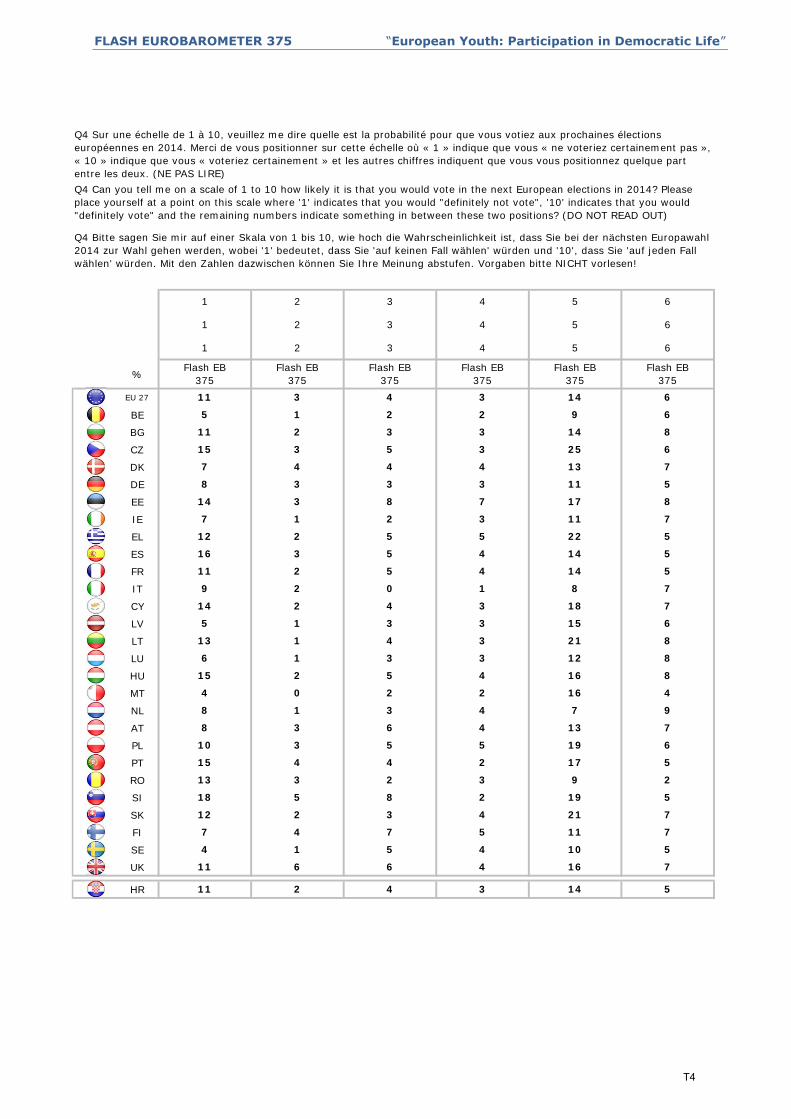
FLASH EUROBAROMETER 375 “European Youth: Participation in Democratic Life”
%
EU 27
BE
BG
CZ
DK
DE
EE
IE
EL
ES
FR
IT
CY
LV
LT
LU
HU
MT
NL
AT
PL
PT
RO
SI
SK
FI
SE
UK
HR
Q4 Sur une échelle de 1 à 10, veuillez me dire quelle est la probabilité pour que vous votiez aux prochaines élections européennes en 2014. Merci de vous positionner sur cette échelle où « 1 » indique que vous « ne voteriez certainement pas », « 10 » indique que vous « voteriez certainement » et les autres chiffres indiquent que vous vous positionnez quelque part entre les deux. (NE PAS LIRE)Q4 Can you tell me on a scale of 1 to 10 how likely it is that you would vote in the next European elections in 2014? Please place yourself at a point on this scale where '1' indicates that you would "definitely not vote", '10' indicates that you would "definitely vote" and the remaining numbers indicate something in between these two positions? (DO NOT READ OUT)
Q4 Bitte sagen Sie mir auf einer Skala von 1 bis 10, wie hoch die Wahrscheinlichkeit ist, dass Sie bei der nächsten Europawahl 2014 zur Wahl gehen werden, wobei '1' bedeutet, dass Sie 'auf keinen Fall wählen' würden und '10', dass Sie 'auf jeden Fall wählen' würden. Mit den Zahlen dazwischen können Sie Ihre Meinung abstufen. Vorgaben bitte NICHT vorlesen!
14 511 2 4 3
11 6 6 4 16 7
10 54 1 5 4
7 4 7 5 11 7
21 712 2 3 4
18 5 8 2 19 5
9 213 3 2 3
15 4 4 2 17 5
19 610 3 5 5
8 3 6 4 13 7
7 98 1 3 4
4 0 2 2 16 4
16 815 2 5 4
6 1 3 3 12 8
21 813 1 4 3
5 1 3 3 15 6
18 714 2 4 3
9 2 0 1 8 7
14 511 2 5 4
16 3 5 4 14 5
22 512 2 5 5
7 1 2 3 11 7
17 814 3 8 7
8 3 3 3 11 5
13 77 4 4 4
15 3 5 3 25 6
14 811 2 3 3
5 1 2 2 9 6
14 611 3 4 3
6
Flash EB375
5
5
5
Flash EB375
6
6
4
Flash EB375
3
3
3
Flash EB375
4
4
2
Flash EB375
1
1
1
Flash EB375
2
2
T4

FLASH EUROBAROMETER 375 “European Youth: Participation in Democratic Life”
%
EU 27
BE
BG
CZ
DK
DE
EE
IE
EL
ES
FR
IT
CY
LV
LT
LU
HU
MT
NL
AT
PL
PT
RO
SI
SK
FI
SE
UK
HR 1 34 65
43 561
12 14
10 12 6 21
6 28
0 24 76
34 651
9 16
14 18 13 13
10 36
0 42 58
52 471
8 12
9 12 6 15
6 25
3 30 67
42 562
9 11
6 13 8 24
7 38
0 42 58
34 651
10 16
10 17 9 22
7 19
1 23 76
24 751
16 22
8 16 8 39
7 22
1 42 57
25 750
9 13
13 11 3 40
5 22
0 42 58
27 730
12 16
12 19 11 25
6 16
4 41 55
20 764
7 9
10 12 10 37
5 27
0 36 64
42 580
8 10
13 11 4 25
7 34
1 46 53
24 760
6 10
14 14 8 33
5 27
3 49 48
28 711
10 9
11 15 11 29
4 17
1 32 67
51 481
6 18
9 10 5 18
7 29
1 33 66
19 801
9 9
10 14 6 44
5 35
1 35 64
Flash EB375
Flash EB375
Flash EB375
10 13
Flash EB375
Flash EB375
Flash EB375
Flash EB375
7 28
Weiß nicht / Keine Angabe
Gesamt 'Nicht wahrscheinlich'
Gesamt 'Wahrscheinlich'
Total 'Not likely' Total 'Likely'DK/NA
7 8
7 8 9 10
9 10
9 10 NSP/SR Total 'Pas probable' Total 'Probable'7 8
Q4 Sur une échelle de 1 à 10, veuillez me dire quelle est la probabilité pour que vous votiez aux prochaines élections européennes en 2014. Merci de vous positionner sur cette échelle où « 1 » indique que vous « ne voteriez certainement pas », « 10 » indique que vous « voteriez certainement » et les autres chiffres indiquent que vous vous positionnez quelque part entre les deux. (NE PAS LIRE)Q4 Can you tell me on a scale of 1 to 10 how likely it is that you would vote in the next European elections in 2014? Please place yourself at a point on this scale where '1' indicates that you would "definitely not vote", '10' indicates that you would "definitely vote" and the remaining numbers indicate something in between these two positions? (DO NOT READ OUT)
Q4 Bitte sagen Sie mir auf einer Skala von 1 bis 10, wie hoch die Wahrscheinlichkeit ist, dass Sie bei der nächsten Europawahl 2014 zur Wahl gehen werden, wobei '1' bedeutet, dass Sie 'auf keinen Fall wählen' würden und '10', dass Sie 'auf jeden Fall wählen' würden. Mit den Zahlen dazwischen können Sie Ihre Meinung abstufen. Vorgaben bitte NICHT vorlesen!
T5

FLASH EUROBAROMETER 375 “European Youth: Participation in Democratic Life”
%
EU 27
BE
BG
CZ
DK
DE
EE
IE
EL
ES
FR
IT
CY
LV
LT
LU
HU
MT
NL
AT
PL
PT
RO
SI
SK
FI
SE
UK
HR
Q4T1 Sur une échelle de 1 à 10, veuillez me dire quelle est la probabilité pour que vous votiez aux prochaines élections européennes en 2014. Merci de vous positionner sur cette échelle où « 1 » indique que vous « ne voteriez certainement pas », « 10 » indique que vous « voteriez certainement » et les autres chiffres indiquent que vous vous positionnez quelque part entre les deux. (NE PAS LIRE)
Q4T1 Can you tell me on a scale of 1 to 10 how likely it is that you would vote in the next European elections in 2014? Please place yourself at a point on this scale where '1' indicates that you would "definitely not vote", '10' indicates that you would "definitely vote" and the remaining numbers indicate something in between these two positions? (DO NOT READ OUT)Q4T1 Bitte sagen Sie mir auf einer Skala von 1 bis 10, wie hoch die Wahrscheinlichkeit ist, dass Sie bei der nächsten Europawahl 2014 zur Wahl gehen werden, wobei '1' bedeutet, dass Sie 'auf keinen Fall wählen' würden und '10', dass Sie 'auf jeden Fall wählen' würden. Mit den Zahlen dazwischen können Sie Ihre Meinung abstufen. Vorgaben bitte NICHT vorlesen!
28
25
13
35
21
20
24
38
15
22
39
22
22
27
25
16
40
27
25
34
37
29
29
17
33
35
18
Vous voteriez certainement
You would definitely vote
Sie würden auf jeden Fall wählen
Flash EB37528
44
T6

FLASH EUROBAROMETER 375 “European Youth: Participation in Democratic Life”
%
EU 27
BE
BG
CZ
DK
DE
EE
IE
EL
ES
FR
IT
CY
LV
LT
LU
HU
MT
NL
AT
PL
PT
RO
SI
SK
FI
SE
UK
HR
Q4T2 Sur une échelle de 1 à 10, veuillez me dire quelle est la probabilité pour que vous votiez aux prochaines élections européennes en 2014. Merci de vous positionner sur cette échelle où « 1 » indique que vous « ne voteriez certainement pas », « 10 » indique que vous « voteriez certainement » et les autres chiffres indiquent que vous vous positionnez quelque part entre les deux. (NE PAS LIRE)
Q4T2 Can you tell me on a scale of 1 to 10 how likely it is that you would vote in the next European elections in 2014? Please place yourself at a point on this scale where '1' indicates that you would "definitely not vote", '10' indicates that you would "definitely vote" and the remaining numbers indicate something in between these two positions? (DO NOT READ OUT)
Q4T2 Bitte sagen Sie mir auf einer Skala von 1 bis 10, wie hoch die Wahrscheinlichkeit ist, dass Sie bei der nächsten Europawahl 2014 zur Wahl gehen werden, wobei '1' bedeutet, dass Sie 'auf keinen Fall wählen' würden und '10', dass Sie 'auf jeden Fall wählen' würden. Mit den Zahlen dazwischen können Sie Ihre Meinung abstufen. Vorgaben bitte NICHT vorlesen!
285 12 14 6
35
7 10 12 6 21
5 9 16 10
25
7 14 18 13 13
7 8 12 6
38
5 9 12 6 15
3 9 11 7
20
5 6 13 8 24
6 10 16 7
22
7 10 17 9 22
9 16 22 7
22
4 8 16 8 39
7 9 13 5
16
7 13 11 3 40
8 12 16 6
27
6 12 19 11 25
7 7 9 5
34
7 10 11 10 37
5 8 10 7
27
5 13 11 4 25
4 6 10 5
17
7 14 14 8 33
8 10 9 4
29
5 11 15 11 29
7 7 18 7
35
6 9 10 5 18
8 9 9 5
28
6 10 14 6 44
6 10 13 7
10
10
10
Flash EB375
9
9
Flash EB375
8
8
8
Flash EB375
9
7
Flash EB375
6
6
6
Flash EB375
7
7
T7

FLASH EUROBAROMETER 375 “European Youth: Participation in Democratic Life”
%
EU 27
BE
BG
CZ
DK
DE
EE
IE
EL
ES
FR
IT
CY
LV
LT
LU
HU
MT
NL
AT
PL
PT
RO
SI
SK
FI
SE
UK
HR
Q4T3 Sur une échelle de 1 à 10, veuillez me dire quelle est la probabilité pour que vous votiez aux prochaines élections européennes en 2014. Merci de vous positionner sur cette échelle où « 1 » indique que vous « ne voteriez certainement pas », « 10 » indique que vous « voteriez certainement » et les autres chiffres indiquent que vous vous positionnez quelque part entre les deux. (NE PAS LIRE)
Q4T3 Can you tell me on a scale of 1 to 10 how likely it is that you would vote in the next European elections in 2014? Please place yourself at a point on this scale where '1' indicates that you would "definitely not vote", '10' indicates that you would "definitely vote" and the remaining numbers indicate something in between these two positions? (DO NOT READ OUT)
Q4T3 Bitte sagen Sie mir auf einer Skala von 1 bis 10, wie hoch die Wahrscheinlichkeit ist, dass Sie bei der nächsten Europawahl 2014 zur Wahl gehen werden, wobei '1' bedeutet, dass Sie 'auf keinen Fall wählen' würden und '10', dass Sie 'auf jeden Fall wählen' würden. Mit den Zahlen dazwischen können Sie Ihre Meinung abstufen. Vorgaben bitte NICHT vorlesen!
1411 2 4 3
10
12 6 6 4 16
4 1 5 4
22
7 4 7 5 11
12 2 3 4
9
19 5 8 2 19
13 3 2 3
19
15 4 4 2 17
10 3 5 5
7
8 3 5 4 13
8 2 3 4
16
4 0 2 2 16
15 2 5 4
21
6 1 3 3 12
13 1 4 3
18
5 1 3 3 15
14 2 4 3
15
9 2 0 1 8
11 2 5 4
22
16 3 5 4 14
12 2 5 5
17
7 1 2 3 11
13 3 8 7
13
8 4 3 3 11
7 4 4 4
14
15 3 5 3 25
12 2 3 3
14
5 1 2 2 9
11 3 4 4
5
5
5
Flash EB375
4
4
Flash EB375
3
3
3
Flash EB375
4
2
Flash EB375
1
1
1
Flash EB375
2
2
T8

FLASH EUROBAROMETER 375 “European Youth: Participation in Democratic Life”
%
EU 27
BE
BG
CZ
DK
DE
EE
IE
EL
ES
FR
IT
CY
LV
LT
LU
HU
MT
NL
AT
PL
PT
RO
SI
SK
FI
SE
UK
HR
Q5A.1 Wenn Sie bei der Europawahl 2014 mit hoher Wahrscheinlichkeit nicht wählen gehen, wird das daran liegen, dass …? Sie sich generell nicht für Politik oder Wahlen interessieren
Q5A.1 S’il est peu probable que vous votiez aux élections européennes de 2014, est-ce que ce sera parce que...? Vous ne vous intéressez pas à la politique ou aux élections en général
Q5A.1 If you are not likely to vote in the European elections in 2014, will it be because…? You are not interested in politics or elections in general
51 47 2
63 36 1
52 46 2
60 38 2
53 44 3
48 50 2
58 42 0
50 49 1
49 49 2
60 38 2
48 44 8
48 51 1
49 50 1
56 43 1
41 56 3
54 43 3
32 61 7
44 54 2
43 56 1
39 60 1
54 44 2
45 55 0
45 55 0
53 43 4
47 52 1
54 45 1
56 41 3
49 49 2
47 51 2
Yes
Ja
Flash EB375
Nein
Flash EB375
Oui NSP/SR
DK/NA
Weiß nicht / Keine Angabe
Flash EB375
Non
No
T9

FLASH EUROBAROMETER 375 “European Youth: Participation in Democratic Life”
%
EU 27
BE
BG
CZ
DK
DE
EE
IE
EL
ES
FR
IT
CY
LV
LT
LU
HU
MT
NL
AT
PL
PT
RO
SI
SK
FI
SE
UK
HR
Q5A.2 Wenn Sie bei der Europawahl 2014 mit hoher Wahrscheinlichkeit nicht wählen gehen, wird das daran liegen, dass…? Sie sich nicht für europäische Politik und Europawahlen interessieren
Q5A.2 S’il est peu probable que vous votiez aux élections européennes de 2014, est-ce que ce sera parce que...? Vous ne vous intéressez pas à la politique et aux élections européennes
Q5A.2 If you are not likely to vote in the European elections in 2014, will it be because…? You are not interested in European politics and elections
53 45 2
51 46 3
56 42 2
63 32 5
55 44 1
48 51 1
56 44 0
51 49 0
50 49 1
65 33 2
51 47 2
55 43 2
52 48 0
52 48 0
55 43 2
57 40 3
36 62 2
37 59 4
47 52 1
61 39 0
58 42 0
50 50 0
51 49 0
54 41 5
55 44 1
58 41 1
56 41 3
60 38 2
54 45 1
Yes
Ja
Flash EB375
Nein
Flash EB375
Oui NSP/SR
DK/NA
Weiß nicht / Keine Angabe
Flash EB375
Non
No
T10

FLASH EUROBAROMETER 375 “European Youth: Participation in Democratic Life”
%
EU 27
BE
BG
CZ
DK
DE
EE
IE
EL
ES
FR
IT
CY
LV
LT
LU
HU
MT
NL
AT
PL
PT
RO
SI
SK
FI
SE
UK
HR
Q5A.3 Wenn Sie bei der Europawahl 2014 mit hoher Wahrscheinlichkeit nicht wählen gehen, wird das daran liegen, dass …? Sie glauben, dass Ihre Stimme nichts ändern wird
Q5A.3 S’il est peu probable que vous votiez aux élections européennes de 2014, est-ce que ce sera parce que...? Vous pensez que votre vote ne changera rien
Q5A.3 If you are not likely to vote in the European elections in 2014, will it be because…? You believe that your vote will not change anything
64 34 2
70 30 0
69 29 2
37 61 2
66 33 1
53 43 4
65 34 1
70 29 1
66 31 3
63 36 1
48 47 5
60 39 1
49 50 1
67 29 4
64 36 0
72 28 0
62 38 0
62 35 3
67 31 2
65 35 0
68 32 0
74 25 1
65 34 1
63 32 5
58 42 0
46 50 4
72 25 3
74 25 1
64 34 2
Yes
Ja
Flash EB375
Nein
Flash EB375
Oui NSP/SR
DK/NA
Weiß nicht / Keine Angabe
Flash EB375
Non
No
T11

FLASH EUROBAROMETER 375 “European Youth: Participation in Democratic Life”
%
EU 27
BE
BG
CZ
DK
DE
EE
IE
EL
ES
FR
IT
CY
LV
LT
LU
HU
MT
NL
AT
PL
PT
RO
SI
SK
FI
SE
UK
HR
Q5A.4 Wenn Sie bei der Europawahl 2014 mit hoher Wahrscheinlichkeit nicht wählen gehen, wird das daran liegen, dass …? Sie gegen Europa, die Europäische Union sind
Q5A.4 S’il est peu probable que vous votiez aux élections européennes de 2014, est-ce que ce sera parce que...? Vous êtes contre l’Europe, l’Union européenne
Q5A.4 If you are not likely to vote in the European elections in 2014, will it be because…? You are against Europe, the European Union
15 78 7
35 63 2
17 80 3
14 77 9
26 71 3
15 80 5
23 76 1
13 85 2
24 71 5
18 77 5
17 69 14
15 82 3
25 74 1
20 78 2
17 79 4
18 80 2
29 71 0
57 39 4
20 75 5
16 82 2
14 83 3
30 68 2
12 88 0
13 82 5
27 70 3
13 80 7
17 80 3
15 82 3
18 79 3
Yes
Ja
Flash EB375
Nein
Flash EB375
Oui NSP/SR
DK/NA
Weiß nicht / Keine Angabe
Flash EB375
Non
No
T12

FLASH EUROBAROMETER 375 “European Youth: Participation in Democratic Life”
%
EU 27
BE
BG
CZ
DK
DE
EE
IE
EL
ES
FR
IT
CY
LV
LT
LU
HU
MT
NL
AT
PL
PT
RO
SI
SK
FI
SE
UK
HR
Q5A.5 Wenn Sie bei der Europawahl 2014 mit hoher Wahrscheinlichkeit nicht wählen gehen, wird das daran liegen, dass …? Sie glauben, dass sich das Europäische Parlament nicht genug um die Probleme kümmert, die Sie betreffen
Q5A.5 S’il est peu probable que vous votiez aux élections européennes de 2014, est-ce que ce sera parce que...? Vous estimez que le Parlement européen ne s’occupe pas suffisamment de problèmes qui vous concernent
Q5A.5 If you are not likely to vote in the European elections in 2014, will it be because…? You believe that the European Parliament does not sufficiently deal with problems that concern you
39 48 13
56 37 7
38 52 10
43 38 19
61 35 4
60 34 6
74 25 1
62 32 6
54 41 5
56 37 7
47 37 16
48 49 3
42 51 7
56 41 3
61 29 10
60 34 6
79 19 2
71 25 4
64 33 3
66 32 2
60 34 6
76 22 2
44 47 9
43 43 14
63 31 6
23 51 26
44 48 8
59 37 4
56 38 6
Yes
Ja
Flash EB375
Nein
Flash EB375
Oui NSP/SR
DK/NA
Weiß nicht / Keine Angabe
Flash EB375
Non
No
T13

FLASH EUROBAROMETER 375 “European Youth: Participation in Democratic Life”
%
EU 27
BE
BG
CZ
DK
DE
EE
IE
EL
ES
FR
IT
CY
LV
LT
LU
HU
MT
NL
AT
PL
PT
RO
SI
SK
FI
SE
UK
HR
Q5A.6 Wenn Sie bei der Europawahl 2014 mit hoher Wahrscheinlichkeit nicht wählen gehen, wird das daran liegen, dass …? Sie glauben, dass Sie nicht ausreichend informiert sind, um wählen zu gehen
Q5A.6 S’il est peu probable que vous votiez aux élections européennes de 2014, est-ce que ce sera parce que...? Vous estimez ne pas être suffisamment informé(e) pour voter
Q5A.6 If you are not likely to vote in the European elections in 2014, will it be because…? You believe that you are not sufficiently informed to vote
53 41 6
41 56 3
63 34 3
70 27 3
63 36 1
60 38 2
60 40 0
51 48 1
64 35 1
71 25 4
64 33 3
62 38 0
84 16 0
48 52 0
64 36 0
65 34 1
56 43 1
63 35 2
64 34 2
67 33 0
60 35 5
64 36 0
58 41 1
66 30 4
53 45 2
70 26 4
65 33 2
55 44 1
61 37 2
Yes
Ja
Flash EB375
Nein
Flash EB375
Oui NSP/SR
DK/NA
Weiß nicht / Keine Angabe
Flash EB375
Non
No
T14

FLASH EUROBAROMETER 375 “European Youth: Participation in Democratic Life”
%
EU 27
BE
BG
CZ
DK
DE
EE
IE
EL
ES
FR
IT
CY
LV
LT
LU
HU
MT
NL
AT
PL
PT
RO
SI
SK
FI
SE
UK
HR
Q5A.7 Wenn Sie bei der Europawahl 2014 mit hoher Wahrscheinlichkeit nicht wählen gehen, wird das daran liegen, dass …? Sie nie wählen gehen
Q5A.7 S’il est peu probable que vous votiez aux élections européennes de 2014, est-ce que ce sera parce que...? Vous ne votez jamais
Q5A.7 If you are not likely to vote in the European elections in 2014, will it be because…? You never vote
53 46 1
29 69 2
23 71 6
25 56 19
30 66 4
29 66 5
47 53 0
28 71 1
35 62 3
34 63 3
19 76 5
33 64 3
38 61 1
33 65 2
29 68 3
48 50 2
24 72 4
22 74 4
34 64 2
44 54 2
37 57 6
23 77 0
35 63 2
28 59 13
25 74 1
30 68 2
15 82 3
31 66 3
37 61 2
Yes
Ja
Flash EB375
Nein
Flash EB375
Oui NSP/SR
DK/NA
Weiß nicht / Keine Angabe
Flash EB375
Non
No
T15

FLASH EUROBAROMETER 375 “European Youth: Participation in Democratic Life”
%
EU 27
BE
BG
CZ
DK
DE
EE
IE
EL
ES
FR
IT
CY
LV
LT
LU
HU
MT
NL
AT
PL
PT
RO
SI
SK
FI
SE
UK
HR
Q5B.1 Wenn Sie bei der Europawahl 2014 mit hoher Wahrscheinlichkeit wählen gehen, wird das daran liegen, dass …? Sie sich generell für Politik oder Wahlen interessieren
Q5B.1 S’il est probable que vous votiez aux élections européennes de 2014, est-ce que ce sera parce que...? Vous vous intéressez à la politique ou aux élections en général
Q5B.1 If you are likely to vote in the European elections in 2014, will it be because…? You are interested in politics or elections in general
63 35 2
46 54 0
70 29 1
60 36 4
49 49 2
58 41 1
67 32 1
53 46 1
66 32 2
51 46 3
62 36 2
65 35 0
67 32 1
64 36 0
70 28 2
65 34 1
66 33 1
76 23 1
68 31 1
69 31 0
60 37 3
61 39 0
72 26 2
63 34 3
59 39 2
75 23 2
51 48 1
60 39 1
65 34 1
Yes
Ja
Flash EB375
Nein
Flash EB375
Oui NSP/SR
DK/NA
Weiß nicht / Keine Angabe
Flash EB375
Non
No
T16

FLASH EUROBAROMETER 375 “European Youth: Participation in Democratic Life”
%
EU 27
BE
BG
CZ
DK
DE
EE
IE
EL
ES
FR
IT
CY
LV
LT
LU
HU
MT
NL
AT
PL
PT
RO
SI
SK
FI
SE
UK
HR
Q5B.2 Wenn Sie bei der Europawahl 2014 mit hoher Wahrscheinlichkeit wählen gehen, wird das daran liegen, dass …? Sie Europa und Europawahlen für wichtig halten
Q5B.2 S’il est probable que vous votiez aux élections européennes de 2014, est-ce que ce sera parce que...? Vous considérez que l’Europe et les élections européennes sont importantes
Q5B.2 If you are likely to vote in the European elections in 2014, will it be because…? You believe Europe and European elections are important
91 8 1
78 21 1
86 13 1
89 9 2
89 10 1
90 9 1
93 7 0
93 6 1
88 11 1
95 5 0
96 3 1
92 7 1
93 7 0
94 6 0
93 7 0
95 5 0
91 6 3
77 18 5
92 8 0
86 13 1
94 5 1
83 17 0
89 10 1
90 8 2
88 12 0
92 6 2
82 17 1
93 6 1
90 9 1
Yes
Ja
Flash EB375
Nein
Flash EB375
Oui NSP/SR
DK/NA
Weiß nicht / Keine Angabe
Flash EB375
Non
No
T17

FLASH EUROBAROMETER 375 “European Youth: Participation in Democratic Life”
%
EU 27
BE
BG
CZ
DK
DE
EE
IE
EL
ES
FR
IT
CY
LV
LT
LU
HU
MT
NL
AT
PL
PT
RO
SI
SK
FI
SE
UK
HR
Q5B.3 Wenn Sie bei der Europawahl 2014 mit hoher Wahrscheinlichkeit wählen gehen, wird das daran liegen, dass …? Sie Wählen für eine moralische Verpflichtung halten
Q5B.3 S’il est probable que vous votiez aux élections européennes de 2014, est-ce que ce sera parce que...? Vous considérez que voter est une obligation morale
Q5B.3 If you are likely to vote in the European elections in 2014, will it be because…? You believe that voting is a moral obligation
62 36 2
81 18 1
67 32 1
76 22 2
80 20 0
78 21 1
81 19 0
63 35 2
71 28 1
79 19 2
85 14 1
56 44 0
77 22 1
65 34 1
75 25 0
81 19 0
88 11 1
78 22 0
66 34 0
72 27 1
69 29 2
72 28 0
74 25 1
75 22 3
72 27 1
77 21 2
67 32 1
70 28 2
72 27 1
Yes
Ja
Flash EB375
Nein
Flash EB375
Oui NSP/SR
DK/NA
Weiß nicht / Keine Angabe
Flash EB375
Non
No
T18

FLASH EUROBAROMETER 375 “European Youth: Participation in Democratic Life”
%
EU 27
BE
BG
CZ
DK
DE
EE
IE
EL
ES
FR
IT
CY
LV
LT
LU
HU
MT
NL
AT
PL
PT
RO
SI
SK
FI
SE
UK
HR
Q5B.4 Wenn Sie bei der Europawahl 2014 mit hoher Wahrscheinlichkeit wählen gehen, wird das daran liegen, dass …? Sie Wählen für das richtige Mittel halten, um politische Entscheidungen zu beeinflussen
Q5B.4 S’il est probable que vous votiez aux élections européennes de 2014, est-ce que ce sera parce que...? Vous considérez que voter est le bon moyen de peser sur les décisions politiques
Q5B.4 If you are likely to vote in the European elections in 2014, will it be because…? You believe that voting is the right way to influence political decision-making
90 9 1
65 33 2
95 5 0
96 4 0
83 16 1
75 22 3
90 10 0
85 14 1
85 13 2
79 18 3
90 8 2
87 13 0
81 18 1
79 19 2
82 17 1
85 14 1
79 18 3
83 15 2
83 17 0
72 26 2
90 8 2
76 23 1
89 10 1
85 12 3
86 14 0
93 6 1
71 28 1
84 14 2
83 15 2
Yes
Ja
Flash EB375
Nein
Flash EB375
Oui NSP/SR
DK/NA
Weiß nicht / Keine Angabe
Flash EB375
Non
No
T19

FLASH EUROBAROMETER 375 “European Youth: Participation in Democratic Life”
%
EU 27
BE
BG
CZ
DK
DE
EE
IE
EL
ES
FR
IT
CY
LV
LT
LU
HU
MT
NL
AT
PL
PT
RO
SI
SK
FI
SE
UK
HR
Q5B.5 Wenn Sie bei der Europawahl 2014 mit hoher Wahrscheinlichkeit wählen gehen, wird das daran liegen, dass …? Sie glauben, dass die Teilnahme an Europawahlen Einfluss auf Probleme hat, die Sie betreffen
Q5B.5 S’il est probable que vous votiez aux élections européennes de 2014, est-ce que ce sera parce que...? Vous considérez que voter aux élections européennes a un impact sur les problèmes qui vous concernent
Q5B.5 If you are likely to vote in the European elections in 2014, will it be because…? You believe that voting at the European elections has an impact on problems that concern you
75 23 2
58 39 3
71 27 2
77 20 3
63 34 3
67 32 1
81 16 3
70 28 2
67 32 1
67 32 1
73 21 6
63 35 2
68 31 1
73 25 2
68 31 1
74 25 1
73 24 3
75 24 1
68 30 2
59 40 1
77 21 2
77 23 0
61 38 1
58 35 7
78 21 1
73 24 3
63 36 1
82 17 1
68 30 2
Yes
Ja
Flash EB375
Nein
Flash EB375
Oui NSP/SR
DK/NA
Weiß nicht / Keine Angabe
Flash EB375
Non
No
T20

FLASH EUROBAROMETER 375 “European Youth: Participation in Democratic Life”
%
EU 27
BE
BG
CZ
DK
DE
EE
IE
EL
ES
FR
IT
CY
LV
LT
LU
HU
MT
NL
AT
PL
PT
RO
SI
SK
FI
SE
UK
HR
Q5B.6 Wenn Sie bei der Europawahl 2014 mit hoher Wahrscheinlichkeit wählen gehen, wird das daran liegen, dass …? Sie glauben, dass Demokratie wichtig ist
Q5B.6 S’il est probable que vous votiez aux élections européennes de 2014, est-ce que ce sera parce que...? Vous considérez que la démocratie est importante
Q5B.6 If you are likely to vote in the European elections in 2014, will it be because…? You believe that democracy is important
92 7 1
88 11 1
95 4 1
97 2 1
92 7 1
88 8 4
97 2 1
85 13 2
97 3 0
95 4 1
98 1 1
96 4 0
95 5 0
96 4 0
93 6 1
92 7 1
93 6 1
95 4 1
95 5 0
93 6 1
97 2 1
94 6 0
98 1 1
94 3 3
91 8 1
98 1 1
92 8 0
88 9 3
94 5 1
Yes
Ja
Flash EB375
Nein
Flash EB375
Oui NSP/SR
DK/NA
Weiß nicht / Keine Angabe
Flash EB375
Non
No
T21

FLASH EUROBAROMETER 375 “European Youth: Participation in Democratic Life”
%
EU 27
BE
BG
CZ
DK
DE
EE
IE
EL
ES
FR
IT
CY
LV
LT
LU
HU
MT
NL
AT
PL
PT
RO
SI
SK
FI
SE
UK
HR
Q5B.7 Wenn Sie bei der Europawahl 2014 mit hoher Wahrscheinlichkeit wählen gehen, wird das daran liegen, dass …? Sie immer wählen gehen
Q5B.7 S’il est probable que vous votiez aux élections européennes de 2014, est-ce que ce sera parce que...? Vous votez toujours
Q5B.7 If you are likely to vote in the European elections in 2014, will it be because…? You always vote
64 33 3
63 34 3
66 30 4
74 17 9
58 42 0
62 33 5
72 27 1
63 34 3
63 36 1
60 31 9
83 13 4
70 27 3
75 22 3
58 39 3
66 30 4
52 43 5
77 18 5
72 23 5
66 32 2
75 24 1
62 33 5
78 21 1
79 17 4
65 25 10
59 40 1
78 19 3
86 13 1
55 42 3
70 26 4
Yes
Ja
Flash EB375
Nein
Flash EB375
Oui NSP/SR
DK/NA
Weiß nicht / Keine Angabe
Flash EB375
Non
No
T22

FLASH EUROBAROMETER 375 “European Youth: Participation in Democratic Life”
% Flash EB375
Diff.Flash EB
319
Flash EB375
Diff.Flash EB
319
Flash EB375
Diff.Flash EB
319EU 27 35 1 22 4 14 0
BE 46 -2 32 7 22 4
BG 23 6 16 6 14 5
CZ 30 5 18 4 18 -1
DK 48 6 28 12 10 -2
DE 42 -5 27 7 18 2
EE 26 -9 14 -3 6 -10
IE 53 0 37 11 13 -2
EL 30 9 15 4 10 0
ES 38 11 24 10 18 8
FR 44 4 23 5 12 0
IT 25 -11 15 -7 13 -7
CY 19 1 8 -3 7 -1
LV 25 -1 23 8 13 -3
LT 15 -9 14 -3 6 -8
LU 48 2 38 12 25 5
HU 19 -4 11 0 7 -3
MT 25 5 19 3 13 4
NL 59 0 27 8 18 6
AT 36 -1 21 -1 16 -5
PL 19 4 13 4 10 -1
PT 31 8 26 13 20 5
RO 16 3 12 -12 8 -6
SI 26 -3 14 -5 16 -5
SK 32 3 23 10 23 3
FI 30 2 25 6 11 -2
SE 48 12 24 7 12 -2
UK 38 2 28 5 12 0
HR 20 12 9
Q6 Avez-vous participé au cours de l’année passée à l’une des activités des organismes suivants ? (PLUSIEURS REPONSES POSSIBLES)Q6 Avez-vous participé au cours de l’année passée à l’une des activités des organismes suivants ? (PLUSIEURS REPONSES POSSIBLES)
Q6 Have you in the past year participated in any activities of the following organisations? (MULTIPLE ANSWERS POSSIBLE)
Q6 Haben Sie im vergangenen Jahr an irgendwelchen Aktivitäten der folgenden Organisationen teilgenommen? An den Aktivitäten… (MEHRFACHNENNUNGEN MÖGLICH)
eines Sportklubs
Une association ou un club de jeunesse, de loisirs ou tout type
d’association de jeunes
A youth club, leisure-time club or any kind of youth
organisation
eines Jugend- oder Freizeitklubs oder irgendeiner anderen
Jugendorganisation
Une association culturelle
A cultural organisation
einer kulturellen Organisation
Un club sportif
A sports club
T23

FLASH EUROBAROMETER 375 “European Youth: Participation in Democratic Life”
% Flash EB375
Diff.Flash EB
319
Flash EB375
Diff.Flash EB
319
Flash EB375
Diff.Flash EB
319EU 27 5 0 15 4 7 4
BE 8 3 17 4 10 5
BG 6 2 9 2 10 7
CZ 2 -1 11 4 7 5
DK 8 1 16 5 7 3
DE 6 1 16 3 8 6
EE 3 -2 7 -3 2 0
IE 7 1 36 12 10 4
EL 7 0 12 0 10 5
ES 5 2 14 8 10 7
FR 4 2 13 5 6 4
IT 6 1 14 4 4 1
CY 7 -1 5 -4 4 1
LV 4 1 16 6 6 5
LT 5 0 7 -5 4 1
LU 10 6 21 9 13 9
HU 1 -2 10 0 6 4
MT 14 11 12 3 6 3
NL 4 0 13 3 6 2
AT 8 -2 16 1 10 7
PL 2 0 12 3 1 0
PT 5 -3 21 6 8 5
RO 8 1 8 -7 5 0
SI 3 -1 9 -8 2 -1
SK 5 1 13 7 9 7
FI 5 1 17 5 7 3
SE 7 0 14 4 9 4
UK 5 -2 25 9 7 2
HR 6 8 3
Un organisme politique ou un parti politique
A political organisation or a political party
einer politischen Organisation oder einer politischen Partei
einer Organisation, die im Bereich des Klimawandels bzw.
von Umweltthemen aktiv ist
einer lokalen Organisation, die auf die Verbesserung Ihres
lokalen Gemeinwesens ausgerichtet ist
An organisation active in the domain of climate
change/environmental issues
A local organisation aimed at improving your local
community
Une association active dans le domaine du changement
climatique et de l’ environnement
Une association locale ayant pour objectif d’améliorer la vie
de la communauté locale
Q6 Avez-vous participé au cours de l’année passée à l’une des activités des organismes suivants ? (PLUSIEURS REPONSES POSSIBLES)
Q6 Have you in the past year participated in any activities of the following organisations? (MULTIPLE ANSWERS POSSIBLE)
Q6 Haben Sie im vergangenen Jahr an irgendwelchen Aktivitäten der folgenden Organisationen teilgenommen? An den Aktivitäten… (MEHRFACHNENNUNGEN MÖGLICH)
T24

FLASH EUROBAROMETER 375 “European Youth: Participation in Democratic Life”
% Flash EB375
Diff.Flash EB
319
Flash EB375
Diff.Flash EB
319
Flash EB375
Diff.Flash EB
319
Flash EB375
Diff.Flash EB
319EU 27 8 3 12 4 44 44 1 1
BE 13 5 14 9 32 32 1 1
BG 8 2 6 1 59 59 0 0
CZ 6 3 12 6 49 49 2 2
DK 12 1 16 7 28 28 2 2
DE 8 5 15 8 34 34 1 1
EE 1 -1 4 -5 57 57 1 1
IE 12 4 18 10 24 24 0 0
EL 5 0 11 4 52 52 0 0
ES 12 6 14 6 42 42 0 0
FR 5 3 9 3 39 39 0 0
IT 6 -1 12 0 53 53 1 1
CY 5 0 6 -1 67 67 0 0
LV 6 3 13 6 53 53 0 0
LT 2 -3 6 -3 63 63 1 1
LU 13 7 21 14 25 25 1 1
HU 3 2 6 1 63 63 0 0
MT 5 2 14 3 44 44 2 2
NL 14 6 15 8 22 22 0 0
AT 11 4 15 8 38 38 1 1
PL 5 2 7 0 60 60 2 2
PT 9 4 12 5 45 45 1 1
RO 5 -1 10 1 60 60 0 0
SI 3 -3 10 2 48 48 0 0
SK 11 8 11 6 43 43 2 2
FI 14 6 11 2 42 42 1 1
SE 13 5 18 7 28 28 1 1
UK 9 1 15 5 41 41 0 0
HR 4 5 59 1
An organisation promoting human rights or global development
Any other non-governmental organisation
None of these (DO NOT READ OUT) DK/NA
einer Organisation zur Förderung von
Menschenrechten oder der globalen Entwicklung
irgendeiner anderen Nicht-
Regierungsorganisation
Nichts davon (NICHT VORLESEN)
Weiß nicht / Keine Angabe
Une association de promotion des droits de
l’homme ou du développement mondial
Toutes autres organisations non gouvernementales
Aucun d’entre eux (NE PAS LIRE) NSP/SR
Q6 Avez-vous participé au cours de l’année passée à l’une des activités des organismes suivants ? (PLUSIEURS REPONSES POSSIBLES)
Q6 Have you in the past year participated in any activities of the following organisations? (MULTIPLE ANSWERS POSSIBLE)
Q6 Haben Sie im vergangenen Jahr an irgendwelchen Aktivitäten der folgenden Organisationen teilgenommen? An den Aktivitäten… (MEHRFACHNENNUNGEN MÖGLICH)
T25


