Flap testing on the rotating test rig in the INDUFLAP...
35
General rights Copyright and moral rights for the publications made accessible in the public portal are retained by the authors and/or other copyright owners and it is a condition of accessing publications that users recognise and abide by the legal requirements associated with these rights. • Users may download and print one copy of any publication from the public portal for the purpose of private study or research. • You may not further distribute the material or use it for any profit-making activity or commercial gain • You may freely distribute the URL identifying the publication in the public portal If you believe that this document breaches copyright please contact us providing details, and we will remove access to the work immediately and investigate your claim. Downloaded from orbit.dtu.dk on: Sep 15, 2018 Flap testing on the rotating test rig in the INDUFLAP project Barlas, Athanasios; Aagaard Madsen , Helge; Enevoldsen, Karen; Klemmensen, Kasper Publication date: 2014 Document Version Publisher's PDF, also known as Version of record Link back to DTU Orbit Citation (APA): Barlas, A., Aagaard Madsen , H., Enevoldsen, K., & Klemmensen, K. (2014). Flap testing on the rotating test rig in the INDUFLAP project. DTU Wind Energy. (DTU Wind Energy E; No. 0064(EN)).
Transcript of Flap testing on the rotating test rig in the INDUFLAP...

General rights Copyright and moral rights for the publications made accessible in the public portal are retained by the authors and/or other copyright owners and it is a condition of accessing publications that users recognise and abide by the legal requirements associated with these rights.
• Users may download and print one copy of any publication from the public portal for the purpose of private study or research. • You may not further distribute the material or use it for any profit-making activity or commercial gain • You may freely distribute the URL identifying the publication in the public portal
If you believe that this document breaches copyright please contact us providing details, and we will remove access to the work immediately and investigate your claim.
Downloaded from orbit.dtu.dk on: Sep 15, 2018
Flap testing on the rotating test rig in the INDUFLAP project
Barlas, Athanasios; Aagaard Madsen , Helge; Enevoldsen, Karen; Klemmensen, Kasper
Publication date:2014
Document VersionPublisher's PDF, also known as Version of record
Link back to DTU Orbit
Citation (APA):Barlas, A., Aagaard Madsen , H., Enevoldsen, K., & Klemmensen, K. (2014). Flap testing on the rotating test rigin the INDUFLAP project. DTU Wind Energy. (DTU Wind Energy E; No. 0064(EN)).

Dep
artm
ent o
f W
ind
Ener
gy
E R
epor
t 201
5
Flap testing on the rotating test rig in the INDUFLAP project
Thanasis K. Barlas, Helge A. Madsen, Karen Enevoldsen, Kasper Klemmensen
DTU Vindenergi-E-0064(EN)
December 2014
Authors: Thanasis K. Barlas, Helge A. Madsen, Title: Flap testing on the the rotating test rig in the INDUFLAP project Department: Institut for Vindenergy
DTU Vindenergi-E-0064(EN) 2014
Summary (max 2000 characters): Tests of a prototype Controllable Rubber Trailing Edge Flap (CRTEF) are performed on the rotating test rig at the Risø campus of DTU. The general description and objectives are presented, along with an overview of sensors on the setup and the test cases. The post-processing of data is discussed and results of steady, flap step and azimuth control flap cases are presented.
Contract no.:
Project no.:
43031
Sponsorship:
EUDP
Front page:
Photo of the rotating rig and flap
Pages: 34
Tables: 4
References: 5
Danmarks Tekniske Universitet DTU Vindenergi Nils Koppels Allé Bygning 403 2800 Kgs. Lyngby Phone www.vindenergi.dtu.dk


Preface
This report serves as a summary of the tests of a prototype Controllable Rubber Trailing Edge Flap (CRTEF) performed on the rotating test rig at the Risø campus of DTU in the INDUFLAP project. Roskilde, December 2014 Thanasis K. Barlas Researcher
Flap testing on the rotating test rig in the INDUFLAP project

Content
Summary ........................................................................................................................................ 6
1. Introduction, background and objectives ............................................................................. 7
2. Sensors overview ................................................................................................................. 9
3. Test cases overview ..........................................................................................................11
4. Post-processing procedure ................................................................................................13
5. Steady cases ......................................................................................................................17
6. Flap step cases ..................................................................................................................20
7. Azimuth flap control cases .................................................................................................24
8. Comparison with Hawc2 results .........................................................................................28
9. Conclusions ........................................................................................................................31
References ...................................................................................................................................32
Acknowledgements ......................................................................................................................33
Flap testing on the rotating test rig in the INDUFLAP project

Summary
Tests of a prototype Controllable Rubber Trailing Edge Flap (CRTEF) are performed on the rotating test rig at the Risø campus of DTU. The general description and objectives are presented, along with an overview of sensors on the setup and the test cases. The post-processing of data is discussed and results of steady, flap step, and azimuth control flap cases are presented.
6 Flap testing on the rotating test rig in the INDUFLAP project

1. Introduction, background and objectives
In this section, the flap testing on the rotating test rig is introduced, together with background information and general objectives in the context of the INDUFLAP project. Introduction Testing the performance and robustness of the smart blade technology is an important part of the INDUFLAP project. Wind tunnel testing of an earlier prototype flap system was performed in 2009 and proved that the actuation concept works in a wind tunnel [1]. However, there is big step from wind tunnel testing on a stationary blade section to full scale turbine application and therefore a so-called rotating test rig has been developed in the INDUFLAP project. Background information The idea behind the test rig is that the testing should be as close as possible to the rotating test environment on the real turbine and have the same unsteady inflow conditions and a size of the flap not that far from full scale [2]. This has been obtained by manufacturing a blade section with a 1m chord and 2m span and mounting it on a 10m long boom on the rotating rig. The basic platform for the rotating test rig is the 100kW Tellus turbine positioned at the old turbine test site at DTU, Campus Risø. The original three bladed rotor has been taken down and a new full variable speed drive has been installed so the rotational speed with the boom mounted is controllable between 0 and 60 rpm (Figure 1). A comprehensive instrumentation of the test rig has been carried out and includes sensors for the blade surface pressure distribution on the mid span position, which enable a continuous monitoring of the instantaneous sectional aerodynamic loading on blade, and thus also allow measuring the exact response of flap actuation. Another part of the instrumentation comprises two five-hole pitot tubes of the leading edge of the blade section for measuring the inflow to the blade. Finally, metrological data such as wind speed and wind direction is measured in three heights in a nearby met mast.
Flap testing on the rotating test rig in the INDUFLAP project 7

Figure 1 – The rotating rig.
Main characteristics of the flap tests: • Proof of concept of the flap system in atmospheric conditions • Measurement of aerodynamic characteristics in free wind as an important supplement to
wind tunnel measurements on aerofoil sections • Scale of flap system and blade section close to real scale • Potential of load reduction with flap actuation in a realistic scale
8 Flap testing on the rotating test rig in the INDUFLAP project

2. Sensors overview
In this section an overview of the sensors and data channels used in the flap testing on the rotating rig is presented. Details about the sensors and calibration are found in [3]. To fulfil the objectives of the flap tests, a few parameters measured on the rotating rig and the met mast are necessary to combine, as in the case of large scale wind turbine measurements in the DAN-ERO project [4]. Data channels involve sensor signals related to • operation of rotating rig • inflow • flap operation • blade section aerodynamics • boom and blade section structural response In total, 196 data channels are recorded. The list of data channels utilized during the described experimental campaign is shown in Table 1, together with the corresponding data channel. The physical units of each channel are mentioned since most of the sensor signals in use have been converted from a raw signal (usually [V]) into a physical quantity already within the acquisition software processing. In some of the sensors further calibration /post processing is used in order to derive physical quantities of interest (e.g. flap deflection angle from flap pressure). Calibration procedure details are found in [3], and post-processing details are described in this report.
Table 1 – Measurement data channels.
sensor units channel raw/ calibrated Pitch angle deg 7 calibrated Positive flap angle bar 14 calibrated Negative flap angle bar 15 calibrated Inflow angle pressure difference Pitot tube (P45) psi 19 calibrated Dynamic pressure Pitot tube (P16) psi 20 calibrated Root flapwise strain mV/V 24 raw Root edgewise strain mV/V 25 raw Blade section flapwise strain mV/V 26 raw Blade section edgewise strain mV/V 28 raw Pressure from chordwise taps psi 37-95 calibrated Rotor speed rpm 169 calibrated Rotor azimuth deg 171 calibrated Yaw position deg 173 calibrated Wind speed from met mast at 29m m/s 181 calibrated Wind direction from met mast at 29m m/s 184 calibrated The data files, each with a length of 10 min., are located and named as:
Flap testing on the rotating test rig in the INDUFLAP project 9

\\veadbs-03\data-disk\Induflap\Data\Data\[yyyy]\[mm]\[dd]\Default_[yyyy][mm][dd]_[hh][mn]\ Default_[yyyy][mm][dd]_[hh][mn].zip ,where yyy:year, mm:month, dd:date, hh:hour, mn:minute The data format is the so-called tim format. The sampling frequency is 100Hz, so the number of samples per data file is 60000. The database comprises data from August 21, 2014 to October 30, 2014, with the main measurement period between October 14-30 2014, and various preliminary testing activities in the earlier period.
10 Flap testing on the rotating test rig in the INDUFLAP project
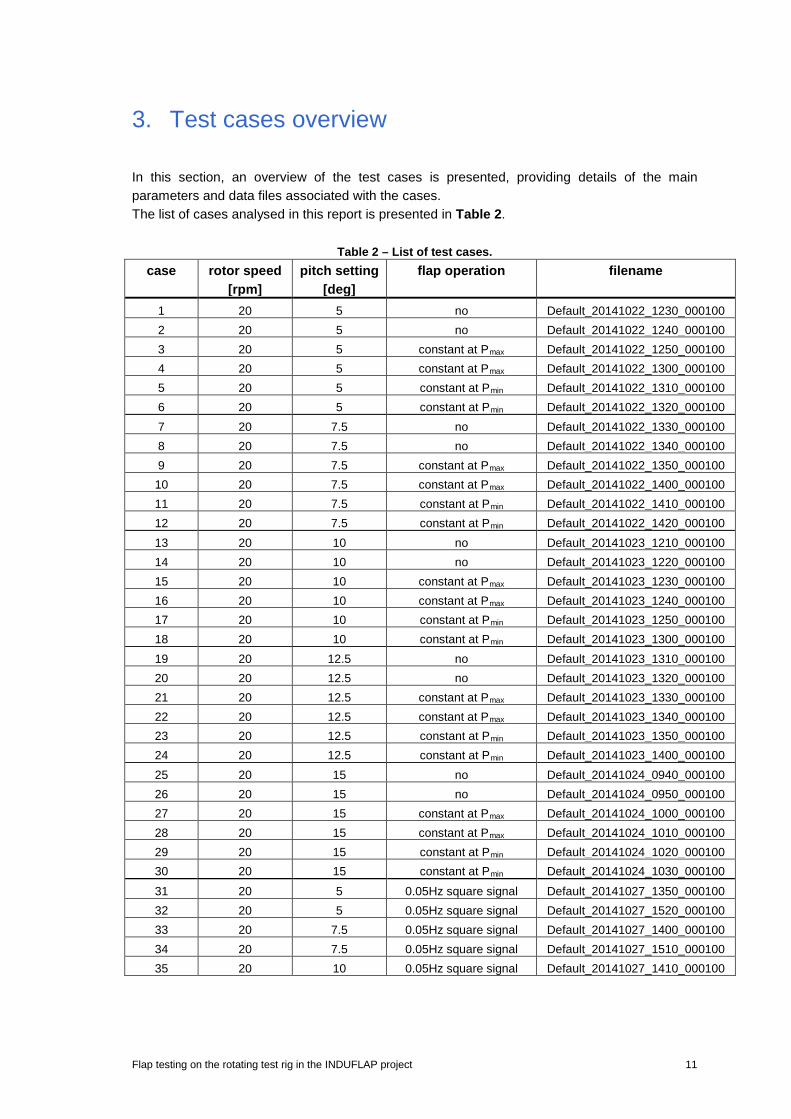
3. Test cases overview
In this section, an overview of the test cases is presented, providing details of the main parameters and data files associated with the cases. The list of cases analysed in this report is presented in Table 2.
Table 2 – List of test cases. case rotor speed
[rpm] pitch setting
[deg] flap operation filename
1 20 5 no Default_20141022_1230_000100 2 20 5 no Default_20141022_1240_000100 3 20 5 constant at Pmax Default_20141022_1250_000100 4 20 5 constant at Pmax Default_20141022_1300_000100 5 20 5 constant at Pmin Default_20141022_1310_000100 6 20 5 constant at Pmin Default_20141022_1320_000100 7 20 7.5 no Default_20141022_1330_000100 8 20 7.5 no Default_20141022_1340_000100 9 20 7.5 constant at Pmax Default_20141022_1350_000100 10 20 7.5 constant at Pmax Default_20141022_1400_000100 11 20 7.5 constant at Pmin Default_20141022_1410_000100 12 20 7.5 constant at Pmin Default_20141022_1420_000100 13 20 10 no Default_20141023_1210_000100 14 20 10 no Default_20141023_1220_000100 15 20 10 constant at Pmax Default_20141023_1230_000100 16 20 10 constant at Pmax Default_20141023_1240_000100 17 20 10 constant at Pmin Default_20141023_1250_000100 18 20 10 constant at Pmin Default_20141023_1300_000100 19 20 12.5 no Default_20141023_1310_000100 20 20 12.5 no Default_20141023_1320_000100 21 20 12.5 constant at Pmax Default_20141023_1330_000100 22 20 12.5 constant at Pmax Default_20141023_1340_000100 23 20 12.5 constant at Pmin Default_20141023_1350_000100 24 20 12.5 constant at Pmin Default_20141023_1400_000100 25 20 15 no Default_20141024_0940_000100 26 20 15 no Default_20141024_0950_000100 27 20 15 constant at Pmax Default_20141024_1000_000100 28 20 15 constant at Pmax Default_20141024_1010_000100 29 20 15 constant at Pmin Default_20141024_1020_000100 30 20 15 constant at Pmin Default_20141024_1030_000100
31 20 5 0.05Hz square signal Default_20141027_1350_000100 32 20 5 0.05Hz square signal Default_20141027_1520_000100 33 20 7.5 0.05Hz square signal Default_20141027_1400_000100 34 20 7.5 0.05Hz square signal Default_20141027_1510_000100 35 20 10 0.05Hz square signal Default_20141027_1410_000100
Flap testing on the rotating test rig in the INDUFLAP project 11
36 20 10 0.05Hz square signal Default_20141027_1500_000100 37 20 12.5 0.05Hz square signal Default_20141027_1420_000100 38 20 12.5 0.05Hz square signal Default_20141027_1450_000100 39 20 15 0.05Hz square signal Default_20141027_1430_000100 40 20 15 0.05Hz square signal Default_20141027_1440_000100
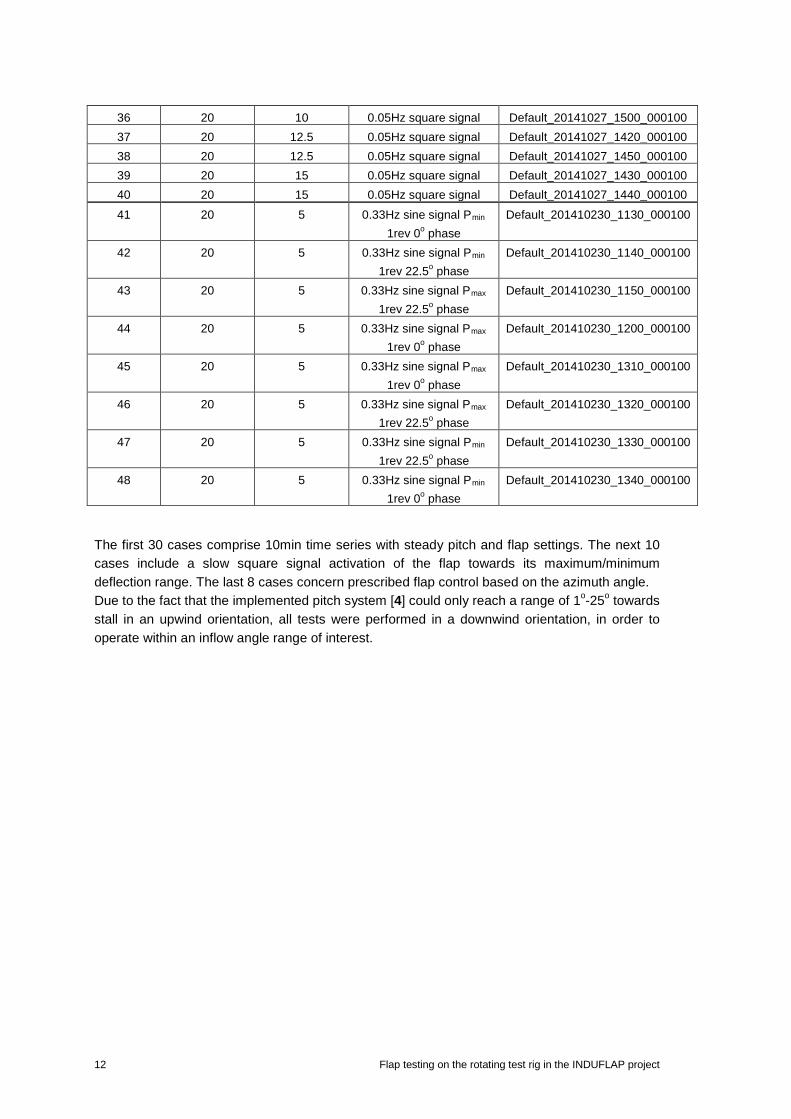
41 20 5 0.33Hz sine signal Pmin 1rev 0o phase
Default_201410230_1130_000100
42 20 5 0.33Hz sine signal Pmin 1rev 22.5o phase
Default_201410230_1140_000100
43 20 5 0.33Hz sine signal Pmax 1rev 22.5o phase
Default_201410230_1150_000100
44 20 5 0.33Hz sine signal Pmax 1rev 0o phase
Default_201410230_1200_000100
45 20 5 0.33Hz sine signal Pmax 1rev 0o phase
Default_201410230_1310_000100
46 20 5 0.33Hz sine signal Pmax 1rev 22.5o phase
Default_201410230_1320_000100
47 20 5 0.33Hz sine signal Pmin 1rev 22.5o phase
Default_201410230_1330_000100
48 20 5 0.33Hz sine signal Pmin 1rev 0o phase
Default_201410230_1340_000100
The first 30 cases comprise 10min time series with steady pitch and flap settings. The next 10 cases include a slow square signal activation of the flap towards its maximum/minimum deflection range. The last 8 cases concern prescribed flap control based on the azimuth angle. Due to the fact that the implemented pitch system [4] could only reach a range of 1o-25o towards stall in an upwind orientation, all tests were performed in a downwind orientation, in order to operate within an inflow angle range of interest.
12 Flap testing on the rotating test rig in the INDUFLAP project

4. Post-processing procedure
Post-processing of data from the acquired data files is performed in order to derive physic quantities of interest in the described test cases. Only the data channels mentioned in Table 1 are used. Calibration of raw data has been either performed in the data acquisition software or as part of the post-processing as explained in detail in [3]. Operational and met mast data is directly used from the data files, since it is already calibrated. Flap pressure signals and strain signals are calibrated afterwards. Pressure signals require further post-processing which is explained in this section. Pressure post-processing For the derivation of aerodynamic characteristics of the blade section the pressure data from the chordwise pressure taps (channels 37-95) and the Pitot tubes (channels 19, 20) are utilized. The procedure is shown in the flowchart in Figure 2.
Figure 2 – Flowchart of pressure post-processing procedure.
In one part of the post-processing the local flow angle and dynamic pressure (and local flow velocity) are derived from the Pitot tube pressure differences. In the other part of the post-processing, the chordwise pressure tap data is utilized and corrected in order to derive the integrated aerodynamic forces (and further coefficients). The Pitot tube pressure data calibration/post-processing is explained in detail in [3]. Apart from all calibration coefficients, only the Pitot tube relative angle to the aerofoil chord is used. The pitch coefficient Cα is derived from the pressure differences P16 and P45 from the Pitot tube and the flow (‘pitch’) angle and the dynamic pressure coefficient Cq are derived using the data
Flap testing on the rotating test rig in the INDUFLAP project 13

reduction procedure. The dynamic pressure (and relative flow velocity) is derived from Cq. It must be noted that because the presented test results concern a downwind rotor orientation, both the derived flow angle and Pitot tube angle with respect to the chord have a negative sign (Eq. 1).
𝛼𝛼 = −(𝑎𝑎𝑝𝑝𝑝𝑝𝑝𝑝𝑝𝑝𝑝𝑝 + 𝜃𝜃𝑝𝑝𝑝𝑝𝑝𝑝𝑝𝑝𝑝𝑝) (Eq. 1)
The pressure tap data is directly logged in pressure units [psi] in the data files. Firstly, the pressure data is corrected by subtracting reference pressure data which is logged for every test campaign at standstill conditions and relatively low wind speeds. The same measurements are also utilized for deriving the offset for the raw data calibration of the Pitot tubes pressure data. The pressure data is then interpolated in space in order to account for a number of corrupted pressure tap data channels. The channels [4,5,12,13,41,45,49,58] are corrected by linearly interpolating between the neighbouring channels. Moreover, since the first two pressure tap points at the suction side, close to the trailing edge [58,59] also provided corrupt signals, the pressure at these points has been corrected using the pressure difference between the next points [57 and 3] and scaling that to 50% for the first point, thus following smoothly the slope of the pressure distribution. The aerofoil geometry with the pressure tap locations is shown in Figure 3. A sample of the raw and corrected pressure distribution at 20rpm and 5deg pitch is shown in Figure 4.
Figure 3 – NACA 0015 geometry and pressure taps locations.
14 Flap testing on the rotating test rig in the INDUFLAP project

Figure 4 – Pressure distribution before and after applying corrections for the case of 20rpm and
5deg pitch. In the next step, the pressure tap data is utilized together with the aerofoil coordinates in order to calculate the integrated aerodynamic forces. Using the trapezoidal rule, the normal and tangential forces are calculated according to Eq. 2 and Eq. 3.
𝐹𝐹𝑁𝑁 = ∑ �𝑃𝑃(𝑝𝑝)+𝑃𝑃(𝑝𝑝+1)2
� ∙ 𝑑𝑑𝑑𝑑𝑝𝑝=𝑛𝑛𝑝𝑝−1𝑝𝑝=1 (Eq. 2)
𝐹𝐹𝑇𝑇 = ∑ �𝑃𝑃(𝑝𝑝)+𝑃𝑃(𝑝𝑝+1)
2� ∙ 𝑑𝑑𝑑𝑑𝑝𝑝=𝑛𝑛𝑝𝑝−1
𝑝𝑝=1 (Eq. 3)
The pressure data at the middle of every element is also used in order to calculate the pressure coefficient distribution according to Eq. 4, where Q is the dynamic pressure derived from the Pitot tube data. Pref is taken as the atmospheric pressure and is assumed to be 1atm.
𝐶𝐶𝑝𝑝(𝑖𝑖) = 𝑃𝑃(𝑝𝑝)−𝑃𝑃𝑟𝑟𝑟𝑟𝑟𝑟𝑄𝑄
(Eq. 4)
Using the trapezoidal rule, the normal and tangential force coefficients are then calculated from the pressure coefficient distribution according to Eq. 5 and Eq. 6.
𝐶𝐶𝑁𝑁 = ∑ �𝐶𝐶𝑝𝑝(𝑝𝑝)+𝐶𝐶𝑝𝑝(𝑝𝑝+1)
2� ∙ 𝑑𝑑𝑑𝑑𝑝𝑝=𝑛𝑛𝑝𝑝−1
𝑝𝑝=1 (Eq. 5)
𝐶𝐶𝑇𝑇 = ∑ �𝐶𝐶𝑝𝑝(𝑝𝑝)+𝐶𝐶𝑝𝑝(𝑝𝑝+1)
2� ∙ 𝑑𝑑𝑑𝑑𝑝𝑝=𝑛𝑛𝑝𝑝−1
𝑝𝑝=1 (Eq. 6)
The lift coefficient and the (pressure) drag coefficient can then be calculated using the inflow angle from the Pitot tube data, according to Eq. 7 and Eq. 8.
𝐶𝐶𝐿𝐿 = 𝐶𝐶𝑁𝑁 ∙ cos𝛼𝛼 + 𝐶𝐶𝑇𝑇 ∙ sin𝑎𝑎 (Eq. 7)
𝐶𝐶𝐷𝐷 = 𝐶𝐶𝑁𝑁 ∙ sin𝑎𝑎−𝐶𝐶𝑇𝑇 ∙ cos𝛼𝛼 (Eq. 8)
Flap testing on the rotating test rig in the INDUFLAP project 15

Time averaging of data The pressure processing procedure is performed for every sample in the data files. All calibrated and derived variables are processed for every time step (60000 samples). A plot of time varying operating parameters from a case at 20rpm and 5deg pitch and a square input in the flap is shown in Figure 5.
Figure 5 - Sample operating parameters for a case of 20rpm and 5deg pitch.
For the steady cases with fixed flap and pitch settings for the whole 10-min sample, derived variables for every time step are statistically analysed. For the case of square flap input signals, the derived aerodynamic data is averaged over smaller periods during the flap activation cycle. For the case of prescribed azimuth-based flap control the aerodynamic and structural response data is averaged over an azimuthal period of 90deg around the tower passage point.
16 Flap testing on the rotating test rig in the INDUFLAP project
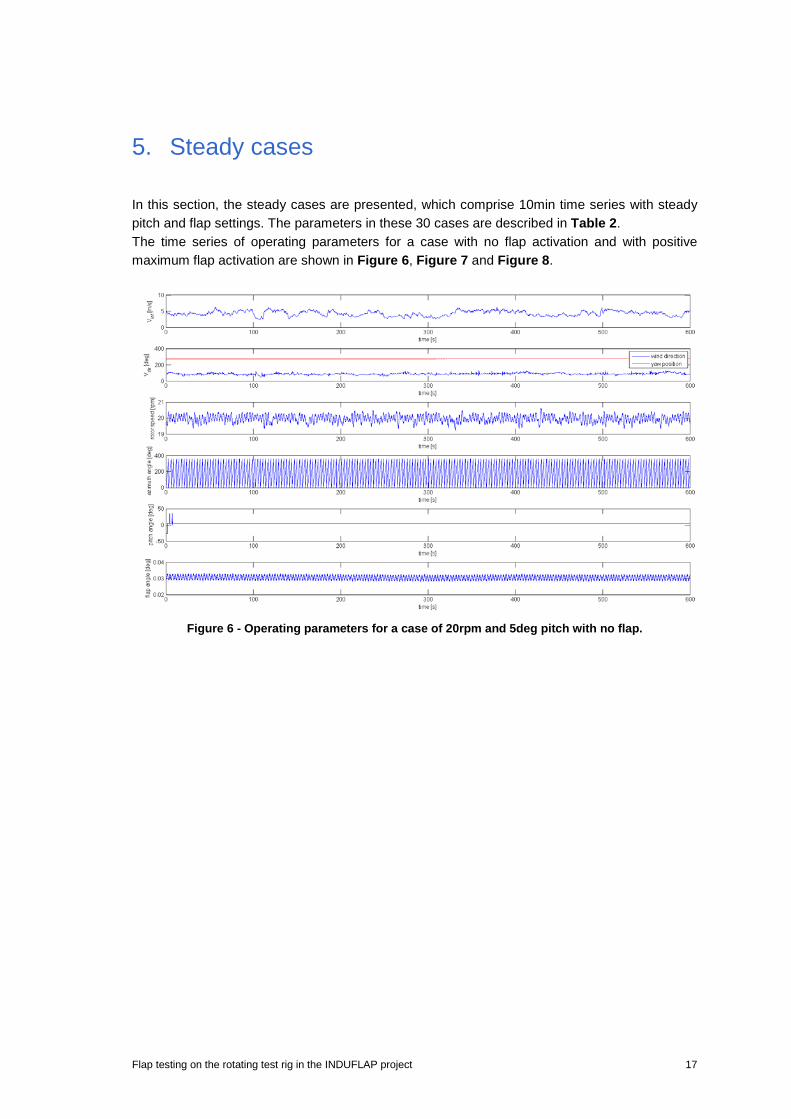
5. Steady cases
In this section, the steady cases are presented, which comprise 10min time series with steady pitch and flap settings. The parameters in these 30 cases are described in Table 2. The time series of operating parameters for a case with no flap activation and with positive maximum flap activation are shown in Figure 6, Figure 7 and Figure 8.
Figure 6 - Operating parameters for a case of 20rpm and 5deg pitch with no flap.
Flap testing on the rotating test rig in the INDUFLAP project 17
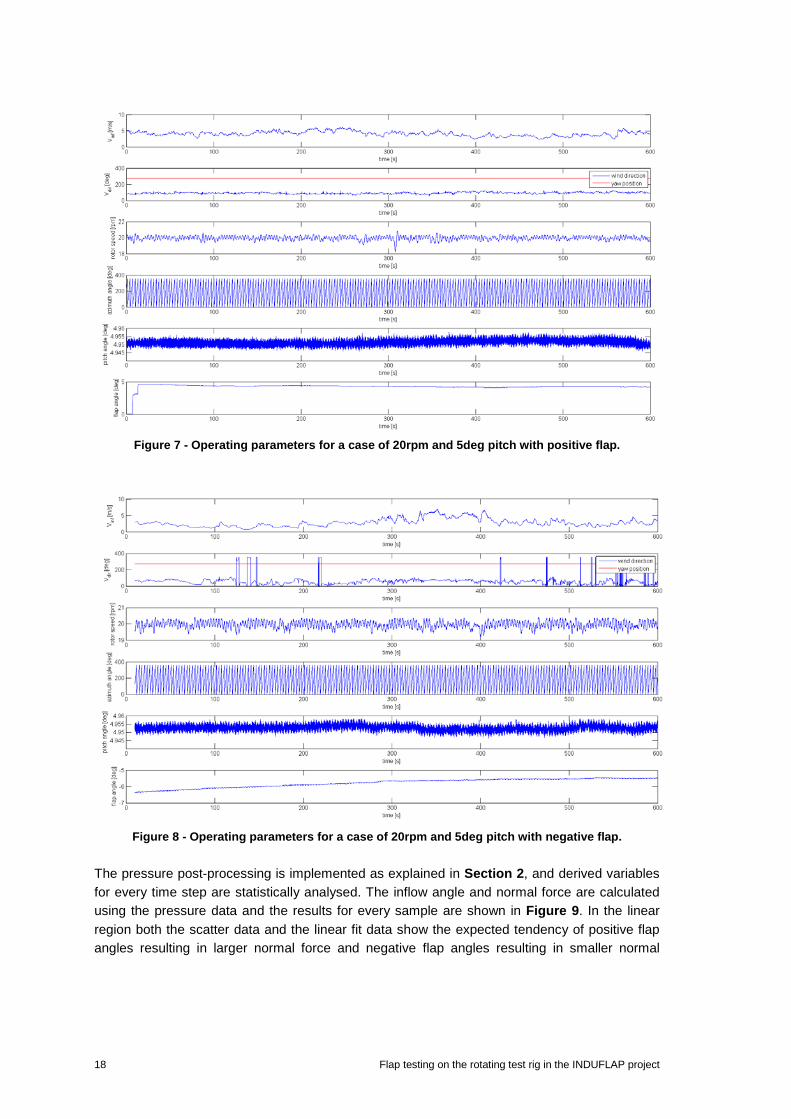
Figure 7 - Operating parameters for a case of 20rpm and 5deg pitch with positive flap.
Figure 8 - Operating parameters for a case of 20rpm and 5deg pitch with negative flap.
The pressure post-processing is implemented as explained in Section 2, and derived variables for every time step are statistically analysed. The inflow angle and normal force are calculated using the pressure data and the results for every sample are shown in Figure 9. In the linear region both the scatter data and the linear fit data show the expected tendency of positive flap angles resulting in larger normal force and negative flap angles resulting in smaller normal
18 Flap testing on the rotating test rig in the INDUFLAP project
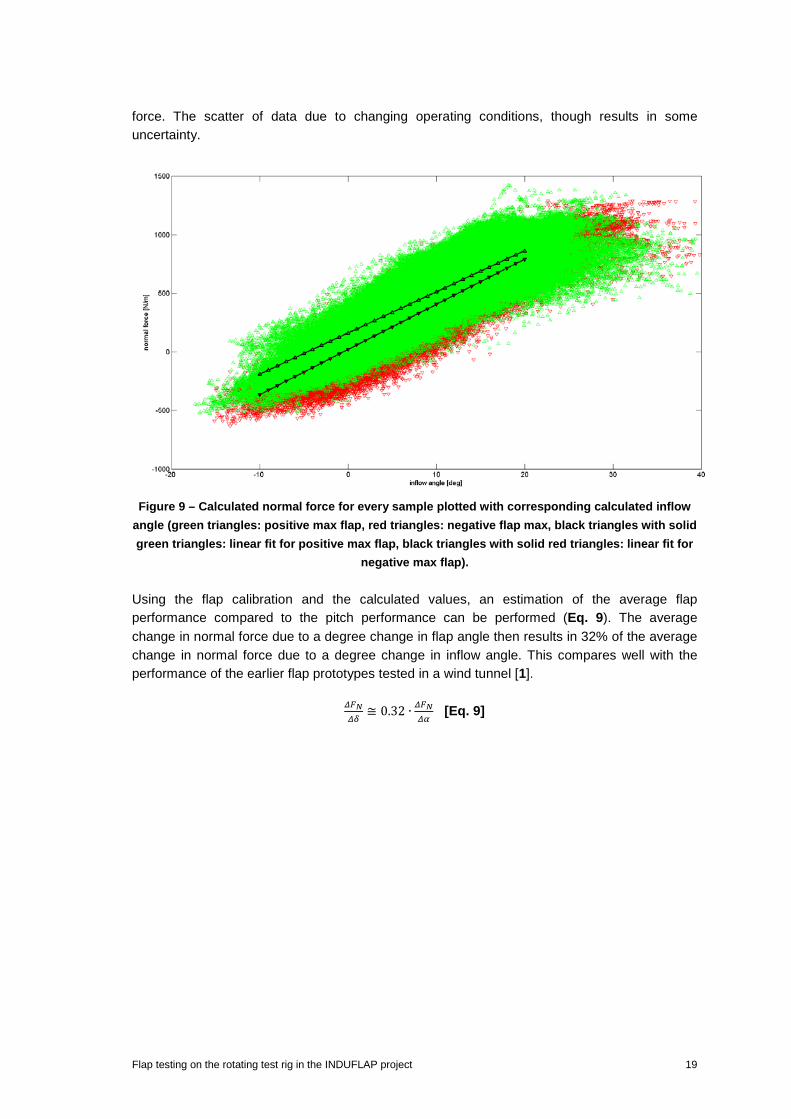
force. The scatter of data due to changing operating conditions, though results in some uncertainty.
Figure 9 – Calculated normal force for every sample plotted with corresponding calculated inflow
angle (green triangles: positive max flap, red triangles: negative flap max, black triangles with solid green triangles: linear fit for positive max flap, black triangles with solid red triangles: linear fit for
negative max flap). Using the flap calibration and the calculated values, an estimation of the average flap performance compared to the pitch performance can be performed (Eq. 9). The average change in normal force due to a degree change in flap angle then results in 32% of the average change in normal force due to a degree change in inflow angle. This compares well with the performance of the earlier flap prototypes tested in a wind tunnel [1].
𝛥𝛥𝐹𝐹𝑁𝑁𝛥𝛥𝛥𝛥
≅ 0.32 ∙ 𝛥𝛥𝐹𝐹𝑁𝑁𝛥𝛥𝛥𝛥
[Eq. 9]
Flap testing on the rotating test rig in the INDUFLAP project 19
6. Flap step cases
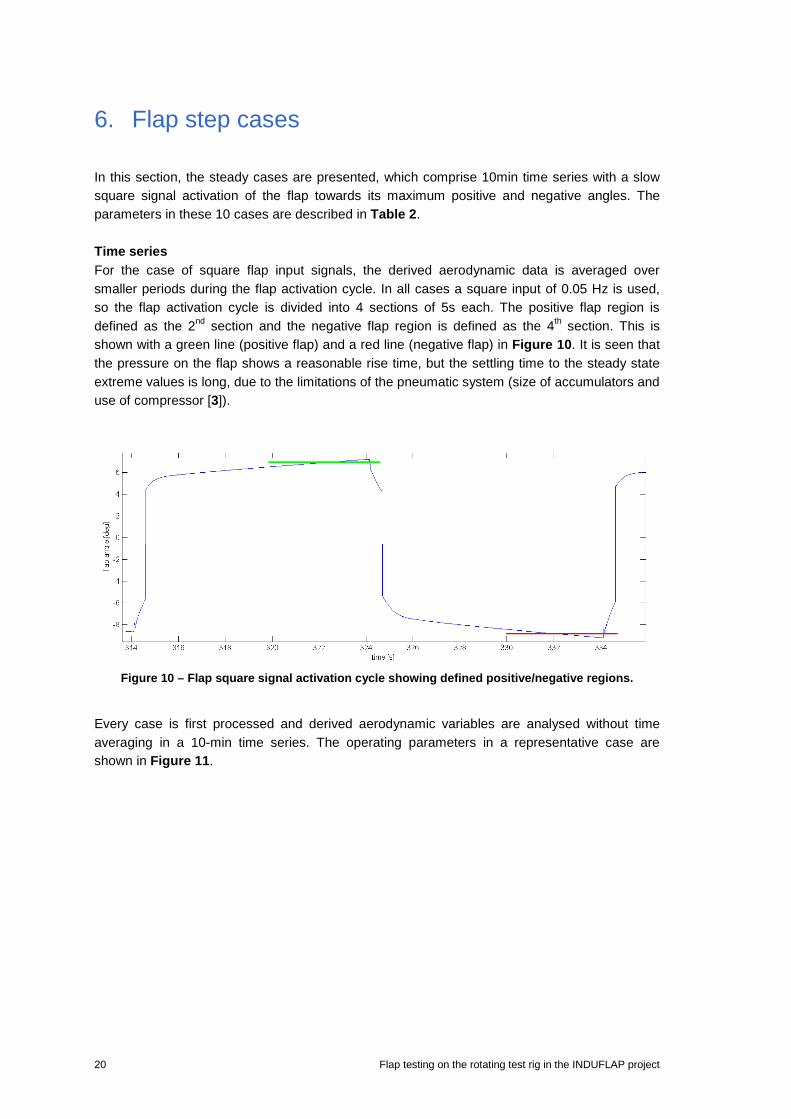
In this section, the steady cases are presented, which comprise 10min time series with a slow square signal activation of the flap towards its maximum positive and negative angles. The parameters in these 10 cases are described in Table 2. Time series For the case of square flap input signals, the derived aerodynamic data is averaged over smaller periods during the flap activation cycle. In all cases a square input of 0.05 Hz is used, so the flap activation cycle is divided into 4 sections of 5s each. The positive flap region is defined as the 2nd section and the negative flap region is defined as the 4th section. This is shown with a green line (positive flap) and a red line (negative flap) in Figure 10. It is seen that the pressure on the flap shows a reasonable rise time, but the settling time to the steady state extreme values is long, due to the limitations of the pneumatic system (size of accumulators and use of compressor [3]).
Figure 10 – Flap square signal activation cycle showing defined positive/negative regions.
Every case is first processed and derived aerodynamic variables are analysed without time averaging in a 10-min time series. The operating parameters in a representative case are shown in Figure 11.
20 Flap testing on the rotating test rig in the INDUFLAP project

Figure 11 - Operating parameters for a case of 20rpm and 5deg pitch with square flap input.
In Figure 12, the calculate inflow angle, resultant velocity, pressure close to the trailing edge and resulting normal force are shown. The flap angle is also plot non-dimensionalized over the last two response variables, indicating a clear correlation between flap activation and pressure/force response.
Figure 12 - Aerodynamic parameters for a case of 20rpm and 5deg pitch with square flap input.
Flap testing on the rotating test rig in the INDUFLAP project 21
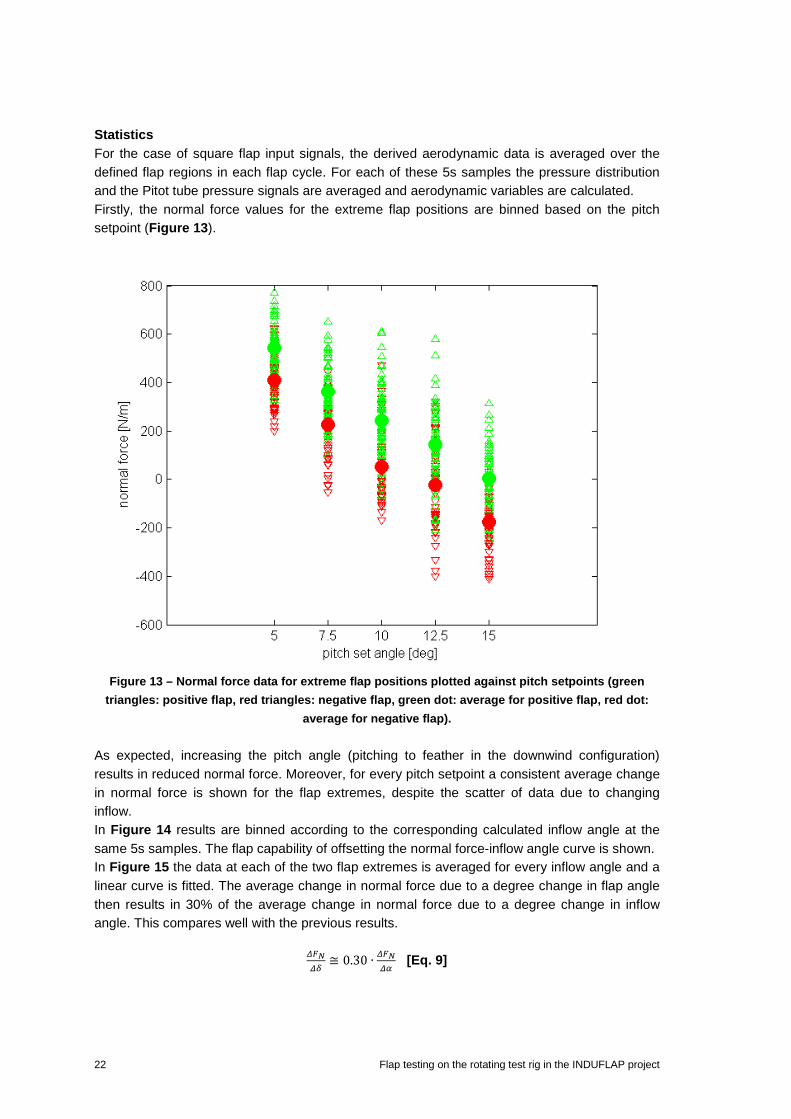
Statistics For the case of square flap input signals, the derived aerodynamic data is averaged over the defined flap regions in each flap cycle. For each of these 5s samples the pressure distribution and the Pitot tube pressure signals are averaged and aerodynamic variables are calculated. Firstly, the normal force values for the extreme flap positions are binned based on the pitch setpoint (Figure 13).
Figure 13 – Normal force data for extreme flap positions plotted against pitch setpoints (green
triangles: positive flap, red triangles: negative flap, green dot: average for positive flap, red dot: average for negative flap).
As expected, increasing the pitch angle (pitching to feather in the downwind configuration) results in reduced normal force. Moreover, for every pitch setpoint a consistent average change in normal force is shown for the flap extremes, despite the scatter of data due to changing inflow. In Figure 14 results are binned according to the corresponding calculated inflow angle at the same 5s samples. The flap capability of offsetting the normal force-inflow angle curve is shown. In Figure 15 the data at each of the two flap extremes is averaged for every inflow angle and a linear curve is fitted. The average change in normal force due to a degree change in flap angle then results in 30% of the average change in normal force due to a degree change in inflow angle. This compares well with the previous results.
𝛥𝛥𝐹𝐹𝑁𝑁𝛥𝛥𝛥𝛥
≅ 0.30 ∙ 𝛥𝛥𝐹𝐹𝑁𝑁𝛥𝛥𝛥𝛥
[Eq. 9]
22 Flap testing on the rotating test rig in the INDUFLAP project
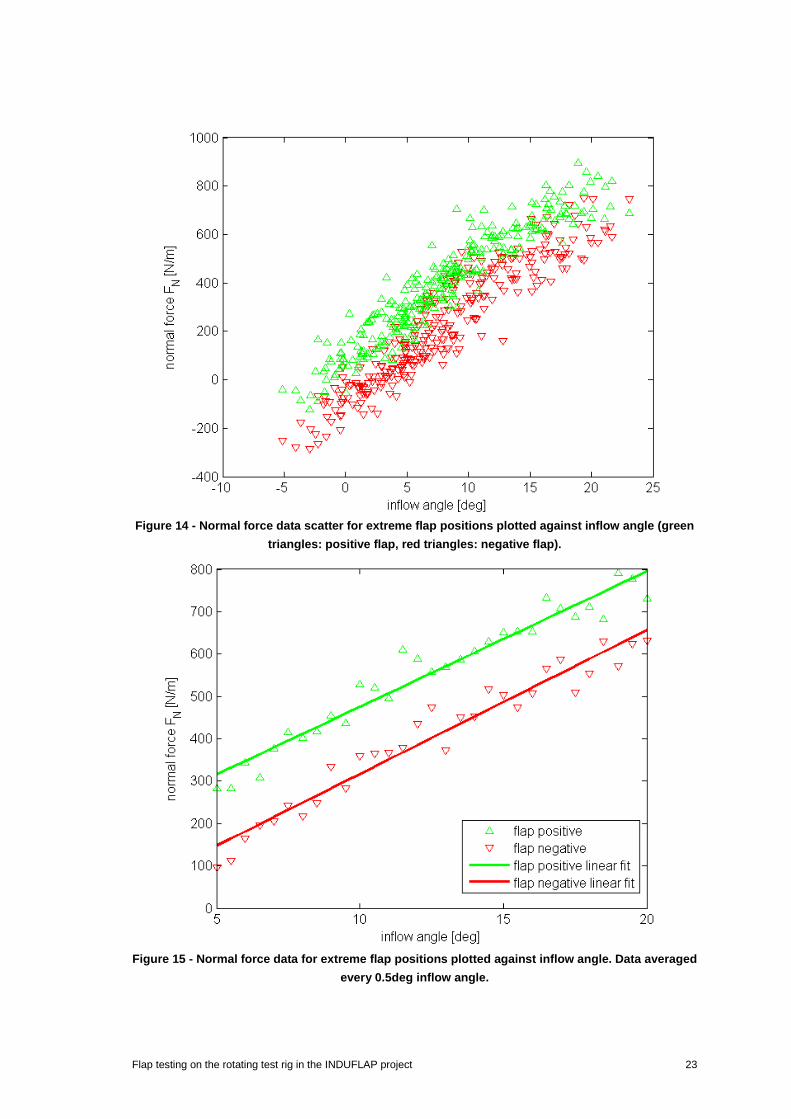
Figure 14 - Normal force data scatter for extreme flap positions plotted against inflow angle (green
triangles: positive flap, red triangles: negative flap).
Figure 15 - Normal force data for extreme flap positions plotted against inflow angle. Data averaged
every 0.5deg inflow angle.
Flap testing on the rotating test rig in the INDUFLAP project 23
7. Azimuth flap control cases
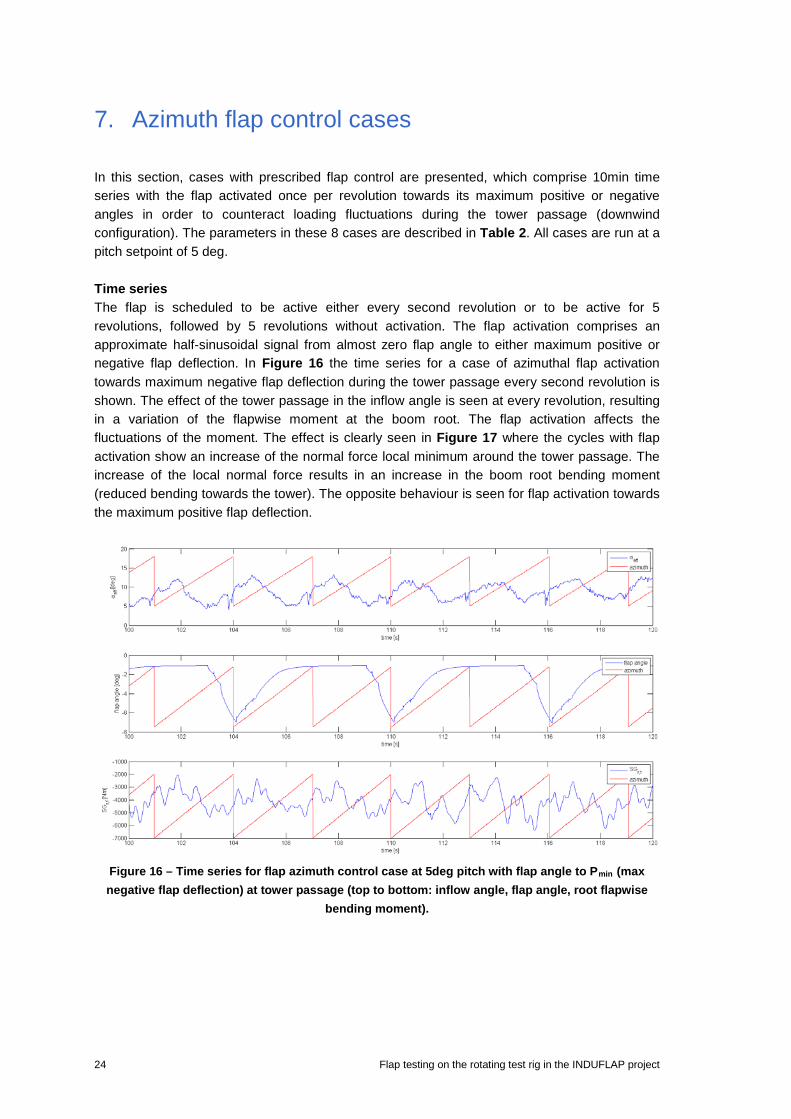
In this section, cases with prescribed flap control are presented, which comprise 10min time series with the flap activated once per revolution towards its maximum positive or negative angles in order to counteract loading fluctuations during the tower passage (downwind configuration). The parameters in these 8 cases are described in Table 2. All cases are run at a pitch setpoint of 5 deg. Time series The flap is scheduled to be active either every second revolution or to be active for 5 revolutions, followed by 5 revolutions without activation. The flap activation comprises an approximate half-sinusoidal signal from almost zero flap angle to either maximum positive or negative flap deflection. In Figure 16 the time series for a case of azimuthal flap activation towards maximum negative flap deflection during the tower passage every second revolution is shown. The effect of the tower passage in the inflow angle is seen at every revolution, resulting in a variation of the flapwise moment at the boom root. The flap activation affects the fluctuations of the moment. The effect is clearly seen in Figure 17 where the cycles with flap activation show an increase of the normal force local minimum around the tower passage. The increase of the local normal force results in an increase in the boom root bending moment (reduced bending towards the tower). The opposite behaviour is seen for flap activation towards the maximum positive flap deflection.
Figure 16 – Time series for flap azimuth control case at 5deg pitch with flap angle to Pmin (max negative flap deflection) at tower passage (top to bottom: inflow angle, flap angle, root flapwise
bending moment).
24 Flap testing on the rotating test rig in the INDUFLAP project

Figure 17 - Time series for flap azimuth control case at 5deg pitch with flap angle to Pmin (max
negative flap deflection) at tower passage (top to bottom: normal force, flap angle). In aforementioned cases (cases 41 and 44 in Table 2) the flap is activated every second revolution with no phase difference with the tower passage (0o/360o). Cases 42 and 44 have also been tested where the flap is activated with a phase lead of 22.5o before the tower passage, but flap performance was seen to be reduced compared to the 0o phase angle. Moreover cases 45-48 comprise the same flap activation at 5 consecutive revolutions instead of every second revolution. No clear trend of affecting loads with flap activation was identified, since the due to changing inflow the consecutive cases are not well correlated for a fair comparison. Statistics The difference in the statistics of normal force, blade section root flapwise moment and boom root flapwise moment between consecutive revolutions with no flap or flap activation is shown in Figure 18, Figure 19 and Figure 20. The average trend of the flap activation effect on the loads is observed consistently in all plots. Cycles with flap activation to maximum negative flap deflection show an increase of the normal force local minimum around the tower passage compared to consecutive cycles with no flap. The increase of the local normal force results in an increase in the blade section root flapwise moment and the boom root flapwise moment (reduced bending towards the tower). The opposite behaviour is seen for flap activation towards the maximum positive flap deflection. The differences in statistics are shown in Table 3. Considerable average reduction of extreme loading in the order of 15% is achieved.
Flap testing on the rotating test rig in the INDUFLAP project 25

Figure 18 – Comparison of minimum normal force around tower passage between consecutive
samples of no flap and flap activation (left: flap to max negative flap angle, right: flap to max positive flap deflection).
Figure 19 - Comparison of minimum flapwise bending moment at blade section root around tower passage between consecutive samples of no flap and flap activation (left: flap to max negative flap
angle, right: flap to max positive flap deflection).
Figure 20 - Comparison of minimum flapwise bending moment at boom root around tower passage
between consecutive samples of no flap and flap activation (left: flap to max negative flap angle, right: flap to max positive flap deflection).
26 Flap testing on the rotating test rig in the INDUFLAP project

Table 3 – Statistics of flap azimuth control cases (FN: normal force, SGbf: blade section root flapwise moment, SGrf: boom root flapwise moment).
case % difference in min FN
% difference in min SGbf
% difference in min SGrf
max positive flap angle -14.0 -1.5 -14.0 max negative flap angle +6.5 +1.5 +12.5
Flap testing on the rotating test rig in the INDUFLAP project 27
8. Comparison with Hawc2 results
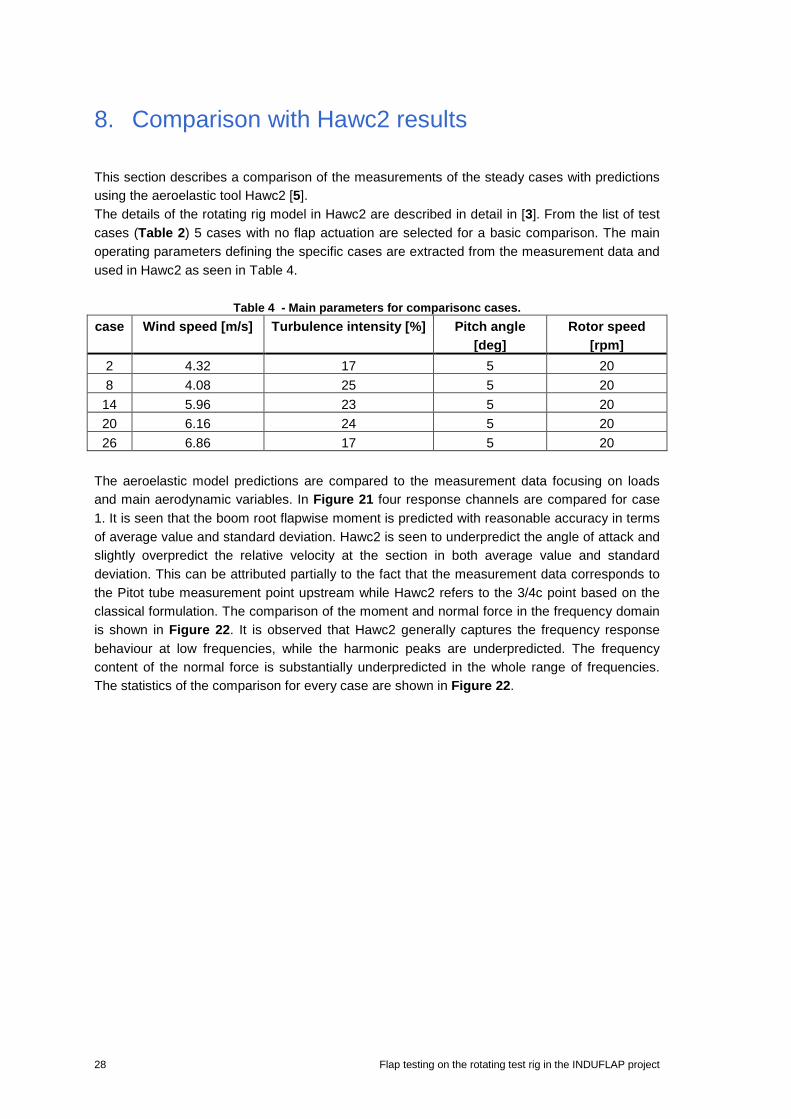
This section describes a comparison of the measurements of the steady cases with predictions using the aeroelastic tool Hawc2 [5]. The details of the rotating rig model in Hawc2 are described in detail in [3]. From the list of test cases (Table 2) 5 cases with no flap actuation are selected for a basic comparison. The main operating parameters defining the specific cases are extracted from the measurement data and used in Hawc2 as seen in Table 4.
Table 4 - Main parameters for comparisonc cases. case Wind speed [m/s] Turbulence intensity [%] Pitch angle
[deg] Rotor speed
[rpm] 2 4.32 17 5 20 8 4.08 25 5 20 14 5.96 23 5 20 20 6.16 24 5 20 26 6.86 17 5 20
The aeroelastic model predictions are compared to the measurement data focusing on loads and main aerodynamic variables. In Figure 21 four response channels are compared for case 1. It is seen that the boom root flapwise moment is predicted with reasonable accuracy in terms of average value and standard deviation. Hawc2 is seen to underpredict the angle of attack and slightly overpredict the relative velocity at the section in both average value and standard deviation. This can be attributed partially to the fact that the measurement data corresponds to the Pitot tube measurement point upstream while Hawc2 refers to the 3/4c point based on the classical formulation. The comparison of the moment and normal force in the frequency domain is shown in Figure 22. It is observed that Hawc2 generally captures the frequency response behaviour at low frequencies, while the harmonic peaks are underpredicted. The frequency content of the normal force is substantially underpredicted in the whole range of frequencies. The statistics of the comparison for every case are shown in Figure 22.
28 Flap testing on the rotating test rig in the INDUFLAP project

Figure 21 – Time series comparison between Hawc2 predictions and measurements for 5 deg pitch
(top to bottom: boom root flapwise moment, angle of attack, relative velocity, normal force).
Figure 22 - Power spectral density comparison between Hawc2 predictions and measurements for
a range of pitch set angles (top to bottom: boom root flapwise moment, normal force).
Flap testing on the rotating test rig in the INDUFLAP project 29
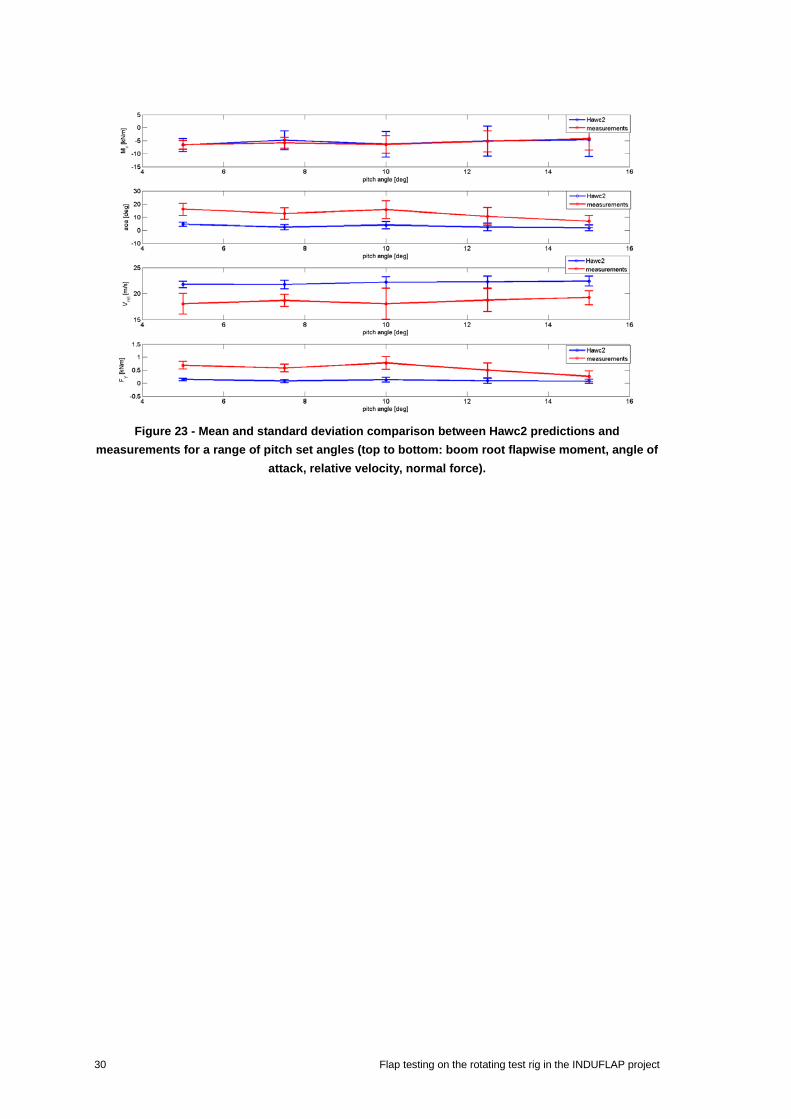
Figure 23 - Mean and standard deviation comparison between Hawc2 predictions and
measurements for a range of pitch set angles (top to bottom: boom root flapwise moment, angle of attack, relative velocity, normal force).
30 Flap testing on the rotating test rig in the INDUFLAP project

9. Conclusions
The tests of a prototype Controllable Rubber Trailing Edge Flap (CRTEF) are described as performed on the rotating test rig at the Risø campus of DTU, including an overview of sensors on the setup and the test cases. The post-processing of data is discussed and results of steady, flap step, and azimuth control flap cases are presented. Steady and step case results show the average change in normal force due to a degree change in flap angle then results in 30-32% of the average change in normal force due to a degree change in inflow angle. The azimuth flap control, cases show that a prescribed flap motion once per revolution targeting the inflow fluctuations due to the tower passage can provide an average change of 14% in root moment and sectional force. Comparison of steady cases with Hawc2 predictions show a reasonable agreement in global loads and specific discrepancies in local aerodynamic variables. The tests in general have provided an important proof of concept of the CRTEF technology in real atmospheric conditions and have validated the flap prototype in terms of aerodynamic performance and load control potential.
Flap testing on the rotating test rig in the INDUFLAP project 31
References
[1] Madsen, H. A., Andersen, P. B., Andersen, T. L., Bak C. and Buhl, T., The potentials of the controllable rubber trailing edge flap (CRTEF). Proceedings of EWEC 2010, Warsaw, Poland, 2010.
[2] Madsen, H. A. et al., Towards an industrial manufactured morphing trailing edge flap system for wind turbines, Proceedings of EWEC 2014, Barcelona, Spain, 2014.
[3] Barlas, T. K., Madsen, H. A. and Andersen, T. L., Design and simulation of the rotating test rig in the INDUFLAP project, DTU Vindenergi-E-0063(EN), 2014.
[4] Bak, C. et al., DANAERO MW: Instrumentation of the NM80 turbine and meteorology mast at Tjæreborg, DTU Wind Energy Report-I-0083, 2013.
[5] Larsen, T. B., Hansen A. M., (2013): How 2 HAWC2, the user's manual, Risø-R-1597(ver. 4-4) (EN).
32 Flap testing on the rotating test rig in the INDUFLAP project

Acknowledgements
The work of the following colleagues who have contributed to the experiments is acknowledged: Per Hansen, Michael Rasmussen, Lars Christensen, Oluf Høst, Henrik Jensen.
Flap testing on the rotating test rig in the INDUFLAP project 33

DTU Wind Energy is a department of the Technical University of Denmark with a unique integration of research, education, innovation and public/private sector consulting in the field of wind energy. Our activities develop new opportunities and technology for the global and Danish exploitation of wind energy. Research focuses on key technical-scientific fields, which are central for the development, innovation and use of wind energy and provides the basis for advanced education at the education. We have more than 240 staff members of which approximately 60 are PhD students. Research is conducted within nine research programmes organized into three main topics: Wind energy systems, Wind turbine technology and Basics for wind energy.
Danmarks Tekniske Universitet DTU Vindenergi Nils Koppels Allé Bygning 403 2800 Kgs. Lyngby Phone 45 25 25 25 [email protected] www.vindenergi.dtu.dk


![Design and simulation of the rotating test rig in the INDUFLAP … · 2017. 12. 20. · 0 2 4 6 8 10 12 0 50 100 150 200 250 300 350 boom length [m] σ [N/mm. 2] Dynamic stress Alu](https://static.fdocuments.net/doc/165x107/603332ec5de37d7790191428/design-and-simulation-of-the-rotating-test-rig-in-the-induflap-2017-12-20-0.jpg)