Fixed Income Investor Presentation - Goldman Sachs · 2...
20
Fixed Income Investor Presentation January 29, 2015
Transcript of Fixed Income Investor Presentation - Goldman Sachs · 2...

Fixed Income Investor Presentation
January 29, 2015
2
fwroot\projects\NY\Treasury\Investor_Relations\Earnings\2014\4Q14\Fixed Income Presentation\Fixed Income
Presentation (1.29.15) FINAL FINAL.pptx
Cautionary Note
on Forward-Looking Statements
Today’s presentation may include forward-looking statements. These statements represent the Firm’s belief
regarding future events that, by their nature, are uncertain and outside of the Firm’s control. The Firm’s actual
results and financial condition may differ, possibly materially, from what is indicated in those forward-looking
statements.
For a discussion of some of the risks and important factors that could affect the Firm’s future results and financial
condition, please see the description of “Risk Factors” in our annual report on Form 10-K for the year ended
December 31, 2013. You should also read the forward-looking disclaimer in our quarterly earnings release,
particularly as it relates to estimated capital, leverage and liquidity ratios, risk-weighted assets, total assets and
global core excess liquidity, and information on the calculation of non-GAAP financial measures that is posted on
the Investor Relations portion of our website: www.gs.com.
The statements in the presentation are current only as of its date, January 29, 2015.
3
fwroot\projects\NY\Treasury\Investor_Relations\Earnings\2014\4Q14\Fixed Income Presentation\Fixed Income
Presentation (1.29.15) FINAL FINAL.pptx
I. 2014 in Review
4
fwroot\projects\NY\Treasury\Investor_Relations\Earnings\2014\4Q14\Fixed Income Presentation\Fixed Income
Presentation (1.29.15) FINAL FINAL.pptx
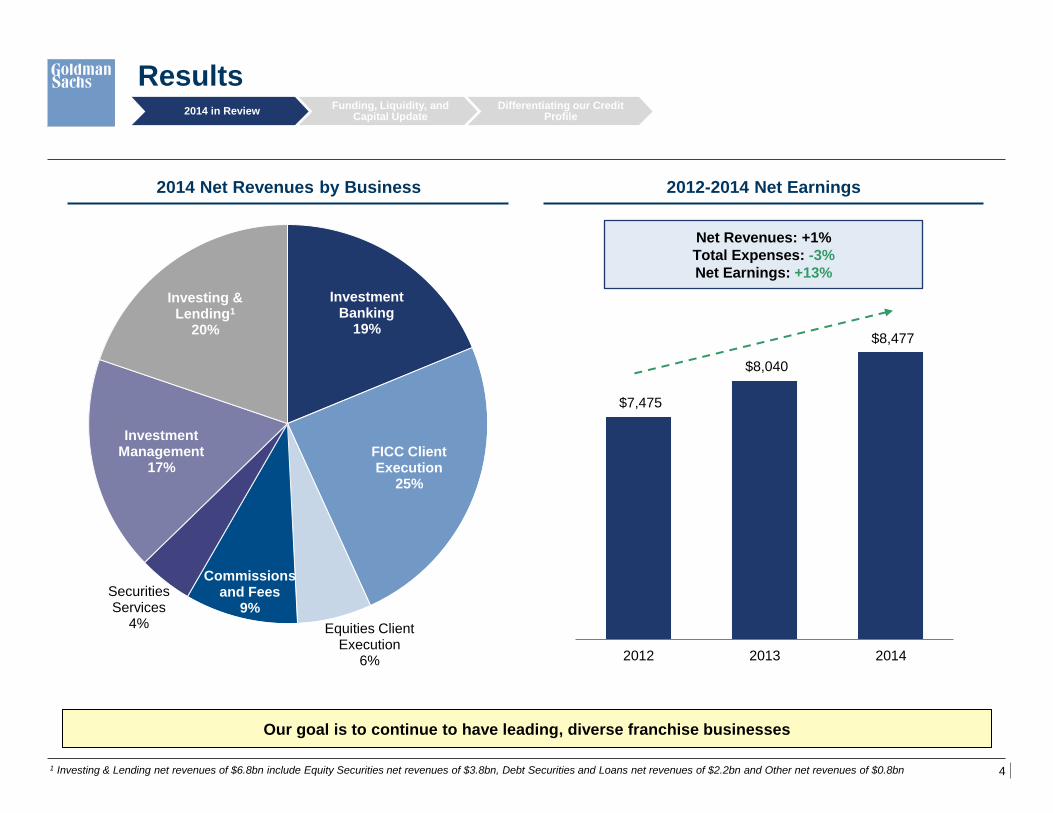
Results
2014 Net Revenues by Business 2012-2014 Net Earnings
Investment Banking
19%
FICC Client Execution
25%
Equities Client Execution
6%
Commissions and Fees
9%
Securities Services
4%
Investment Management
17%
Investing & Lending1
20%
$7,475
$8,040
$8,477
2012 2013 2014
Our goal is to continue to have leading, diverse franchise businesses
2014 in Review Funding, Liquidity, and
Capital Update Differentiating our Credit
Profile
Net Revenues: +1%
Total Expenses: -3%
Net Earnings: +13%
1 Investing & Lending net revenues of $6.8bn include Equity Securities net revenues of $3.8bn, Debt Securities and Loans net revenues of $2.2bn and Other net revenues of $0.8bn
5
fwroot\projects\NY\Treasury\Investor_Relations\Earnings\2014\4Q14\Fixed Income Presentation\Fixed Income
Presentation (1.29.15) FINAL FINAL.pptx
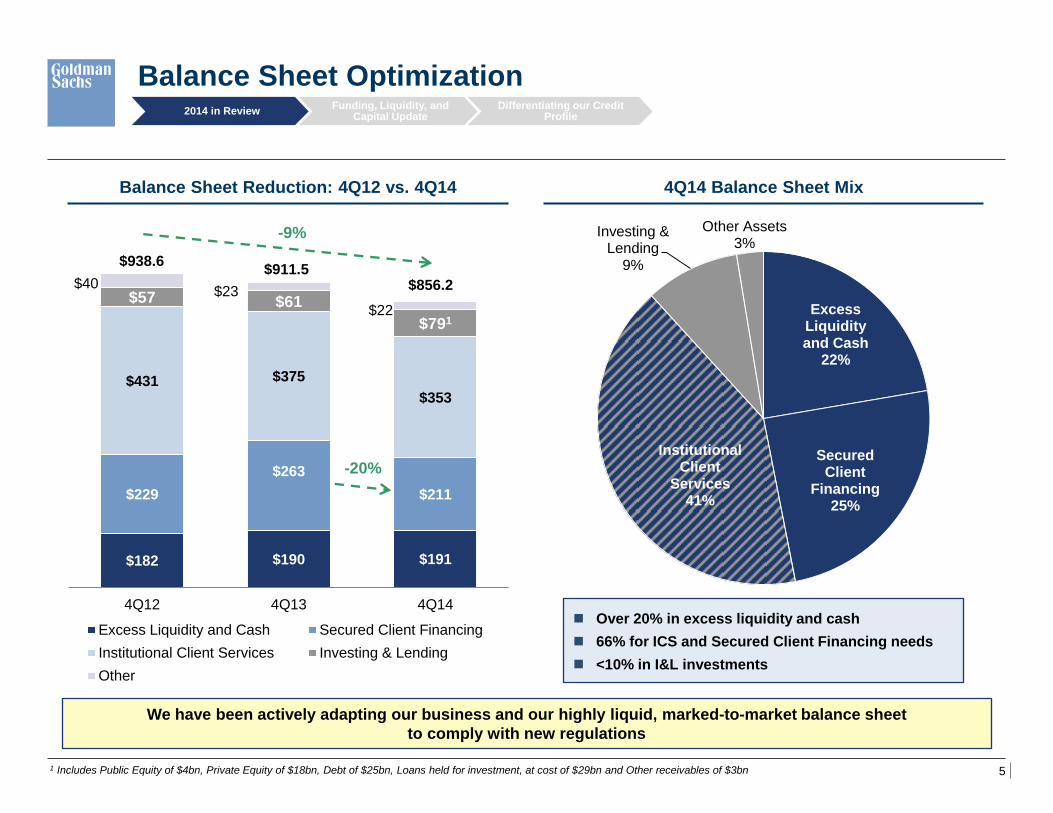
4Q14 Balance Sheet Mix
Excess Liquidity and Cash
22%
Secured Client
Financing 25%
Institutional Client
Services 41%
Investing & Lending
9%
Other Assets 3%
$182 $190 $191
$229
$263
$211
$431 $375
$353
$57 $61
$791
$40 $23
$22
4Q12 4Q13 4Q14
Excess Liquidity and Cash Secured Client Financing
Institutional Client Services Investing & Lending
Other
-9%
-20%
$938.6
$856.2
We have been actively adapting our business and our highly liquid, marked-to-market balance sheet
to comply with new regulations
Balance Sheet Optimization 2014 in Review
Funding, Liquidity, and Capital Update
Differentiating our Credit Profile
$911.5
Balance Sheet Reduction: 4Q12 vs. 4Q14
Over 20% in excess liquidity and cash
66% for ICS and Secured Client Financing needs
<10% in I&L investments
1 Includes Public Equity of $4bn, Private Equity of $18bn, Debt of $25bn, Loans held for investment, at cost of $29bn and Other receivables of $3bn
6
fwroot\projects\NY\Treasury\Investor_Relations\Earnings\2014\4Q14\Fixed Income Presentation\Fixed Income
Presentation (1.29.15) FINAL FINAL.pptx
II. Funding, Liquidity and Capital Update
7
fwroot\projects\NY\Treasury\Investor_Relations\Earnings\2014\4Q14\Fixed Income Presentation\Fixed Income
Presentation (1.29.15) FINAL FINAL.pptx
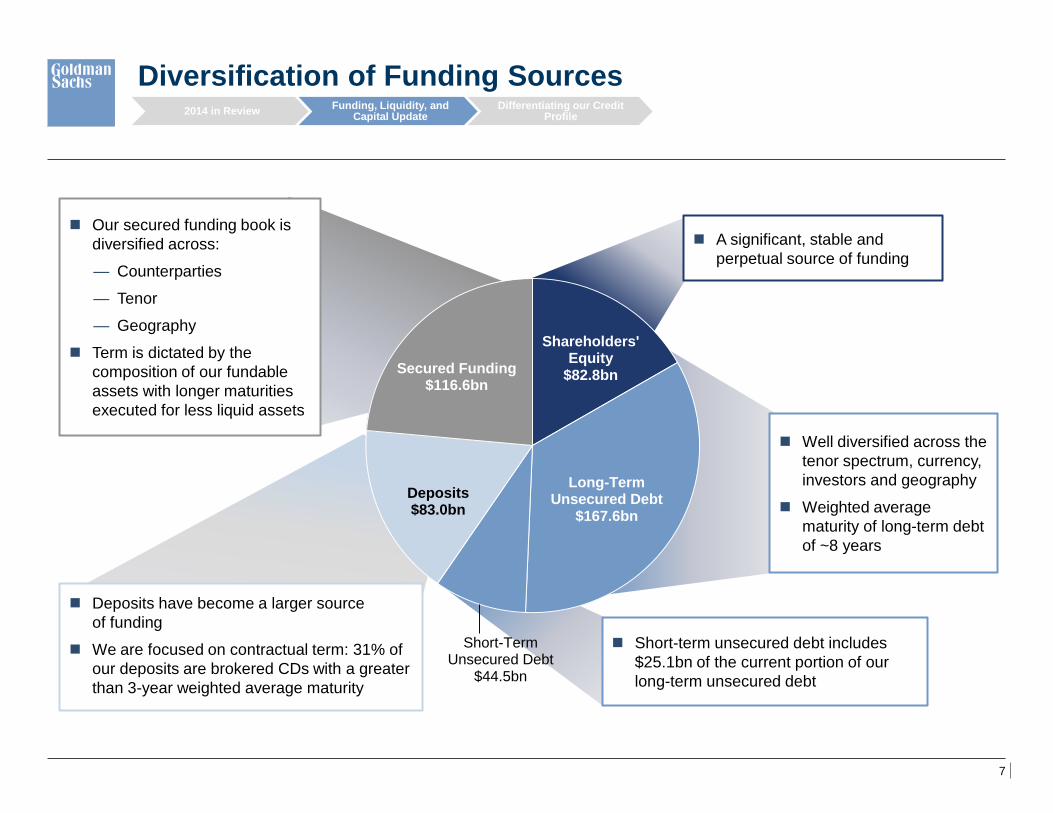
A significant, stable and
perpetual source of funding
Well diversified across the
tenor spectrum, currency,
investors and geography
Weighted average
maturity of long-term debt
of ~8 years
Diversification of Funding Sources 2014 in Review
Funding, Liquidity, and Capital Update
Differentiating our Credit Profile
Deposits have become a larger source
of funding
We are focused on contractual term: 31% of
our deposits are brokered CDs with a greater
than 3-year weighted average maturity
Our secured funding book is
diversified across:
— Counterparties
— Tenor
— Geography
Term is dictated by the
composition of our fundable
assets with longer maturities
executed for less liquid assets
Short-term unsecured debt includes
$25.1bn of the current portion of our
long-term unsecured debt
Shareholders' Equity
$82.8bn
Long-Term Unsecured Debt
$167.6bn
Short-Term Unsecured Debt
$44.5bn
Deposits $83.0bn
Secured Funding $116.6bn
8
fwroot\projects\NY\Treasury\Investor_Relations\Earnings\2014\4Q14\Fixed Income Presentation\Fixed Income
Presentation (1.29.15) FINAL FINAL.pptx
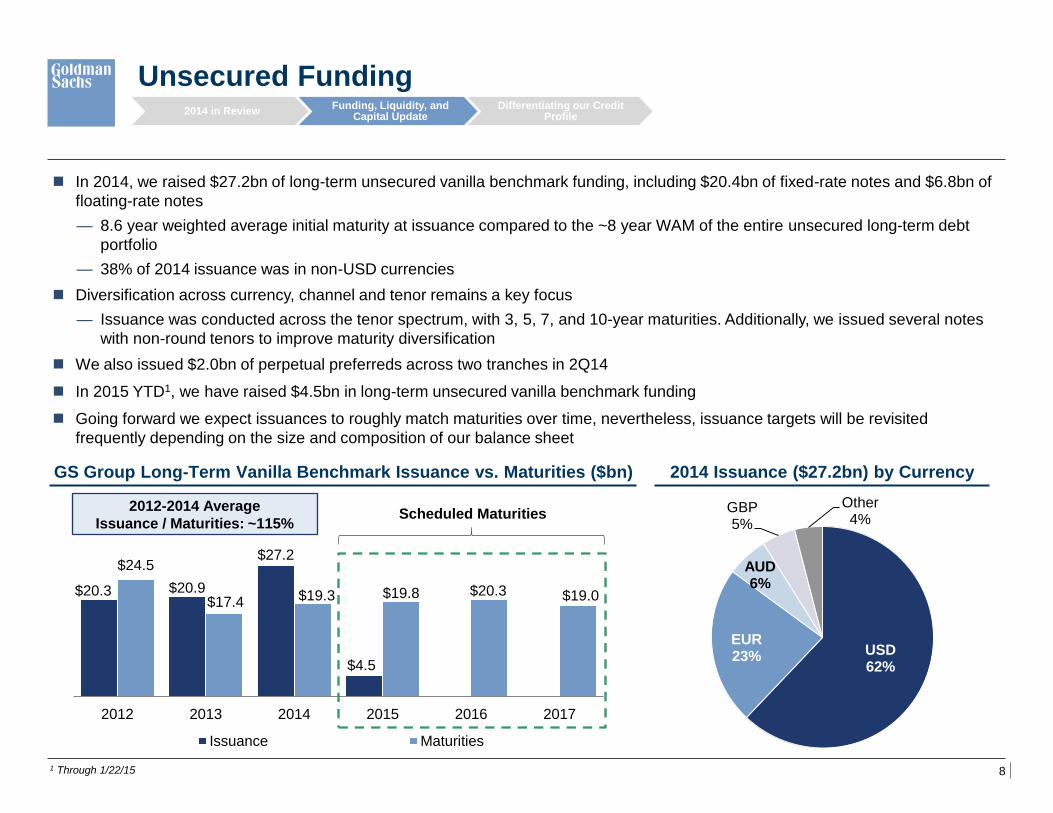
$20.3 $20.9
$27.2
$4.5
$24.5
$17.4 $19.3 $19.8 $20.3 $19.0
2012 2013 2014 2015 2016 2017
Issuance Maturities
Unsecured Funding
GS Group Long-Term Vanilla Benchmark Issuance vs. Maturities ($bn)
In 2014, we raised $27.2bn of long-term unsecured vanilla benchmark funding, including $20.4bn of fixed-rate notes and $6.8bn of
floating-rate notes
— 8.6 year weighted average initial maturity at issuance compared to the ~8 year WAM of the entire unsecured long-term debt
portfolio
— 38% of 2014 issuance was in non-USD currencies
Diversification across currency, channel and tenor remains a key focus
— Issuance was conducted across the tenor spectrum, with 3, 5, 7, and 10-year maturities. Additionally, we issued several notes
with non-round tenors to improve maturity diversification
We also issued $2.0bn of perpetual preferreds across two tranches in 2Q14
In 2015 YTD1, we have raised $4.5bn in long-term unsecured vanilla benchmark funding
Going forward we expect issuances to roughly match maturities over time, nevertheless, issuance targets will be revisited
frequently depending on the size and composition of our balance sheet
2014 Issuance ($27.2bn) by Currency
Scheduled Maturities 2012-2014 Average
Issuance / Maturities: ~115%
USD 62%
EUR 23%
AUD 6%
GBP 5%
Other 4%
2014 in Review Funding, Liquidity, and
Capital Update Differentiating our Credit
Profile
1 Through 1/22/15
9
fwroot\projects\NY\Treasury\Investor_Relations\Earnings\2014\4Q14\Fixed Income Presentation\Fixed Income
Presentation (1.29.15) FINAL FINAL.pptx
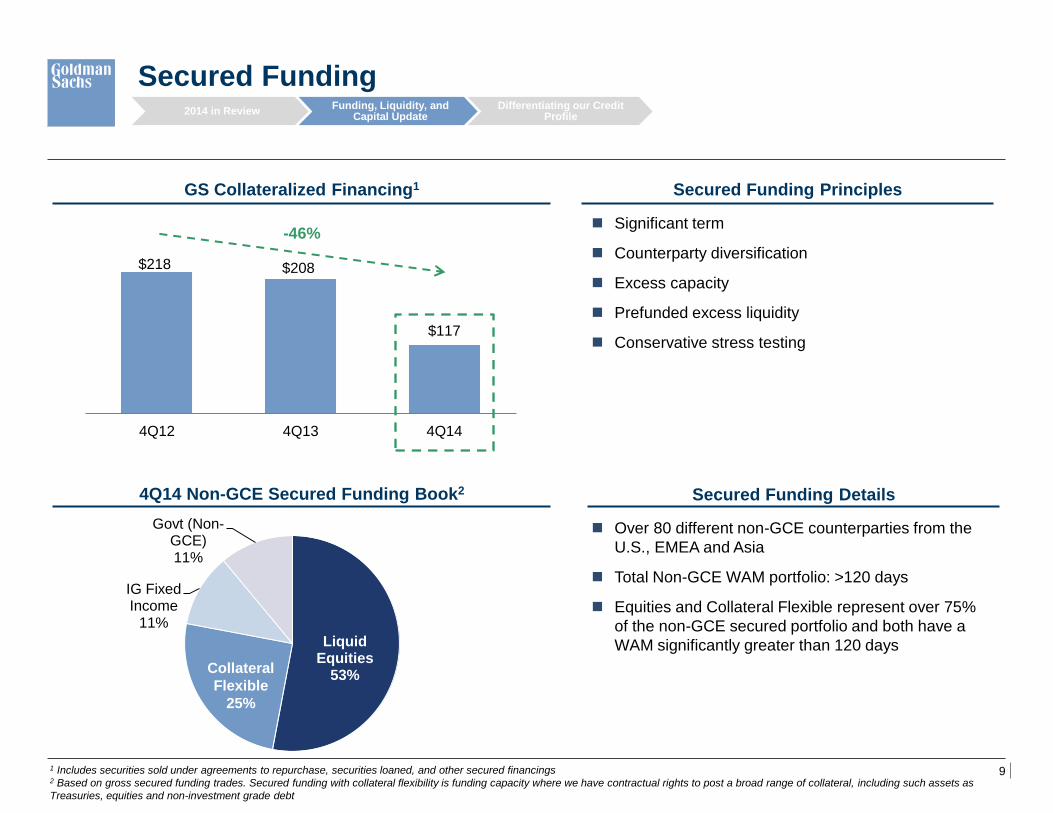
Secured Funding
GS Collateralized Financing1
$218 $208
$117
4Q12 4Q13 4Q14
4Q14 Non-GCE Secured Funding Book2
1 Includes securities sold under agreements to repurchase, securities loaned, and other secured financings
2 Based on gross secured funding trades. Secured funding with collateral flexibility is funding capacity where we have contractual rights to post a broad range of collateral, including such assets as
Treasuries, equities and non-investment grade debt
Significant term
Counterparty diversification
Excess capacity
Prefunded excess liquidity
Conservative stress testing
2014 in Review Funding, Liquidity, and
Capital Update Differentiating our Credit
Profile
Secured Funding Principles
Liquid Equities
53%
IG Fixed Income
11%
Govt (Non-GCE) 11%
Collateral
Flexible
25%
Over 80 different non-GCE counterparties from the
U.S., EMEA and Asia
Total Non-GCE WAM portfolio: >120 days
Equities and Collateral Flexible represent over 75%
of the non-GCE secured portfolio and both have a
WAM significantly greater than 120 days
Secured Funding Details
-46%
10
fwroot\projects\NY\Treasury\Investor_Relations\Earnings\2014\4Q14\Fixed Income Presentation\Fixed Income
Presentation (1.29.15) FINAL FINAL.pptx
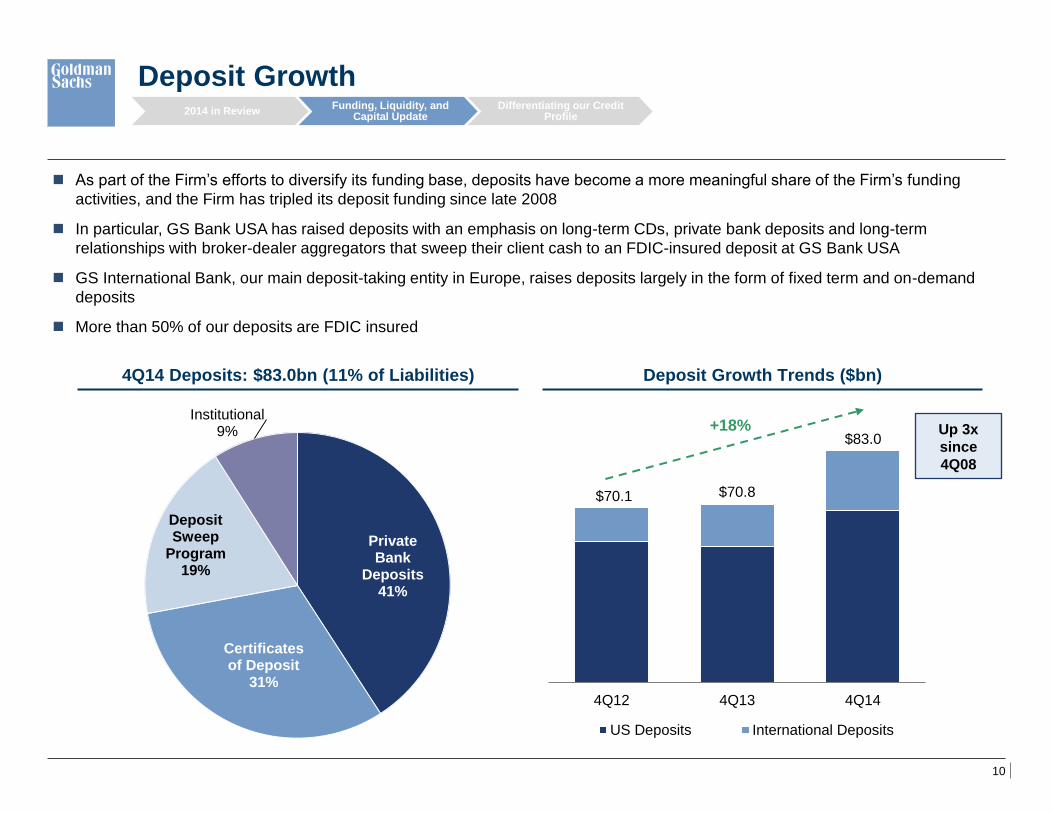
Deposit Growth
$70.1 $70.8
$83.0
4Q12 4Q13 4Q14
US Deposits International Deposits
Up 3x
since
4Q08
Private Bank
Deposits 41%
Certificates of Deposit
31%
Deposit Sweep
Program 19%
Institutional 9%
4Q14 Deposits: $83.0bn (11% of Liabilities) Deposit Growth Trends ($bn)
As part of the Firm’s efforts to diversify its funding base, deposits have become a more meaningful share of the Firm’s funding
activities, and the Firm has tripled its deposit funding since late 2008
In particular, GS Bank USA has raised deposits with an emphasis on long-term CDs, private bank deposits and long-term
relationships with broker-dealer aggregators that sweep their client cash to an FDIC-insured deposit at GS Bank USA
GS International Bank, our main deposit-taking entity in Europe, raises deposits largely in the form of fixed term and on-demand
deposits
More than 50% of our deposits are FDIC insured
2014 in Review Funding, Liquidity, and
Capital Update Differentiating our Credit
Profile
+18%
11
fwroot\projects\NY\Treasury\Investor_Relations\Earnings\2014\4Q14\Fixed Income Presentation\Fixed Income
Presentation (1.29.15) FINAL FINAL.pptx
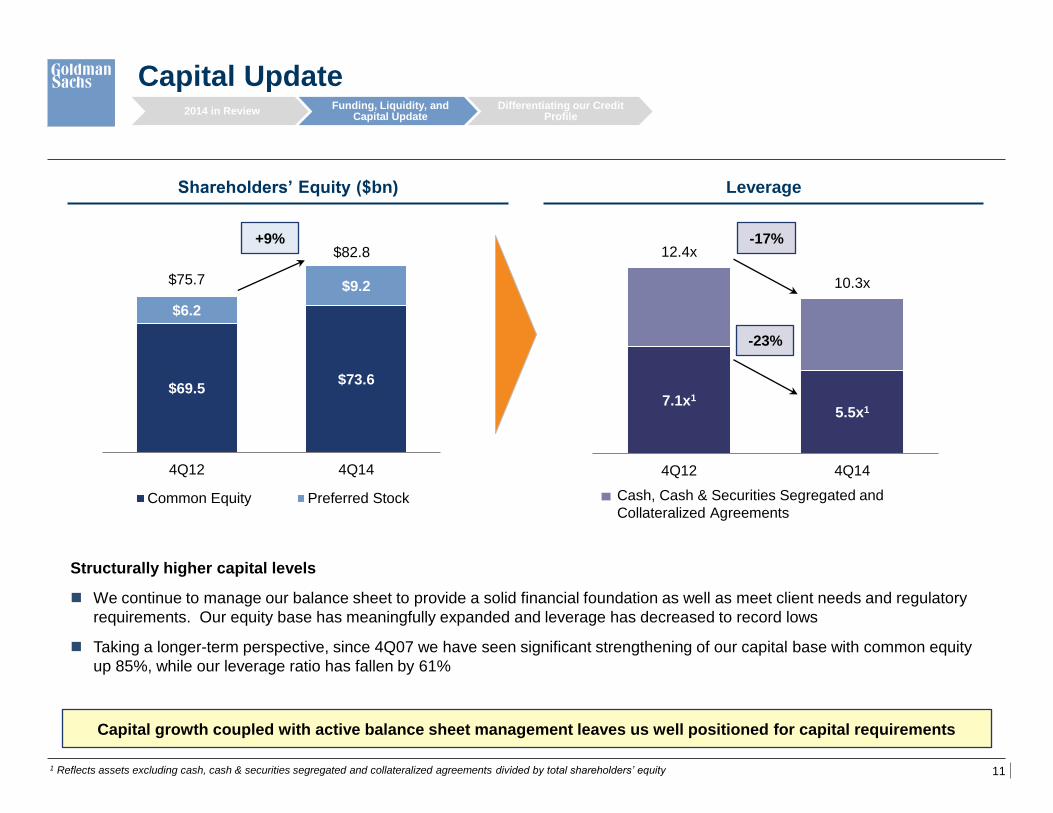
$69.5 $73.6
$6.2
$9.2
4Q12 4Q14
Common Equity Preferred Stock
$75.7
$82.8
Capital Update
+9%
Capital growth coupled with active balance sheet management leaves us well positioned for capital requirements
Structurally higher capital levels
We continue to manage our balance sheet to provide a solid financial foundation as well as meet client needs and regulatory
requirements. Our equity base has meaningfully expanded and leverage has decreased to record lows
Taking a longer-term perspective, since 4Q07 we have seen significant strengthening of our capital base with common equity
up 85%, while our leverage ratio has fallen by 61%
7.1x1
5.5x1
12.4x
10.3x
4Q12 4Q14
-17%
Cash, Cash & Securities Segregated and
Collateralized Agreements
1 Reflects assets excluding cash, cash & securities segregated and collateralized agreements divided by total shareholders’ equity
2014 in Review Funding, Liquidity, and
Capital Update Differentiating our Credit
Profile
Leverage Shareholders’ Equity ($bn)
-23%
12
fwroot\projects\NY\Treasury\Investor_Relations\Earnings\2014\4Q14\Fixed Income Presentation\Fixed Income
Presentation (1.29.15) FINAL FINAL.pptx
Preliminary
G-SIFI Buffer
Regulatory
Minimum
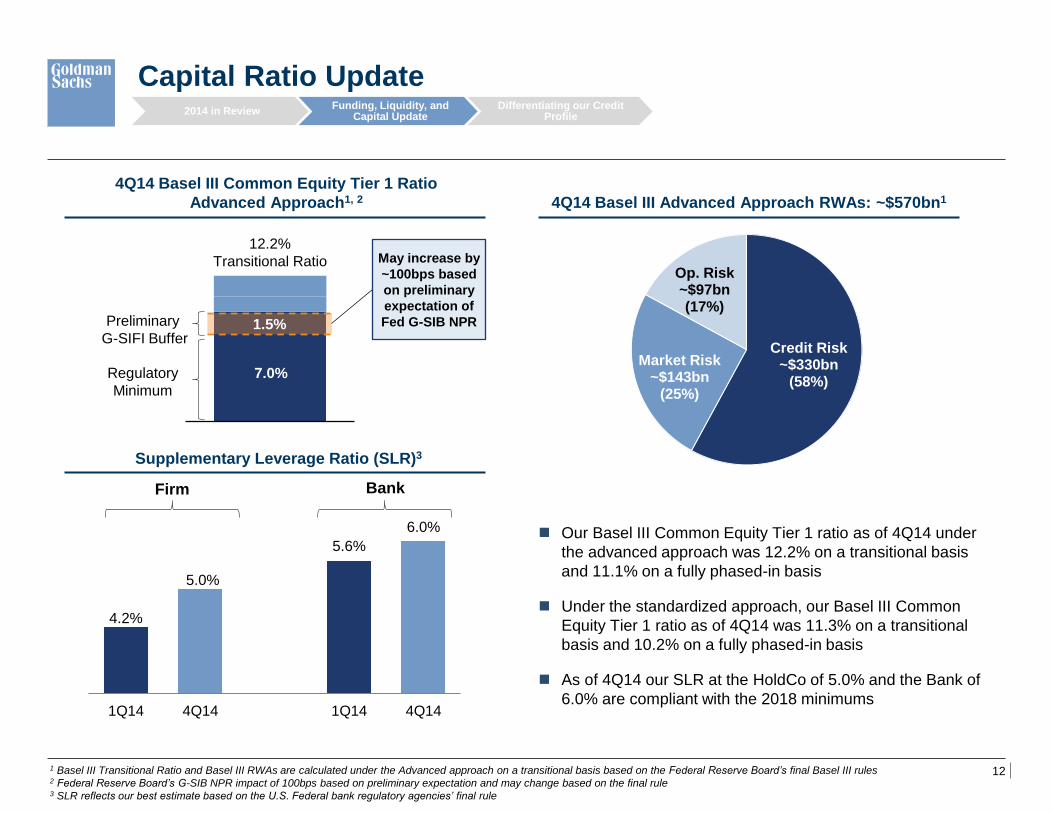
Credit Risk ~$330bn
(58%)
Market Risk ~$143bn
(25%)
Op. Risk ~$97bn (17%)
4.2%
5.0%
5.6%
6.0%
1Q14 4Q14 1Q14 4Q14
Capital Ratio Update
Supplementary Leverage Ratio (SLR)3
1 Basel III Transitional Ratio and Basel III RWAs are calculated under the Advanced approach on a transitional basis based on the Federal Reserve Board’s final Basel III rules 2 Federal Reserve Board’s G-SIB NPR impact of 100bps based on preliminary expectation and may change based on the final rule 3 SLR reflects our best estimate based on the U.S. Federal bank regulatory agencies’ final rule
4Q14 Basel III Common Equity Tier 1 Ratio
Advanced Approach1, 2 4Q14 Basel III Advanced Approach RWAs: ~$570bn1
Our Basel III Common Equity Tier 1 ratio as of 4Q14 under
the advanced approach was 12.2% on a transitional basis
and 11.1% on a fully phased-in basis
Under the standardized approach, our Basel III Common
Equity Tier 1 ratio as of 4Q14 was 11.3% on a transitional
basis and 10.2% on a fully phased-in basis
As of 4Q14 our SLR at the HoldCo of 5.0% and the Bank of
6.0% are compliant with the 2018 minimums
7.0%
12.2%
Transitional Ratio
Bank Firm
1.5%
2014 in Review Funding, Liquidity, and
Capital Update Differentiating our Credit
Profile
May increase by
~100bps based
on preliminary
expectation of
Fed G-SIB NPR
13
fwroot\projects\NY\Treasury\Investor_Relations\Earnings\2014\4Q14\Fixed Income Presentation\Fixed Income
Presentation (1.29.15) FINAL FINAL.pptx
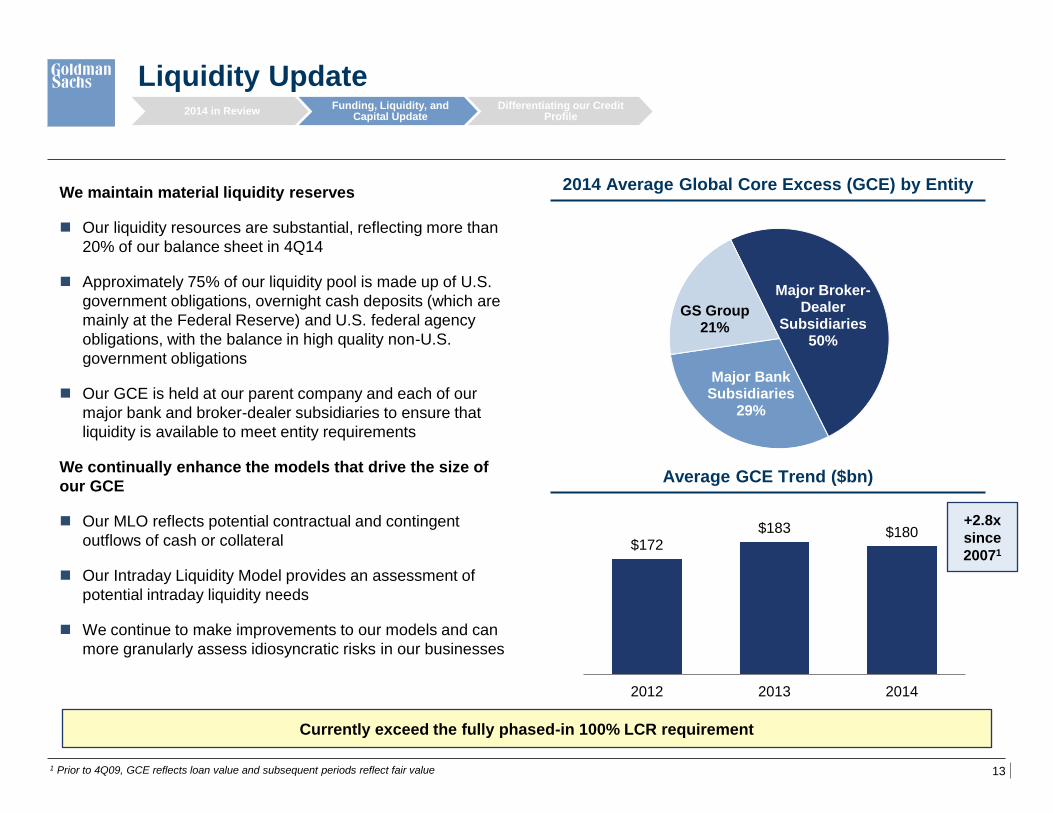
Major Broker-Dealer
Subsidiaries 50%
Major Bank Subsidiaries
29%
GS Group 21%
Liquidity Update
TBU
We maintain material liquidity reserves
Our liquidity resources are substantial, reflecting more than
20% of our balance sheet in 4Q14
Approximately 75% of our liquidity pool is made up of U.S.
government obligations, overnight cash deposits (which are
mainly at the Federal Reserve) and U.S. federal agency
obligations, with the balance in high quality non-U.S.
government obligations
Our GCE is held at our parent company and each of our
major bank and broker-dealer subsidiaries to ensure that
liquidity is available to meet entity requirements
We continually enhance the models that drive the size of
our GCE
Our MLO reflects potential contractual and contingent
outflows of cash or collateral
Our Intraday Liquidity Model provides an assessment of
potential intraday liquidity needs
We continue to make improvements to our models and can
more granularly assess idiosyncratic risks in our businesses
2014 Average Global Core Excess (GCE) by Entity
$172 $183 $180
2012 2013 2014
Currently exceed the fully phased-in 100% LCR requirement
Average GCE Trend ($bn)
1 Prior to 4Q09, GCE reflects loan value and subsequent periods reflect fair value
2014 in Review Funding, Liquidity, and
Capital Update Differentiating our Credit
Profile
+2.8x
since
20071
14
fwroot\projects\NY\Treasury\Investor_Relations\Earnings\2014\4Q14\Fixed Income Presentation\Fixed Income
Presentation (1.29.15) FINAL FINAL.pptx
III. Differentiating our Credit Profile
15
fwroot\projects\NY\Treasury\Investor_Relations\Earnings\2014\4Q14\Fixed Income Presentation\Fixed Income
Presentation (1.29.15) FINAL FINAL.pptx
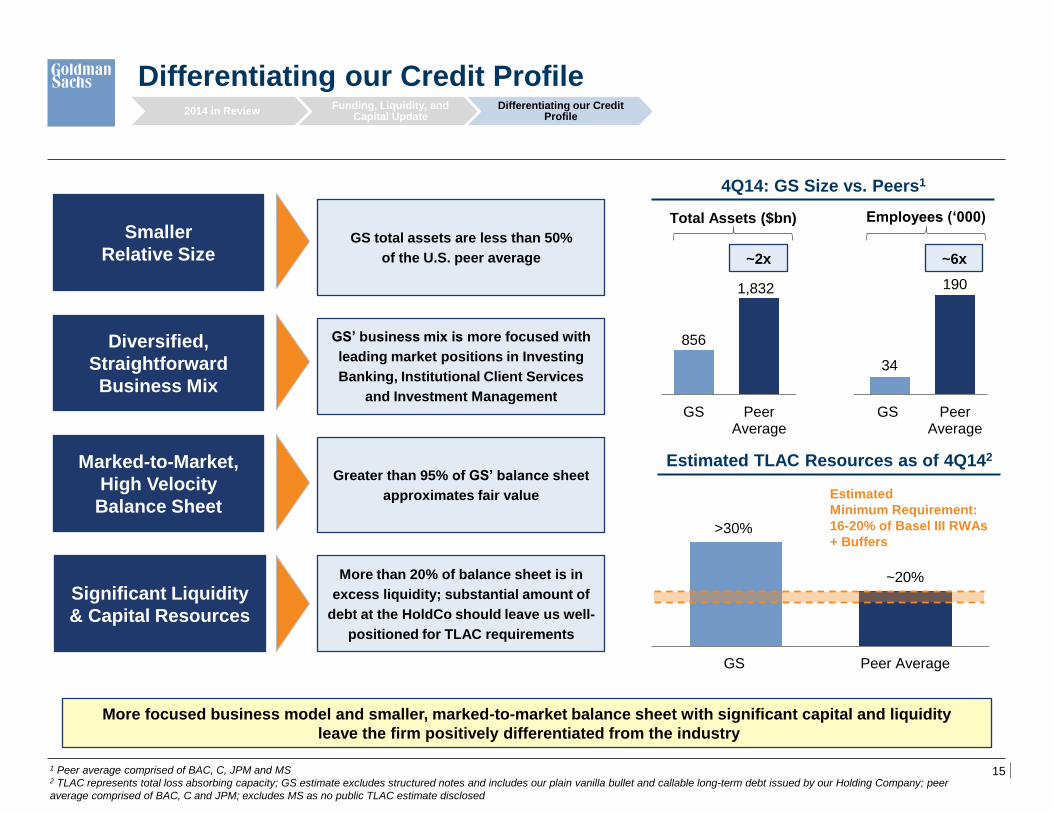
Differentiating our Credit Profile
More focused business model and smaller, marked-to-market balance sheet with significant capital and liquidity
leave the firm positively differentiated from the industry
Smaller
Relative Size
Diversified,
Straightforward
Business Mix
Marked-to-Market,
High Velocity
Balance Sheet
GS total assets are less than 50%
of the U.S. peer average
GS’ business mix is more focused with
leading market positions in Investing
Banking, Institutional Client Services
and Investment Management
Greater than 95% of GS’ balance sheet
approximates fair value
Significant Liquidity
& Capital Resources
More than 20% of balance sheet is in
excess liquidity; substantial amount of
debt at the HoldCo should leave us well-
positioned for TLAC requirements
4Q14: GS Size vs. Peers1
Estimated TLAC Resources as of 4Q142
2014 in Review Funding, Liquidity, and
Capital Update Differentiating our Credit
Profile
856
1,832
34
190
GS PeerAverage
GS PeerAverage
Employees (‘000) Total Assets ($bn)
~2x ~6x
1 Peer average comprised of BAC, C, JPM and MS 2 TLAC represents total loss absorbing capacity; GS estimate excludes structured notes and includes our plain vanilla bullet and callable long-term debt issued by our Holding Company; peer
average comprised of BAC, C and JPM; excludes MS as no public TLAC estimate disclosed
>30%
~20%
GS Peer Average
Estimated
Minimum Requirement:
16-20% of Basel III RWAs
+ Buffers
16
fwroot\projects\NY\Treasury\Investor_Relations\Earnings\2014\4Q14\Fixed Income Presentation\Fixed Income
Presentation (1.29.15) FINAL FINAL.pptx
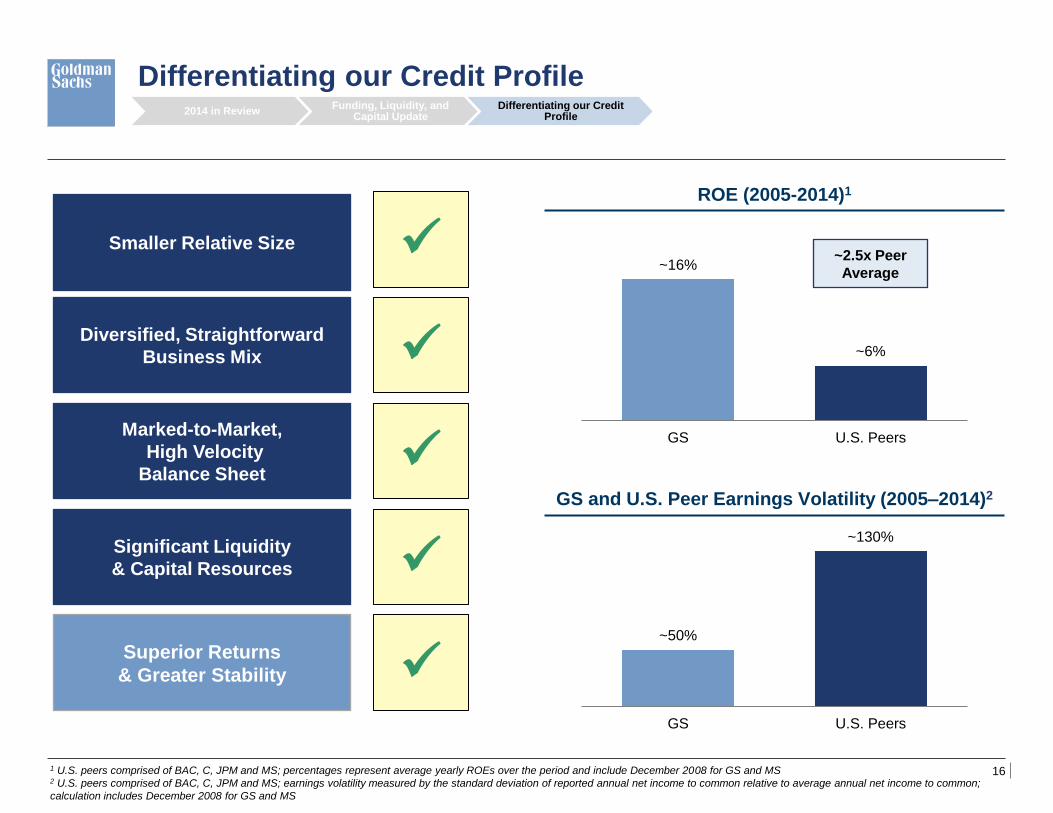
Differentiating our Credit Profile
1 U.S. peers comprised of BAC, C, JPM and MS; percentages represent average yearly ROEs over the period and include December 2008 for GS and MS 2 U.S. peers comprised of BAC, C, JPM and MS; earnings volatility measured by the standard deviation of reported annual net income to common relative to average annual net income to common;
calculation includes December 2008 for GS and MS
ROE (2005-2014)1
Superior Returns
& Greater Stability
2014 in Review Funding, Liquidity, and
Capital Update Differentiating our Credit
Profile
GS and U.S. Peer Earnings Volatility (2005–2014)2
~50%
~130%
GS U.S. Peers
~16%
~6%
GS U.S. Peers
~2.5x Peer
Average
Smaller Relative Size
Diversified, Straightforward
Business Mix
Marked-to-Market,
High Velocity
Balance Sheet
Significant Liquidity
& Capital Resources
17
fwroot\projects\NY\Treasury\Investor_Relations\Earnings\2014\4Q14\Fixed Income Presentation\Fixed Income
Presentation (1.29.15) FINAL FINAL.pptx
Appendix Non-GAAP Measures
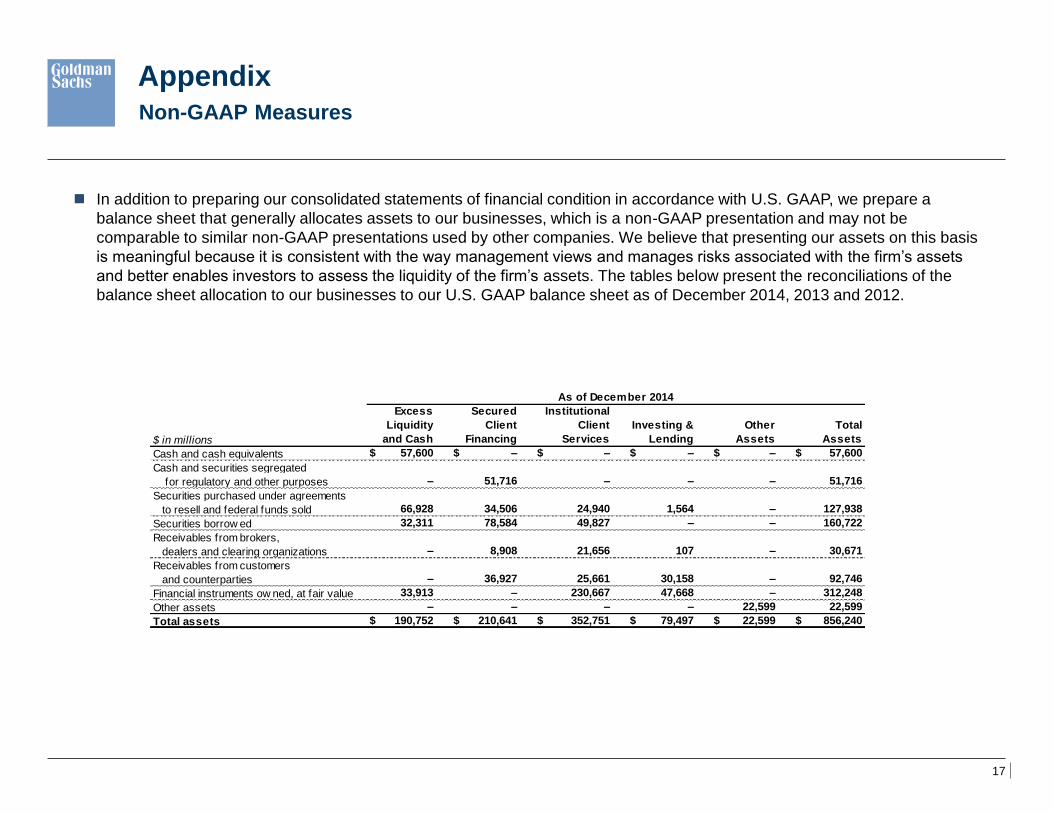
In addition to preparing our consolidated statements of financial condition in accordance with U.S. GAAP, we prepare a
balance sheet that generally allocates assets to our businesses, which is a non-GAAP presentation and may not be
comparable to similar non-GAAP presentations used by other companies. We believe that presenting our assets on this basis
is meaningful because it is consistent with the way management views and manages risks associated with the firm’s assets
and better enables investors to assess the liquidity of the firm’s assets. The tables below present the reconciliations of the
balance sheet allocation to our businesses to our U.S. GAAP balance sheet as of December 2014, 2013 and 2012.
$ in millions
Cash and cash equivalents $ 57,600 $ – $ – $ – $ – $ 57,600
Cash and securities segregated
for regulatory and other purposes – 51,716 – – – 51,716
Securities purchased under agreements
to resell and federal funds sold 66,928 34,506 24,940 1,564 – 127,938
Securities borrow ed 32,311 78,584 49,827 – – 160,722
Receivables from brokers,
dealers and clearing organizations – 8,908 21,656 107 – 30,671
Receivables from customers
and counterparties – 36,927 25,661 30,158 – 92,746
Financial instruments ow ned, at fair value 33,913 – 230,667 47,668 – 312,248
Other assets – – – – 22,599 22,599
Total assets $ 190,752 $ 210,641 $ 352,751 $ 79,497 $ 22,599 $ 856,240
and Cash
As of December 2014
Excess
Liquidity
Secured
Client Total
AssetsFinancing
Institutional
Investing &
Lending
Other
AssetsServices
Client
18
fwroot\projects\NY\Treasury\Investor_Relations\Earnings\2014\4Q14\Fixed Income Presentation\Fixed Income
Presentation (1.29.15) FINAL FINAL.pptx
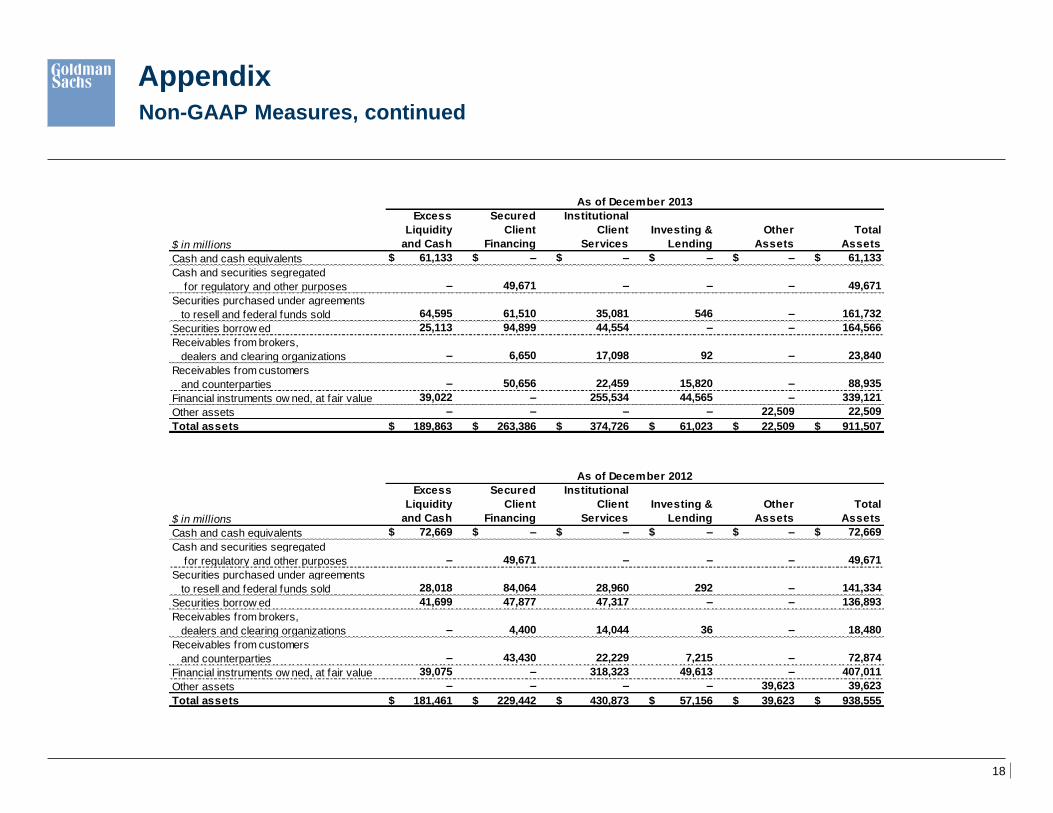
Appendix Non-GAAP Measures, continued
$ in millions
Cash and cash equivalents $ 72,669 $ – $ – $ – $ – $ 72,669
Cash and securities segregated
for regulatory and other purposes – 49,671 – – – 49,671
Securities purchased under agreements
to resell and federal funds sold 28,018 84,064 28,960 292 – 141,334
Securities borrow ed 41,699 47,877 47,317 – – 136,893
Receivables from brokers,
dealers and clearing organizations – 4,400 14,044 36 – 18,480
Receivables from customers
and counterparties – 43,430 22,229 7,215 – 72,874
Financial instruments ow ned, at fair value 39,075 – 318,323 49,613 – 407,011
Other assets – – – – 39,623 39,623
Total assets $ 181,461 $ 229,442 $ 430,873 $ 57,156 $ 39,623 $ 938,555
Assetsand Cash Financing Services Lending Assets
As of December 2012
Excess Secured Institutional
Liquidity Client Client Investing & Other Total
$ in millions
Cash and cash equivalents $ 61,133 $ – $ – $ – $ – $ 61,133
Cash and securities segregated
for regulatory and other purposes – 49,671 – – – 49,671
Securities purchased under agreements
to resell and federal funds sold 64,595 61,510 35,081 546 – 161,732
Securities borrow ed 25,113 94,899 44,554 – – 164,566
Receivables from brokers,
dealers and clearing organizations – 6,650 17,098 92 – 23,840
Receivables from customers
and counterparties – 50,656 22,459 15,820 – 88,935
Financial instruments ow ned, at fair value 39,022 – 255,534 44,565 – 339,121
Other assets – – – – 22,509 22,509
Total assets $ 189,863 $ 263,386 $ 374,726 $ 61,023 $ 22,509 $ 911,507
Assetsand Cash Financing Services Lending Assets
As of December 2013
Excess Secured Institutional
Liquidity Client Client Investing & Other Total
19
fwroot\projects\NY\Treasury\Investor_Relations\Earnings\2014\4Q14\Fixed Income Presentation\Fixed Income
Presentation (1.29.15) FINAL FINAL.pptx
Appendix Non-GAAP Measures, continued
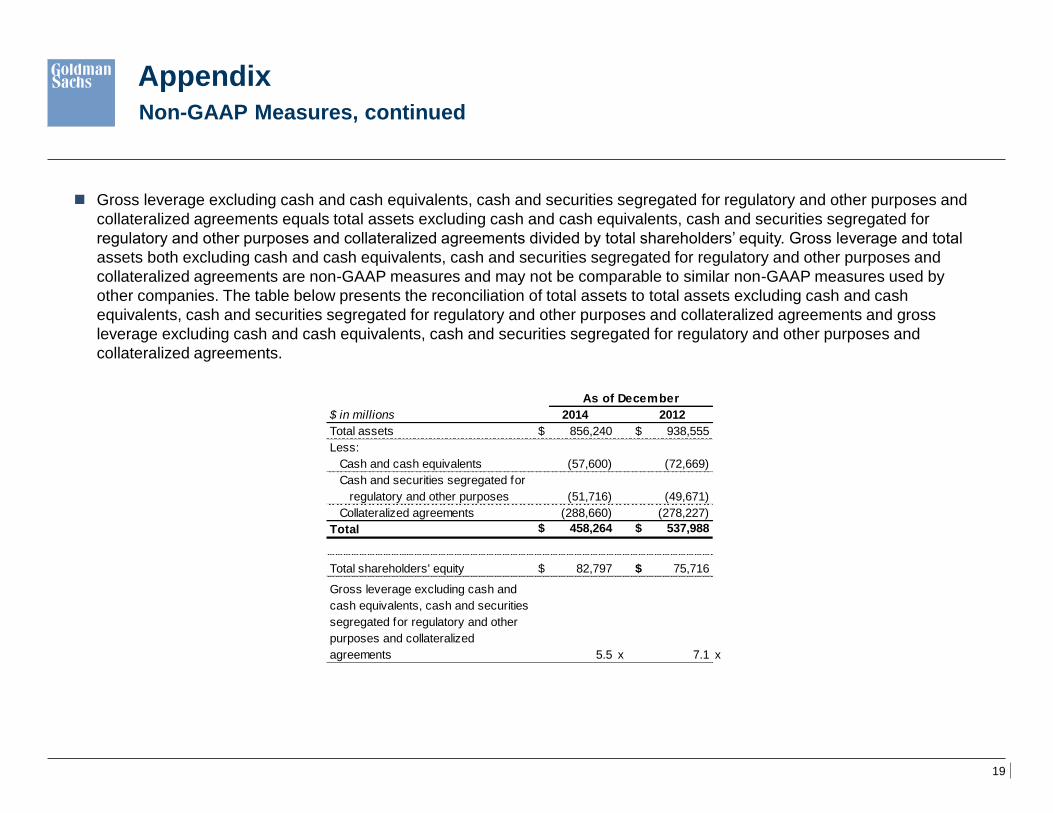
Gross leverage excluding cash and cash equivalents, cash and securities segregated for regulatory and other purposes and
collateralized agreements equals total assets excluding cash and cash equivalents, cash and securities segregated for
regulatory and other purposes and collateralized agreements divided by total shareholders’ equity. Gross leverage and total
assets both excluding cash and cash equivalents, cash and securities segregated for regulatory and other purposes and
collateralized agreements are non-GAAP measures and may not be comparable to similar non-GAAP measures used by
other companies. The table below presents the reconciliation of total assets to total assets excluding cash and cash
equivalents, cash and securities segregated for regulatory and other purposes and collateralized agreements and gross
leverage excluding cash and cash equivalents, cash and securities segregated for regulatory and other purposes and
collateralized agreements.
$ in millions
Total assets $ 856,240 $ 938,555
Less:
Cash and cash equivalents (57,600) (72,669)
Cash and securities segregated for
regulatory and other purposes (51,716) (49,671)
Collateralized agreements (288,660) (278,227)
Total $ 458,264 $ 537,988
Total shareholders' equity
$ 82,797 $ 75,716
Gross leverage excluding cash and
cash equivalents, cash and securities
segregated for regulatory and other
purposes and collateralized
agreements 5.5 x 7.1 x
2014 2012
As of December
Fixed Income Investor Presentation
January 29, 2015