Fit for the Future: Options analysis & comparison report
59
Fit for the Future: Options analysis & comparison report Berrigan Shire Council April 2015
Transcript of Fit for the Future: Options analysis & comparison report

Fit for the Future: Options analysis & comparison report Berrigan Shire Council April 2015

SGS Economics and Planning Pty Ltd ACN 007 437 729 www.sgsep.com.au Offices in Canberra, Hobart, Melbourne, Sydney
Disclaimer This report has been prepared on behalf of Berrigan Shire Council. It was prepared by SGS Economics and Planning Pty Ltd. Any representation, statement, opinion or advice expressed or implied in this publication is made in good faith. SGS Economics and Planning is not liable to any person or entity for any damage or loss that has or may occur in relation to that person or entity taking or not taking action in respect of any representation, statement, opinion or advice referred to above.

TABLE OF CONTENTS
EXECUTIVE SUMMARY 1 1 INTRODUCTION 7 Project context 7
Project scope & objectives 9
2 STRATEGIC APPRAISAL 11 Regional spatial structure 11
Functional linkages mapped 15
Socio-economic characteristics 23
Socio-economic indicators 28
NSW Local Government Areas: Similarities and Differences 29
Community strategic priorities 33
Conclusions functional linkages and socio-economic characteristics 36
3 FINANCIAL APPRAISAL 38 Standalone long term financial plans/ projections 38
Standalone OLG financial benchmark projections 40
Projected financial savings (unconstrained) 42
Legislative framework analysis financial savings 45
Comparison of financial savings scenarios 46
4 DUE DILIGENCE 48 Amalgamation Option Risks 48
5 THE BENEFITS TO BERRIGAN 52 Benefits and disadvantages of the stand-alone option 52
Benefits and disadvantages of the merged option 52

1
www.sgsep.com.au
EXECUTIVE SUMMARY
Project brief
SGS Economics & Planning (SGS) was commissioned by Berrigan Shire Council (BSC) to provide independent analysis to inform Council’s future deliberations over two options: Amalgamation with Jerilderie Shire Council (JSC), as per the Independent Local Government Review
Panel’s (ILGRP) recommendation, and BSC remaining within its existing boundaries. To this end, SGS has under taken a high level strategic appraisal, financial appraisal, and due dilience assessment of potential outcomes.
Strategic appraisal
SGS examined how well the proposed amalgamation would gel by examining the functional linkages between the municipalities, and the degree of similarity of community characteristics and development expectations. This work utilised selected ILTRP criteria for determining future local government boundary changes, as well as GIS-based functional mapping, the socio-economic profiles of the respective municipalities and their adopted Community Strategic Plans. SGS’s overall conclusion is the BSC and JSC share substantial similarities but also a significant number of differences. Key differences relate to: The rate of population growth (BSC growing/ JSC declining)
Economic diversity and development planning (BSC diversifying into tourism & related industries,
while JSC remains heavily reliant on agriculture)
Relationships with nearby LGAs, especially BSC’s relationship with Moira (Vic), and
The composition of the municipal rates base (with BSC enjoying higher property values and more
residential assessments).
BSC undoubtedly looks to the south (Victoria) for a variety of social (service delivery, migration) and economic linkages (freight, jobs), and also to the east in Albury-Wodonga (service delivery, air transport). The figure overleaf summaries SGS’s assessment against the relevant ILGRP criteria.
Financial appraisal
SGS has independently reviewed the reasonableness of the key assumptions adopted in the long term financial planning of BSC, which has been prepared on a standalone basis. At a global level, the global assumptions applied appear reasonable, and given that these assumptions hold true, it is likely that the performance against OLG financial benchmarks will improve in future. BSC’s self-assessed performance against the OLG financial benchmarks indicate that the existing poor results will quickly turn around. Indeed, based on BSC’s self-assessment, Council will meet six out of the seven OLG benchmarks over the period from 2016/17-2019/20. The only exception is the own source revenue ratio. According to OLG’s requirements, councils need to be able to generate more than 60% of

2
www.sgsep.com.au
FIGURE A: ASSESSMENT AGAINST RELEVANT ILGRP CRITERIA
Integrated Planning: LGA boundaries should not unnecessarily divide areas with strong economic and social inter-relationships; they should facilitate integrated planning, coordinated service delivery, and regional development. In terms of integrated planning and regional development, while both economies have a significant agricultural base, BSC has a strong focus on tourism, transport and warehousing as well. While JSC is mostly self-contained in terms of employment and migration, BSC is committed to diversifying the economy, growing tourism and transport related activities, and therefore the focus lies on the Murray River and linkages with Victoria. BSC shares important linkages with nearby councils on the border of the Murray River; Moira in particular. BSC has migration linkages with Victoria and other urban centres. The intermodal hub at Tocumwal plays a regional strategic role for the wider region enabling a viable network connection between Tocumwal and Seymour (Vic) including Shepparton. Tourism in BSC gravitates towards Tocumwal and Barooga (Murray River), while JSC – with a weak focus on tourism – links with other Riverina councils. In terms of coordinated service delivery, JSC depends on a range of services (health, art, federal services and some tertiary education) provided in Berrigan, and for higher order services, it relies mostly on Shepparton and Albury-Wodonga (tertiary education, larger hospital, air travel). In that sense, BSC and JSC form a functional region for lower order services. Local Identity and Sense of Place: Consistent with the need for integrated planning, boundaries should reflect a sense of identity and place, including important historical and traditional values. BSC and JSC share some aspects of identity and sense of place, both being agricultural areas with a long and treasured history. BSC’s identity however is also formed by the Murray River. The socio-economic profiles of BCS and JSC are highly similar but differ in numerous ways. Some key differences include labour force participation rates, education and occupation profiles, jobs self-containment, socio-economic status levels, and the composition of the municipal rates base. While the community strategic plans of both Shires has some commonalities, key differences include BSC’s clear focus on volunteering, the Murray River, lifestyle and growth, and relations with Victorian municipalities. An amalgamation would result in an area developing in quite opposite directions: one area with population growth and related increases in property values and the rate base, while the remainder would experience population decline and a weak or deteriorating rate base. Population Growth: The boundaries of a local government area (LGA) should be able to accommodate projected population growth generated by the LGA over at least the next 25 years. The boundary of the LGAs can comfortably accommodate projected population growth over the next 25 years. Accessibility: As a general rule, it should be possible to drive to the boundaries of a LGA from a main administration centre within 60-90 minutes in country areas, and within 30 to 45 minutes in metropolitan areas. Most if not all of BSC’s and JSC’s boundaries would be accessible from Berrigan (the assumed administrative centre in case of an amalgamation) within 90 minutes. Strong Centre: Each LGA should have a substantial population centre that can provide higher order commercial, administrative, education, health and other services. The two main population centres in BSC and/ or JSC are Finley and Tocumwal. Together with Berrigan these towns would provide most of the sub-regional commercial, education, administrative, health and other services if the two Shires were to merge. Higher order regional services are provided in Shepparton (Victoria) or in Albury-Wodonga. Key Infrastructure: As far as possible, key transport infrastructure such as airports and ports, and those nearby urban and regional centres that are principal destination points, should be within the same LGA. Only a limited suite of regional infrastructure items appear to be located in BSC and/ or JSC. The Tocumwal intermodal hub is the most notable item, and this funnels freight to Victorian ports. Other key infrastructure items appear to be provided in Shepparton (Victoria) or in Albury-Wodonga.

3
www.sgsep.com.au
Financial appraisal (continued)
their operating revenue from its own sources (e.g. rates), however BSC can only generate around 53% of its operating revenue itself with the rest relying on external sources (e.g. grants & contributions). BSC advises that there are two key drivers underpinning improved performance:
The Council has reduced long term operating expenses by about $250,000 p.a. to reflect the permanent reduction in the level of the Financial Assistance Grant, and
The Council has reduced its level of budget conservatism, i.e. increased anticipated interest revenues recognised some sales of bulk water etc.
SGS has also independently projected the potential for financial savings generated by a merger of BSC and JSC. This has been done using 3 different modelling scenarios: Scenario 1: Lead council model: This approach uses BSC’s per capita costs and applies these to the population of JSC. This implies that both BSC and JSC adopt Berrigan’s systems and processes, where applicable. Where JSC activities are different to BSC then this scenario assumes that those activities will not go ahead. However, this cannot be clearly ascertained without completing a detailed review of service levels, and service quality. Scenario 2: Average efficiency (economies of scale) model: This approach is statistical and uses a multi-variable regression model that examines the relationship between total per capita expenditure and population (controlling for road assets, which represents geographic dispersion and regional variations) for councils in NSW and QLD. Service cost savings are then derived by comparing predicted aggregate expenditure prior to merging with the predicted aggregate expenditure post amalgamation. Scenario 2 reflects the average efficiencies that may be achieved through amalgamation and reflects the potential efficiencies relating to a larger council. The impact of both scale (population), which increases scale economies, and geographic dispersion, which reduces scale economies, are jointly examined by this model.
Scenario 3: Constrained financial savings model: This approach estimates financial savings from the proposed merger taking into account factors that should be considered when contemplating boundary changes, as per Section 263 (3) and Section 218CA of the Local Government Act 1993. Accordingly, SGS has made specific assumptions about executive level redundancies, natural attrition rates of non-executive staff (GM only), and efficiencies on material and contracts. The table below summarises the results generated. TABLE A: NPV OF ESTIMATED COST SAVINGS OVER 10 YEARS
Scenario
Estimated Savings
Scenario 1 - lead council model: savings $12.51 million
Scenario 1 - lead council : share of base case (standalone entities) 10.8%
Scenario 2 - average efficiency: savings $1.69 million
Scenario 2 - average efficiency : share of base case(standalone entities) 1.2%
Scenario 3 – legislative framework scenario: savings $4.45 million
Scenario 3 - legislative framework scenario : share of base case (standalone entities) 3.8%
The financial modelling undertaken is at a broad level and is not based on a detailed service review which would be required prior to and to inform decision making and a possible merger process. Source: SGS, 2015. Note that all estimates (and growth rates) exclude depreciation.

4
www.sgsep.com.au
Given the high-level nature of this financial analysis, it is noteworthy that the expenditure savings estimates are preliminary only (i.e. numerous assumptions apply and numerous caveats apply). Scenario 1 Results
Given the difference in per capita expenditure of BSC and JSC1 (which reflects Berrigan’s comparative scale and efficiency of operations), there is potential for strong savings in administration (NPV $8.9 million over 10 years), and economic affairs (NPV $2.1 million over ten years). These savings assume rationalisation of buildings, staff, methods, systems, and supplier contracts to achieve efficiencies observed at BSC. In present value terms, this scenario expects $12.5 million in savings over 10 years (or $1.25 million per annum on average) or 11% of the base case expenditures of the two standalone Shires. The approach assumes that JSC adopt BSC per capita expenditures, and as a result the majority of efficiencies and savings would come from Jerilderie. In other words, the modelling approach implies unchanged expenditures or savings for BSC functions. Scenario 2 results
Scenario 2 shows very little financial savings under the merger option. This is because the increase in population from JSC joining with BSC (approx. 1500 in FYE 2016) is insufficient to compensate for the increase in geographic dispersion (80% increase in road length). In present value terms, the project savings are around $1.7 million over ten years or 1.2% of the base case expenditures of the two standalone Shires. Scenario 3 results
Scenario 3 shows that there is potential for around $3.4 million savings from staff rationalisation – assuming executive redundancies and a freeze on hiring of non-executive staff; and around $1.2 million in savings from materials and contracts. Overall, the legislative framework modelling shows savings of $4.5 million over 10 years in present value terms. This is around 3.8% of base case expenditures of the two standalone Shires. Comparison of financial savings scenarios
The estimates from the lead council model (Scenario 1) are certainly optimistic, as they assume rationalisation of assets, and do not consider the constraints that exist under the LGA Act 1993. Scenario 2 estimates reflect average estimates derived from a statistical model, so there are no explicit assumptions regarding governance. Instead, the estimates reflect the potential for economies of scale. Due to the increase in geographic area, the potential for economies of scale is weak. Scenario 3, is more conservative, and takes into account constraints implied in the Local Government Act 1993. Some of these constraints might be circumvented in the merger process, so estimates from Scenario 3 may well be conservative.
1 Based on FY 2016 estimates, this is $960 for Berrigan and $5526 for Jerilderie. Note that these estimates exclude Water and
Sewer expenditure, as well as depreciation and amortization.
5
www.sgsep.com.au
Conclusions
The financial modelling undertaken by SGS indicates that expenditure savings might be generated by the merger of BSC and JSC. The degree to which these savings arise will depend on the constraints that are ultimately applied during the amalgamation process. When relevant sections of the Local Government Act (1993) are respected, the forecast financial savings still appear to be material between 1.2% and 3.8% compared to the base case of two standalone councils (taking all caveats into account). SGS reviewed the LTFP projections for Berrigan and concluded the assumptions and results are reasonable and founded. The LFTP projections demonstrate that Berrigan’s performance will improve as a stand-alone option and marked improvements are forecast against all OLG indicators, with only one not meeting the required OLG Benchmark ratio of own source revenue.
Due diligence
After reflecting on the outputs of the previous tasks, SGS final task was to identify the risks/ concerns that might be associated with both the amalgamation and standalone options. In terms of the standalone option, the key risks are that the:
Global assumptions made in the long term financial planning process do not hold true and therefore the performance against the OLG financial benchmarks does not improve; suggesting that the strategic capacity of BSC will stagnate if not decline.
Community expectations for improved service delivery will rise and this will be unmatched by a willingness to fund these services through increased rates and/ or user charges.
The financial modelling undertaken in this report indicates that material savings could potentially be generated by the amalgamation of BSC and JSC. However, numerous assumptions were invoked in this modelling and therefore they pose risks. These and other risks associated with the merger option are the:
Scale and scope of the initial amalgamation costs
Potential clash of organisational cultures, especially during the initial transition period
Degree to which projected financial savings are pursued/ implemented by the new entity
Global assumptions do not hold true and therefore the performance against the OLG financial benchmarks does not improve.
Community expectations for improved service delivery may rise beyond merger savings and will be unmatched by a willingness to fund these services through increased rates and/ or user charges.
Impact of salary equalisation arrangements that would ultimately be required by the new entity
Impact of service equalisation arrangements across the merged entity, which may unwittingly cause service delivery improvement expectations, and

6
www.sgsep.com.au
The impact on rate payers, particularly on BSC based farmland rate payers, which our initial modelling indicates will experience a material rise in rates, whereas others experience modest adjustments only.
The existence of possible ‘legacy issues’ where a merging Council may feel they are ‘subsidising’ or ‘diverting resources’ to address issues of the other merging Council. It could result in resources that otherwise would have been invested in Berrigan, being diverted to Jerilderie (or vice versa). The financial models used do not identify the existence (or absence) of any such issues. If applicable, the savings of the merger could be used towards addressing any such issues.
Another issue, not explicitly covered in this analysis, is the risk of reduced local representation and reduced local sovereignty for residents. These matters are at the heart of the local government amalgamation debate.
The benefits to Berrigan
In theory, under the new merged entity, rates and service levels would be equalised over time with all ratepayers contributing and benefitting in an equitable way. That, in combination with the savings of the merger would mean that everyone gets better value for money. A key question to the Berrigan community is whether Berrigan as a stand-alone Council is better off than Berrigan as part of a merged option. Both options have their benefits and these need to be considered for Berrigan to make an informed decision. The benefits of the stand-alone model for Berrigan are:
Long term sustainability (with the exception of own source revenue)
Growing rate base
Continued strong local representation and focus on locally significant issues
No merger and transition costs, and
No risks of amalgamation (including any legacy issues) The benefits of the merger model for Berrigan are:
Increased capacity for (strategic) service improvement
Possibly more Council jobs in Berrigan
The savings of the merger which may lead to lower rates, increased service delivery and/or increased long term sustainability of Council

7
www.sgsep.com.au
1 INTRODUCTION
Project context
Local Government Review
The Independent Local Government Review Panel (ILGRP) released a final report titled “Revitalising Local Government” in October 2013. This report identified a reshaping of governance arrangements and consolidation of local government in New South Wales. The objective for local government reform is to create strategic and “Fit for the Future” councils. That is, councils that: Are financially sustainable and efficient Have the capacity to effectively manage infrastructure and deliver services Have the scale, resources and ‘strategic capacity’ to govern effectively and partner with the State Have the capacity to reduce red tape and bureaucracy for business Are of a scale and structure that is broadly in line with the Panel’s recommendations. In September 2014, the State Government announced a Fit for the Future package of local government reforms, which responds to the recommendations of the ILGRP. The Fit for the Future package is primarily a funding scheme designed to incentivise local governments, by encouraging them to develop the scale and capacity the Government believes necessary to enable them to provide quality services and infrastructure into the future. To that end the Government has provided a blueprint that outlines how it will assist in the reform of local government. Key elements included in the blueprint that are relevant are set out below: $258m to help councils that have decided to merge to make the transition $13m to support local transition committees and ensure elected representatives are involved in the
merger process $5.3m to get new regional Joint Organisations up and running, and Up to $600m potential savings from cheaper finance for Fit for Future councils to invest in local
infrastructure. In addition the Government is providing access to expert assistance, access to the Office of Local Government (OLG) One Stop Shop for local government reform, facilitators and technical support.
Fit for the Future Criteria
To become Fit for the Future Councils must perform a self-assessment of their financial management, service delivery and scale of operations, and submit a proposal on how the plan to become Fit for the Future by June 2015, using the self-assessment tool, templates and guidance provided by OLG. Submissions will be assessed by the Independent Expert Panel on the basis of criteria and benchmarks developed by the OLG. The Independent Expert Panel will make recommendations to the Minister for Local Government in December 2015. Councils will then begin to implement their approved roadmaps in March 2016, with support to ensure any new arrangements are in place by the next local government elections.

8
www.sgsep.com.au
The four criteria that will be used to assess whether a council is fit for the future are: sustainability; effective infrastructure and service management; efficiency; and scale and capacity.
Figure 1 defines these criteria and identifies the benchmarks proposed by OLG for assessing performance against these criteria. It also shows how sustained improvement in the fit for the future criteria will lead to improved strategic capacity.
FIGURE 1. FIT FOR FUTURE – CRITERIA AND BENCHMA RKS
Source: NSW Government
Scale and Capacity
The OLG argues that scale is a key component of strategic capacity – both in creating individual councils with the resources and skills to provide leadership on regional planning and to advocate on behalf of communities by creating a system of local government where state and local government partner effectively. A council with appropriate scale and capacity can Save money on bureaucracy and administration, freeing up funds for front line services and
community facilities Contribute to projects and tackle issues that impact on its residents and extend beyond the council
boundary, and Credibly influence different levels of government and industry.
ILGRP Options for Berrigan/ Jerilderie
In their final report (October 2013), the ILGRP propose the following merger and boundary change options for Berrigan and Jerilderie Shire Councils: Berrigan Shire Council: Merge with Jerilderie Shire Council Jerilderie Shire Council: Merge with Berrigan Shire Council or establish a Rural Council as part of the
Mid Murray Joint Organisation.

9
www.sgsep.com.au
These recommendations were made after drawing from the ILGRP’s criteria for determining future local government boundaries.
Project scope & objectives
Project Brief
Berrigan Shire Council (BSC) is developing a business case for submission to the OLG concerning its preferred future. To inform this business case, the BSC project Brief called for an independent analysis of Council’s potential fitness for the future under two options: Amalgamation with Jerilderie Shire Council, as per the ILGRP’s recommendation, and Berrigan Shire Council remaining within its existing boundaries. The BSC Brief also required a comparison of the outcomes that are likely to be generated under both options. To this end, the Brief called for: A high level strategic and financial appraisal for each option (for use in completing OLG Templates 1
and 2)2 An assessment of Council’s future performance against the financial benchmarks set by OLG under
each option (for use in completing OLG Templates 1 and 2) An assessment of amalgamation option in terms of the factors set out in Section 263 of the Local
Government Act 1993 An assessment of amalgamation option in terms of staff protection provisions of Section 218CA of
the Local Government Act 1993, and A high-level due diligence assessment of any risks/ concerns associated with both options.
Project Inception
At the project inception meeting, BSC provided SGS Economics & Planning (SGS) with a thorough overview of the background work that Council has prepared/ commissioned to date, and how this interested with SGS’s proposal. When asked specifically how SGS’s proposed role fitted with this background work, BSC clarified that SGS was not expected to replicate background work but to use it appropriately when independently responding to a) through to e) above.
Project Approach
Given this context, SGS has responded to BSC’s needs as follows. High level strategic appraisal
In terms of the high level strategic appraisal, SGS has examined how well the proposed amalgamation of Berrigan and Jerilderie would gel by examining the functional linkages between the communities, and the degree of similarity of community characteristics and development expectations. This work draws
2 Refer http://www.fitforthefuture.nsw.gov.au/content/just-released-%E2%80%93-council-self-assessment-tool-templates-and-
guidance

10
www.sgsep.com.au
from the ILTRP criteria for determining future local government boundary changes, as well as socio-economic profiles of the respective municipalities and their adopted Community Strategic Plans. High level financial appraisal
In terms of the high level financial appraisal, SGS has: Independently reviewed the key assumptions adopted in the Long Term Financial Plans (LTFP) of
BSC, which has been prepared on a standalone basis. Independently reviewed the financial projections/ OLG benchmarks generated by BSC, again
prepared on a standalone basis
Modelled the level of financial savings that might be generated by the proposed amalgamation
Subsequently explored how the estimated savings correlate with the factors that must be considered when contemplating boundary changes as per Section 263 (3) and Section 218CA of the Local Government Act 1993.
SGS has also identified some of the non-financial costs and benefits that should be considered as
part of the financial and broader economic appraisal. Due diligence
Drawing from the information used and key assumptions adopted in the aforementioned analysis, SGS has highlighted the key risks/ concerns associated with both the amalgamation and standalone options.
Report structure
This report has been structured in a manner that sequentially works through the aforementioned tasks, and therefore has been structured around the headings of strategic appraisal, financial appraisal and due diligence.

11
www.sgsep.com.au
2 STRATEGIC APPRAISAL
This section assesses how well the proposed amalgamation of Berrigan and Jerilderie would gel by examining the functional linkages between the communities, along with the degree of similarity of community characteristics and community strategic priorities. This work draws from the ILTRP criteria for determining future local government boundary changes, as well as socio-economic profiles of the respective municipalities and their adopted Community Strategic Plans.
Regional spatial structure
FIGURE 2 CONTEXT MAP : BERRIGAN AND JERILDE RIE
Source: SGS (2015) using Near Map.

12
www.sgsep.com.au
Berrigan Shire Council and Jerilderie Shire Council are adjacent to each other. Berrigan is situated along the Murray River. North of Berrigan is Jerilderie. Berrigan has a total population of 8,066 people dispersed over four urban centres Berrigan, Finley, Barooga and Tocumwal, and the regional land around these towns. Jerilderie has a total population of 1,496 persons living in Jerilderie township and the surrounding rural areas (Table 1).
TABLE 1 POPULATION BY TOWN A ND RURAL BALANCE, 20 11
Resident population
Berrigan 922
Finley 1,921
Tocumwal 2,154
Remainder Berrigan (including Barooga) 3,069
Berrigan total 8,066
Jerilderie town 775
Remainder Jerilderie 721
Jerilderie total 1,496 Source: ABS Census 2011
The following maps show the situation of the two LGAs in relation to accessibility of key regional services: Hospitals Tertiary education Art galleries and museums Federal services (Centrelink, Human Services), and Regional airports. It is recognised that sometimes the distinction between local and regional services is unclear. Consequently, local services are also mapped where they appear relevant. The maps (Figure 3 and Figure 4) show Berrigan and Jerilderie and their regional services in the context of private vehicle accessibility. These private vehicle travel times are between the centre of each LGA and have been estimated using the actual road network and the speeds applicable to the classifications of each of the roads in the network. The maps make it abundantly clear that Berrigan is connected via the Newell A39 (north-south) and Riverina B58 Highways (west-east), while Jerilderie is serviced only in a north-south direction by a highway standard road (i.e. the Newell Highway). The nearest regional airport for passenger travel is Albury-Wodonga which, based on the modelling methodology, is more than two hours’ drive from Berrigan. There are small (local) hospitals in Berrigan, Finley, Jerilderie and Tocumwal. There is a TAFE facility in Finley. The nearest universities are in Shepparton and Albury-Wodonga. Centrelink services are offered in both Berrigan (phone), Cobram (phone) and Tocumwal (phone). There are three galleries in Berrigan LGA, though it is anticipated that these are purely locally oriented galleries. Jerilderie has a small hospital. There are no tertiary education facilities, Centrelink or Human Services in Jerilderie. Clearly Jerilderie relies on towns in adjacent municipalities such as Berrigan and Deniliquin for these services. From the maps it can be safely concluded that both Berrigan and Jerilderie rely on: Albury-Wodonga for regional air transport services, and

13
www.sgsep.com.au
Albury-Wodonga and Shepparton (Victoria) for higher order (i.e. regional) hospital care needs (and most likely higher education services).
FIGURE 3 BERRIGAN REGIONAL SE RVICES
Source: diverse sources (2015)

14
www.sgsep.com.au
FIGURE 4 JERILDERIE REGIONAL SERVICES
Source: diverse sources (2015)

15
www.sgsep.com.au
Functional linkages mapped
The ILGRP has identified the following criteria for determining local government boundaries (Figure 5).
FIGURE 5. CRITERIA FOR DETERMI NING FUTURE LOCAL GOVERNMENT BOUNDARIES
Sustainability and Strategic Capacity Councils need a strong base to ensure their long-term sustainability; to achieve economies of scale and scope; to deliver quality services; to provide a pool of talented councillor candidates; to attract skilled staff; and to develop strategic capacity in governance, advocacy, planning, and management. Efficiency and Effectiveness Councils should be able to operate efficiently and effectively within the limits imposed by their location, geography and the characteristics of the communities they serve. They should be able to provide ‘value for money’ to their ratepayers and external funding agencies. Integrated Planning LGA boundaries should not unnecessarily divide areas with strong economic and social inter-relationships; they should facilitate integrated planning, coordinated service delivery, and regional development. Local Identity and Sense of Place Consistent with the need for integrated planning, boundaries should reflect a sense of identity and place, including important historical and traditional values. (However, other mechanisms available to maintain local identity should be taken into account.) Population Growth The boundaries of a local government area (LGA) should be able to accommodate projected population growth generated by the LGA over at least the next 25 years. Accessibility As a general rule, it should be possible to drive to the boundaries of a LGA from a main administration centre within 60-90 minutes in country areas, and within 30 to 45 minutes in metropolitan areas. Strong Centre Each LGA should have a substantial population centre that can provide higher order commercial, administrative, education, health and other services. Key Infrastructure As far as possible, key transport infrastructure such as airports and ports, and those nearby urban and regional centres that are principal destination points, should be within the same LGA. Combining Existing Municipalities Wherever practicable, amalgamations should combine the whole of two or more existing LGAs without the additional cost and disruption of associated boundary adjustments. Source: ILGRP, October 2013.
Functional linkages are important indicators for determining local government boundaries and identifying functional regions.
Travel time/ accessibility
Travel times determine to what extent areas are reasonably accessible for work, training, recreation and other services. Berrigan is three hours driving or 270 km north of Melbourne and 7 hours driving (670 km) south west of Sydney. The maps below depict the average travel times from the key residential centres in Berrigan and Jerilderie. The centres of Berrigan and Jerilderie can generally be accessed within 90 minutes’ drive.

16
www.sgsep.com.au
Within Berrigan, travel times are mostly within half an hour, when travelling from the main towns. Moira (Vic), Corowa, Deniliquin and Jerilderie are within an hour to an hour and a half travel time (Figure 6).
FIGURE 6 TRAVEL TIMES FOR BER RIGAN
Source: SGS (2015)

17
www.sgsep.com.au
Within Jerilderie, travel times are mostly within half an hour. Berrigan, Moira (Vic), Deniliquin and Corowa are within an hour to an hour and a half travel time (Figure 7).
FIGURE 7 TRAVEL TIMES FOR JER ILDERIE
Source: SGS (2015)

18
www.sgsep.com.au
Journey to work patterns
The majority of Berrigan LGA residents with jobs, have jobs that are located within the Shire. Nonetheless, a significant number of people work in adjacent LGAs, with most people commuting to Cobram (Vic) and other areas in Moira (Vic).
FIGURE 8 PLACE OF WORK FOR BE RRIGAN WORKING RESID ENTS
Source: ABS, 2011

19
www.sgsep.com.au
Jerilderie is highly self-contained in terms of employment. The most important destination outside Jerilderie, is Murumbidgee. Jerilderie has no economic links with Moira (Vic) and Corowa.
FIGURE 9 PLACE OF WORK FOR JE RILDERIE WORKING RES IDENTS
Source: ABS, 2011
Journey to key services
The travel time and regional services maps (Figures 3 and 4) show that Berrigan is self-reliant in a number of services, but for most tertiary education, high order hospital care and air transport services the LGA relies on nearby areas: Moira, Shepparton and Albury-Wodonga. For Jerilderie this pattern is slightly different with the main destinations for key services being Berrigan and Deniliquin. For higher order services (large hospital, university and airport) Jerilderie relies on Albury-Wodonga.

20
www.sgsep.com.au
Migration patterns
Migration patterns show further functional linkages between areas (Figure 10 and Figure 11). It shows Berrigan has strong ties with Moira (Vic) and larger urban centres in the region. Jerilderie is quite self-contained and is most connected with Berrigan. In Berrigan, migration patterns over the five years to 2011 show that most people relocate within Berrigan. The populations of Tocumwal and Barooga on the border of the Murray River have been growing. If people relocate further away, it is mostly to Moira (Vic), Albury, Wondonga, Wagga Wagga and Conargo.
FIGURE 10 MIGRATION PAT TERNS F ROM BERRIGAN, FIVE YEARS TO 2011
Source: ABS (2011)

21
www.sgsep.com.au
FIGURE 11 MIGRATION PAT TERNS F ROM JERILDERIE, F IVE YEARS TO 2011
Source: ABS (2011)
For Jerilderie, the vast majority of households relocating did so within the Jerilderie LGA. Migration patterns from Jerilderie show some linkage with Berrigan. In addition, migration patterns to Berrigan and Jerilderie were reviewed. While in-migration is smaller than emigration, it further confirms the patterns illustrated earlier. Berrigan is an important lifestyle destination for retirees from Victoria, i.e. Berrigan has significant numbers of people relocating into the area from Victoria. Over the five years to 2011, 809 people migrated from Victoria to Berrigan. This compares to 976 persons who relocated within the same area, and with 378 persons from elsewhere in NSW. For Jerilderie, the in-migration patterns are different. The vast majority of people relocating, did so within the same area (143 persons). There were 83 people migrating from elsewhere in NSW and only 48 persons migrating from Victoria.

22
www.sgsep.com.au
Other regional linkages
Key agricultural industry (downstream) linkages The Berrigan Jerilderie region has a strong agricultural sector that is specialised in sheep, beef cattle, grain and dairy cattle farming. The Newell Highway provides access to the National Highway and national transport and freight hubs. There is an intermodal road/rail hub in Tocumwal (in Berrigan Shire) which currently takes freight from the wider region. The hub transports freight from Tocumwal, south to Melbourne and vice versa. The intermodal hub is the second largest grain transfer in NSW and the second largest container transfer facility in Victoria (the rail area is vested in the State of Victoria). Three trains run each week between Tocumwal and Melbourne with freight movements in both directions. Tocumwal has significant storage facilities adjacent to the hub for produce including grain, lucerne, potatoes and briquettes. Council recently rezoned the land and an extension area to industrial. A further grain site may be developed in the near future. The Berrigan community strategic plan has also identified the need to upgrade the Newell Hwy to Tocumwal to enhance transport and freight accessibility with Victoria and other export markets. BSC has committed to upgrading road access to improve safety and reduce queuing times, spending $3 million (co-funded by State) over the next twelve months. Tourism linkages Tourism is an important industry for Berrigan’s local economy. Berrigan is part of the Murray tourism region (Murray Regional Tourism Board) and Jerilderie of the Riverina (Riverina Regional Tourism Board). Murray Regional Tourism encompasses 14 local councils in NSW and Victoria and four regional tourism associations. The tourism region’s councils are: Albury City Council, Greater Hume Shire Council, Wodonga Rural City Council, Corowa Shire Council, Berrigan Shire Council, Deniliquin Council, Wakool Shire Council, Gannawarra Shire Council, Swan Hill Rural City Council, Campaspe Shire Council, Mildura Rural City Council, Moira Shire Council, Murray Shire Council and Wentworth Shire. Berrigan Shire is also part of the ‘Sun Country on the Murray’ regional tourism association which is a partnership with Moira Shire. In 2014, the Murray region received nearly 2.4 million overnight domestic visitors and the region experienced nearly 7 million visitor nights (MRT, 2014) with holiday or recreation being the primary purpose of the visit. Visitors spent an estimated $1 billion in the region, or $147 per visitor night3. In 2014, the Travel to Sun Country area attracted 464,000 domestic visitors and the area experienced over 1.4 million visitor nights. Visitors spent $196 million in the region or $136 on average per visitor night. The most popular accommodation type used was ‘friends or relatives’ property, followed by camping. Jerilderie is part of the Riverina Regional Tourism Board, which also includes Griffith, Wagga Wagga, Deniliquin, Leeton, Conargo, Coolamon, Cootamundra, Gundagai, Murrumbidgee Shire, Narrandera, Temora, Urana, Hillston, Junee, Lockhart and Hay. In 2013 (most recent year for which data were found), the Riverina region received 867,000 domestic visitors generating 2.4 visitor nights with visiting family and friends being the most important purpose for the visit. Visitors spent $258 million in the region or $107 per visitor night on average (RRT, 2013). Berrigan Shire, in its community strategic plan, has identified that the two tourism regions are competing for market share.
3 Estimates for overseas visitors seem erroneous as the statistics indicate that overseas visitors would stay for 23 nights on
average. Therefore their spending and visitation were not included here.
23
www.sgsep.com.au
The Murray Regional Tourism region is important for Berrigan. Most accommodation and visitor nights spent in Berrigan are in the river-fronting towns of Tocumwal and Barooga. As a result, Berrigan has important economic linkages with other Murray River fronting municipalities and in particular with Moira on the other side of the River. Jerilderie does not have a strongly developed tourism industry. To further develop its tourism potential, Berrigan aims to increase pedestrian access to the River through the development of the Tocumwal Boardwalk, and by exploring the opportunities of tourism in the Barmeah-Millewa National Park. Energy and telecommunications Energy and telecommunications linkages are weak, with the cost of energy and fuel and the internet connectivity impacting adversely on the competitiveness of Berrigan and Jerilderie.
Socio-economic characteristics
This subsection compares some of the key socio-economic characteristics of Berrigan and Jerilderie and compares these with the NSW, and where data are available, the Rural Balance of NSW.
Population and population change
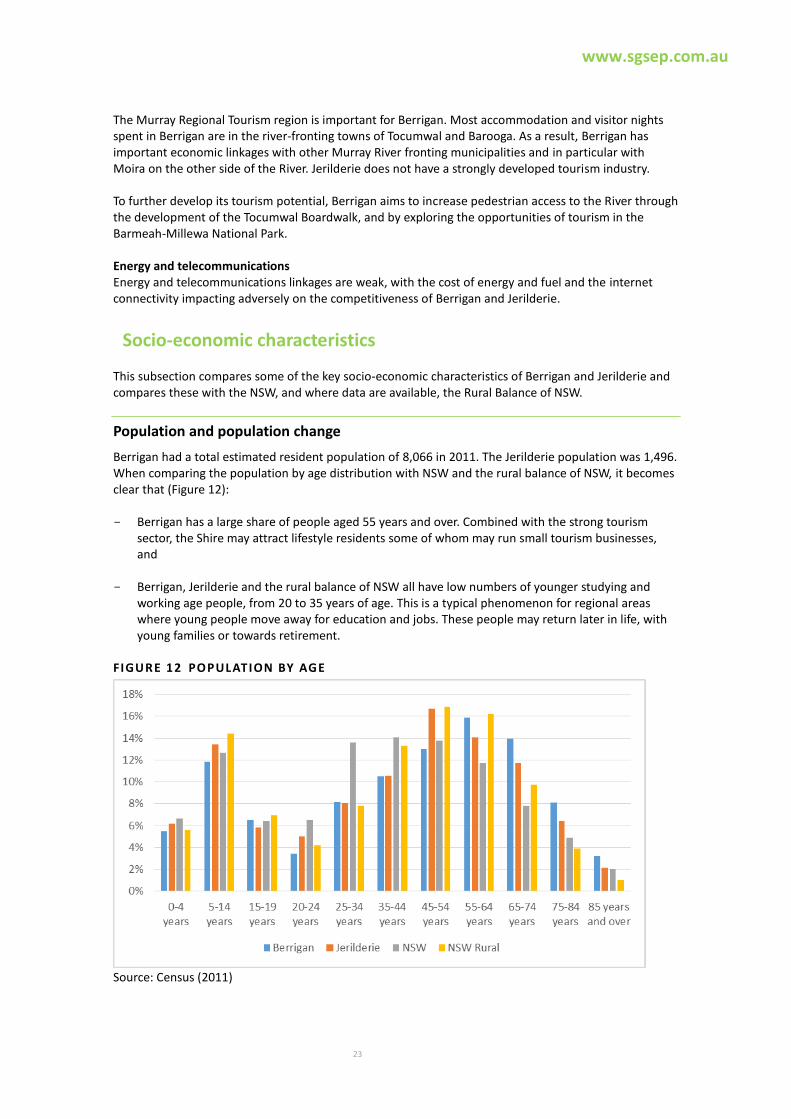
Berrigan had a total estimated resident population of 8,066 in 2011. The Jerilderie population was 1,496. When comparing the population by age distribution with NSW and the rural balance of NSW, it becomes clear that (Figure 12): Berrigan has a large share of people aged 55 years and over. Combined with the strong tourism
sector, the Shire may attract lifestyle residents some of whom may run small tourism businesses, and
Berrigan, Jerilderie and the rural balance of NSW all have low numbers of younger studying and
working age people, from 20 to 35 years of age. This is a typical phenomenon for regional areas where young people move away for education and jobs. These people may return later in life, with young families or towards retirement.
FIGURE 12 POPULATION BY AGE
Source: Census (2011)

24
www.sgsep.com.au
Both the Berrigan and Jerilderie population lag behind NSW in terms of growth rates. Berrigan’s population has increased from 2001 onwards at a rate of between 0.1% and 0.2% per annum. Jerilderie’s population has been in decline, accelerating from -1.7% per annum from 2011 to 2006 to -2.8% per annum from 2006 to 2011. The NSW population increased by 0.7% per annum from 2011 to 2006 and 1.1% from 2006 to 2011. Unfortunately, no data for the rural balance of NSW were available in the ABS time series, as it would likely indicate that population change in Berrigan is in line with rural areas elsewhere. Population projections indicate that: - The Berrigan population will likely continue to grow, at a pace of between 0.3% and 0.4% per annum
on average to nearly 9,000 residents in 2036 - The Berrigan population will continue to age with a significant decline in the number of people aged
10 to 25 years and 30 to 60 years of ages, and a strong increase in people aged 60 and over (ID Consulting)
- The Jerilderie population will continue to decline, at a pace between -0.5% and -0.9% per annum on average to just over 1,300 residents by 2036
- The Jerilderie population will continue to age with a significant decline in the number of people aged 5 to 24 years and 30 to 60 years of age (ID Consulting).
These projections do not consider changing patterns in migration to and from the local areas. The figures below show the population projections for both Shires (Figure 13).
FIGURE 13 POPULATION PROJECTIO NS 2011-2036
Source: ID Consulting, 2013
The vast majority of residents in the Berrigan and Jerilderie Shires are Australian born, 87% of total population. This is higher than in NSW and the rural balance of the state, with Australian born population being 69% and 84% respectively (Table 2).
TABLE 2 TOP FIVE CULTURAL BACKGROUNDS
Berrigan Jerilderie NSW NSW rural
Australia 87% Australia 87% Australia 69% Australia 84%
United Kingdom (3%) Indigenous (3%) United Kingdom (4%) United Kingdom (4%)
Indigenous (2%) United Kingdom (2%) Indigenous (2%) Indigenous (3%)
New Zealand (1%) India (1%) China (2%) New Zealand (1%)
Netherlands (1%) Italy (1%) New Zealand (2%) Germany & Italy (1%)
Source: Census (2011)
25
www.sgsep.com.au
Household characteristics
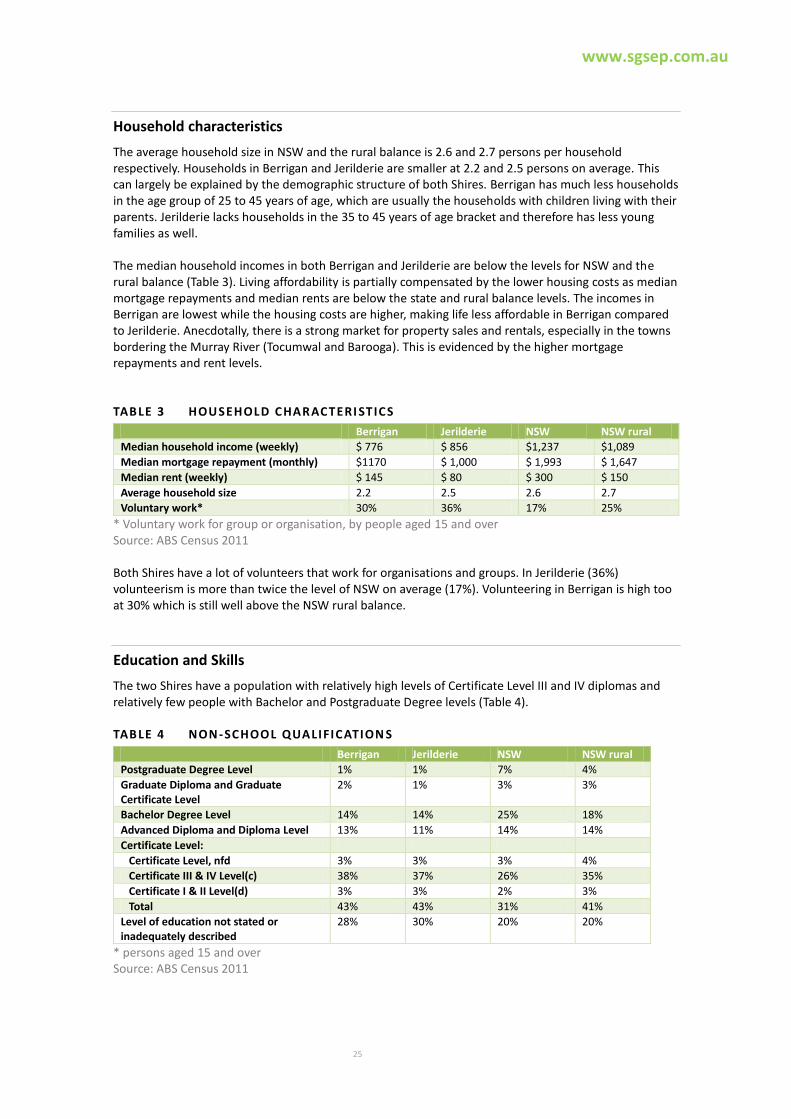
The average household size in NSW and the rural balance is 2.6 and 2.7 persons per household respectively. Households in Berrigan and Jerilderie are smaller at 2.2 and 2.5 persons on average. This can largely be explained by the demographic structure of both Shires. Berrigan has much less households in the age group of 25 to 45 years of age, which are usually the households with children living with their parents. Jerilderie lacks households in the 35 to 45 years of age bracket and therefore has less young families as well. The median household incomes in both Berrigan and Jerilderie are below the levels for NSW and the rural balance (Table 3). Living affordability is partially compensated by the lower housing costs as median mortgage repayments and median rents are below the state and rural balance levels. The incomes in Berrigan are lowest while the housing costs are higher, making life less affordable in Berrigan compared to Jerilderie. Anecdotally, there is a strong market for property sales and rentals, especially in the towns bordering the Murray River (Tocumwal and Barooga). This is evidenced by the higher mortgage repayments and rent levels.
TABLE 3 HOUSEHOLD CHARACTERI STICS
Berrigan Jerilderie NSW NSW rural
Median household income (weekly) $ 776 $ 856 $1,237 $1,089
Median mortgage repayment (monthly) $1170 $ 1,000 $ 1,993 $ 1,647
Median rent (weekly) $ 145 $ 80 $ 300 $ 150
Average household size 2.2 2.5 2.6 2.7
Voluntary work* 30% 36% 17% 25%
* Voluntary work for group or organisation, by people aged 15 and over Source: ABS Census 2011 Both Shires have a lot of volunteers that work for organisations and groups. In Jerilderie (36%) volunteerism is more than twice the level of NSW on average (17%). Volunteering in Berrigan is high too at 30% which is still well above the NSW rural balance.
Education and Skills
The two Shires have a population with relatively high levels of Certificate Level III and IV diplomas and relatively few people with Bachelor and Postgraduate Degree levels (Table 4).
TABLE 4 NON -SCHOOL QUALIFICATION S
Berrigan Jerilderie NSW NSW rural
Postgraduate Degree Level 1% 1% 7% 4%
Graduate Diploma and Graduate Certificate Level
2% 1% 3% 3%
Bachelor Degree Level 14% 14% 25% 18%
Advanced Diploma and Diploma Level 13% 11% 14% 14%
Certificate Level:
Certificate Level, nfd 3% 3% 3% 4%
Certificate III & IV Level(c) 38% 37% 26% 35%
Certificate I & II Level(d) 3% 3% 2% 3%
Total 43% 43% 31% 41%
Level of education not stated or inadequately described
28% 30% 20% 20%
* persons aged 15 and over Source: ABS Census 2011

26
www.sgsep.com.au
Labour force and employment
Unemployment levels in Berrigan and Jerilderie are below the NSW and NSW rural balance average. Especially in Jerilderie unemployment is very low at 2.1%, while the labour force participation rates are comparable to the state and rural average. Youth unemployment is also well below the average for the state and rural balance. Unemployment in Berrigan is slightly higher than in Jerilderie but in line with the rural balance of NSW, which is below the average for NSW. Youth unemployment is at 10.2% for Berrigan, and total unemployment is 4.4% of the labour force. However, participation rates in Berrigan are below average. This is likely due to the relatively older population of Berrigan; the participation rate of people up to 15 years of age is much closer to the comparative rates as can be seen in the table below.
TABLE 5 UNEMPLOYMENT AND LAB OUR FORCE PARTICIPAT ION
Labour force indicators Berrigan Jerilderie NSW NSW Rural
Unemployed <25 yrs 10.2% 6.6% 12.8% 10.3%
Unemployed 4.4% 2.1% 5.9% 4.5%
Labour force participation <25 yrs 55% 57% 58% 58%
Labour force participation 54% 60% 60% 62%
* Unemployment as percentage unemployed of total labour force Source: ABS Census 2011 In terms of employment there are two important indicators to look at: - The levels and industries of employment by residents of the Shires - The levels and industries of employment that are located in the Shires (Place of Work, PoW) These two indicators are also used to determine the level of self-sufficiency of the areas. The figure below shows employment by industry in the two Shires (PoW). Obviously, agriculture and manufacturing (processing of produce) are key sectors in both Shires, with 643 jobs in Berrigan and 325 in Jerilderie. Berrigan also has significant employment in tourism related sectors: retail trade (349 jobs), accommodation and food services (298 jobs) and transport, postal and warehousing (196 jobs). Transport, postal and warehousing is also related to agriculture and manufacturing. Further, Berrigan functions as a sub-regional centre for health related services (not hospitals) and education and training (not university).

27
www.sgsep.com.au
FIGURE 14 EMPLOYMENT BY INDUST RY (POW)
Source: ABS Census 2011 When comparing the economies of the two Shires with NSW as a whole it is clear that both local economies are strongly specialised towards agriculture (Figure 15). The economy of Jerilderie is especially focussed on agriculture. The Berrigan economy is more diversified with accommodation and food services (9%) strongly represented compared to NSW. In terms of health care and education, Berrigan scores close to the NSW average. In Jerilderie, public administration and safety is a relatively important industry, employing 43 people or 6% of total employment.

28
www.sgsep.com.au
FIGURE 15 EMPLOYMENT BY INDUST RY ( IN %) , POW
Source, ABS Census 2011 Comparing the jobs held by residents to the jobs located in the two Shires, it is further evident that the economy of Berrigan relies more strongly on employment offered outside the local area. The self-containment rate for Berrigan is 73% (ratio of employed residents to local jobs), while the rate for Jerilderie is high at 90%. Berrigan’s economic prosperity is relying on nearby municipalities, especially Moira as the mapping exercise in the previous section showed.
Socio-economic indicators
Indicators from the Census of Population and Housing, the Socio-Economic Indexes for Areas (SEIFA) provide a snapshot of the socio-economic situation in areas. SEIFA scores areas in terms of: Index of Relative Socio-Economic Disadvantage: general summary of economic and social
conditions of people in an area. A low score indicates relatively greater disadvantage in general. For example, an area could have a low score if there are (among other things) many households with low income, many people with no qualifications, or many people in low skill occupations.
Index of Relative Economic Resources: focuses on the financial aspects of relative socio-economic advantage and disadvantage, by summarising variables related to income and wealth. A low score indicates a relative lack of access to economic resources in general. For example, an area may have a

29
www.sgsep.com.au
low score if there are many households with low income, or many households paying low rent AND few households with high income, or few owned homes.
Index of Relative Education and Occupation: reflects the educational and occupational level of communities. The education variables in this index show either the level of qualification achieved or whether further education is being undertaken. A low score indicates many people with lower education or low skilled occupations or many unemployed AND few people with high level qualifications or high skilled occupations.
Index of Relative Socio-economic Advantage and Disadvantage: summarises information about the
economic and social conditions of people and households within an area, including both relative advantage and disadvantage measures. A low score indicates relatively greater disadvantage and a lack of advantage in general. For example, an area could have a low score if there are (among other things) many households with low incomes, or many people in unskilled occupations AND few households with high incomes, or few people in skilled occupations.
Berrigan and Jerilderie have quite different socio-economic characteristics. Berrigan consistently scores in the fourth decile, meaning it fits in the lowest 40% areas in regards to socio-economic performance, while Jerilderie fits in the highest 30% areas. Berrigan has higher levels of unemployment, lower skills levels and less economic resources than Jerilderie (Figure 16).
FIGURE 16 SEIFA SCORES FOR BER RIGAN AND JERILDERIE
Source: ABS, SEIFA 2011
Lower scores indicate that an area is relatively disadvantaged compared to an area with a higher score. For deciles, all areas are ordered from lowest to highest score, the lowest 10% of areas are given a decile number of 1 and so on, up to the highest 10% of areas which are given a decile number of 10. Note that deciles have equal number of areas, not people.
NSW Local Government Areas: Similarities and Differences
All LGAs in NSW were compared and clustered on the basis of a range of socio-economic characteristics by NIEIR in 2014. The study is relevant as it contributed to Berrigan being identified as a low rate base council at risk.

30
www.sgsep.com.au
The NIEIR study indicates the clustering of LGAs in NSW was undertaken for the purpose of inviting representatives to discuss common challenges (not necessarily to identify councils at risk). Fourteen clusters were developed to yield groups with similar community characteristics and challenges. The number of clusters was intended to be restricted into a ‘manageable number of clusters’ (p.9). Variables used in the decision tree for clustering are: The share of Aboriginal/Indigenous population (30% or more are labelled Aboriginal LGAs)
The share of population speaking other languages than English at home (50% or more are labelled
multicultural LGAs)
The average rate base per residential property that is more than $400,000 (high-income, high
wealth LGAs)
A total rate base of less than $0.65 billion (low rate base LGAs)
A total rate base is greater than $0.65 billion
A significant dependence on rural and pastoral land use (farm or pastoral property 50% or more of
rate base)
More than 50% of population having completed year 12 (academically inclined)
Less than 50% of population having completed year 12 (diverse skills).
Berrigan and Jerilderie were both classified as LGAs with low rate bases. This cluster is also referred to as ‘farm LGAs’ as the majority has a rate base with over 50% in farm and pastoral properties. Berrigan is one of the five exceptions but was nonetheless included in the cluster. The exceptional condition for Berrigan is that less than 50% of the rate base is in farm and pastoral properties (48%). Berrigan has benefitted from retirement migration from Victoria which contributed to a more diverse rate base. Also, Berrigan is close to being considered ‘academically inclined’. Due to its size and rural location Berrigan was included in this cluster and not in the ‘diverse skill urban cluster’. Common challenges for this cluster are: Maintaining basic services and infrastructure, particularly roads
Provision of educational services and equality of educational opportunity
Dealing with population decline and ageing
Supporting rural industry including water management (floods and droughts).
Berrigan does not have a declining population, but its population is ageing in line with many other municipalities. The LGA adjacent to Berrigan, Corowa Shire Council, was clustered as being ‘diverse skill urban’, which has a population of about 10,000 residents. Cluster analyses can be useful to explore the similarities and differences within a ‘population’, in this case the municipalities in NSW. The NIEIR report describes where LGAs were sometimes re-clustered on what the researchers saw as being the ‘best fit’. This was also done with Berrigan when it was clustered in the ‘low rate base’ cluster. All LGAs were assessed on a number of variables, and the table below lists some of key findings for the two Shires. Between brackets is the cluster number for each variable.

31
www.sgsep.com.au
Berrigan
Jerilderie
Recent population growth Population more or less stable, overseas arrivals balance out emigration (5)
Rapid population decline (9)
Age structure Low young adult retention rate, and high rate of (very) old people (6)
Low young adult retention rate, and high rate of (very) old people (6)
Projected population growth 2012-40
Inland shires with low population growth and moderate ageing (8) Population decline after 2025 coupled with moderate ageing (8) Note: see observations
Inland shires with low population growth and moderate ageing (8) Population decline after 2025 coupled with moderate ageing (8)
Household structure A diverse and large number of communities that score close to the state average (5)
A diverse and large number of communities that score close to the state average (5)
Birthplace Virtually all residents are Australia born (8) Note: see observations
Virtually all residents are Australia born (8) Note: see observations
Religion Mainline Protestant denominations (around half) and about a third Catholic. Other religions mostly absent (8)
Mainline Protestant denominations (around half) and about a third Catholic. Other religions mostly absent (8)
Language Virtually all households only use the English language (8)
Virtually all households speak English, with a small number speaking European languages (5)
Knowledge economy indicators Low scores on indicators for knowledge economy and mostly rural and inland councils (8)
Low scores on indicators for knowledge economy and mostly rural and inland councils (8)
Accessibility of entertainment
Education Low Year 12 achievement, few persons born overseas and low proportions of professionals coupled with moderate adolescent educational attendance. (6) Note: see observations
Low Year 12 achievement, few persons born overseas and low proportions of professionals coupled with moderate adolescent educational attendance. (6)
Labour market indicators. Moderate unemployment and social security take-up, low hours worked and high part-time employment (3)
Moderate unemployment and social security take-up, high hours worked and high full-time employment (6)
Household incomes Middle income LGAs. Wages contribute about a third to disposable income and about a quarter from small business. High reliance on benefits (8)
Pastoral shires with lower incomes. Wages contribute about a third to disposable income, small business more than a third with around 10 percent from property (9)
Dwellings Low level of housing mobility and tenancy, and highest levels of outright home ownership (8)
Low level of housing mobility and tenancy, and highest levels of outright home ownership (8)
Household wealth Low wealth, mainly from property and business with heavy liabilities, and reasonable growth of wealth (5)
Moderate wealth in financial assets, property and business. Moderate liabilities and growth of wealth (7)
Rate base Farmland and towns. Moderate undeveloped capital value (UCV) of around $125,000. Business contributes to rate base (~10%) (5)
UCV per residential property is low to very low (average $30,000), farmland is main contributor, with little from business (9)
Transport High car ownership, moderate levels of working at home, reliance on travel to work by car, and negligible public transport (6)
High car ownership, negligible public transport use and high proportions working on the property (low reliance on car travel to work) (8)
32
www.sgsep.com.au
Some of the observations on the basis of these findings are: Projected population growth: For Berrigan the NIEIR report projects population decline after 2025.
This is however contradicted by historic trends and the projections by ID Consulting referred to
earlier in this report.
Birthplace: Both Berrigan and Jerilderie were clustered as nearly all residents being Australia born.
However, the share is below 90% according to Census data, which would classify both Councils
under cluster (6).
Education: The report notes that Berrigan scores close to the state average in regards to Year 12
achievement. The Year 12 completion rate is based on all population aged 15 and over. Given the
aged demographic of Berrigan and the fact that completion rates are higher among younger
population, the result of Berrigan is skewed towards less academically inclined.
Birthplace and Religion are two variables that correlate strongly.
Taking the above observations into account Berrigan and Jerilderie are similar in regards to 7 variables: Age structure
Household structure
Birthplace
Religion
Knowledge economy indicators
Education (arguably Berrigan differs somewhat here)
Dwellings.
The two Shires differ in regards to 8 variables: Recent population growth: Berrigan’s population is growing at a low pace, while Jerilderie’s
population is declining at a moderate pace.
Projected population growth (based on observation): Berrigan’s population is projected to continue
to increase while Jerilderie’s population is projected to continue to decrease.
Language: while English is by far the most spoken language at home, in Berrigan there are also
European languages spoken at home.
Labour market indicators: Berrigan has higher unemployment and underemployment than
Jerilderie.
Household incomes: Berrigan has higher incomes but also higher dependency on benefits.
Household wealth: household wealth in Jerilderie is higher, while businesses in Berrigan have higher
liabilities.
Rate base: the rate base in Berrigan is based on higher value properties (UCV) and on a mix of
agricultural, residential and business properties. Jerilderie’s rate base is based on low property
values with agricultural uses.
Transport: Berrigan relies on commuter travel, by car, to nearby municipalities, while Jerilderie has a
lower car dependency.
Relationships between LGA communities arise from the need to access services, jobs and education. There is a geographic hierarchy across towns in the level of service they provide, with larger towns generally providing for a wider range and for higher level services than smaller towns. All LGAs were classified in terms of their position in the hierarchy of education provision and ease of access to education within commuting distances. LGAs on the border with for instance Victoria, such as Berrigan, generally have improved access due to the option of interstate commuting.

33
www.sgsep.com.au
The following relationships included relevant information for Berrigan and/or Jerilderie: Education. Berrigan was classified in a group of LGAs (cluster 8) with no or very limited secondary
schools, with limited TAFE facilities and secondary schooling mostly being provided in adjacent
LGAs. Jerilderie was classified (cluster 9) as lacking both tertiary and secondary education facilities.
Health services. In terms of health services, access to hospitals was found as the most discerning
factor for LGAs. Berrigan was classified as (cluster 5) having a small hospital, and Jerilderie as
(cluster 6) having a very small hospital.
Employment placement services. There was no reporting on Berrigan, while Jerilderie was
identified as lacking an employment agency.
Commuter flows. It reports that Berrigan has many people commuting to Moira for work.
Cross border relationship. Berrigan was classified as relying on neighbour LGAs for employment and
having high rates of cross border migration. Berrigan also has relatively many retail jobs relative to
its population (red: which can be explained by the thriving tourism sector attracting shoppers from
elsewhere). Jerilderie was classified as not relying on neighbours for employment and not having
close migration ties with nearby LGAs. It may also attract shoppers and light inbound commuting.
Berrigan has towns close to the Murray River and more inland. It has cross border migration to and
from Moira, although not as strong as Corowa, and with Shires to the north, Jerilderie and Conargo.
Some of the observations on the basis of these findings are: Berrigan is economically and functionally interrelated to nearby LGAs. Our analysis of Place of Work
statistics indicate Berrigan has important economic ties with Moira (Vic).
Jerilderie has a self-contained agricultural economy with weak links to nearby municipalities.
The Berrigan population continues to grow (at a slow pace to NSW standards) which is enabled by
growth in tourism, retail and employment links with adjacent LGAs, especially Moira.
The Jerilderie population continues to decline while the economy continues to be focussed towards
agriculture.
The rate base of Berrigan is moderate, coming from agriculture, residential and business uses. The
rate base of Jerilderie is low and depending on agricultural uses.
While Berrigan has limited education facilities within the LGA, it has good access to facilities in
Victoria.
Overall, the analysis shows that Berrigan and Jerilderie share a number of similarities, but also a significant number of differences and these relate primarily to: Population change
Community (education) and economic outlook and relation with nearby LGAs, especially Moira, and
Rate base.
Community strategic priorities
This subsection distils the key issues and priorities that each of the Shire’s Community Strategic Plans enunciate and then assesses their commonalities and differences.
Berrigan Shire 2023 Community Strategic Plan – Creating our preferred future
Berrigan Shire 2023 Community Strategic Plan formulates the vision for the Shire: “In 2023 we will be recognised as a Shire that builds on and promotes our natural assets and advantages to create employment and economic activity to attract residents, families and tourists.” Berrigan’s key assets are:

34
www.sgsep.com.au
Lifestyle
The Murray River
Irrigated agriculture, and
Tourism.
The four strategic outcomes are: 1. Sustainable natural and built landscapes 2. Good government 3. Supported and engaged communities, and 4. Diverse and resilient business. The strategic outcomes for sustainable ‘natural and built landscapes’ are to: Support sustainable use of our natural resources and built landscapes Retain the diversity and preserve the health of our natural landscapes and wildlife Connect and protect our communities. Some of the priorities are to establish partnerships with National Parks, invest in town entrances and the visual amenity of streetscapes, preserve and develop local heritage and history, and invest in the Shire’s critical infrastructure. The strategic outcomes for ‘good government’ are to: For Berrigan Shire 2023 objectives and strategies inform Council planning and community led
projects Ensure effective governance by Council of Council operations and reporting, and Strengthen strategic relationships and partnerships with community, business and government. Some of the priorities are to implement the Integrated Management System, engage the community in implementation of projects and initiatives and to engage in regional initiatives and coordination. The strategic outcomes for ‘supported and engaged communities’ are to: Create safe, friendly and accessible communities Support community engagement through life-long learning, culture and recreation. Some of the priorities are to enhance community transport, share facilities and resources (potable water, public health and safety services), market lifestyle, plan for an ageing population, celebrate achievements of young people and upgrade existing sporting facilities. The strategic outcomes for ‘diverse and resilient business’ are to: Invest in local job creation, retention and innovation Strengthen and diversify the local economy Diversify and promote local tourism Connect local, regional and national road, rail and aviation infrastructure. Some of the priorities are to develop freight and industry infrastructure (Tocumwal Intermodal Facility and Tocumwal Aerodrome), upgrade National Hwy 39 to Tocumwal, incentives for new and existing businesses, develop retail/commercial/industrial precincts of Barooga, and to promote event based tourism and tourism in general.

35
www.sgsep.com.au
Jerilderie Shire Council Community Strategic Plan 2014-2024
The Shire’s community vision is: “We are blessed with a strong and vibrant community, a resilient economy and an environment that provides us both enjoyment and productivity. As a community we offer diverse opportunities, exciting possibilities and a strong sense of belonging. We possess an identity that reflects our rich history, our focus on the land, and our hope for the future. Together, we will make our shire the place to be in the year 2030.” The strategic directions of the strategic plan are: a) An economy that provides opportunities and stability for our shire and our families b) Infrastructure that is responsibly planned, developed and maintained c) A supportive, active and passionate community d) An environment that is valued, protected and respected e) Effective and productive relationships with all levels of government. The strategic outcomes for ‘An economy that provides opportunities and stability for our shire and our families’ are: A strong tourist sector A profitable and growing business and industry community A community that has access to education and training that enhances their future opportunities A resilient and vibrant agricultural sector Infrastructure that supports growth and productivity of our businesses and industry. Some of the priorities are the development of a long term tourism strategy, improved access to training and education, long term water security for agriculture and infrastructure to support commercial and industrial businesses. The strategic outcomes for ‘Infrastructure that is responsibly planned, developed and maintained’ are: Infrastructure that supports our community identity (this refers to visual amenity and historic
buildings and landmarks) The ability to be an active community (infrastructure for sport and recreation) A safe and accessible shire to travel, and Infrastructure for our future. Some of the priorities are conservation of historic assets, safe local roads, the implementation of a footpath strategy, upgrade of the swimming pool, Jerilderie Recreation Master Plan and land use practices. The strategic outcomes for ‘A supportive, active and passionate community’ are: An empowered community Vibrant community events and celebrations A safe and accessible community A community that has opportunities for people of all ages Protection of our history and heritage. Some of the priorities are volunteerism, sustainable clubs and organisations, celebrations of achievements, opportunities for lifelong learning and protection of history and heritage. The strategic outcomes for ‘An environment that is valued, protected and respected’ are: Efficient and responsible waste water management and recycling services

36
www.sgsep.com.au
Respect an protection of our natural environment Waterways which are appreciated and valued Protection of native flora and fauna. Some of the priorities are waste management, recycling, high quality waterways and protection of flora and fauna. The strategic outcomes for ‘Effective and productive relationships with all levels of government’ are: A community that is passionate and engaged in its future Accessible, effective and utilised services and programs for our community Productive and beneficial relationships Strong and effective local government. Some of the priorities are to host annual ‘Partners Meeting’ with Urana Shire regarding service delivery and strategic direction, a community engagement strategy, representation of community at State level, a community services database and an Municipal Emergency Management Plan. Many strategic outcomes and objectives of the Jerilderie Strategic Plan are generic and non-specific, and often outside the direct influence of the Shire to influence.
Comparison of community strategic plans
The community plans are similar in regards to the important role of land and the river in the local economies and identities, ageing of population and lifelong learning, recreation, local history, support for local businesses and industries, and tourism. A key difference between the community strategic plans is that Berrigan appears more intent on growing and expanding, while Jerilderie appears to be more focussed on stability and preventing decline. The Berrigan plan has a focus on enabling investment in key infrastructure and in precinct development for economic growth and diversifying the economy, and with aims to intensify resource sharing. Jerilderie is less specific in its aims and objectives, and appears also to be interested in strengthening its relation with Urana Shire in relation to service delivery and strategic direction.
Conclusions functional linkages and socio-economic characteristics
The analysis of functional linkages and socio-economic characteristics, provide useful insights in regards to a number of the ILGRP criteria for determining future local government boundaries, in particular with respect to: Integrated planning. Boundaries should enable integrated planning and regional development on
the basis of strong economic and social relationships. In terms of integrated planning and regional development, while both economies have a strong agricultural base, Berrigan has a strong focus on tourism, transport and warehousing as well. While Jerilderie is mostly self-contained in terms of employment and migration, Berrigan is committed to diversifying the economy, growing tourism and transport related activities, and therefore the focus lies on the Murray River and linkages with Victoria. Berrigan shares important linkages with nearby councils on the border of the Murray River, Moira in particular. Berrigan has migration linkages with Victoria and other urban centres. The intermodal hub at Tocumwal plays a function role for the wider region which includes parts of Victoria. Tourism

37
www.sgsep.com.au
in Berrigan gravitates towards Tocumwal and Barooga (Murray River), while Jerilderie – with a weak focus on tourism – links with other Riverina councils.
In terms of coordinated service delivery, Jerilderie depends on a range of services (health, art, federal services and some tertiary education) provided in Berrigan, and for higher order services it relies on Albury-Wodonga mostly (tertiary education, larger hospital, air travel). In that sense, Berrigan and Jerilderie form a functional region for the lower order sub-regional services.
Local identity and sense of place. Berrigan and Jerilderie share some aspects of identity and sense
of place, both being agricultural areas with a long and treasured history. Berrigan’s identity however is also formed by the Murray River. The socio-economic profiles of Berrigan and Jerilderie are highly similar but differ in a number of areas. Some key differences, which were confirmed by the NIEIR cluster analysis, include labour force participation, education and occupation, self-containment, socio-economic disadvantage (including income), access to economic resources, and the rate base. While the community strategic plans reflect some commonalities, key differences especially in terms of volunteering, Murray River, lifestyle and growth versus stability, relations with nearby LGAs.
Population growth. The boundary of the LGAs can comfortably accommodate projected population
growth over the next 25 years. Having said this, Berrigan is projected to continue to experience a low level of population growth and a further ageing of population (ID Consulting). This is contrary to the projections used by NIEIR which report a future decline in Berrigan’s population. Jerilderie however, is expected to continue to experience moderate population decline as well as ageing. An amalgamation would result in an area developing in quite opposite directions: one area with population growth and related increases in property values and rate base, while the remainder would experience population decline and a weak or deteriorating rate base.
Accessibility. Most if not all of Berrigan’s and Jerilderie’s boundaries would be accessible from Berrigan (as the assumed administrative centre in case of an amalgamation) within 90 minutes.
Strong centre. The two main centres in Berrigan are Finley and Tocumwal. Together with Berrigan
these towns would provide most of the sub-regional commercial, education, administrative, health and other services if the two Shires were to merge.
Key infrastructure. Some key infrastructure for the wider region is located in Berrigan, especially the
Tocumwal intermodal hub.
Combining existing municipalities. If an amalgamation between the two Councils was proceeded with it would not obviously require boundary adjustments with other LGAs, which would lead to additional cost and disruption.

38
www.sgsep.com.au
3 FINANCIAL APPRAISAL
This section independently reviews the baseline financial projections for Berrigan, i.e. on a standalone basis, as well as how these baseline forecasts are likely to be reflected in performance levels with respect to the OLG financial benchmarks. This is a headline/ key assumptions review. Following this, the potential financial savings that might be generated by the proposed merger of BSC and JSC are examined. Initially this is done on an unconstrained basis to highlight the potential extent and composition of financial savings. Relevant factors identified in Sections 263(3) and Section 218CA of the Local Government Act 1993 are then assessed to see how they might compromise any forecast savings. Key non-financial items are then identified and qualitatively scaled for both the standalone and amalgamation options.
Standalone long term financial plans/ projections
The chart below provides the income statement projections for Berrigan Shire’s general fund, based on Council’s LTFP for the 10 year period ending 30 June 2025. It is projected that Berrigan will return a positive operating result from Council’s continuing operations in the first 9 consecutive years, though the operating surplus diminishes over time. In particular, Council forecasts a sharp fall in its operating profit from 2015/16-2016/17 due to the projected decline in capital grants.
FIGURE 17 TEN YEAR F INANCIAL PROJECTION ($’000) , 2015 /16-2024/25
Source: Berrigan Shire Council 2015
(500)
-
500
1,000
1,500
2,000
2,500
3,000
3,500
4,000
4,500
-
2,000
4,000
6,000
8,000
10,000
12,000
14,000
16,000
18,000
2015/16 2016/17 2017/18 2018/19 2019/202020/21 2021/22 2022/23 2023/24 2024/25
Operating income (LHS) Operating expenses (LHS) Net Operating Result (RHS)

39
www.sgsep.com.au
Key assumptions underpinning the above forecast are summarised in the table below.
TABLE 6 KEY LTFP ASSUMPTIONS
Changes over previous year after applying all changes (including individual changes)
Operating Income 2015/16 2016/17 2017/18 2018/19 2019/20 2020/21 2021/22 2022/23 2023/24 2024/25
Rates & Annual Charges 2.0% 2.4% 2.4% 0.7% 2.5% 2.5% 2.5% 2.5% 2.5% 1.3%
User Charges & Fees -8.2% 2.8% 3.0% 3.3% 3.0% 3.3% 3.1% 3.3% 3.1% 3.2%
Interest & Investment Revenue -0.1% -0.1% 0.3% 0.3% 0.3% 0.3% 0.3% 0.3% 0.3% 0.3%
Other Revenues -17.6% -2.5% 2.5% 2.7% 2.5% 2.7% 2.6% 2.6% 2.6% 2.6% Grants & Contributions provided for Operating Purposes -3.5% -0.3% 1.8% 1.8% 1.8% 1.8% 1.8% 1.8% 1.8% 0.0% Grants & Contributions provided for Capital Purposes 115.7% -91.6% -28.9% 26.8% -15.3% -8.3% -9.3% -10.6% -17.3% 57.4%
Operating Expenditure
Employee Benefits & On-Costs -1% 2% 3% 3% 3% 3% 3% 3% 3% 3%
Borrowing Costs 36% -18% -13% -12% -15% -18% -23% -31% -48% -86%
Materials & Contracts -22% -1% 4% 4% 4% 3% 3% 3% 3% 4%
Depreciation & Amortisation 3% 3% 3% 3% 3% 3% 3% 3% 3% 3%
Other Expenses -11% 6% 1% 4% 3% 3% 3% 3% 3% 3%
Source: Berrigan Shire Council 2015
Overall, according to the projections, the long term position of Council is expected to slowly improve into the future, and satisfy the OLG Benchmarks with the exception of own source revenue which needs to be considered in the context of rural council operations. The long term financial projections were reviewed by Graeme Fleming - a subcontractor to SGS - in regards to their likely reasonableness, the implications for the long term financial position of Council, and any assumptions or issues that may affect the projected results in an adverse way and which therefore may be queried by stakeholders. This independent review highlighted that:
While both the Income Statement and Balance Sheet for the General Fund show aggregated headings, the key assumptions for global changes and changes over previous years in the LTFP provide a slightly better indication of the specific treatment of items and trends.
The global assumptions underlying the LTFP generally appeared reasonable. However, the following specific observations were made identifying some apparent inconsistencies.
“Interest and Investment Revenue shows small increases from 2015/16 ($338,000) through to 2024/25 ($345,000), yet under the Balance Sheet Current Assets, Investments increase from $6,795,000 in 2015/16 to an estimated $10,060,000 in 2024/25. There is also a gradual increase in retained earnings of $5,300,000 during this period.” Council has responded to this observation by highlighting that Council now budgets conservatively for interest revenue, i.e. so that it isn’t spent until received. Indeed this is why the operating result declines over the life of the LTFP. “Employee Benefits and on costs show a reduction of $6,474,000 from 2013/14, to $3,508,000 2014/15 to $3,488,000 in 2015/16 and then show a steady consistent increase in future years”.

40
www.sgsep.com.au
Council has responded by pointing out that this reflects the retirement of long term staff in an aging workforce.
“Whilst the impact is unknown, it should be noted that the revaluation of Roads Assets in 2015/16 may affect a number of financial indicators and the LTFP. Revaluation of other assets such as water, sewer, land and buildings will also follow in future years”. Council has responded by agreeing with this and stating that this is an ongoing cycle of revaluation. Pointing out that this reflects the retirement of long term staff in an aging workforce.
The results may be adversely affected by such things as federal and state government decisions and legislation, major global events, natural disasters, etc.
Other issues that might also be raised by independent observers are likely to include: future policy decisions of Council; future capital works; future services and service levels.
Appendix A includes a more extensive list of some of the key assumptions utilised in Council’s financial projections, with more explanation provided by Council for the bulk of these assumptions.
Standalone OLG financial benchmark projections
BSC has completed a self-assessment against the FFTF benchmarks identified by OLG, using the financial forecasts above. The results are shown in the figures overleaf. Based on BSC’s self-assessment, Council will meet six out of the seven OLG benchmarks over the period from 2016/17-2019/20. The only exception is the own source revenue ratio. According to OLG’s requirements, councils need to be able to generate more than 60% of their operating revenue from its own sources (e.g. rates), however Berrigan can only generate around 53% of its operating revenue itself with the rest relying on external sources (e.g. grants & contributions) . The standalone OLG financial benchmark projections were independently reviewed, again by Graeme Fleming, in regards to Council’s likely future performance, the alignment with OLG expectations and underlying assumptions, treatments or items that may adversely affect the results. This independent review concluded that: “Given Council’s current performance and LTFP, the performance against the OLG benchmarks is likely to show a positive trend in the future, that align with the expectations of OLG with the exception of own source revenue”. Council has further emphasised that the difference between the current and forecast OLG performance indicators is mainly due to two significant factors:
The Council has reduced long term operating expenses by about $250,000 pa to reflect the permanent reduction in the level of the Financial Assistance Grant, and
The Council has reduced its level of budget conservatism, i.e. increased anticipated interest revenues recognised some sales of bulk water etc.

41
www.sgsep.com.au
FIGURE 18 FFTF ASSESS MENT OF BERRIGAN’S C URRENT PERFORMANCE
Source: Berrigan Shire Council 2015
FIGURE 19 FFTF ASSESSMENT OF B ERRIGAN’S FINANCIAL PROJECTIONS, 2016 /17-2018/19
Source: Berrigan Shire Council 2015
FIGURE 20 FFTF ASSESSMENT OF B ERRIGAN’S FINANCIAL PROJECTIONS, 2017 /18-2019/20
Source: Berrigan Shire Council 2015
BENCHMARK RESULT
MEETS FFTF
BENCHMARK
0.057 YES
Own Source Revenue Ratio (greater than 60% average over 3 years) 52.60% NO
101.37% YES
Infrastructure Backlog Ratio (less than 2%) 0.98% YES
Asset Maintenance Ratio (greater than 100% average over 3 years) 102.55% YES
Debt Service Ratio (greater than 0 and less than or equal to 20% average over 3 years) 1.58% YES
Decreasing YES
Building and Infrastructure Asset Renewal Ratio (greater than 100% average over 3 years)
A decrease in Real Operating Expenditure per capita over time
Operating Performance Ratio (greater or equal to break-even average over 3 years)
BENCHMARK RESULT
MEETS FFTF
BENCHMARK
0.047 YES
Own Source Revenue Ratio (greater than 60% average over 3 years) 52.72% NO
103.39% YES
Infrastructure Backlog Ratio (less than 2%) 0.98% YES
Asset Maintenance Ratio (greater than 100% average over 3 years) 102.05% YES
Debt Service Ratio (greater than 0 and less than or equal to 20% average over 3 years) 1.45% YES
Decreasing YES
Building and Infrastructure Asset Renewal Ratio (greater than 100% average over 3 years)
A decrease in Real Operating Expenditure per capita over time
Operating Performance Ratio (greater or equal to break-even average over 3 years)

42
www.sgsep.com.au
Projected financial savings (unconstrained)
A key focus of this projection is to estimate the potential expenditure savings for the merger option against the status quo (no merger) of BSC and JSC. The merger savings calculated and presented are the savings compared to BSC and JSC as two stand-alone Councils. To this end, two scenarios have been modelled to estimate expenditure savings:
Scenario 1: Lead council model: This approach uses a BSC’s per capita costs and applies these to the population of Jerilderie. This implies that both BSC and JSC adopt Berrigan’s systems and processes, where applicable. If it is the case that some of JSC activities are different to BSC (e.g. operating activities associated with planned capital expenditure in JSC) then this scenario assumes that those activities will not go ahead (since it is not reflected in the lead council’s per capita expenditure). However, this cannot be clearly ascertained without completing a detailed review of service levels, and service quality.
Scenario 2: Average efficiency (economies of scale) model: This approach is statistical and uses a multi-variable regression model that examines the relationship between total per capita expenditure and population (controlling for road assets which represents geographic dispersion and regional variations) for councils in New South Wales and Queensland. Service cost savings are then derived by comparing predicted aggregate expenditure prior to merging with the predicted aggregate expenditure post amalgamation. Scenario 2 reflects the average efficiencies that may be achieved through amalgamation and reflects the potential efficiencies relating to a larger council. On average, all else being equal, the model predicts that the larger the new council, the greater the expected savings in the medium to long run, after transition costs have been met. However, the larger the geographic dispersion, the lower the predicted scale economies. That is, the impact of both scale (population), which increases scale economies, and geographic dispersion, which reduces scale economies, are jointly examined by this model.
Key assumptions and caveats
One of the key assumptions behind the lead council model is that merged councils are able to generate savings by adopting a lead council’s systems and processes. However, not all services are likely to generate savings, as certain unique services might need to be retained under amalgamation. For instance, if an existing council provides a service of regional significance (servicing a larger catchment than its own), this may need to be retained under amalgamation. For a high-level study such as this, SGS has used simple regression models of population and per capita expenditure of NSW councils to ascertain which functions are likely to be able to adopt the reference council’s systems and processes. That is, if the regression analysis shows that larger populations are associated with lower per capita costs for a specific service, then it is plausible that this service could adopt systems and processes of the lead council. There could, of course, be exceptions to this. It is difficult to establish whether one council’s systems and process could be rolled out across other areas without doing an extensive service-level review across all council areas being considered. Based on the simple regression analysis of NSW councils (by service area), SGS has assumed that five (out of 13) service areas have the potential to experience efficiencies, and therefore adopt the per capita expenditure of the lead council4. This is a necessary assumption, given the high-level nature of this study. The following five areas have potential for efficiency savings:
4 Though Transport and Communication is has the potential to generate savings, it is excluded due to issue with data quality. SGS
was advised by BSC staff that Transport and Communication operating expenditure tends to include some capital expenditure works in progress.

43
www.sgsep.com.au
Governance
Administration
Housing and community amenities
Recreation and culture
Economic affairs. BSC per capita expenditure has been applied to the combined population of Jerilderie and Berrigan to derive expenditure estimates under amalgamation for five out of the five services identified above. The only exception to this is governance, where it has been assumed that the merged entity has seven Councillors. Using Berrigan’s governance expenditure, this implies savings from one less Councillor ($8000 per annum), and savings from Jerilderie’s total governance savings ($1.8 million per annum at FY 2016). It should also be noted that the expenditure savings only include those arising from wages and on-costs, and materials. Depreciation, and interest payments are excluded. Following are a set of additional assumptions applied to all scenarios in this study:
Transition period: it is assumed that cost savings only commence four years from now (FY 2016) in FY 2019. This encompasses a transition period where council cost structures gradually move to merged structures where economies of scale apply.
Merger costs: There are likely to be transition costs to change systems and processes following a merger. SGS undertook a number of case studies to understand the findings of mergers for councils in the UK, New Zealand and Queensland. For this study, findings from the UK case study are used to estimate the cost of transition (2.8 percent of base case expenditure). This includes both systems and processes, and redundancies.
Operating expenditure projections: Expenditure savings are assumed to grow in line with projected Long Term Financial Plan (LTFP) expenditure growth rates for each council.
Discount rate: The discount rate is used to measure the present value of future flows of money and takes into account not just the time value of money, but also the risk or uncertainty of future cash flows. This is used in Discounted Cash Flow (DCF) analysis as a way to translate future cash flows to the present. A high discount rate reduces the present value of future flows, while a low discount rate increases the present value. A nominal discount rate of 5.5% per annum is used in the cash flow model, as all cash flows are in nominal terms.
Given the high-level nature of this financial analysis, it is worth reiterating that the expenditure savings estimates are preliminary only and that the following caveats apply:
Savings from governance are based on a high-level assumption regarding the nature of the future entity. This is ultimately at the discretion of the merging parties, and the administration of a future entity.
Since a detailed service review has not been completed, differences in services levels and/or quality are not explicitly considered. For instance, a council may provide a service of regional significance, which is not comparable with services provided by another council. This may impact services relating to environment, and recreation and culture.
Salary equalisation of merging councils has not been explicitly considered here. On the revenue side, rates related impacts have not been explicitly modelled either.

44
www.sgsep.com.au
An SGS review of the expenditure by service function of BSC and JSC shows that there are some differences in the allocation of expenditure to each service function. Berrigan Shire Council have aligned their expenditure classifications with Jerilderie’s as best possible. However, we believe that there are still differences in service category definitions. For instance, SGS was advised by BSC staff that Transport and Communication operating expenditure tends to include some capital expenditure works in progress. Issues relating to data quality implies that savings by function in Scenario 1 should be interpreted as indicative estimates only.
Modelling processes
For the lead council model, pre-merger operating expenditure for each option is compared with post-merger expenditure to derive financial savings. For the average efficiency model, predicted pre-merger expenditure is compared with predicted post-merger expenditure, to derive a percentage reduction in total expenditure, which is then applied to the base case expenditure of that option, to derive financial savings. These post-merger cost savings for FY ending 2016 are then modelled in a Discounted Cash Flow (DCF) framework over the next 10 years. Using a nominal discount rate of 5.5 percent – which broadly reflects the Weighted Average Cost of Capital (WACC) for NSW councils; all future cash flows are translated to present values at FY ending 2016. As noted earlier, the merger costs for each option occur over three years (2016 to 2018) of the analysis, and savings commence in 2019. The merger costs shown in TABLE 7 is the total of expenditure over three years.
Modelling results
TABLE 7 shows the results of the high-level financial modelling for the lead council and average efficiency scenarios. Given the difference in per capita expenditure of Berrigan and Jerilderie5 (which reflects Berrigan’s comparative scale and efficiency of operations), there is potential for savings in administration ($8.9 million over 10 years), and economic affairs ($2.07 million over 10 years). These savings assume rationalisation of buildings, staff, methods, systems, and supplier contracts to achieve efficiencies observed at Berrigan. In aggregate, this scenario expects $12.5 million in savings over 10 years (or $1.25 million per annum on average). The lead council scenario also assumes reduction in duplication, and is not constrained by LGA Act (1993) specifications (see Scenario 3). From a methodological point of view, since the reference council modelling approach assumes that JSC adopt BSC per capita expenditures, it follows that the majority of efficiencies and savings would come from Jerilderie. In other words, the modelling approach implies unchanged expenditure for BSC functions. Scenario 2 average efficiency modelling, which estimates the potential for savings from economies of scale, shows very little financial savings under the merger option. This is because the increase in population from Jerilderie joining with Berrigan (approximately 1500 in FYE 2016) is not large enough to compensate for the increase in geographic dispersion (80 percent increase in road length). In present value terms, this is around $1.42 million over ten years or 1.2 percent of the base case expenditure of the two unmerged councils. This suggests that a merged entity is unlikely to generate significant pure efficiencies from scale alone.
5 Based on FY 2016 estimates, this is $960 for Berrigan and $5526 for Jerilderie. Note that these estimates exclude Water and
Sewer expenditure, as well as depreciation and amortization.

45
www.sgsep.com.au
TABLE 7 . NPV ($ THOUSANDS) OF POTENTIAL COST SAVINGS – SCENARIOS 1 AND 2 10 year PV at FYE 2016 ('000)
Scenario 1: lead council model New expenditure
Merger cost -$377
Expenditure savings Governance $678 Administration $8,963 Public Order & Safety $0 Health $0 Environment $0 Community Services $0 Housing & Community Amenities $274 Recreation & Culture $892 Fuel & Energy $0 Agriculture $0 Mining & Construction $0 Transport & Communication $0 Economic Affairs $2,078
Scenario 1 - lead council model: savings $12,508 Scenario 1 - lead council : share of base case 10.8%
Scenario 2 - average efficiency: savings $1,692 Scenario 2 - average efficiency : share of base case 1.2%
Source: SGS, 2015. Note that all estimates (and growth rates) exclude depreciation.
Legislative framework analysis financial savings
In this section SGS has modelled financial savings from the proposed merger taking into account factors that should be considered when contemplating boundary changes, as per Section 263 (3) and Section 218CA of the Local Government Act 1993. SGS has assumed one forced redundancy at the executive level (General Manager only), but all other staff rationalisation is with natural attrition only. In addition, SGS has assumed that no change to building and assets. Specific assumptions are detailed below.
Executive level redundancies are savings generated by removing duplication. These estimates are based on salary structures at BSC, but only apply to the General Manager.
Attrition rates are based on data provided by both BSC and JSC. These attrition rates are applied to employee costs to derive savings. This assumption implies that whilst there are no redundancies at the non-executive level, a hiring freeze persists over the period of the modelling.
There are currently 15 councillors in both BSC and JSC. Based on advice from BSC, it assumed that the merged entity would have seven councillors (as in Scenario 1). This implies that there are savings from having fewer Councillors (at $8000 per councillor per annum), which are shown in Other Expenses.
Since it has been assumed that council offices and facilities at Berrigan and Jerilderie remain, there are no explicit savings from building and asset rationalisation.
Assumptions regarding merger costs, transition period, growth in savings, and discount rate are as above.

46
www.sgsep.com.au
TABLE 8 . LEGISLATIVE FRAMEWOR K SCENARIO - ASSUMPTIONS
Assumption Source
Executive rationalisations General Manager $171,492 Based on BSC pay structure provided. Attrition rates - applied to Employee costs (excl. executive)
BSC 6.59% Using current attritions provided by BSC JSC 5.45% Using probable attritions provided by JSC
Efficiency on materials and contracts 5.0% Based on likely joint utilisation
Governance 7 councillors Based on advice from BSC
Buildings and assets No change
The modelling shows that there is potential for around $3.4 million savings (over 10 years) from staff rationalisation – assuming one executive redundancy (general manager only) and a freeze on hiring of non-executive staff; and around $1.2 million in savings over 10 years from materials and contracts. Unlike Scenario 1, since the modelling approach does not assume JSC adopting BSC systems and processes (implicit in their per capita expenditure) it is not possible to identify the likely major recipient of savings. In other words, each area is equally likely to experience efficiencies in this scenario. As before, these savings commence in FY 2019 (four years from FY 2016), and merger costs (including additional executive redundancies) occur over the first three years of the analysis. Overall, the legislative framework modelling shows savings of around $4.45 million over 10 years (or ~$445,000 per annum, on average). This is around 3.8 percent of base case/ standalone operating expenditures.
TABLE 9 . LEGISLATIVE FRAMEWOR K FINANCIAL SAVINGS - SCENARIO 3
10 year PV at FYE 2016 ('000)
Employee Costs $3,424
Materials & Contracts $1,189
Borrowing Costs $0
Depreciation & Amortisation $0
Other Expenses $374
Loss from Disposal of Assets $0
Merger costs -$377
Additional executive rationalisation cost -$162
Scenario 3 - legislative framework scenario : savings $4,448
Scenario 3 - legislative framework scenario : share of base case 3.8% Source: SGS, 2015. Note that all estimates (and growth rates) exclude depreciation.
Comparison of financial savings scenarios
The table below compares the savings estimated under each scenario. The estimates from the lead council model (Scenario 1) are certainly optimistic as they assume rationalisation of assets and buildings, unconstrained rationalisation of staff, and do not explicitly account for geographic dispersion. Under current legislation this scenario provides unrealistic outcomes.

47
www.sgsep.com.au
Scenario 2 are average estimates derived from a statistical model, so there are no explicit assumptions regarding governance. Instead, it reflects the potential for economies of scale. Due to the increase in geographic area under amalgamation, the potential for economies of scale is weak. Scenario 3, is more conservative than scenario 1, and takes into account constraints implied in the Local Government Act 1993.
TABLE 10. COMPARISON OF SCEN ARIOS
10 year PV at
FYE 2016 ('000)
Scenario 1 - lead council model: savings $12,508
Scenario 1 - lead council: share of base case 10.8%
Scenario 2 - average efficiency: savings $1,423
Scenario 2 - average efficiency: share of base case 1.2%
Scenario 3 - legislative framework scenario: savings $4,448
Scenario 3 - legislative framework scenario: share of base case 3.8% Source: SGS, 2015. Note that all estimates (and growth rates) exclude depreciation.
The range of estimates provided in this study should be used subject to the caveats specified. However, the estimates provide a reasonable high-level indication of the nature of the potential savings from a merger of BSC and JSC. As shown in the graph below, the base case trajectory of expenditure could be altered under the merger option. Though, this would depend on the nature of the circumstances that transpire. With those caveats in mind, under current legislation the likely expenditure savings would be between 1.2% and 3.8% compared to two stand-alone Councils.
FIGURE 21 OPERATING EXPENDITUR E – SCENARIOS AND BASE CASE
Source: SGS, 2015.

48
www.sgsep.com.au
4 DUE DILIGENCE
This section analyses the key risks/ concerns that are likely to be generated under both the amalgamation and standalone options.
Amalgamation Option Risks
Merger and transition costs
With amalgamation, transition costs will occur and these are associated with systems and processes, and redundancies. The table below, Table 11, illustrates the possible range of merger costs that could be incurred.
TABLE 11 MERGER COST ESTIMATE S – CASE STUDIES
Location
Period Amount description Included aspects Number of LGAs Source[3]
Used in this study
Cornwall, UK 2008-2009
2.8% of operating expenditure (£42 M)
50% redundancies, 50% systems and processes
7 SGS study (2014)
Other sources
Queensland 2008-2009 over 10 year period
Final assessed claim approx. $194.8M total for 24 councils, avg. $8.1 per council (Original claim by councils range$1.2M - $21.5M)
Approx. 50% Infrastructure, 30% Wages, Salaries, Redundancies, 20% Systems, Process & Operations.
24 Queensland Treasury Corporation (2009)
Western Australia 2008 over 4 year period
$8.8M Change Management, Relocation, Policy & Regulation, Civic/Community and Operating Processes
3 Bob Davis, City of Greater Geraldton (2013).
2008 over 4 year period
$3.5M 2
Halifax, Canada 1996 n.f.d
$24M (one off transition) + Ongoing transition costs
One off costs not stated. Ongoing costs include IT, wages and salaries
Unspecified McKinlay Douglas Ltd (2006)
Source: Collated by SGS from previous work. If the new, amalgamated entity does not to follow through with projected efficiencies this will affect the financial viability of the merged council. Similarly, decisions made subsequent to the merger about the
[3] McKinlay Douglas Limited. (2006). Local government structure and efficiency, a report prepared for local government New
Zealand, Tauranga: Author.; Queensland Treasury Corporation (2009), Review of local government amalgamation costs funding submission – final summary report, Brisbane: Author; and Davis, B. (2013). Some insights from experiences of the City of Greater Geraldton: Amalgam of City of Geraldton, Shire of Greenough and Shire of Mullewa [PowerPoint slides]. Presentation to City of Melville on 16th August 2013.

49
www.sgsep.com.au
rationalisation of facilities and services, may not reduce the cost base of the merged organisation as originally modelled. This is one of the major financial risks avoided under the base case option. The exact merger and transition costs remain uncertain and a number of risks that may drive the costs up include:
Projected efficiency gains fail to come to fruition
Salary equalisation and differences between councils
Rates equalization and the risk to rate revenue
Equalization of service levels and skew towards highest service level.
Salary equalisation
It is likely that the Shires considered in this study have different salary structures. A merged entity would need to equalise salaries and wages, to establish a consistent pay structure and it is likely that salaries would rise toward the most generous current system, adding to long term costs. The financial modelling in this study does not explicitly consider this issue; so it is possible that the estimated savings underestimate the costs arising from salary equalisation. This issue is of medium risk.
Organisational cultures
The integration of two organisational cultures needs to be carefully managed, especially if cultures are very different, by strong and inspiring leadership. If not managed well, employees may resist change, morale may decrease; reducing business performance and increasing staff turnover, which may add to the time and costs involved in the transition period.
Impact on rates
There are differences in the rating systems used by BSC and JSC, which impact on the rates charged to individual property types. There are variations also in the proportion of rates borne by farms and residential rate payers. A merged entity would eventually have to set up a single rating system across the new administrative boundaries and, regardless of the mechanism adopted, there are likely to be some properties where rates would rise and others where rates would fall. A key driver for this would be differences in land values. It is possible that the total rate income pool would remain unchanged under a new entity (by equalising rates in a manner that leaves rate income unchanged). However, a new rate system designed to minimise impact on residents and businesses, may reduce the rate revenue pool. This issue is of medium risk. The new merged entity (council) may elect to use some savings to reduce revenue from external sources and thereby enhance the own source revenue ratio, or to reduce rates. Below is a basic calculation of the likely impacts to the rates for different rate categories in BSC and JSC. It assumes the total rate revenue base remains the same before and after amalgamation, and under the new rating structure the base component makes up 30% of the total rates raised from each category. While noting the actual model adopted may be different, the impacts of equalisation on the rates under the stated assumptions are mostly small. The major adverse impact would be the rating over farmland in BSC which would go up by about 19%.

50
www.sgsep.com.au
TABLE 12 IMPACT ON RATES BEFO RE AND AFTER THE AMA LGAMATION
Berrigan, average rates
Jerilderie, average rates
Rate categories
No. Standalone Merger No. Standalone Merger
Residential Rural 526 $615 $621 26 $632 $493
Farmland 909 $1,950 $2,317 539 $3,068 $2,448
Residential 3,526* $761 $745 382 $279 $431
* Sum of residential properties in Barooga Town, Berrigan Town, Finley Town and Tocumwal Town. Source: SGS (2015)
Differences in service levels and quality
As noted earlier, a detailed service review has not been completed for this study, and differences in service levels and/or quality have not been explicitly considered. Equalisation of services levels may lead to the highest service level (often the most costly one) of the two pre-existing councils being preferred and rolled out across the amalgamated council, resulting in costs going up. This issue is of medium to high risk.
Impacts on towns
The project financial savings under Scenario 3 – legislative framework financial savings model – are mostly attributable to a reduction in staffing levels, i.e. executive redundancies combined with the natural attrition of non-executive staff and a hiring freeze. The legislative framework analysis assumed the redundancy of four senior staff. This would likely affect Jerilderie most if management of the merged entity would be based in Berrigan. Generally speaking, the employment impacts on the townships would be limited and indirect with retiring staff not being directly replaced.
Local representation
Another issue, not explicitly covered in this analysis, is the risk of reduced local representation and reduced local sovereignty for residents. Indeed SGS has assumed that no change in representation in its Scenario 3 – financially legislative framework modelling. These matters are at the heart of the local government amalgamation debate. Local representation could be ensured by introducing wards, but that would be accompanied by significant costs.
Legacy issues
In theory, under the new merged entity rates and service levels would be equalised over time with everyone contributing and benefitting in an equitable way. That, in combination with the savings of the merger would mean that everyone gets better value for money. ‘Legacy issues’ occur when the new merged entity ‘inherits’ financial or asset maintenance issues from the merging Councils. Legacy issues can appear when there is a significant difference in the financial performance between the merging Councils. They can result in one former Council area ‘subsidising’ or ‘diverting resources from their area’ to support or solve issues in another former Council area.

51
www.sgsep.com.au
For example, if one Council has a significant asset maintenance backlog that would need to be addressed by the merged entity, then all constituents would be required to contribute to that (through their rates). And arguably, resources would be diverted from an area that a former stand-alone Council would have used to the benefit of their own community, to solving issues in the other former stand-alone Council area. If not properly upfront identified and addressed, significant resistance among Council managers, staff, Elected Members and constituents of the subsidising Council(s) would complicate the merger and increase the transitional costs and timeframe of the merger. The financial models used do not identify the existence (or absence) of any such issues. If applicable, the savings of the merger could be used towards addressing any such issues. This issue is of medium to high risk.

52
www.sgsep.com.au
5 THE BENEFITS TO BERRIGAN
This section provides an overview of the likely benefits and disadvantages to the current Berrigan community of the stand-alone option versus the merged option.
Benefits and disadvantages of the stand-alone option
Stand-alone Option Benefits
The benefits to Berrigan to the stand-alone option are:
Long term sustainability. With the proposed improvements under the long term financial plan (LTFP), Berrigan demonstrates it is sustainable in the long term in regards to the OLG criteria with the exception of the revenue from own sources of its own source revenue rate (52.6%) which is below the OLG Benchmark rate of 60%.
Growing rate base. Council’s rate base is expected to continue to increase, driven by continued population growth. Over time, economies of scale may enable lower rates and/or higher service levels.
Strong local representation. Berrigan has a strong community, and Council can continue to act solely on their behalf.
Focus on Murray River tourism. Continued clear focus on Murray River for the development of the tourism industry, without the risk of attention and resources to be focussed on the Riverina tourism region which competes for market share.
No merger and transition costs and risks (including any possible legacy issues).
Stand-alone Option Disadvantages
The disadvantage of the stand-alone option to Berrigan is:
Limited capacity for improvement. As a stand-alone Council there is limited scope for efficiency gains to open resources to be used for service improvement, strategic capacity and/or projects by Council to benefit Berrigan. Also, as a smaller stand-alone Council there may be limited potential to attract more qualified Council staff. However, as a stand-alone Council, the scale is not much smaller than the merged option.
Benefits and disadvantages of the merged option
Merged Option Benefits
The benefits to Berrigan of the merger are mostly due to increased scale and capacity and merger savings, and are as follows:
Increased capacity for (strategic) improvement. Due to the increased scale of the Council (all staff is retained except one GM position – as per legislative framework scenario), efficiency

53
www.sgsep.com.au
gains would open up potential resources to increase services, strategic capacity and/or projects of Council that benefit Berrigan. Together with that, due to increased scale, there may be opportunity to attract more qualified staff which could improve services and strategic capacity. However, as a merged Council, the scale is not much greater and population would remain under 10,000 residents.
Possibly more Council jobs in Berrigan. Likely increase in number of Council jobs located in Berrigan (assuming at least governance and strategic roles are consolidated in one location), strengthening the economic outlook.
The savings of the merger, which could result in: o Lower average rates per property, OR o Enhanced service delivery , i.e. increased value for money for ratepayers, OR o Increased long term sustainability. A Council with a higher rate of own source
revenue, possibly meeting the OLG Benchmark of 60%
Merger Option Disadvantages
The disadvantages are as follows:
Upward pressure on rates due to eroding rate base. Rates for property owners being pushed up over time as rate base Jerilderie continues to erode due to declining population
Potentially decreased focus on Murray River tourism. Possible decreased focus on Murray River for the development of the tourism industry. The merged Council would be a member of two tourism boards which are partially competing for market.
Merger and transition costs and risks
Weaker local representation, although this may impact Jerilderie more than Berrigan

54
www.sgsep.com.au
Appendix A Key assumptions and explanations to assumptions
Assumptions
Council explanations
Staff numbers – short, medium and long term this can affect operating expenses as well as ELE provisions.
Permanent staff numbers will decline by 2.5 EFT from 1/7/15
Future Capital Works and Borrowings – note no borrowings post 2014/15, 2015/16.
Correct
Employee Costs – salaries, shown as 2.16% in 15/16, understood Award increase is 2.7%, with new Award to be re-negotiated.
less staff & GM position not covered by Award
Employee Costs – Superannuation shows a decrease of -2.75% for 2015/16. It is understood that Division A Local Government Super will be seeking an extra increase to cover shortfalls in this fund. Note Division A would only apply to long serving Local Government employees.
Less staff and this is cost is already been built in to base figures i.e. the extra contribution has been in place for a number of years. Only a few staff in that fund.
Employee Costs – Workers Compensation shows varying decreases and increase in period 2022/23 – 2024/25.
Is a factor of wages and expected claims history
Materials and Contracts – Raw Materials and Consumables as well as Contracts and other seems to indicate existing or proposed Contracts for 2015/16 & the next two years.
Correct and no decision has been made about significant capital items as to whether to contract out or use day labour or a combination.
Other Expenses Utilities, indicates, a 29.4% increase for 2015/16 and becomes the base for future years
Significant increase in street lighting charges
Other Expenses – other, indicates a 23.3% decrease in 2015/16, an 8.4% decrease in 2016/17 and then indicates steadier increases ranging from 3.6% to 2.7% through to 2024/25.
Capital Grants – Recurrent and Non Recurrent show significant variations starting 2015/16. This is assumed to be for either a one-off or group of projects. Capital Grants can also affect Councils income for on-costs and overheads.
Significant grant included for road works in 15/16 – see comment about contracts etc. above
Transfers from Reserves shows a 2,152% increase in 2017/18 over the 2016/17 figure, whilst transfer to Reserves shows a 412% increase in 2020/21.
That is saving and spending in relation to major capital projects for general fund. In water and sewer and domestic waste fund surplus funds are transferred to reserve to fund future capital works.

55
www.sgsep.com.au
Assumptions
Council explanations
Interest and Investment Revenue shows small increases from 2015/16 ($338,000) through to 2024/25 ($345,000), yet under the Balance Sheet Current Assets, Investments increase from $6,795,000 in 2015/16 to an estimated $10,060,000 in 2024/25. There is a query in relation to the correlation between these two figures. There is also a gradual increase in retained earnings of $5,300,000 during this period.
The Council budgets conservatively for interest revenue so that it isn’t spent until it is received. This conservative budgeting is why the operating result declines over the life of the LTFP. In reality this corrected each year.
Employee Benefits and on costs show a reduction of $6,474,000 from 2013/14, to $3,508,000 2014/15 to $3,488,000 in 2015/16 and then show a steady consistent increase in future years.
Correct this is an ongoing cycle.
Whilst the impact is unknown, it should be noted that the revaluation of Roads Assets in 2015/16 may affect a number of financial indicators and the LTFP. Revaluation of other assets such as water, sewer, land and buildings will also follow in future years.

56
www.sgsep.com.au
Contact us CANBERRA
Level 6, 39 London Circuit, Canberra 2601 +61 2 6262 7603 [email protected]
HOBART
Unit 2, 5 King Street Bellerive TAS 7018
+61 (0)439 941 934 [email protected]
MELBOURNE
Level 5, 171 La Trobe Street Melbourne VIC 3000
+61 3 8616 0331 [email protected]
SYDNEY
Suite 209, 50 Holt Street Surry Hills NSW 2010
+61 2 8307 0121 [email protected]